146
Microfinance Joint Evaluation of the Contribution of CFAs to the Microfinance Sector, 2003-2007 Synthesis Report - Annexes April 2010

Microfi nance
Joint Evaluation of the Contribution of CFAsto the Microfi nance Sector, 2003-2007
Synthesis Report - Annexes
April 2010
2 Joint Evaluation of the Contribution of CFAs to the Microfi nance Sector, 2003-2007
Colofon
Principals:
Partos, Ellermanstraat 18b, 1099 BX AmsterdamPhone: +31 (0)20 3209901www.partos.nl
Cordaid, P.O. Box 16440, 2500 BK Den HaagPhone: +31 (0)70 3136300www.cordaid.nl
Oxfam Novib, P.O. Box 30919, 2500 GX Den HaagPhone: +31 (0)70 3421621www.oxfamnovib.nl
ICCO, P.O. Box 8190, 3503 RD UtrechtPhone: +31 (0)30 6927811www.icco.nl
Hivos, P.O. Box 85565, 2508 CG Den HaagPhone: +31 (0)70 3765500www.hivos.nl
Executing Agency:
EcorysDhr. M. NugterenMw. A. Slobwww.ecorys.nl
EOS ConsultMw. L. Zuidbergwww.eosconsult.nl
Carnegie ConsultDhr. H. Slegtenhorstwww.carnegieconsult.nl
EvaluatiegroepDhr. L. Roggeveenwww.evaluatiegroep.nl
3Table of contents
Table of contents
Annex 1 Assessment of External Reference Group ................................................................................... 4
Annex 2 Terms of Reference ..................................................................................................................................... 7
Annex 3 Evaluation Framework .............................................................................................................................. 86
Annex 4 List of Partners in the sample .............................................................................................................. 93
Annex 5 Lists of People Interviewed .................................................................................................................... 104
Annex 6 Literature consulted ................................................................................................................................... 113
Annex 7 Operational Performance Data ........................................................................................................... 125
Annex 8 Financial Performance Data .................................................................................................................. 131
Annex 9 Effi ciency and Risk Management ...................................................................................................... 134
Annex 10 Social Performance Indicators ............................................................................................................. 141
Annex 11 Members of the Coordination Group ............................................................................................ 145
Annex 12 Members of the External Reference Group ............................................................................... 146
4 Joint Evaluation of the Contribution of CFAs to the Microfi nance Sector, 2003-2007
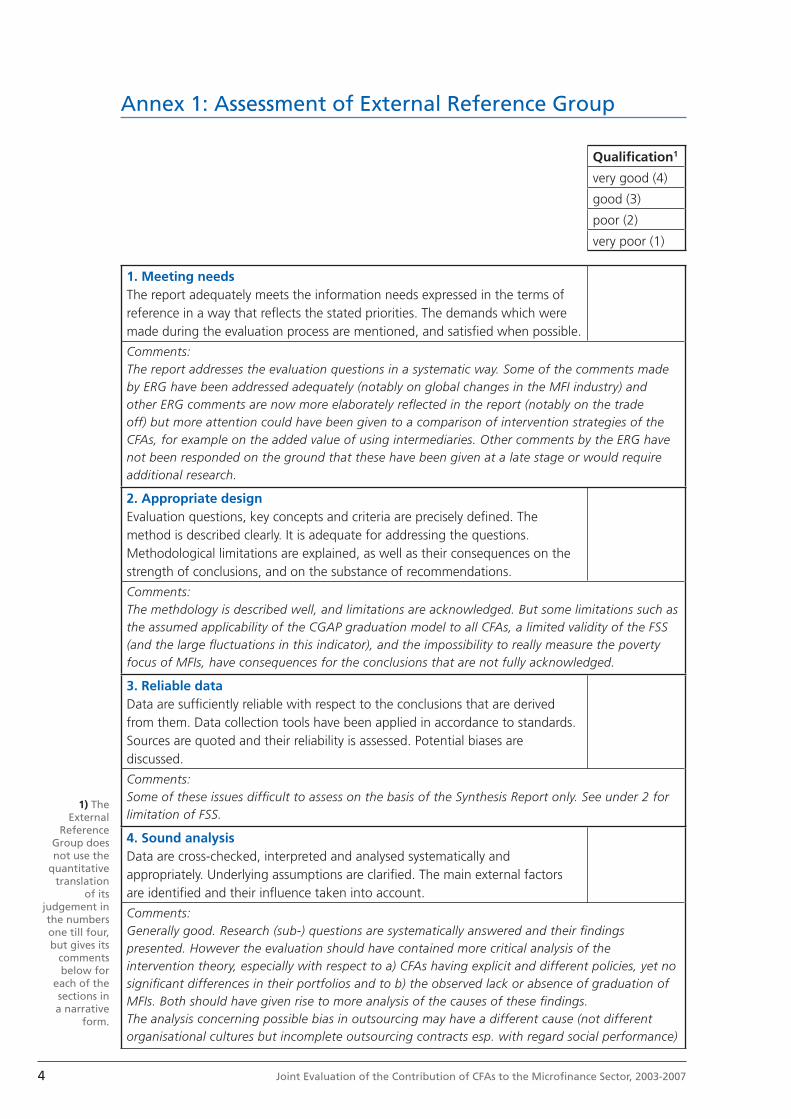
Qualifi cation1
very good (4)
good (3)
poor (2)
very poor (1)
1. Meeting needsThe report adequately meets the information needs expressed in the terms of reference in a way that refl ects the stated priorities. The demands which were made during the evaluation process are mentioned, and satisfi ed when possible.
Comments:The report addresses the evaluation questions in a systematic way. Some of the comments made by ERG have been addressed adequately (notably on global changes in the MFI industry) and other ERG comments are now more elaborately refl ected in the report (notably on the trade off) but more attention could have been given to a comparison of intervention strategies of the CFAs, for example on the added value of using intermediaries. Other comments by the ERG have not been responded on the ground that these have been given at a late stage or would require additional research.
2. Appropriate designEvaluation questions, key concepts and criteria are precisely defi ned. The method is described clearly. It is adequate for addressing the questions. Methodological limitations are explained, as well as their consequences on the strength of conclusions, and on the substance of recommendations.
Comments:The methdology is described well, and limitations are acknowledged. But some limitations such as the assumed applicability of the CGAP graduation model to all CFAs, a limited validity of the FSS (and the large fl uctuations in this indicator), and the impossibility to really measure the poverty focus of MFIs, have consequences for the conclusions that are not fully acknowledged.
3. Reliable dataData are suffi ciently reliable with respect to the conclusions that are derived from them. Data collection tools have been applied in accordance to standards. Sources are quoted and their reliability is assessed. Potential biases are discussed.
Comments:Some of these issues diffi cult to assess on the basis of the Synthesis Report only. See under 2 for limitation of FSS.
4. Sound analysisData are cross-checked, interpreted and analysed systematically and appropriately. Underlying assumptions are clarifi ed. The main external factors are identifi ed and their infl uence taken into account.
Comments:Generally good. Research (sub-) questions are systematically answered and their fi ndings presented. However the evaluation should have contained more critical analysis of the intervention theory, especially with respect to a) CFAs having explicit and different policies, yet no signifi cant differences in their portfolios and to b) the observed lack or absence of graduation of MFIs. Both should have given rise to more analysis of the causes of these fi ndings. The analysis concerning possible bias in outsourcing may have a different cause (not different organisational cultures but incomplete outsourcing contracts esp. with regard social performance)
1) The External
Reference Group does not use the
quantitative translation
of its judgement in the numbers one till four, but gives its
comments below for
each of the sections in a narrative
form.
Annex 1: Assessment of External Reference Group
5Annex 1: Assessment of External Reference Group
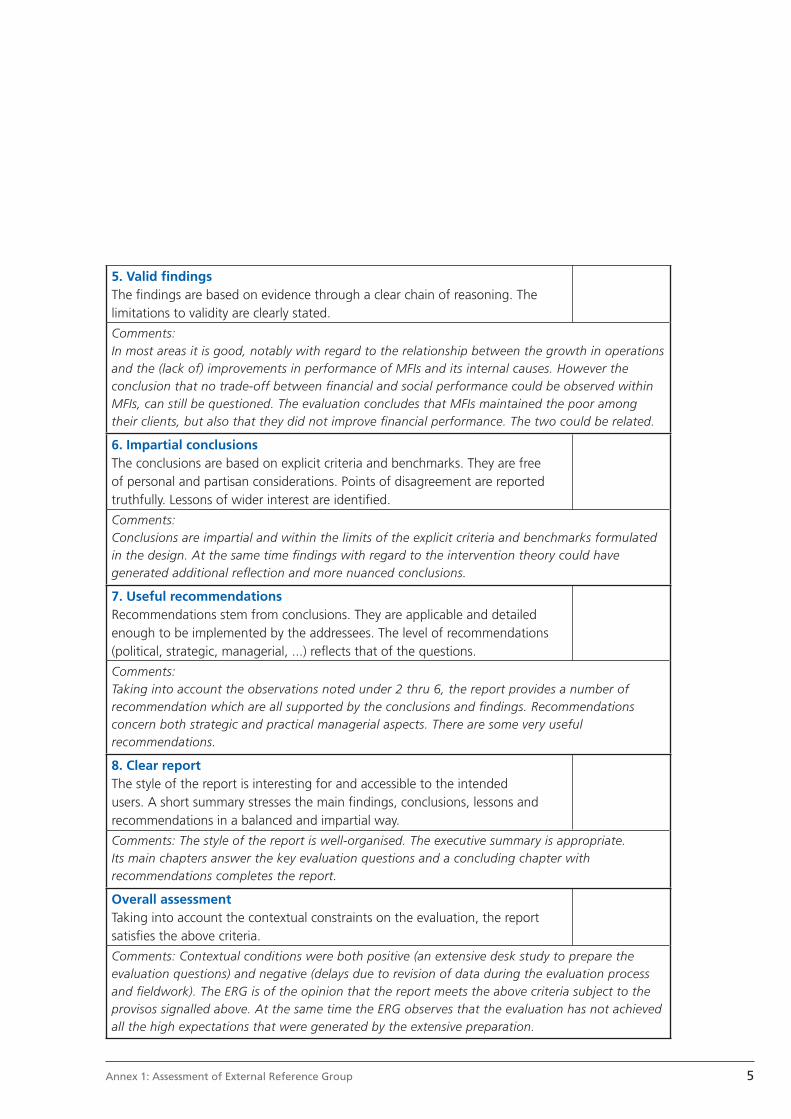
5. Valid fi ndingsThe fi ndings are based on evidence through a clear chain of reasoning. The limitations to validity are clearly stated.
Comments:In most areas it is good, notably with regard to the relationship between the growth in operations and the (lack of) improvements in performance of MFIs and its internal causes. However the conclusion that no trade-off between fi nancial and social performance could be observed within MFIs, can still be questioned. The evaluation concludes that MFIs maintained the poor among their clients, but also that they did not improve fi nancial performance. The two could be related.
6. Impartial conclusionsThe conclusions are based on explicit criteria and benchmarks. They are free of personal and partisan considerations. Points of disagreement are reported truthfully. Lessons of wider interest are identifi ed.
Comments:Conclusions are impartial and within the limits of the explicit criteria and benchmarks formulated in the design. At the same time fi ndings with regard to the intervention theory could have generated additional refl ection and more nuanced conclusions.
7. Useful recommendationsRecommendations stem from conclusions. They are applicable and detailed enough to be implemented by the addressees. The level of recommendations (political, strategic, managerial, ...) refl ects that of the questions.
Comments:Taking into account the observations noted under 2 thru 6, the report provides a number of recommendation which are all supported by the conclusions and fi ndings. Recommendations concern both strategic and practical managerial aspects. There are some very useful recommendations.
8. Clear reportThe style of the report is interesting for and accessible to the intended users. A short summary stresses the main fi ndings, conclusions, lessons and recommendations in a balanced and impartial way.
Comments: The style of the report is well-organised. The executive summary is appropriate. Its main chapters answer the key evaluation questions and a concluding chapter with recommendations completes the report.
Overall assessment Taking into account the contextual constraints on the evaluation, the report satisfi es the above criteria.
Comments: Contextual conditions were both positive (an extensive desk study to prepare the evaluation questions) and negative (delays due to revision of data during the evaluation process and fi eldwork). The ERG is of the opinion that the report meets the above criteria subject to the provisos signalled above. At the same time the ERG observes that the evaluation has not achieved all the high expectations that were generated by the extensive preparation.

6 Joint Evaluation of the Contribution of CFAs to the Microfi nance Sector, 2003-2007
7Annex 2: Terms of Reference
Annex 2: Terms of Reference
Joint Programme Evaluation
Contribution of the CFAs to the Microfi nance sector, 2003 -2007
Participating organisations:
CordaidICCOHivosOxfam Novib
Amsterdam, 24 june 2008
8 Joint Evaluation of the Contribution of CFAs to the Microfi nance Sector, 2003-2007
Table of Contents
List of abbreviations .................................................................................................................................................. 9
1. Background of the evaluation ................................................................................................................ 10
2. Microfi nance at the CFAs ............................................................................................................................ 12 2.1 Introduction ................................................................................................................................................................ 12 2.2 Role of the CFAs ...................................................................................................................................................... 12 2.3 Differences between the CFAs ...................................................................................................................... 14
3. Proposed evaluation questions ............................................................................................................. 16
4. Methodology ......................................................................................................................................................... 18 4.1 Expected methodological diffi culties......................................................................................................... 19
5. Deliverables and deadlines ....................................................................................................................... 20 6. Evaluation team .................................................................................................................................................. 22
7. Budget .......................................................................................................................................................................... 23
8. Management and steering of the evaluation ........................................................................... 24
9. Minimal requirements for proposals ................................................................................................ 25
Annexes:
I Documents available at the CFAs ................................................................................................................ 27 II Terminology used in the Results Chain .................................................................................................. 33 III Three intervention strategies of the CFAs .............................................................................................. 34 IV Quality Assessment List IOB (in Dutch: Beoordelingslijst Programma Evaluaties MFS) ............................................................. 35 V Microfi nance Portfolio, april 2008 .............................................................................................................. 40
9Annex 2: Terms of Reference
List of abbreviations
CFA Co-Financing Agency
CG Co-ordination Group
CGAP Consultative Group to Assist the Poor
ERG External Reference Group
INAFI International Network of Alternative Financial Institutions
IOB Inspectie Ontwikkelingssamenwerking en Beleidsevaluatie (Policy and Operations Evaluation Department)
MFI Microfi nance Institution
MFP Medefi nancieringsprogramma (= CFP: Co-Financing Programme)
MFS Medefi nancieringsstelsel (= CFS: Co-Financing System)
NPM Netherlands Platform for Microfi nance
OECD/DAC Organisation for Economic Cooperation and Development/ Development Assistance Committee
PME Planning, Monitoring and Evaluation
SIM Social Impact Measurement
SWOT Strengths, Weaknesses, Opportunities, Threats
ToR Terms of Reference
10 Joint Evaluation of the Contribution of CFAs to the Microfi nance Sector, 2003-2007
1. Background of the evaluation
The Dutch Co-Financing Agencies (CFAs) have decided on a series of programme evaluations for the subsidy period 2007 - 20101,2, which includes fi ve themes for evaluation. The second theme of these series is ‘microfi nance’. Four CFAs - Cordaid, ICCO, Hivos, Oxfam Novib - have committed themselves to participate in this evaluation. The co-ordination of the joint programme evaluations is with Partos, the association of Dutch civil society organisations in the international development cooperation sector.
Important reasons to select ‘microfi nance’ as a subject to be evaluated during 2008 are 1) that a substantial amount in terms of budget of the CFAs is spent in microfi nance programmes (5,2% at Cordaid, 5% at ICCO, 15% at HIVOS, and 8% at Oxfam Novib)3, 2) the high profi le of the topic, and 3) the changes in the area of microfi nance the previous fi ve years. In addition to these, the world of microfi nance itself is rapidly changing: an increase in funding from many sources, including commercial sources, and the professionalisation of the sector itself.
In the Netherlands, in the past fi ve years the collaboration and the co-ordination of activities of the main Dutch actors in microfi nance were substantially intensifi ed. Early in 2003 the Dutch Platform Microfi nance (NPM) was established, bringing together the main Dutch actors in the sector. The NPM constitutes a follow-up to and broadening of the Working group “Leningen en Garanties” (CFA platform for internal co-ordination and for dialogue with DGIS), bringing together the ‘Dutch offer’ in Microfi nance. The NPM organisations all participated in the CGAP initiated peer review processes in 2003 and 2007.
Besides this cooperation, the past fi ve years have also brought more clarity about the differentiation of roles within this ‘Dutch offer’, in connection with an increasing clarity about the differentiation of Microfi nance institutions in the South. As an expression of this clarity, the four CFAs co-operate since May 2006 on a structural basis in MicroNed, with respect to the establishment of a specialised sector approach for microfi nance. MicroNed aims to improve effi ciency and effectiveness of MFI support by a joint approach4.
Actually, as CFAs are independent not-for profi t NGOs, they are able to take risk in order to support start-up initiatives where commercial capital cannot take those risks. This means that the CFAs have the task to push frontiers for fi nancial systems for the poor. The CFAs have in place policy guidelines and a series of best practices, and it must also be recognised that a strong learning process is implicitly present in this sector.
1) CFP evaluation reports during the previous subsidy round (2003 - 2006) can be found at www.partos.nl, under ‘Kwaliteit’, ‘Kwaliteitshuis’, ‘Rapporten Programma Evaluaties’. For example:
- Synthesis report of Dutch CFA Programme Evaluation HIV/AIDS 2001 -2004 (no 5, Feb 2006)- Synthesis Report - Assessing civil society participation as supported in-country by Cordaid, Hivos, Novib and Plan Netherlands
(no 4, Dec 2005)- Synthesis Report - Evaluation of health related programmes of three co-fi nancing agencies 2002 -2004 (no 3, Oct 2005)- Synthesis Report - The Role of Women’s Organisations in Civil Society Building 1998-2003 (no 2, Nov 2004)2) Gezamenlijke programma evaluaties 2007-2010, Plan van aanpak, 20 oktober 2006.3) Information from the CFA’s, MicroNed and the NPM data base. At the end of 2006, the CFAs had a total portfolio outstanding
in microfi nance of _ 47.7 million, and disbursed in that same year _ 43.7 million on grants and other forms of funding. In 2006, the CFAs spent _ 19 million on grants for the microfi nance sector, in 2007 this fi gure was _ 18.5 million.
4) A more elaborate description of the policy can be found in the MicroNed Inception Plan (2006). The Business Plan 2008 - 2010 contains an update of MicroNed policy.
11Annex 2: Terms of Reference
An important motor for the before mentioned developments in the Dutch microfi nance sector has been the publication of the study by the Steering Committee for the Evaluation of the Co-fi nancing Programme (Ondersteuning van Microfi nancieringsprogramma’s door Nederlandse Medefi nancieringsorganisaties: een synthese studie, by Otto Hospes, December 2002). The ‘Hospes’ study was the fi rst joint evaluation of microfi nance programmes as they had been developed by the CFAs since the ‘90s5. In the follow-up of this study, three items were central: more co-ordination between the CFAs in their microfi nance activities; the increase and improvement of the loan and guarantee portfolio of the CFAs, and the improvement of the grant policy for MFIs and enabling environment.
Another antecedent is the self-evaluation carried out in 2002 by the four CFAs on their Loan & Guarantee programmes (1998-2001) for the Ministry of International Co-operation.6 As a result of this self-evaluation, the Ministry gave the CFAs permission to develop the loan, guarantee and equity instruments as part of their fi nancing of MFIs.
Taking into account the developments in the microfi nance playing fi eld in the Netherlands and the world, the strong collaboration between the CFAs in the fi eld of microfi nance, and the responsibility of the CFAs to be innovative, CFAs have decided to evaluate collectively their activities in microfi nance during the past 5 years (the period 2003 - 2007). The present joint programme evaluation will look at the results achieved by the CFAs in these past 5 years and focuses on the effects that choices made by CFAs have on the MFIs and their services.
The results of this evaluation will serve accountability, learning and policy development purposes.
The evaluation should explicitly be informed by, build on and benefi t from the wealth of knowledge and research fi ndings on microfi nance as they were generated worldwide in the past years7. Important input for this evaluation is the inventory of the portfolio (grants, loans, guarantees and investment in equity) already done by the CFAs, as a preparation for this evaluation (and included as annex V in this ToR)8. Furthermore, policy and other documents and project information available in the CFAs will serve as other sources of information, just as information gathered in the fi eld.
5) The Synthesis study was based on the following documents:- An evaluation of micro-fi nance programmes in Sri Lanka as supported through the Dutch co-fi nancing programme, by Otto
Hospes et al. (2001),- Evaluation of micro-fi nance programmes in Kenya as supported through the Dutch co-fi nancing programme, by Otto Hospes et
al. (2002),- An inventory of impact studies of microfi nance programmes supported by Dutch co-fi nancing agencies in Bolivia, by Gabrielle
Athmer & Otto Hospes (desk study, working document, 2002)- An inventory of impact studies of microfi nance programmes supported by Dutch co-fi nancing agencies in Bangladesh, by
Gabrielle Athmer & Otto Hospes (desk study, working document, 2002)- Het L&G programma in het kader van het Medefi nancieringsprogramma. Een inventarisatie van werkwijzen en verkennende
beleidsanalyse, by Gabrielle Athmer & Otto Hospes (working document, 2002)6) The self-evaluation produced a joint self-evaluation document (“Granting credits”, April 2002), based on 4 separate CFA
documents.7) An interesting overview of this research can be found in Vice Versa, 2007/ 4 pp.10-178) Triodos Facet, The Partos Portfolio Analysis 2008

12 Joint Evaluation of the Contribution of CFAs to the Microfi nance Sector, 2003-2007
2. Microfi nance at the CFAs
2.1 IntroductionMicrofi nance has become one of the important stories in development cooperation, because of its demonstrated potential to contribute to poverty reduction and to the achievement of other Millennium Development Goals. These days, over 100 million poor people have access to fi nancial services, but the need for growth of the sector is still enormous. Still some 900 million poor people are not yet served. Microfi nance investment funds and commercial banks contribute considerably in scaling up of operations but the demand for (grant) support to starting and emerging MFIs is still largely unmet. The development fi nance organisations in the Netherlands, Cordaid, Hivos, ICCO and Oxfam Novib play an important role in this segment of the microfi nance market.
The defi nition of microfi nance in this evaluation is:
“Microfi nance is the supply of loans, savings, and other basic fi nancial services to the poor. People living in poverty, like everyone else, need a diverse range of fi nancial instruments to run their businesses, build assets, stabilize consumption, and shield themselves against risks. Financial services needed by the poor include working - and investment capital loans, consumer credit, savings, pensions, insurance, and money transfer services.9”
In the Netherlands a large variety of institutions is involved in supporting microfi nance in the south: CFAs as well as commercial banks, foundations of commercial banks, insurance companies as well as different fund managers. All these players perform activities in the area of their expertise to support the build up and expansion of fi nancial systems for the poor. Depending on the core activities and sources of funds, each has its own focus in terms of instruments. But, there is also a difference in the stage of development where organisations are intervening.
2.2 Role of the CFAsThe CFAs want to enhance access to fi nance, as a means to structural poverty reduction. They want to contribute to the creation of inclusive fi nancial sectors, giving the poor access to appropriate fi nancial services. CFAs intervene at three levels10: 1. Micro level, being the MFIs, promoting improvement of the performance of MFIs in terms
of breadth and depth of outreach, portfolio quality, sustainability and impact.2. Meso level, support services and infrastructure, such as networks, (impact)research and
educational services.3. Macro level, which includes the promotion of regulation, supervision and an enabling
environment for the development of inclusive fi nancial systems at national level.
Ad 1: Micro level. For identifi cation of the need regarding the development of the microfi nance institutions, it is helpful to distinguish its main segments, according to level of maturity:
A. The segment of starting and emerging MFIs; those that are in the process of achieving operational self suffi ciency (OSS). It may take several years before the basic MFI operations
9) Defi nition derived from http://www.cgap.org/p/site/c/template.rc/1.26.1302 and adapted by us.10) A more comprehensive description of these three levels can be found at CGAP: Good Practices, Guidelines for Funders of
Microfi nance 2nd edition, October 2006 (The Pink Book)
13Annex 2: Terms of Reference
become profi table and thus grant funding is required to cover initial operating defi cits, capacity building and initial investments. As venture capital is still a rare phenomenon in this market, seed capital is mostly grant-based. The better performing emerging MFIs may qualify for non-commercial debt fi nancing (loans with preferential conditions).
B. The segment of expanding MFIs that have covered their costs but work at improvement of their fi nancial return (FSS). These institutions become eligible for debt fi nancing, although their credit worthiness may not yet be considered adequate for commercial fi nance. For this reason there is substantial demand for loan funds based on prospects rather than collateral and a past good track record. For the expanding MFIs, grants may still be an instrument for improving the quality of their service delivery, management and governance. In some cases, savings or debt fi nancing becomes also available for such MFIs, like wholesale funding from development banks or from social investors.
C. The segment of mature, commercially operating MFIs (including banks) that can pay the full market cost of capital, mobilise deposits and meet the credit worthiness standards of institutional and other commercial lenders.
To enhance access to appropriate fi nancial services for poor people, CFAs focus especially on starting, pre-starting, re-starting MFIs at the lower end of the market (segment A). These are MFIs that need grant funding for loan portfolio, investments, product development and/or technical assistance to grow and to develop into sustainable institutions and to widen and deepening their outreach. Other organisations support MFIs in this segment of the market (like Rabobank Foundation).
CFAs also contribute to increased access to microfi nance for excluded people by supporting MFIs that just reached sustainability (segment B), in order to widen and deepen their outreach and to consolidate their operations and strengthen their sustainability. It concerns grant funding for example for opening new branches in underserved areas, for product development for hard-to-reach people or existing clients, for further capacity building, for innovation, for transformation into regulated and supervised institutions, and so forth. However, debt fi nancing, guarantees and equity investments can already be done from funds of CFAs as risks are still high and MFIs may not yet meet the requirements of commercial sources. Advisory services can be delivered by commercial banks, private advisory organisations, with possible fi nancing from CFAs.11
CFAs have no role to play in segment C, in which organisations qualify for commercial and institutional fi nancing. MFIs in this sector are already mainstream working and active in the microfi nance market. Subsidies or concessional loans from CFAs only can disturb the market, which is contrary to the purpose of the programmes of the CFAs.
Ad 2: Meso level.Contributions to the creation or strengthening of an enabling environment are directed at meso level support services and infrastructure such as associations of MFIs, research and training institutions, technical assistance providers, universities, wholesale lenders, etc. Finance instruments are grants. When grants are provided for lobby and advocacy purposes, most often mature MFIs are involved as they are important partners for these purposes. Other activities for the entire sector such as impact studies are also often subsidised for this infant industry.
11) More in- depth criteria for the CFAs’ involvement in loans & guarantees can be founding the joint CFA document “Kwaliteitskader L/P/G (non-grant) instrumenten MFOs” (October 2005),
14 Joint Evaluation of the Contribution of CFAs to the Microfi nance Sector, 2003-2007
Ad 3: Macro level.At macro level, actors -mostly governments- may be working for national policies, regulations and supervision of new forms of fi nancial institutions aimed at serving the poor. CFAs also support activities aimed at improving enabling environment to improve quality and reliability of fi nancial services.
2.3 Differences between the CFAsIn the performance of their ‘role’ (para 2.2.) the CFAs show some differences in terms of poverty focus, internal organisation and funding delivery.
1. Poverty focusCordaid considers the support of microfi nance institutions to be a route that empowers the poor to take their life in their own hands and improve their livelihoods. Its programme concentrates on building up capacity and start-up fi nancing of new and emerging MFIs. Cordaid also acts as an initiator and catalyst in the development of funds which are aimed (partly) at fi nancing emerging MFIs. Although the focus lies on new and emerging MFIs, Cordaid also works with established MFIs in specifi c cases, e.g. in the development of new products (savings, insurance, fi nancial services for growing micro businesses) or in order to reach particular vulnerable groups (HIV carriers, landless people, indigenous peoples).At Hivos, the overall objective of micro fi nance is improved income, job opportunities and livelihoods of poor excluded men and women living in agricultural settings and poor urban areas. Hivos implements special programmes to improve access to micro fi nance programmes of women and people affected by HIV/Aids. Hivos is also developing programmes to improve social performance of MFIs Improved access to fi nancial services is ‘integrated’ in the ‘equitable markets’ concept, with more ownership for local producers and forms part of the Access of Opportunities Programme of Hivos.ICCO’s microfi nance programme is part of the subprogramme Financial Services of ICCO’s Fair Economic Development Programme (DREO). Its aim is to improve the socio-economic position of small producers, small entrepreneurs, labourers and families access to fi nancial services. ICCO has a strong rural focus in its programme since access to fi nancial services is more limited there. The fi nancial services programme complements other subprogrammes of the Fair Economic Development Programme (DREO) in particular its local market development programme which aims to provide rural based producer groups access to local (and/or international) markets. ICCO therefore supports MFIs, producers’ organisations and small enterprises in rural areas which are not yet sustainable (operationally and fi nancially) but show the perspective to reach this stage.Oxfam Novib sees micro fi nance as an instrument to eradicate poverty and empower poor people. It aims to achieve that micro fi nance as an industry at large will profoundly contribute to improving income and overcoming injustice faced by the millions of people living in inhumane conditions across the world. As far as MFIs are concerned, Oxfam Novib sees improved access to credits as a ‘right on a sustainable livelihood’ and focuses on MFIs which are working in the development of new markets, MFIs involved in rural fi nancing, MFIs promoting product development (HIV/AIDS, women, microinsurance), and actively contributing to a microfi nance legal framework in their country. Also increase of outreach is a target of fi nancing.
2. Internal organisationWithin each of the four CFAs, microfi nance activities are organised in a different way. At Cordaid these activities are co-ordinated by the Sector ‘Ondernemen’ with its regional teams. At ICCO, microfi nance for Africa is organised within the Terrafi na team, and for the

15Annex 2: Terms of Reference
other regions, they are divided over the regional teams within the Fair Economic Development Programme. In Hivos, all microfi nance activities are organised within one team, while microfi nance activities at Oxfam Novib are distributed over the regional bureaus.
3. Delivery of fundingFor the delivery of loans, guarantees and equity, CFAs work with Microfi nance Investment Funds, in collaboration with other players in the Dutch microfi nance fi eld. Cordaid uses in-house expertise to manage its funds. Cordaid provides loans to its partners directly. Hivos is working with Triodos Bank, guaranteeing loans and other types of fi nancing through the Hivos-Triodos Fund (1994). Hivos supports expanding MFIs through the Hivos-Triodos Fund (HTF). Hivos guarantees for 90% saving deposits in HTF for loans in the south, combining fi nancial and banking knowledge of Triodos and social and environmental knowledge and experience of Hivos. Hivos set up a seed capital programme for capacity building of starting and emerging MFI so that at a certain moment they will qualify for semi (commercial) funding such as HTF and TFSF (Triodos Fair Share Fund). ICCO works in alliance with Oikocredit guaranteeing loans and other types of fi nancing through fund engineering. Another public private partnership, in which ICCO is involved, is Terrafi na Microfi nance. It is founded in 2005 by ICCO, Oikocredit and the Rabobank Foundation with the aim to stimulate rural microfi nance in Africa. It aims to provide the complete range of specialised fi nancing and capacity-building support required by emerging microfi nance institutions (MFIs) in Africa. Other regions are served through the Fair Economic Development Programme. Funds of Oxfam Novib are managed by Triple Jump Management B.V., a professional fund manager, combining fi nancial expertise of Triple Jump and social and development knowledge of Oxfam Novib. Together with Triple Jump, Oxfam Novib wants to provide support to MFIs in all stages of development (segments B-C), through different Funds: Oxfam Novib Fund for MFIs in segments A and B and the ASN-Novib Fund for segment C (ASN-Novib Fund being a commercial investment fund).
In the evaluation period (2003-2007), important changes have taken place in the microfi nance modalities of individual CFAs, often in response to the outcome of evaluations or reviews, but also in response to opportunities in the market. Although not all these changes have already fully taken effect in the fi eld operations, it is important that the evaluation takes stock of such changes, through interviews and documentary review at individual CFAs.
16 Joint Evaluation of the Contribution of CFAs to the Microfi nance Sector, 2003-2007
3 Proposed evaluation questions
The main focus of the evaluation is to assess the extent to which the CFAs have contributed to building sustainable MFIs during the period 2003- 2007 that deliver relevant services to the poor.
Specifi c evaluation questions are the following:
1. Status of Maturity: To what extent did the CFAs succeed in supporting the MFIs to go from start-up, emerging
to mature MFIs that are commercial? Were they effi cient12, effective and relevant within the context (countries, markets)?
Look into:- different instruments used, e.g. equity/guarantees, grants, loans, seed capital,
subordinated loans, working in alliances or networks.- capacity development of young and /or emerging MFIs towards greater sustainability- growth and innovation (diversity of services/products/technology) of more consolidated
MFIs
2. Poverty Focus: To what extent have CFAs and the supported MFIs been able to maintain the poverty
focus13? To what extent is there a correlation between question 1 (status of maturity) and 2 (poverty focus)?
Look into:- SPM / impact assessments on clients level (the ‘100 impact studies’):
how sure can we already be about the poverty alleviation effects of MF; what are the blind spots that were identifi ed in literature in 200514; and what have we done with them?
3. Enabling Environment: To what extent have the CFA-supported activities been able to change the enabling
environment for poverty-oriented micro fi nance? Were they effi cient, effective and relevant within the context (countries, markets)?
Enabling environment is operationalised through:- All activities that aim to increase access to fi nancial services for those target groups
that have no access to regular fi nancial services, e.g. support to regional and national networks, advocacy and lobby activities to stimulate governments to improve legislation.
12) See annex II for an explanation of the terms effi ciency, effectiveness, relevance as well as the terms impact and sustainability. Sustainability as an explicit evaluation criteria is left out, since one of the aims of the microfi nance programmes at the CFAs is to support starting and emerging MFIs on their way to become mature and viable organisations.
13) See paragraph 2.3. 14) Source: Nathanael Goldberg: Measuring the Impact of Microfi nance: Taking Stock of What We Know, Grameen Foundation,
December 2005. This is a comprehensive literature review of existing research on the impact of microfi nance around the globe (an examination of roughly 100 impact evaluations released since 1986).
17Annex 2: Terms of Reference
Further operationalisation of the evaluation questions is left to the evaluators. Consultants are requested to capture the evaluation questions into different judgement criteria in their proposal for a Plan of Approach to this Terms of Reference (see chapter 9). Each evaluation question should have at least 1 to 2 judgement criteria.
The evaluation will pay attention to certain cross cutting issues during the data collection and analysis:
- To what extent are results of previous evaluations regarding microfi nance at CFAs (Hospes 2002, self assessment L&G 2002, and Mozambique 2006, CGAP peer reviews 2003 and 2007) taken into account at policy development at the CFAs?
- Data collection, fi ndings, results and conclusions should be formulated in a gender-specifi c way, and need to look at intended as well as unintended consequences.
- Present some examples of some innovative practices in the fi eld of microfi nance.
18 Joint Evaluation of the Contribution of CFAs to the Microfi nance Sector, 2003-2007
4. Methodology
The evaluation process will continue through three phases (desk/literature, fi eld, synthesis).
There is already a wealth of knowledge and research fi ndings on microfi nance generated worldwide in the past few years on which this evaluation can build on and benefi t from. Therefore, the fi rst phase (desk/literature) is the most crucial. In principle the evaluation questions need to be answered through the desk and literature study. If deemed necessary, an email survey round among partner organisations in the South is possible. Phase 2 (a fi eld study in selected countries or geographical areas in the South) should focus on fi lling in gaps or verify certain fi ndings, so details of this phase can only be fi lled in during phase one.
Phase 1: Desk study of all four participating CFAs plus literature review
A desk and literature study. This study will focus on the reconstruction and analysis of the intervention logic (result levels and indicators) and a fi rst data collection and judgement of these data.
This phase should include: a. A systematic review of relevant fi les15 (including context analysis), reports and other
documents (e.g. on social performance measurement, existing (impact) studies, project and previous programme evaluations) available at Cordaid, Hivos, Icco and Oxfam Novib. A basic analysis should be done on the total portfolio at all four participating CFAs. Based on the evaluation questions and fi rst fi ndings, a more in-depth analysis of a selected number of countries or geographical areas should be done. A description of the microfi nance portfolio is already attached with this ToR.
b. Interviews with desk- and programme offi cers, and management at the four CFAs: to get an insight in the relation between policy, knowledge and practice of desk and programme offi cers.
c. Literature review, e.g. based on materials to be found at CGAP, Imp-Act Consortium, SIM project of INAFI, Grameen Foundation (e.g. Goldberg study). Based on this literature review, it should be possible to compare the work of the CFAs with the state of the art.
d. Interviews other relevant stakeholders: ○ CGAP consultants who have just fi nalised the peer review of the Netherlands Platform
for Microfi nance (NPM)○ Microned○ Financial partners of the MFOs: Triodos, ASN, Oikocredit, ABN-AMRO, ABN AMRO
India, the Deutsche Bank, Triple Jump Advisory Services, Rabobank Foundation.
With this information, the consultants should be able to answer the evaluation questions as complete as possible. Based on the fi ndings of phase 1, recommendations will be made for phase 2: sharpening a more in-depth fi eld study at partner organisations in the South.
Phase one should be fi nalised with a report. Depending on the results of the desk/literature study, and after the approval of the report, the co-ordination group16 decides for a continuation with phase 2.
15) Availability of monitoring data at CFAs may differ. 16) See chapter 8 for an outline of the steering and management of the evaluation

19Annex 2: Terms of Reference
Phase 2: Field study in the South
Within the fi eld study the co-ordination group wants to focus more on the perspective of southern partners and the context in which they operate.
The aim of the fi eld studies is to:a. Fill gaps of information that did not show up during phase 1. b. Verify already collected data, and collect additional data on partner organisation- and
target population level -clients and ex clients- (looking for intended as well as unintended, positive as well as negative effects)
c. In addition to partner organisations, other reliable and appropriate data sources may need to be consulted as well. Triangulation of data found in the desk study is needed.
d. Share the information collected with at least the partner organisations, but preferably also other relevant stakeholders in the fi eld, in order to create a common understanding and stimulate the learning process at relevant stakeholders.
This phase should also be fi nalised with different organisational-, country reports or otherwise.
Phase 3: Synthesis
Based on information from phase 1 and 2, one fi nal synthesis report needs to be prepared. Besides answering the evaluation questions, this synthesis report should synthesise all fi ndings (of desk, literature and fi eld studies), conclusions and recommendations into an overall assessment of the microfi nance programme (based on the evaluation questions). This synthesis report needs to match the standards set out by the Policy and Operations Evaluation Department (IOB), an independent body of the Netherlands Ministry of Foreign Affairs (see annex IV, in Dutch).
4.1 Expected methodological diffi culties
- Confi dentiality of the data at the fi nancial partners of the CFAs. However, all activities that are fi nanced with public funding should be made accessible.
- Multiple level analysis: Within the aid chain, CFAs as well as partner organisations may or may not have monitoring data. Be aware that in case there are hardly data available at CFA level, they very well may be available at the level of partner organisations. Different PME systems may be used within the organisations (at CFAs and at partner organisations, as well as the link between CFAs and partner organisations), so this should be taken into account.
- Multiple intervention strategies: CFAs work through three intervention strategies that are closely linked to each other (direct poverty alleviation, civil society building and lobby & advocacy). It may be hard to disentangle these strategies.

20 Joint Evaluation of the Contribution of CFAs to the Microfi nance Sector, 2003-2007
5. Deliverables and deadlines
All fi nal products need to be in English. Depending on the selected areas for fi eld study, translations may need to take place to French or Spanish.
Expected products, delivered by the consultants, and deadlines
Time available for phase 1 is 8 weeks: 15 sept - 10 nov 2008
During this phase, the consultants:a. will have a kick-off meeting with the co-ordination group (CG): Mon 15 or Tue 16 Sept
2008b. will have a meeting on the progress in the implementation of the work plan with the co-
ordination group (after 4 weeks, so around Mon 13 oct 2008). The discussion includes:- problems faced so far and solutions found- reliability of data collected- more information on judgement criteria and provisional indicators- verifi cation that all important sources of information have been/will be used- fi rst outline for the fi eld study, suggestions for fi ne-tuning of the evaluation questions
and the methodology for data collection in the fi eld phasec. should submit a draft report at (after 6 weeks, so around Thu 23 oct 2008). This draft
report is also sent to the External Reference Group (ERG) for comments.d. will have a meeting with the CG to discuss the draft report (around Mon 3 nov 2008) e. should submit a fi nal report at Mon 10 nov 2008, including any comments received from
the co-ordination group and ERG on the draft report. This fi nal report includes at least:- an overview of the different policies (formal or informal), intervention or programme
logic, judgement criteria plus indicators, practices and main activities during 2003 - 2007 of the four participating CFAs regarding microfi nance
- an overview of expenditures by CFAs (total and MFP budget) and the number of partners involved in microfi nance (already available in the portfolio)
- an assessment or a SWOT analysis of the microfi nance work at CFAs- an analysis of the link between the work of CFAs and literature fi ndings, preliminary
answers on the evaluations questions, and hypotheses to be further validated through fi eld research
Number of pages for the fi nal report: max 40 main text, excl. annexes Format: draft report: electronic version (MS Word format)Final report: hardcopy (5 copies) plus electronic version (MS Word format)
Time available for phase 2 is 11 weeks: 17 nov 2008 - 2 feb 2009
At the end of the fi eld study phase, the consultants will:a. submit four draft organisation-, country (regional) reports, or otherwise (around 05 jan
09). These reports will also be shared with the partner organisations for comments. These
reports should include at least:- reports of the fi eld briefi ngs and debriefi ngs (meetings or workshops) in the countries/
regions- context analysis, methodology, fi ndings, conclusions and a maximum of four

21Annex 2: Terms of Reference
organisation specifi c recommendations regarding the evaluation questionsb. give a presentation of the fi ndings to the co-ordination group (around 19 jan 09)c. submit four fi nal organisation-, country (regional) reports, or otherwise (no later than 2
feb 09), including any comments received from the concerned parties on the draft reports.
Number of pages for each report: max 40 main text, excl. annexesFormat: Draft organisation/or country reports: electronic version (MS Word format)Final organisation/or country reports: hardcopy (5 copies of each report) plus electronic version (MS Word format)
Time available for phase 3 is 4 weeks: 2 feb - 2 march 2009
After the fi eld study phase, the consultants will:a. submit a draft Synthesis Report (around 16 feb 2009) of the desk and fi eld studies:
besides answering the evaluation questions, the draft fi nal report should also synthesise all fi ndings, conclusions and recommendations into an overall assessment of the programme. This draft Synthesis Report is also sent to the External Reference Group for their comments and concerned parties.
b. give a presentation on the draft report to the co-ordination group (around 23 feb 2009), followed by a discussion on: - fi ndings, conclusions- quality of the report- utilisation of the report, including transferable lessons and recommendations
c. submit a fi nal Synthesis Report (no later than 2 march 2009), including any comments received from the concerned parties on the draft report. This report needs to match the standards set out by the Policy and Operations Evaluation Department (IOB), an independent body of the Netherlands Ministry of Foreign Affairs (see annex IV, in Dutch).
Number of pages of synthesis report: max 60 main text, excl. annexesFormat: Draft Synthesis report: electronic version (MS Word format)Final Synthesis report: hardcopy (5 copies) plus electronic version (MS Word format) The fi nal Synthesis Report will include an annex 1 with the formal assessment of the External Reference Group. It will be printed and distributed by Partos, and put on Partos’ website.
22 Joint Evaluation of the Contribution of CFAs to the Microfi nance Sector, 2003-2007
6. Evaluation team
The team leader should have expertise in managing complex evaluation processes. Experience with evaluations which go beyond policy level; knowledge of the working conditions and contexts of local partner organisations in the South is a must.
Team members will have to complement the specifi c ‘microfi nance’ expertise, gender expertise, and have experience in quantitative and qualitative survey techniques. Language skills needed are Dutch, English, French and Spanish, in order to be able to read and interpret the fi les available at the CFAs. At least one team member should have an understanding of the Dutch co-fi nancing system. Preferably, the team should be a mixture of northern and southern consultants. Working with local consultants during fi eld studies in the South is a pre-condition.
Team members should not have had a working relationship with the involved CFAs during 2002-2007, the period just before and under evaluation. The co-ordination group follows the generally accepted principle that the evaluation of a programme must be carried out by independent bodies, organisations or individuals. In this particular case, this means that consultants should not have been involved in setting up the ‘microfi nance programmes’ at the CFAs under evaluation, nor should they have worked as policy-, programme or desk offi cers on this specifi c topic at these CFAs. In short: someone should not evaluate his or her own work.
It is the responsibility of the team leader to assure:- composition of the team- a realistic time frame and budget for the evaluation- the consistency of the deliverables with the ToR- the quality of the content of the deliverables
The team leader is ultimately responsible for fi nalising the report and co-ordinating and guiding the evaluation process (including all logistic arrangements).

23Annex 2: Terms of Reference
7. Budget
A budget should give a breakdown of the expected number of days per team member and their fees. Prices need to be calculated in Euro’s, excl VAT/BTW, and are maximum prices and cannot be changed during the contract. The maximum budget available for the complete evaluation (including all three phases) is € 300,000
The payment procedures are as follows:
25% at acceptance by the evaluation team of the task25% after approval by co-ordination group of the draft desk study report (end phase 1)25% after approval by co-ordination group of the fi nal organisational or country reports (end
phase 2)25% after approval by co-ordination group of fi nal report and fi nancial justifi cation (end
phase 3)

24 Joint Evaluation of the Contribution of CFAs to the Microfi nance Sector, 2003-2007
8. Management and steering of the evaluation
Co-ordination Group (CG)
The evaluation is managed by the evaluation manager within Partos, with the assistance of a co-ordination group consisting of members of the four participating co-fi nancing agencies. The co-ordination group members have prepared the current Terms of Reference. The main function of this group is:
- To select the evaluation team who actually implement this evaluation.- To ensure that the consultants have access to and have consulted all relevant information
sources and documents related to the project/programme available at the agencies.- To validate the evaluation questions. - To discuss and comment on notes and reports delivered by the consultants. Comments by
individual group members are compiled into a single document by the evaluation manager and subsequently transmitted to the consultants.
- To assist in feedback of the fi ndings, conclusions, lessons and recommendations from the evaluation back into their organisations.
External Reference Group (ERG)
Partos, together with the Co-Financing Agencies have installed a Reference Group of external experts to advise the co-ordination group on the quality of process and results of the joint programme evaluations. The External Reference Group gives advice on the Terms of Reference, the draft deskstudy report, the draft Synthesis report, and prepares a fi nal assessment on the quality of process and results. Their independent assessment will be included in the fi nal synthesis report as an annex17.
Policy and Operations Evaluation Department (IOB)
The CFAs are accountable to the Ministry of Foreign Affairs and the Dutch public for the obtained results. The evaluation reports will be open for public use and are reviewed by the Policy and Operations Evaluation Department, an independent body of the Ministry of Foreign Affairs, according to a Quality Assessment List (annex IV, in Dutch).
Contact person during the evaluation:
All contracting, payment and correspondence concerning the evaluation goes through Partos:
Nieuwe Keizersgracht 451018 VC AmsterdamThe Netherlands
Tel : 020 - 320 9901Fax : 020 - 620 8049
Contact person: Marja Exterkate, [email protected]
25Annex 2: Terms of Reference
9. Minimal requirements for proposals
In case you are or your organisation is interested, we invite you to prepare a proposal for implementation (max 15 pages, excluding annexes). We encourage you to team up with other organisations or individuals. The proposal should be written in English. We expect a plan of approach, with at least the following information:
Understanding context and evaluation questions:- Fine tuning of the evaluation questions, including a fi rst draft of ‘judgement criteria’. The evaluation questions need to be captured into different judgement criteria developed
by the consultants. Each evaluation question should have at least 1 to 2 judgement criteria. The achievement of these criteria during the period 2003 -2007 can be assessed or judged through indicators during the evaluation.
Evaluation capacity:- A proposal for a methodology, the way in which data will be collected and data
sources needed, taking into account the expected methodological problems and data shortcomings.
- A proposal for how to analyse data in order to answer the evaluation questions.
Evaluation team:- An overview of the roles, expertise and skills of the team members in the evaluation.- Time table, including possible risks, and measures you may take in order to reduce those
risks.
The proposal should include at least the following annexes:○ Composition of the evaluation team with cv’s, showing their knowledge, skills and
experiences○ List of relevant evaluations within the last 5 years
A separate document including a breakdown of the requested budget should be sent with the technical proposal, but in a separate envelope. You should give the reference number “Partos /073/08/me/800, technical -or- fi nancial proposal” for quotation on the envelopes. Technical and fi nancial proposals (5 hardcopies each, in two different envelopes) should be sent in quintuple to the contact person at Partos (mentioned in chapter 8), and need to be in her receipt no later than 18 August 2008 at 12.00 o’clock Dutch time.
Selection procedure
Envelopes will be opened on 18 August at 13.00 o’clock Dutch time. The co-ordination group, representing members of the participating organisations, will assess the proposals based on the plan of approach in line with the ToR, on the following eight quality criteria:
Understanding of context and questions:1. Understanding of context2. Understanding of questions

26 Joint Evaluation of the Contribution of CFAs to the Microfi nance Sector, 2003-2007
Evaluation capacity:3. Quality of evaluation design4. Mastery of data collection 5. Capacity to analyse data 6. Capacity to deliver conclusions and recommendations
Evaluation team:7. Skills of the team8. Organisational capacity
The quality of the proposal is decisive. In case two proposals are of equal quality, the co-ordination group will invite both candidates on Tuesday 2 September in the afternoon in The Hague in order to clarify their proposal.
On 3 September in the morning you will be informed about the fi nal selection. The evaluation is supposed to start with a kick-off meeting with the coordination group and the complete evaluation team on Monday 15 or Tuesday 16 September 2008.
27Annex 2: Terms of Reference
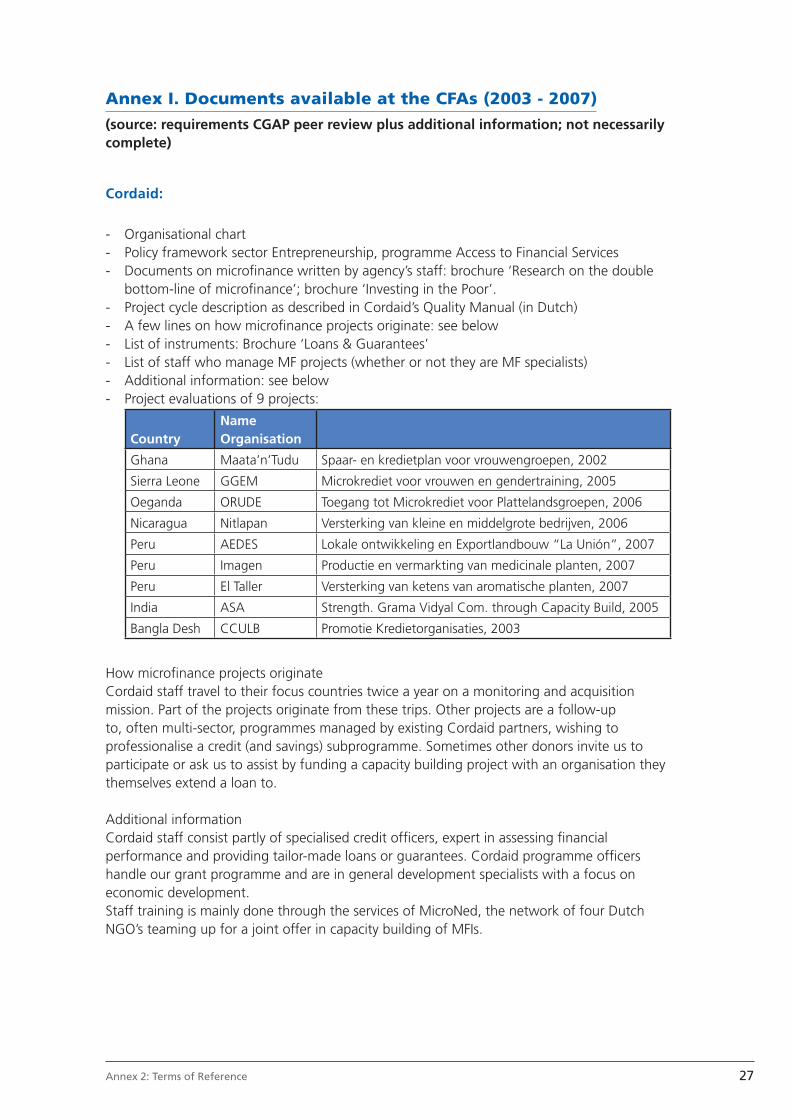
Annex I. Documents available at the CFAs (2003 - 2007)(source: requirements CGAP peer review plus additional information; not necessarily complete)
Cordaid:
- Organisational chart - Policy framework sector Entrepreneurship, programme Access to Financial Services- Documents on microfi nance written by agency’s staff: brochure ‘Research on the double
bottom-line of microfi nance’; brochure ‘Investing in the Poor’.- Project cycle description as described in Cordaid’s Quality Manual (in Dutch) - A few lines on how microfi nance projects originate: see below - List of instruments: Brochure ‘Loans & Guarantees’ - List of staff who manage MF projects (whether or not they are MF specialists) - Additional information: see below - Project evaluations of 9 projects:
CountryName Organisation
Ghana Maata’n’Tudu Spaar- en kredietplan voor vrouwengroepen, 2002
Sierra Leone GGEM Microkrediet voor vrouwen en gendertraining, 2005
Oeganda ORUDE Toegang tot Microkrediet voor Plattelandsgroepen, 2006
Nicaragua Nitlapan Versterking van kleine en middelgrote bedrijven, 2006
Peru AEDES Lokale ontwikkeling en Exportlandbouw “La Unión”, 2007
Peru Imagen Productie en vermarkting van medicinale planten, 2007
Peru El Taller Versterking van ketens van aromatische planten, 2007
India ASA Strength. Grama Vidyal Com. through Capacity Build, 2005
Bangla Desh CCULB Promotie Kredietorganisaties, 2003
How microfi nance projects originateCordaid staff travel to their focus countries twice a year on a monitoring and acquisition mission. Part of the projects originate from these trips. Other projects are a follow-up to, often multi-sector, programmes managed by existing Cordaid partners, wishing to professionalise a credit (and savings) subprogramme. Sometimes other donors invite us to participate or ask us to assist by funding a capacity building project with an organisation they themselves extend a loan to.
Additional informationCordaid staff consist partly of specialised credit offi cers, expert in assessing fi nancial performance and providing tailor-made loans or guarantees. Cordaid programme offi cers handle our grant programme and are in general development specialists with a focus on economic development.Staff training is mainly done through the services of MicroNed, the network of four Dutch NGO’s teaming up for a joint offer in capacity building of MFIs.
28 Joint Evaluation of the Contribution of CFAs to the Microfi nance Sector, 2003-2007
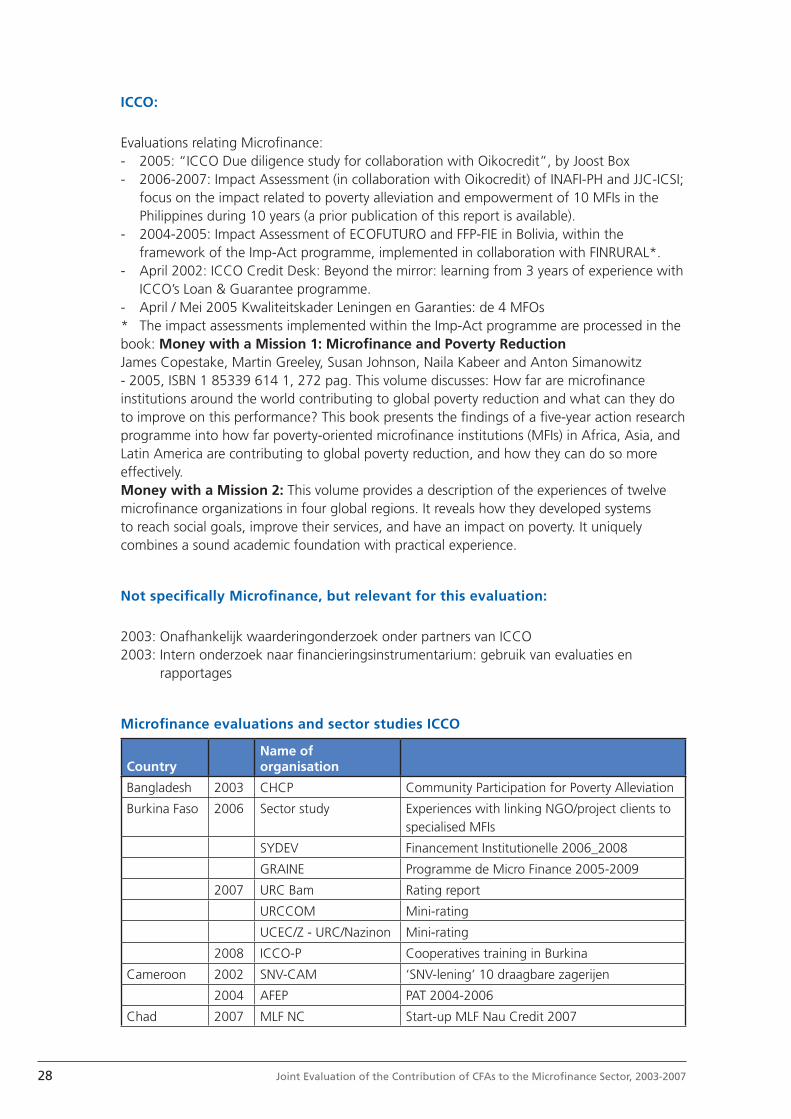
ICCO:
Evaluations relating Microfi nance:- 2005: “ICCO Due diligence study for collaboration with Oikocredit”, by Joost Box- 2006-2007: Impact Assessment (in collaboration with Oikocredit) of INAFI-PH and JJC-ICSI;
focus on the impact related to poverty alleviation and empowerment of 10 MFIs in the Philippines during 10 years (a prior publication of this report is available).
- 2004-2005: Impact Assessment of ECOFUTURO and FFP-FIE in Bolivia, within the framework of the Imp-Act programme, implemented in collaboration with FINRURAL*.
- April 2002: ICCO Credit Desk: Beyond the mirror: learning from 3 years of experience with ICCO’s Loan & Guarantee programme.
- April / Mei 2005 Kwaliteitskader Leningen en Garanties: de 4 MFOs* The impact assessments implemented within the Imp-Act programme are processed in the book: Money with a Mission 1: Microfi nance and Poverty ReductionJames Copestake, Martin Greeley, Susan Johnson, Naila Kabeer and Anton Simanowitz - 2005, ISBN 1 85339 614 1, 272 pag. This volume discusses: How far are microfi nance institutions around the world contributing to global poverty reduction and what can they do to improve on this performance? This book presents the fi ndings of a fi ve-year action research programme into how far poverty-oriented microfi nance institutions (MFIs) in Africa, Asia, and Latin America are contributing to global poverty reduction, and how they can do so more effectively.Money with a Mission 2: This volume provides a description of the experiences of twelve microfi nance organizations in four global regions. It reveals how they developed systems to reach social goals, improve their services, and have an impact on poverty. It uniquely combines a sound academic foundation with practical experience.
Not specifi cally Microfi nance, but relevant for this evaluation:
2003: Onafhankelijk waarderingonderzoek onder partners van ICCO2003: Intern onderzoek naar fi nancieringsinstrumentarium: gebruik van evaluaties en
rapportages
Microfi nance evaluations and sector studies ICCO
CountryName of organisation
Bangladesh 2003 CHCP Community Participation for Poverty Alleviation
Burkina Faso 2006 Sector study Experiences with linking NGO/project clients to specialised MFIs
SYDEV Financement Institutionelle 2006_2008
GRAINE Programme de Micro Finance 2005-2009
2007 URC Bam Rating report
URCCOM Mini-rating
UCEC/Z - URC/Nazinon Mini-rating
2008 ICCO-P Cooperatives training in Burkina
Cameroon 2002 SNV-CAM ‘SNV-lening’ 10 draagbare zagerijen
2004 AFEP PAT 2004-2006
Chad 2007 MLF NC Start-up MLF Nau Credit 2007
29Annex 2: Terms of Reference
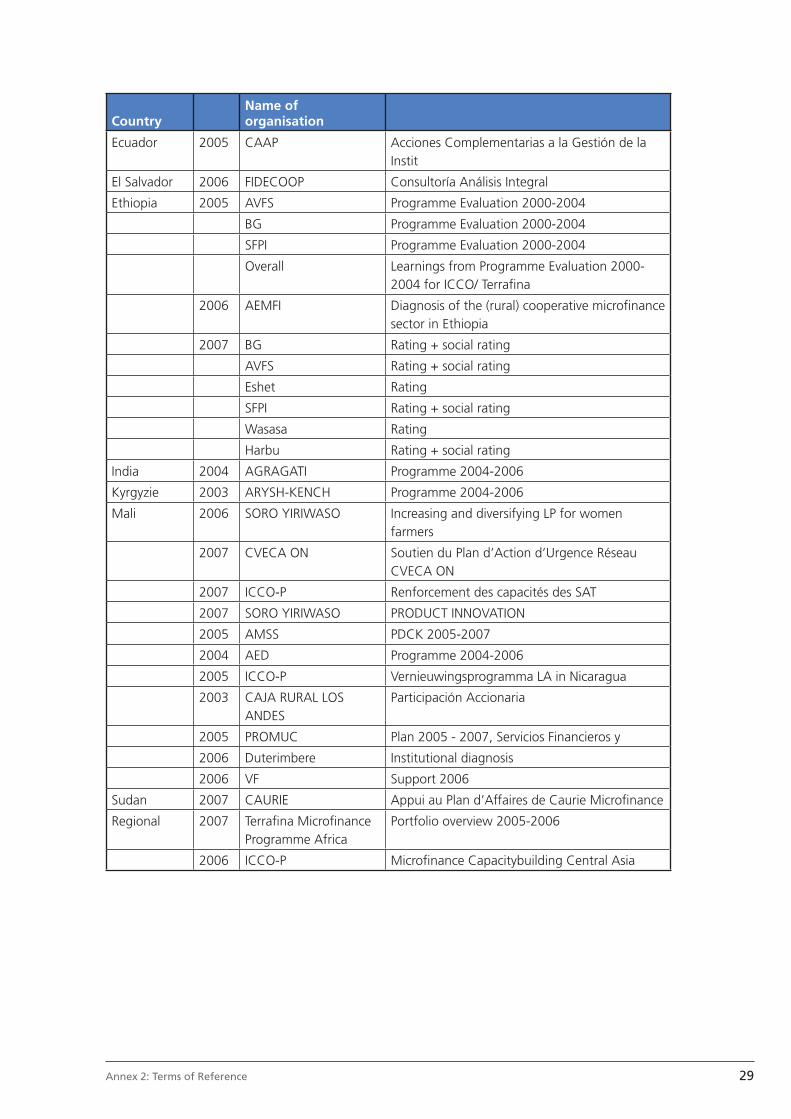
CountryName of organisation
Ecuador 2005 CAAP Acciones Complementarias a la Gestión de la Instit
El Salvador 2006 FIDECOOP Consultoría Análisis Integral
Ethiopia 2005 AVFS Programme Evaluation 2000-2004
BG Programme Evaluation 2000-2004
SFPI Programme Evaluation 2000-2004
Overall Learnings from Programme Evaluation 2000-2004 for ICCO/ Terrafi na
2006 AEMFI Diagnosis of the (rural) cooperative microfi nance sector in Ethiopia
2007 BG Rating + social rating
AVFS Rating + social rating
Eshet Rating
SFPI Rating + social rating
Wasasa Rating
Harbu Rating + social rating
India 2004 AGRAGATI Programme 2004-2006
Kyrgyzie 2003 ARYSH-KENCH Programme 2004-2006
Mali 2006 SORO YIRIWASO Increasing and diversifying LP for women farmers
2007 CVECA ON Soutien du Plan d’Action d’Urgence Réseau CVECA ON
2007 ICCO-P Renforcement des capacités des SAT
2007 SORO YIRIWASO PRODUCT INNOVATION
2005 AMSS PDCK 2005-2007
2004 AED Programme 2004-2006
2005 ICCO-P Vernieuwingsprogramma LA in Nicaragua
2003 CAJA RURAL LOS ANDES
Participación Accionaria
2005 PROMUC Plan 2005 - 2007, Servicios Financieros y
2006 Duterimbere Institutional diagnosis
2006 VF Support 2006
Sudan 2007 CAURIE Appui au Plan d’Affaires de Caurie Microfi nance
Regional 2007 Terrafi na Microfi nance Programme Africa
Portfolio overview 2005-2006
2006 ICCO-P Microfi nance Capacitybuilding Central Asia

30 Joint Evaluation of the Contribution of CFAs to the Microfi nance Sector, 2003-2007
Hivos:
Requirement CGAP Peer Review Description
Organizational chart 1.1. Organizational chart as taken from page 91 Annual Report 2006, Hivos
MF (and or SME) policy 2.1. Civil Voices: Hivos overall policy document (for FS section see p 24-28)
2.2. Policy note: Seed capital package for fi nancial institutions (fi nal_external)
2.3. Policy paper on Sustainable Economic Development 2004-2007
Any document on microfi nance written by agency’s MD
3.1 Logical framework for Financial Services sector in the Hivos Business Plan 2007-2010
3.2 Briefi ng note on Hivos’policy on microfi nance 2007
3.3 Public relations brochure on Financial services policy of Hivos
Project cycle description
4.1. Selection process of projects and partners
4.2 Appraisal and contract (in general)
4.3 Appraisal and approval of contracts: Hivos Triodos Fund procedures
4.4. Summary of Hivos project cycle
A few lines on how microfi nance projects originate
5.1 Hivos partner policy
5.2 Appraisal and approval of contract: HTF procedure
List of instruments 6.1 Hivos instruments
List of staff who manage MF projects (whether or not they are MF specialists)
7.1 List of staff members dealing with Financial Services
Any additional information they would like to share
8.1 Brochure”Noord Zuid Internet sparen: sparen met dubbel rendement
8.2 Hivos Triodos Fonds Jaarverslag 2006
8.3 page 12 and 26 from the brochure: People unlimited
8.4 page 12-13 of HI: Het geld dat gelukkig maakt.
8.5 page 19-21 Programma Access to Opportunies-Business Plan Hivos 2007-2010
8.6 Annual Report in english 2006
8.7 A broader perspective (short popular version of Hivos policy paper)
- Project evaluations 2002 - 2007:
Country Counterpart Year evaluation Type
Uganda CERUDEB 1999 Impact Assessment
India CDF : SAHAVIKASA 2000
South Africa ALLIANCE 2001
Zimbabwe NISSI 2002
Zimbabwe WDSCU 2002
Bolivia Caja los Andes 2002 Impact Assessment
31Annex 2: Terms of Reference
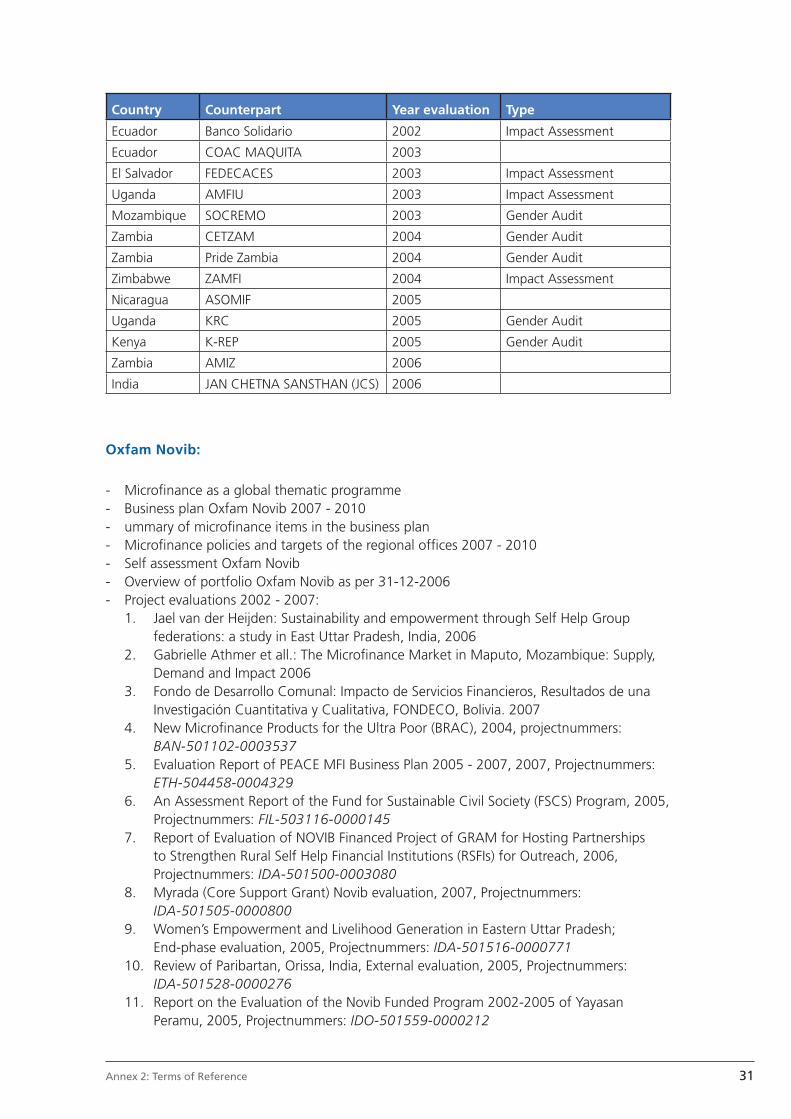
Country Counterpart Year evaluation Type
Ecuador Banco Solidario 2002 Impact Assessment
Ecuador COAC MAQUITA 2003
El Salvador FEDECACES 2003 Impact Assessment
Uganda AMFIU 2003 Impact Assessment
Mozambique SOCREMO 2003 Gender Audit
Zambia CETZAM 2004 Gender Audit
Zambia Pride Zambia 2004 Gender Audit
Zimbabwe ZAMFI 2004 Impact Assessment
Nicaragua ASOMIF 2005
Uganda KRC 2005 Gender Audit
Kenya K-REP 2005 Gender Audit
Zambia AMIZ 2006
India JAN CHETNA SANSTHAN (JCS) 2006
Oxfam Novib:
- Microfi nance as a global thematic programme- Business plan Oxfam Novib 2007 - 2010- ummary of microfi nance items in the business plan- Microfi nance policies and targets of the regional offi ces 2007 - 2010- Self assessment Oxfam Novib- Overview of portfolio Oxfam Novib as per 31-12-2006- Project evaluations 2002 - 2007:
1. Jael van der Heijden: Sustainability and empowerment through Self Help Group federations: a study in East Uttar Pradesh, India, 2006
2. Gabrielle Athmer et all.: The Microfi nance Market in Maputo, Mozambique: Supply, Demand and Impact 2006
3. Fondo de Desarrollo Comunal: Impacto de Servicios Financieros, Resultados de una Investigación Cuantitativa y Cualitativa, FONDECO, Bolivia. 2007
4. New Microfi nance Products for the Ultra Poor (BRAC), 2004, projectnummers: BAN-501102-0003537
5. Evaluation Report of PEACE MFI Business Plan 2005 - 2007, 2007, Projectnummers: ETH-504458-0004329
6. An Assessment Report of the Fund for Sustainable Civil Society (FSCS) Program, 2005, Projectnummers: FIL-503116-0000145
7. Report of Evaluation of NOVIB Financed Project of GRAM for Hosting Partnerships to Strengthen Rural Self Help Financial Institutions (RSFIs) for Outreach, 2006, Projectnummers: IDA-501500-0003080
8. Myrada (Core Support Grant) Novib evaluation, 2007, Projectnummers: IDA-501505-0000800
9. Women’s Empowerment and Livelihood Generation in Eastern Uttar Pradesh; End-phase evaluation, 2005, Projectnummers: IDA-501516-0000771
10. Review of Paribartan, Orissa, India, External evaluation, 2005, Projectnummers: IDA-501528-0000276
11. Report on the Evaluation of the Novib Funded Program 2002-2005 of Yayasan Peramu, 2005, Projectnummers: IDO-501559-0000212

32 Joint Evaluation of the Contribution of CFAs to the Microfi nance Sector, 2003-2007
12. Evaluation externe: NEF Programme Tarabé-Korombana (TAKO), 2004, Projectnummers: MAL-501633-0003655
13. Ophavela Program Evaluation 2005 - 2006, Ophavela Savings&Credit fase III, 2007, Projectnummers: MOC-503558-0003934.pdf
14. Mid-Term evaluation of Thardeep Rural Development Programme (TRDP), 2006, Projectnummers: PAK-501820-0000508
15. Informe Consultoria para la Evaluacion Final del Proyecto “Inclusión de Micro Emprendedores/as con Potencial Competitivo, en Situación de Pobreza, a Circuitos Dinámicos de Mercados Locales y Regionales - Proyecto IPYMER”, Serv. Empresariales Micro Empresa. 2008, Projectnummers: PER-501856-0000566
16. Evaluation of the Project “Livelihood Improvement and Economic Rehabilitation of Victims affected by Deadly Tsunami in belt of Sri Lanka.”, 2006, Projectnummers: SRL-501988-0006121
17. Evaluation Report of Faiders Savings and Credit Programme, from July 2003 to October 2006,
Evaluation of Faiders business plan July/03 to June/06, 2007, Projectnummers: TAN-502052-0003126

33Annex 2: Terms of Reference
Annex II. Terminology used in the Results Chainsource of defi nitions: OECD/DAC
Results chain : The causal sequence for a development intervention that stipulates the necessary sequence to achieve desired objectives beginning with inputs, moving through activities and outputs, and culminating in outcomes, impacts, and feedback.
Input : The fi nancial, human, and material resources (by source) used for the development intervention
Results : The output, outcome or impact (intended or unintended, positive and/or negative) of a development intervention:
Output : The products, capital goods and services which result from a development intervention; may also include changes resulting from the intervention which are relevant to the achievement of outcomes. These are tangible products over which the Southern partner has complete control (SMART).
Outcome : The likely or achieved short-term and medium-term effects of an intervention’s outputs (which contributes to the improvement of welfare/prosperity of the target group).
Impact : Positive and negative, primary and secondary long-term effects produced by a development intervention, directly or indirectly, intended or unintended.
Effi ciency : A measure of how economically resources/inputs (funds, expertise, time, etc.) are converted to results (relation input - output)
Effectiveness : The extent to which the development intervention’s objectives were achieved, or are expected to be achieved, taking into account their relative importance (relation output - outcome)
Relevance : The extent to which the objectives of a development intervention are consistent with benefi ciaries’ requirements, country needs, global priorities and partners’ and donors’ policies (relation outcome - impact). Note: Retrospectively, the question of relevance often becomes a question as to whether the objectives of an intervention or its design are still appropriate given changed circumstances.
Sustainability : The continuation of benefi ts from a development intervention after major development assistance has been completed. The probability of continued long-term benefi ts. The resilience to risk of the net benefi t fl ows over time.

34 Joint Evaluation of the Contribution of CFAs to the Microfi nance Sector, 2003-2007
Annex III. Three intervention strategies of the CFAs
Three intervention strategies are core to the development work of all CFAs:
1. Direct poverty alleviation
Direct poverty alleviation is geared to directly improving the living conditions of poor populations through the targeted provision of services or by strengthening their capacity to provide for their own basic needs (policy framework co-fi nancing programme, 2003 -2006).
2. Civil society building
Civil society building involves the strengthening of pluralistic and democratic social structures and organisations to achieve a more equal balance of power and the involvement of marginalized groups in social, economic and political decision-making processes. CFAs distinguish four broad fi elds of activity in the area of civil society building.
a. Strengthening organisational capacities (of both formal and informal organisations) in civil society.
b. Building up and strengthening networks of, and alliances between, social organisations (both within and between the various sectors)
c. Building up and strengthening capacities for (policy) advocacy, with the aim of strengthening
vertical intermediary channels between civil society and the state and/or the marketd. Strengthening citizenship, social consciousness, democratic leadership, and social and
political responsibility, with the aim of increasing participation of citizens in the public sphere.
(Biekart: CFA evaluation Civil Society Building, 2003 )
3. Lobby and advocacy
Lobbying and advocacy is designed to change local, national and international policy and processes and structures which perpetuate or aggravate poverty and inequality (policy framework co-fi nancing programme, 2003 -2006).
Within the CFP programme, policy is infl uenced by partner organisations, CFAs and their networks. The evaluation design will include the measurement of results of lobbying and advocacy efforts of partner organisations and CFAs
35Annex 2: Terms of Reference
Annex IV. Quality Assessment List IOB
(Beoordelingslijst Programma Evaluaties MFS)
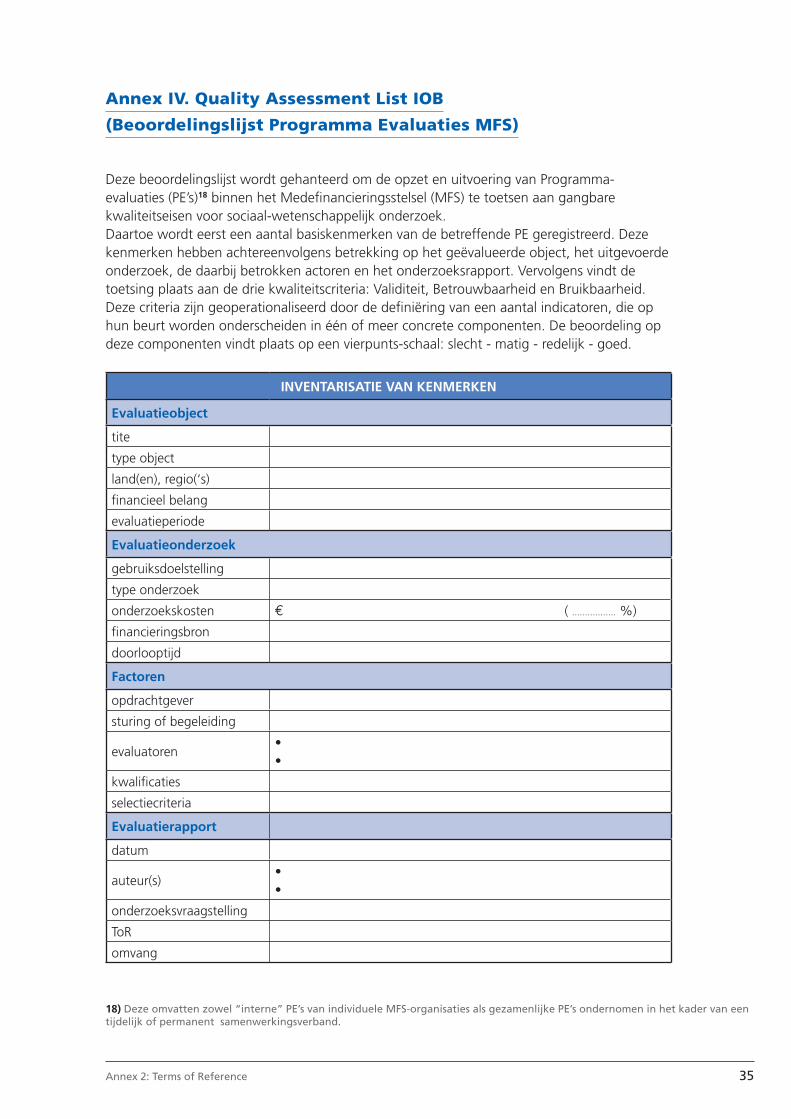
Deze beoordelingslijst wordt gehanteerd om de opzet en uitvoering van Programma-evaluaties (PE’s)18 binnen het Medefi nancieringsstelsel (MFS) te toetsen aan gangbare kwaliteitseisen voor sociaal-wetenschappelijk onderzoek.Daartoe wordt eerst een aantal basiskenmerken van de betreffende PE geregistreerd. Deze kenmerken hebben achtereenvolgens betrekking op het geëvalueerde object, het uitgevoerde onderzoek, de daarbij betrokken actoren en het onderzoeksrapport. Vervolgens vindt de toetsing plaats aan de drie kwaliteitscriteria: Validiteit, Betrouwbaarheid en Bruikbaarheid. Deze criteria zijn geoperationaliseerd door de defi niëring van een aantal indicatoren, die op hun beurt worden onderscheiden in één of meer concrete componenten. De beoordeling op deze componenten vindt plaats op een vierpunts-schaal: slecht - matig - redelijk - goed.
INVENTARISATIE VAN KENMERKEN
Evaluatieobject
tite
type object
land(en), regio(‘s)
fi nancieel belang
evaluatieperiode
Evaluatieonderzoek
gebruiksdoelstelling
type onderzoek
onderzoekskosten € ( ................. %)
fi nancieringsbron
doorlooptijd
Factoren
opdrachtgever
sturing of begeleiding
evaluatoren• •
kwalifi caties
selectiecriteria
Evaluatierapport
datum
auteur(s)• •
onderzoeksvraagstelling
ToR
omvang
18) Deze omvatten zowel “interne” PE’s van individuele MFS-organisaties als gezamenlijke PE’s ondernomen in het kader van een tijdelijk of permanent samenwerkingsverband.
36 Joint Evaluation of the Contribution of CFAs to the Microfi nance Sector, 2003-2007
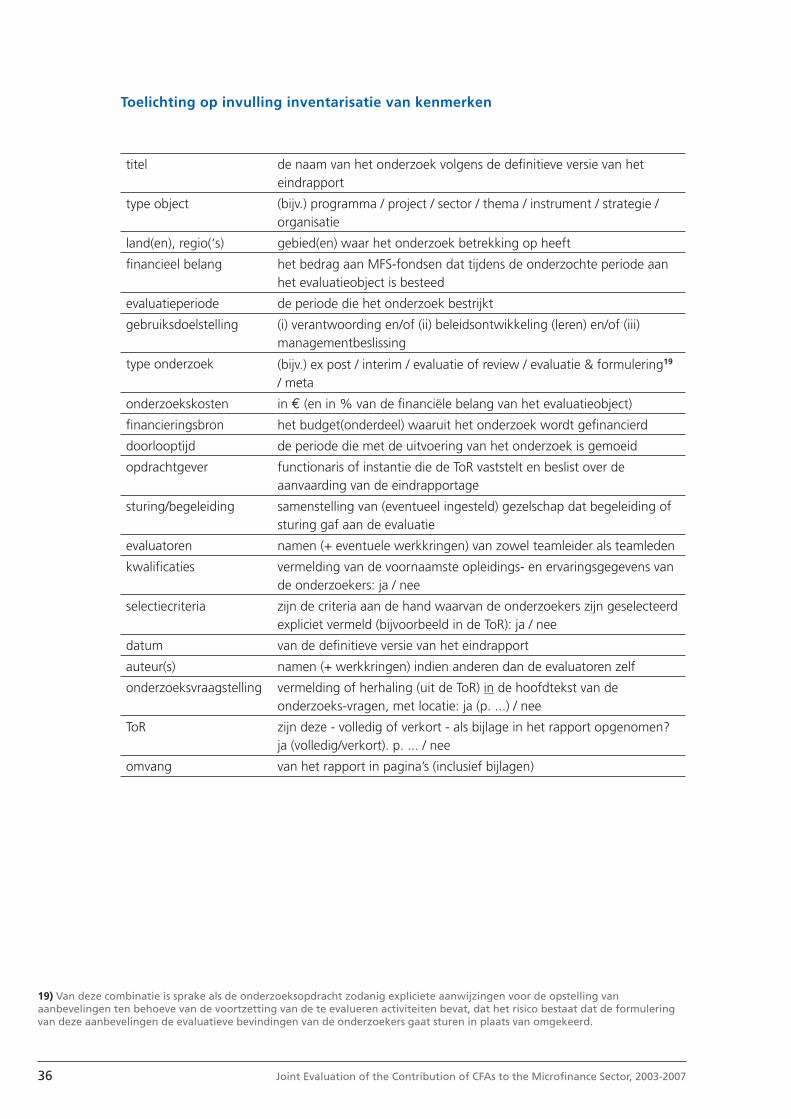
Toelichting op invulling inventarisatie van kenmerken
titel de naam van het onderzoek volgens de defi nitieve versie van het eindrapport
type object (bijv.) programma / project / sector / thema / instrument / strategie / organisatie
land(en), regio(‘s) gebied(en) waar het onderzoek betrekking op heeft
fi nancieel belang het bedrag aan MFS-fondsen dat tijdens de onderzochte periode aan het evaluatieobject is besteed
evaluatieperiode de periode die het onderzoek bestrijkt
gebruiksdoelstelling (i) verantwoording en/of (ii) beleidsontwikkeling (leren) en/of (iii) managementbeslissing
type onderzoek (bijv.) ex post / interim / evaluatie of review / evaluatie & formulering19 / meta
onderzoekskosten in € (en in % van de fi nanciële belang van het evaluatieobject)
fi nancieringsbron het budget(onderdeel) waaruit het onderzoek wordt gefi nancierd
doorlooptijd de periode die met de uitvoering van het onderzoek is gemoeid
opdrachtgever functionaris of instantie die de ToR vaststelt en beslist over de aanvaarding van de eindrapportage
sturing/begeleiding samenstelling van (eventueel ingesteld) gezelschap dat begeleiding of sturing gaf aan de evaluatie
evaluatoren namen (+ eventuele werkkringen) van zowel teamleider als teamleden
kwalifi caties vermelding van de voornaamste opleidings- en ervaringsgegevens van de onderzoekers: ja / nee
selectiecriteria zijn de criteria aan de hand waarvan de onderzoekers zijn geselecteerd expliciet vermeld (bijvoorbeeld in de ToR): ja / nee
datum van de defi nitieve versie van het eindrapport
auteur(s) namen (+ werkkringen) indien anderen dan de evaluatoren zelf
onderzoeksvraagstelling vermelding of herhaling (uit de ToR) in de hoofdtekst van de onderzoeks-vragen, met locatie: ja (p. ...) / nee
ToR zijn deze - volledig of verkort - als bijlage in het rapport opgenomen? ja (volledig/verkort). p. ... / nee
omvang van het rapport in pagina’s (inclusief bijlagen)
19) Van deze combinatie is sprake als de onderzoeksopdracht zodanig expliciete aanwijzingen voor de opstelling van aanbevelingen ten behoeve van de voortzetting van de te evalueren activiteiten bevat, dat het risico bestaat dat de formulering van deze aanbevelingen de evaluatieve bevindingen van de onderzoekers gaat sturen in plaats van omgekeerd.
37Annex 2: Terms of Reference
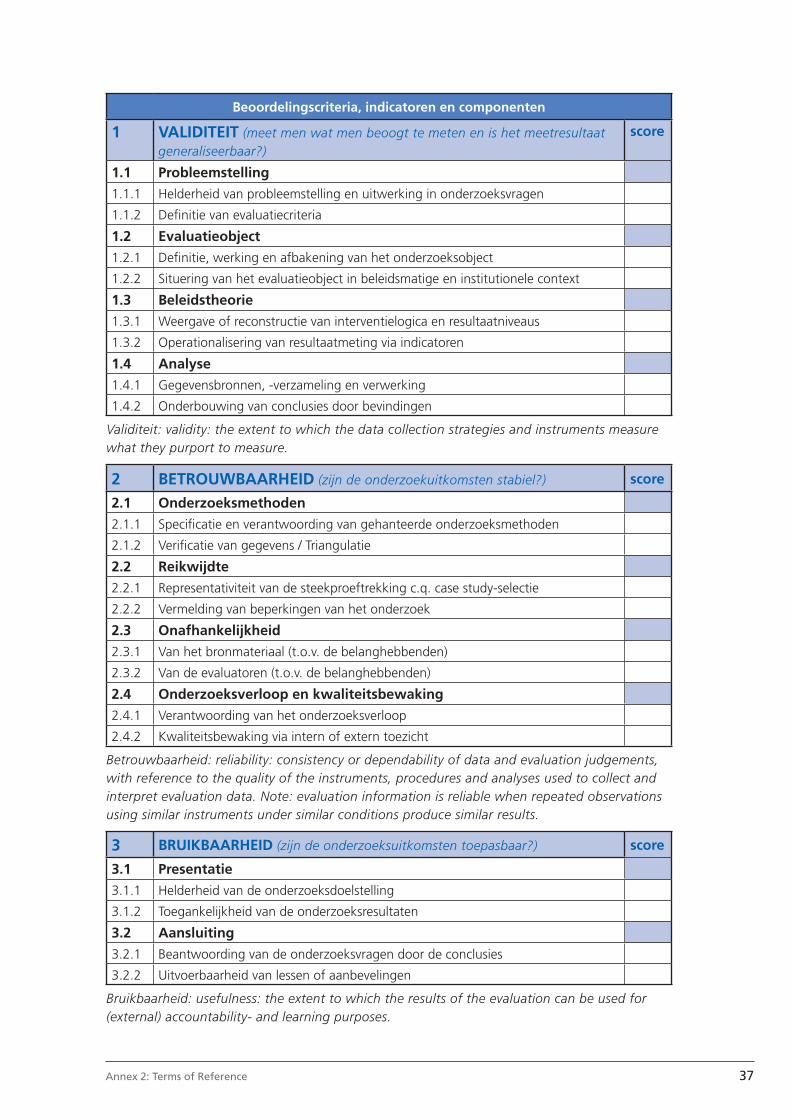
Beoordelingscriteria, indicatoren en componenten
1 VALIDITEIT (meet men wat men beoogt te meten en is het meetresultaat generaliseerbaar?)
score
1.1 Probleemstelling
1.1.1 Helderheid van probleemstelling en uitwerking in onderzoeksvragen
1.1.2 Defi nitie van evaluatiecriteria
1.2 Evaluatieobject
1.2.1 Defi nitie, werking en afbakening van het onderzoeksobject
1.2.2 Situering van het evaluatieobject in beleidsmatige en institutionele context
1.3 Beleidstheorie
1.3.1 Weergave of reconstructie van interventielogica en resultaatniveaus
1.3.2 Operationalisering van resultaatmeting via indicatoren
1.4 Analyse
1.4.1 Gegevensbronnen, -verzameling en verwerking
1.4.2 Onderbouwing van conclusies door bevindingen
Validiteit: validity: the extent to which the data collection strategies and instruments measure what they purport to measure.
2 BETROUWBAARHEID (zijn de onderzoekuitkomsten stabiel?) score
2.1 Onderzoeksmethoden
2.1.1 Specifi catie en verantwoording van gehanteerde onderzoeksmethoden
2.1.2 Verifi catie van gegevens / Triangulatie
2.2 Reikwijdte
2.2.1 Representativiteit van de steekproeftrekking c.q. case study-selectie
2.2.2 Vermelding van beperkingen van het onderzoek
2.3 Onafhankelijkheid
2.3.1 Van het bronmateriaal (t.o.v. de belanghebbenden)
2.3.2 Van de evaluatoren (t.o.v. de belanghebbenden)
2.4 Onderzoeksverloop en kwaliteitsbewaking
2.4.1 Verantwoording van het onderzoeksverloop
2.4.2 Kwaliteitsbewaking via intern of extern toezicht
Betrouwbaarheid: reliability: consistency or dependability of data and evaluation judgements, with reference to the quality of the instruments, procedures and analyses used to collect and interpret evaluation data. Note: evaluation information is reliable when repeated observations using similar instruments under similar conditions produce similar results.
3 BRUIKBAARHEID (zijn de onderzoeksuitkomsten toepasbaar?) score
3.1 Presentatie
3.1.1 Helderheid van de onderzoeksdoelstelling
3.1.2 Toegankelijkheid van de onderzoeksresultaten
3.2 Aansluiting
3.2.1 Beantwoording van de onderzoeksvragen door de conclusies
3.2.2 Uitvoerbaarheid van lessen of aanbevelingen
Bruikbaarheid: usefulness: the extent to which the results of the evaluation can be used for (external) accountability- and learning purposes.
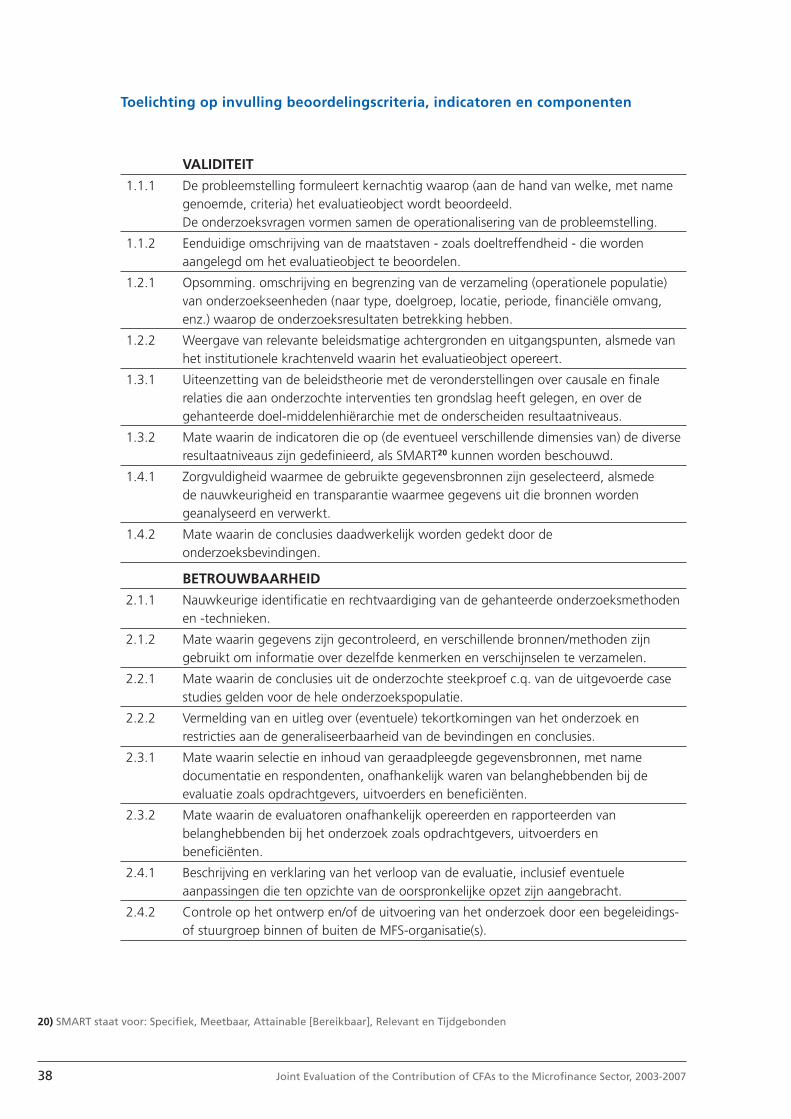
38 Joint Evaluation of the Contribution of CFAs to the Microfi nance Sector, 2003-2007
Toelichting op invulling beoordelingscriteria, indicatoren en componenten
VALIDITEIT
1.1.1 De probleemstelling formuleert kernachtig waarop (aan de hand van welke, met name genoemde, criteria) het evaluatieobject wordt beoordeeld.De onderzoeksvragen vormen samen de operationalisering van de probleemstelling.
1.1.2 Eenduidige omschrijving van de maatstaven - zoals doeltreffendheid - die worden aangelegd om het evaluatieobject te beoordelen.
1.2.1 Opsomming. omschrijving en begrenzing van de verzameling (operationele populatie) van onderzoekseenheden (naar type, doelgroep, locatie, periode, fi nanciële omvang, enz.) waarop de onderzoeksresultaten betrekking hebben.
1.2.2 Weergave van relevante beleidsmatige achtergronden en uitgangspunten, alsmede van het institutionele krachtenveld waarin het evaluatieobject opereert.
1.3.1 Uiteenzetting van de beleidstheorie met de veronderstellingen over causale en fi nale relaties die aan onderzochte interventies ten grondslag heeft gelegen, en over de gehanteerde doel-middelenhiërarchie met de onderscheiden resultaatniveaus.
1.3.2 Mate waarin de indicatoren die op (de eventueel verschillende dimensies van) de diverse resultaatniveaus zijn gedefi nieerd, als SMART20 kunnen worden beschouwd.
1.4.1 Zorgvuldigheid waarmee de gebruikte gegevensbronnen zijn geselecteerd, alsmede de nauwkeurigheid en transparantie waarmee gegevens uit die bronnen worden geanalyseerd en verwerkt.
1.4.2 Mate waarin de conclusies daadwerkelijk worden gedekt door de onderzoeksbevindingen.
BETROUWBAARHEID
2.1.1 Nauwkeurige identifi catie en rechtvaardiging van de gehanteerde onderzoeksmethoden en -technieken.
2.1.2 Mate waarin gegevens zijn gecontroleerd, en verschillende bronnen/methoden zijn gebruikt om informatie over dezelfde kenmerken en verschijnselen te verzamelen.
2.2.1 Mate waarin de conclusies uit de onderzochte steekproef c.q. van de uitgevoerde case studies gelden voor de hele onderzoekspopulatie.
2.2.2 Vermelding van en uitleg over (eventuele) tekortkomingen van het onderzoek en restricties aan de generaliseerbaarheid van de bevindingen en conclusies.
2.3.1 Mate waarin selectie en inhoud van geraadpleegde gegevensbronnen, met name documentatie en respondenten, onafhankelijk waren van belanghebbenden bij de evaluatie zoals opdrachtgevers, uitvoerders en benefi ciënten.
2.3.2 Mate waarin de evaluatoren onafhankelijk opereerden en rapporteerden van belanghebbenden bij het onderzoek zoals opdrachtgevers, uitvoerders en benefi ciënten.
2.4.1 Beschrijving en verklaring van het verloop van de evaluatie, inclusief eventuele aanpassingen die ten opzichte van de oorspronkelijke opzet zijn aangebracht.
2.4.2 Controle op het ontwerp en/of de uitvoering van het onderzoek door een begeleidings- of stuurgroep binnen of buiten de MFS-organisatie(s).
20) SMART staat voor: Specifi ek, Meetbaar, Attainable [Bereikbaar], Relevant en Tijdgebonden

39Annex 2: Terms of Reference
BRUIKBAARHEID
3.1.1 Helderheid van de specifi catie van het (buiten het onderzoek zelf gelegen - externe) doel van de evaluatie, waarvoor de onderzoeksuitkomsten zullen worden of zijn gebruikt.
3.1.2 Duidelijkheid en volledigheid waarmee in het evaluatierapport en en de samenvatting ervan de essentie van het onderzoek, en met name de hoofdbevindingen, zijn weergeven.
3.2.1 Volledigheid waarmee de onderzoeksvragen (dus alle) door de conclusies zijn beantwoord.
3.2.2 Praktische uitvoerbaarheid van gepresenteerde aanbevelingen en de mate waarin deze binnen het bereik liggen van betrokken verantwoordelijken, met name de opdrachtgevers van de evaluatie.

40 Joint Evaluation of the Contribution of CFAs to the Microfi nance Sector, 2003-2007
Annex V. Microfi nance Portfolio, april 2008
PARTOS PORTFOLIO ANALYSIS2008
Triodos Facet
April 2008 - version 2.2
Triodos Facet, P.O.Box 55, 3700 AB Zeist, The NetherlandsTel: +31 (0)30 6933 766 - Fax: +31 (0)30 6923936
[email protected] - www.triodosfacet.nl

41Annex 2: Terms of Reference
Table of content
Introduction ................................................................................................................................................................................. 33
Finding from the portfolio analysis .............................................................................................................................. 34
I - Portfolio data in geographic perspective ............................................................................................ 34
II - Portfolio data by type of instruments and goal of projects .................................................... 41
III - Portfolio data by partner organisation and its characteristics ............................................... 54
IV - CGAP Self Assessment results from all four CFAs ......................................................................... 61
V - Description of main features of the investment funds and grant programmes ....... 63
Conclusion .................................................................................................................................................................................... 69
Annex ............................................................................................................................................................................................ 70
42 Joint Evaluation of the Contribution of CFAs to the Microfi nance Sector, 2003-2007
Introduction
In the fi rst quarter of 2008, Partos has commissioned this microfi nance portfolio analysis with the aim to provide input material for the formulation of relevant evaluation questions that will be taken forward in a next phase where a full microfi nance programme evaluation will take place. The participating co-fi nancing agencies (CFAs) are based in the Netherlands and are: Cordaid, Hivos, ICCO, and Oxfam Novib. The results of this portfolio analysis are quite interesting and are presented in this report.
This portfolio analysis consists of three parts:1. Analysis at partner organisation level/project level of the four CFAs over the period
2003 - 2006;2. Analysis at the level of the CFAs, based on the CGAP 5 Star self assessment model in
2003, 2005 and 2007; and3. Description of the fund mechanisms as applied by the four CFAs (in-house or externally
managed).
For this there were three different data collection forms designed, one in Excel and two in Word. The data collection was executed under the control of the CFAs themselves.
We would like to express our sincere thanks to all staff involved in the four participating CFAs. Without them this analysis would obviously not have been possible. We would also like to thank the staff of Partos for the coordination and facilitation in the various stages of this analysis.
All tables below (and the complete database set) are provided in a separate Excel spreadsheet together with this report.
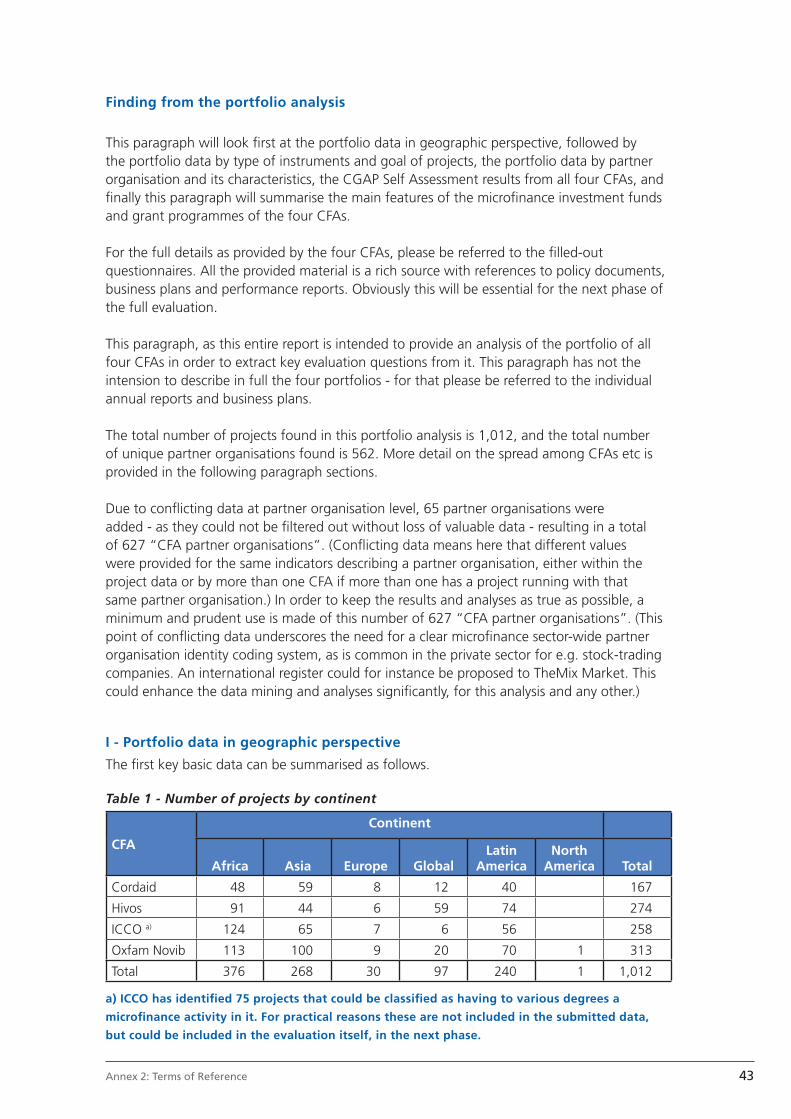
43Annex 2: Terms of Reference
Finding from the portfolio analysis
This paragraph will look fi rst at the portfolio data in geographic perspective, followed by the portfolio data by type of instruments and goal of projects, the portfolio data by partner organisation and its characteristics, the CGAP Self Assessment results from all four CFAs, and fi nally this paragraph will summarise the main features of the microfi nance investment funds and grant programmes of the four CFAs.
For the full details as provided by the four CFAs, please be referred to the fi lled-out questionnaires. All the provided material is a rich source with references to policy documents, business plans and performance reports. Obviously this will be essential for the next phase of the full evaluation.
This paragraph, as this entire report is intended to provide an analysis of the portfolio of all four CFAs in order to extract key evaluation questions from it. This paragraph has not the intension to describe in full the four portfolios - for that please be referred to the individual annual reports and business plans.
The total number of projects found in this portfolio analysis is 1,012, and the total number of unique partner organisations found is 562. More detail on the spread among CFAs etc is provided in the following paragraph sections.
Due to confl icting data at partner organisation level, 65 partner organisations were added - as they could not be fi ltered out without loss of valuable data - resulting in a total of 627 “CFA partner organisations”. (Confl icting data means here that different values were provided for the same indicators describing a partner organisation, either within the project data or by more than one CFA if more than one has a project running with that same partner organisation.) In order to keep the results and analyses as true as possible, a minimum and prudent use is made of this number of 627 “CFA partner organisations”. (This point of confl icting data underscores the need for a clear microfi nance sector-wide partner organisation identity coding system, as is common in the private sector for e.g. stock-trading companies. An international register could for instance be proposed to TheMix Market. This could enhance the data mining and analyses signifi cantly, for this analysis and any other.)
I - Portfolio data in geographic perspective
The fi rst key basic data can be summarised as follows.
Table 1 - Number of projects by continent
CFA
Continent
Africa Asia Europe GlobalLatin
AmericaNorth
America Total
Cordaid 48 59 8 12 40 167
Hivos 91 44 6 59 74 274
ICCO a) 124 65 7 6 56 258
Oxfam Novib 113 100 9 20 70 1 313
Total 376 268 30 97 240 1 1,012
a) ICCO has identifi ed 75 projects that could be classifi ed as having to various degrees a
microfi nance activity in it. For practical reasons these are not included in the submitted data,
but could be included in the evaluation itself, in the next phase.
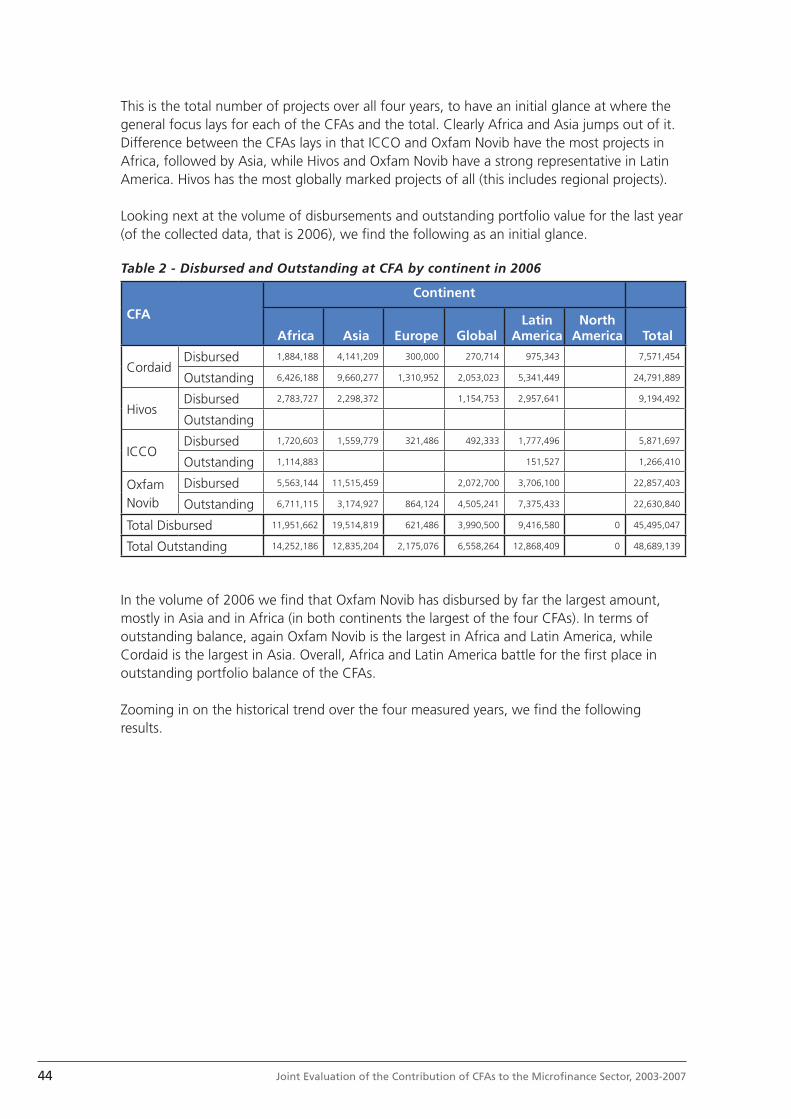
44 Joint Evaluation of the Contribution of CFAs to the Microfi nance Sector, 2003-2007
This is the total number of projects over all four years, to have an initial glance at where the general focus lays for each of the CFAs and the total. Clearly Africa and Asia jumps out of it. Difference between the CFAs lays in that ICCO and Oxfam Novib have the most projects in Africa, followed by Asia, while Hivos and Oxfam Novib have a strong representative in Latin America. Hivos has the most globally marked projects of all (this includes regional projects).
Looking next at the volume of disbursements and outstanding portfolio value for the last year (of the collected data, that is 2006), we fi nd the following as an initial glance.
Table 2 - Disbursed and Outstanding at CFA by continent in 2006
CFA
Continent
Africa Asia Europe GlobalLatin
AmericaNorth
America Total
Cordaid Disbursed 1,884,188 4,141,209 300,000 270,714 975,343 7,571,454
Outstanding 6,426,188 9,660,277 1,310,952 2,053,023 5,341,449 24,791,889
Hivos Disbursed 2,783,727 2,298,372 1,154,753 2,957,641 9,194,492
Outstanding
ICCO Disbursed 1,720,603 1,559,779 321,486 492,333 1,777,496 5,871,697
Outstanding 1,114,883 151,527 1,266,410
Oxfam Novib
Disbursed 5,563,144 11,515,459 2,072,700 3,706,100 22,857,403
Outstanding 6,711,115 3,174,927 864,124 4,505,241 7,375,433 22,630,840
Total Disbursed 11,951,662 19,514,819 621,486 3,990,500 9,416,580 0 45,495,047
Total Outstanding 14,252,186 12,835,204 2,175,076 6,558,264 12,868,409 0 48,689,139
In the volume of 2006 we fi nd that Oxfam Novib has disbursed by far the largest amount, mostly in Asia and in Africa (in both continents the largest of the four CFAs). In terms of outstanding balance, again Oxfam Novib is the largest in Africa and Latin America, while Cordaid is the largest in Asia. Overall, Africa and Latin America battle for the fi rst place in outstanding portfolio balance of the CFAs.
Zooming in on the historical trend over the four measured years, we fi nd the following results.

45Annex 2: Terms of Reference
Table 3 - Total disbursements by year, by continent, and by CFA
CFA
Continent
Africa Asia Europe GlobalLatin
AmericaNorth
America Total
Cordaid
Total 2003 592,760 3,085,948 700,000 1,044,014 1,070,920 6,493,642
Total 2004 2,337,400 2,493,385 700,000 733,386 1,211,579 7,475,750
Total 2005 2,779,389 2,719,984 400,000 328,450 926,769 7,154,592
Total 2006 1,884,188 4,141,209 300,000 270,714 975,343 7,571,454
Hivos
Total 2003 3,082,104 2,794,702 183,215 237,260 4,099,015 10,396,297
Total 2004 2,331,526 2,223,300 273,167 599,503 3,037,790 8,465,285
Total 2005 5,011,292 2,861,868 900,000 1,227,307 3,008,301 13,008,768
Total 2006 2,783,727 2,298,372 1,154,753 2,957,641 9,194,492
ICCO
Total 2003 763,856 1,272,341 335,000 767,008 3,138,206
Total 2004 824,078 1,044,957 13,000 335,000 634,594 2,851,628
Total 2005 1,625,018 978,087 183,587 506,956 1,472,814 4,766,462
Total 2006 1,720,603 1,559,779 321,486 492,333 1,777,496 5,871,697
Oxfam Novib
Total 2003 2,537,627 3,546,403 545,349 477,787 2,770,887 9,878,053
Total 2004 2,727,414 4,296,082 352,851 506,297 2,718,155 75,000 10,675,799
Total 2005 5,361,321 12,735,478 1,155,075 3,959,848 23,211,722
Total 2006 5,563,144 11,515,459 2,072,700 3,706,100 22,857,403
Total 2003 6,976,348 10,699,39 1,428,564 2,094,061 8,707,830 29,906,198 45,495,047
Total 2004 8,220,417 10,057,724 1,339,018 2,174,186 7,602,119 75,000 29,468,463
Total 2005 14,777,020 19,295,417 1,483,587 3,217,788 9,367,732 48,141,544
Total 2006 11,951,662 19,514,819 621,486 3,990,500 9,416,580 45,495,047
Grand Total 41,925,447 59,567,354 4,872,656 11,476,534 35,094,260 75,000 153,011,252
Here we fi nd that overall Africa and Asia have grown signifi cantly in volume within the total portfolio, while Europe has been shrunk and the global and Latin America part has grown to some extent. The total level of disbursements has increased signifi cantly over the years, fl attening in the fi nal year.
Looking at the four CFAs individual, we fi nd the following disbursement trends. ICCO and Oxfam Novib have increased their Africa disbursement level substantially, while Cordaid and Hivos show a slower and altering pace with a drop in their levels in the fi nal year. The same sustained increase of Oxfam Novib can be found for Asia, Latin America and their global disbursement. Cordaid has shifted its volume from Latin America to Asia, while reducing its global and Europe disbursement levels. Hivos has reduced its Latin America level (as Cordaid), contrary to ICCO and Oxfam Novib. And Hivos, ICCO and Oxfam Novib have increased their ‘global’ disbursement levels.
Looking at the development of the average disbursement levels within each project of the CFAs over the years and again by continent, we fi nd the following.

46 Joint Evaluation of the Contribution of CFAs to the Microfi nance Sector, 2003-2007
Table 4 - Average disbursements by project of the CFAs, by year, and by continent
CFA
Continent
Africa Asia Europe GlobalLatin
AmericaNorth
AmericaTotal
Average
Cordaid
Aver. 2003 118,552 205,730 700,000 261,004 97,356 180,379
Aver. 2004 194,783 166,226 350,000 183,347 80,772 155,745
Aver. 2005 132,352 108,799 200,000 82,113 92,677 115,397
Aver. 2006 110,835 147,900 300,000 45,119 243,836 135,205
Hivos
Aver. 2003 88,060 164,394 91,608 47,452 195,191 129,954
Aver. 2004 97,147 158,807 54,633 37,469 144,657 105,816
Aver. 2005 192,742 168,345 900,000 43,832 158,332 142,953
Aver. 2006 126,533 153,225 38,492 173,979 109,458
ICCO
Aver. 2003 95,482 90,882 335,000 95,876 101,232
Aver. 2004 164,816 61,468 13,000 335,000 57,690 81,475
Aver. 2005 42,764 61,130 91,794 168,985 86,636 62,717
Aver. 2006 33,089 59,991 160,743 164,111 80,795 55,921
Oxfam Novib
Aver. 2003 181,259 168,876 181,783 95,557 184,726 170,311
Aver. 2004 136,371 179,003 176,426 168,766 247,105 75,000 175,013
Aver. 2005 157,686 454,839 385,025 282,846 293,819
Aver. 2006 142,645 359,858 414,540 218,006 245,779
Total average 2003 112,522 159,692 238,094 139,604 158,324 145,884
Total average 2004 134,761 143,682 133,902 90,591 131,071 75,000 131,556
Total average 2005 124,177 224,365 296,717 84,679 156,129 156,304
Total average 2006 91,936 193,216 207,162 90,693 156,943 134,601
The average level of disbursement within each project has not changed a lot overall, although there are some signifi cant extremes to be found over the continents and the years. By CFA it looks like that ICCO has the strongest downwards trends overall, with Oxfam Novib with the highest overall average disbursement levels. The overall trend within each CFA (except Oxfam Novib) is one of a downwards trends, which may depend on the average absorption capacity at the receiving end, the partner organisation. This could be interesting to explore further as possible evidence for a trend of having a larger number of smaller partner organisations in the portfolio (with subsequent smaller funding needs and smaller funding absorption capacities).
The above data is based on the following number of occurrences in the database, which suggests a good representation.
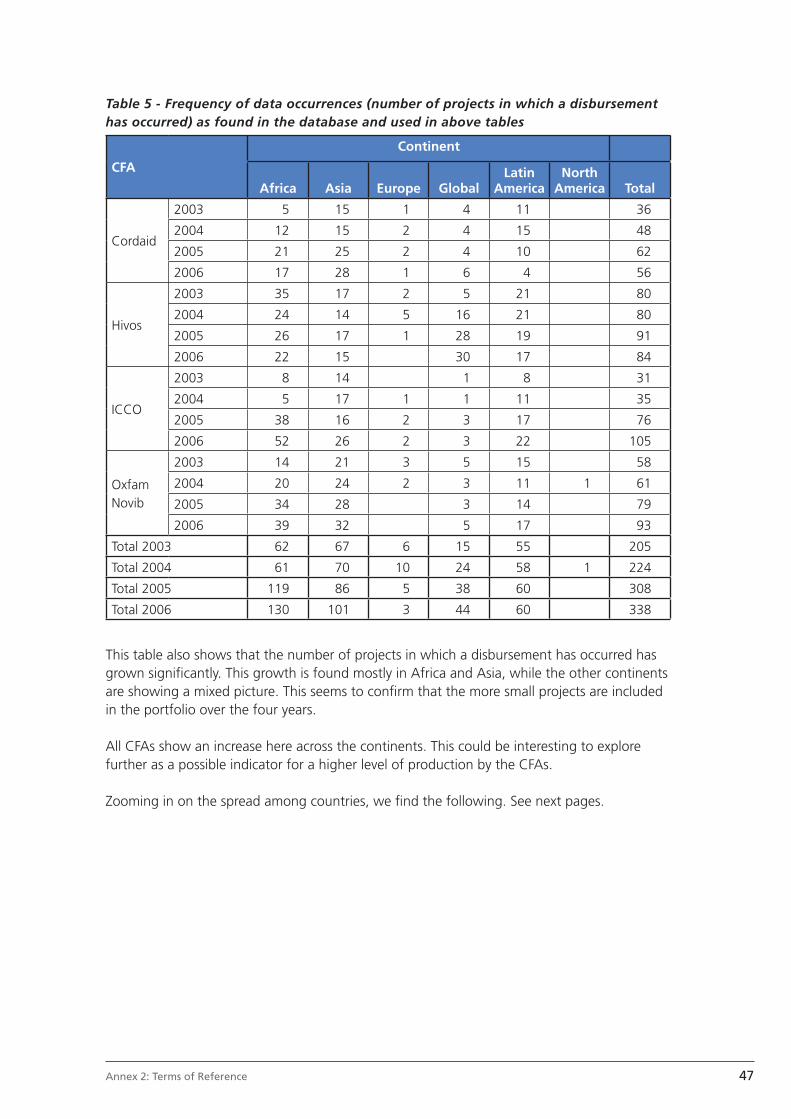
47Annex 2: Terms of Reference
Table 5 - Frequency of data occurrences (number of projects in which a disbursement has occurred) as found in the database and used in above tables
CFA
Continent
Africa Asia Europe GlobalLatin
AmericaNorth
America Total
Cordaid
2003 5 15 1 4 11 36
2004 12 15 2 4 15 48
2005 21 25 2 4 10 62
2006 17 28 1 6 4 56
Hivos
2003 35 17 2 5 21 80
2004 24 14 5 16 21 80
2005 26 17 1 28 19 91
2006 22 15 30 17 84
ICCO
2003 8 14 1 8 31
2004 5 17 1 1 11 35
2005 38 16 2 3 17 76
2006 52 26 2 3 22 105
Oxfam Novib
2003 14 21 3 5 15 58
2004 20 24 2 3 11 1 61
2005 34 28 3 14 79
2006 39 32 5 17 93
Total 2003 62 67 6 15 55 205
Total 2004 61 70 10 24 58 1 224
Total 2005 119 86 5 38 60 308
Total 2006 130 101 3 44 60 338
This table also shows that the number of projects in which a disbursement has occurred has grown signifi cantly. This growth is found mostly in Africa and Asia, while the other continents are showing a mixed picture. This seems to confi rm that the more small projects are included in the portfolio over the four years.
All CFAs show an increase here across the continents. This could be interesting to explore further as a possible indicator for a higher level of production by the CFAs.
Zooming in on the spread among countries, we fi nd the following. See next pages.
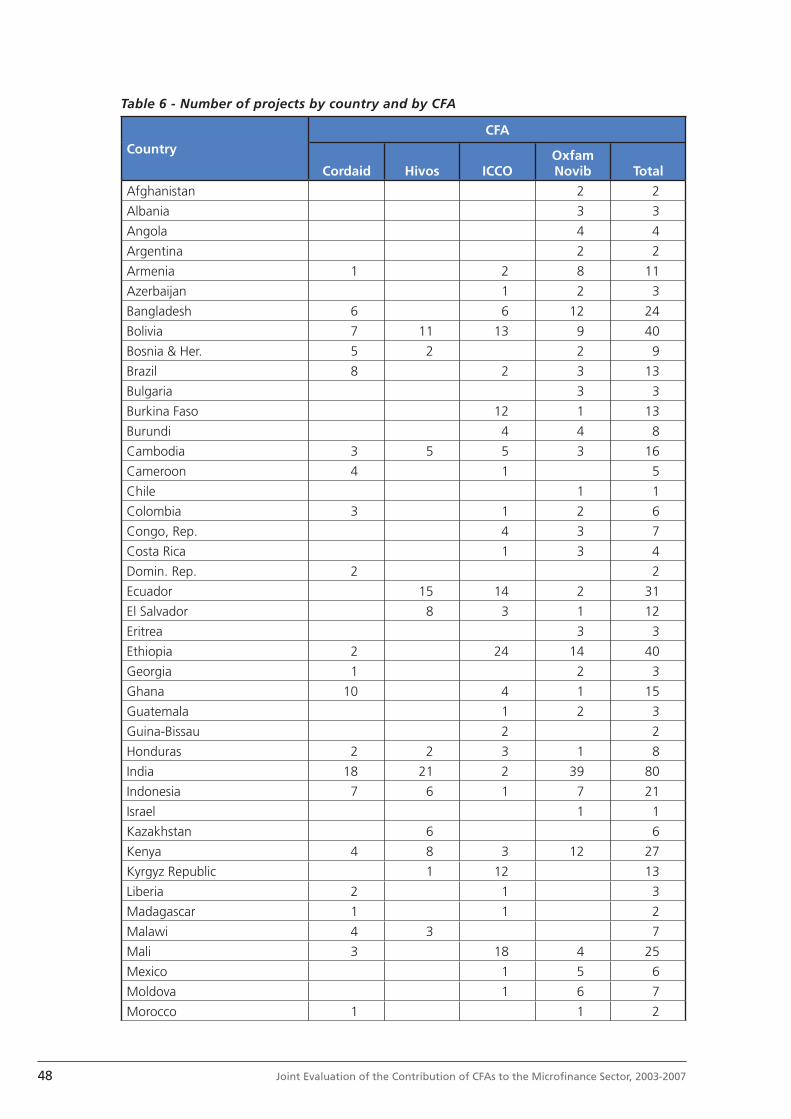
48 Joint Evaluation of the Contribution of CFAs to the Microfi nance Sector, 2003-2007
Table 6 - Number of projects by country and by CFA
CountryCFA
Cordaid Hivos ICCOOxfam Novib Total
Afghanistan 2 2
Albania 3 3
Angola 4 4
Argentina 2 2
Armenia 1 2 8 11
Azerbaijan 1 2 3
Bangladesh 6 6 12 24
Bolivia 7 11 13 9 40
Bosnia & Her. 5 2 2 9
Brazil 8 2 3 13
Bulgaria 3 3
Burkina Faso 12 1 13
Burundi 4 4 8
Cambodia 3 5 5 3 16
Cameroon 4 1 5
Chile 1 1
Colombia 3 1 2 6
Congo, Rep. 4 3 7
Costa Rica 1 3 4
Domin. Rep. 2 2
Ecuador 15 14 2 31
El Salvador 8 3 1 12
Eritrea 3 3
Ethiopia 2 24 14 40
Georgia 1 2 3
Ghana 10 4 1 15
Guatemala 1 2 3
Guina-Bissau 2 2
Honduras 2 2 3 1 8
India 18 21 2 39 80
Indonesia 7 6 1 7 21
Israel 1 1
Kazakhstan 6 6
Kenya 4 8 3 12 27
Kyrgyz Republic 1 12 13
Liberia 2 1 3
Madagascar 1 1 2
Malawi 4 3 7
Mali 3 18 4 25
Mexico 1 5 6
Moldova 1 6 7
Morocco 1 1 2
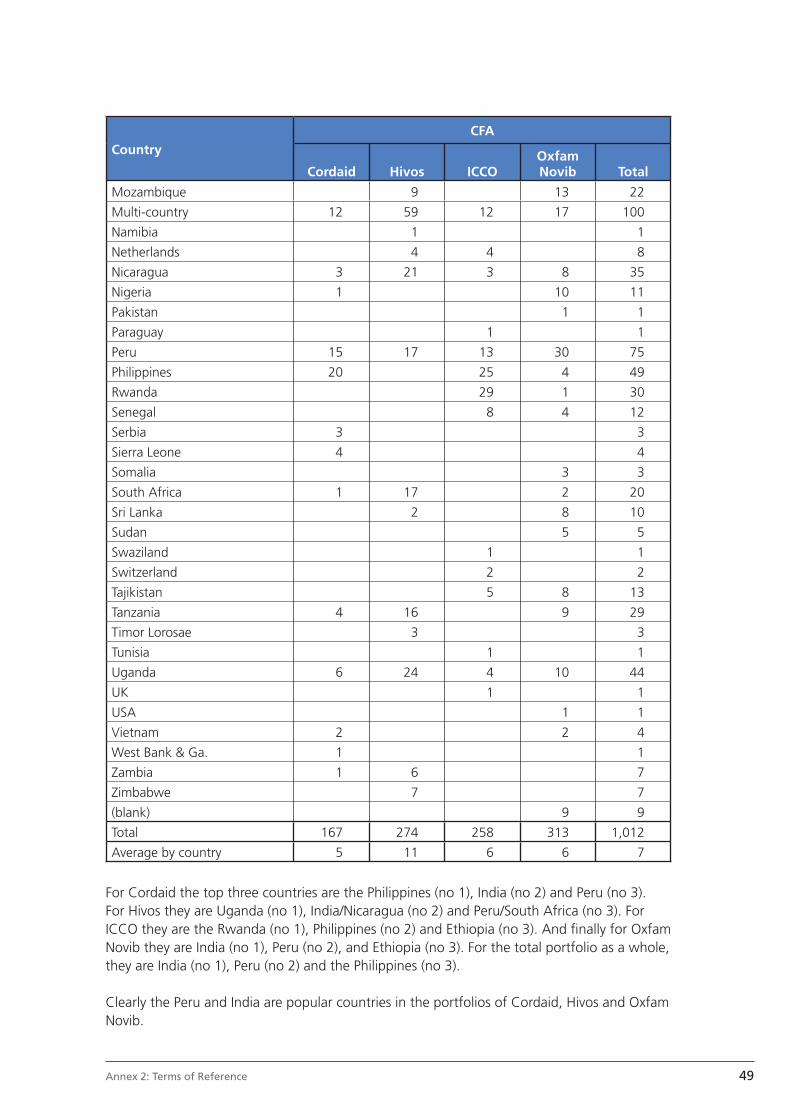
49Annex 2: Terms of Reference
CountryCFA
Cordaid Hivos ICCOOxfam Novib Total
Mozambique 9 13 22
Multi-country 12 59 12 17 100
Namibia 1 1
Netherlands 4 4 8
Nicaragua 3 21 3 8 35
Nigeria 1 10 11
Pakistan 1 1
Paraguay 1 1
Peru 15 17 13 30 75
Philippines 20 25 4 49
Rwanda 29 1 30
Senegal 8 4 12
Serbia 3 3
Sierra Leone 4 4
Somalia 3 3
South Africa 1 17 2 20
Sri Lanka 2 8 10
Sudan 5 5
Swaziland 1 1
Switzerland 2 2
Tajikistan 5 8 13
Tanzania 4 16 9 29
Timor Lorosae 3 3
Tunisia 1 1
Uganda 6 24 4 10 44
UK 1 1
USA 1 1
Vietnam 2 2 4
West Bank & Ga. 1 1
Zambia 1 6 7
Zimbabwe 7 7
(blank) 9 9
Total 167 274 258 313 1,012
Average by country 5 11 6 6 7
For Cordaid the top three countries are the Philippines (no 1), India (no 2) and Peru (no 3). For Hivos they are Uganda (no 1), India/Nicaragua (no 2) and Peru/South Africa (no 3). For ICCO they are the Rwanda (no 1), Philippines (no 2) and Ethiopia (no 3). And fi nally for Oxfam Novib they are India (no 1), Peru (no 2), and Ethiopia (no 3). For the total portfolio as a whole, they are India (no 1), Peru (no 2) and the Philippines (no 3).
Clearly the Peru and India are popular countries in the portfolios of Cordaid, Hivos and Oxfam Novib.
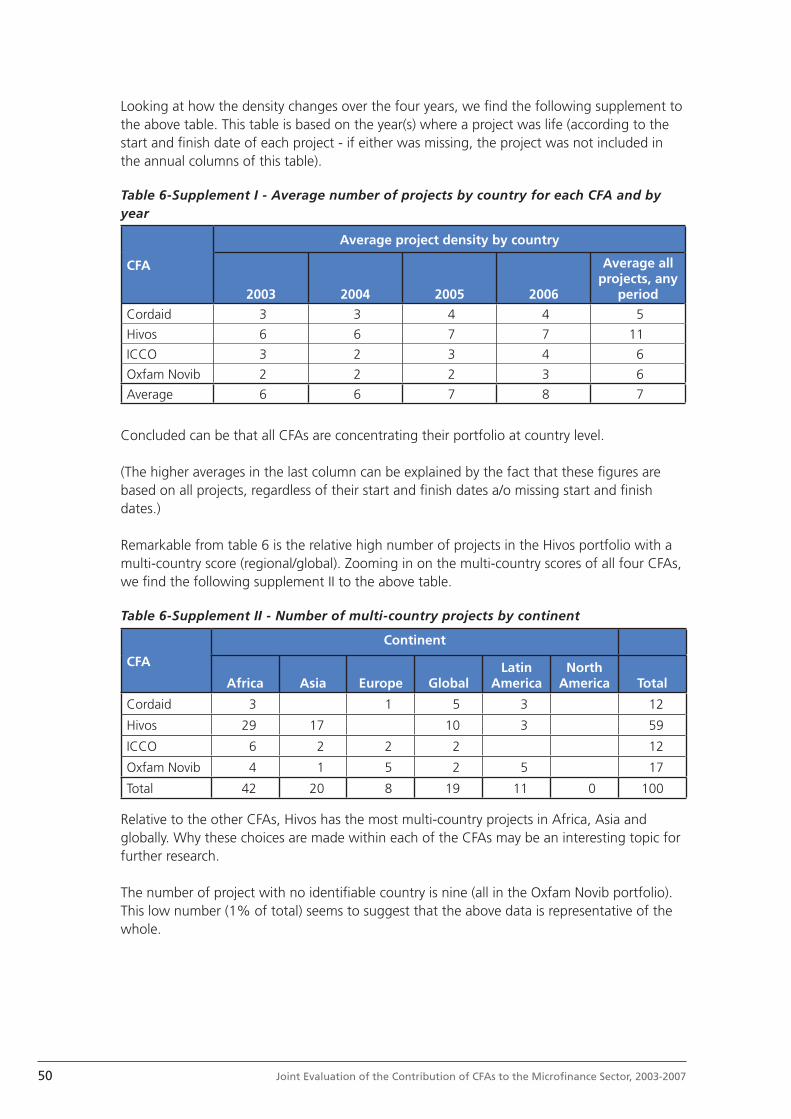
50 Joint Evaluation of the Contribution of CFAs to the Microfi nance Sector, 2003-2007
Looking at how the density changes over the four years, we fi nd the following supplement to the above table. This table is based on the year(s) where a project was life (according to the start and fi nish date of each project - if either was missing, the project was not included in the annual columns of this table).
Table 6-Supplement I - Average number of projects by country for each CFA and by year
CFA
Average project density by country
2003 2004 2005 2006
Average all projects, any
period
Cordaid 3 3 4 4 5
Hivos 6 6 7 7 11
ICCO 3 2 3 4 6
Oxfam Novib 2 2 2 3 6
Average 6 6 7 8 7
Concluded can be that all CFAs are concentrating their portfolio at country level.
(The higher averages in the last column can be explained by the fact that these fi gures are based on all projects, regardless of their start and fi nish dates a/o missing start and fi nish dates.)
Remarkable from table 6 is the relative high number of projects in the Hivos portfolio with a multi-country score (regional/global). Zooming in on the multi-country scores of all four CFAs, we fi nd the following supplement II to the above table.
Table 6-Supplement II - Number of multi-country projects by continent
CFA
Continent
Africa Asia Europe GlobalLatin
AmericaNorth
America Total
Cordaid 3 1 5 3 12
Hivos 29 17 10 3 59
ICCO 6 2 2 2 12
Oxfam Novib 4 1 5 2 5 17
Total 42 20 8 19 11 0 100
Relative to the other CFAs, Hivos has the most multi-country projects in Africa, Asia and globally. Why these choices are made within each of the CFAs may be an interesting topic for further research.
The number of project with no identifi able country is nine (all in the Oxfam Novib portfolio). This low number (1% of total) seems to suggest that the above data is representative of the whole.
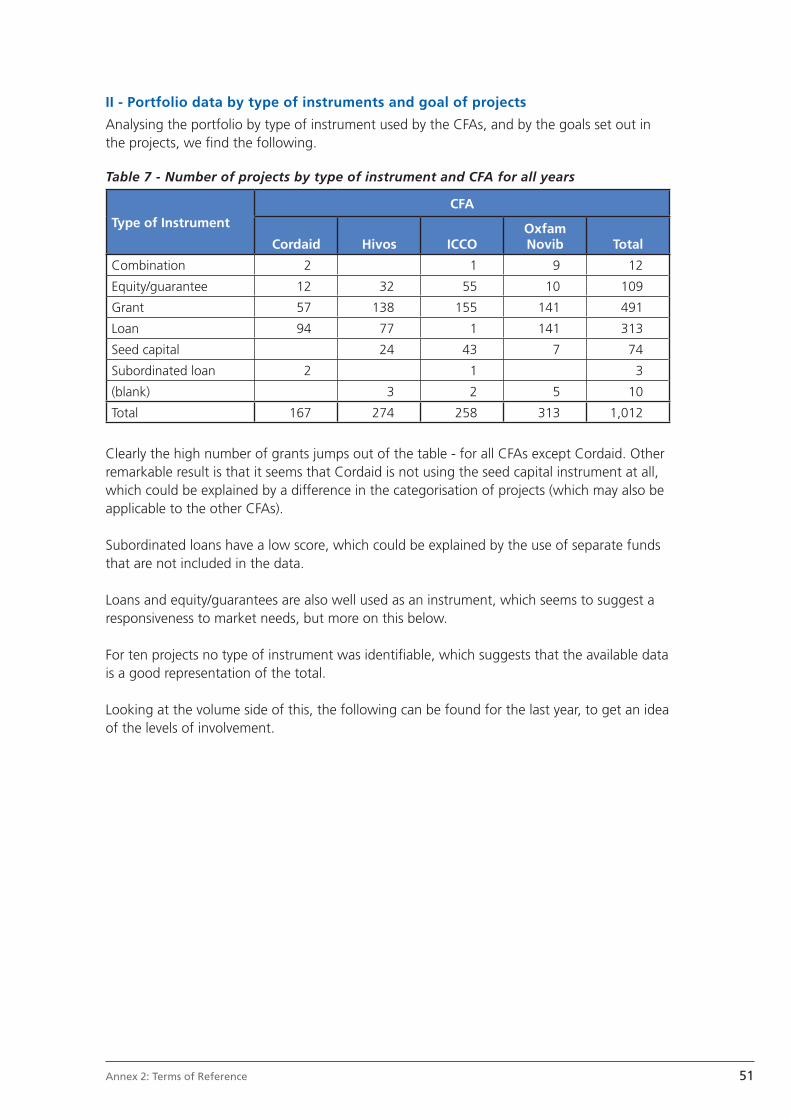
51Annex 2: Terms of Reference
II - Portfolio data by type of instruments and goal of projects
Analysing the portfolio by type of instrument used by the CFAs, and by the goals set out in the projects, we fi nd the following.
Table 7 - Number of projects by type of instrument and CFA for all years
Type of InstrumentCFA
Cordaid Hivos ICCOOxfam Novib Total
Combination 2 1 9 12
Equity/guarantee 12 32 55 10 109
Grant 57 138 155 141 491
Loan 94 77 1 141 313
Seed capital 24 43 7 74
Subordinated loan 2 1 3
(blank) 3 2 5 10
Total 167 274 258 313 1,012
Clearly the high number of grants jumps out of the table - for all CFAs except Cordaid. Other remarkable result is that it seems that Cordaid is not using the seed capital instrument at all, which could be explained by a difference in the categorisation of projects (which may also be applicable to the other CFAs).
Subordinated loans have a low score, which could be explained by the use of separate funds that are not included in the data.
Loans and equity/guarantees are also well used as an instrument, which seems to suggest a responsiveness to market needs, but more on this below.
For ten projects no type of instrument was identifi able, which suggests that the available data is a good representation of the total.
Looking at the volume side of this, the following can be found for the last year, to get an idea of the levels of involvement.
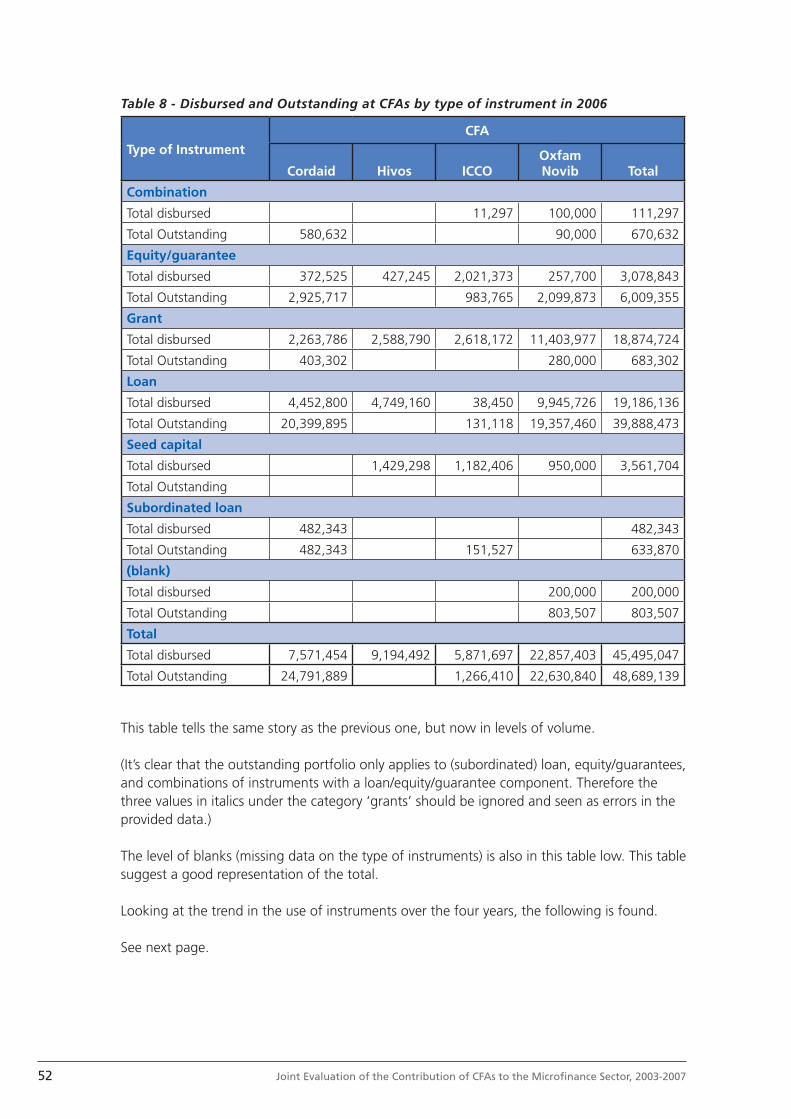
52 Joint Evaluation of the Contribution of CFAs to the Microfi nance Sector, 2003-2007
Table 8 - Disbursed and Outstanding at CFAs by type of instrument in 2006
Type of InstrumentCFA
Cordaid Hivos ICCOOxfam Novib Total
Combination
Total disbursed 11,297 100,000 111,297
Total Outstanding 580,632 90,000 670,632
Equity/guarantee
Total disbursed 372,525 427,245 2,021,373 257,700 3,078,843
Total Outstanding 2,925,717 983,765 2,099,873 6,009,355
Grant
Total disbursed 2,263,786 2,588,790 2,618,172 11,403,977 18,874,724
Total Outstanding 403,302 280,000 683,302
Loan
Total disbursed 4,452,800 4,749,160 38,450 9,945,726 19,186,136
Total Outstanding 20,399,895 131,118 19,357,460 39,888,473
Seed capital
Total disbursed 1,429,298 1,182,406 950,000 3,561,704
Total Outstanding
Subordinated loan
Total disbursed 482,343 482,343
Total Outstanding 482,343 151,527 633,870
(blank)
Total disbursed 200,000 200,000
Total Outstanding 803,507 803,507
Total
Total disbursed 7,571,454 9,194,492 5,871,697 22,857,403 45,495,047
Total Outstanding 24,791,889 1,266,410 22,630,840 48,689,139
This table tells the same story as the previous one, but now in levels of volume.
(It’s clear that the outstanding portfolio only applies to (subordinated) loan, equity/guarantees, and combinations of instruments with a loan/equity/guarantee component. Therefore the three values in italics under the category ‘grants’ should be ignored and seen as errors in the provided data.)
The level of blanks (missing data on the type of instruments) is also in this table low. This table suggest a good representation of the total.
Looking at the trend in the use of instruments over the four years, the following is found.
See next page.

53Annex 2: Terms of Reference
Table 9 - Total disbursements by year, by type of instrument and by CFA
Type of Instrument, with disbursements by year
CFA
Cordaid Hivos ICCOOxfam Novib Total
Combination
Total 2003 275,401 275,401
Total 2004 69,676 69,676
Total 2005 205,000 205,000
Total 2006 11,297 100,000 111,297
Equity/guarantee
Total 2003 409,697 3,457,823 1,145,565 13,740 5,026,825
Total 2004 817,287 1,976,014 358,467 6,297 3,158,065
Total 2005 652,106 2,005,500 1,702,600 133,000 4,493,206
Total 2006 372,525 427,245 2,021,373 257,700 3,078,843
Grant
Total 2003 827,421 2,430,562 1,905,625 4,495,774 9,659,381
Total 2004 1,951,811 2,314,898 2,493,161 5,183,496 11,943,367
Total 2005 1,760,795 2,485,709 2,187,509 14,589,097 21,023,110
Total 2006 2,263,786 2,588,790 2,618,172 11,403,977 18,874,724
Loan
Total 2003 5,256,524 3,614,780 87,016 4,888,138 13,846,458
Total 2004 4,636,976 3,238,432 5,086,006 12,961,414
Total 2005 4,741,691 7,475,124 27,829 7,690,197 19,934,841
Total 2006 4,452,800 4,749,160 38,450 9,945,726 19,186,136
Seed capital
Total 2003 893,133 205,000 1,098,133
Total 2004 932,941 400,000 1,332,941
Total 2005 1,042,435 711,524 394,428 2,148,387
Total 2006 1,429,298 1,182,406 950,000 3,561,704
Subordinated loan
Total 2003
Total 2004
Total 2005 137,000 137,000
Total 2006 482,343 482,343
(blank)
Total 2003
Total 2004 3,000 3,000
Total 2005 200,000 200,000
Total 2006 200,000 200,000
Total 2003 6,493,642 10,396,297 3,138,206 9,878,053 29,906,198
Total 2004 7,475,750 8,465,285 2,851,628 10,675,799 29,468,463
Total 2005 7,154,592 13,008,768 4,766,462 23,211,722 48,141,544
Total 2006 7,571,454 9,194,492 5,871,697 22,857,403 45,495,047
Grand Total 28,695,438 41,064,843 16,627,994 66,622,977 153,011,252
The grant’s and loan’s levels have gone up overall, though there are some differences between the CFAs. It seems that Hivos and ICCO have a more or less stable grants budget allocated, while Cordaid has increased its grants level over the years to come at par with Hivos and ICCO. Oxfam Novib has signifi cantly further enhanced its grants levels, well beyond the others.
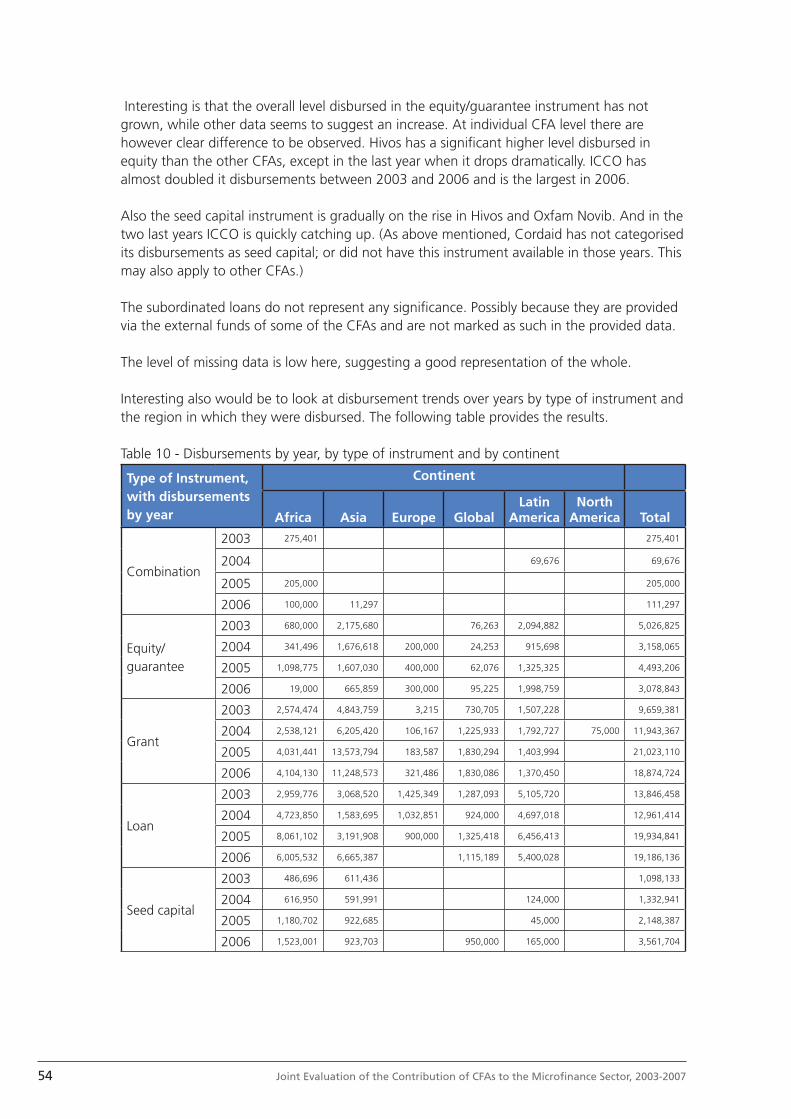
54 Joint Evaluation of the Contribution of CFAs to the Microfi nance Sector, 2003-2007
Interesting is that the overall level disbursed in the equity/guarantee instrument has not grown, while other data seems to suggest an increase. At individual CFA level there are however clear difference to be observed. Hivos has a signifi cant higher level disbursed in equity than the other CFAs, except in the last year when it drops dramatically. ICCO has almost doubled it disbursements between 2003 and 2006 and is the largest in 2006.
Also the seed capital instrument is gradually on the rise in Hivos and Oxfam Novib. And in the two last years ICCO is quickly catching up. (As above mentioned, Cordaid has not categorised its disbursements as seed capital; or did not have this instrument available in those years. This may also apply to other CFAs.)
The subordinated loans do not represent any signifi cance. Possibly because they are provided via the external funds of some of the CFAs and are not marked as such in the provided data.
The level of missing data is low here, suggesting a good representation of the whole.
Interesting also would be to look at disbursement trends over years by type of instrument and the region in which they were disbursed. The following table provides the results.
Table 10 - Disbursements by year, by type of instrument and by continent
Type of Instrument, with disbursements by year
Continent
Africa Asia Europe GlobalLatin
AmericaNorth
America Total
Combination
2003 275,401 275,401
2004 69,676 69,676
2005 205,000 205,000
2006 100,000 11,297 111,297
Equity/guarantee
2003 680,000 2,175,680 76,263 2,094,882 5,026,825
2004 341,496 1,676,618 200,000 24,253 915,698 3,158,065
2005 1,098,775 1,607,030 400,000 62,076 1,325,325 4,493,206
2006 19,000 665,859 300,000 95,225 1,998,759 3,078,843
Grant
2003 2,574,474 4,843,759 3,215 730,705 1,507,228 9,659,381
2004 2,538,121 6,205,420 106,167 1,225,933 1,792,727 75,000 11,943,367
2005 4,031,441 13,573,794 183,587 1,830,294 1,403,994 21,023,110
2006 4,104,130 11,248,573 321,486 1,830,086 1,370,450 18,874,724
Loan
2003 2,959,776 3,068,520 1,425,349 1,287,093 5,105,720 13,846,458
2004 4,723,850 1,583,695 1,032,851 924,000 4,697,018 12,961,414
2005 8,061,102 3,191,908 900,000 1,325,418 6,456,413 19,934,841
2006 6,005,532 6,665,387 1,115,189 5,400,028 19,186,136
Seed capital
2003 486,696 611,436 1,098,133
2004 616,950 591,991 124,000 1,332,941
2005 1,180,702 922,685 45,000 2,148,387
2006 1,523,001 923,703 950,000 165,000 3,561,704

55Annex 2: Terms of Reference
Type of Instrument, with disbursements by year
Continent
Africa Asia Europe GlobalLatin
AmericaNorth
America Total
Subordinated loan
2003
2004
2005 137,000 137,000
2006 482,343 482,343
(blank)
2003
2004 3,000 3,000
2005 200,000 200,000
2006 200,000 200,000
Total 2003 6,976,348 10,699,395 1,428,564 2,094,061 8,707,830 29,906,198
Total 2004 8,220,417 10,057,724 1,339,018 2,174,186 7,602,119 75,000 29,468,463
Total 2005 14,777,020 19,295,417 1,483,341 3,217,788 9,367,732 48,141,544
Total 2006 11,951,662 19,514,819 621,486 3,990,500 9,416,580 45,495,047
Signifi cant is that the loan instrument in Africa is now at par with Latin America, and that it even has surpassed Latin America in some years. The equity/guarantee instrument however has stayed behind in Africa compared to Latin America, which could be explained by a lack of suitable partner organisations in Africa, or a too high risk level to allow for the prudent use of equity. Nevertheless these developed with regard to Africa could be an interesting topic for further research.
The seed capital instrument is mostly used in Africa, followed by Asia. This seems to confi rm the general impression that the highest need of this type of instrument is indeed to be found in Africa, followed by Asia. (Noted should be that each CFA uses a (slightly) different defi nition of what a seed capital instrument is.)
The grant instrument is mostly disbursed in Asia and shows the highest growth rate over the four years. The level of grants disbursed in Africa lack signifi cantly behind Asia, in the last year at a rate of 1:3 coming from a rate of 1:2 - thus worsening. Again this could be an interesting topic for further research in the rationale of this allocation issue and causes that may have infl uenced this.
In roughly all instruments has Latin America remained its position. This may indicate a maturing part of the portfolio.
Europe is clearly on the way out with fl uctuating but downwards turning trends in instruments.
The level of missing data is low here, suggesting the table is a good representation of the whole.
In the following table, number 11, the number of projects by type of instrument and region are shown.
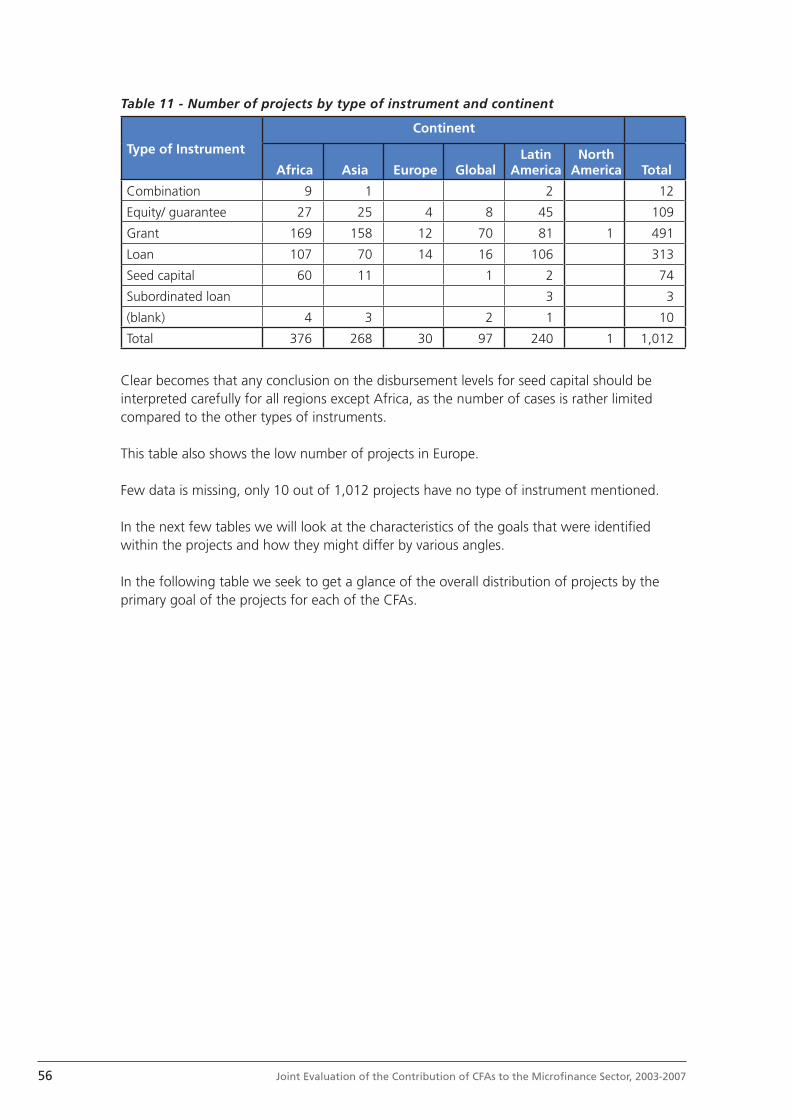
56 Joint Evaluation of the Contribution of CFAs to the Microfi nance Sector, 2003-2007
Table 11 - Number of projects by type of instrument and continent
Type of Instrument
Continent
Africa Asia Europe GlobalLatin
AmericaNorth
America Total
Combination 9 1 2 12
Equity/ guarantee 27 25 4 8 45 109
Grant 169 158 12 70 81 1 491
Loan 107 70 14 16 106 313
Seed capital 60 11 1 2 74
Subordinated loan 3 3
(blank) 4 3 2 1 10
Total 376 268 30 97 240 1 1,012
Clear becomes that any conclusion on the disbursement levels for seed capital should be interpreted carefully for all regions except Africa, as the number of cases is rather limited compared to the other types of instruments.
This table also shows the low number of projects in Europe.
Few data is missing, only 10 out of 1,012 projects have no type of instrument mentioned.
In the next few tables we will look at the characteristics of the goals that were identifi ed within the projects and how they might differ by various angles.
In the following table we seek to get a glance of the overall distribution of projects by the primary goal of the projects for each of the CFAs.
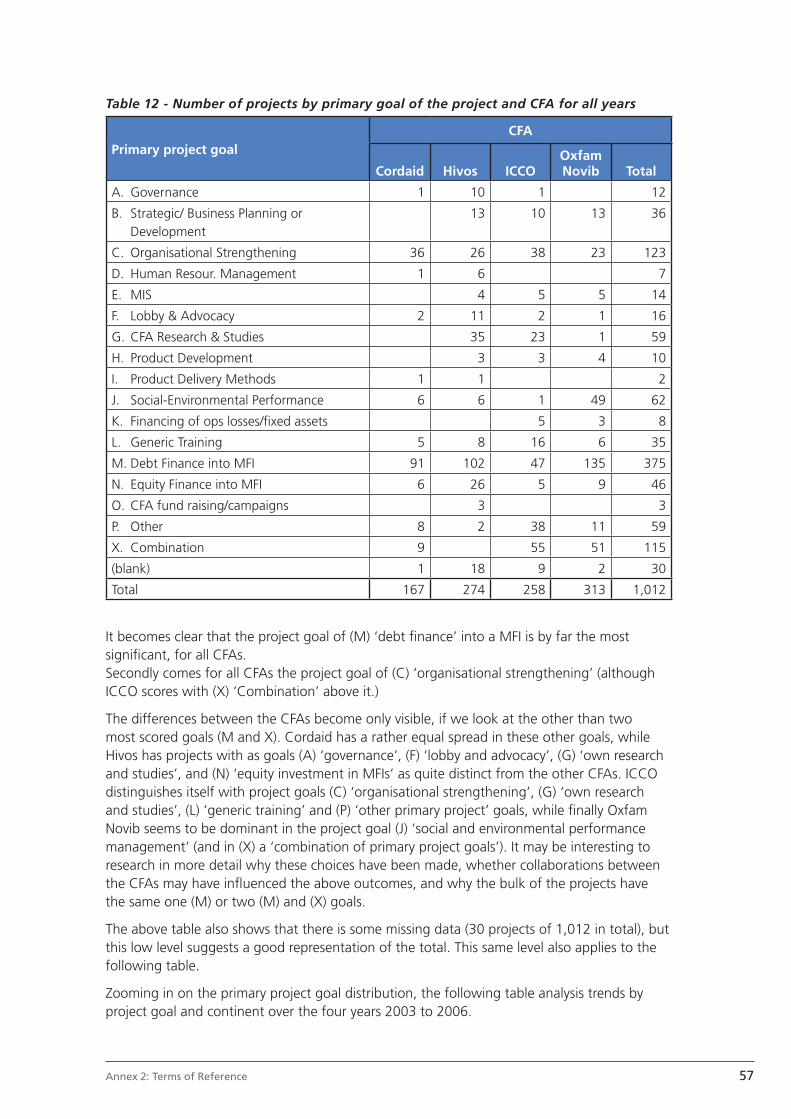
57Annex 2: Terms of Reference
Table 12 - Number of projects by primary goal of the project and CFA for all years
Primary project goalCFA
Cordaid Hivos ICCOOxfam Novib Total
A. Governance 1 10 1 12
B. Strategic/ Business Planning or Development
13 10 13 36
C. Organisational Strengthening 36 26 38 23 123
D. Human Resour. Management 1 6 7
E. MIS 4 5 5 14
F. Lobby & Advocacy 2 11 2 1 16
G. CFA Research & Studies 35 23 1 59
H. Product Development 3 3 4 10
I. Product Delivery Methods 1 1 2
J. Social-Environmental Performance 6 6 1 49 62
K. Financing of ops losses/fi xed assets 5 3 8
L. Generic Training 5 8 16 6 35
M. Debt Finance into MFI 91 102 47 135 375
N. Equity Finance into MFI 6 26 5 9 46
O. CFA fund raising/campaigns 3 3
P. Other 8 2 38 11 59
X. Combination 9 55 51 115
(blank) 1 18 9 2 30
Total 167 274 258 313 1,012
It becomes clear that the project goal of (M) ‘debt fi nance’ into a MFI is by far the most signifi cant, for all CFAs.Secondly comes for all CFAs the project goal of (C) ‘organisational strengthening’ (although ICCO scores with (X) ‘Combination’ above it.)
The differences between the CFAs become only visible, if we look at the other than two most scored goals (M and X). Cordaid has a rather equal spread in these other goals, while Hivos has projects with as goals (A) ‘governance’, (F) ‘lobby and advocacy’, (G) ‘own research and studies’, and (N) ‘equity investment in MFIs’ as quite distinct from the other CFAs. ICCO distinguishes itself with project goals (C) ‘organisational strengthening’, (G) ‘own research and studies’, (L) ‘generic training’ and (P) ‘other primary project’ goals, while fi nally Oxfam Novib seems to be dominant in the project goal (J) ‘social and environmental performance management’ (and in (X) a ‘combination of primary project goals’). It may be interesting to research in more detail why these choices have been made, whether collaborations between the CFAs may have infl uenced the above outcomes, and why the bulk of the projects have the same one (M) or two (M) and (X) goals.
The above table also shows that there is some missing data (30 projects of 1,012 in total), but this low level suggests a good representation of the total. This same level also applies to the following table.
Zooming in on the primary project goal distribution, the following table analysis trends by project goal and continent over the four years 2003 to 2006.

58 Joint Evaluation of the Contribution of CFAs to the Microfi nance Sector, 2003-2007
Table 13 - Disbursements by year, by primary project goal and by continent
Primary project goal, with disbursements by year
Continent
Africa Asia Europe GlobalLatin
AmericaNorth
America Total
A. Governance 2003 453,78 50 51,073 554,853
2004 482,934 115 83,489 681,423
2005 37,214 275 8,096 320,31
2006 42,272 203 70 315,272
B. Strategic/ Business Planning or Development
2003 79,193 156,436 235,629
2004 365,013 120,528 13 140 124 75 837,541
2005 768,96 197,161 28,194 45 1,039,315
2006 333,6 629,028 100,331 165 1,227,959
C. Organisational Strengthening
2003 657,137 1,504,149 170,705 917,74 3,249,731
2004 504,88 1,393,245 304,877 831,022 3,034,024
2005 1,119,164 1,506,192 13,341 96,031 348,956 3,083,684
2006 1,234,990 1,255,740 95 367,21 2,952,940
D. Human Resour. Management
2003 50 50
2004 90 90
2005 52,403 4,52 56,923
2006 100 33,588 133,588
E. MIS 2003 45,378 1,814 47,192
2004 49,473 49,473
2005 5,63 101,32 50 156,95
2006 50 83,153 98 231,153
F. Lobby & Advocacy
2003 237 25 262
2004 175 9,36 184,36
2005 385,207 69,64 454,847
2006 325 112,63 30 467,63
G. CFA Research & Studies
2003 10,293 30 40,293
2004 17,432 266,056 27,143 310,63
2005 80,507 170,246 818,458 87 1,156,212
2006 121,495 18,17 316,063 502,556 40 998,284
H. Product Development
2003
2004 127 127
2005 49 35,315 84,315
2006 4,8 70,17 950 20 1,044,970
I. Product Delivery Methods
2003
2004 567,6 567,6
2005
2006
J. Social-Environmental Performance
2003 200 2,202,399 10 7,28 2,419,679
2004 140 2,688,502 2,828,502
2005 635 10,995,948 11,630,948
2006 381,649 8,434,265 110,125 95 9,021,039
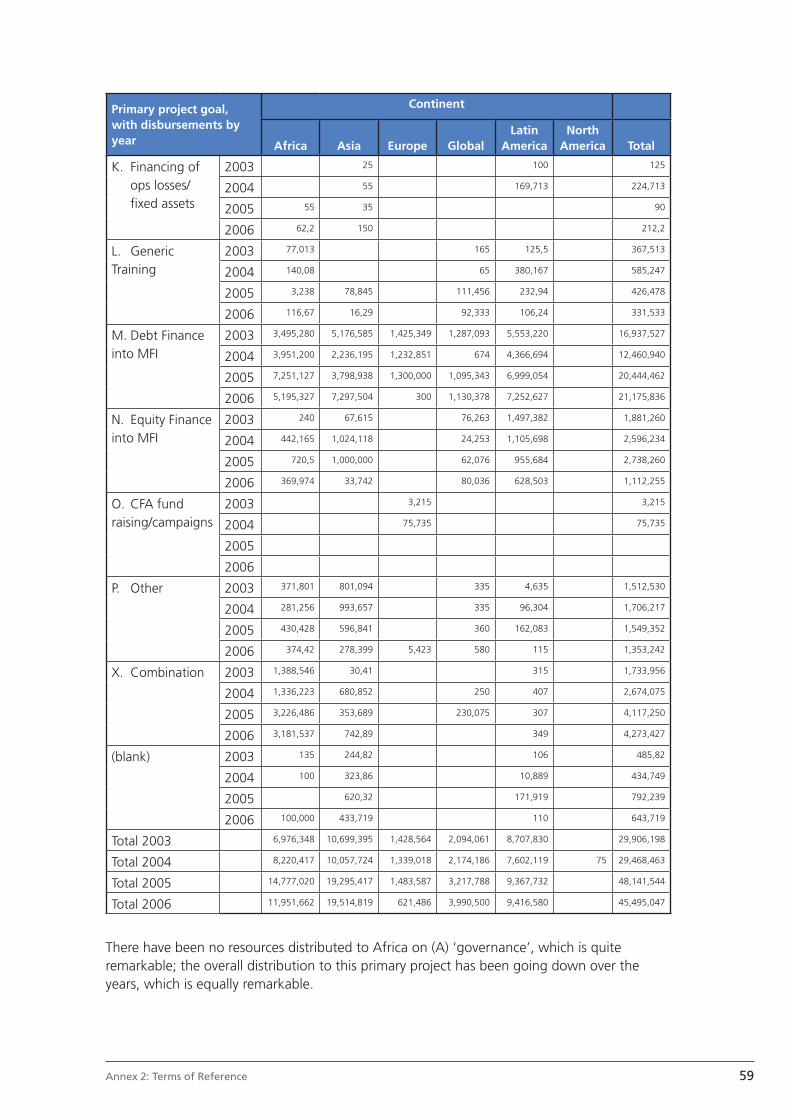
59Annex 2: Terms of Reference
Primary project goal, with disbursements by year
Continent
Africa Asia Europe GlobalLatin
AmericaNorth
America Total
K. Financing of ops losses/fi xed assets
2003 25 100 125
2004 55 169,713 224,713
2005 55 35 90
2006 62,2 150 212,2
L. Generic Training
2003 77,013 165 125,5 367,513
2004 140,08 65 380,167 585,247
2005 3,238 78,845 111,456 232,94 426,478
2006 116,67 16,29 92,333 106,24 331,533
M. Debt Finance into MFI
2003 3,495,280 5,176,585 1,425,349 1,287,093 5,553,220 16,937,527
2004 3,951,200 2,236,195 1,232,851 674 4,366,694 12,460,940
2005 7,251,127 3,798,938 1,300,000 1,095,343 6,999,054 20,444,462
2006 5,195,327 7,297,504 300 1,130,378 7,252,627 21,175,836
N. Equity Finance into MFI
2003 240 67,615 76,263 1,497,382 1,881,260
2004 442,165 1,024,118 24,253 1,105,698 2,596,234
2005 720,5 1,000,000 62,076 955,684 2,738,260
2006 369,974 33,742 80,036 628,503 1,112,255
O. CFA fund raising/campaigns
2003 3,215 3,215
2004 75,735 75,735
2005
2006
P. Other 2003 371,801 801,094 335 4,635 1,512,530
2004 281,256 993,657 335 96,304 1,706,217
2005 430,428 596,841 360 162,083 1,549,352
2006 374,42 278,399 5,423 580 115 1,353,242
X. Combination 2003 1,388,546 30,41 315 1,733,956
2004 1,336,223 680,852 250 407 2,674,075
2005 3,226,486 353,689 230,075 307 4,117,250
2006 3,181,537 742,89 349 4,273,427
(blank) 2003 135 244,82 106 485,82
2004 100 323,86 10,889 434,749
2005 620,32 171,919 792,239
2006 100,000 433,719 110 643,719
Total 2003 6,976,348 10,699,395 1,428,564 2,094,061 8,707,830 29,906,198
Total 2004 8,220,417 10,057,724 1,339,018 2,174,186 7,602,119 75 29,468,463
Total 2005 14,777,020 19,295,417 1,483,587 3,217,788 9,367,732 48,141,544
Total 2006 11,951,662 19,514,819 621,486 3,990,500 9,416,580 45,495,047
There have been no resources distributed to Africa on (A) ‘governance’, which is quite remarkable; the overall distribution to this primary project has been going down over the years, which is equally remarkable.

60 Joint Evaluation of the Contribution of CFAs to the Microfi nance Sector, 2003-2007
The overall level of distributions on (B) ‘strategic/business planning or development’ has grown over the years, but no clear trend can be observed by continent.
For primary project goal (C) ‘organisational strengthening’ we see a stable level overall, while within that Africa has received an almost double amount, at the expense of Latin America and projects marked as being global.
Almost all the disbursements on (D) ‘human resource development’ have gone to Africa, which over the four years shows a rather fl uctuating trend around a modest average level, compared to the other primary project goals.
Disbursements on (E) ‘MIS (management information systems)’ is rather uneven, no clear trends can be observed here. The overall level is also modest, compared to the other primary project goals.
‘Lobby and advocacy’ (F) as primary project goal has been on the rise over the years and has been distributed mostly to projects in Africa, and secondly to projects in Asia.
Most of the project with a primary ‘research and study goal’ (G) have been found in the globally marked projects, which is not remarkable as these projects have often a regional or multi-country perspective.
(H) ‘Product development’ as primary project goal fl uctuates rather over the years and within the regions, no clear conclusions can be drawn here.
For (I) ‘product delivery methods’ can not much be said with any validity given the very low number of projects (two).
Remarkable is that more than 90% of the disbursements on projects with a (J) ‘social and environmental performance’ goal has gone to projects in Asia. And the amounts have been growing over the four years (though dropping off in the last year).
There is no clear trend to be observed for projects with primary goal (K) ‘fi nancing of ops losses/ fi xed assets’. The numbers are also quite small compared to the other primary project goals.
The disbursement trends for project with (L) ‘generic training’ as the primary goal are overall declining (though uneven). Found is a rather equal spread between Africa, Latin America and the global projects.
As to be expected from the previous results in the other tables, project with primary goal (M) ‘debt fi nance into MFIs’ is in every respect the largest of all project goals. The annual trend is one of a steady growth overall and for Africa, Asia and Latin America. All three regions show the same growth rate. Global and Europe are gradually declining in disbursement levels for projects with this primary goal.
Remarkable is the trend in project disbursements with (N) ‘equity fi nance into MFI’ as goal. In the table we see the same uneven trends of declining disbursements as in table 10. This would be an interesting topic for further research - especially given the huge need for projects with this primary goal, especially in Africa overall and in Asian emerging economies.

61Annex 2: Terms of Reference
For (O) ‘fund raising & campaigns’ can not much be said with any validity given the very low number of projects (three). All three projects are to be found in Hivos, and are placed in Europe, in the Netherlands.
It is unclear why the categories (P) ‘other primary project goal’ and (X) ‘combination of primary project goals’ have been so relatively high marked. Most of the projects with these marks are to be found in the Oxfam Novib and ICCO portfolios.
The results on secondary project goals do not differ much from the above table. See the table below on secondary project goals.
Table 14 - Number of projects by secondary project goals and continent
Secondary project goals (multiple scores per project possible)
Continent
Africa Asia Europe GlobalLatin
AmericaNorth
America Total
A. Governance 46 19 2 7 7 81
B. Strategic/ Business Planning or Development
68 33 2 7 37 147
C. Organisational Strengthening
71 59 11 31 1 173
D. Human Resour. Management
39 6 5 2 52
E. MIS 60 17 1 5 13 96
F. Lobby & Advocacy 12 23 10 10 55
G. CFA Research & Studies
12 4 6 4 2 28
H. Product Development 61 20 1 9 21 112
I. Product Delivery Methods
27 5 26 58
J. Social-Environmental Performance
19 16 1 7 4 1 48
K. Financing of ops losses/fi xed assets
36 15 1 9 61
L. Generic Training 36 22 3 2 63
M. Debt Finance into MFI 26 1 3 1 31
N. Equity Finance into MFI
17 6 6 1 30
O. CFA fund raising/campaigns
5 1 2 1 9
P. Other 17 8 1 8 34
X. Combination 6 26 2 25 59
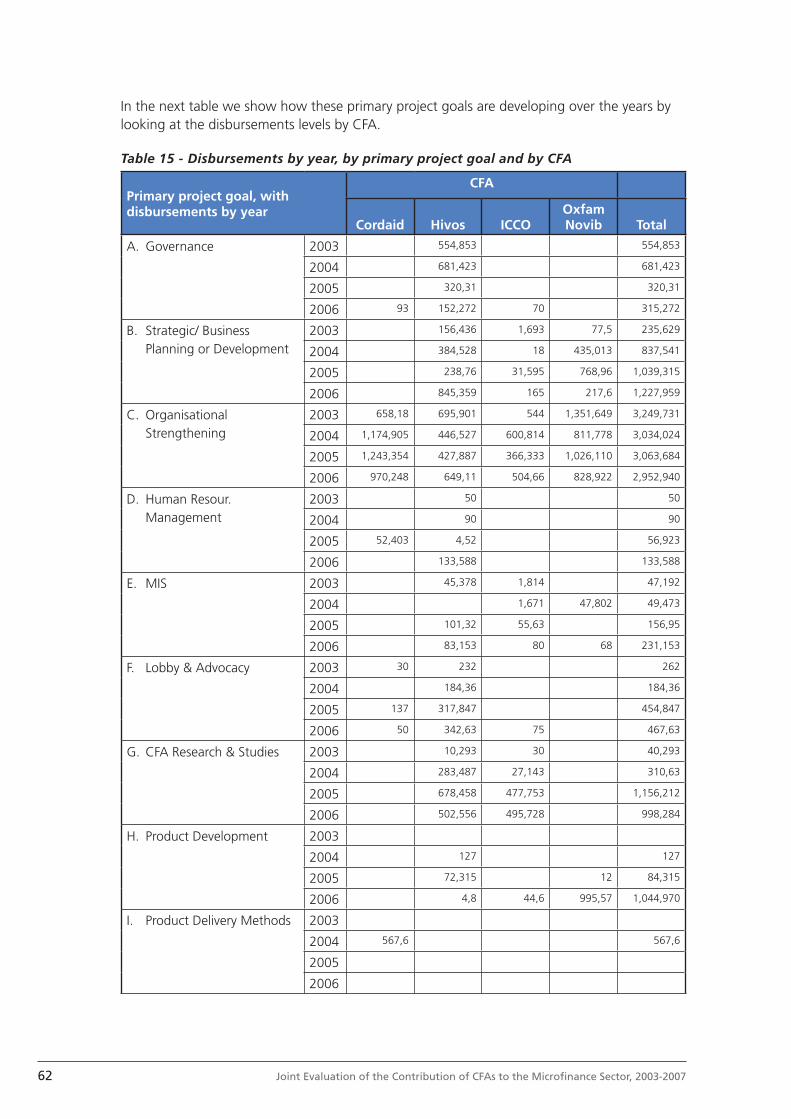
62 Joint Evaluation of the Contribution of CFAs to the Microfi nance Sector, 2003-2007
In the next table we show how these primary project goals are developing over the years by looking at the disbursements levels by CFA.
Table 15 - Disbursements by year, by primary project goal and by CFA
Primary project goal, with disbursements by year
CFA
Cordaid Hivos ICCOOxfam Novib Total
A. Governance 2003 554,853 554,853
2004 681,423 681,423
2005 320,31 320,31
2006 93 152,272 70 315,272
B. Strategic/ Business Planning or Development
2003 156,436 1,693 77,5 235,629
2004 384,528 18 435,013 837,541
2005 238,76 31,595 768,96 1,039,315
2006 845,359 165 217,6 1,227,959
C. Organisational Strengthening
2003 658,18 695,901 544 1,351,649 3,249,731
2004 1,174,905 446,527 600,814 811,778 3,034,024
2005 1,243,354 427,887 366,333 1,026,110 3,063,684
2006 970,248 649,11 504,66 828,922 2,952,940
D. Human Resour. Management
2003 50 50
2004 90 90
2005 52,403 4,52 56,923
2006 133,588 133,588
E. MIS 2003 45,378 1,814 47,192
2004 1,671 47,802 49,473
2005 101,32 55,63 156,95
2006 83,153 80 68 231,153
F. Lobby & Advocacy 2003 30 232 262
2004 184,36 184,36
2005 137 317,847 454,847
2006 50 342,63 75 467,63
G. CFA Research & Studies 2003 10,293 30 40,293
2004 283,487 27,143 310,63
2005 678,458 477,753 1,156,212
2006 502,556 495,728 998,284
H. Product Development 2003
2004 127 127
2005 72,315 12 84,315
2006 4,8 44,6 995,57 1,044,970
I. Product Delivery Methods 2003
2004 567,6 567,6
2005
2006
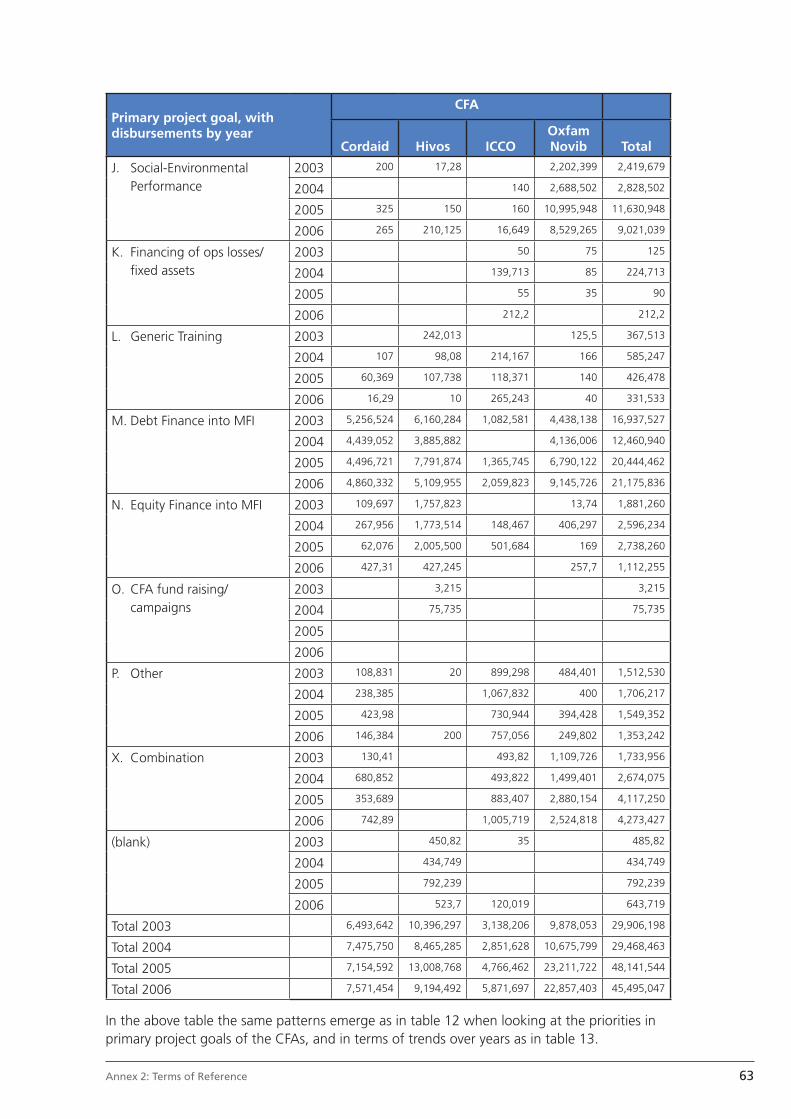
63Annex 2: Terms of Reference
Primary project goal, with disbursements by year
CFA
Cordaid Hivos ICCOOxfam Novib Total
J. Social-Environmental Performance
2003 200 17,28 2,202,399 2,419,679
2004 140 2,688,502 2,828,502
2005 325 150 160 10,995,948 11,630,948
2006 265 210,125 16,649 8,529,265 9,021,039
K. Financing of ops losses/fi xed assets
2003 50 75 125
2004 139,713 85 224,713
2005 55 35 90
2006 212,2 212,2
L. Generic Training 2003 242,013 125,5 367,513
2004 107 98,08 214,167 166 585,247
2005 60,369 107,738 118,371 140 426,478
2006 16,29 10 265,243 40 331,533
M. Debt Finance into MFI 2003 5,256,524 6,160,284 1,082,581 4,438,138 16,937,527
2004 4,439,052 3,885,882 4,136,006 12,460,940
2005 4,496,721 7,791,874 1,365,745 6,790,122 20,444,462
2006 4,860,332 5,109,955 2,059,823 9,145,726 21,175,836
N. Equity Finance into MFI 2003 109,697 1,757,823 13,74 1,881,260
2004 267,956 1,773,514 148,467 406,297 2,596,234
2005 62,076 2,005,500 501,684 169 2,738,260
2006 427,31 427,245 257,7 1,112,255
O. CFA fund raising/campaigns
2003 3,215 3,215
2004 75,735 75,735
2005
2006
P. Other 2003 108,831 20 899,298 484,401 1,512,530
2004 238,385 1,067,832 400 1,706,217
2005 423,98 730,944 394,428 1,549,352
2006 146,384 200 757,056 249,802 1,353,242
X. Combination 2003 130,41 493,82 1,109,726 1,733,956
2004 680,852 493,822 1,499,401 2,674,075
2005 353,689 883,407 2,880,154 4,117,250
2006 742,89 1,005,719 2,524,818 4,273,427
(blank) 2003 450,82 35 485,82
2004 434,749 434,749
2005 792,239 792,239
2006 523,7 120,019 643,719
Total 2003 6,493,642 10,396,297 3,138,206 9,878,053 29,906,198
Total 2004 7,475,750 8,465,285 2,851,628 10,675,799 29,468,463
Total 2005 7,154,592 13,008,768 4,766,462 23,211,722 48,141,544
Total 2006 7,571,454 9,194,492 5,871,697 22,857,403 45,495,047
In the above table the same patterns emerge as in table 12 when looking at the priorities in primary project goals of the CFAs, and in terms of trends over years as in table 13.
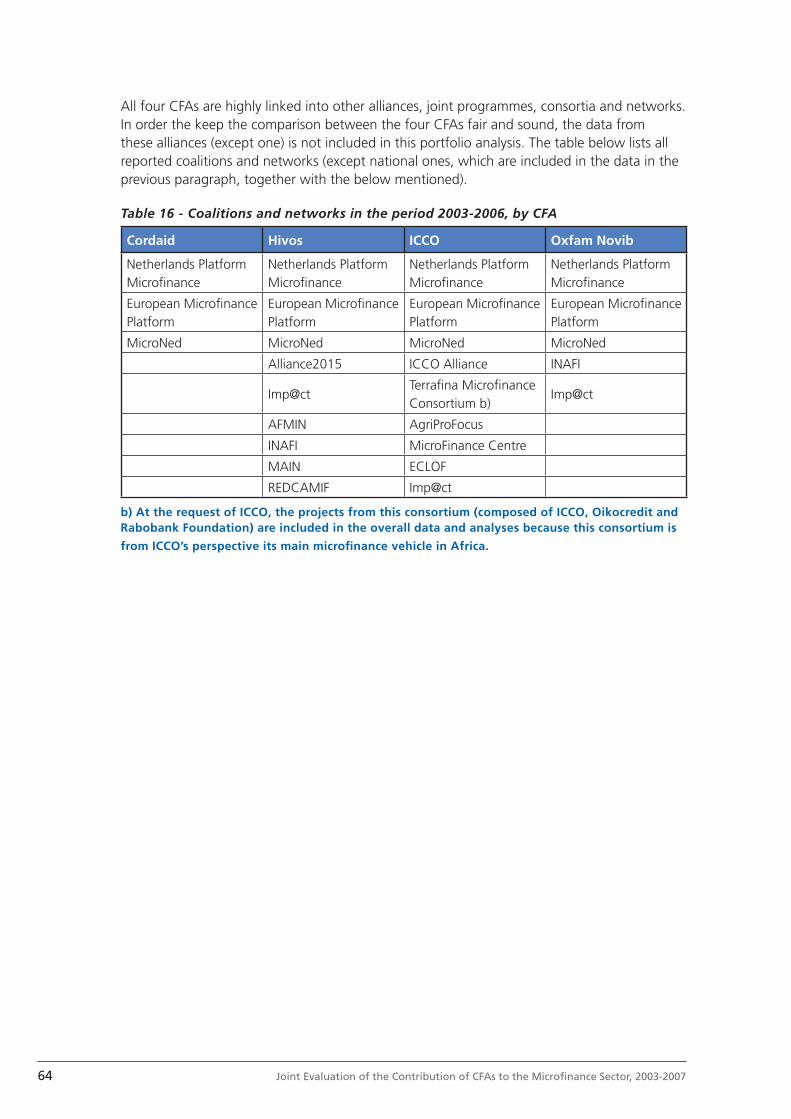
64 Joint Evaluation of the Contribution of CFAs to the Microfi nance Sector, 2003-2007
All four CFAs are highly linked into other alliances, joint programmes, consortia and networks. In order the keep the comparison between the four CFAs fair and sound, the data from these alliances (except one) is not included in this portfolio analysis. The table below lists all reported coalitions and networks (except national ones, which are included in the data in the previous paragraph, together with the below mentioned).
Table 16 - Coalitions and networks in the period 2003-2006, by CFA
Cordaid Hivos ICCO Oxfam Novib
Netherlands Platform Microfi nance
Netherlands Platform Microfi nance
Netherlands Platform Microfi nance
Netherlands Platform Microfi nance
European Microfi nance Platform
European Microfi nance Platform
European Microfi nance Platform
European Microfi nance Platform
MicroNed MicroNed MicroNed MicroNed
Alliance2015 ICCO Alliance INAFI
Imp@ctTerrafi na Microfi nance Consortium b)
Imp@ct
AFMIN AgriProFocus
INAFI MicroFinance Centre
MAIN ECLOF
REDCAMIF Imp@ct
b) At the request of ICCO, the projects from this consortium (composed of ICCO, Oikocredit and Rabobank Foundation) are included in the overall data and analyses because this consortium is
from ICCO’s perspective its main microfi nance vehicle in Africa.
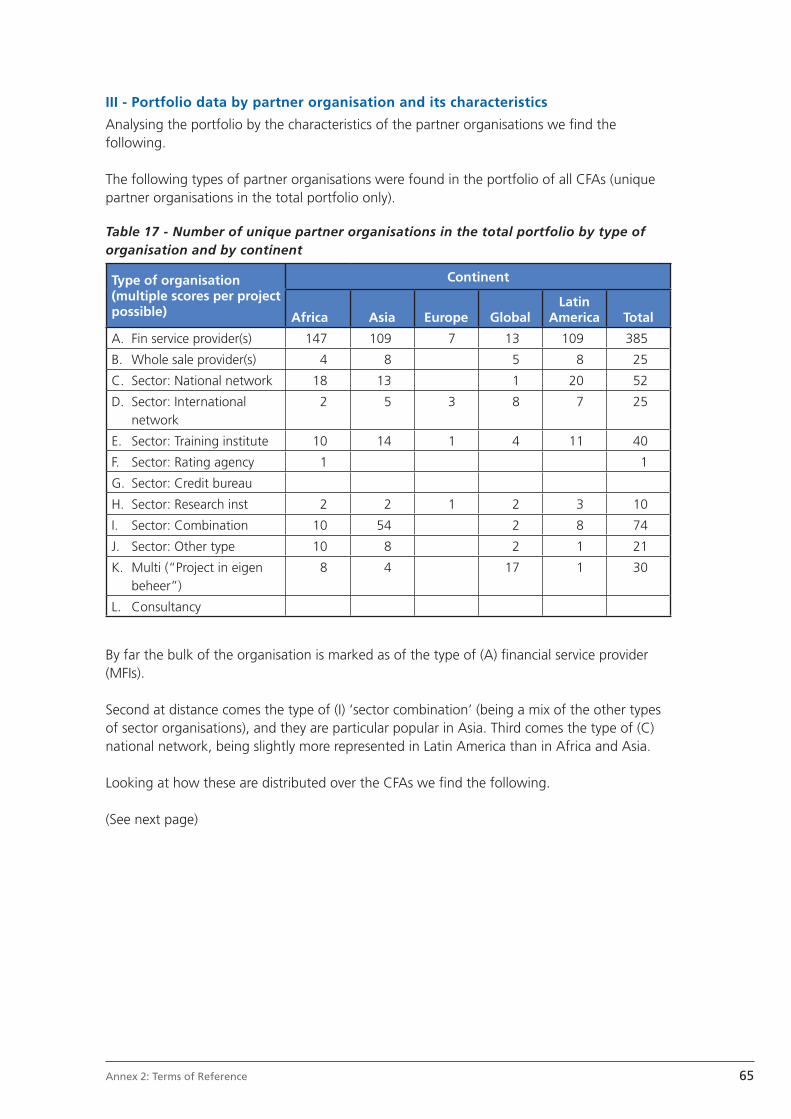
65Annex 2: Terms of Reference
III - Portfolio data by partner organisation and its characteristics
Analysing the portfolio by the characteristics of the partner organisations we fi nd the following.
The following types of partner organisations were found in the portfolio of all CFAs (unique partner organisations in the total portfolio only).
Table 17 - Number of unique partner organisations in the total portfolio by type of organisation and by continent
Type of organisation (multiple scores per project possible)
Continent
Africa Asia Europe GlobalLatin
America Total
A. Fin service provider(s) 147 109 7 13 109 385
B. Whole sale provider(s) 4 8 5 8 25
C. Sector: National network 18 13 1 20 52
D. Sector: International network
2 5 3 8 7 25
E. Sector: Training institute 10 14 1 4 11 40
F. Sector: Rating agency 1 1
G. Sector: Credit bureau
H. Sector: Research inst 2 2 1 2 3 10
I. Sector: Combination 10 54 2 8 74
J. Sector: Other type 10 8 2 1 21
K. Multi (“Project in eigen beheer”)
8 4 17 1 30
L. Consultancy
By far the bulk of the organisation is marked as of the type of (A) fi nancial service provider (MFIs).
Second at distance comes the type of (I) ‘sector combination’ (being a mix of the other types of sector organisations), and they are particular popular in Asia. Third comes the type of (C) national network, being slightly more represented in Latin America than in Africa and Asia.
Looking at how these are distributed over the CFAs we fi nd the following.
(See next page)
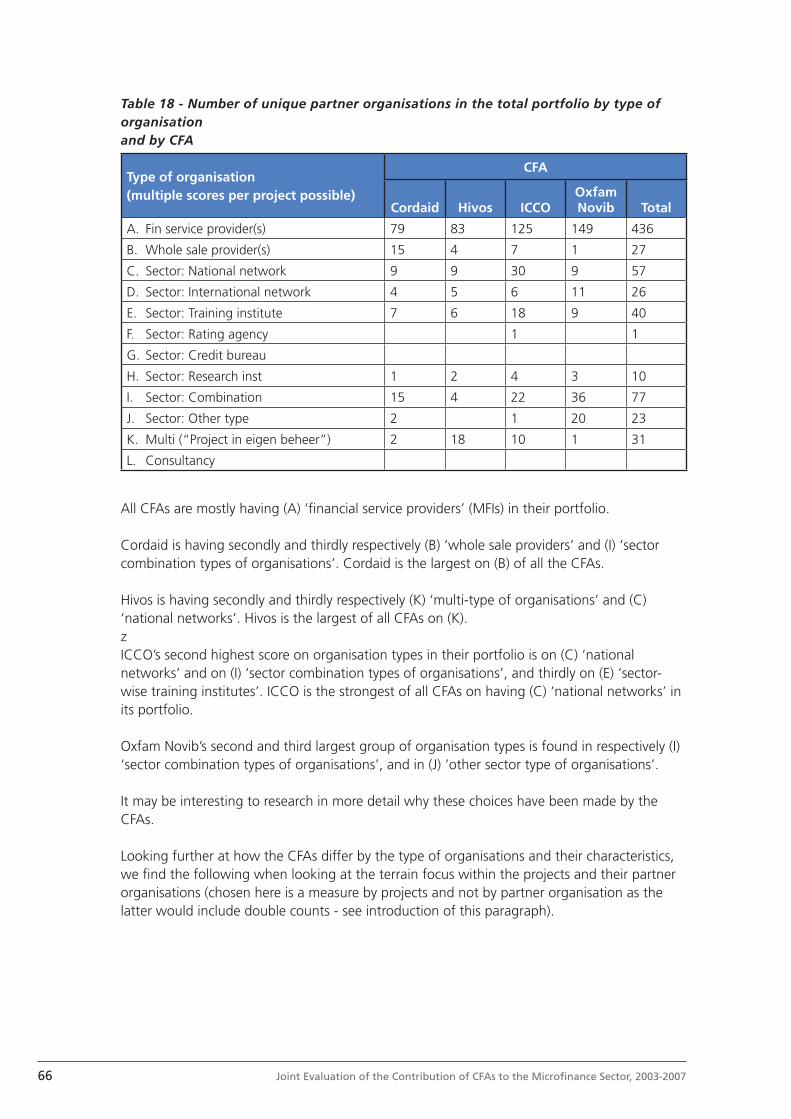
66 Joint Evaluation of the Contribution of CFAs to the Microfi nance Sector, 2003-2007
Table 18 - Number of unique partner organisations in the total portfolio by type of organisation and by CFA
Type of organisation (multiple scores per project possible)
CFA
Cordaid Hivos ICCOOxfam Novib Total
A. Fin service provider(s) 79 83 125 149 436
B. Whole sale provider(s) 15 4 7 1 27
C. Sector: National network 9 9 30 9 57
D. Sector: International network 4 5 6 11 26
E. Sector: Training institute 7 6 18 9 40
F. Sector: Rating agency 1 1
G. Sector: Credit bureau
H. Sector: Research inst 1 2 4 3 10
I. Sector: Combination 15 4 22 36 77
J. Sector: Other type 2 1 20 23
K. Multi (“Project in eigen beheer”) 2 18 10 1 31
L. Consultancy
All CFAs are mostly having (A) ‘fi nancial service providers’ (MFIs) in their portfolio.
Cordaid is having secondly and thirdly respectively (B) ‘whole sale providers’ and (I) ‘sector combination types of organisations’. Cordaid is the largest on (B) of all the CFAs.
Hivos is having secondly and thirdly respectively (K) ‘multi-type of organisations’ and (C) ‘national networks’. Hivos is the largest of all CFAs on (K).zICCO’s second highest score on organisation types in their portfolio is on (C) ‘national networks’ and on (I) ‘sector combination types of organisations’, and thirdly on (E) ‘sector-wise training institutes’. ICCO is the strongest of all CFAs on having (C) ‘national networks’ in its portfolio.
Oxfam Novib’s second and third largest group of organisation types is found in respectively (I) ‘sector combination types of organisations’, and in (J) ‘other sector type of organisations’.
It may be interesting to research in more detail why these choices have been made by the CFAs.
Looking further at how the CFAs differ by the type of organisations and their characteristics, we fi nd the following when looking at the terrain focus within the projects and their partner organisations (chosen here is a measure by projects and not by partner organisation as the latter would include double counts - see introduction of this paragraph).

67Annex 2: Terms of Reference
Table 19 - Number of projects by terrain focus and by CFA
Terrain focusCFA
Cordaid Hivos ICCOOxfam Novib Total
Combination 52 (31%) 98 (36%) 93 (36%) 192 (61%) 435
Rural 42 (25%) 67 (24%) 106 (41%) 61 (19%) 276
Semi-urban 8 (5%) 13 (5%) 0% 13 (4%) 34
Urban 10 (6%) 24 (9%) 19 (7%) 14 (4%) 67
(blank) 55 (33%) 72 (26%) 40 (16%) 33 (11%) 200
Total 167 (100%) 274 (100%) 258 (100%) 313 (100%) 1,012
Clear becomes that ICCO is by the strongest in rural focused projects, followed by Cordaid, Hivos, and Oxfam Novib (as share in each portfolio).
Semi-urban doesn’t play a large role in neither of the CFA’s portfolios (and is nil in ICCO’s).Urban is slightly higher than semi-urban represented in the portfolios, and the largest in Hivos’ portfolio but still a small portion of the whole.
The combination of one or more terrain focused is well represented in all CFA’s portfolios, with the highest share (and absolute number of projects) in the portfolio of Oxfam Novib.
The number of projects with an unknown terrain focus is quite high in Cordaid and Hivos and to a lesser extent in ICCO and Oxfam Novib. This may be of signifi cance, and thus some care should be taken in reading these fi gures.
Looking further down the chain, and at the sector in which the end-clients (of the partner organisations) work, we fi nd the following.
Table 20 - Number of projects by end-client type of work and by CFA
End-client type of work
CFA
Cordaid Hivos ICCOOxfam Novib Total
Combination 88 (53%) 139 (51%) 83 (32%) 239 (76%) 549
Work in primary production
17 (10%) 32 (12%) 34 (13%) 32 (10%) 115
Work in secondary production
1 (1%) 0% 0% 0% 1
Work in services 6 (4%) 25 (9%) 17 (7%) 7 (2%) 55
(blank) 55 (33%) 78 (28%) 124 (48%) 35 (11%) 292
Total 167 (100%) 274 (100%) 258 (100%) 313 (100%) 1,012
Not much emerges from this table, as the Combination category (total 549 of 1,012) is highly scored and the number of unknowns is also high (292 of 1,012).
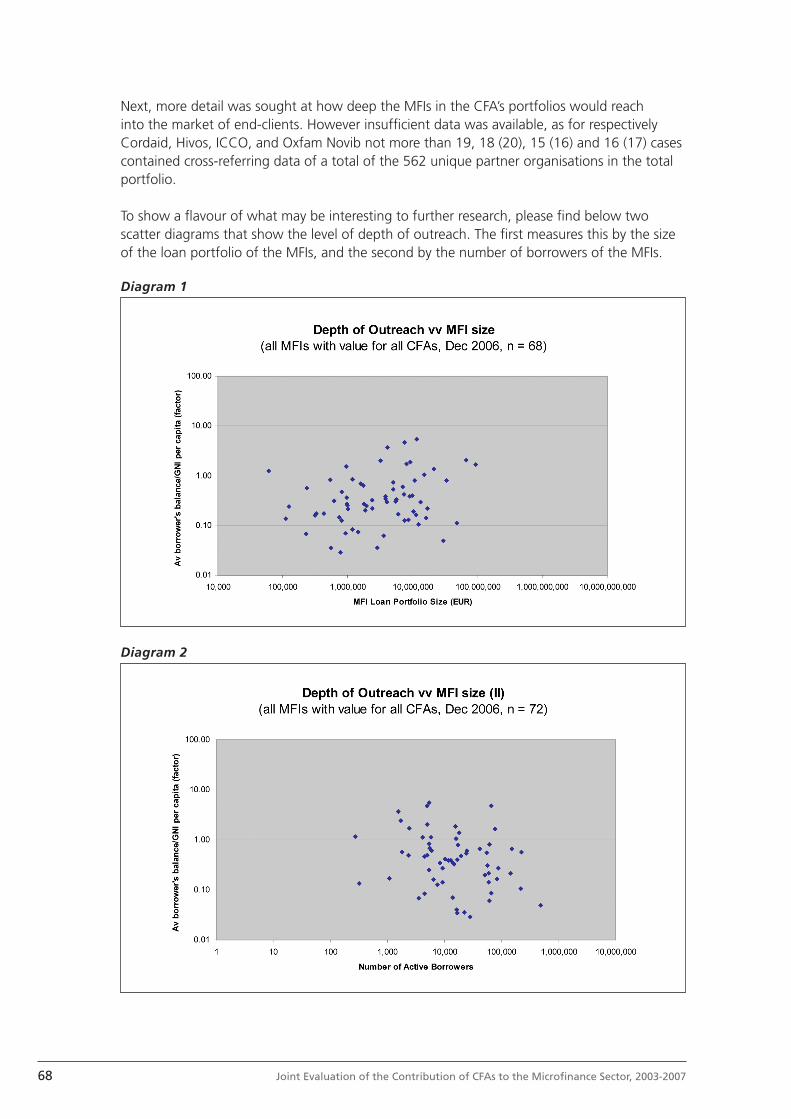
68 Joint Evaluation of the Contribution of CFAs to the Microfi nance Sector, 2003-2007
Next, more detail was sought at how deep the MFIs in the CFA’s portfolios would reach into the market of end-clients. However insuffi cient data was available, as for respectively Cordaid, Hivos, ICCO, and Oxfam Novib not more than 19, 18 (20), 15 (16) and 16 (17) cases contained cross-referring data of a total of the 562 unique partner organisations in the total portfolio.
To show a fl avour of what may be interesting to further research, please fi nd below two scatter diagrams that show the level of depth of outreach. The fi rst measures this by the size of the loan portfolio of the MFIs, and the second by the number of borrowers of the MFIs.
Diagram 1
Diagram 2
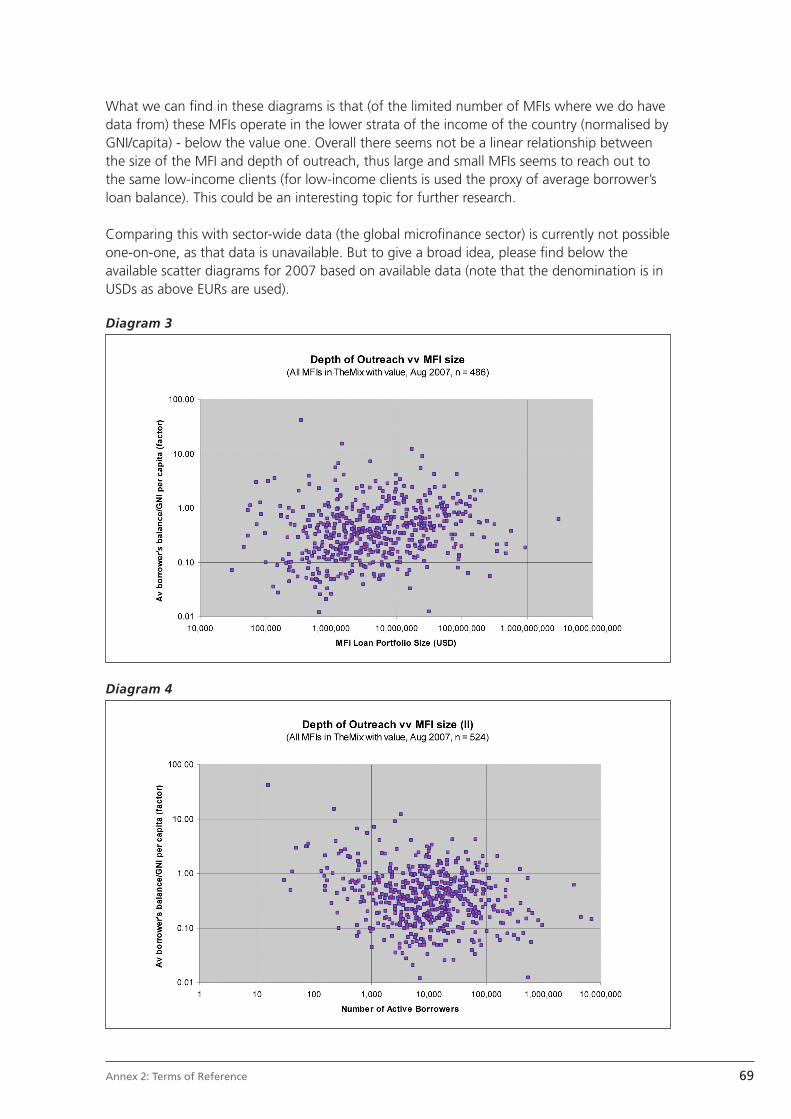
69Annex 2: Terms of Reference
What we can fi nd in these diagrams is that (of the limited number of MFIs where we do have data from) these MFIs operate in the lower strata of the income of the country (normalised by GNI/capita) - below the value one. Overall there seems not be a linear relationship between the size of the MFI and depth of outreach, thus large and small MFIs seems to reach out to the same low-income clients (for low-income clients is used the proxy of average borrower’s loan balance). This could be an interesting topic for further research.
Comparing this with sector-wide data (the global microfi nance sector) is currently not possible one-on-one, as that data is unavailable. But to give a broad idea, please fi nd below the available scatter diagrams for 2007 based on available data (note that the denomination is in USDs as above EURs are used).
Diagram 3
Diagram 4
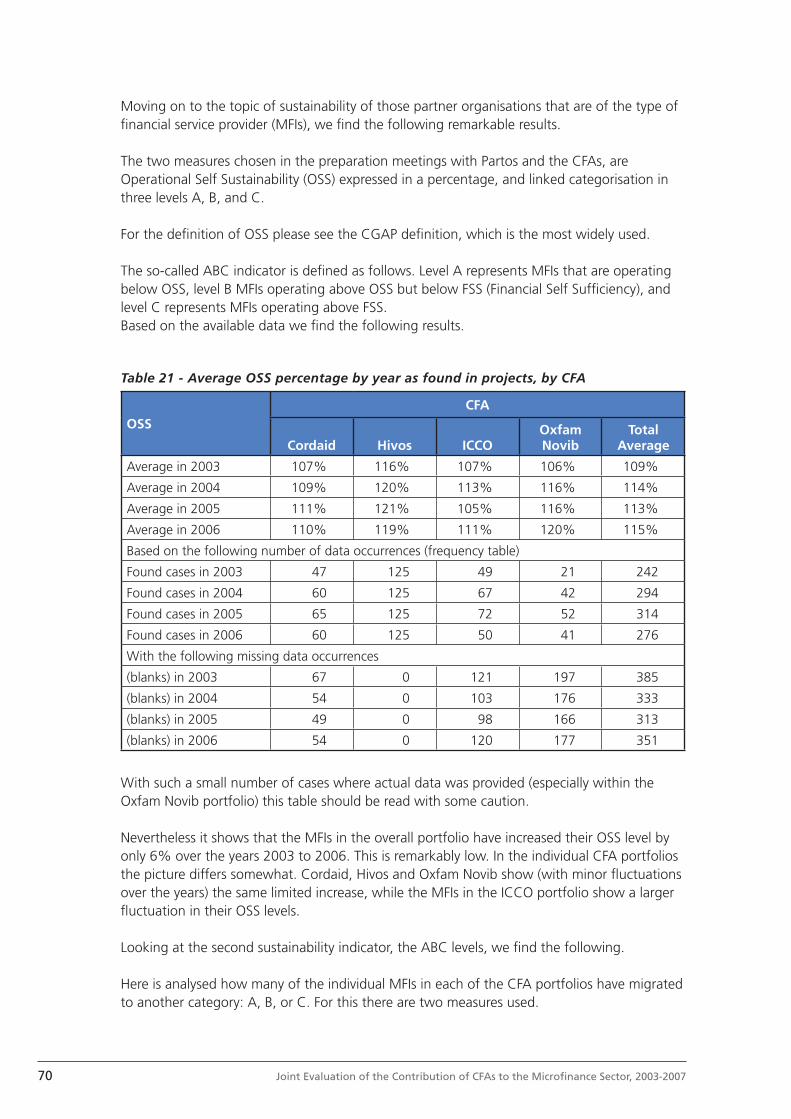
70 Joint Evaluation of the Contribution of CFAs to the Microfi nance Sector, 2003-2007
Moving on to the topic of sustainability of those partner organisations that are of the type of fi nancial service provider (MFIs), we fi nd the following remarkable results.
The two measures chosen in the preparation meetings with Partos and the CFAs, are Operational Self Sustainability (OSS) expressed in a percentage, and linked categorisation in three levels A, B, and C.
For the defi nition of OSS please see the CGAP defi nition, which is the most widely used.
The so-called ABC indicator is defi ned as follows. Level A represents MFIs that are operating below OSS, level B MFIs operating above OSS but below FSS (Financial Self Suffi ciency), and level C represents MFIs operating above FSS.Based on the available data we fi nd the following results.
Table 21 - Average OSS percentage by year as found in projects, by CFA
OSSCFA
Cordaid Hivos ICCOOxfam Novib
Total Average
Average in 2003 107% 116% 107% 106% 109%
Average in 2004 109% 120% 113% 116% 114%
Average in 2005 111% 121% 105% 116% 113%
Average in 2006 110% 119% 111% 120% 115%
Based on the following number of data occurrences (frequency table)
Found cases in 2003 47 125 49 21 242
Found cases in 2004 60 125 67 42 294
Found cases in 2005 65 125 72 52 314
Found cases in 2006 60 125 50 41 276
With the following missing data occurrences
(blanks) in 2003 67 0 121 197 385
(blanks) in 2004 54 0 103 176 333
(blanks) in 2005 49 0 98 166 313
(blanks) in 2006 54 0 120 177 351
With such a small number of cases where actual data was provided (especially within the Oxfam Novib portfolio) this table should be read with some caution.
Nevertheless it shows that the MFIs in the overall portfolio have increased their OSS level by only 6% over the years 2003 to 2006. This is remarkably low. In the individual CFA portfolios the picture differs somewhat. Cordaid, Hivos and Oxfam Novib show (with minor fl uctuations over the years) the same limited increase, while the MFIs in the ICCO portfolio show a larger fl uctuation in their OSS levels.
Looking at the second sustainability indicator, the ABC levels, we fi nd the following.
Here is analysed how many of the individual MFIs in each of the CFA portfolios have migrated to another category: A, B, or C. For this there are two measures used.
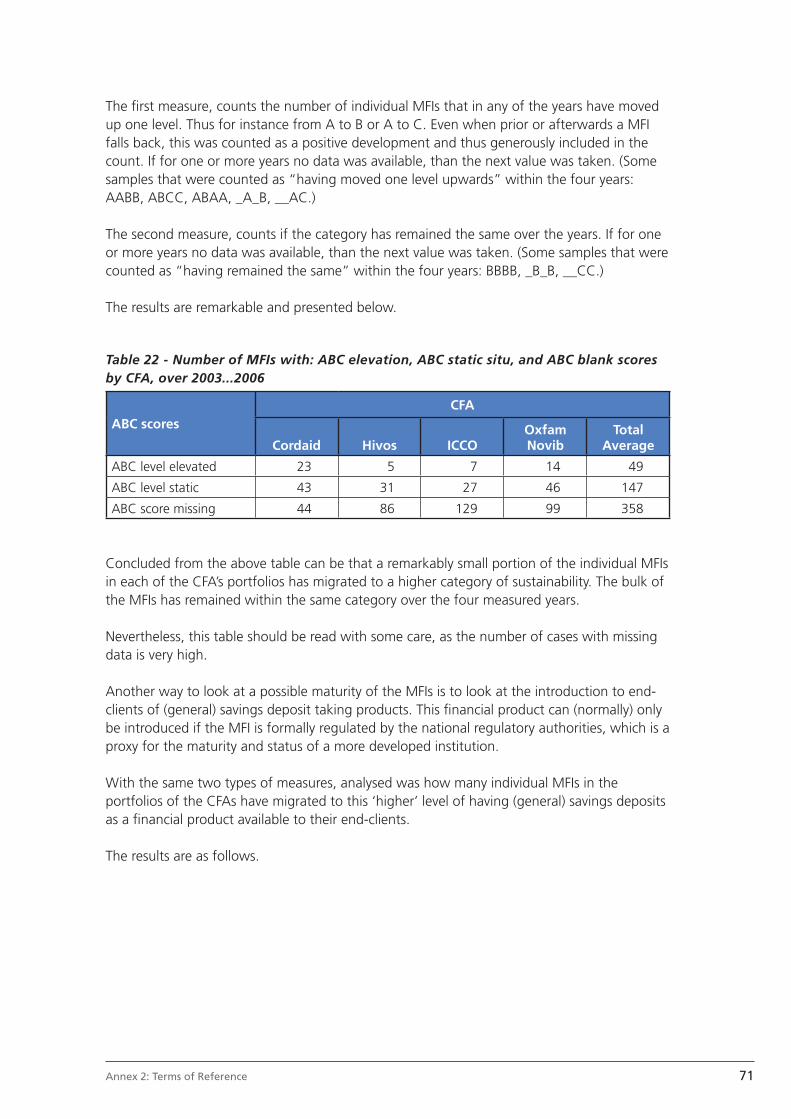
71Annex 2: Terms of Reference
The fi rst measure, counts the number of individual MFIs that in any of the years have moved up one level. Thus for instance from A to B or A to C. Even when prior or afterwards a MFI falls back, this was counted as a positive development and thus generously included in the count. If for one or more years no data was available, than the next value was taken. (Some samples that were counted as “having moved one level upwards” within the four years: AABB, ABCC, ABAA, _A_B, __AC.)
The second measure, counts if the category has remained the same over the years. If for one or more years no data was available, than the next value was taken. (Some samples that were counted as “having remained the same” within the four years: BBBB, _B_B, __CC.)
The results are remarkable and presented below.
Table 22 - Number of MFIs with: ABC elevation, ABC static situ, and ABC blank scores by CFA, over 2003...2006
ABC scoresCFA
Cordaid Hivos ICCOOxfam Novib
Total Average
ABC level elevated 23 5 7 14 49
ABC level static 43 31 27 46 147
ABC score missing 44 86 129 99 358
Concluded from the above table can be that a remarkably small portion of the individual MFIs in each of the CFA’s portfolios has migrated to a higher category of sustainability. The bulk of the MFIs has remained within the same category over the four measured years.
Nevertheless, this table should be read with some care, as the number of cases with missing data is very high.
Another way to look at a possible maturity of the MFIs is to look at the introduction to end-clients of (general) savings deposit taking products. This fi nancial product can (normally) only be introduced if the MFI is formally regulated by the national regulatory authorities, which is a proxy for the maturity and status of a more developed institution.
With the same two types of measures, analysed was how many individual MFIs in the portfolios of the CFAs have migrated to this ‘higher’ level of having (general) savings deposits as a fi nancial product available to their end-clients.
The results are as follows.
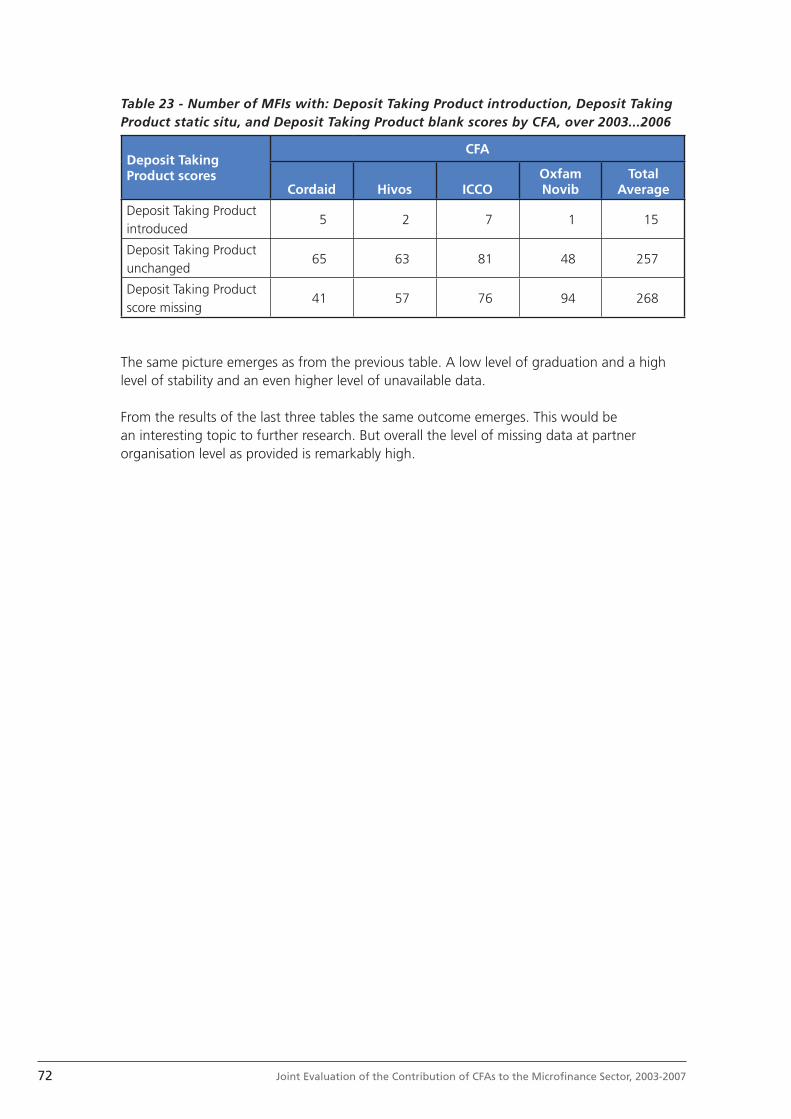
72 Joint Evaluation of the Contribution of CFAs to the Microfi nance Sector, 2003-2007
Table 23 - Number of MFIs with: Deposit Taking Product introduction, Deposit Taking Product static situ, and Deposit Taking Product blank scores by CFA, over 2003...2006
Deposit Taking Product scores
CFA
Cordaid Hivos ICCOOxfam Novib
Total Average
Deposit Taking Product introduced
5 2 7 1 15
Deposit Taking Product unchanged
65 63 81 48 257
Deposit Taking Product score missing
41 57 76 94 268
The same picture emerges as from the previous table. A low level of graduation and a high level of stability and an even higher level of unavailable data.
From the results of the last three tables the same outcome emerges. This would be an interesting topic to further research. But overall the level of missing data at partner organisation level as provided is remarkably high.
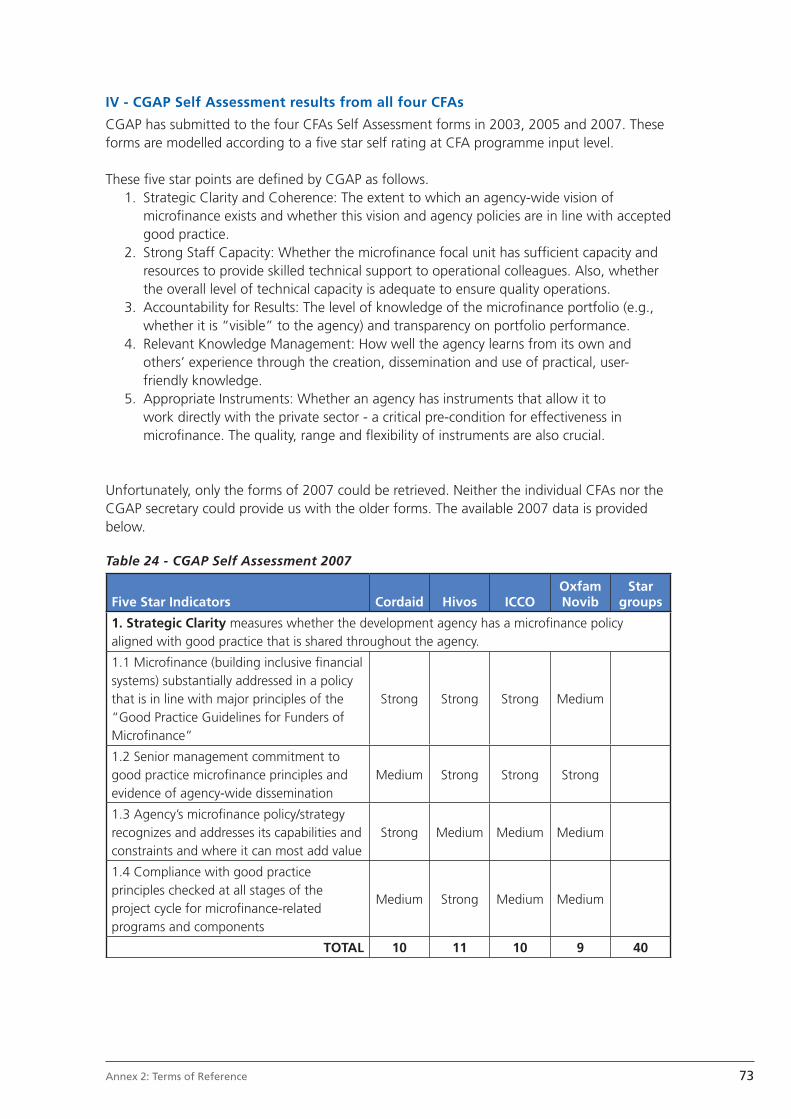
73Annex 2: Terms of Reference
IV - CGAP Self Assessment results from all four CFAs
CGAP has submitted to the four CFAs Self Assessment forms in 2003, 2005 and 2007. These forms are modelled according to a fi ve star self rating at CFA programme input level.
These fi ve star points are defi ned by CGAP as follows. 1. Strategic Clarity and Coherence: The extent to which an agency-wide vision of
microfi nance exists and whether this vision and agency policies are in line with accepted good practice.
2. Strong Staff Capacity: Whether the microfi nance focal unit has suffi cient capacity and resources to provide skilled technical support to operational colleagues. Also, whether the overall level of technical capacity is adequate to ensure quality operations.
3. Accountability for Results: The level of knowledge of the microfi nance portfolio (e.g., whether it is “visible” to the agency) and transparency on portfolio performance.
4. Relevant Knowledge Management: How well the agency learns from its own and others’ experience through the creation, dissemination and use of practical, user-friendly knowledge.
5. Appropriate Instruments: Whether an agency has instruments that allow it to work directly with the private sector - a critical pre-condition for effectiveness in microfi nance. The quality, range and fl exibility of instruments are also crucial.
Unfortunately, only the forms of 2007 could be retrieved. Neither the individual CFAs nor the CGAP secretary could provide us with the older forms. The available 2007 data is provided below.
Table 24 - CGAP Self Assessment 2007
Five Star Indicators Cordaid Hivos ICCOOxfam Novib
Star groups
1. Strategic Clarity measures whether the development agency has a microfi nance policy aligned with good practice that is shared throughout the agency.
1.1 Microfi nance (building inclusive fi nancial systems) substantially addressed in a policy that is in line with major principles of the “Good Practice Guidelines for Funders of Microfi nance”
Strong Strong Strong Medium
1.2 Senior management commitment to good practice microfi nance principles and evidence of agency-wide dissemination
Medium Strong Strong Strong
1.3 Agency’s microfi nance policy/strategy recognizes and addresses its capabilities and constraints and where it can most add value
Strong Medium Medium Medium
1.4 Compliance with good practice principles checked at all stages of the project cycle for microfi nance-related programs and components
Medium Strong Medium Medium
TOTAL 10 11 10 9 40

74 Joint Evaluation of the Contribution of CFAs to the Microfi nance Sector, 2003-2007
Five Star Indicators Cordaid Hivos ICCOOxfam Novib
Star groups
2. Staff Capacity measures whether the development agency has staff with microfi nance expertise to ensure quality of design, implementation, and monitoring of programs.
2.1 Designated focal point with microfi nance/fi nancial sector experience and responsibility to provide technical advice to program managers
Medium Strong Strong Strong
2.2 Agency makes resources available for technical expertise to be involved in the design of all microfi nance-related programs and components
Medium Strong Medium Medium
2.3 Agency requires and verifi es that all staff who manage microfi nance-related programs and components have training/experience
Medium Strong Medium Medium
2.4 Agency places microfi nance specialist staff in countries/regions where it has its most signifi cant portfolio of microfi nance-related programs and components
n/a Strong Medium n/a(not
counted: n/a)
(Totals in this Star group adjusted to same scale as others)
TOTAL 8 12 9 9 38
3. Accountability for Results measures whether the development agency has systems in place that ensure the transparency and performance-based management of microfi nance-related programs and components.
3.1 System in place to identify microfi nance-related programs and components from design to disbursement
Strong Strong Strong Medium
3.2 Microfi nance/fi nancial sector specialist required to review microfi nance programs and components
Strong Strong Medium Medium
3.3 Agency annually tracks and reports on performance indicators for microfi nance-related programs and components
Medium Strong Medium Medium
3.4 Agency uses performance-based contracts in its microfi nance programs and components
Medium Strong Medium Medium
TOTAL 10 12 9 8 39

75Annex 2: Terms of Reference
Five Star Indicators Cordaid Hivos ICCOOxfam Novib
Star groups
4. Knowledge Management measures whether the development agency has systems to create, disseminate, and incorporate learning from its own and others’ experience.
4.1 Focal point’s responsibilities and budget include knowledge management for microfi nance
Medium Medium Medium Medium
4.2 Agency systematically assesses its micro-fi nance programs and components through reviews or evaluations and extracts learning
Medium Strong Medium Medium
4.3 Mechanism(s) in place for exchanging learning on agency’s microfi nance programs and latest microfi nance developments throughout headquarters and fi eld offi ces
Medium Medium Medium WeakLowest of all
4.4 Agency requires staff to actively engage and coordinate with key regional/country-level microfi nance stakeholders
Medium Strong Strong Strong
Lowest Star group score
TOTAL 8 10 9 8 35
5. Appropriate Instruments measures whether the development agency has appropriate instruments for microfi nance that are used in a fl exible manner and adapted to market needs.
5.1 Able to work directly with private actors Strong Strong Strong Strong
5.2 Little microfi nance programming is done through credit components of larger, non-fi nancial sector program
Medium Medium Medium Medium
5.3 Nature and use of instruments are consistent with agency’s strategy and with requirements for supporting microfi nance well
Medium Strong Medium Medium
5.4 Policies and procedures governing use of instruments allow for a range of collaborative funding and technical support
Strong Strong Strong Medium
TOTAL 10 11 10 9 40
GRAND TOTAL 46 56 47 43
Scale used for this report: Strong=3; Medium=2; Weak=1 (max by Star group/CFA=12; max per Star group all CFAs=48; max grand total/CFA=60)
When in-between scores were given (e.g. Medium/Strong) this was rounded down (example becomes: Medium) as this table is based on a threshold method to score institutions.
From this table can obviously no development over the years be read (as only 2007 data has become available).
This table shows that Hivos has assessed itself with the highest scores in all fi ve Star groups, while Oxfam Novib has assessed itself with the lowest scores overall. The Knowledge Management Star group is scored with the lowest results overall. Especially the indicator 4.3 within this Star group (“Mechanism(s) in place for exchanging learning on agency’s microfi nance programs and latest microfi nance developments throughout headquarters and fi eld offi ces”) has received the lowest score of all indicators overall. This may be an interesting topic for further research.
Since this is a self-assessment, a certain level of subjectivity should be expected.
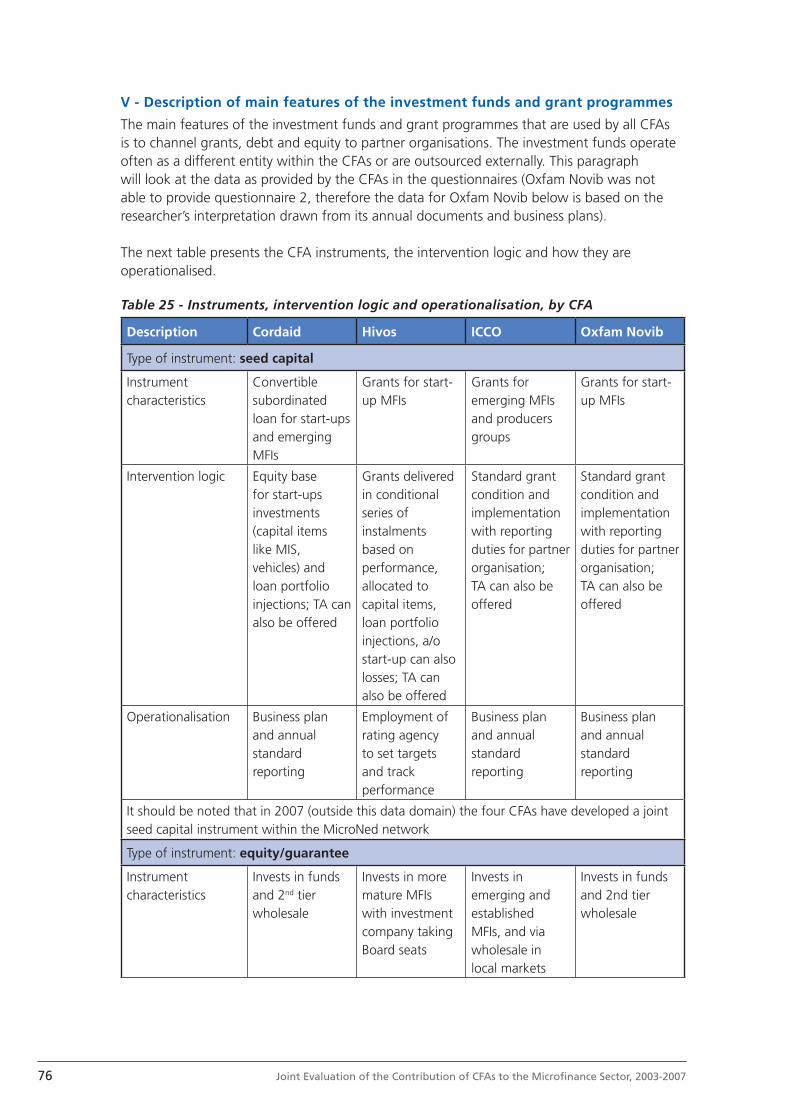
76 Joint Evaluation of the Contribution of CFAs to the Microfi nance Sector, 2003-2007
V - Description of main features of the investment funds and grant programmes
The main features of the investment funds and grant programmes that are used by all CFAs is to channel grants, debt and equity to partner organisations. The investment funds operate often as a different entity within the CFAs or are outsourced externally. This paragraph will look at the data as provided by the CFAs in the questionnaires (Oxfam Novib was not able to provide questionnaire 2, therefore the data for Oxfam Novib below is based on the researcher’s interpretation drawn from its annual documents and business plans).
The next table presents the CFA instruments, the intervention logic and how they are operationalised.
Table 25 - Instruments, intervention logic and operationalisation, by CFA
Description Cordaid Hivos ICCO Oxfam Novib
Type of instrument: seed capital
Instrument characteristics
Convertible subordinated loan for start-ups and emerging MFIs
Grants for start-up MFIs
Grants for emerging MFIs and producers groups
Grants for start-up MFIs
Intervention logic Equity base for start-ups investments (capital items like MIS, vehicles) and loan portfolio injections; TA can also be offered
Grants delivered in conditional series of instalments based on performance, allocated to capital items, loan portfolio injections, a/o start-up can also losses; TA can also be offered
Standard grant condition and implementation with reporting duties for partner organisation; TA can also be offered
Standard grant condition and implementation with reporting duties for partner organisation; TA can also be offered
Operationalisation Business plan and annual standard reporting
Employment of rating agency to set targets and track performance
Business plan and annual standard reporting
Business plan and annual standard reporting
It should be noted that in 2007 (outside this data domain) the four CFAs have developed a joint seed capital instrument within the MicroNed network
Type of instrument: equity/guarantee
Instrument characteristics
Invests in funds and 2nd tier wholesale
Invests in more mature MFIs with investment company taking Board seats
Invests in emerging and established MFIs, and via wholesale in local markets
Invests in funds and 2nd tier wholesale
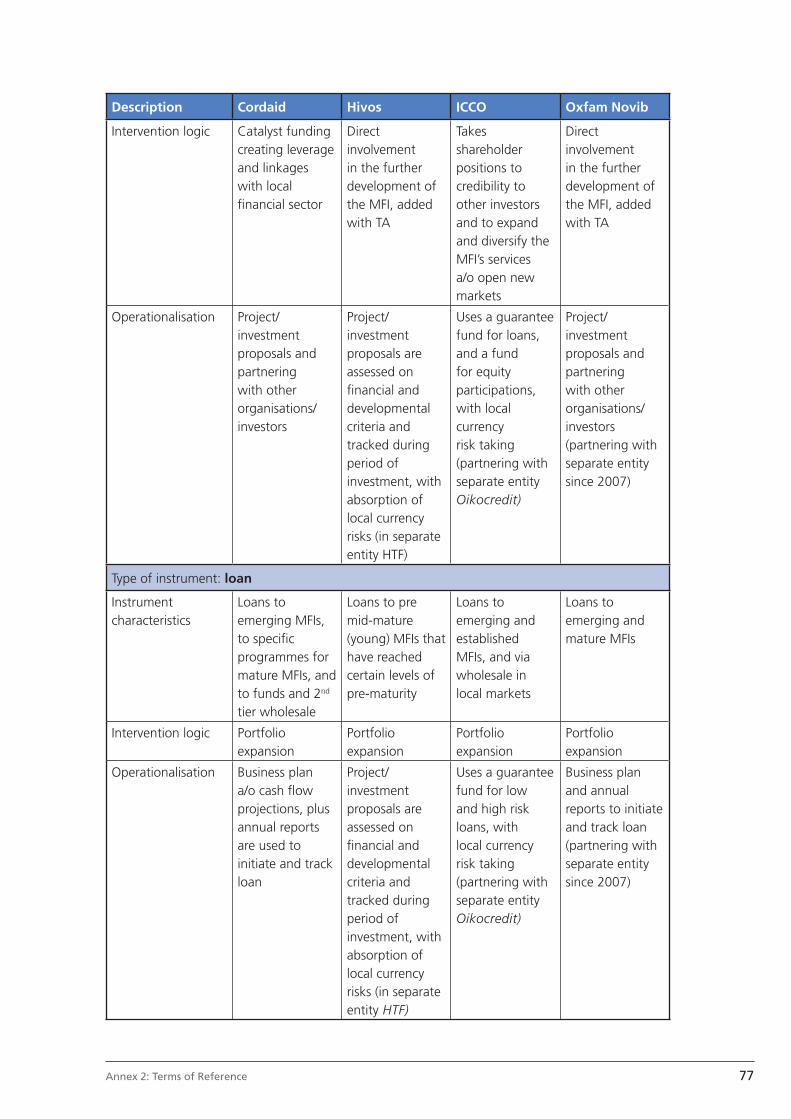
77Annex 2: Terms of Reference
Description Cordaid Hivos ICCO Oxfam Novib
Intervention logic Catalyst funding creating leverage and linkages with local fi nancial sector
Direct involvement in the further development of the MFI, added with TA
Takes shareholder positions to credibility to other investors and to expand and diversify the MFI’s services a/o open new markets
Direct involvement in the further development of the MFI, added with TA
Operationalisation Project/investment proposals and partnering with other organisations/ investors
Project/investment proposals are assessed on fi nancial and developmental criteria and tracked during period of investment, with absorption of local currency risks (in separate entity HTF)
Uses a guarantee fund for loans, and a fund for equity participations, with local currency risk taking (partnering with separate entity Oikocredit)
Project/investment proposals and partnering with other organisations/ investors (partnering with separate entity since 2007)
Type of instrument: loan
Instrument characteristics
Loans to emerging MFIs, to specifi c programmes for mature MFIs, and to funds and 2nd tier wholesale
Loans to pre mid-mature (young) MFIs that have reached certain levels of pre-maturity
Loans to emerging and established MFIs, and via wholesale in local markets
Loans to emerging and mature MFIs
Intervention logic Portfolio expansion
Portfolio expansion
Portfolio expansion
Portfolio expansion
Operationalisation Business plan a/o cash fl ow projections, plus annual reports are used to initiate and track loan
Project/investment proposals are assessed on fi nancial and developmental criteria and tracked during period of investment, with absorption of local currency risks (in separate entity HTF)
Uses a guarantee fund for low and high risk loans, with local currency risk taking (partnering with separate entity Oikocredit)
Business plan and annual reports to initiate and track loan (partnering with separate entity since 2007)
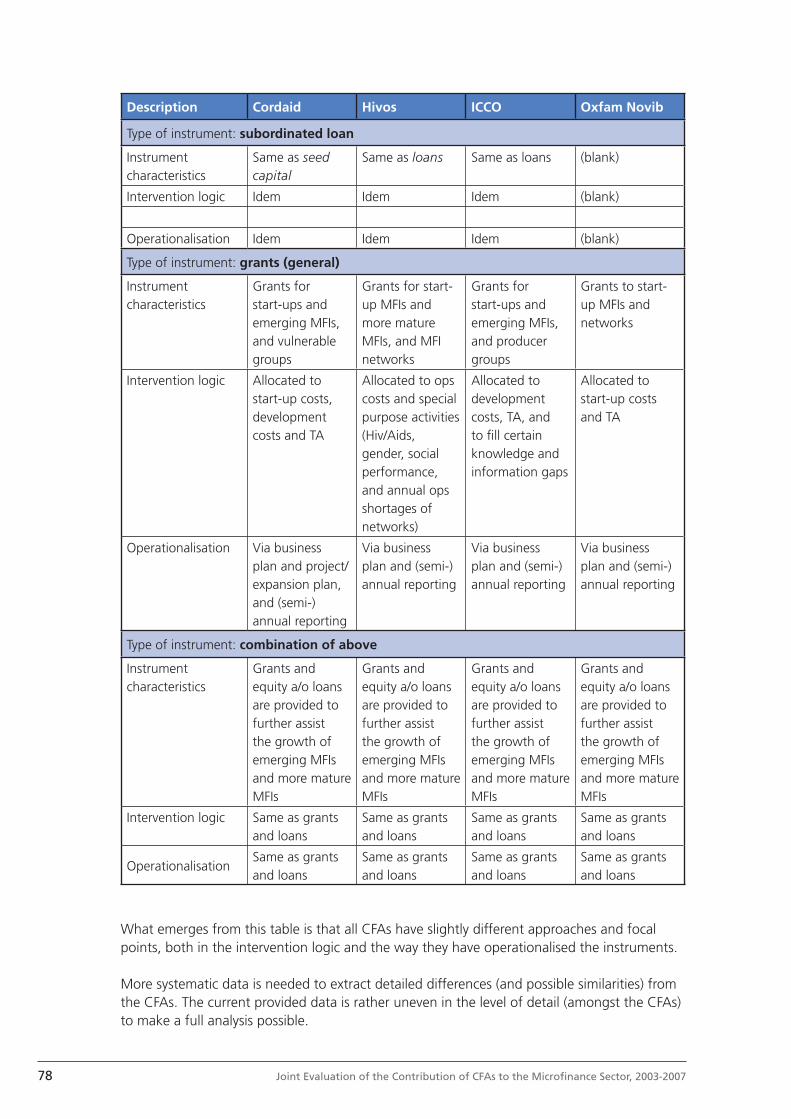
78 Joint Evaluation of the Contribution of CFAs to the Microfi nance Sector, 2003-2007
Description Cordaid Hivos ICCO Oxfam Novib
Type of instrument: subordinated loan
Instrument characteristics
Same as seed capital
Same as loans Same as loans (blank)
Intervention logic Idem Idem Idem (blank)
Operationalisation Idem Idem Idem (blank)
Type of instrument: grants (general)
Instrument characteristics
Grants for start-ups and emerging MFIs, and vulnerable groups
Grants for start-up MFIs and more mature MFIs, and MFI networks
Grants for start-ups and emerging MFIs, and producer groups
Grants to start-up MFIs and networks
Intervention logic Allocated to start-up costs, development costs and TA
Allocated to ops costs and special purpose activities (Hiv/Aids, gender, social performance, and annual ops shortages of networks)
Allocated to development costs, TA, and to fi ll certain knowledge and information gaps
Allocated to start-up costs and TA
Operationalisation Via business plan and project/ expansion plan, and (semi-) annual reporting
Via business plan and (semi-) annual reporting
Via business plan and (semi-) annual reporting
Via business plan and (semi-) annual reporting
Type of instrument: combination of above
Instrument characteristics
Grants and equity a/o loans are provided to further assist the growth of emerging MFIs and more mature MFIs
Grants and equity a/o loans are provided to further assist the growth of emerging MFIs and more mature MFIs
Grants and equity a/o loans are provided to further assist the growth of emerging MFIs and more mature MFIs
Grants and equity a/o loans are provided to further assist the growth of emerging MFIs and more mature MFIs
Intervention logic Same as grants and loans
Same as grants and loans
Same as grants and loans
Same as grants and loans
OperationalisationSame as grants and loans
Same as grants and loans
Same as grants and loans
Same as grants and loans
What emerges from this table is that all CFAs have slightly different approaches and focal points, both in the intervention logic and the way they have operationalised the instruments.
More systematic data is needed to extract detailed differences (and possible similarities) from the CFAs. The current provided data is rather uneven in the level of detail (amongst the CFAs) to make a full analysis possible.
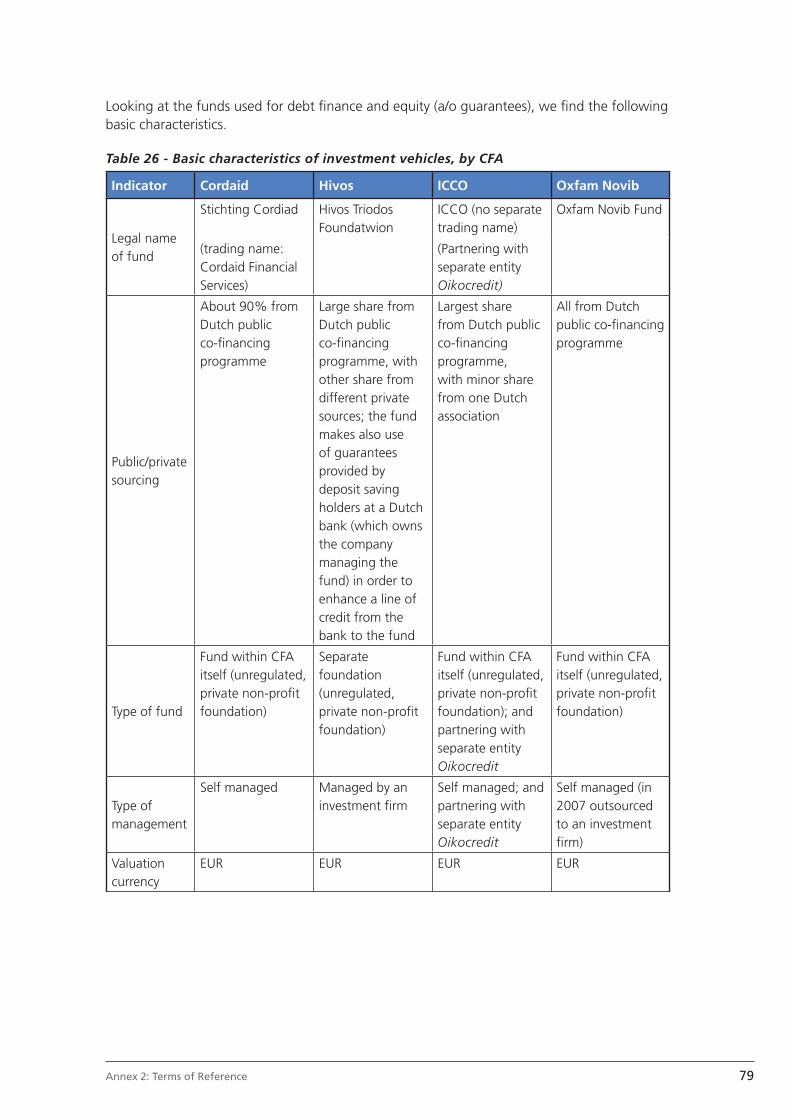
79Annex 2: Terms of Reference
Looking at the funds used for debt fi nance and equity (a/o guarantees), we fi nd the following basic characteristics.
Table 26 - Basic characteristics of investment vehicles, by CFA
Indicator Cordaid Hivos ICCO Oxfam Novib
Legal name of fund
Stichting Cordiad Hivos Triodos Foundatwion
ICCO (no separate trading name)
Oxfam Novib Fund
(trading name: Cordaid Financial Services)
(Partnering with separate entity Oikocredit)
Public/private sourcing
About 90% from Dutch public co-fi nancing programme
Large share from Dutch public co-fi nancing programme, with other share from different private sources; the fund makes also use of guarantees provided by deposit saving holders at a Dutch bank (which owns the company managing the fund) in order to enhance a line of credit from the bank to the fund
Largest share from Dutch public co-fi nancing programme, with minor share from one Dutch association
All from Dutch public co-fi nancing programme
Type of fund
Fund within CFA itself (unregulated, private non-profi t foundation)
Separate foundation (unregulated, private non-profi t foundation)
Fund within CFA itself (unregulated, private non-profi t foundation); and partnering with separate entity Oikocredit
Fund within CFA itself (unregulated, private non-profi t foundation)
Type of management
Self managed Managed by an investment fi rm
Self managed; and partnering with separate entity Oikocredit
Self managed (in 2007 outsourced to an investment fi rm)
Valuation currency
EUR EUR EUR EUR
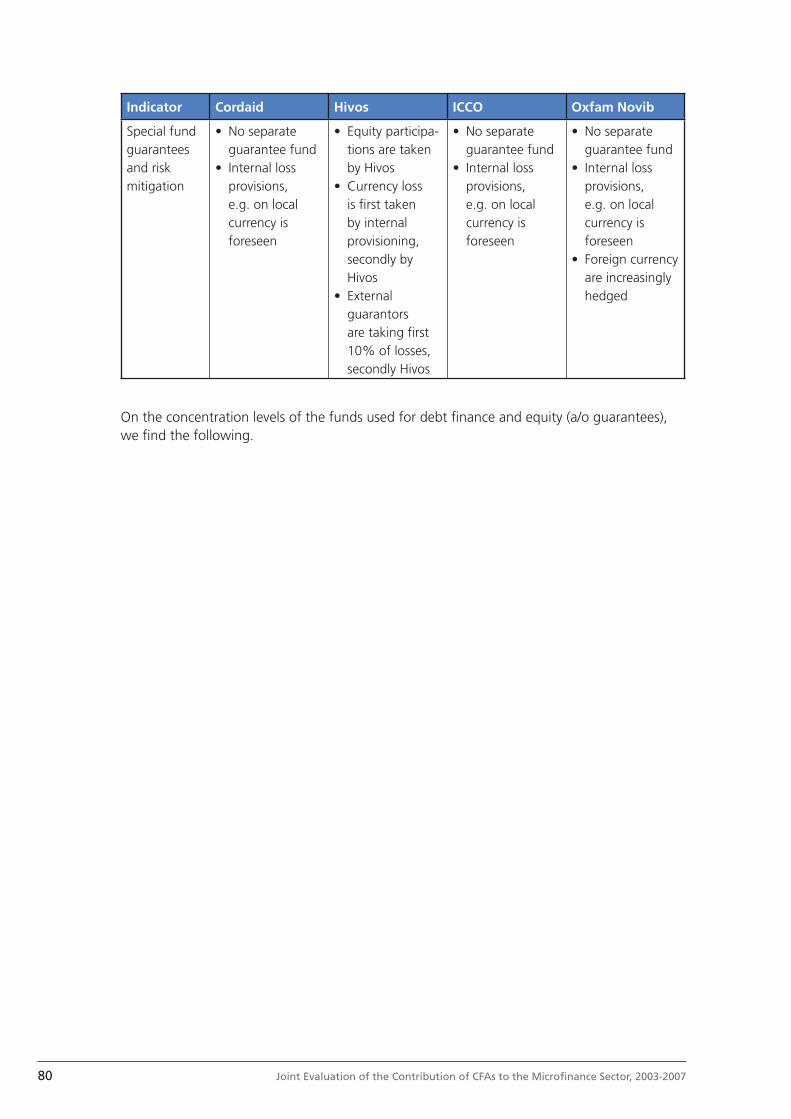
80 Joint Evaluation of the Contribution of CFAs to the Microfi nance Sector, 2003-2007
Indicator Cordaid Hivos ICCO Oxfam Novib
Special fund guarantees and risk mitigation
• No separate guarantee fund
• Internal loss provisions, e.g. on local currency is foreseen
• Equity participa-tions are taken by Hivos
• Currency loss is fi rst taken by internal provisioning, secondly by Hivos
• External guarantors are taking fi rst 10% of losses, secondly Hivos
• No separate guarantee fund
• Internal loss provisions, e.g. on local currency is foreseen
• No separate guarantee fund
• Internal loss provisions, e.g. on local currency is foreseen
• Foreign currency are increasingly hedged
On the concentration levels of the funds used for debt fi nance and equity (a/o guarantees), we fi nd the following.

81Annex 2: Terms of Reference
Table 27 - Concentration levels of investment vehicles, by CFA (I)
Indicator (fi rst listed is on top, for each year)
Cordaid Hivos ICCO Oxfam Novib
Top 3 country exposures
2003: n/a 2003: (blank) 2003: Bolivia, Peru, Philippines
2003: Peru, Colombia, Uganda
2004: n/a 2004: (blank) 2004: Bolivia, Peru, Philippines
2004: Peru, Uganda, Colombia
2005: India, Philippines, Kenya
2005: (blank) 2005: Bolivia, Cambodia, Ecuador
2005: Peru, Nicaragua, India
2006: India, Bangladesh, Philippines
2006: (blank) 2006: Mali, Bolivia, Ecuador
2006: Peru, Bolivia, Ecuador
2007: India, Philippines, Peru
2007: India, Cambodia, Uganda
2007: Ecuador, Peru, Mali
2007: Peru, Bolivia, Nicaragua
Top 3 currency exposures
2003: n/a 2003: (blank) 2003: BOL, PHP, KSH
2003: (blank)
2004: n/a 2004: USD, EUR, ? 2004: BOL, PHP, GHC
2004: (blank)
2005: USD, EUR, INR
2005: USD, EUR, ? 2005: BOL, PHP, GHC
2005: (blank)
2006: EUR, USD, INR
2006: USD, EUR, ? 2006: BOL, PHP, KSH
2006: (blank)
2007: EUR, USD, INR
2007: USD, EUR, ? 2007: BOL, PHP, KSH
2007: USD, TZS, NGN
Note that all investment vehicles offer local currency fi nance
In terms of concentration levels by region and type of fi nance we fi nd the following.
(See next page)
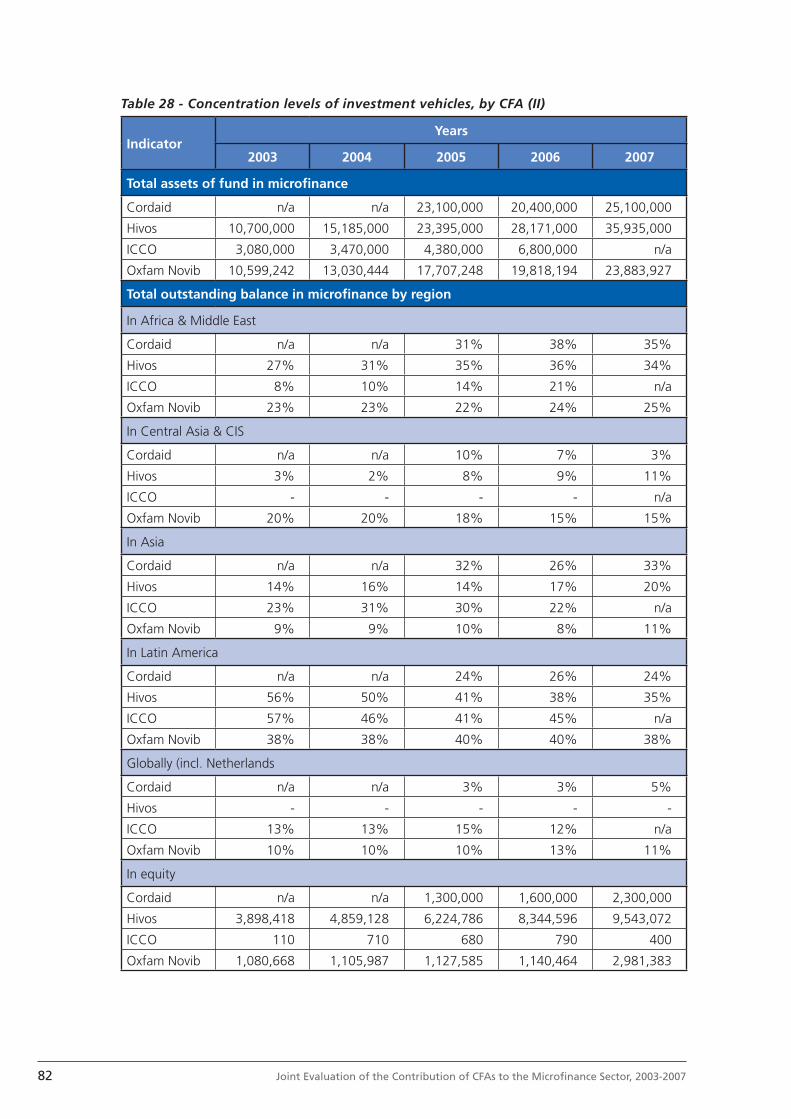
82 Joint Evaluation of the Contribution of CFAs to the Microfi nance Sector, 2003-2007
Table 28 - Concentration levels of investment vehicles, by CFA (II)
IndicatorYears
2003 2004 2005 2006 2007
Total assets of fund in microfi nance
Cordaid n/a n/a 23,100,000 20,400,000 25,100,000
Hivos 10,700,000 15,185,000 23,395,000 28,171,000 35,935,000
ICCO 3,080,000 3,470,000 4,380,000 6,800,000 n/a
Oxfam Novib 10,599,242 13,030,444 17,707,248 19,818,194 23,883,927
Total outstanding balance in microfi nance by region
In Africa & Middle East
Cordaid n/a n/a 31% 38% 35%
Hivos 27% 31% 35% 36% 34%
ICCO 8% 10% 14% 21% n/a
Oxfam Novib 23% 23% 22% 24% 25%
In Central Asia & CIS
Cordaid n/a n/a 10% 7% 3%
Hivos 3% 2% 8% 9% 11%
ICCO - - - - n/a
Oxfam Novib 20% 20% 18% 15% 15%
In Asia
Cordaid n/a n/a 32% 26% 33%
Hivos 14% 16% 14% 17% 20%
ICCO 23% 31% 30% 22% n/a
Oxfam Novib 9% 9% 10% 8% 11%
In Latin America
Cordaid n/a n/a 24% 26% 24%
Hivos 56% 50% 41% 38% 35%
ICCO 57% 46% 41% 45% n/a
Oxfam Novib 38% 38% 40% 40% 38%
Globally (incl. Netherlands
Cordaid n/a n/a 3% 3% 5%
Hivos - - - - -
ICCO 13% 13% 15% 12% n/a
Oxfam Novib 10% 10% 10% 13% 11%
In equity
Cordaid n/a n/a 1,300,000 1,600,000 2,300,000
Hivos 3,898,418 4,859,128 6,224,786 8,344,596 9,543,072
ICCO 110 710 680 790 400
Oxfam Novib 1,080,668 1,105,987 1,127,585 1,140,464 2,981,383
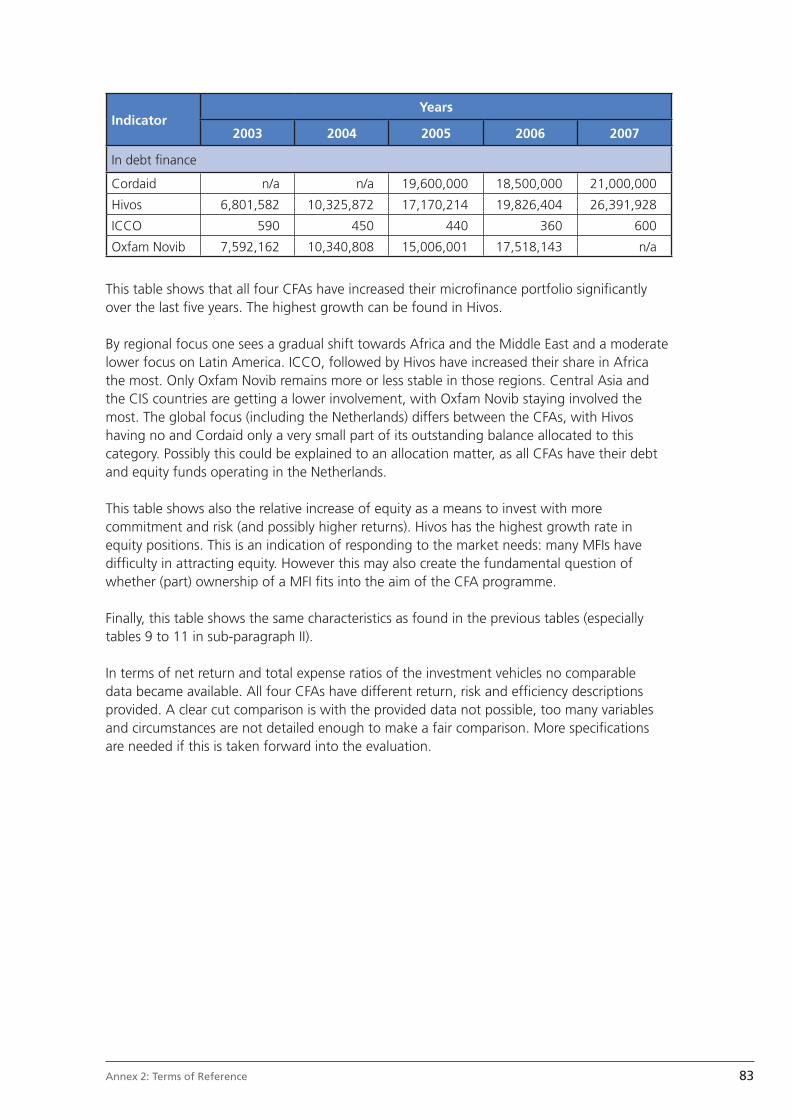
83Annex 2: Terms of Reference
IndicatorYears
2003 2004 2005 2006 2007
In debt fi nance
Cordaid n/a n/a 19,600,000 18,500,000 21,000,000
Hivos 6,801,582 10,325,872 17,170,214 19,826,404 26,391,928
ICCO 590 450 440 360 600
Oxfam Novib 7,592,162 10,340,808 15,006,001 17,518,143 n/a
This table shows that all four CFAs have increased their microfi nance portfolio signifi cantly over the last fi ve years. The highest growth can be found in Hivos.
By regional focus one sees a gradual shift towards Africa and the Middle East and a moderate lower focus on Latin America. ICCO, followed by Hivos have increased their share in Africa the most. Only Oxfam Novib remains more or less stable in those regions. Central Asia and the CIS countries are getting a lower involvement, with Oxfam Novib staying involved the most. The global focus (including the Netherlands) differs between the CFAs, with Hivos having no and Cordaid only a very small part of its outstanding balance allocated to this category. Possibly this could be explained to an allocation matter, as all CFAs have their debt and equity funds operating in the Netherlands.
This table shows also the relative increase of equity as a means to invest with more commitment and risk (and possibly higher returns). Hivos has the highest growth rate in equity positions. This is an indication of responding to the market needs: many MFIs have diffi culty in attracting equity. However this may also create the fundamental question of whether (part) ownership of a MFI fi ts into the aim of the CFA programme.
Finally, this table shows the same characteristics as found in the previous tables (especially tables 9 to 11 in sub-paragraph II).
In terms of net return and total expense ratios of the investment vehicles no comparable data became available. All four CFAs have different return, risk and effi ciency descriptions provided. A clear cut comparison is with the provided data not possible, too many variables and circumstances are not detailed enough to make a fair comparison. More specifi cations are needed if this is taken forward into the evaluation.
84 Joint Evaluation of the Contribution of CFAs to the Microfi nance Sector, 2003-2007
Conclusion
What conclusions and suggestions can be drawn from this analysis based on the available data?
All CFAs support and work towards a diversifi ed fi nancial services approach, where not only credit but also all other fi nancial services are developed and made available to low-income clients: varying from micro-insurance, to savings, remittances, leasing, and specifi c agricultural - and trade fi nance products. The modes of fi nancial service delivery - like e-banking, mobile phone banking - were not explicitly mentioned, but integrated in the various policies and instruments. Each CFA has emphasised (or is emphasising) certain niches and parts of this approach.
The focus on meso level partner organisations seems to be lower than to fi nancial service providing partner organisations. Nevertheless, meso level support is signalled to be important. The CFA’s role as creating synergy, operating as broker in bringing parties together, and leveraging local and global knowledge, seems to have renewed attention. Further research may be needed to uncover the outcome of these meso level partner organisations.
Of all four CFAs the strongest focus on rural development (rural microfi nance) can be found in ICCO. The other three CFAs show to a lesser degree a focus on rural microfi nance and score high on projects with a combined rural-(semi-)urban orientation. However the topic of rural/urban fi nance and rural sector development in general is not precisely defi ned. Issues as farm - and non-farm enterprises; linkages between the rural and urban areas; the growing importance to seek an integrated environmental approach; the need of fi nancing services that cover a trade chain (from farm to wholesale to distribution to consumer); are all issues that may need further research. Without more insight in these aspects, one may risk to be less effective and effi cient with available funding resources.
Further research may also be needed to analyse the effectiveness of supporting one particular type of partner organisations, namely the MFIs, in their effort to reach higher levels of sustainability, as the (very) limited available data suggests a rather disappointing effectiveness.
And fi nally, Africa is strong on the map of all CFAs, be it with each applying its own type of instruments and having its own focal countries. The levels of disbursement and the use of certain instruments suggests that further research may be needed.
Lastly, the data and the fi lled-out questionnaires offer a rich source for the next phase: the full evaluation.
85Annex 2: Terms of Reference
Annex
Terms of Reference Portfolio Analyses
InleidingSinds 1 januari 2007 heeft Partos de aansturing van gezamenlijke programma evaluaties van Cordaid, Hivos, ICCO, Oxfam Novib en Plan Nederland onder haar hoede. Eén van de onderwerpen op de evaluatie agenda 2007 - 2010 is microfi nanciering. Aan deze microfi nancieringsevaluatie doen Cordaid, Hivos, ICCO en Oxfam Novib mee. Eind 2007 is er een begin gemaakt met de voorbereidingen. Elke organisatie heeft 2 contactpersonen richting Partos. Deze 9 personen samen vormen een coördinatiegroep, welke o.a. verantwoordelijk is voor het opstellen van de Terms of Reference. Eind 2007 is een concept Terms of Reference voorgelegd aan een onafhankelijke Externe Referentie Groep. Haar belangrijkste advies aan de coördinatiegroep was om de evaluatievragen verder af te bakenen, en daarvoor eerst ‘n grondige portfolio analyse te doen.
Portfolio analyse Het doel van de portfolio analyse is het in kaart brengen van de microfi nanciering-portefeuilles van Cordaid, Hivos, ICCO en Oxfam Novib om op basis daarvan de evaluatievragen verder af te kunnen bakenen, en te beslissen waarop we gaan inzoomen tijdens de evaluatie. Het is in eerste instantie een beschrijving, het in kaart brengen van patronen; de analyse moet in dienst staan van de evaluatievragen, en geen vergaande analyse zijn naar de ‘waarom’ en de ‘hoe komt het dat’ vragen. Deze komen in de feitelijke evaluatie na deze portfolio analyse naar voren. De portfolio analyse moet plaats vinden op 3 niveaus:
1. portfolio van deze 4 organisaties op partner en project niveau gedurende 2003 - 2006. Naar schatting praten we over 350 partner/projecten, plus daarnaast nog de adviesmissies, (evt) lobbycampagnes, etc
2. portfolio op MFO input niveau, periode 2003 - 2007: gebaseerd op het CGAP 5 star system (self assessments in 2007, 2005 en 2003) welke conclusies zijn hier op MFO niveau uit te trekken?
3. portfolio m.b.t. mechanieken van het beheer van de fondsen over de periode 2003- 2007. Het gaat om een beschrijving van de mechanismen en enkele fi nanciële fonds-indicatoren (het gaat hier om indicatoren die beleidsmatig belang hebben en gerelateerd zijn aan de in het (effectiviteit, effi ciency, etc) van publiek geld voor de bevordering van Microfi nance, bijvoorbeeld indicatoren omtrent portfolio-ontwikkeling, mengsmering publiek-privaat geld, kosten/opbrengstenprofi el van het fonds, portfoliovoorzieningen / -verliezen).
Het is de bedoeling dat deze informatie ingeschoven kan worden (of misschien al beschikbaar is) in de nieuwe NPM database, en aansluit op de Microned module. Dit om dubbel werk te voorkomen.
Taken consultantDe coördinatiegroep heeft besloten om de portfolio analyse uit te laten voeren onder verantwoordelijkheid van 1 consultant. (‘onderzoeker’ genoemd in het contract). De coördinatiegroep en de programma verantwoordelijken in de organisaties zelf moeten tijd steken in het aanleveren van alle materialen. De consultant is verantwoordelijke voor:
a. het ontwikkelen van een format voor de portfolio analyse,b. het systematiseren van al de informatie die uit te organisaties komt,c. deze data te importeren in een overall spreadsheet,d. een beschrijvende analyse uit te voeren die in dienst staat van de evaluatie,e. de resultaten vast te leggen in een rapportage (Engelstalig).
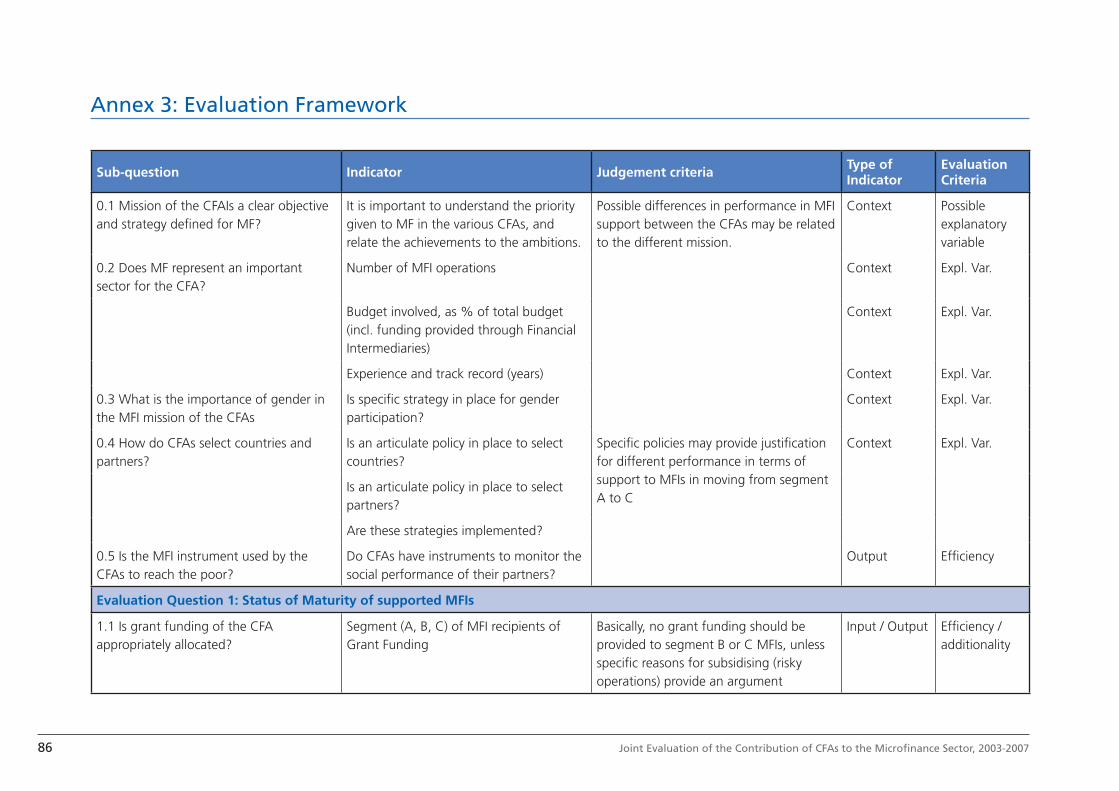
86 Joint Evaluation of the Contribution of CFAs to the Microfi nance Sector, 2003-2007
Sub-question Indicator Judgement criteria Type of Indicator
Evaluation Criteria
0.1 Mission of the CFAIs a clear objective and strategy defi ned for MF?
It is important to understand the priority given to MF in the various CFAs, and relate the achievements to the ambitions.
Possible differences in performance in MFI support between the CFAs may be related to the different mission.
Context Possible explanatory variable
0.2 Does MF represent an important sector for the CFA?
Number of MFI operations Context Expl. Var.
Budget involved, as % of total budget (incl. funding provided through Financial Intermediaries)
Context Expl. Var.
Experience and track record (years) Context Expl. Var.
0.3 What is the importance of gender in the MFI mission of the CFAs
Is specifi c strategy in place for gender participation?
Context Expl. Var.
0.4 How do CFAs select countries and partners?
Is an articulate policy in place to select countries?
Specifi c policies may provide justifi cation for different performance in terms of support to MFIs in moving from segment A to C
Context Expl. Var.
Is an articulate policy in place to select partners?
Are these strategies implemented?
0.5 Is the MFI instrument used by the CFAs to reach the poor?
Do CFAs have instruments to monitor the social performance of their partners?
Output Effi ciency
Evaluation Question 1: Status of Maturity of supported MFIs
1.1 Is grant funding of the CFA appropriately allocated?
Segment (A, B, C) of MFI recipients of Grant Funding
Basically, no grant funding should be provided to segment B or C MFIs, unless specifi c reasons for subsidising (risky operations) provide an argument
Input / Output Effi ciency / additionality
Annex 3: Evaluation Framework
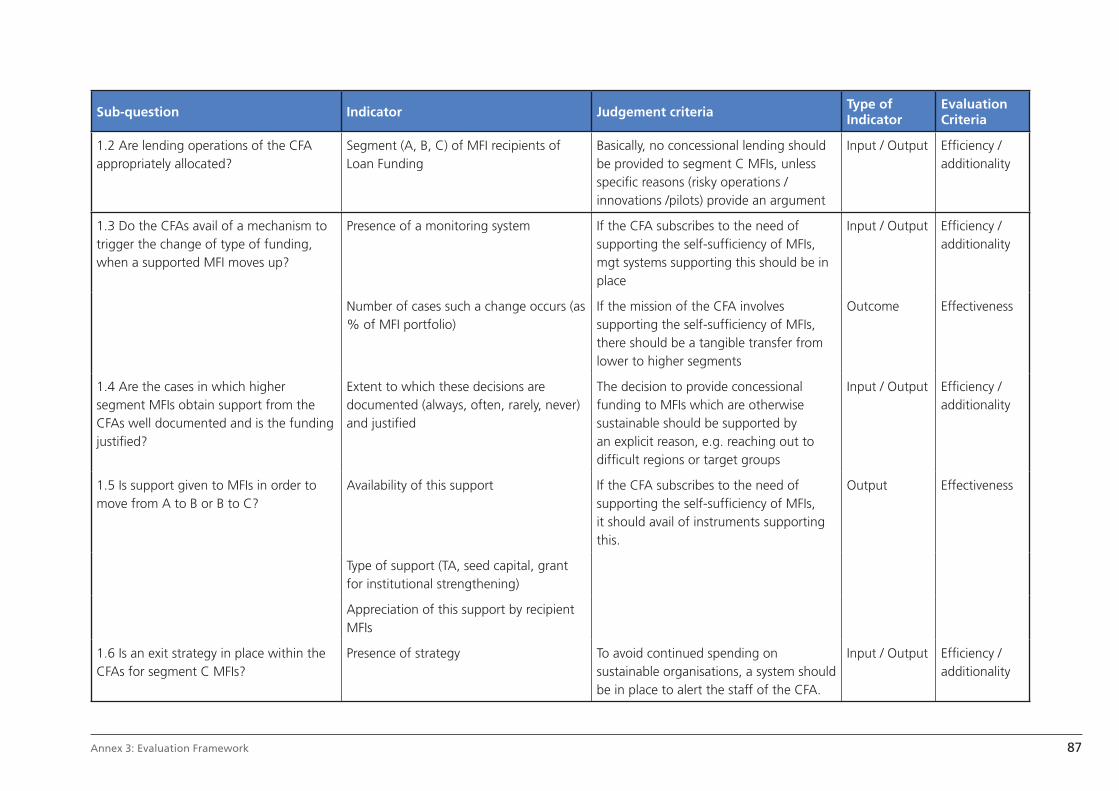
87Annex 3: Evaluation Framework
Sub-question Indicator Judgement criteria Type of Indicator
Evaluation Criteria
1.2 Are lending operations of the CFA appropriately allocated?
Segment (A, B, C) of MFI recipients of Loan Funding
Basically, no concessional lending should be provided to segment C MFIs, unless specifi c reasons (risky operations /innovations /pilots) provide an argument
Input / Output Effi ciency / additionality
1.3 Do the CFAs avail of a mechanism to trigger the change of type of funding, when a supported MFI moves up?
Presence of a monitoring system If the CFA subscribes to the need of supporting the self-suffi ciency of MFIs, mgt systems supporting this should be in place
Input / Output Effi ciency / additionality
Number of cases such a change occurs (as % of MFI portfolio)
If the mission of the CFA involves supporting the self-suffi ciency of MFIs, there should be a tangible transfer from lower to higher segments
Outcome Effectiveness
1.4 Are the cases in which higher segment MFIs obtain support from the CFAs well documented and is the funding justifi ed?
Extent to which these decisions are documented (always, often, rarely, never) and justifi ed
The decision to provide concessional funding to MFIs which are otherwise sustainable should be supported by an explicit reason, e.g. reaching out to diffi cult regions or target groups
Input / Output Effi ciency / additionality
1.5 Is support given to MFIs in order to move from A to B or B to C?
Availability of this support If the CFA subscribes to the need of supporting the self-suffi ciency of MFIs, it should avail of instruments supporting this.
Output Effectiveness
Type of support (TA, seed capital, grant for institutional strengthening)
Appreciation of this support by recipient MFIs
1.6 Is an exit strategy in place within the CFAs for segment C MFIs?
Presence of strategy To avoid continued spending on sustainable organisations, a system should be in place to alert the staff of the CFA.
Input / Output Effi ciency / additionality
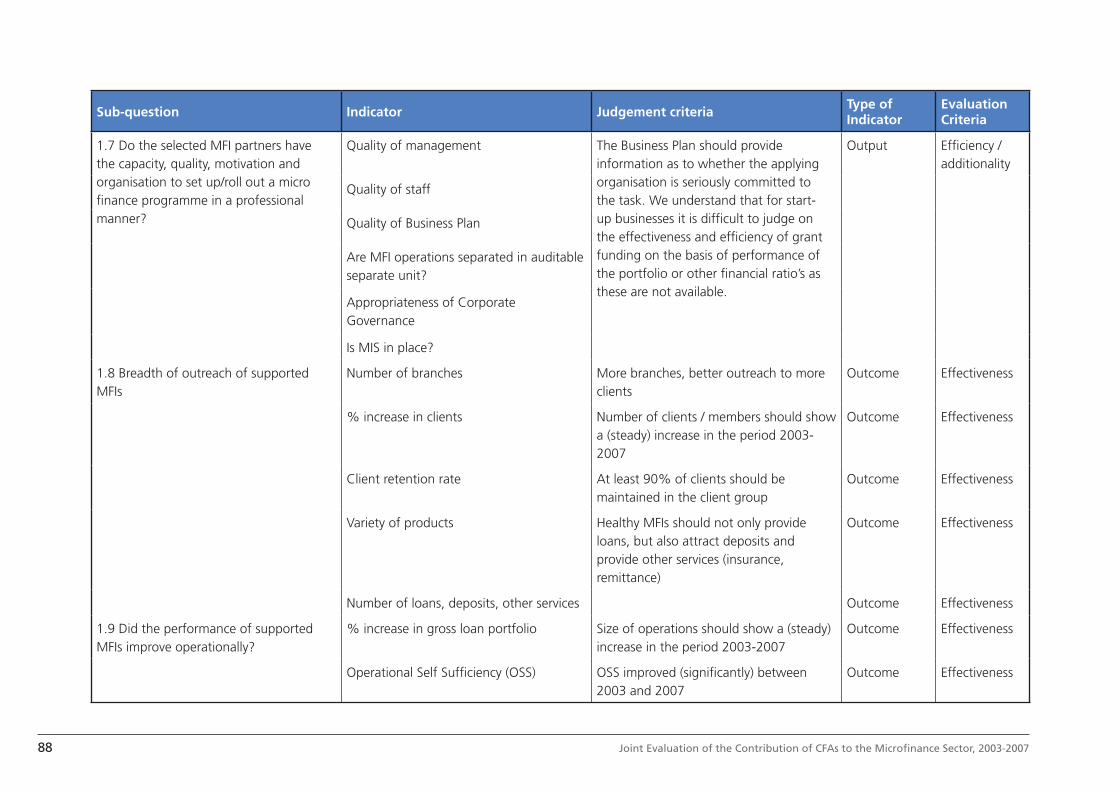
88 Joint Evaluation of the Contribution of CFAs to the Microfi nance Sector, 2003-2007
Sub-question Indicator Judgement criteria Type of Indicator
Evaluation Criteria
1.7 Do the selected MFI partners have the capacity, quality, motivation and organisation to set up/roll out a micro fi nance programme in a professional manner?
Quality of management The Business Plan should provide information as to whether the applying organisation is seriously committed to the task. We understand that for start-up businesses it is diffi cult to judge on the effectiveness and effi ciency of grant funding on the basis of performance of the portfolio or other fi nancial ratio’s as these are not available.
Output Effi ciency / additionality
Quality of staff
Quality of Business Plan
Are MFI operations separated in auditable separate unit?
Appropriateness of Corporate Governance
Is MIS in place?
1.8 Breadth of outreach of supported MFIs
Number of branches More branches, better outreach to more clients
Outcome Effectiveness
% increase in clients Number of clients / members should show a (steady) increase in the period 2003-2007
Outcome Effectiveness
Client retention rate At least 90% of clients should be maintained in the client group
Outcome Effectiveness
Variety of products Healthy MFIs should not only provide loans, but also attract deposits and provide other services (insurance, remittance)
Outcome Effectiveness
Number of loans, deposits, other services Outcome Effectiveness
1.9 Did the performance of supported MFIs improve operationally?
% increase in gross loan portfolio Size of operations should show a (steady) increase in the period 2003-2007
Outcome Effectiveness
Operational Self Suffi ciency (OSS) OSS improved (signifi cantly) between 2003 and 2007
Outcome Effectiveness

89Annex 3: Evaluation Framework
Sub-question Indicator Judgement criteria Type of Indicator
Evaluation Criteria
1.10 Is a credit rating carried out for the supported MFI(s)?
Outcome of the credit rating Ideally, credit rating should have improved or at least maintained at suffi cient level over the period 2003-2007
Outcome Effectiveness
1.11 Did the performance of supported MFIs improve fi nancially?
Financial Self Suffi ciency (FSS) FSS improved (signifi cantly) between 2003 and 2007
Outcome Effectiveness
Return on Assets (RoA), Return on Equity (RoE)
RoA and RoE should not have deteriorated between 2003 and 2007
Outcome Effectiveness
1.12 Is the risk of the operations calculated and limited?
Debt: Equity ratio Should be within healthy limits (30% - 40% equity on total assets)
Outcome Effectiveness
Gross Loan Portfolio / Total Assets Should be within healthy limits Outcome Effectiveness
1.13 Do the supported MFIs work effi ciently?
Operating Expense /average Loan Portfolio
The MFIs, especially the more mature, should operate effi ciently, trying to maximise the value of services provided per EURO invested. (Large scale) defaulting is ‘unfair’ to the honest repayers.
Output Effi ciency
Adjusted Cost per Borrower (Euro) Output Effi ciency
Borrowers per credit offi cer Output Effi ciency
Portfolio At Risk> 30 days Output Effi ciency
Default rate Output Effi ciency
1.14 Does the support to segment C MFIs improve fi nancial services and innovations?
Type of products offered Number of clients accessing Outcome Effectiveness
Expansion of services to remote areas Savings/insurance/ remittance product offered by MFIs
Increase in number of clients and portfolio in diffi cult areas.
Outcome Effectiveness
Changes in OSS and FSS over 4 years Outcome Effectiveness

90 Joint Evaluation of the Contribution of CFAs to the Microfi nance Sector, 2003-2007
Sub-question Indicator Judgement criteria Type of Indicator
Evaluation Criteria
Evaluation Question 2: the Poverty Focus
2.1 Are the supported MFIs committed to serving the poor?
Importance of the poor, as laid down in Business Plan, Mission and Strategy of the MFIs
Attention given to the poor in the operations, as mentioned in the Business Plan
Outcome Effectiveness
2.2 Depth of outreach: are conditions in place to ensure the possibility of servicing the poor?
Location (rural, remote, urban)? Rural areas are harder to reach than others
Outcome Effectiveness
lending methodology ( individual, solidarity group, village banking, bulk lender, other)
Solidarity group may be a mean to reach poorer clients
Outcome Effectiveness
Is there a focus on or attention for specifi c underprivileged groups (tribal, HIV/AIDS, displaced persons etc)
Focus on underprivileged groups may enhance the poverty abatement effect.
% women among active clients Women should be an important and sizeable group among the clients
Outcome Effectiveness
% women among members Outcome Effectiveness
2.3 Depth of outreach: are services accessible to the poor?
Are there minimum sizes (‘thresholds’) of loans or deposits?
Normally these thresholds may be a barrier for poor clients
Outcome Effectiveness
Average loan balance and loan size per borrower/GNI per capita
<20% - poor to poorest clients Outcome Effectiveness
>20%<150% medium class
>150% upper
Interest rate and other costs for clients Lower than market rates, although not necessarily high interest is a threshold, but rather the fact that small size services are not provided
Outcome Effectiveness

91Annex 3: Evaluation Framework
Sub-question Indicator Judgement criteria Type of Indicator
Evaluation Criteria
2.4 Is a social performance rating carried out?
Outcome of the soc. performance rating Ideally, rating should have improved or at least maintained at suffi cient level over the period 2003-2007
Impact Effectiveness
2.5 Is there a trade-off between moving to higher segments, i.e. reaching OSS and FSS, and maintaining a poverty focus?
Poverty focus per segment averaged and compared.
If a signifi cant difference in poverty focus between different segments can be observed, it may be that the thrive to segment C and FSS is counterproductive for the poverty focus
Output Effi ciency
2.6. How do the MFIs defi ne poverty? (new sub-question)
Poverty defi nition Essential is at least that activities are addressed at groups or individuals who have no access to regular fi nancial institutes,
Context Effectivenes
Evaluation Question 3: The enabling environment
3.1 Are the CFAs indeed focusing on the enabling environment?
Yes or no. Number that do. Context Context
Number of operations focusing on enabling environment and type of operations
Input / output Effi ciency
Number of partners in the south involved Input / Output Effi ciency
3.2 Do platforms in the North add to effectiveness and impact of operations focusing on enabling environment
Are CFAs member of platforms like MicroNed, NPM, e-MFP, Imp-Act)?
Input/Output Effi ciency
Do CFAs see a value added in the membership and which?
3.3 To what extent are the partners of the CFAs institutions relevant for infl uencing the enabling environment?
Are the networks or other organisations supported suffi ciently infl uential and recognised to have an effect on changing the enabling environment?
Outcome Effectiveness
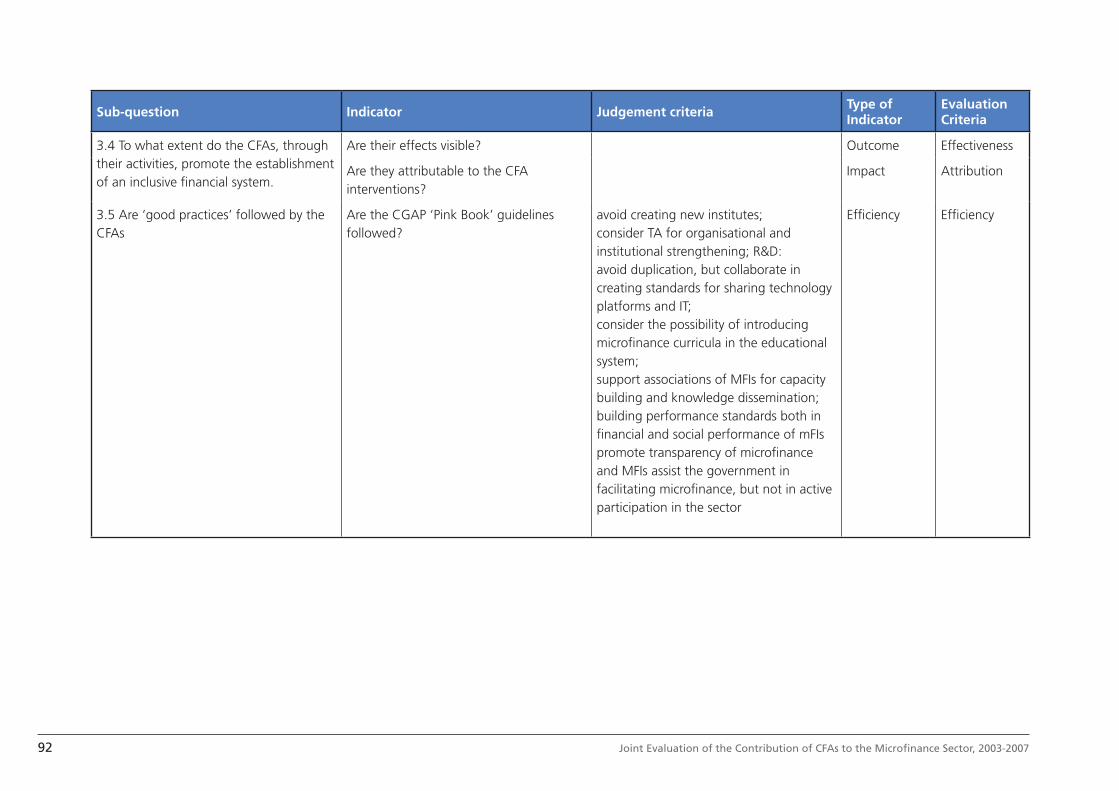
92 Joint Evaluation of the Contribution of CFAs to the Microfi nance Sector, 2003-2007
Sub-question Indicator Judgement criteria Type of Indicator
Evaluation Criteria
3.4 To what extent do the CFAs, through their activities, promote the establishment of an inclusive fi nancial system.
Are their effects visible? Outcome Effectiveness
Are they attributable to the CFA interventions?
Impact Attribution
3.5 Are ‘good practices’ followed by the CFAs
Are the CGAP ‘Pink Book’ guidelines followed?
avoid creating new institutes;consider TA for organisational and institutional strengthening; R&D: avoid duplication, but collaborate in creating standards for sharing technology platforms and IT;consider the possibility of introducing microfi nance curricula in the educational system;support associations of MFIs for capacity building and knowledge dissemination;building performance standards both in fi nancial and social performance of mFIspromote transparency of microfi nance and MFIs assist the government in facilitating microfi nance, but not in active participation in the sector
Effi ciency Effi ciency
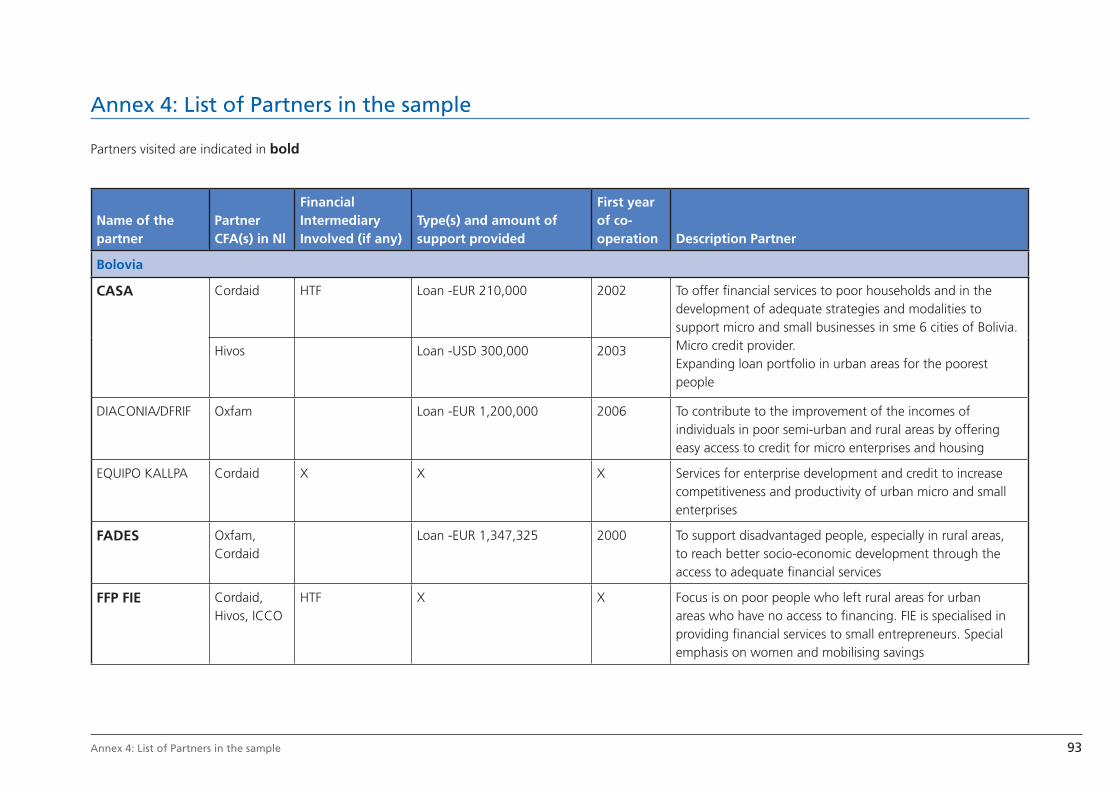
93Annex 4: List of Partners in the sample
Name of the partner
Partner CFA(s) in Nl
Financial Intermediary Involved (if any)
Type(s) and amount of support provided
First year of co-operation Description Partner
Bolovia
CASA Cordaid HTF Loan -EUR 210,000 2002 To offer fi nancial services to poor households and in the development of adequate strategies and modalities to support micro and small businesses in sme 6 cities of Bolivia. Micro credit provider.Expanding loan portfolio in urban areas for the poorest people
Hivos Loan -USD 300,000 2003
DIACONIA/DFRIF Oxfam Loan -EUR 1,200,000 2006 To contribute to the improvement of the incomes of individuals in poor semi-urban and rural areas by offering easy access to credit for micro enterprises and housing
EQUIPO KALLPA Cordaid X X X Services for enterprise development and credit to increase competitiveness and productivity of urban micro and small enterprises
FADES Oxfam, Cordaid
Loan -EUR 1,347,325 2000 To support disadvantaged people, especially in rural areas, to reach better socio-economic development through the access to adequate fi nancial services
FFP FIE Cordaid, Hivos, ICCO
HTF X X Focus is on poor people who left rural areas for urban areas who have no access to fi nancing. FIE is specialised in providing fi nancial services to small entrepreneurs. Special emphasis on women and mobilising savings
Annex 4: List of Partners in the sample
Partners visited are indicated in bold
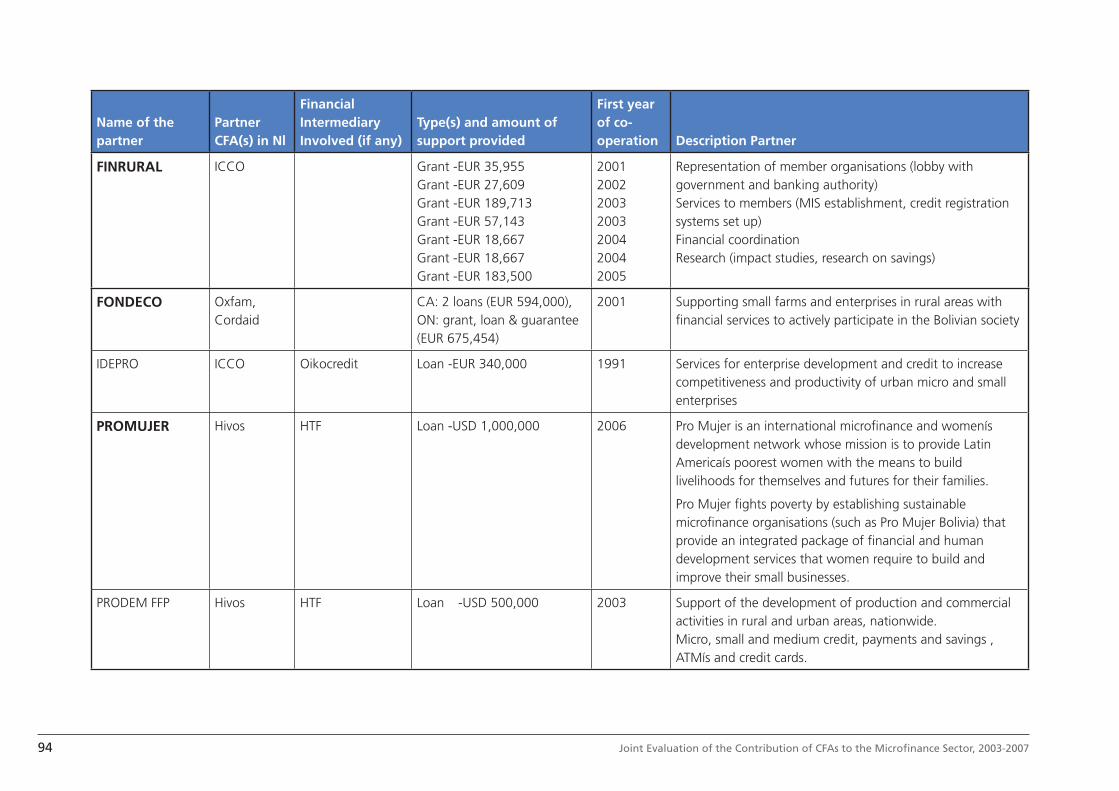
94 Joint Evaluation of the Contribution of CFAs to the Microfi nance Sector, 2003-2007
Name of the partner
Partner CFA(s) in Nl
Financial Intermediary Involved (if any)
Type(s) and amount of support provided
First year of co-operation Description Partner
FINRURAL ICCO Grant -EUR 35,955Grant -EUR 27,609Grant -EUR 189,713Grant -EUR 57,143Grant -EUR 18,667Grant -EUR 18,667Grant -EUR 183,500
2001200220032003200420042005
Representation of member organisations (lobby with government and banking authority)Services to members (MIS establishment, credit registration systems set up)Financial coordinationResearch (impact studies, research on savings)
FONDECO Oxfam, Cordaid
CA: 2 loans (EUR 594,000), ON: grant, loan & guarantee (EUR 675,454)
2001 Supporting small farms and enterprises in rural areas with fi nancial services to actively participate in the Bolivian society
IDEPRO ICCO Oikocredit Loan -EUR 340,000 1991 Services for enterprise development and credit to increase competitiveness and productivity of urban micro and small enterprises
PROMUJER Hivos HTF Loan -USD 1,000,000 2006 Pro Mujer is an international microfi nance and womenís development network whose mission is to provide Latin Americaís poorest women with the means to build livelihoods for themselves and futures for their families.
Pro Mujer fi ghts poverty by establishing sustainable microfi nance organisations (such as Pro Mujer Bolivia) that provide an integrated package of fi nancial and human development services that women require to build and improve their small businesses.
PRODEM FFP Hivos HTF Loan -USD 500,000 2003 Support of the development of production and commercial activities in rural and urban areas, nationwide.Micro, small and medium credit, payments and savings , ATMís and credit cards.

95Annex 4: List of Partners in the sample
Name of the partner
Partner CFA(s) in Nl
Financial Intermediary Involved (if any)
Type(s) and amount of support provided
First year of co-operation Description Partner
Ethiopia
AEMFI Oxfam Grant -EUR 273,000 2007 Offering training and negotiation for alternative funding resources from both local and international sources. And undertaking research, advocacy, promotion of the industry, engage dialogue with the government and other relevant international institutions.ICCO EUR 122,000
EUR 40,000Grant -EUR 30,267
200720052002
AVFS ICCO Grant -EUR 90,000Grant -EUR 100,000Grant -EUR 136,134
200720052002
Provide professional, sustainable and profi table fi nancial services to small and micro enterprise with special focus on women’s enterprise
Busaa Gondafa ICCO Grant -EUR 194,700 2003 To provide fl exible and effi cient micro-fi nancial services on a sustainable basis to enhance self-reliant livelihood of the resource-poor in rural and peri-urban areas in Oromia
CIDR ICCO Terrafi na Grants -EUR 60,000To three MFIs (Buusaa Gonofaa, Eshet, Wasasa)
Since August 2005, till December 2006 (length project)
Poverty reduction; promote social and economic development among economic active rural poor by offering them access to adequate decentralised fi nancial services.Contribute to MF development in Ethiopia by introducing participatory methods and reinforcing viable MFIs in underserved rural areasCapacity building
DECSI Oxfam Grant -EUR 135,000 2007 Poverty alleviation, for those people that have no access to regular fi nancial services, in rural and urban areasloan services: credit facilities and savings mobilisation
ICCO

96 Joint Evaluation of the Contribution of CFAs to the Microfi nance Sector, 2003-2007
Name of the partner
Partner CFA(s) in Nl
Financial Intermediary Involved (if any)
Type(s) and amount of support provided
First year of co-operation Description Partner
Eshet Oxfam Loan -EUR 310,000Grant -EUR 90,000
2002 bring positive change to the well being of the active poor and less privileged category of the society through provision of appropriate and sustainable fi nancial services and building of vibrant and sustainable fi nancial institutionEshet wants to realize fast expansion through the establishment of regional offi ces, in the next 3 year serve more than 40.000 active clients (now they serve over 10,000 clients)
Oxfam Loan -EUR 400,000Grant -EUR 100,000
2005
ICCO Grant -EUR 200,000 2005
HARBU ICCO Grant -EUR 280,000 2007 Multisectoral: MF, humanitarian aid and consultancy to small entrepreneursOnly doing MF (since 2000). Play a role in alleviating poverty in Ethiopia by facilitating to bring above a sustainable economic development in Ethiopia by providing fi n services that will stimulate individual initiatives for self reliance and food security
PEACE Oxfam Loan -EUR 400,000Grant -EUR 115,584
2002 (grant)2005 (loan)
Contribute to a sustainable socio-economic development of rural and urban communities and so support the national policy on poverty alleviation credit services
SHDI ICCO Seed capital -EUR 200,000 2006 Emergency aidfocus more on causes of poverty through support and implementation of integrated rural development projects. Vision: developing fl ourishing communities in the developing world where every citizen has access to adequate food, shelter, health care and education

97Annex 4: List of Partners in the sample
Name of the partner
Partner CFA(s) in Nl
Financial Intermediary Involved (if any)
Type(s) and amount of support provided
First year of co-operation Description Partner
Indonesia
BMM Cordaid Loan -EUR 275,000 2003 cooperative MFI (savings and credit), fi nancial intermediarymobilize funds from its members (savings) and channel them to small entrepreneurs organized in self-help groups via the microfi nance Centre of Bina Swadaya
Bina Swadaya Cordaid Grant -EUR 1,828,185Loan -EUR 395,463
19992002
BS springs from the Catholic farmer movement and was established to alleviate the problems of poor communities with saving and credit services and cooperation establishment. Central in this strategy is to develop “self-help-groups” accompanied with training and technical assistance
Cuco Inkopdit Cordaid Loan -EUR 235,000 2003 Promote credit unions in Indonesia. In the 1990s the Foundationís role was to form pre-credit unions and pre-Chapters.The aim is to strengthen the development of autonomous and self-reliant Credit union. Emphasis on participative decision-making.
Ganesha/ PT Mitra Bisnis
Hivos Seed capital -EUR 353,000 2004 Microfi nance: Purpose is to lift poor people in Indonesia above the poverty line directly in a way that is sustainable. Cordaid Loan -EUR 400,000
(Guarantee -EUR 610,000)2006
Pancur Kasih Oxfam Grant -EUR 392,519Grant -EUR 96,305 (extension)
20032007
To carry out people economy through Credit Unions members as the fi nancial institution for the assisted community; to establish and develop group enterprises among CU members as the effort to generate their income; to promote gender equity at the PEP institutional level as well as at the assisted groups.
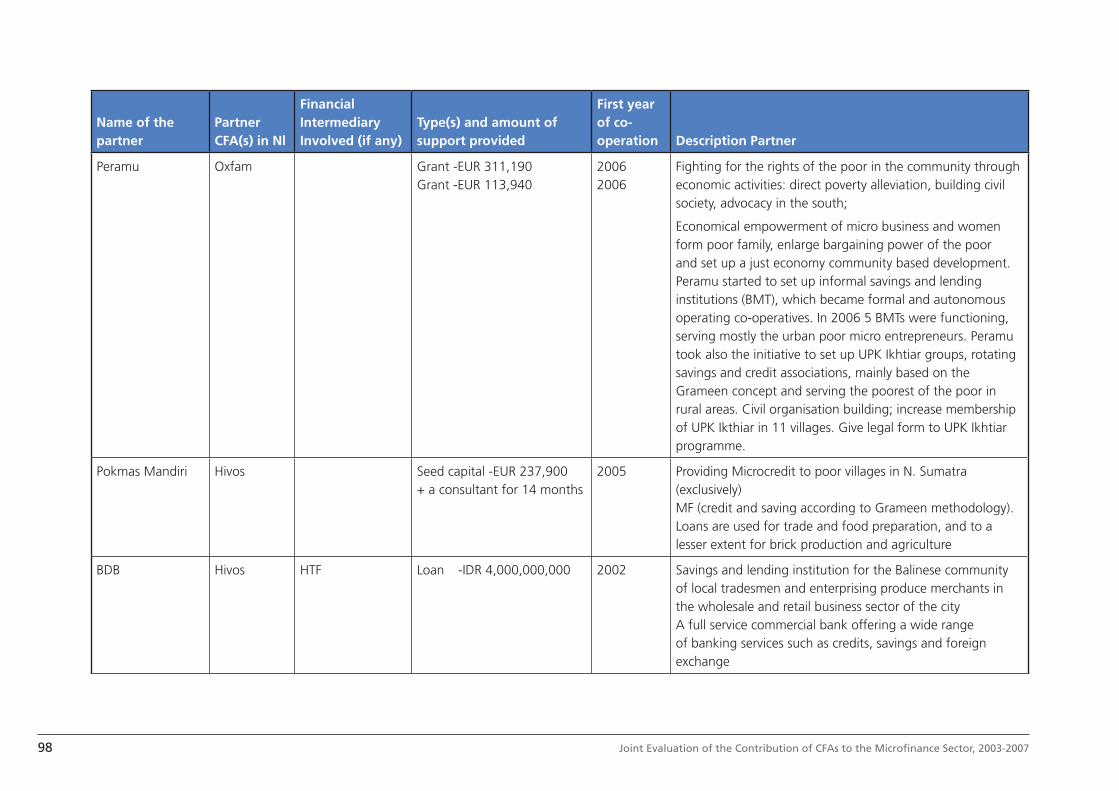
98 Joint Evaluation of the Contribution of CFAs to the Microfi nance Sector, 2003-2007
Name of the partner
Partner CFA(s) in Nl
Financial Intermediary Involved (if any)
Type(s) and amount of support provided
First year of co-operation Description Partner
Peramu Oxfam Grant -EUR 311,190Grant -EUR 113,940
20062006
Fighting for the rights of the poor in the community through economic activities: direct poverty alleviation, building civil society, advocacy in the south;
Economical empowerment of micro business and women form poor family, enlarge bargaining power of the poor and set up a just economy community based development. Peramu started to set up informal savings and lending institutions (BMT), which became formal and autonomous operating co-operatives. In 2006 5 BMTs were functioning, serving mostly the urban poor micro entrepreneurs. Peramu took also the initiative to set up UPK Ikhtiar groups, rotating savings and credit associations, mainly based on the Grameen concept and serving the poorest of the poor in rural areas. Civil organisation building; increase membership of UPK Ikthiar in 11 villages. Give legal form to UPK Ikhtiar programme.
Pokmas Mandiri Hivos Seed capital -EUR 237,900+ a consultant for 14 months
2005 Providing Microcredit to poor villages in N. Sumatra (exclusively)MF (credit and saving according to Grameen methodology). Loans are used for trade and food preparation, and to a lesser extent for brick production and agriculture
BDB Hivos HTF Loan -IDR 4,000,000,000 2002 Savings and lending institution for the Balinese community of local tradesmen and enterprising produce merchants in the wholesale and retail business sector of the cityA full service commercial bank offering a wide range of banking services such as credits, savings and foreign exchange
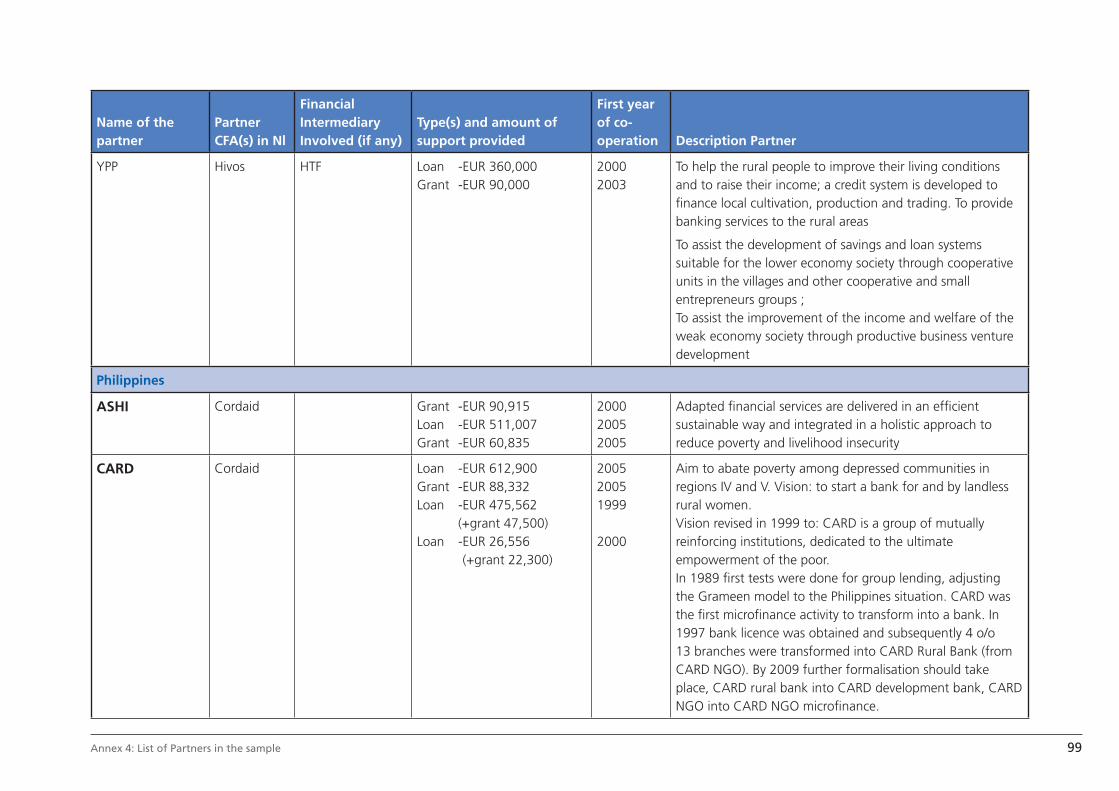
99Annex 4: List of Partners in the sample
Name of the partner
Partner CFA(s) in Nl
Financial Intermediary Involved (if any)
Type(s) and amount of support provided
First year of co-operation Description Partner
YPP Hivos HTF Loan -EUR 360,000Grant -EUR 90,000
20002003
To help the rural people to improve their living conditions and to raise their income; a credit system is developed to fi nance local cultivation, production and trading. To provide banking services to the rural areas
To assist the development of savings and loan systems suitable for the lower economy society through cooperative units in the villages and other cooperative and small entrepreneurs groups ; To assist the improvement of the income and welfare of the weak economy society through productive business venture development
Philippines
ASHI Cordaid Grant -EUR 90,915Loan -EUR 511,007Grant -EUR 60,835
200020052005
Adapted fi nancial services are delivered in an effi cient sustainable way and integrated in a holistic approach to reduce poverty and livelihood insecurity
CARD Cordaid Loan -EUR 612,900Grant -EUR 88,332Loan -EUR 475,562
(+grant 47,500)Loan - EUR 26,556
(+grant 22,300)
200520051999
2000
Aim to abate poverty among depressed communities in regions IV and V. Vision: to start a bank for and by landless rural women. Vision revised in 1999 to: CARD is a group of mutually reinforcing institutions, dedicated to the ultimate empowerment of the poor. In 1989 fi rst tests were done for group lending, adjusting the Grameen model to the Philippines situation. CARD was the fi rst microfi nance activity to transform into a bank. In 1997 bank licence was obtained and subsequently 4 o/o 13 branches were transformed into CARD Rural Bank (from CARD NGO). By 2009 further formalisation should take place, CARD rural bank into CARD development bank, CARD NGO into CARD NGO microfi nance.

100 Joint Evaluation of the Contribution of CFAs to the Microfi nance Sector, 2003-2007
Name of the partner
Partner CFA(s) in Nl
Financial Intermediary Involved (if any)
Type(s) and amount of support provided
First year of co-operation Description Partner
It states that the original focus, a bank for, owned and managed by landless rural women, has been unaltered.
EBI Oxfam Loan -EUR 300,000Loan -EUR 500,000
20062007
To provide credit to local business and to contribute to local economic development.Rural bank with a wide range of banking services - savings, loans, remittances in tie up with Western Union, payment services for health insurance companies and social security system. The bank as per law can provide fi nancial services except insurance.
KPS Seed Cordaid Grant -EUR 59,040Loan -EUR 200,000
20042005
Saving and fi nance systems, childcare, gender, landownership and rights. Vision: poverty-free communities living in solidarity and dignity.
Life Bank Cordaid Loan -EUR 205,000Grant -
?2004
Regular bank providing fi nancial services - loans, savingsStrategic, ecologically and social responsible banking. Poverty alleviation and sustainable development.
MCPI Cordaid, ICCO
Grant -EUR 202,932Grant -NLG 308,480
20062001
In 2005 -06 strategic business plan was formulated including vision, mission and objectives and thrust areas. The thrust areas are fi ve including advocacy for enabling policy environment, promoting and adopting international performance standards, building a knowledge centre for mF best practices, promoting innovations in fi nancial products, promoting use of impact assessment tools including on social performance.Promote adoption of standards; promote expansion of formal mF market; facilitate access to training and mutual assistance of members, create forum to generate ideas from the roots, mobilize resources and network with government

101Annex 4: List of Partners in the sample
Name of the partner
Partner CFA(s) in Nl
Financial Intermediary Involved (if any)
Type(s) and amount of support provided
First year of co-operation Description Partner
MILAMDEC ICCO Oikocredit Guarantee -EUR 76,483 2007 Provide fi nancial services to large number of poor people with institutional sustainabilityCordaid Loan -EUR 144,000
Grant -EUR 55,36920042005
PALFSI ICCO Oikocredit Guarantee -EUR 344,000Grant -EUR 80,000
20032006
It is a pro poor foundation aiming at human development in the local church of Sorsogon. Aim is to increase income of household by 25%. Main activities are fi nancial services and training.
PEF Cordaid Grant -EUR 70,696 2007 To provide fi nancial, managerial, technical and policy assistances to NGOs, peopleís organisations, community associations, social entrepreneurs etc.Financing of loans to MFIs and micro enterprises in Mindanao
Natcco ICCO Oikocredit Grant -EUR 234,016Loan -313,480
2006 Training and educational services to primary cooperativesMulti-service national cooperative federation (biggest and strongest nat federation): develop coops into viable fi n. Institutions; integrate coops to enhance their capacity to serve members; consolidate resources centrallyVarious support services to MFIs such as capacity building, coaching, monitoring
Cordaid Grant -EUR 255,234 2006
ERCOF Oxfam Grant -EUR 20,062 2007 One area of work is to build the awareness among overseas workers and their families to save and use the remittances in a planned manner‘Establishing links and fi nancial services between Philippine rural banks and overseas Filipinos and their family networks’
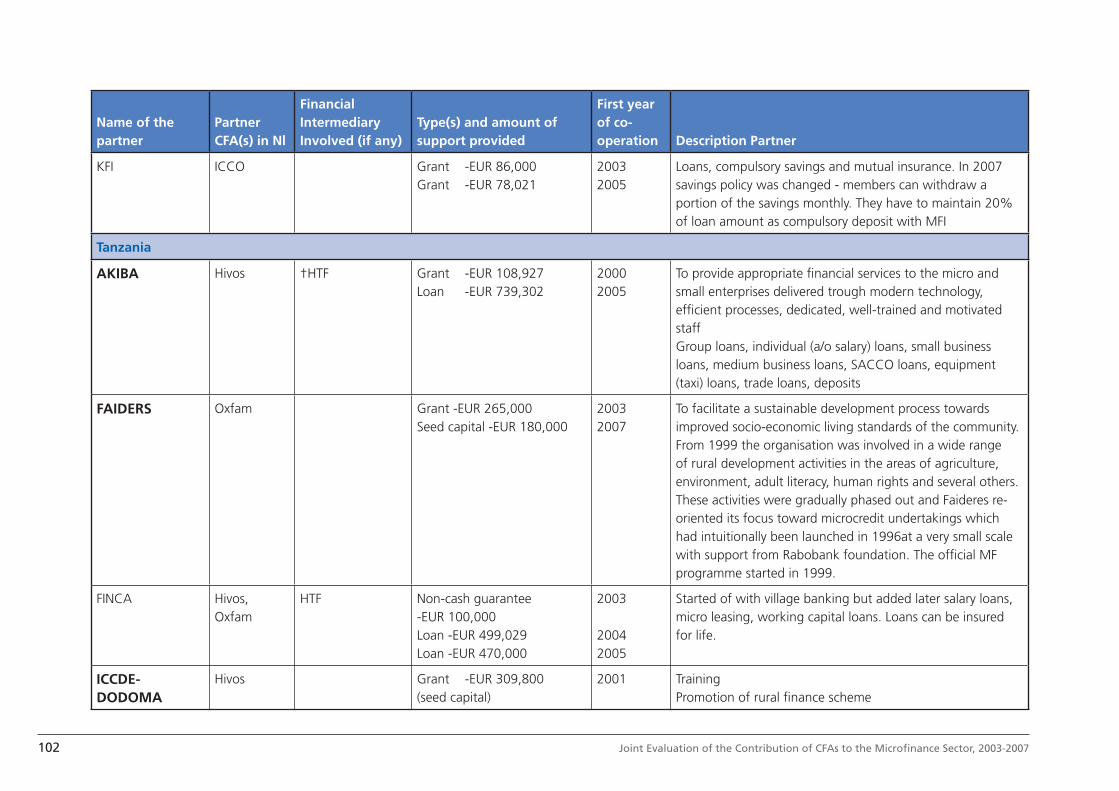
102 Joint Evaluation of the Contribution of CFAs to the Microfi nance Sector, 2003-2007
Name of the partner
Partner CFA(s) in Nl
Financial Intermediary Involved (if any)
Type(s) and amount of support provided
First year of co-operation Description Partner
KFI ICCO Grant -EUR 86,000Grant -EUR 78,021
20032005
Loans, compulsory savings and mutual insurance. In 2007 savings policy was changed - members can withdraw a portion of the savings monthly. They have to maintain 20% of loan amount as compulsory deposit with MFI
Tanzania
AKIBA Hivos †HTF Grant -EUR 108,927Loan -EUR 739,302
20002005
To provide appropriate fi nancial services to the micro and small enterprises delivered trough modern technology, effi cient processes, dedicated, well-trained and motivated staffGroup loans, individual (a/o salary) loans, small business loans, medium business loans, SACCO loans, equipment (taxi) loans, trade loans, deposits
FAIDERS Oxfam Grant -EUR 265,000Seed capital -EUR 180,000
20032007
To facilitate a sustainable development process towards improved socio-economic living standards of the community.From 1999 the organisation was involved in a wide range of rural development activities in the areas of agriculture, environment, adult literacy, human rights and several others. These activities were gradually phased out and Faideres re-oriented its focus toward microcredit undertakings which had intuitionally been launched in 1996at a very small scale with support from Rabobank foundation. The offi cial MF programme started in 1999.
FINCA Hivos, Oxfam
HTF Non-cash guarantee -EUR 100,000Loan -EUR 499,029Loan -EUR 470,000
2003
20042005
Started of with village banking but added later salary loans, micro leasing, working capital loans. Loans can be insured for life.
ICCDE-DODOMA
Hivos Grant -EUR 309,800 (seed capital)
2001 TrainingPromotion of rural fi nance scheme
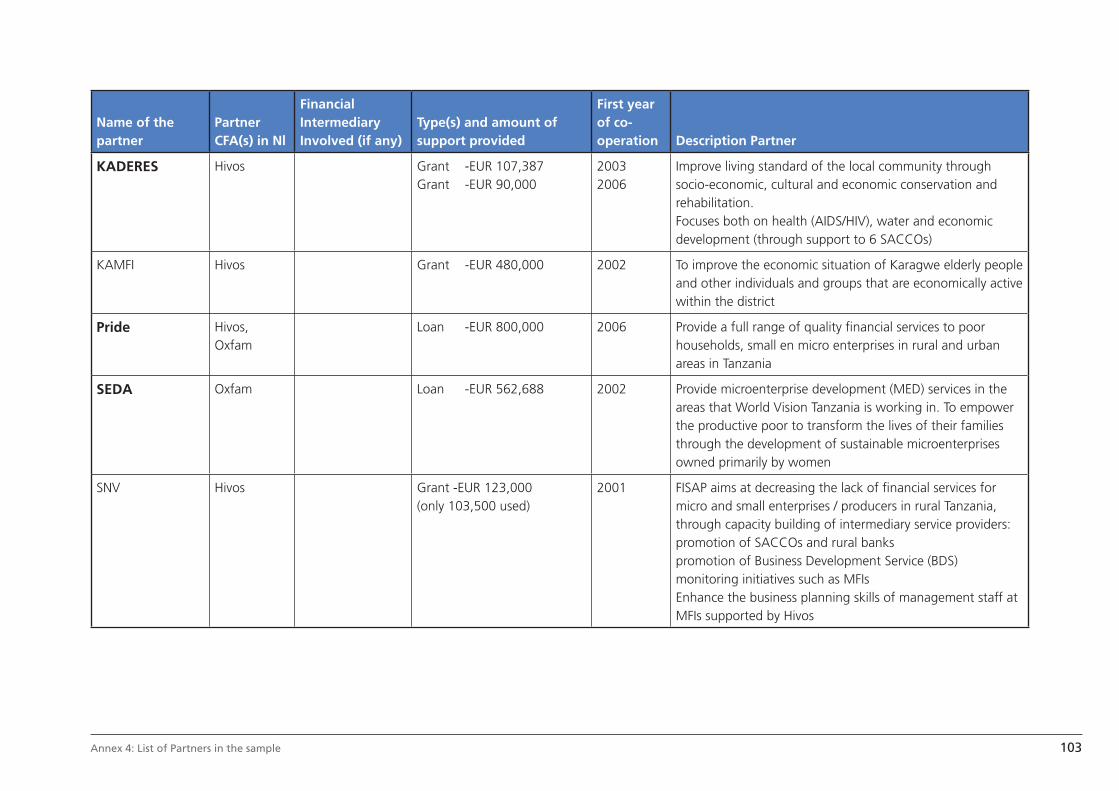
103Annex 4: List of Partners in the sample
Name of the partner
Partner CFA(s) in Nl
Financial Intermediary Involved (if any)
Type(s) and amount of support provided
First year of co-operation Description Partner
KADERES Hivos Grant -EUR 107,387Grant -EUR 90,000
20032006
Improve living standard of the local community through socio-economic, cultural and economic conservation and rehabilitation.Focuses both on health (AIDS/HIV), water and economic development (through support to 6 SACCOs)
KAMFI Hivos Grant -EUR 480,000 2002 To improve the economic situation of Karagwe elderly people and other individuals and groups that are economically active within the district
Pride Hivos, Oxfam
Loan -EUR 800,000 2006 Provide a full range of quality fi nancial services to poor households, small en micro enterprises in rural and urban areas in Tanzania
SEDA Oxfam Loan -EUR 562,688 2002 Provide microenterprise development (MED) services in the areas that World Vision Tanzania is working in. To empower the productive poor to transform the lives of their families through the development of sustainable microenterprises owned primarily by women
SNV Hivos Grant -EUR 123,000 (only 103,500 used)
2001 FISAP aims at decreasing the lack of fi nancial services for micro and small enterprises / producers in rural Tanzania, through capacity building of intermediary service providers:promotion of SACCOs and rural bankspromotion of Business Development Service (BDS)monitoring initiatives such as MFIsEnhance the business planning skills of management staff at MFIs supported by Hivos

104 Joint Evaluation of the Contribution of CFAs to the Microfi nance Sector, 2003-2007
Annex 5: Lists of People Interviewed
Surname Name Organisation Position
Abachi Norbert Oxfam Novib Programme offi cer Ethiopia
Abdissa Mezu Busaa Gonofaa Credit offi cer
Abdulla Kelifa Self-Help Development International
Project manager SACCO development
Alemu Sisay Busaa Gonofaa Credit offi cer
Alemu Muluneh National Bank of Ethiopia
MFI Supervisory Department
Alip Annie CARD Research Director
Alip Aristotle CARD MRI Managing Director
Allegre Doña Victoria FONDECO Client of FONDECO, Yapacani branch, retail seller of toys and offi ce material
Almario Joselito NCC Bureau Director
Almonte Carmen ASHI Ex-Offi cio Board Member- Member Rep
Alvarez Cossio Juan F. FIE FFP Manager, Internal Audit
Amare Sisay Debit Credit and Saving Institution
Head saving division
Amoronio Ed Sta. Catalina MPC General Manager
Arago Hermie ASHI Curriculum Development Manager
Arguedas Zaballos
Wilson ProMujer Bolivia Internal Auditor
Arzaga Jose Jessie ASHI Operations Manager
Arze Montes de Oca
José PRODEM National Credits deputy manger
Asfaw Zegeye Busaa Gonofaa Chairman Board
Assefa Kebede Eshet General manager
Athmer Gabrielle Consultant social performance management
Ayano Korme Busaa Gonofaa Credit offi cer
Bacani Senen PEF Board Member, Finance Committee Member
Baldeo Cynthia CARD Bank AVP
Bamenya Juma Mwanza region SACA
Chairman and member of the Board
Bant Astrid Oxfam Head Latin America & Caribbean department
Becerra José CASA General Manager
Bedada Abdissa Busaa Gonofaa Credit offi cer
Bekele Adissu Eshet Supervisor rural facilities

105 Annex 5: Lists of People Interviewed
Surname Name Organisation Position
Bekele Merga Centre International de Développement et de Recherche
Project offi cer
Belarmino Pauline CARD Partnership Manager Trainee
Bellott Arnez Hugo ProMujer Bolivia Commercial Manager
Berg, van den Steef RNE 1st Secretary
Berhanu Wibishet Self-Help Development International
Executive manager
Billegas Don Celeste Ecofuturo Individual credit client, land owner and agricultural entrepreneur
Bunker Gavin ASHI MIS Consultant
Byamungo Christian FAIDERS CEO
Calayan Raul NATCCO Group Head, Treasury, Credit and Cash Management Group
Calim Doprosi ASHI Board Member- Member Rep.
Callizaya Sabina FIE FFP Regional Manager, Cochabamba
Cavarrubias Don Juan, husband of Bertha
CASA Client, CASA Montero Branch
Celoza Deserie ASHI Social Protection Offi cer
Chambille Karel Hivos 21 years w/ Hivos, 3 yrs Policy offi cer in evaluation
Choque Doña Gladys CASA Client, CASA Montero Branch
Christiaanse Ben NMB CEO
Colque Felix Ecofuturo Individual credit client, promoter and teacher of an Evangelical school
Cretecio Dolores PEF Manager, Paglaum Consolidated MPC
Cruz Marco Ecofuturo Branch manager, San Julian.
Cuellar Costas Franz FONDECO Collection Manager (national level)
Damula Kumssa Eshet Credit offi cer
Dawat May CARD MBA Chief Finance Offi cer
Dawit Kibre Africa Village Financial Service
General manager
Dequito Aristeo BDSFI Chief Executive Offi cer
Dessu Desalegn Africa Village Financial Service
Loan offi cer
Dimamay Wilfredo NATCCO COO
Dinko Molash Africa Village Financial Service
Loan offi cer
Diva, Sr. Ulysses C. PEF MP3 Program Coordinator
Mark Doesburgh, van Triple Jump
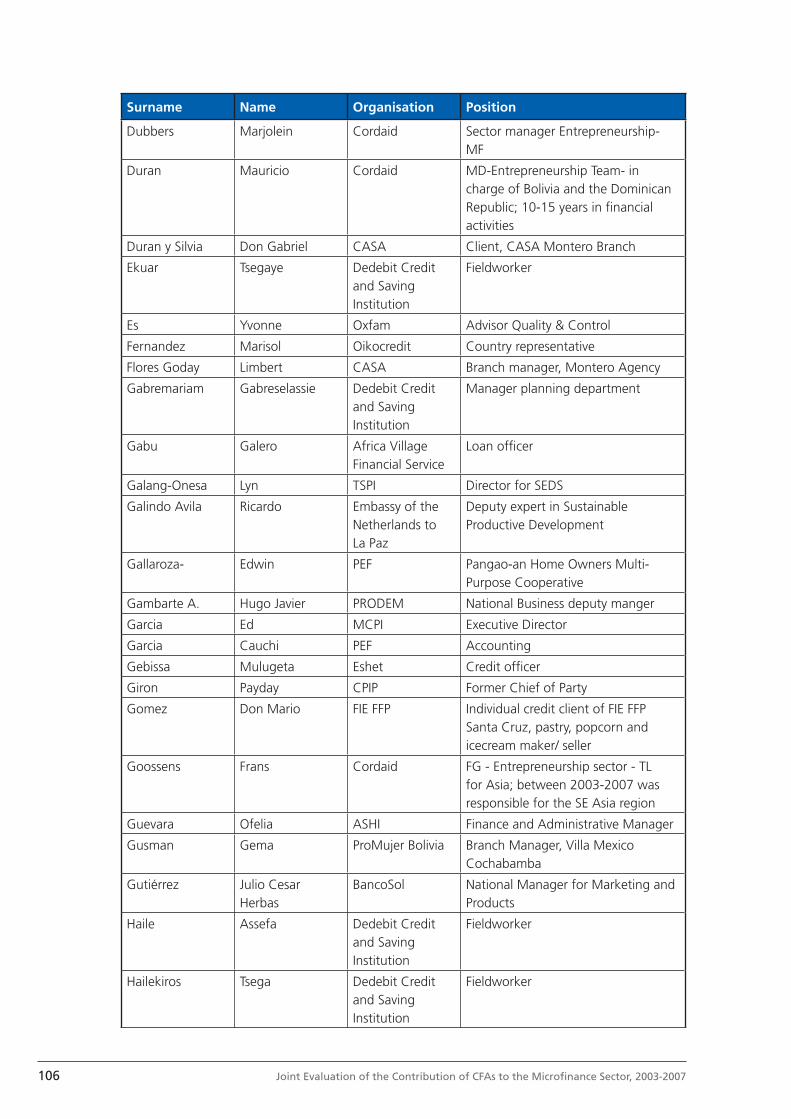
106 Joint Evaluation of the Contribution of CFAs to the Microfi nance Sector, 2003-2007
Surname Name Organisation Position
Dubbers Marjolein Cordaid Sector manager Entrepreneurship- MF
Duran Mauricio Cordaid MD-Entrepreneurship Team- in charge of Bolivia and the Dominican Republic; 10-15 years in fi nancial activities
Duran y Silvia Don Gabriel CASA Client, CASA Montero Branch
Ekuar Tsegaye Dedebit Credit and Saving Institution
Fieldworker
Es Yvonne Oxfam Advisor Quality & Control
Fernandez Marisol Oikocredit Country representative
Flores Goday Limbert CASA Branch manager, Montero Agency
Gabremariam Gabreselassie Dedebit Credit and Saving Institution
Manager planning department
Gabu Galero Africa Village Financial Service
Loan offi cer
Galang-Onesa Lyn TSPI Director for SEDS
Galindo Avila Ricardo Embassy of the Netherlands to La Paz
Deputy expert in Sustainable Productive Development
Gallaroza- Edwin PEF Pangao-an Home Owners Multi-Purpose Cooperative
Gambarte A. Hugo Javier PRODEM National Business deputy manger
Garcia Ed MCPI Executive Director
Garcia Cauchi PEF Accounting
Gebissa Mulugeta Eshet Credit offi cer
Giron Payday CPIP Former Chief of Party
Gomez Don Mario FIE FFP Individual credit client of FIE FFP Santa Cruz, pastry, popcorn and icecream maker/ seller
Goossens Frans Cordaid FG - Entrepreneurship sector - TL for Asia; between 2003-2007 was responsible for the SE Asia region
Guevara Ofelia ASHI Finance and Administrative Manager
Gusman Gema ProMujer Bolivia Branch Manager, Villa Mexico Cochabamba
Gutiérrez Julio Cesar Herbas
BancoSol National Manager for Marketing and Products
Haile Assefa Dedebit Credit and Saving Institution
Fieldworker
Hailekiros Tsega Dedebit Credit and Saving Institution
Fieldworker
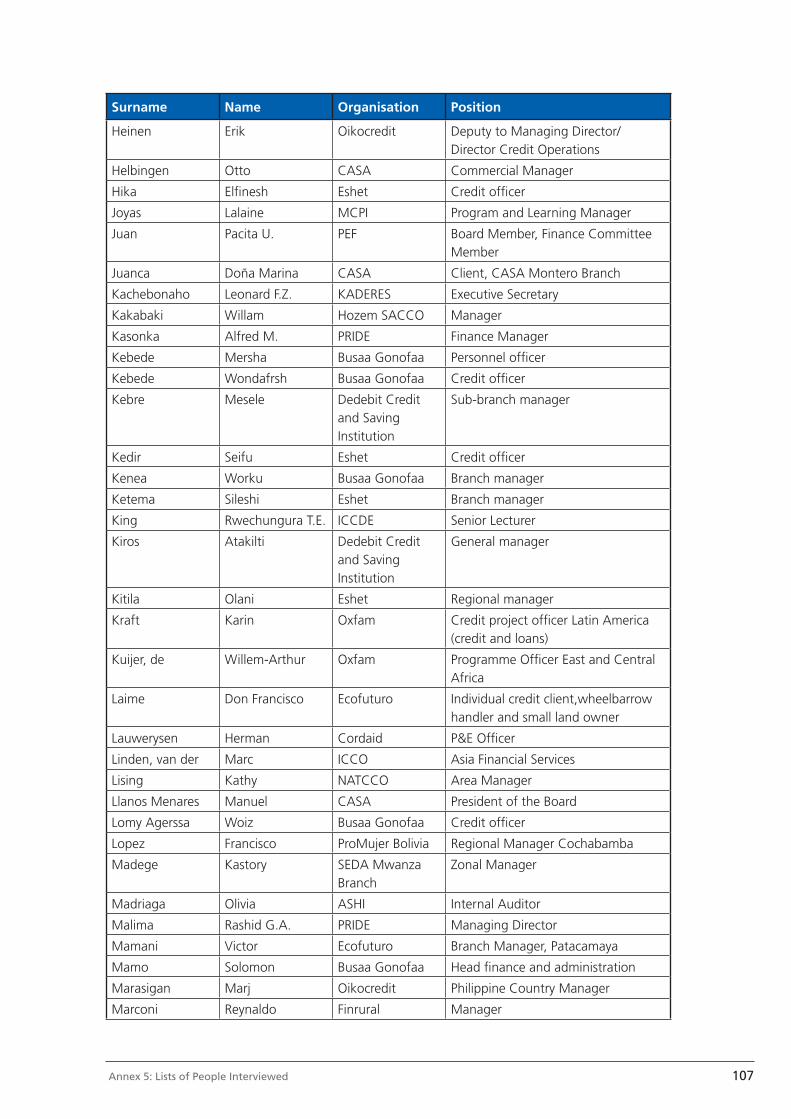
107 Annex 5: Lists of People Interviewed
Surname Name Organisation Position
Heinen Erik Oikocredit Deputy to Managing Director/ Director Credit Operations
Helbingen Otto CASA Commercial Manager
Hika Elfi nesh Eshet Credit offi cer
Joyas Lalaine MCPI Program and Learning Manager
Juan Pacita U. PEF Board Member, Finance Committee Member
Juanca Doña Marina CASA Client, CASA Montero Branch
Kachebonaho Leonard F.Z. KADERES Executive Secretary
Kakabaki Willam Hozem SACCO Manager
Kasonka Alfred M. PRIDE Finance Manager
Kebede Mersha Busaa Gonofaa Personnel offi cer
Kebede Wondafrsh Busaa Gonofaa Credit offi cer
Kebre Mesele Dedebit Credit and Saving Institution
Sub-branch manager
Kedir Seifu Eshet Credit offi cer
Kenea Worku Busaa Gonofaa Branch manager
Ketema Sileshi Eshet Branch manager
King Rwechungura T.E. ICCDE Senior Lecturer
Kiros Atakilti Dedebit Credit and Saving Institution
General manager
Kitila Olani Eshet Regional manager
Kraft Karin Oxfam Credit project offi cer Latin America (credit and loans)
Kuijer, de Willem-Arthur Oxfam Programme Offi cer East and Central Africa
Laime Don Francisco Ecofuturo Individual credit client,wheelbarrow handler and small land owner
Lauwerysen Herman Cordaid P&E Offi cer
Linden, van der Marc ICCO Asia Financial Services
Lising Kathy NATCCO Area Manager
Llanos Menares Manuel CASA President of the Board
Lomy Agerssa Woiz Busaa Gonofaa Credit offi cer
Lopez Francisco ProMujer Bolivia Regional Manager Cochabamba
Madege Kastory SEDA Mwanza Branch
Zonal Manager
Madriaga Olivia ASHI Internal Auditor
Malima Rashid G.A. PRIDE Managing Director
Mamani Victor Ecofuturo Branch Manager, Patacamaya
Mamo Solomon Busaa Gonofaa Head fi nance and administration
Marasigan Marj Oikocredit Philippine Country Manager
Marconi Reynaldo Finrural Manager

108 Joint Evaluation of the Contribution of CFAs to the Microfi nance Sector, 2003-2007
Surname Name Organisation Position
Maregn Kibkab Africa Village Financial Service
Loan offi cer
Mashera, Thaddeo W. SEDA Executive Director
Masias Doña Margarida and Don Ermelehildo Garcia
Ecofuturo Individual credit client, peanut / beens trader and her husband
Medina Ludy CARD Research Technical Manager
Mejia Cristina FONDECO Village banking offi cer, Buena Vista
Melanio Jenerose Sta. Catalina MPC MICOOP Branch Manager
Meles Behailu Busaa Gonofaa Credit offi cer
Mendez Vaca Milena FONDECO Casheers, Buena Vista
Mensink Mariel ICCO MM-Terrafi na, Rural fi nance team coordination
Mensink Mariel ICCO-Terrafi na Programme offi cer
Mercado-Bunker Mila ASHI President
Michael Esther Client PRIDE Shop owner in Arusha
Millan Larry ECLOF Executive Director
Mlugu Joelly Hozem SACCO Chairperson
Mol Caroline Hivos programme offi cer in sustainable economic development (focus on Central Asia)
Molijn Bruno Oxfam Novib Policy Advisor Microfi nance in Bureau R&D
Mompó Fernando Ecofuturo General Manager
Morrell Geraline Sta. Catalina MPC Branch Supervisor
Moscoso de Zimmerman
Maria Eugenia FONDECO General Director
Mulder Arjen Oxfam Policy adviser Quality & Control
Mulsi Tsegaye Eshet Credit offi cer
Muralihar A. ACB General Manager Commerce
Nava Salinas Roxana FIE FFP Regional Manager Santa Cruz
Navarro Enrique CMDI Institute Director
Ndambala Harry J. Bank of Tanzania Dept. Director Microfi nance Institutions Department
Nijkamp Ben ICCO BN-Coordinator Financial Services
Nijland Erik Hivos head of Sustainable Ec. Dev Bureau, 8 years with Hivos of which 5 on the Lat. Am Desk
Nijland Henk FMO Manager Massif & Capacity Development Africa
Noë Sacha Oxfam Programme Offi cer Middle-East, Caucasus
Noel Zamora José PRODEM General Manager
Ntuyabaliwe Shimimana PRIDE Gen. Mgr & Head of Oper. & Bus. Dvt
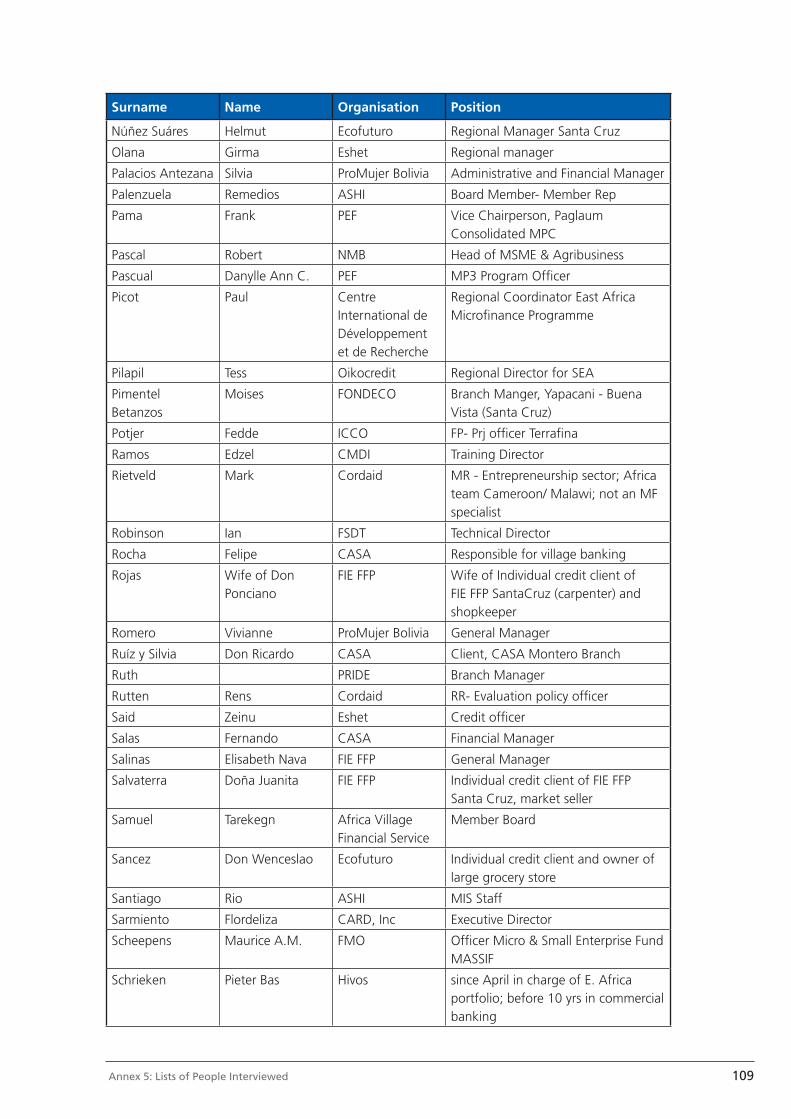
109 Annex 5: Lists of People Interviewed
Surname Name Organisation Position
Núñez Suáres Helmut Ecofuturo Regional Manager Santa Cruz
Olana Girma Eshet Regional manager
Palacios Antezana Silvia ProMujer Bolivia Administrative and Financial Manager
Palenzuela Remedios ASHI Board Member- Member Rep
Pama Frank PEF Vice Chairperson, Paglaum Consolidated MPC
Pascal Robert NMB Head of MSME & Agribusiness
Pascual Danylle Ann C. PEF MP3 Program Offi cer
Picot Paul Centre International de Développement et de Recherche
Regional Coordinator East Africa Microfi nance Programme
Pilapil Tess Oikocredit Regional Director for SEA
Pimentel Betanzos
Moises FONDECO Branch Manger, Yapacani - Buena Vista (Santa Cruz)
Potjer Fedde ICCO FP- Prj offi cer Terrafi na
Ramos Edzel CMDI Training Director
Rietveld Mark Cordaid MR - Entrepreneurship sector; Africa team Cameroon/ Malawi; not an MF specialist
Robinson Ian FSDT Technical Director
Rocha Felipe CASA Responsible for village banking
Rojas Wife of Don Ponciano
FIE FFP Wife of Individual credit client of FIE FFP SantaCruz (carpenter) and shopkeeper
Romero Vivianne ProMujer Bolivia General Manager
Ruíz y Silvia Don Ricardo CASA Client, CASA Montero Branch
Ruth PRIDE Branch Manager
Rutten Rens Cordaid RR- Evaluation policy offi cer
Said Zeinu Eshet Credit offi cer
Salas Fernando CASA Financial Manager
Salinas Elisabeth Nava FIE FFP General Manager
Salvaterra Doña Juanita FIE FFP Individual credit client of FIE FFP Santa Cruz, market seller
Samuel Tarekegn Africa Village Financial Service
Member Board
Sancez Don Wenceslao Ecofuturo Individual credit client and owner of large grocery store
Santiago Rio ASHI MIS Staff
Sarmiento Flordeliza CARD, Inc Executive Director
Scheepens Maurice A.M. FMO Offi cer Micro & Small Enterprise Fund MASSIF
Schrieken Pieter Bas Hivos since April in charge of E. Africa portfolio; before 10 yrs in commercial banking
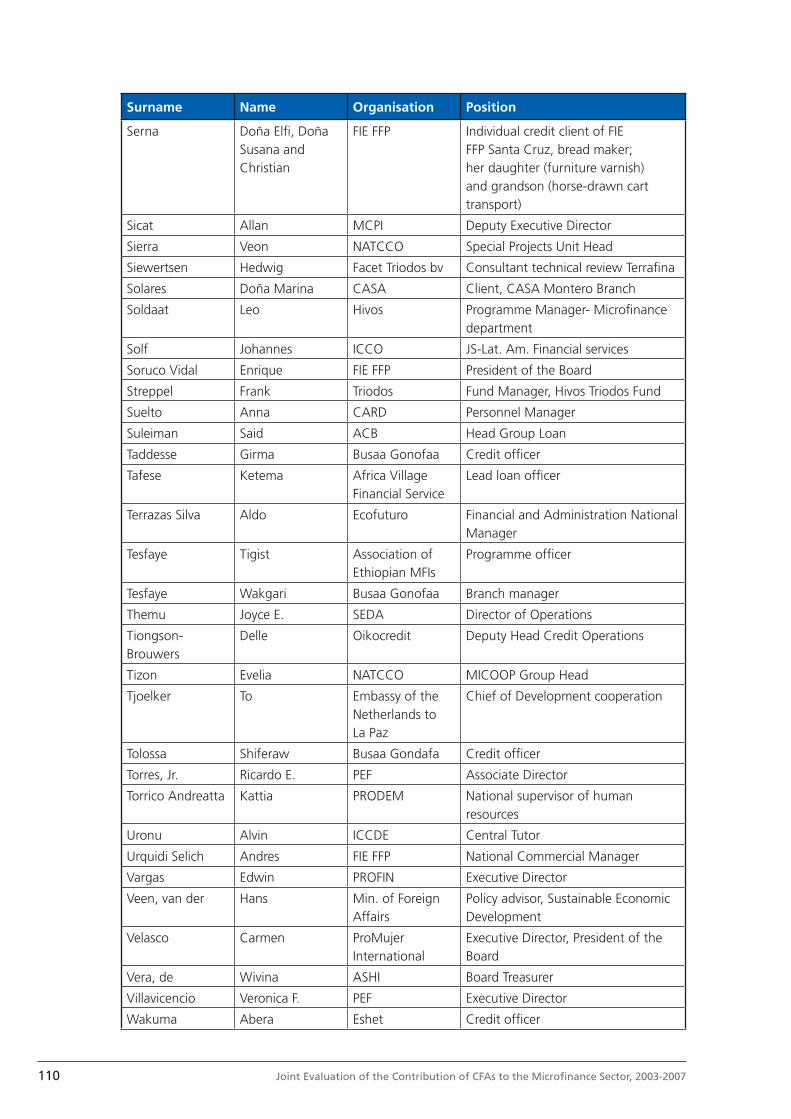
110 Joint Evaluation of the Contribution of CFAs to the Microfi nance Sector, 2003-2007
Surname Name Organisation Position
Serna Doña Elfi , Doña Susana and Christian
FIE FFP Individual credit client of FIE FFP Santa Cruz, bread maker; her daughter (furniture varnish) and grandson (horse-drawn cart transport)
Sicat Allan MCPI Deputy Executive Director
Sierra Veon NATCCO Special Projects Unit Head
Siewertsen Hedwig Facet Triodos bv Consultant technical review Terrafi na
Solares Doña Marina CASA Client, CASA Montero Branch
Soldaat Leo Hivos Programme Manager- Microfi nance department
Solf Johannes ICCO JS-Lat. Am. Financial services
Soruco Vidal Enrique FIE FFP President of the Board
Streppel Frank Triodos Fund Manager, Hivos Triodos Fund
Suelto Anna CARD Personnel Manager
Suleiman Said ACB Head Group Loan
Taddesse Girma Busaa Gonofaa Credit offi cer
Tafese Ketema Africa Village Financial Service
Lead loan offi cer
Terrazas Silva Aldo Ecofuturo Financial and Administration National Manager
Tesfaye Tigist Association of Ethiopian MFIs
Programme offi cer
Tesfaye Wakgari Busaa Gonofaa Branch manager
Themu Joyce E. SEDA Director of Operations
Tiongson-Brouwers
Delle Oikocredit Deputy Head Credit Operations
Tizon Evelia NATCCO MICOOP Group Head
Tjoelker To Embassy of the Netherlands to La Paz
Chief of Development cooperation
Tolossa Shiferaw Busaa Gondafa Credit offi cer
Torres, Jr. Ricardo E. PEF Associate Director
Torrico Andreatta Kattia PRODEM National supervisor of human resources
Uronu Alvin ICCDE Central Tutor
Urquidi Selich Andres FIE FFP National Commercial Manager
Vargas Edwin PROFIN Executive Director
Veen, van der Hans Min. of Foreign Affairs
Policy advisor, Sustainable Economic Development
Velasco Carmen ProMujer International
Executive Director, President of the Board
Vera, de Wivina ASHI Board Treasurer
Villavicencio Veronica F. PEF Executive Director
Wakuma Abera Eshet Credit offi cer
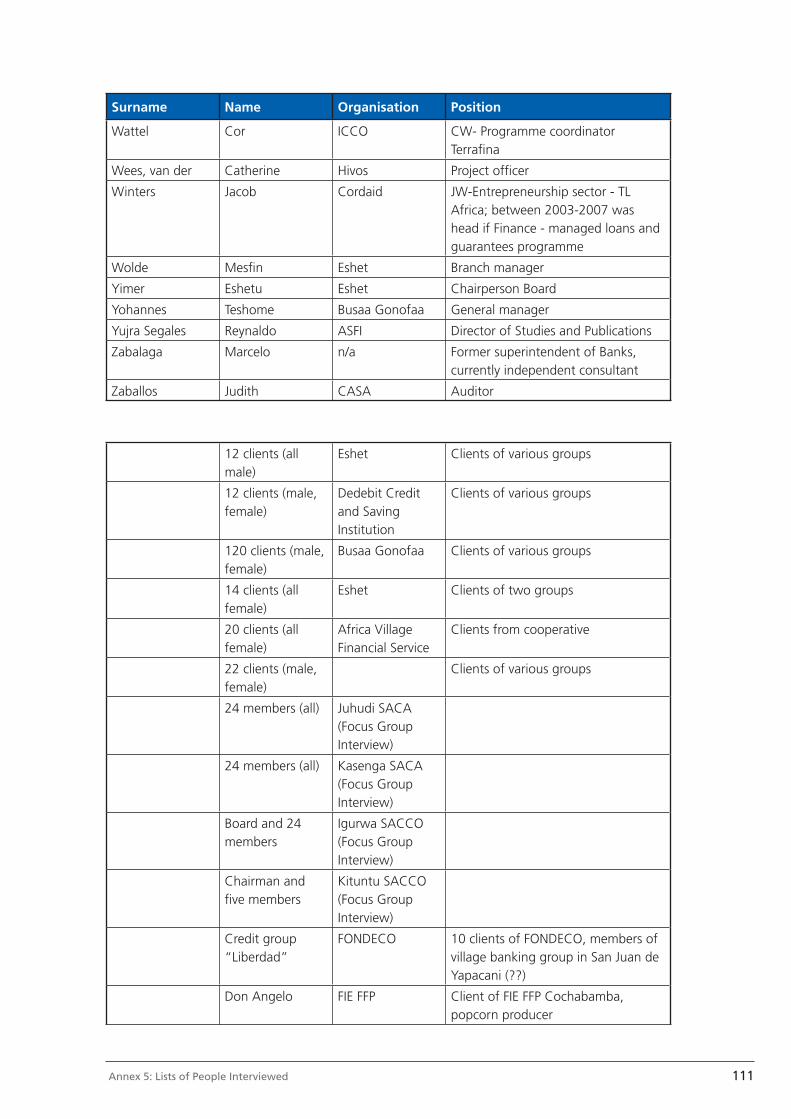
111 Annex 5: Lists of People Interviewed
Surname Name Organisation Position
Wattel Cor ICCO CW- Programme coordinator Terrafi na
Wees, van der Catherine Hivos Project offi cer
Winters Jacob Cordaid JW-Entrepreneurship sector - TL Africa; between 2003-2007 was head if Finance - managed loans and guarantees programme
Wolde Mesfi n Eshet Branch manager
Yimer Eshetu Eshet Chairperson Board
Yohannes Teshome Busaa Gonofaa General manager
Yujra Segales Reynaldo ASFI Director of Studies and Publications
Zabalaga Marcelo n/a Former superintendent of Banks, currently independent consultant
Zaballos Judith CASA Auditor
The following persons did not provide business cards
12 clients (all male)
Eshet Clients of various groups
12 clients (male, female)
Dedebit Credit and Saving Institution
Clients of various groups
120 clients (male, female)
Busaa Gonofaa Clients of various groups
14 clients (all female)
Eshet Clients of two groups
20 clients (all female)
Africa Village Financial Service
Clients from cooperative
22 clients (male, female)
Clients of various groups
24 members (all) Juhudi SACA (Focus Group Interview)
24 members (all) Kasenga SACA (Focus Group Interview)
Board and 24 members
Igurwa SACCO (Focus Group Interview)
Chairman and fi ve members
Kituntu SACCO (Focus Group Interview)
Credit group “Liberdad”
FONDECO 10 clients of FONDECO, members of village banking group in San Juan de Yapacani (??)
Don Angelo FIE FFP Client of FIE FFP Cochabamba, popcorn producer

112 Joint Evaluation of the Contribution of CFAs to the Microfi nance Sector, 2003-2007
Surname Name Organisation Position
Don Eulogio Ecofuturo Mechanic
Don Juan Ecofuturo Business man
Don Julian Ecofuturo Farmer
Don Salomon Ecofuturo Owner of copy shop
Doña Dominga Ecofuturo Farmer
Doña Herminia and Doña Lidia of the “Rositas fuertes” group from Moliemoli
ProMujer Bolivia Clients ProMujer, Villa Mexico Branch, Cochabamba
Doña Sabina FIE FFP Client of FIE FFP Cochabamba, noodles producer in Sacaba
Doña Sandy FONDECO Client of FONDECO, Yapacani branch, seller of cloth and accessories
Eduardo FONDECO Individual credit offi cer, Buena Vista
Entire staff FAIDERS (Focus Group Interview)
Esposo de Doña Domitilla
Ecofuturo Farmer
Government Co-operative Offi cer
Karagwe district
Javier Ecofuturo President of the Board
Juan Carlos ProMujer Bolivia Internal Auditor
Sabine Hivos project offi cer
Seven clients CARD BDSFI
Three women of the group “Pucara Grande” fromTamborada
ProMujer Bolivia Clients ProMujer, Villa Mexico Branch in Cochabamba
Yohannis Rural Financial Intermediation programme
113Annex 6: Literature consulted
Annex 6: Literature consulted
Abrams and Von Stauffenberg Micro Capital, 2007.
Adams, Dale W. & Pischke, J.D. von, “Microenterprise Programs: Déjà vu”, World Development 20(10), pp. 1463-70, 1992.
Alem, Julio; Sergio Antezana (2009). Diagnostico de cobertura de servicios fi nancieros ylínea base para el programa MIF BID. La Paz: PROFIN.
Alex Borchgrevink, Jo Helle-Valle and Tassew Woldehanna, 2003. Impact study of DedebitCredit and Saving Institution (DECSI), Tigray, Ethiopia. Norwegian Institute of International Affairs and Norsk. Overview of results is given in Wolday Amha, 2008;
Alex Borchgrevink, Tassew Woldehanna, Gebrehiwot Ageba and Woldeab Teshome, 2005. Marginalised groups, credit and empowerment: the case of DECSI of Tigray, Ethiopia. Norwegian People’s Aid and AEMFI. AEMFI Occasional paper no, 14.
Amare Dejen, Tadesse Kassaye, Fatuma Hassen and Tsegaye Anebo, 2009. The impact of HIV-AIDS on microfi nance. AEMFI Occasional paper no.25
Annual plans Oxfam Novib 2003, 2004 and 2006;
Armendariz de Aghion, B. and Morduch, J. The Economics of Microfi nance The MIT Press: Cambridge, MA. 2005.
Athmer, A. & Vletter de, F. “Poverty Outreach and impact assessment study in Mozambique of three partner institutions of members of the Netherlands Platform for Microfi nance”, October, 2006.
AVFS Business Plan 2008-2012;
Barr‘s, I. “Effi ciency” MIX, Microbanking Bulletin, 14, Spring 2007.
Beyond the mirror, April 2002. Lessons learned from the self-evaluation concerning the ICCO loan and guarantee policy
Bhatt, N. & Tang, S. “Delivering Microfi nance in Developing Countries: Controversies and Policy Perspective”, Policy Studies Organisation, 2001.
Business Plan 2005-2007 (draft). Eshet, October 2005;
Capra, Guido (2007). La Economía Boliviana. La Paz: Capra.
CARD Annual Report 2008;
CGAP .“Funding Microfi nance technology” Donor brief, 2005.
CGAP “Assessing the relative poverty level of clients, CGAP poverty assessment tool”, 2003. available online at: http://www.cgap.org/gm/document-1.9.2978/TechnicalTool_05_overview.pdf
114 Joint Evaluation of the Contribution of CFAs to the Microfi nance Sector, 2003-2007
CGAP “Developing Deposit Services for the Poor: Preliminary Guidance for Donors”, Draft April 2002.
CGAP “Good Practice Guidelines for Funders of Microfi nance”, October, 2006.
CGAP “Working with savings and credit co operatives”, Donor brief, 25, August 2005.
CGAP and Central Bank for West Africa. “Determining the Outreach of Senegalese MFIs”, Washington, D.C., CGAP, 2004; “CGAP Focus Note, no. 21” (Washington, D.C., CGAP, 2001, quoted in Brigit Helms, Access for All: Building Inclusive Financial Systems, Washington, D.C., CGAP, 2006.
CGAP working group on micro insurance. “Preliminary donor guidelines for supporting micro insurance”, Draft, October 2003.
CGAP. “Beyond good intentions: measuring the social performance of Microfi nance institutions” CGAP focus note 41, May 2007.
CGAP. “The CGAP IT innovations series”, 2003.
CGAP. “Who Are the Clients of Microfi nance?” currently available online athttp://www.cgap.org/p/site/c/template.rc/1.26.1304.
Cheston, S. & Reed, L. “Measuring Transformation: Assessing and Improving the Impact of Microcredit”, Microcredit Summit Meeting of Councils: Adibjan, Cote d’Ivoire, 1999.
Christen, R.P. “Banking Services for the Poor: Managing for Financial Success (An Expanded and Revised Guidebook for Microfi nance Institutions)”, ACCION International, 1997.
Christen, R.P. “Commercialisation and Mission Drift. The Transformation of Microfi nance in Latin America”, CGAP Occasional Paper #5, Washington DC, 2001.
Christen, R.P., Rhyne, E., Vogel, R.C. & McKean, C. “Maximising the Outreach of Microenterprise Finance: An Analysis of Successful Microfi nance Programs”, USAID Programme and Operations Assessment Report, 10, Washington, DC, USAID, 1995.
Christen, R.P., Rosenberg, R. & Jayadeva, V. “Financial institutions with a “double bottom line”: implications for the future of Microfi nance”, Occasional Paper No. 08, 2004. available online at http://Microfi nancegateway.org/resource_centers/savings/library/_summary_christen.
Churchill, C. “Is Micro insurance a Priority for the Poor? Understanding the Demand for Risk-managing Financial Services”, 2003.
CIDR, 2005. Feasibility study report of the implementation of a rural participative microfi nance scheme in Arsi and Bale zone the Oromiya region. CIDR/Ethiopia/Microfi nance/MFTSC/no.2;
CIDR, 2005. Feasibility study report of the implementation of a rural participative microfi nance scheme in Jimma zone of the Oromiya region. CIDR/Ethiopia/Microfi nance/MFTSC/no.3.
115Annex 6: Literature consulted
CIDR, April 2002. Participative Microfi nance development Project in Ethiopia. Project proposal;
Coady International Institute. “Reaching the hard to reach, Comparative study of member owned fi nancial institutions in remote rural areas”, June 2008.
Conning. “Outreach, Sustainability and Leverage in Monitored and Peer-Monitored lending, Journal of Development Economics, 1999.
Cordaid partners’ consultation workshop Manilla Philippines, 17-21 November 2008
Cordaid: Access to markets policy paper 2003-2006, October 2003
Cordaid: Finance Business Unit, 2004 (brochure)
Cordaid: Financing start-up and emerging MFIs: the Cordaid approach, 2007 (policy paper)
Cordaid: Investing in the poor; linking Microfi nance to social investors, 2005 (brochure)
Cordaid: Jaarverslag 2007
Cordaid: Loans and Guarantees programme, 2006 (annual report)
Cordaid: Policy Framework Microfi nance Programme, July 2008
Cordaid: Post-Tsunami reconstruction of livelihood: when to intervene with credit. Cordaid’s experience of post-Tsunami credit in India, Sri Lanka and Indonesia, 2008
Cordaid: Procedures Donaties, February 2007
Cordaid: Procedures Leningen en Garanties, February 2007
Cordaid: Summary report on Cordaid’s support to wholesale facilities, 2008 (by Triodos Facet)
Cordaid: Walk that extra mile, Cordaid Strategy Paper 2007-2010
Dagnew Gesese, 2009. Assessment study on SHDI-Terrafi na supported saving and credit cooperative unions (draft).
DECSI, 2004. Global proposal submitted to Oxfam-Novib;
DECSI, May 2007. Counterpart and project description;
Dichter, T.W. “Despite good intentions, why development assistance to the Third World has failed”, January, 2003.
Draft report on pilot testing of poverty score and intake card. Busaa Gonofaa, August 2007.
Dunford, C. “Evidence of Microfi nance’s Contribution to Achieving the Millennium Development Goals” November 2006.

116 Joint Evaluation of the Contribution of CFAs to the Microfi nance Sector, 2003-2007
Dunford, C. “What’s Wrong with Loan Size?” Freedom from Hunger Publication, 2002. Available online at http://www.ffhtechnical.org/publications/summary/loansize0302.html.
Elser L., Hannig, A. & Wisniwski, S. “Comparative analysis of savings mobilisation strategies”, Eschborn, 1999.
Eshet briefi ng sheet on progress in the microfi nance innovation fund. Eshet, October 2006.
Ethiopia Demographic and Health Survey 2005. Central Statistical Agency Addis Ababa, Ethiopia, 2006;
Ethiopia Microfi nance Country Scan, commissioned by Oxfam-Novib to Rhino Consult BV and AEMFI in 2006;
Experiences with AVFS, Busaa Gonofaa and SFPI in 2005 by Joost de la Rive Box;
Finrural, 2004, Dossier de estadísticas micro fi nancieras, La Paz: Finrural
Foose, L. “Microfi nance Social Performance Standards and Social Rating Services”, Social Performance Task Force, June 19, 2008 Paris.
Frank et al. “Stemming the tide of mission drift: Microfi nance transformations and the double bottom line”, 2008.
FUNDA PRO, 1998, Foro de Micro fi nanzas. Serie Crédito No 2. El desarrollo de las microfi nanzas, La Paz: FUNDA PRO.
Gabrielle Athmer, 2008. An inventory of policies, practices and challenges regarding support to rural (micro) fi nance among Netherlands’ Microned members. Rural Finance Group of Microned
Gaul S.and Tazi H. “Benchmarking Asian Micro Finance 2006”, a MIX Market report, December, 2006.
Gebrehiwot Ageba, 2006. Mainstreaming microfi nance institutions in food and income security. Oxfam-Novib in collaboration with AEMFI. AEMFI Occasional paper no.16
Getachew Olana, Report on study for promotion of use of peasant farm technologies and practices. Wasasa, February 2007.
Gibbons, D.S. and Meehan, J.W. “The Microcredit1 Summit’s Challenge: Working Towards Institutional Financial Self-Suffi ciency while Maintaining a Commitment to Serving the Poorest Families”, Updated June 2000.
Goldberg, N. “Measuring the Impact of Microfi nance: Taking Stock of What We Know”, Grameen Foundation USA Publication Series, 2005. Available online at http://www.gfusa.org/pubdownload/dl.php?pubID=29.
117Annex 6: Literature consulted
Gonzalez, A. “Effi ciency Drivers of Microfi nance Institutions (MFIs): The Case of operating Costs”, MIX Microbanking Bulletin, 15, Autumn 2007.
Gonzalez, A. “International Comparisons of Loan Balances per Borrower”, Micro Banking Bulletin, Issue 16, Spring 2008.
Goodwin-Groen, R. “Learning from the Progress of Seven Microfi nance Deposit-Taking Institutions from 1996-2003”, CGAP, 2006.
Grameen Foundation. “100 impact studies”, USA, 2005.
Harper, M. “Farm Credit and Microfi nance - Is There a Critical Mismatch?”, Small Enterprise Development, 16(3), 2005.
Hatch, J.K. & Frederick, L. “Poverty assessment by MFIs; a review of current practice” “FINCA International, Development Alternatives, Inc.”, August 1998.
Hege, G. “The two approaches to Microfi nance - poverty reduction vs. institutions approach, Microfi nance and poverty, questioning the conventional wisdom”, 1998. Available online at: http://idbdocs.iadb.org/wsdocs/getdocument.aspx?docnum=913778.
Hirschland, M. “Savings Operations for Very Small or Remote Depositors: Some Strategies”, Sussex: Institute of Development Studies at the University of Sussex, 2003.
Hivos / HTF Tanzania Country Strategy Paper Microfi nance
Hivos: Civil voices on a global stage, 2002 (policy paper)
Hivos: Hivos and Microfi nance, 2007 (policy paper)
Hivos: HTF Country strategy papers, 2007 (interim evaluation)
Hivos: Partner policy, 2004
Hivos: People unlimited, 2007 (Hivos Business plan 2007-2010)
Hivos: Seed capital package for fi nancial institutions, February 2001 (policy paper)
Hivos: Sustainable economic development, 2004 (policy document)
Hivos: Women unlimited, policy document gender, women and development, 2006-2010
Hivos-Triodos Fund Foundation: Annual reports 2003-2007
Hivos-Triodos Fund Foundation: Primary selection and rejection, April 2007;Appraisal and approval of applications: HTF procedure, October 2008
Hospes, O. “The support to Microfi nance programmes by Dutch co funding agencies, a synthesis report”, December, 2002.
Hulme, D. & Mosley P. “Finance Against Poverty”, 1, London & New York, Routledge, 1996.

118 Joint Evaluation of the Contribution of CFAs to the Microfi nance Sector, 2003-2007
ICCO Credit Desk: Beyond the Mirror, Learning from 3 years of experience with ICCO’s Loan & Guarantee programme, April 2002
ICCO, Oikocredit and Rabobank Foundation: Business plan for starting up Africa Microfi nance and Rural Entrepreneurship programme, 2005-2007
ICCO: (Be)wegen tot gerechtigheid, 2001-2005 (beleidsplan)
ICCO: (On) the Road to Justice, 2000 (policy document)
ICCO: Agreement for Cooperation between ICCO and Oikocredit, May 2001
ICCO: Alliance Operational Plan 2007-2010
ICCO: Business Plan 2003-2006, April 2002
ICCO: Concept bedrijfsplan voor het thema microfi nanciering, February 2006
ICCO: Fair economic development 2003-2006, April 2003 (policy paper)
ICCO: Financiële diensten in rurale gebieden in Latijns-Amerika 2007-2010, 2007
ICCO: Internal policy document Equity investments, November 2007
ICCO: Microfi nance programme, Department for Asia, Europe and the Pacifi c 2006-2010, May 2006 (5th version)
ICCO: Partnership policy, 2003
ICCO: Policy choices and implementation for the period 2003-2006, June 2003
ICCO: Policy framework for seed capital grants, November 2007
ICCO: Rolverdeling AMREP en ICCO-AFMO, August 2005
ICCO’s niche in microfi nance; exploring the case of Ethiopia. In: ICCO’s niche in microfi nance,feedback from key partners in Bolivia, Ethiopia and the Philippines. Internal working document, January 2004;
ICCO-Oikocredit Guarantee Fund: A new phase of higher scale and outreach, Utrecht, July 2005
IFAD (2007). IFAD Strategic Framework 2007-2010.Rome: International Fund for Agricultural Development.
INAFI-Phils & JJCICSI. “Heeding Poverty, An assessment of Microfi nance in the Philippines”, 2008.
Inception Report 3163. Development of training courses in Microfi nance for the Rural Financial Intermediation Program (RUFIP). FACET Commissioned by AEMFI, 2005

119Annex 6: Literature consulted
Institutional Business Development Plan January 2004-December 2006. AVFS, 2004;
Isern, J., Abrams, J. & Born, M. “Appraisal Guide for Microfi nance Institutions”, resource manual”, March 2008available online at http://www.cgap.org/gm/document-1.9.4394/MFIAppraisalTechnicalGuide.pdf.
Ivatury, G. “Harnessing technology to transform fi nancial services for the poor”, Small Enterprise Development Vol.15 No.4 December 2004.
Ivatury, G. and Mas I. “The Early Experience with Branchless Banking”, CGAP. April, 2008.
Jim Roth & Michael J McCord, 2008, Agricultural micro insurance, global practices and prospects, The Micro Insurance Centre, LLC; 1045 N. Lynndale Drive, Ste. 2A5; Appleton, WI 54914 USA.
Joost de la Rive Box and Amsalu Alemayehu, 2005. Evaluation of Busaa Gonofaa MFI on behalf of ICCO;
Joost de la Rive Box and Hailu Wondrash, 2005. Evaluation of AVFS on behalf of ICCO;
Joost de la Rive Box, 2005. Evaluation of 3 MFIs in Ethiopia (BG-MFI, AVFS and SFPI).Covering note for ICCO;
Joost de la Rive Box, 2009. Terrafi na Innovation Fund programme Ethiopia 2006-2009
Karlan, D. “Is Microfi nance too rigid?”, Yale University, December 2007.
Karlan, D. “Microfi nance Impact Assessments: The Perils of Using New Members as a Control Group”, 2001.
Karnani, A.G. “Employment, not Microcredit, is the Solution”, January, 2007.
Khandker, S.R. “Microfi nance and poverty: evidence using panel data from Bangladesh.”, World Bank Economic Review, 19(2), pp. 263-286, 2005.
Kneiding, C. “Are “upmarket” MFIs really more sustainable?”, July 16, 2008. Available online at http://www.cgap.org/p/site/c/template.rc/1.11.1909/1.26.3004.
Lapenu, C., & Zeller, M. “Distribution, growth, and performance of the Microfi nance institutions in Africa, Asia and Latin America: A recent inventory”, Savings and Development, Vol. 26 (1), pp 87 -111, 2002.
Latortue, A., Glisovic-Mezieres J, and Tsilikounas, C. “Netherlands Peer Review Check-up November 2007”, CGAP, 2008.
Lee, Nancy, Rural Remote Microfi nance and Selfi sh Genes, 2006, http://www.microcreditsummit.org/papers/Workshops/2_Lee.pdf.
Lensink, R., Meesters, A. & Hermes, N. “Outreach and Effi ciency of Microfi nance Institutions: is there a trade-off?” draft, 2007. Available online at: http://www.aiccon.it/File/Lensink.pdf.
120 Joint Evaluation of the Contribution of CFAs to the Microfi nance Sector, 2003-2007
Maas, H. “Hivos Seed Capital Review”, September 2008.
Maes, J. & Foose, L. “Microfi nance Services for Very Poor People: Promising Approaches from the Field And The US Law’s Mandate to Reach Very Poor People: What Strategies are MFIs Developing, and What do they Mean for the Rest of the Field? -A Practitioner Survey” Poverty Outreach Working Group, SEEP Network, July 2006.
Mariel Mensink, 2005. Busaa Gonofaa Summary of Financial projections. Annex A of Voortgangsmemo made as follow-up of Evaluation of Busaa Gonofaa in 2005;
McIntosh, C., de Janvry, A. & Sadoulet, E. “How Rising Competition Among Microfi nance Lenders Affects Incumbent Village Banks”, Economic Journal, October 2005.
MCPI Annual Report 2008;
Mekonnen Kassa, Alemayehu G/Hiwot, Yisehak Mengesha and Haftu Dimtsu, 2007. Development in saving and credit cooperatives in Ethiopia: evolution, performances, challenges and interventions. AEMFI Occasional paper no.19
Memorandum of understanding ICCO, Oikocredit and Rabobank Foundation, 22 December 2005
Micro Banking Bulletin, Issue 18, Spring 2009;
Micro Ned Business Plan 2008-2010
Microcredit summit campaign, 2006.
Microfi nance Industry Assessment, A Report on the Philippines, MCPI, SEEP Network and Citi Foundation, August 2008;
Microfi nance Institutions Performance Analysis reports 2003, 2004, 2005, 2006 and 2007, published by AEMFI as Bulletins 1-5. The information is published on www.mixmarket.org as well
MIcroned, Ethiopia Microfi nance Country Strategy 2008-2010;
Mid Term Review of Rural Financial Intermediation Program. Stakeholders Workshop, Development Bank of Ethiopia, May 2008;
MIX Market. “How Many MFIs and Borrowers Exist?” most recent update 2008, currently available on line http://www.themix.org/publication_detail.aspx?publicationID=275.
MIX. “Trend Lines 2004-06 MFI Benchmarks”, MIX Micro banking Bulletin, 16, spring 2008.
Morduch, J. “The Microfi nance Promise”, Journal of Economic Literature, 37(4), pp 1569-1614, 1999.
121Annex 6: Literature consulted
Morduch, J., Hashemi, S. & Littlefi eld, E. “Is Microfi nance an Effective Strategy to Reach the Millennium Development Goals?” “CGAP Focus Note 24”, 2003. Available online at http://www.cgap.org/docs/FocusNote_24.html#top.
MP3 (Mindanao Partnership Project for Peace) Protocol;
MP3 Narrative Report and Indicators on Outreach, as of 31 December 2007;
MP3 Social Rating Scorecard, By Partner;
Nagarajan, Geetha and Richard Meyer, 2005, Rural Finance, recent advances and emerging lessons, debates and opportunities, Reformatted version of Working Paper No. (AEDE-WP-0041-05), Department of Agricultural, Environmental, and Development Economics, The Ohio State University (Columbus, Ohio, USA).
NATCCO 2008 Annual Report;
National Bank of Ethiopia. Examination reports Busaa Gonofaa, Eshet and AVFS.
Novib Stappenplan 2003-2006 and Business Plan 2003-2006;
Olivares-Polanco, F. “Commercialising Microfi nance and Deepening Outreach? Empirical Evidence from Latin America”, 2004. Available online at: http://www.Microfi nancegateway.org/content/article/detail/20249.
Oxfam Novib: Annual plans of the Regional Bureaus 2004-2006
Oxfam Novib: Business Plan 2007-2010
Oxfam Novib: Microfi nance Global Thematic program, 2004
Oxfam-Novib: Contracten van Financiële Diensten Eenheid 2003-2007
Paxton J. “Contrasting Methodologies Used to Expand the Outreach of Financial Services to the Rural Poor: Lessons from Mexico’s PATMIR Experience”, International Conference on Rural Finance Research: Moving Results into Policies and Practice, 19-21 March 2007, FAO Headquarters, Rome, Italy.
Paxton, J. & Cuevas, C. “Outreach and Sustainability of Member-Based Rural Financial Intermediaries”, The Triangle of Microfi nance: Financial Sustainability, Outreach and Impact, The Johns Hopkins University Press, 2002.
PEF Philippine Provincial Poverty Indicators;
Pischke, J.D. von, “Finance at the Frontier Debt Capacity and the Role of Credit in the Private Economy”, EDI Development Studies, Washington, D.C. The World Bank, 1991
Planet Rating, 2007. Girafe Rating for AVFS, July 2007 and Social Rating for AVFS, August 2007;

122 Joint Evaluation of the Contribution of CFAs to the Microfi nance Sector, 2003-2007
Planet Rating, 2007. Girafe Rating for Busaa Gonofaa, July 2007 and Social Rating for Busaa Gonofaa, July 2007;
PWC. “Double yields in Micro Finance”, September 2008.
Quality Audit Tool Report (QAT) Report on CARD MRI 2008;
Rhyne, E. “A New View of Finance Programme Evaluation”, The New World of Microenterprise Finance, Otero, Maria and Rhyne, Elisabeth (Ed.), 1994.
Rhyne, E. “The Yin and Yang of Microfi nance: Reaching the Poor and Sustainability”, MIX Micro banking Bulletin, 2, 1998.
Robinson, M. & Wright G.A.N. “Micro Save Briefi ng Note # 3: Mobilising Savings”, Micro Save, June 2001. Available at: http://www.Microfi nancegateway.org/fi les/22077_BN03_Mobilising_Savings.pdf.
Roth, J., McCord, M.J., Liber D. “The Landscape of Micro insurance in the World’s 100 Poorest Countries” available online at: http://www.microinsurancecentre.org/UploadDocuments/Landscape%20study%20paper.pdf.
RUFIP in collaboration with AEMFI, 2003. Training needs assessment of the microfi nance industry in Ethiopia. AEMFI Occasional paper no.9
Rutherford, S. “CMN meeting with Stuart Rutherford”, Polo wane, August 28, 2004. Available online at http://www.cmfnet.org.za/Polokwane.htm.
Rutherford, S. “The Poor and their Money: An Essay about Financial Services for Poor People”, Institute for Development Policy and Management, January 1999, pp. 13-30.†
Schreiner, M. “Aspects of Outreach: A Framework for the Discussion of the Social Benefi ts of Microfi nance”, June 2002. Available online at: http://www.Microfi nance.com/English/Papers/Aspects_of_Outreach.pdf.
Schreiner, M. “Seven Aspects of Loan Size.” Journal of Microfi nance, 3(2), pp. 27-47, 2001. Available online at http://www.Microfi nance.com/English/Papers/Aspects_of_Loan_Size.pdf.
Sebstad, J. and Cohen, M. “Microfi nance, Risk Management and Poverty”. USAID-AIMS. 2000. available online at http://www.microlinks.org/ev02.php?ID=7239_201&ID2=DO_TOPIC
Seed capital package policy for Microned members, May 2008
SEEP Network. “Social Performance Progress Brief”, March 2007, 1(3).
SHDI, December 2005. Strategic Plan Self-Help Ethiopia, pp.2-3;
Simanowitz, A. “Commercialising Microfi nance and deepening outreach? Empirical evidencefrom Latin America”, 2001.

123Annex 6: Literature consulted
Simanowitz, A. “Ensuring Impact: Reaching the Poorest While Building Financially Self-Suffi cient Institutions, and Showing Improvement in the Lives of the Poorest Families.”, available online at: http://www.microcreditsummit.org/papers/chapter1.html.
Simanowitz, A., Nkuna B and Kasim S. “Overcoming the obstacles of identifying the poorest families”, Updated June 2000 by Anton Simanowitz. Available online at http://www.microcreditsummit.org/papers/povertypaperH.pdf.
Simple Poverty Scorecard for the Philippines, Grameen Foundation USA, Mark Schreiner, February 2009 (www.progressoutofpoverty.org);
Simple Social Rating on ASHI by MicroFinanza, September 2008;
Social Performance Audit of CMEDFI, March 2009.
Stimpsom, D. “Moody’s Investors Service”, Global Credit Analysis, 1992.
Strategic Portfolio Management Plan for 2007-2010
Terrafi na country strategy Ethiopia 2005-2007;
Terrafi na: Microfi nance Operating policy on Microfi nance grants, September 2007
Terrafi na: Microfi nance Policy on capacity building
Terrfi na: Technical Review of Terrafi na Microfi nance Programme, Triodos Facet, early 2009
Teshome Yohannes & Getachew Mekonen, 2008. Moving Towards Management of Social Performance: The Case of Busaa Gonofaa, Ethiopia. International Conference on Microfi nance Development Organized by AEMFI & BGMF, March 24 - 28, 2008, Asosa, Ethiopia;
The Micro fi nance gateway Client targeting Centre online at: http://www.Microfi nancegateway.org/section/resourcecenters/clienttargeting/mfi experiences.
The Philippine Coop Sector Public Policy Paper, May 2009-08-31;
Todd, H. “Women at the Centre”, Dhaka, Bangladesh, University Press Limited, 1996.
Towards the development of an equipment leasing product for AVFS. AVFS, January 2007.
Triodos Facet ‘Tanzania Country Scan Microfi nance’ for Hivos/MicroNed, December 2007.
Triodos Facet. “Additionality of Public Funding in Microfi nance”, 2007 available online at:http://www.Microfi nance.nl/Documents/npm%20report%20-additionality%20in%20public%20funding%20-oct%202007.pdf.
Triodos Facet: Partos portfolio analysis, April 2008, (version 2.2)
Tsehay Tsegaye and Lebesech Tsega, 2009. Situation analysis for gender mainstreaming in microfi nance institutions in Ethiopia. AEMFI (draft)
124 Joint Evaluation of the Contribution of CFAs to the Microfi nance Sector, 2003-2007
Tsehay Tsegaye and Mengistu Bediye, 2002. Impact of microfi nance services among the poor women in Ethiopia. A study submitted to AEMFI
Voting with Their Feet: Why CARD, Inc. Clients are Leaving, CARD Study in 2009;
Wabekbon Development Consultants PLC, 2006. Women empowerment through delivery of microfi nance in Ethiopia. AEMFI Occasional paper no.17
Watson, A.A. & Dunford, C. “From Microfi nance to Macro Change: Integrating Health Education and Microfi nance to Empower Women and Reduce Poverty”, United Nations Population Fund 3333 and Microcredit Summit Campaign. 2006. available online at: http://www.microcreditsummit.org/papers/UNFPA_Advocacy_FINAL.pdf.
Wolday Amha, 2008. A decade of Microfi nance Institutions Development in Ethiopia: growth, performance, impact and prospect (2008-2017). AEMFI Occasional paper no.21
Woller, G. & Woodworth, W. “Microcredit as a Grass-Roots Policy for International Development”, Policy Studies Journal, 29(2), pp 267, 2001.
Woller, G. “Poverty Lending, Financial Self-Suffi ciency, And The Six Aspects Of Outreach”, 2000, Romney Institute of Public Management, Marriott School, Brigham Young University, Provo, Utah, USA.
Wright, G.A.N. “Designing Savings Services for the Poor”, Prepared for the MIX Micro banking Bulletin.
Youth microfi nance initiative; market study and product feasibility. SFPI, October 2007;
Yunus, M. “Does the Capital System Have to Be the Handmaiden of the Rich?” Extracts from the keynote address delivered at 85th Rotary International Convention, June 12-15, 1994, Taipei, Taiwan.
Zabalaga, Marcelo, Rolando Morales, et all (2005). Pobreza y Globalización en América Latina. Estudios de Caso: Bolivia y Nicaragua. Ed. NOVIB, Fundación FORD.
Zeller, M. & Meyer, R.L. “The triangle of Microfi nance: Financial Sustainability, Outreach, and Impact”, 2002.
Zeller, M. “Review of Poverty Assessment Tools”, Report submitted to IRIS and USAID as part of the Developing Poverty Assessment Tools Project, February 6, 2004.

125Annex 7: Operational Performance Data
Annex 7: Operational Performance Data
Table 7.1 Gross Loan Portfolio (in USD)
2003 2004 2005 2006 2007
Bolivia
FADES 17,156,000 18,321,000 18,846,000 20,047,000 22,752,000
FONDECO 6,468,000 6,936,000
ProMujer 7,150,000 11,155,000 13,562,000 21,396,000
CASA 1,097,000 1,473,000 1,967,000 2,006,000
ECOFUTURO 14,235,000 19,065,000 23,870,000 33,245,000
FIE FFP 54,264,000 73,850,000 101,058,000 161,253,000
PRODEM 86,602,000 108,944,000 134,642,000 166,580,000
Benchmark L.A. 2,870,750 3,278,047 3,459,333 4,218,404 4,802,070
Ethiopia
DECSI 23,168,976 46,365,572 77,918,547 85,266,397 118,766,535
Busaa Gonofaa 241,842 246,381 895,251 1,157,892 2,165,529
Eshet 434,151 855,196 1,332,492 2,810,169 3,762,881
AVFS 253,243 385,629 745,051 880,420 1,048,129
Benchmark Africa 695,598 908,454 1,087,924 1,602,317 1,705,386
The Philippines
CARD NGO 6,141,755 6,825,646 8,596,650 16,104,458 33,840,685
ASHI 937,912 1,490,844 1,837,194 3,024,356
KPS Seed 39,966 54,353 158,440 377,999 365,407
NATCCO - - - - 5,294,569
PEF 242,000
Benchmark Asia 961,512 1,117,198 1,206,720 1,427,274 1,804,765
Tanzania
ACB 9,746,846 11,645,398 15,485,337 14,383,780 21,634,808
FAIDERS* 78,413 88,980 173,527
PRIDE 9,303,369 11,094,110 12,738,424 16,365,149 25,309,674
SEDA 1,571,680 1,552,421 1,576,511 2,286,953 2,733,829
Benchmark Africa 695,598 908,454 1,087,924 1,062,317 1,705,386
* This is the amount on-lent by FAIDERS to the SACAs.

126 Joint Evaluation of the Contribution of CFAs to the Microfi nance Sector, 2003-2007
Table 7.2 Number of active borrowers
2003 2004 2005 2006 2007
Bolivia
FADES 21,436 21,405 20,728 20,983 21,784
FONDECO 6,114 6,110 6,167 8,120 8,861
ProMujer 38,380 48,496 64,517 74,106 90,510
CASA 8,036 4,425 4,715 5,365 5,989
ECOFUTURO 8,624 10,440 15,064 11,847 14,309
FIE FFP 31,397 41,888 51,973 64,456 79,553
PRODEM 25,250 56,618 68,792 77,476 85,578
Benchmark L.A. 6,553 6,568 7,051 7,200 7,462
Ethiopia
DECSI 225,996 336,733 419,052 392,693 423,830
Busaa Gonofaa 5,999 5,571 10,117 18,217 26,247
Eshet 6,540 9,728 12,432 23,734 25,638
AVFS 2,866 4,867 5,948 7,739 9,267
Benchmark Africa 4,486 5,861 5,543 5,748 7,094
The Philippines
CARD NGO 74,182 73,065 97,580 159,640 298,875
ASHI 9,219 12,065 11,466 14,360 14,821
KPS Seed 961 1,209 1,276 3,681 2,440
NATCCO* 100,679
PEF - - - - 576
Benchmark Asia 3,966 5,277 5,583 4,775 6,035
Tanzania
ACB 6,936 12,903 15,507 15,531 19,603
FAIDERS* 1,394 1,345 1,446 2,427
ICCDE* 2,401 3,589 4,440 4,989
KADERES* 4,800 9,104 8,332 10,095
PRIDE 62,423 63,359 71,315 89,783 99,258
SEDA 16,264 14,640 14,919 17,577 14,667
Benchmark Africa 4,486 5,861 5,543 5,748 7,094
* Number of members of supported SACCOs etc.
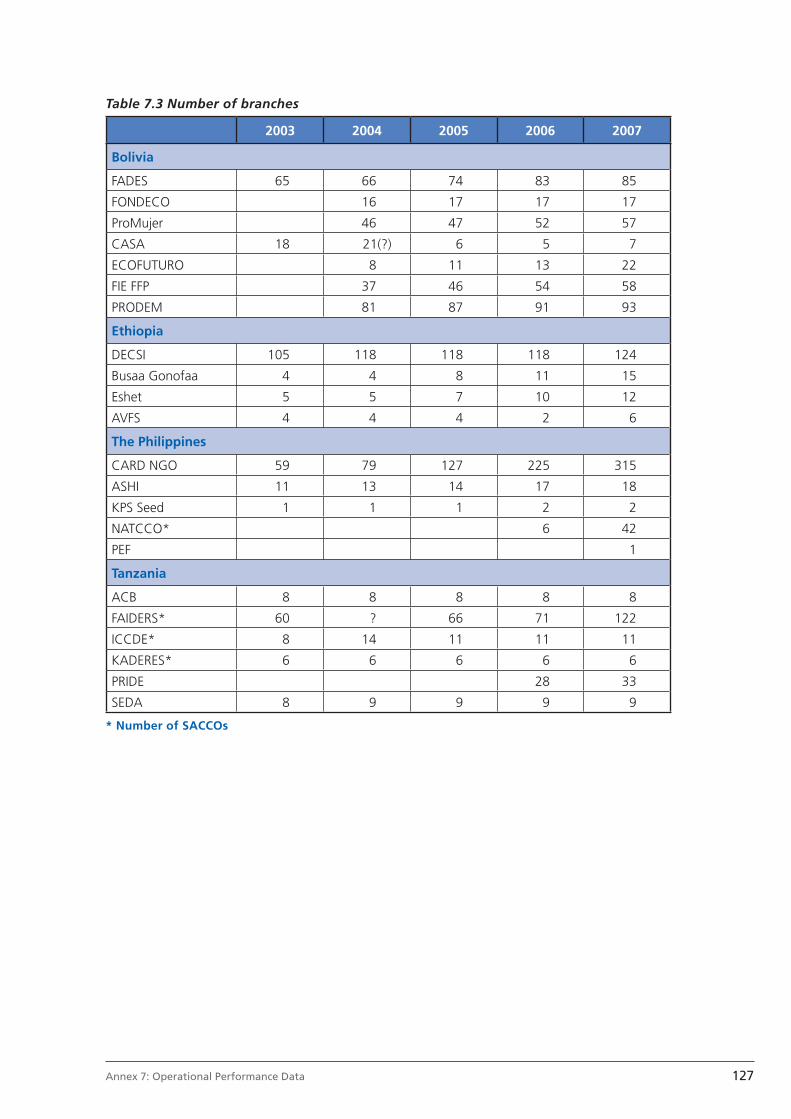
127Annex 7: Operational Performance Data
Table 7.3 Number of branches
2003 2004 2005 2006 2007
Bolivia
FADES 65 66 74 83 85
FONDECO 16 17 17 17
ProMujer 46 47 52 57
CASA 18 21(?) 6 5 7
ECOFUTURO 8 11 13 22
FIE FFP 37 46 54 58
PRODEM 81 87 91 93
Ethiopia
DECSI 105 118 118 118 124
Busaa Gonofaa 4 4 8 11 15
Eshet 5 5 7 10 12
AVFS 4 4 4 2 6
The Philippines
CARD NGO 59 79 127 225 315
ASHI 11 13 14 17 18
KPS Seed 1 1 1 2 2
NATCCO* 6 42
PEF 1
Tanzania
ACB 8 8 8 8 8
FAIDERS* 60 ? 66 71 122
ICCDE* 8 14 11 11 11
KADERES* 6 6 6 6 6
PRIDE 28 33
SEDA 8 9 9 9 9
* Number of SACCOs
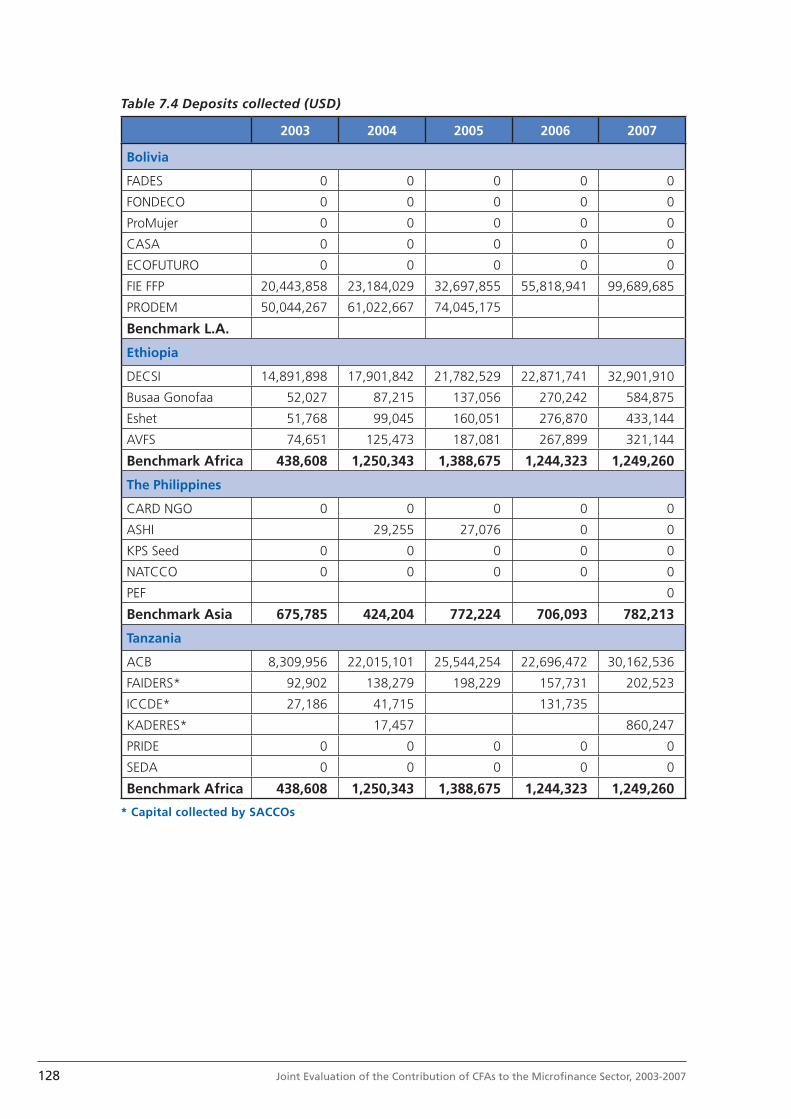
128 Joint Evaluation of the Contribution of CFAs to the Microfi nance Sector, 2003-2007
Table 7.4 Deposits collected (USD)
2003 2004 2005 2006 2007
Bolivia
FADES 0 0 0 0 0
FONDECO 0 0 0 0 0
ProMujer 0 0 0 0 0
CASA 0 0 0 0 0
ECOFUTURO 0 0 0 0 0
FIE FFP 20,443,858 23,184,029 32,697,855 55,818,941 99,689,685
PRODEM 50,044,267 61,022,667 74,045,175
Benchmark L.A.
Ethiopia
DECSI 14,891,898 17,901,842 21,782,529 22,871,741 32,901,910
Busaa Gonofaa 52,027 87,215 137,056 270,242 584,875
Eshet 51,768 99,045 160,051 276,870 433,144
AVFS 74,651 125,473 187,081 267,899 321,144
Benchmark Africa 438,608 1,250,343 1,388,675 1,244,323 1,249,260
The Philippines
CARD NGO 0 0 0 0 0
ASHI 29,255 27,076 0 0
KPS Seed 0 0 0 0 0
NATCCO 0 0 0 0 0
PEF 0
Benchmark Asia 675,785 424,204 772,224 706,093 782,213
Tanzania
ACB 8,309,956 22,015,101 25,544,254 22,696,472 30,162,536
FAIDERS* 92,902 138,279 198,229 157,731 202,523
ICCDE* 27,186 41,715 131,735
KADERES* 17,457 860,247
PRIDE 0 0 0 0 0
SEDA 0 0 0 0 0
Benchmark Africa 438,608 1,250,343 1,388,675 1,244,323 1,249,260
* Capital collected by SACCOs
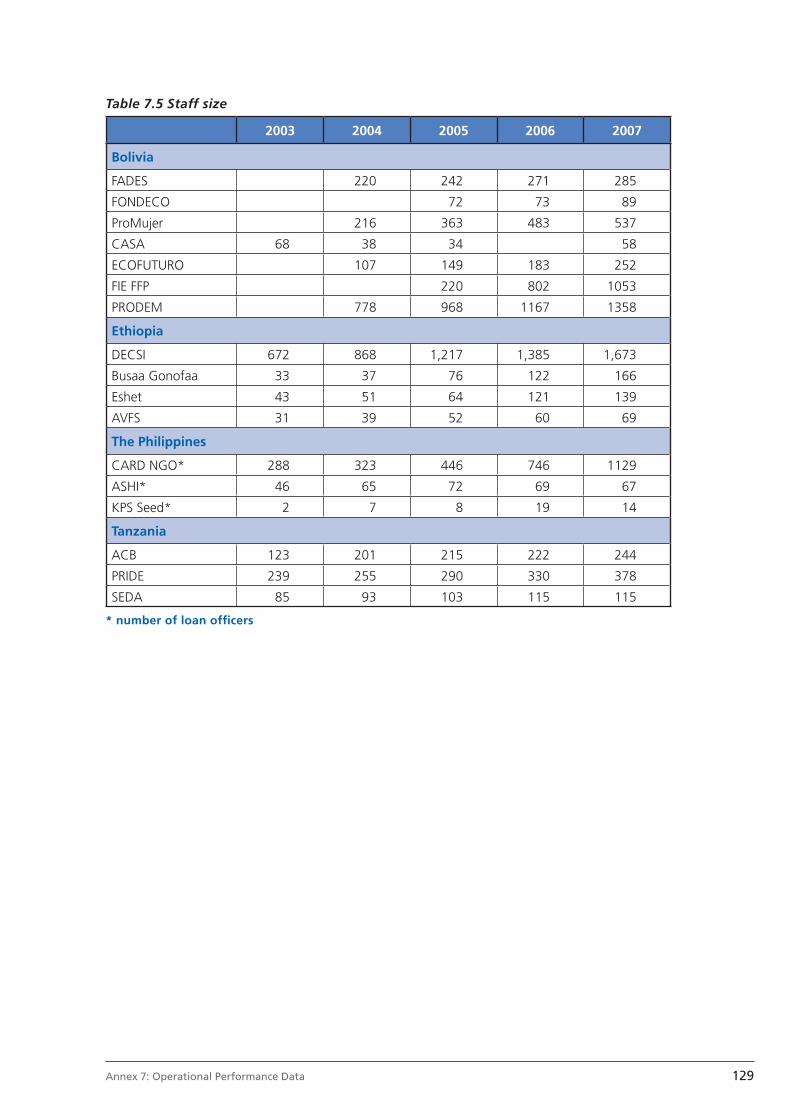
129Annex 7: Operational Performance Data
Table 7.5 Staff size
2003 2004 2005 2006 2007
Bolivia
FADES 220 242 271 285
FONDECO 72 73 89
ProMujer 216 363 483 537
CASA 68 38 34 58
ECOFUTURO 107 149 183 252
FIE FFP 220 802 1053
PRODEM 778 968 1167 1358
Ethiopia
DECSI 672 868 1,217 1,385 1,673
Busaa Gonofaa 33 37 76 122 166
Eshet 43 51 64 121 139
AVFS 31 39 52 60 69
The Philippines
CARD NGO* 288 323 446 746 1129
ASHI* 46 65 72 69 67
KPS Seed* 2 7 8 19 14
Tanzania
ACB 123 201 215 222 244
PRIDE 239 255 290 330 378
SEDA 85 93 103 115 115
* number of loan offi cers

130 Joint Evaluation of the Contribution of CFAs to the Microfi nance Sector, 2003-2007
Table 7.6 Operational Self Suffi ciency, %
2003 2004 2005 2006 2007
Bolivia
FADES 118.66 112.39 122.45 129.65 118.87
FONDECO 118.97 121.50 125.49 120.90 131.78
ProMujer 136.58 113.79 163.03 156.47 143.22
CASA 52.90 57.40 80.30
ECOFUTURO 102.89 111.89 119.42 124.27 127.44
FIE FFP 152.36 148.31 131.77 128.71 134.17
PRODEM 120.15 122.61 124.77 119.66 122.01
Ethiopia
DECSI 180.40 215.60 197.30 193.80 173.40
Busaa Gonofaa 104.10 100.40 76.50 124.50 130.00
Eshet 103.80 155.00 148.00 159.60 105.00
AVFS 91.30 73.20 76.80 86.50 125.90
The Philippines
CARD NGO 130.00 125.00 115.00 127.00 123.00
ASHI 73.00 113.00 119.00 128.00 109.00
KPS Seed 44.00**
Tanzania
ACB 116.80 119.54 117.34 103.30 112.43
FAIDERS 40.00 59.00 61.00 77.00 71.00
KADERES* 226.00 115
PRIDE 122.32 114.86 109.36 103.46 102.93
SEDA 98.44 78.20 67.74 71.16 79.81
* The combined OSS of all supported SACCOs** year 2008
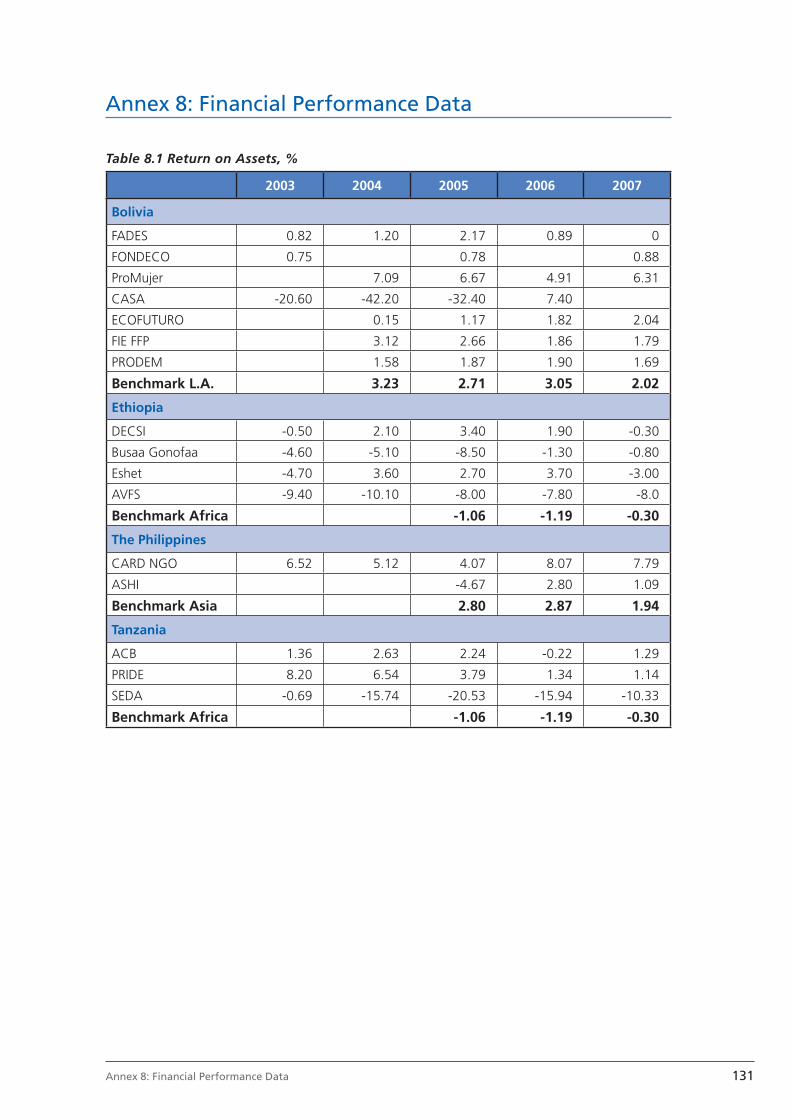
131Annex 8: Financial Performance Data
Annex 8: Financial Performance Data
Table 8.1 Return on Assets, %
2003 2004 2005 2006 2007
Bolivia
FADES 0.82 1.20 2.17 0.89 0
FONDECO 0.75 0.78 0.88
ProMujer 7.09 6.67 4.91 6.31
CASA -20.60 -42.20 -32.40 7.40
ECOFUTURO 0.15 1.17 1.82 2.04
FIE FFP 3.12 2.66 1.86 1.79
PRODEM 1.58 1.87 1.90 1.69
Benchmark L.A. 3.23 2.71 3.05 2.02
Ethiopia
DECSI -0.50 2.10 3.40 1.90 -0.30
Busaa Gonofaa -4.60 -5.10 -8.50 -1.30 -0.80
Eshet -4.70 3.60 2.70 3.70 -3.00
AVFS -9.40 -10.10 -8.00 -7.80 -8.0
Benchmark Africa -1.06 -1.19 -0.30
The Philippines
CARD NGO 6.52 5.12 4.07 8.07 7.79
ASHI -4.67 2.80 1.09
Benchmark Asia 2.80 2.87 1.94
Tanzania
ACB 1.36 2.63 2.24 -0.22 1.29
PRIDE 8.20 6.54 3.79 1.34 1.14
SEDA -0.69 -15.74 -20.53 -15.94 -10.33
Benchmark Africa -1.06 -1.19 -0.30
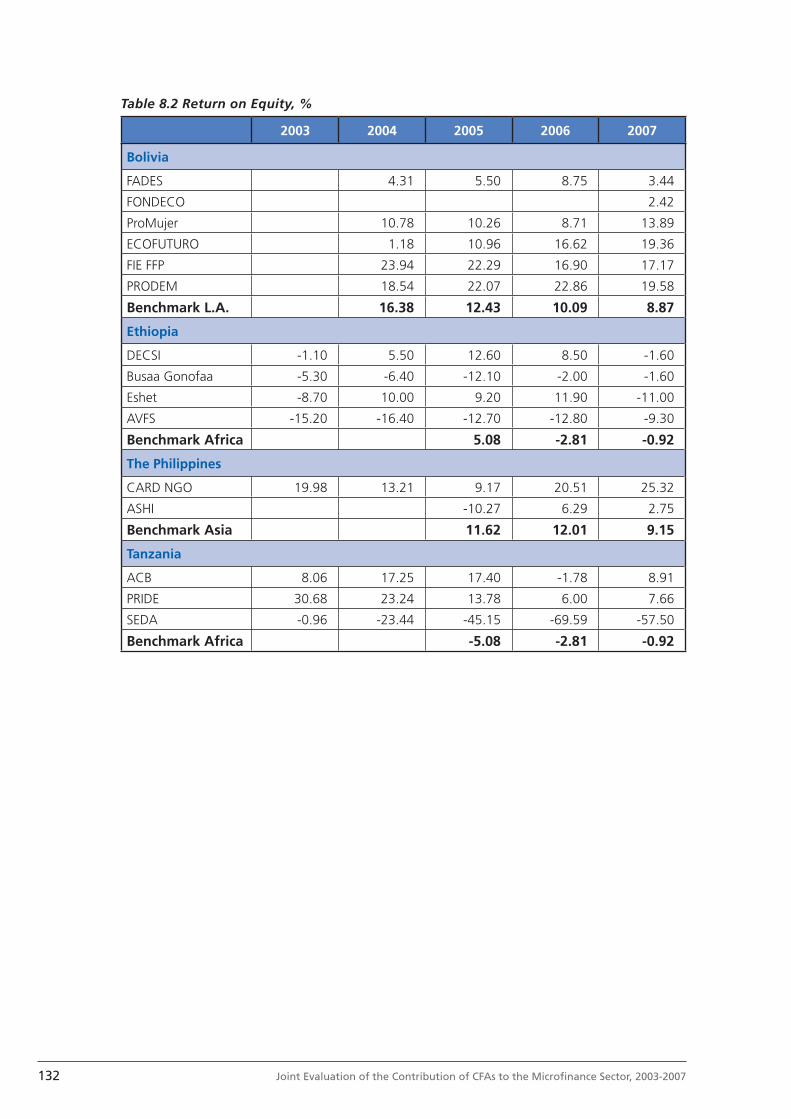
132 Joint Evaluation of the Contribution of CFAs to the Microfi nance Sector, 2003-2007
Table 8.2 Return on Equity, %
2003 2004 2005 2006 2007
Bolivia
FADES 4.31 5.50 8.75 3.44
FONDECO 2.42
ProMujer 10.78 10.26 8.71 13.89
ECOFUTURO 1.18 10.96 16.62 19.36
FIE FFP 23.94 22.29 16.90 17.17
PRODEM 18.54 22.07 22.86 19.58
Benchmark L.A. 16.38 12.43 10.09 8.87
Ethiopia
DECSI -1.10 5.50 12.60 8.50 -1.60
Busaa Gonofaa -5.30 -6.40 -12.10 -2.00 -1.60
Eshet -8.70 10.00 9.20 11.90 -11.00
AVFS -15.20 -16.40 -12.70 -12.80 -9.30
Benchmark Africa 5.08 -2.81 -0.92
The Philippines
CARD NGO 19.98 13.21 9.17 20.51 25.32
ASHI -10.27 6.29 2.75
Benchmark Asia 11.62 12.01 9.15
Tanzania
ACB 8.06 17.25 17.40 -1.78 8.91
PRIDE 30.68 23.24 13.78 6.00 7.66
SEDA -0.96 -23.44 -45.15 -69.59 -57.50
Benchmark Africa -5.08 -2.81 -0.92

133Annex 8: Financial Performance Data
Table 8.3 Financial Self Suffi ciency (FSS), %
2003 2004 2005 2006 2007
Bolivia
FADES 114.00 111.57 114.50 119.29 115.64
FONDECO 117.00 116.56 113.38 117.72 129.55
ProMujer 137.00 113.79 163.03 156.47 143.22
CASA 51.00 57.00 80.20
ECOFUTURO 101.00 108.94 115.08 120.45 124.57
FIE FFP 151.00 146.79 130.61 128.17 133.51
PRODEM 118.00 120.75 122.65 117.39 119.89
Benchmark L.A. 112.91 109.53 111.85 108.69
Ethiopia
DECSI 95.70 125.30 151.40 127.10 96.60
Busaa Gonofaa 86.60 80.20 64.20 94.40 96.90
Eshet 80.80 119.70 117.20 123.00 87.00
AVFS 64.90 63.10 61.90 61.20 74.40
Benchmark Africa 111.62 95.73 100.29 95.84
The Philippines
CARD NGO 123.00 110.00 106.00 108.00 114.00
ASHI 63.00 83.00 91.00 85.00 84.00
Benchmark Asia 110.74 111.98 110.23 106.78
Tanzania
KADERES* 149.00
PRIDE 113.00 109.00
SEDA 89.00 84.00
Benchmark Africa 111.62 95.73 100.29 95.84
* Combined FSS for all supported SACCOs
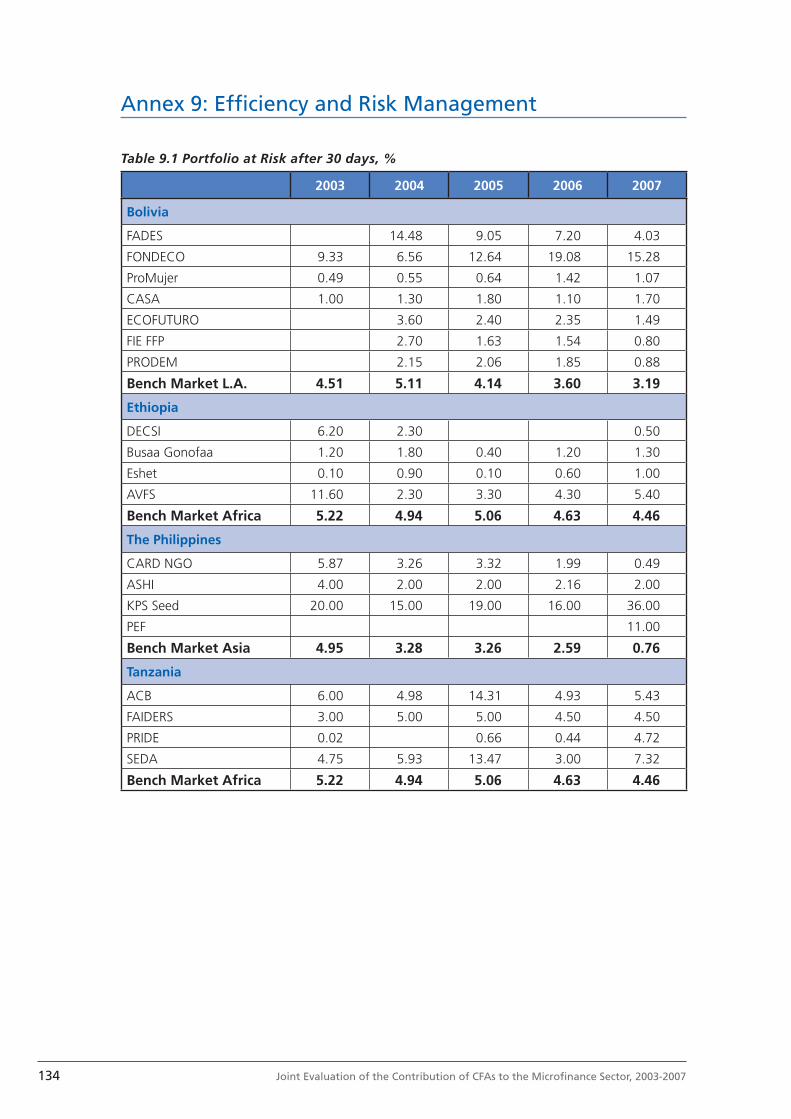
134 Joint Evaluation of the Contribution of CFAs to the Microfi nance Sector, 2003-2007
Annex 9: Effi ciency and Risk Management
Table 9.1 Portfolio at Risk after 30 days, %
2003 2004 2005 2006 2007
Bolivia
FADES 14.48 9.05 7.20 4.03
FONDECO 9.33 6.56 12.64 19.08 15.28
ProMujer 0.49 0.55 0.64 1.42 1.07
CASA 1.00 1.30 1.80 1.10 1.70
ECOFUTURO 3.60 2.40 2.35 1.49
FIE FFP 2.70 1.63 1.54 0.80
PRODEM 2.15 2.06 1.85 0.88
Bench Market L.A. 4.51 5.11 4.14 3.60 3.19
Ethiopia
DECSI 6.20 2.30 0.50
Busaa Gonofaa 1.20 1.80 0.40 1.20 1.30
Eshet 0.10 0.90 0.10 0.60 1.00
AVFS 11.60 2.30 3.30 4.30 5.40
Bench Market Africa 5.22 4.94 5.06 4.63 4.46
The Philippines
CARD NGO 5.87 3.26 3.32 1.99 0.49
ASHI 4.00 2.00 2.00 2.16 2.00
KPS Seed 20.00 15.00 19.00 16.00 36.00
PEF 11.00
Bench Market Asia 4.95 3.28 3.26 2.59 0.76
Tanzania
ACB 6.00 4.98 14.31 4.93 5.43
FAIDERS 3.00 5.00 5.00 4.50 4.50
PRIDE 0.02 0.66 0.44 4.72
SEDA 4.75 5.93 13.47 3.00 7.32
Bench Market Africa 5.22 4.94 5.06 4.63 4.46
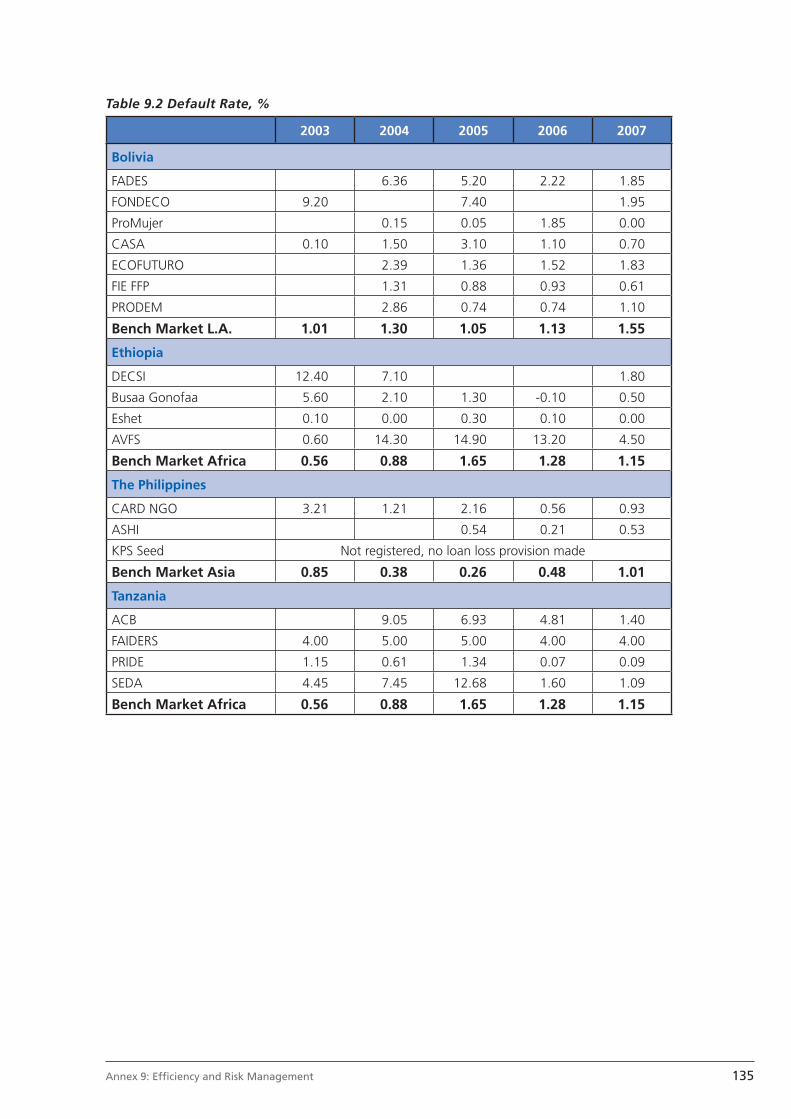
135Annex 9: Effi ciency and Risk Management
Table 9.2 Default Rate, %
2003 2004 2005 2006 2007
Bolivia
FADES 6.36 5.20 2.22 1.85
FONDECO 9.20 7.40 1.95
ProMujer 0.15 0.05 1.85 0.00
CASA 0.10 1.50 3.10 1.10 0.70
ECOFUTURO 2.39 1.36 1.52 1.83
FIE FFP 1.31 0.88 0.93 0.61
PRODEM 2.86 0.74 0.74 1.10
Bench Market L.A. 1.01 1.30 1.05 1.13 1.55
Ethiopia
DECSI 12.40 7.10 1.80
Busaa Gonofaa 5.60 2.10 1.30 -0.10 0.50
Eshet 0.10 0.00 0.30 0.10 0.00
AVFS 0.60 14.30 14.90 13.20 4.50
Bench Market Africa 0.56 0.88 1.65 1.28 1.15
The Philippines
CARD NGO 3.21 1.21 2.16 0.56 0.93
ASHI 0.54 0.21 0.53
KPS Seed Not registered, no loan loss provision made
Bench Market Asia 0.85 0.38 0.26 0.48 1.01
Tanzania
ACB 9.05 6.93 4.81 1.40
FAIDERS 4.00 5.00 5.00 4.00 4.00
PRIDE 1.15 0.61 1.34 0.07 0.09
SEDA 4.45 7.45 12.68 1.60 1.09
Bench Market Africa 0.56 0.88 1.65 1.28 1.15
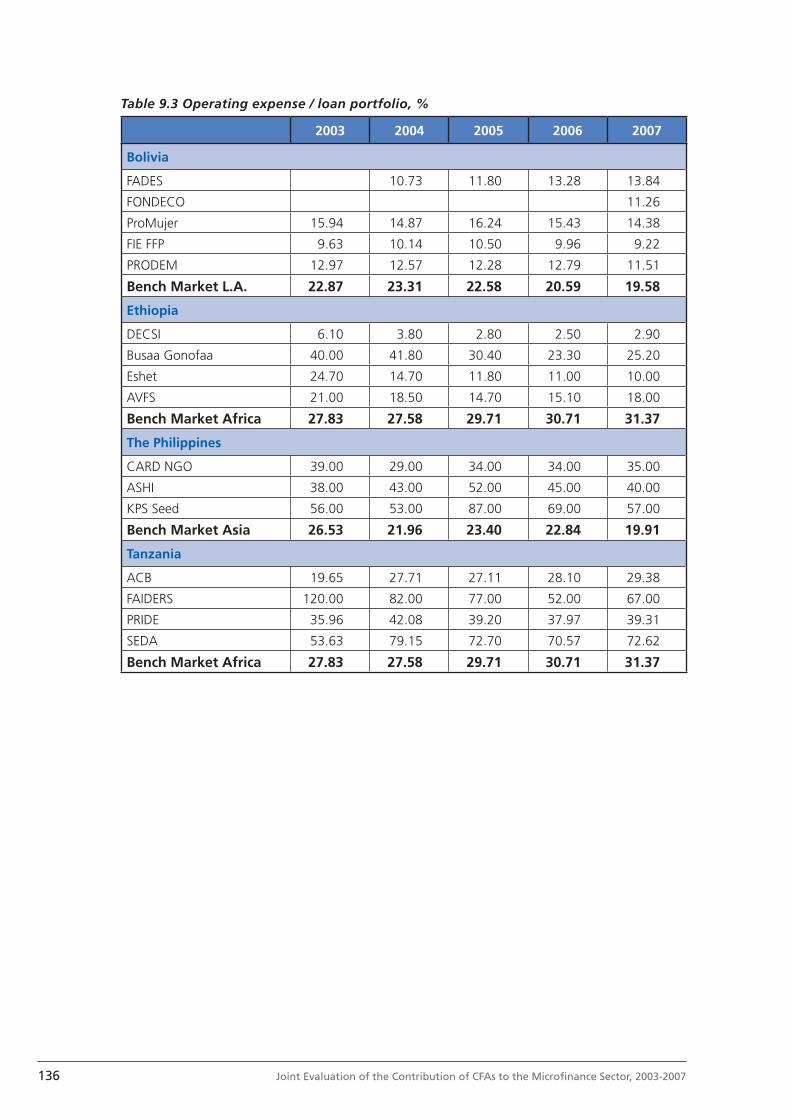
136 Joint Evaluation of the Contribution of CFAs to the Microfi nance Sector, 2003-2007
Table 9.3 Operating expense / loan portfolio, %
2003 2004 2005 2006 2007
Bolivia
FADES 10.73 11.80 13.28 13.84
FONDECO 11.26
ProMujer 15.94 14.87 16.24 15.43 14.38
FIE FFP 9.63 10.14 10.50 9.96 9.22
PRODEM 12.97 12.57 12.28 12.79 11.51
Bench Market L.A. 22.87 23.31 22.58 20.59 19.58
Ethiopia
DECSI 6.10 3.80 2.80 2.50 2.90
Busaa Gonofaa 40.00 41.80 30.40 23.30 25.20
Eshet 24.70 14.70 11.80 11.00 10.00
AVFS 21.00 18.50 14.70 15.10 18.00
Bench Market Africa 27.83 27.58 29.71 30.71 31.37
The Philippines
CARD NGO 39.00 29.00 34.00 34.00 35.00
ASHI 38.00 43.00 52.00 45.00 40.00
KPS Seed 56.00 53.00 87.00 69.00 57.00
Bench Market Asia 26.53 21.96 23.40 22.84 19.91
Tanzania
ACB 19.65 27.71 27.11 28.10 29.38
FAIDERS 120.00 82.00 77.00 52.00 67.00
PRIDE 35.96 42.08 39.20 37.97 39.31
SEDA 53.63 79.15 72.70 70.57 72.62
Bench Market Africa 27.83 27.58 29.71 30.71 31.37
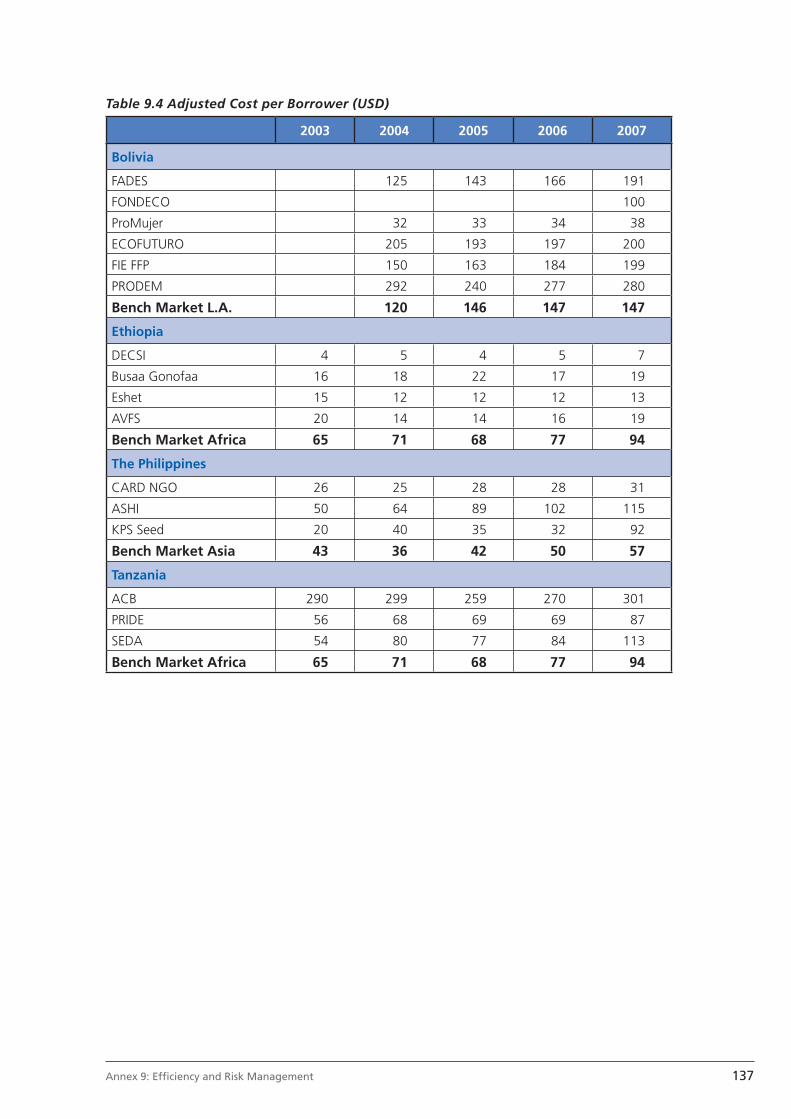
137Annex 9: Effi ciency and Risk Management
Table 9.4 Adjusted Cost per Borrower (USD)
2003 2004 2005 2006 2007
Bolivia
FADES 125 143 166 191
FONDECO 100
ProMujer 32 33 34 38
ECOFUTURO 205 193 197 200
FIE FFP 150 163 184 199
PRODEM 292 240 277 280
Bench Market L.A. 120 146 147 147
Ethiopia
DECSI 4 5 4 5 7
Busaa Gonofaa 16 18 22 17 19
Eshet 15 12 12 12 13
AVFS 20 14 14 16 19
Bench Market Africa 65 71 68 77 94
The Philippines
CARD NGO 26 25 28 28 31
ASHI 50 64 89 102 115
KPS Seed 20 40 35 32 92
Bench Market Asia 43 36 42 50 57
Tanzania
ACB 290 299 259 270 301
PRIDE 56 68 69 69 87
SEDA 54 80 77 84 113
Bench Market Africa 65 71 68 77 94
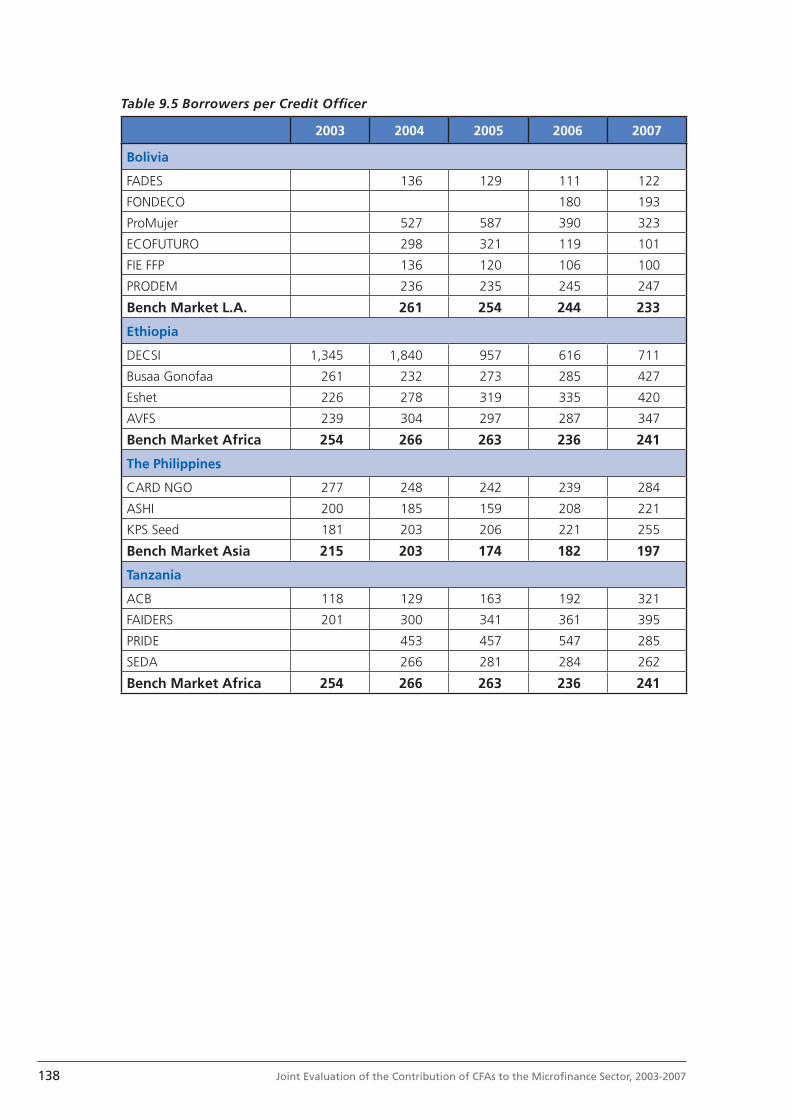
138 Joint Evaluation of the Contribution of CFAs to the Microfi nance Sector, 2003-2007
Table 9.5 Borrowers per Credit Offi cer
2003 2004 2005 2006 2007
Bolivia
FADES 136 129 111 122
FONDECO 180 193
ProMujer 527 587 390 323
ECOFUTURO 298 321 119 101
FIE FFP 136 120 106 100
PRODEM 236 235 245 247
Bench Market L.A. 261 254 244 233
Ethiopia
DECSI 1,345 1,840 957 616 711
Busaa Gonofaa 261 232 273 285 427
Eshet 226 278 319 335 420
AVFS 239 304 297 287 347
Bench Market Africa 254 266 263 236 241
The Philippines
CARD NGO 277 248 242 239 284
ASHI 200 185 159 208 221
KPS Seed 181 203 206 221 255
Bench Market Asia 215 203 174 182 197
Tanzania
ACB 118 129 163 192 321
FAIDERS 201 300 341 361 395
PRIDE 453 457 547 285
SEDA 266 281 284 262
Bench Market Africa 254 266 263 236 241
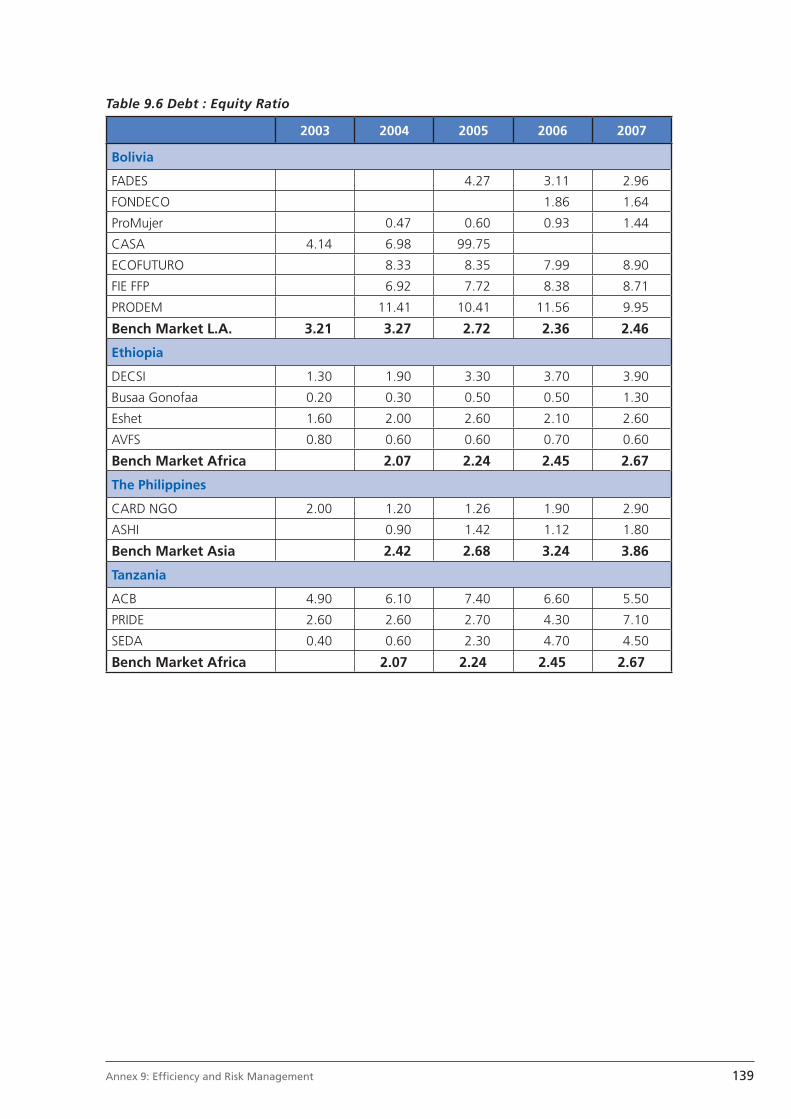
139Annex 9: Effi ciency and Risk Management
Table 9.6 Debt : Equity Ratio
2003 2004 2005 2006 2007
Bolivia
FADES 4.27 3.11 2.96
FONDECO 1.86 1.64
ProMujer 0.47 0.60 0.93 1.44
CASA 4.14 6.98 99.75
ECOFUTURO 8.33 8.35 7.99 8.90
FIE FFP 6.92 7.72 8.38 8.71
PRODEM 11.41 10.41 11.56 9.95
Bench Market L.A. 3.21 3.27 2.72 2.36 2.46
Ethiopia
DECSI 1.30 1.90 3.30 3.70 3.90
Busaa Gonofaa 0.20 0.30 0.50 0.50 1.30
Eshet 1.60 2.00 2.60 2.10 2.60
AVFS 0.80 0.60 0.60 0.70 0.60
Bench Market Africa 2.07 2.24 2.45 2.67
The Philippines
CARD NGO 2.00 1.20 1.26 1.90 2.90
ASHI 0.90 1.42 1.12 1.80
Bench Market Asia 2.42 2.68 3.24 3.86
Tanzania
ACB 4.90 6.10 7.40 6.60 5.50
PRIDE 2.60 2.60 2.70 4.30 7.10
SEDA 0.40 0.60 2.30 4.70 4.50
Bench Market Africa 2.07 2.24 2.45 2.67

140 Joint Evaluation of the Contribution of CFAs to the Microfi nance Sector, 2003-2007
Table 9.7 Credit ratings
Rating* Year Agency
Bolivia
FADES B 2006 Planet Rating
B- 2006 Fitch
FONDECO B- 2008 Planet Rating
ProMujer A- 2008 Planet Rating
CASA B- 2007 Planet Rating
ECOFUTURO B+ 2006 Planet Rating
FIE FFP A 2003 Microrate
PRODEM A 2008 Fitch
Ethiopia
DECSI
Busaa Gonofaa C+ 2007 Planet Rating
Eshet
AVFS D- 2007 Planet Rating
The Philippines
CARD NGO A- 2008 Planet Rating
ASHI No rating
KPS Seed No rating
NATCCO No rating
PEF No rating
Tanzania
ACB No rating
FAIDERS No rating
PRIDE No rating
SEDA No rating
*This scoring should not be confused with the A-B-C segmentation
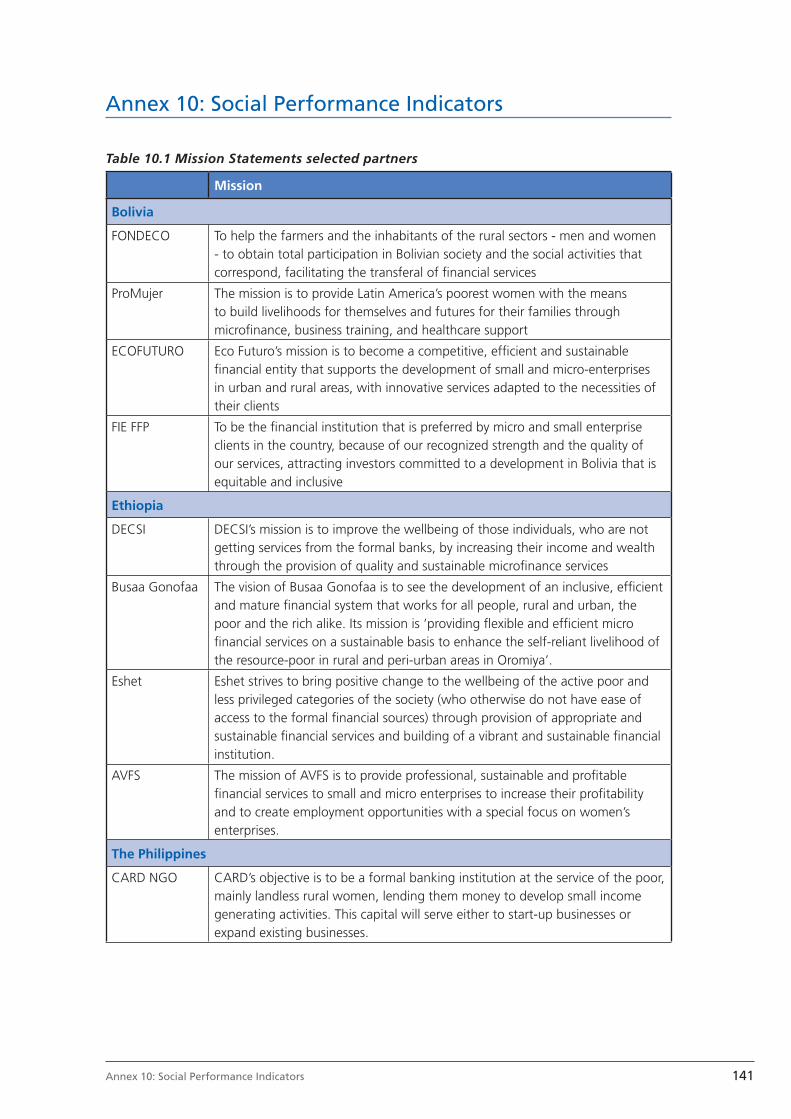
141Annex 10: Social Performance Indicators
Annex 10: Social Performance Indicators
Table 10.1 Mission Statements selected partners
Mission
Bolivia
FONDECO To help the farmers and the inhabitants of the rural sectors - men and women - to obtain total participation in Bolivian society and the social activities that correspond, facilitating the transferal of fi nancial services
ProMujer The mission is to provide Latin America’s poorest women with the means to build livelihoods for themselves and futures for their families through microfi nance, business training, and healthcare support
ECOFUTURO Eco Futuro’s mission is to become a competitive, effi cient and sustainable fi nancial entity that supports the development of small and micro-enterprises in urban and rural areas, with innovative services adapted to the necessities of their clients
FIE FFP To be the fi nancial institution that is preferred by micro and small enterprise clients in the country, because of our recognized strength and the quality of our services, attracting investors committed to a development in Bolivia that is equitable and inclusive
Ethiopia
DECSI DECSI’s mission is to improve the wellbeing of those individuals, who are not getting services from the formal banks, by increasing their income and wealth through the provision of quality and sustainable microfi nance services
Busaa Gonofaa The vision of Busaa Gonofaa is to see the development of an inclusive, effi cient and mature fi nancial system that works for all people, rural and urban, the poor and the rich alike. Its mission is ‘providing fl exible and effi cient micro fi nancial services on a sustainable basis to enhance the self-reliant livelihood of the resource-poor in rural and peri-urban areas in Oromiya’.
Eshet Eshet strives to bring positive change to the wellbeing of the active poor and less privileged categories of the society (who otherwise do not have ease of access to the formal fi nancial sources) through provision of appropriate and sustainable fi nancial services and building of a vibrant and sustainable fi nancial institution.
AVFS The mission of AVFS is to provide professional, sustainable and profi table fi nancial services to small and micro enterprises to increase their profi tability and to create employment opportunities with a special focus on women’s enterprises.
The Philippines
CARD NGO CARD’s objective is to be a formal banking institution at the service of the poor, mainly landless rural women, lending them money to develop small income generating activities. This capital will serve either to start-up businesses or expand existing businesses.
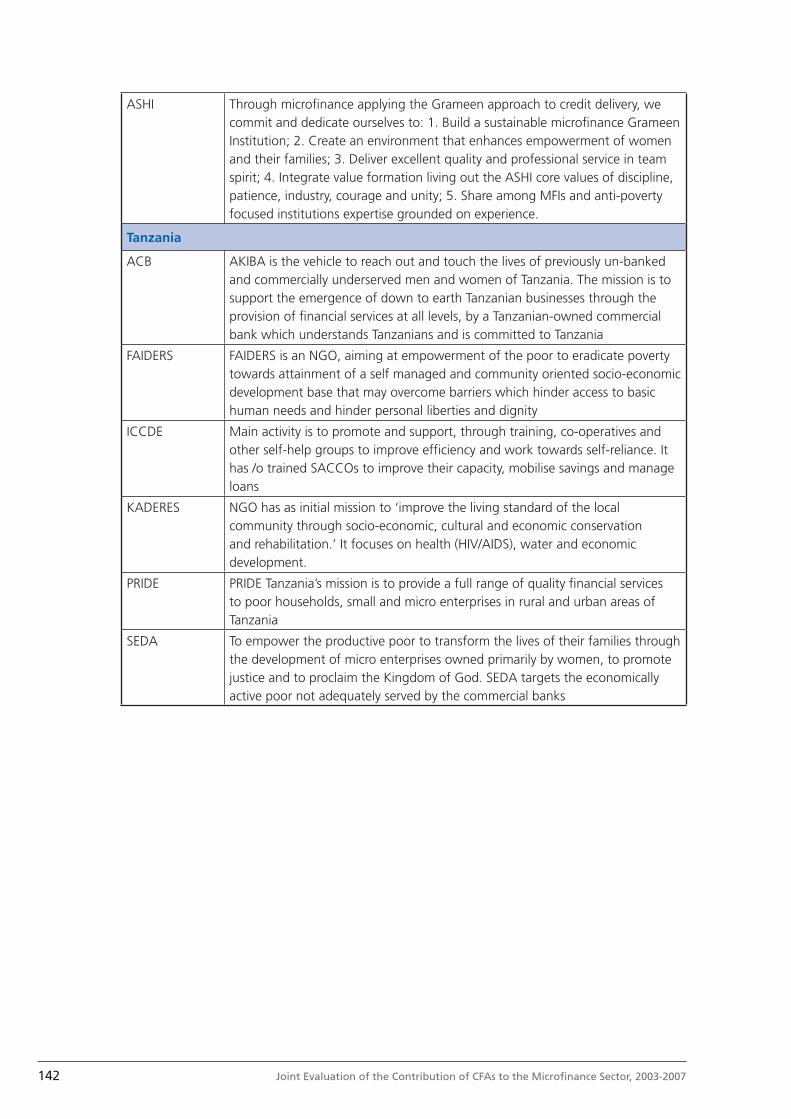
142 Joint Evaluation of the Contribution of CFAs to the Microfi nance Sector, 2003-2007
ASHI Through microfi nance applying the Grameen approach to credit delivery, we commit and dedicate ourselves to: 1. Build a sustainable microfi nance Grameen Institution; 2. Create an environment that enhances empowerment of women and their families; 3. Deliver excellent quality and professional service in team spirit; 4. Integrate value formation living out the ASHI core values of discipline, patience, industry, courage and unity; 5. Share among MFIs and anti-poverty focused institutions expertise grounded on experience.
Tanzania
ACB AKIBA is the vehicle to reach out and touch the lives of previously un-banked and commercially underserved men and women of Tanzania. The mission is to support the emergence of down to earth Tanzanian businesses through the provision of fi nancial services at all levels, by a Tanzanian-owned commercial bank which understands Tanzanians and is committed to Tanzania
FAIDERS FAIDERS is an NGO, aiming at empowerment of the poor to eradicate poverty towards attainment of a self managed and community oriented socio-economic development base that may overcome barriers which hinder access to basic human needs and hinder personal liberties and dignity
ICCDE Main activity is to promote and support, through training, co-operatives and other self-help groups to improve effi ciency and work towards self-reliance. It has /o trained SACCOs to improve their capacity, mobilise savings and manage loans
KADERES NGO has as initial mission to ‘improve the living standard of the local community through socio-economic, cultural and economic conservation and rehabilitation.’ It focuses on health (HIV/AIDS), water and economic development.
PRIDE PRIDE Tanzania’s mission is to provide a full range of quality fi nancial services to poor households, small and micro enterprises in rural and urban areas of Tanzania
SEDA To empower the productive poor to transform the lives of their families through the development of micro enterprises owned primarily by women, to promote justice and to proclaim the Kingdom of God. SEDA targets the economically active poor not adequately served by the commercial banks
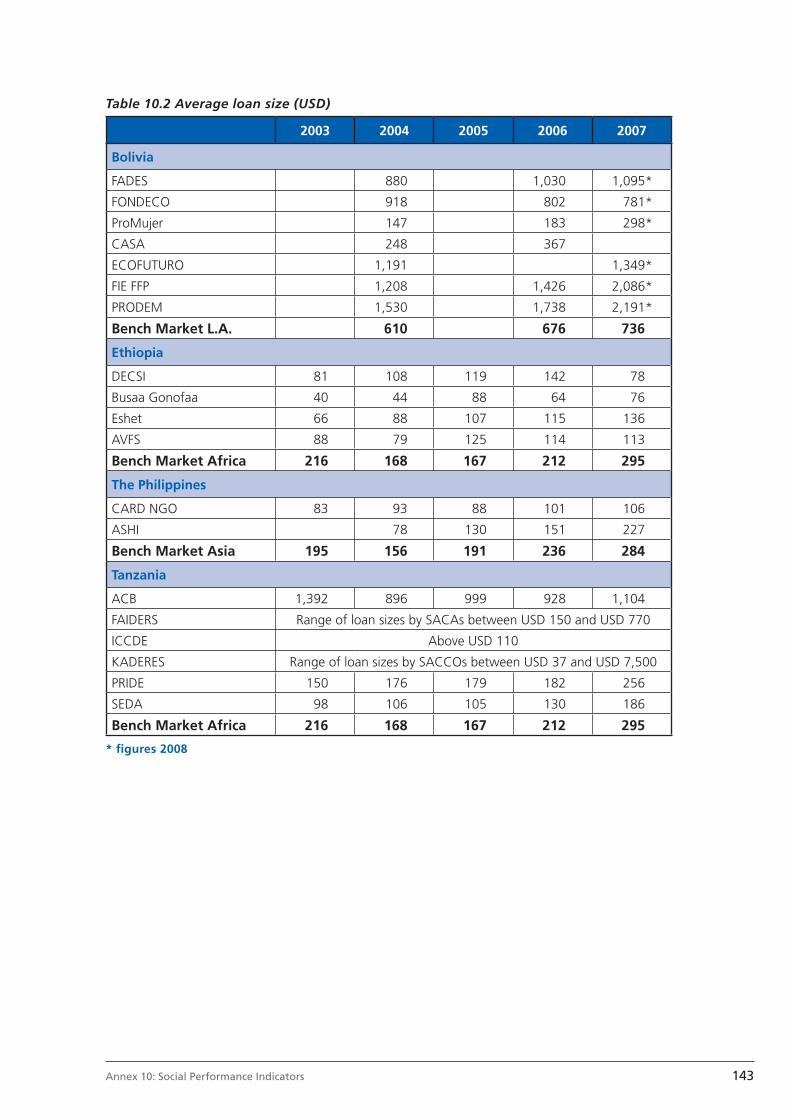
143Annex 10: Social Performance Indicators
Table 10.2 Average loan size (USD)
2003 2004 2005 2006 2007
Bolivia
FADES 880 1,030 1,095*
FONDECO 918 802 781*
ProMujer 147 183 298*
CASA 248 367
ECOFUTURO 1,191 1,349*
FIE FFP 1,208 1,426 2,086*
PRODEM 1,530 1,738 2,191*
Bench Market L.A. 610 676 736
Ethiopia
DECSI 81 108 119 142 78
Busaa Gonofaa 40 44 88 64 76
Eshet 66 88 107 115 136
AVFS 88 79 125 114 113
Bench Market Africa 216 168 167 212 295
The Philippines
CARD NGO 83 93 88 101 106
ASHI 78 130 151 227
Bench Market Asia 195 156 191 236 284
Tanzania
ACB 1,392 896 999 928 1,104
FAIDERS Range of loan sizes by SACAs between USD 150 and USD 770
ICCDE Above USD 110
KADERES Range of loan sizes by SACCOs between USD 37 and USD 7,500
PRIDE 150 176 179 182 256
SEDA 98 106 105 130 186
Bench Market Africa 216 168 167 212 295
* fi gures 2008

144 Joint Evaluation of the Contribution of CFAs to the Microfi nance Sector, 2003-2007
Table 10.3 Women among clients or members (%)
2003 2004 2005 2006 2007
Bolivia
FADES 35.00 37.00 37.20 36.30
FONDECO 63.50 60.60
ProMujer 95.00 95.00 94.90 95.00 95.00
FIE FFP 60.00 48.00 47.30 45.60 43.50
PRODEM 37.00 52.50 48.80 50.50 50.20
Bench Market L.A. 63.00 60.63 60.09 59.34 62.49
Ethiopia
DECSI 25.00 20.00 23.00 19.00 38.00
Busaa Gonofaa 82.00 76.00 70.00 70.00 75.00
Eshet 34.00 26.00 24.00 35.00 28.00
AVFS 57.00 51.00 50.00 47.00 55.00
Bench Market Africa 62.39 59.34 60.00 61.00 62.41
The Philippines
CARD NGO 100.00 100.00 100.00 100.00 100.00
ASHI 100.00 100.00 100.00 100.00 100.00
KPS Seed >50.00 >50.00 >50.00 >50.00 >50.00
Bench Market Asia 76.00 85.89 86.00 84.99 86.11
Tanzania
ACB 60.00 n/a n/a n/a 59.70
FAIDERS Between 7% and 100%, average around 40% in the SACA
ICCDE 40.00 43.00 45.00 43.00 29.00
KADERES Between 39% and 45% in the SACCOs
PRIDE 66.00 54.20 65.00 65.00 54.10
SEDA 80.00 79.00 72.00 67.90 66.40
Bench Market Africa 62.39 59.34 60 61.00 62.41
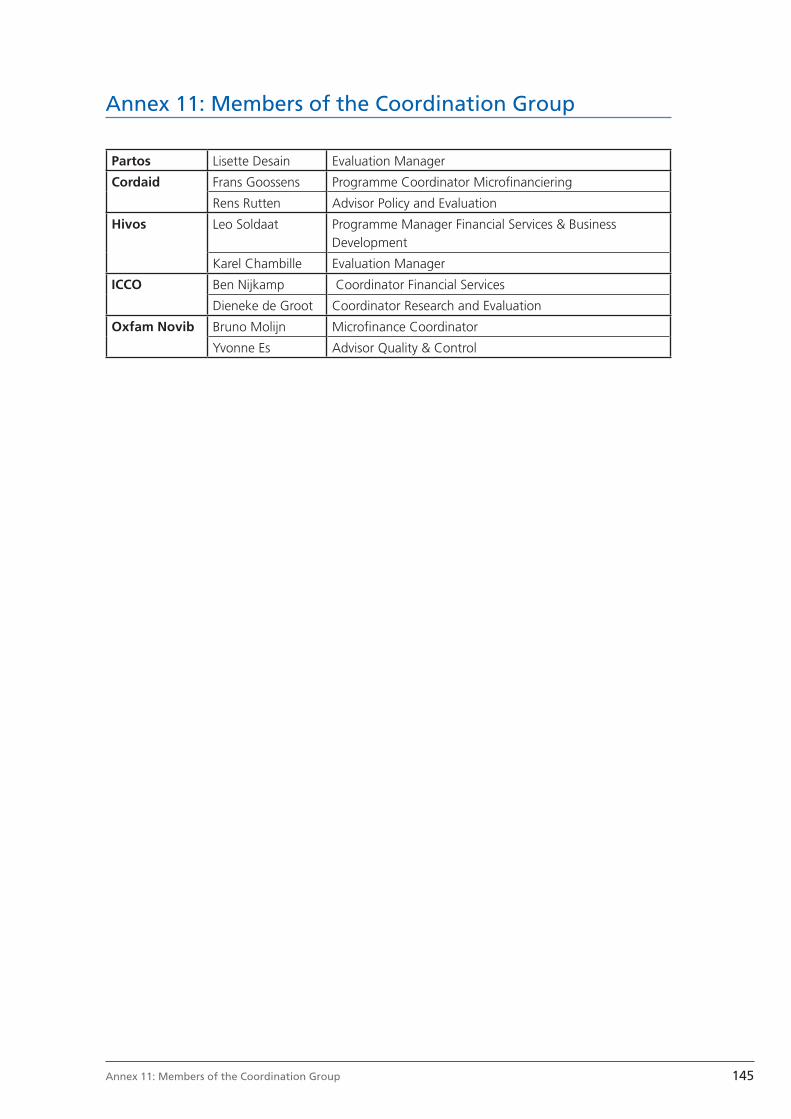
145Annex 11: Members of the Coordination Group
Annex 11: Members of the Coordination Group
Partos Lisette Desain Evaluation Manager
Cordaid Frans Goossens Programme Coordinator Microfi nanciering
Rens Rutten Advisor Policy and Evaluation
Hivos Leo Soldaat Programme Manager Financial Services & Business Development
Karel Chambille Evaluation Manager
ICCO Ben Nijkamp Coordinator Financial Services
Dieneke de Groot Coordinator Research and Evaluation
Oxfam Novib Bruno Molijn Microfi nance Coordinator
Yvonne Es Advisor Quality & Control
146 Joint Evaluation of the Contribution of CFAs to the Microfi nance Sector, 2003-2007
Annex 12: Members of the External Reference Group
• President of ERG: Paul Engel, Director ECDPM• Administrative assistent of ERG: Niels Keijzer, Programme Offi cer Centre Policy and
Innovation, ECDPM• Members of ERG:
- Anita Hardon, Professor Medical Anthropology (UvA)- Rehka Wazir, Co-director International Child Development Initiative- Georg Frerks, Centre for Confl ict Studies UU, Professor Rampenstudies WUR- Geske Dijkstra, Senior lecturer economics, EUR- Bert Helmsing, Professor ISS


