33
1 Microarray Data Analysis A step by step analysis using BRB-Array Tools
1
Microarray Data Analysis
A step by step analysisusing BRB-Array Tools

2
EXAMINATION OF DIFFERENTIAL GENE EXPRESSION (1)
• Objective: to find genes whose expression is changed before and after chemotherapy.
• Experiment: Biopsies from breast cancer patients, before and after a 16 week course of doxorubicin chemotherapy.
• Reference: Korn et. al. Identifying Pre-Post Chemotherapy Differences in Gene Expression in Breast Tumors.
3
Study design
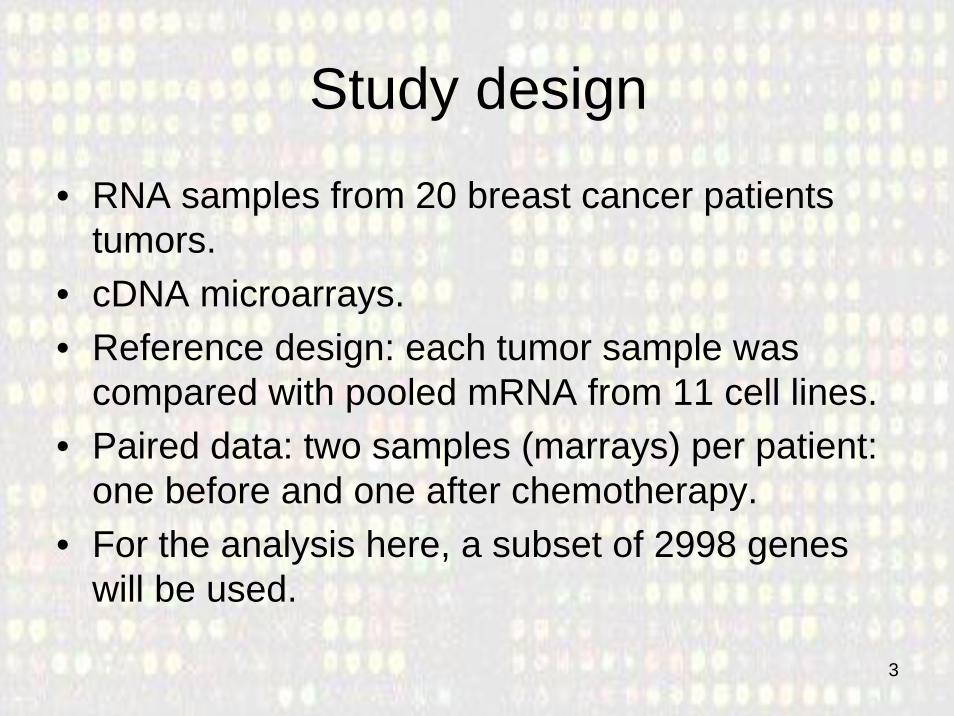
• RNA samples from 20 breast cancer patients tumors.
• cDNA microarrays. • Reference design: each tumor sample was
compared with pooled mRNA from 11 cell lines. • Paired data: two samples (marrays) per patient:
one before and one after chemotherapy.• For the analysis here, a subset of 2998 genes
will be used.

4
Analysis pipeline
1. Load (collate) the data.2. Filter bad spots &
Adjust for low intensities.3. Normalize and check.4. Do the tests.5. Interpret results.

5
1. Load data. Option 1: Collate
• If we are going to work with our own data (.CEL or .gpr files) or with data obtained from a database we must import it into the format used by BRB.
• This can be done following the steps inArray Tools Import data Import wizard
• In this tutorial we will use an example project that has already been created.

6
1. Load data. (2): Existing project
• A BRB project workbook with the prepared data is available in the “sample datasets”folder. Its name is "Perou.xls.“
• Load the project and inspect the four worksheets it contains:– Experimental Descriptors.– Gene Identifiers.– Gene Annotations.– Filtered Log Ratios.
7
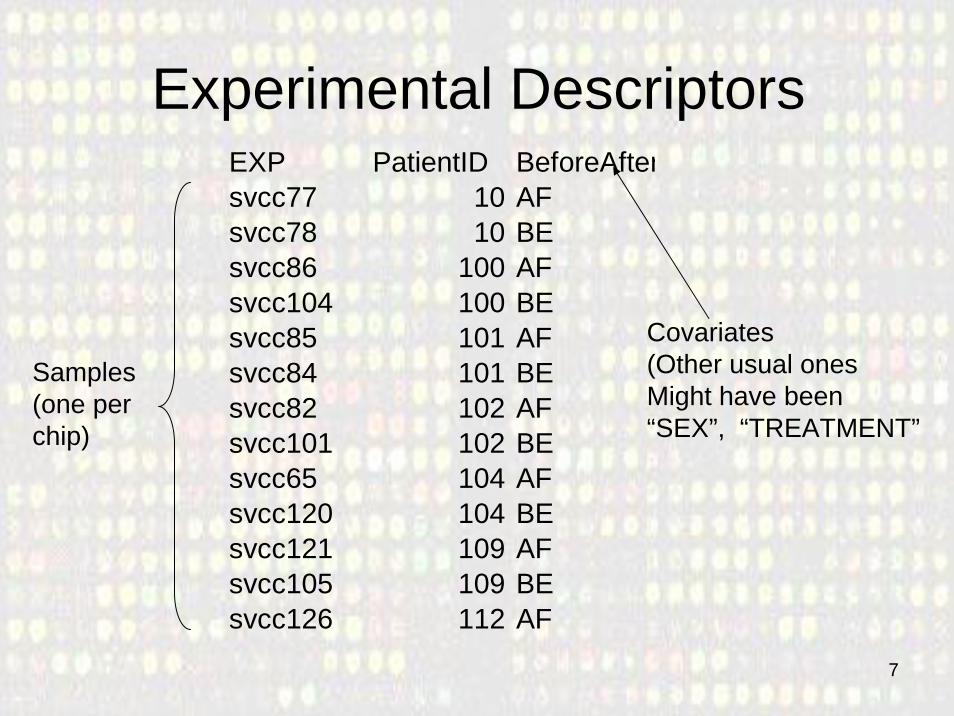
Experimental DescriptorsEXP PatientID BeforeAftersvcc77 10 AFsvcc78 10 BEsvcc86 100 AFsvcc104 100 BEsvcc85 101 AFsvcc84 101 BEsvcc82 102 AFsvcc101 102 BEsvcc65 104 AFsvcc120 104 BEsvcc121 109 AFsvcc105 109 BEsvcc126 112 AF
Samples(one perchip)
Covariates(Other usual onesMight have been“SEX”, “TREATMENT”
8
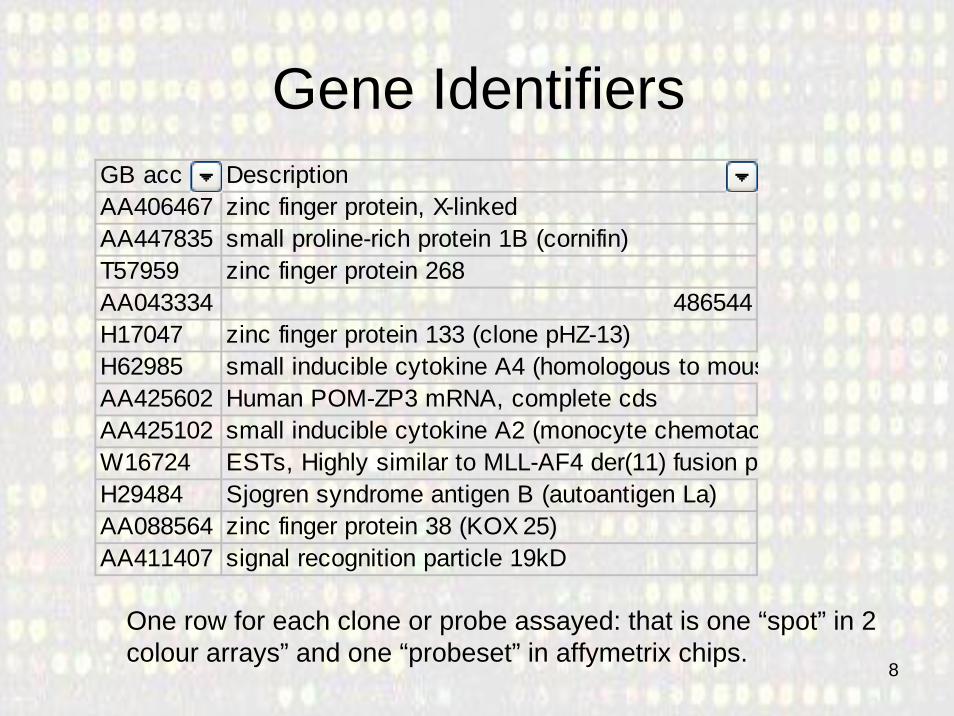
Gene IdentifiersGB acc DescriptionAA406467 zinc finger protein, X-linkedAA447835 small proline-rich protein 1B (cornifin)T57959 zinc finger protein 268AA043334 486544H17047 zinc finger protein 133 (clone pHZ-13)H62985 small inducible cytokine A4 (homologous to mousAA425602 Human POM-ZP3 mRNA, complete cdsAA425102 small inducible cytokine A2 (monocyte chemotacW16724 ESTs, Highly similar to MLL-AF4 der(11) fusion pH29484 Sjogren syndrome antigen B (autoantigen La)AA088564 zinc finger protein 38 (KOX 25)AA411407 signal recognition particle 19kD
One row for each clone or probe assayed: that is one “spot” in 2 colour arrays” and one “probeset” in affymetrix chips.
9
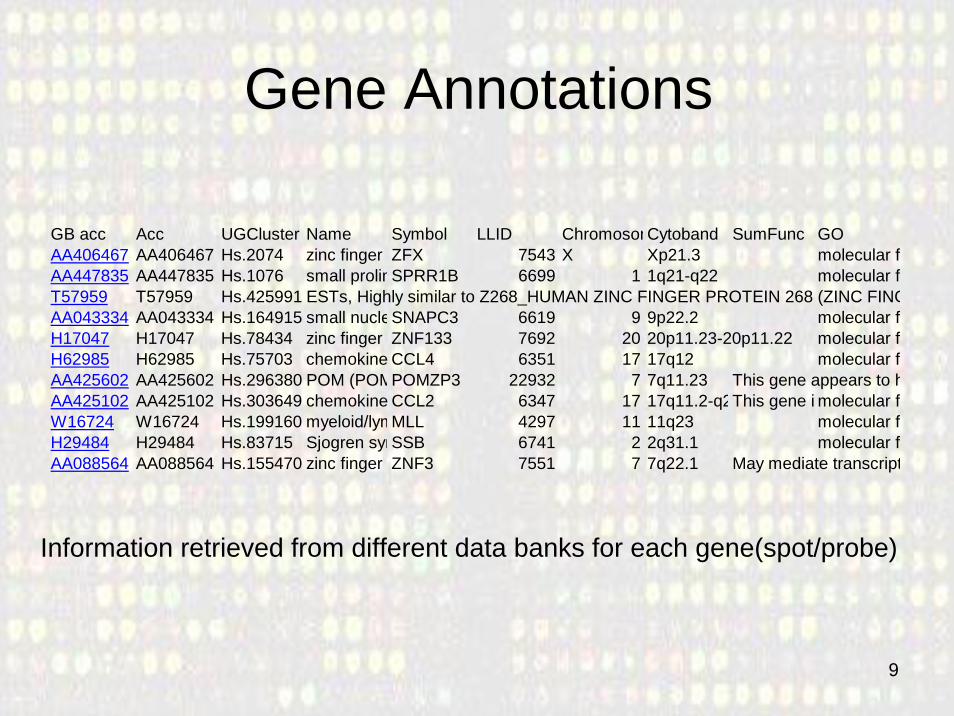
Gene Annotations
GB acc Acc UGCluster Name Symbol LLID ChromosomCytoband SumFunc GOAA406467 AA406467 Hs.2074 zinc finger ZFX 7543 X Xp21.3 molecular fAA447835 AA447835 Hs.1076 small prolinSPRR1B 6699 1 1q21-q22 molecular fT57959 T57959 Hs.425991 ESTs, Highly similar to Z268_HUMAN ZINC FINGER PROTEIN 268 (ZINC FINGAA043334 AA043334 Hs.164915 small nucleSNAPC3 6619 9 9p22.2 molecular fH17047 H17047 Hs.78434 zinc finger ZNF133 7692 20 20p11.23-20p11.22 molecular fH62985 H62985 Hs.75703 chemokine CCL4 6351 17 17q12 molecular fAA425602 AA425602 Hs.296380 POM (POMPOMZP3 22932 7 7q11.23 This gene appears to hAA425102 AA425102 Hs.303649 chemokine CCL2 6347 17 17q11.2-q2This gene i molecular fW16724 W16724 Hs.199160 myeloid/lymMLL 4297 11 11q23 molecular fH29484 H29484 Hs.83715 Sjogren synSSB 6741 2 2q31.1 molecular fAA088564 AA088564 Hs.155470 zinc finger ZNF3 7551 7 7q22.1 May mediate transcript
Information retrieved from different data banks for each gene(spot/probe)
10
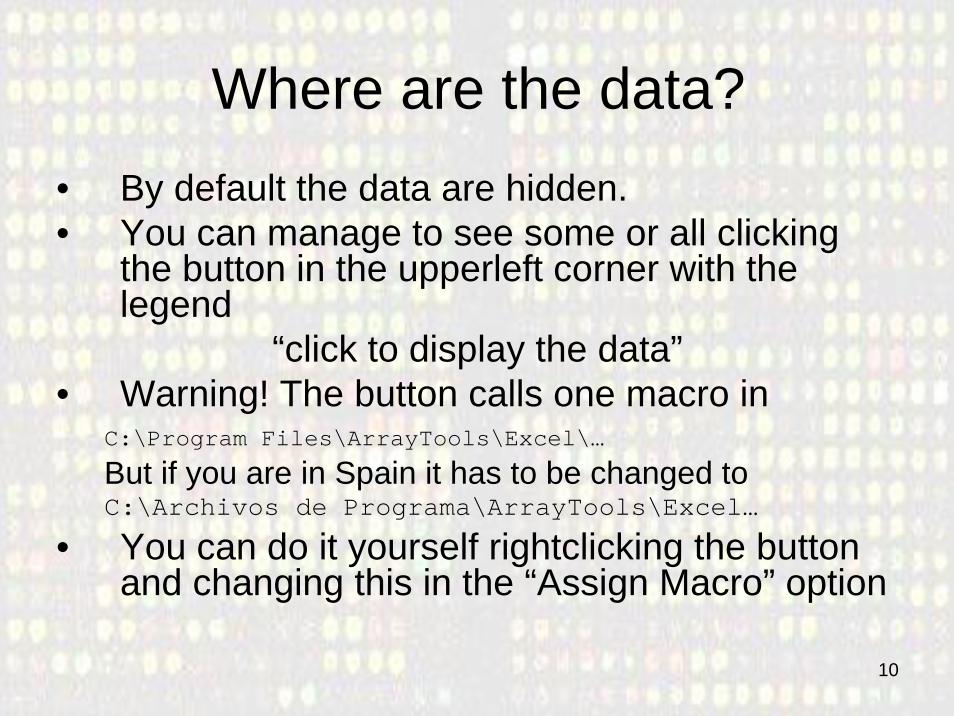
Where are the data?• By default the data are hidden.• You can manage to see some or all clicking
the button in the upperleft corner with thelegend
“click to display the data”• Warning! The button calls one macro in
C:\Program Files\ArrayTools\Excel\…
But if you are in Spain it has to be changed toC:\Archivos de Programa\ArrayTools\Excel…
• You can do it yourself rightclicking the buttonand changing this in the “Assign Macro” option

11
log ratiosGB acc svcc77 svcc78 svcc86 svcc104 svcc85 svcc84AA406467 0.177719161 0.635135 0.117507 -0.059445 -0.344543 -0.29523AA447835 0.483082891 -0.938371 -1.925212 -1.088192 0.404442 -1.47468T57959 -0.466033399 -0.667869 -0.661471 -0.949109 -1.118599 -0.951252AA043334 -0.361635417 -0.52492 -0.180623 -0.975533 -1.337441 -1.108014H17047 -0.180488467 0.467818 0.084874 -0.799491 -1.236151 -0.976088H62985 0.617713928 0.186939 0.674088 1.229423 -0.529549 0.370547AA425602 0.039528362 -0.568089 -0.431157 -0.65056 -1.235254 -0.905405AA425102 -1.462129593 -1.363178 -0.753973 -0.962225 0.284074 -0.055937W16724 -0.193975359 1.053527 -0.035172 -2.082636 -0.715087 -0.533485H29484 -0.655079663 -1.870073 -0.550644 -0.837189 -1.01124 -1.155574AA088564 -0.716671586 -0.725372 -0.720263 -0.899272 -1.529135 -1.312939
log2-transformed Red/Green ratios for two colour arrays or Intensities for single- channel or Affymetrix chip data) with the genes represented by the rows and the arrays by columns

12
2 & 3. Preprocessing steps: Filtering and Normalization
• After import/loading and before the analyisstep data must be pre-processed.
• This may mean two type of actions:– Filtering is done to exclude bad spots or
adjust intensities too low or too high to more reasonable values.
– Normalization is done to correct for biases(systematic errors) due to technical reasonsinstead of biological variability.
13
2: Filtering spots & adjust signals
• We may filter the data on intensity by excludingvalues where both the red and green channelsare less than 100.
• We may set the value of an intensity to theminimum in the event only one of the twochannel intensities is below the minimum of 100.
• In addition, we may use the flag columnimported with the data, and exclude intensitieswith a flag value not equal to 1.
14
Must we filter the data?
• Filtering is intended to remove spotswhose images or signals were wrong dueto different possible reasons– Small quantity of cDNA in the array– Errors during the scanning process
• Some people prefer not to filter to avoideliminating good spots unintentionally.
• In case of doubt be conservative andreduce the filter operation to the minimum.

15
2998 genes passthe filtering criteria
We filter followingthe tutorial’sindications.
16
3. Normalization• A quick inspection of the data -e.g. MA plots-
will show if normalization is needed • First normalize the data subtracting the median
log ratio of an array to all log ratios on that array.• Later we will normalize the data by subtracting a
non-linear transformation with the loess option.– No print-tip group information is available so it is not
possible to perform print-tip normalization.– We will construct M-A plots to evaluate the results of
each normalization option.

17
Is normalization necessary?
• MA plots can show if it is needed to normalize the data (it usually is)
• To draw an MA-plot go to: Array Tools Plugins M vs A plot– Asymetrical clouds, not centered around zero
suggest the need for normalization.– Symetrical narrow clouds suggest that it can
be omitted.

18
Median normalization
19
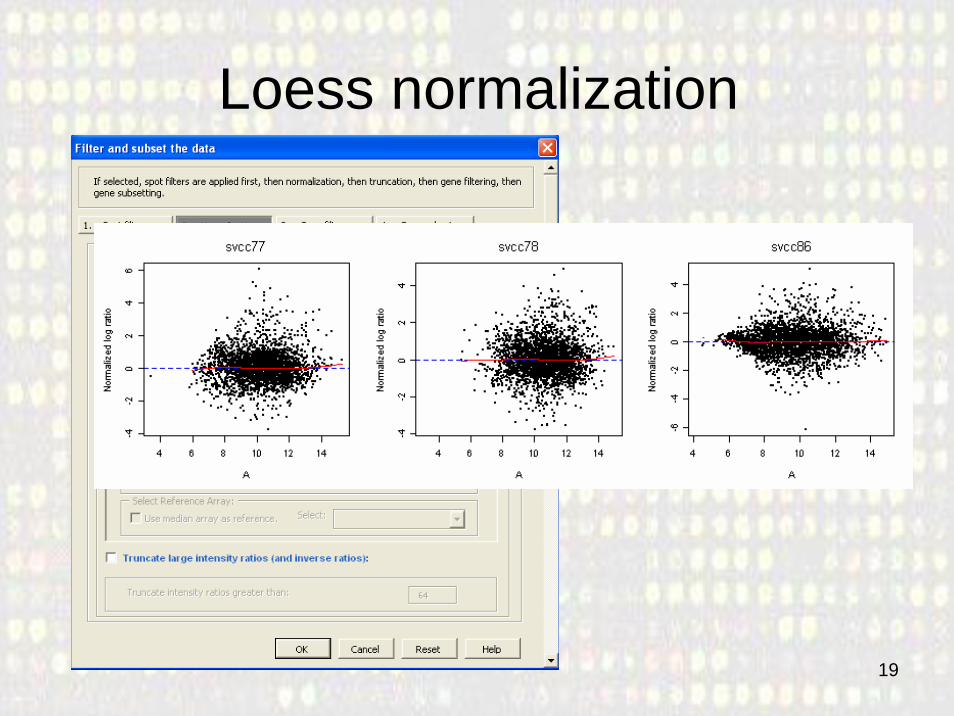
Loess normalization

20
Before and after normalization
No normalization
Global mediannormalization
Global loessnormalization

21
4. Finding differentiallyexpressed genes
• Quick fold-change scatter plots can be used to make an inspection of up or down regulated genes in each experiment.– Useful to look at specific arrays.– Cannot be generalized.
• The best approach of course is to combine all samples and do a test of DE.
22
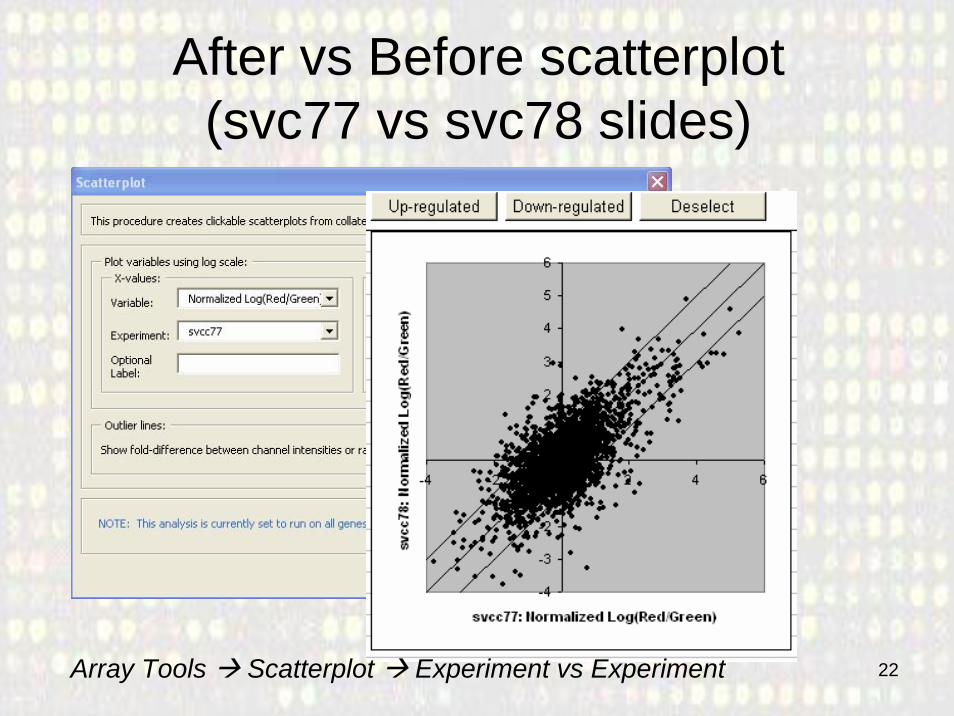
After vs Before scatterplot(svc77 vs svc78 slides)
Array Tools Scatterplot Experiment vs Experiment

23
Comparing visual checks
• Te list of genes up-regulated beforeand afterchemotherapy is not the same for patients 10 and 100

24
4.2 Class comparison tests
• A test for differential gene expression between pre and post chemotherapy can be done using a paired t-test.
• In order to avoid depending on normality assumptions p-values can be computed using a permutation approach.
• The number and proportion of false discoveries must be controlled. It can also be estimated
25
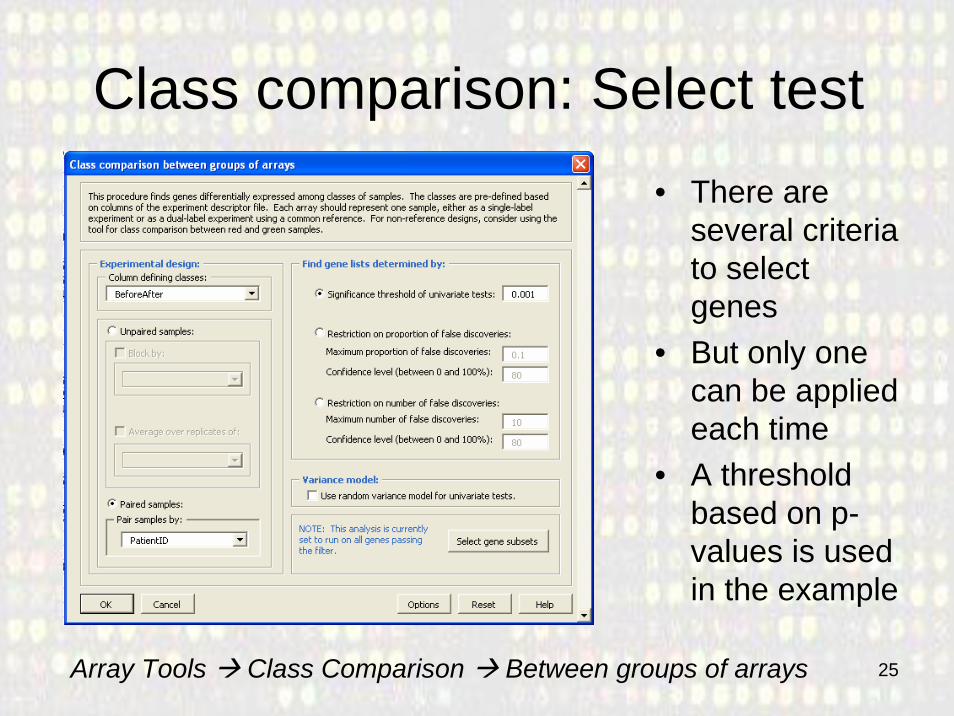
Class comparison: Select test• There are
several criteria to select genes
• But only one can be applied each time
• A threshold based on p-values is used in the example
Array Tools Class Comparison Between groups of arrays
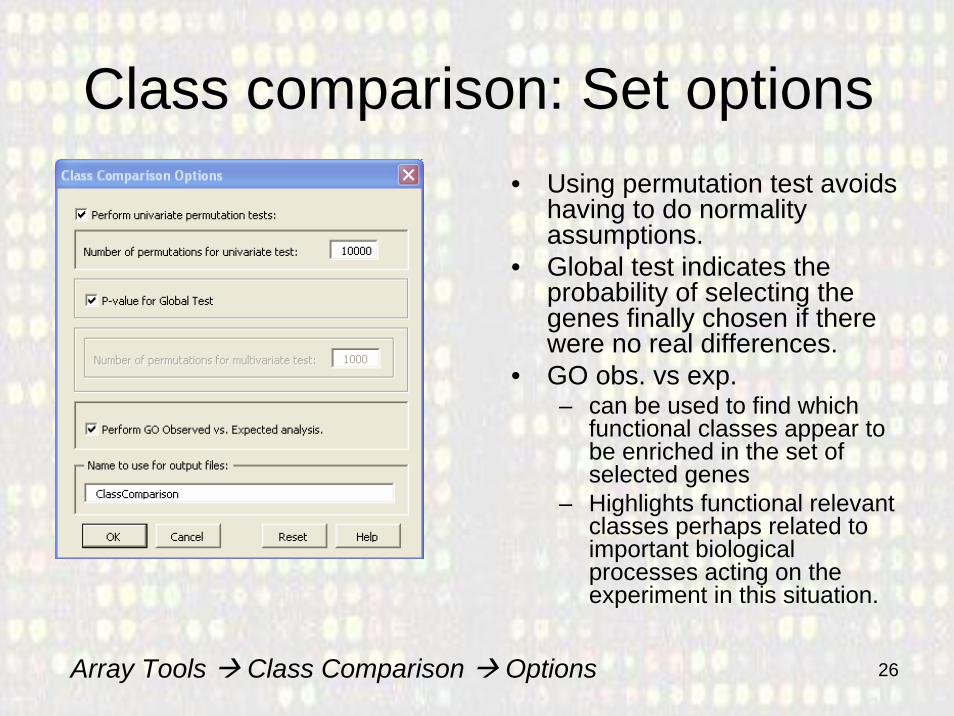
26
Class comparison: Set options• Using permutation test avoids
having to do normality assumptions.
• Global test indicates the probability of selecting the genes finally chosen if there were no real differences.
• GO obs. vs exp. – can be used to find which
functional classes appear to be enriched in the set of selected genes
– Highlights functional relevant classes perhaps related to important biological processes acting on the experiment in this situation.
Array Tools Class Comparison Options

27
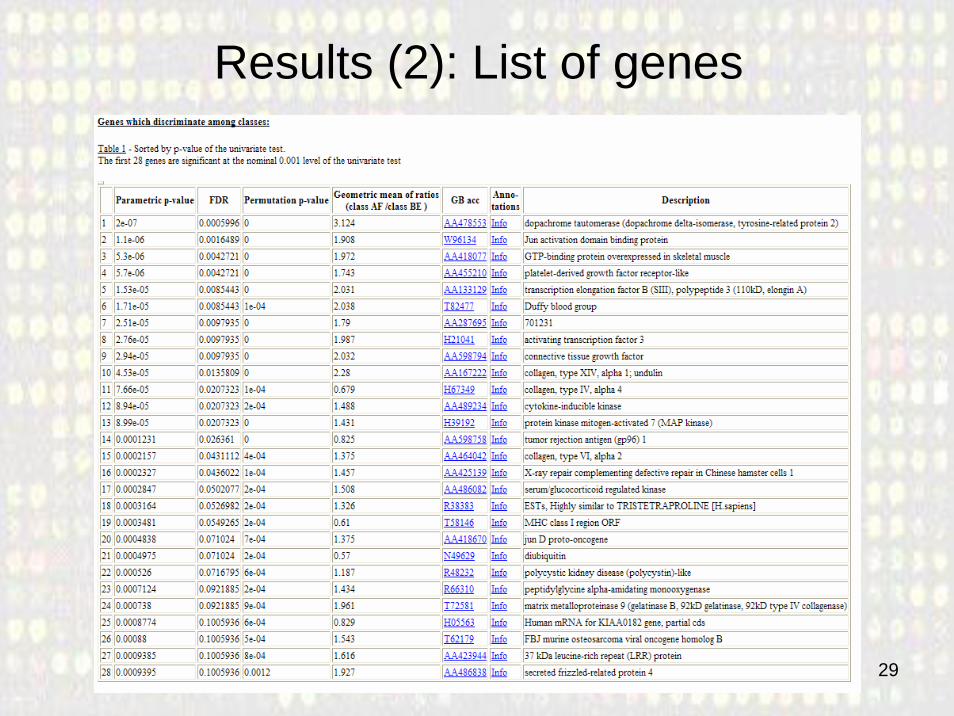
Results
• The analysis results are written to a file “ClassComparison.html”
• It contains– Description of the problem– Summary of Results– Genes which discriminate among classes– [Optional] ‘Observed v. Expected' table of GO
classes

28
Results (1): Summary
29
Results (2): List of genes
30
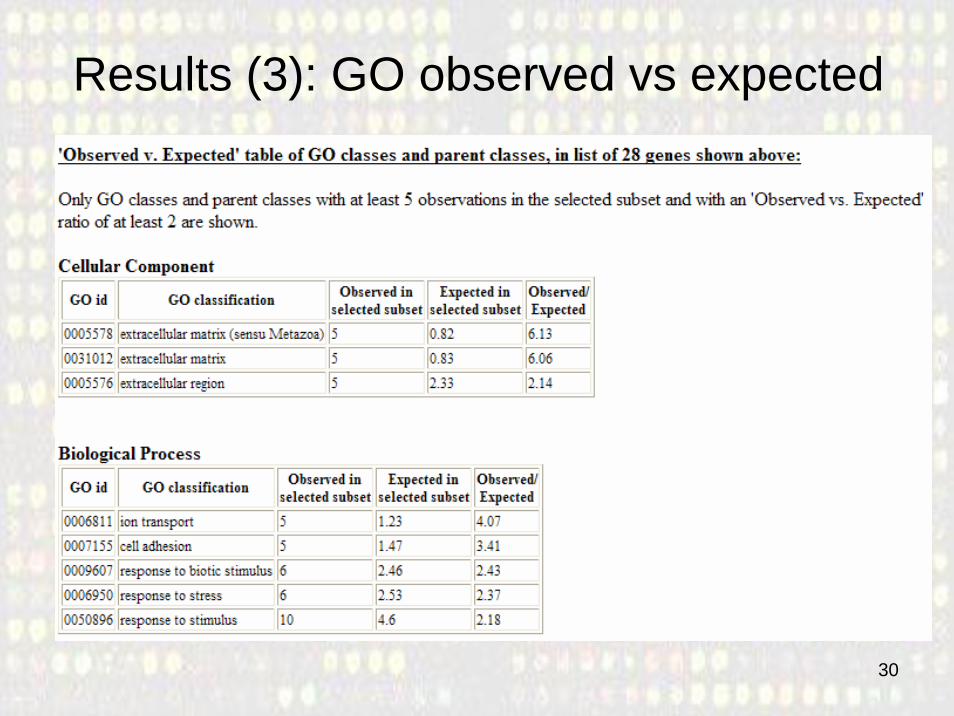
Results (3): GO observed vs expected
31
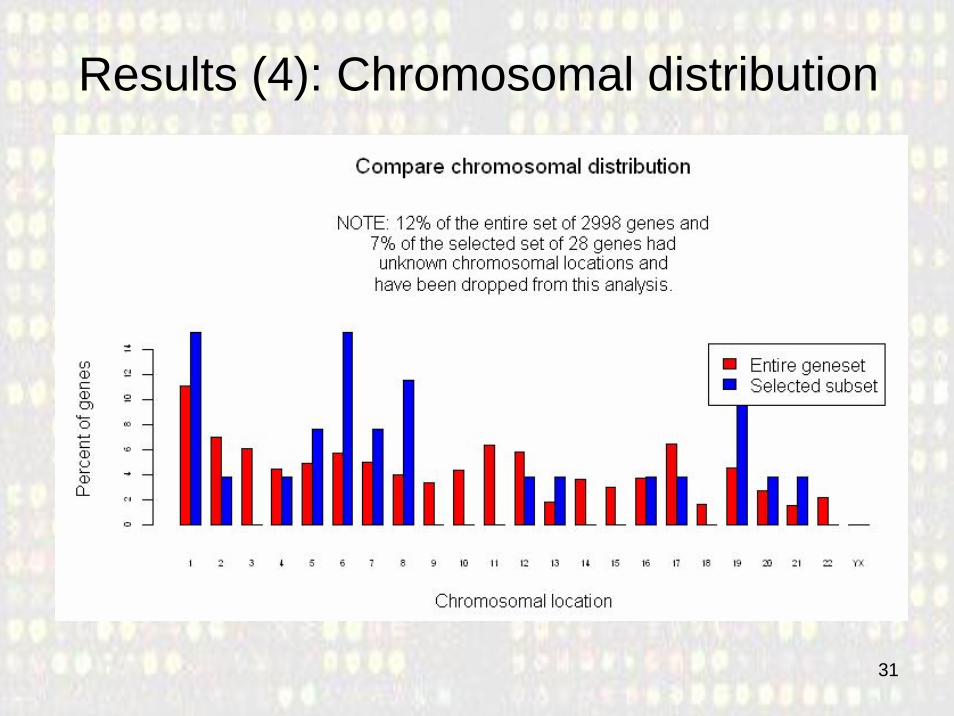
Results (4): Chromosomal distribution

32
Results (4): Some extra info.

33
To learn more …• Analysis of Gene Expression Data Using BRB-Array Tools
Richard Simon, Amy Lam, Ming-Chung Li, Michael Ngan, SupriyaMenenzes, Yingdong ZhaoCancer Informatics 2:11-17, 2007.
• A Tutorial on Data Analysis Using BRB-ArrayTools version 3.5 Supriya MenezesNIH CIT course on BRB-ArrayTools, October 2006.


