Microbial biofilms in food environments: study approaches and intervention strategies A Ph.D. dissertation presented by Francesca Frigo to the University of Udine for the degree of Ph.D. in the subject of Food Science (Cycle XXVI) Department of Food Science UNIVERSITY OF UDINE Italy March 2014
Transcript
Microbial biofilms in food environments:
study approaches and intervention strategies
A Ph.D. dissertation presented by
Francesca Frigo
to the
University of Udine
for the degree of Ph.D. in the subject of
Food Science (Cycle XXVI)
Department of Food Science
UNIVERSITY OF UDINE
Italy
March 2014
Coordinator: Mara Lucia Stecchini, Professor
Department of Food Science
University of Udine, Italy
Supervisors: Michela Maifreni, PhD
Department of Food Science
University of Udine, Italy
Marilena Marino, PhD
Department of Food Science
University of Udine, Italy
Reviewers: Giovanni Di Bonaventura, PhD
Department of Biomedical Sciences
University G. d’Annunzio of Chieti Pescara
Barbara Cardazzo, PhD
Department of Public Health, Comparative Pathology and Veterinary
University of Padova
TABLE OF CONTENTS
List of tables .................................................................................................................................................................. 1
List of figures ................................................................................................................................................................ 2
List of Abbreviations .................................................................................................................................................... 7
Chapter 1. General Introduction ........................................................................................................................... 8
1.1 Historical basis of biofilm study ..................................................................................................... 9
Chapter 3. Biofilm Formation of Food Pathogens and Spoilers as affected by Temperature, pH, Glucose and Sodium Chloride ......................................................................................................................................................... 43
4.2 Materials and methods .................................................................................................................. 87
4.2.1 Biofilm formation by Pseudomonas spp. ................................................................................. 87
4.2.2 Biofilm susceptibility towards disinfectants ............................................................................ 87
4.2.3 Kinetics of adhesion and biofilm formation on stainless steel AISI 304, and resistance to peracid-based sanitizer ........................................................................................................................................ 88
4.3 Results and discussion................................................................................................................... 89
Table 1.1. Microorganisms forming biofilms in various food environments .................................................................................. 17
Table 2.1 Biofilm-forming ability classification; *ODc = the mean of the negative control + 3 x SD ........................................... 31
Table 2.2 Cell viable counts (mean Log CFU/cm2 ± SD; n=2) of biofilm formed on stainless steel at 4 °C in CBR ..................... 38
Table 2.3 Cell viable counts (mean Log CFU/cm2 ± SD; n=2) of biofilm formed on stainless steel at 15 °C in CBR ................... 38
Table 2.4 Cell viable counts (mean Log CFU/cm2 ± SD; n=48) of biofilms grown for seven days on stainless steel at 4 °C and 15 °C. Mean values with a different letter indicate statistically different values (p<0.05) ................................................................... 39
Table 2.5 Disposables and materials needed to perform SP and DP methods for an eight-fold diluted sample in duplicate .......... 41
Table 3.1 Coded levels of experimental design ............................................................................................................................... 46
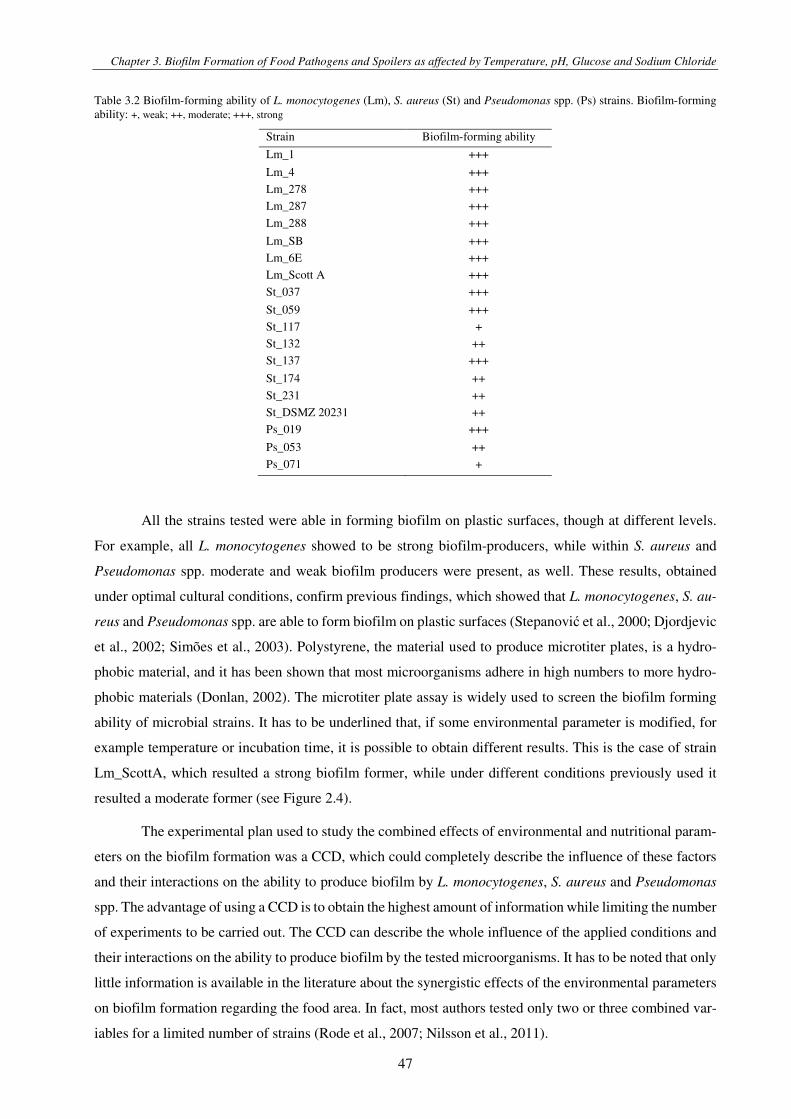
Table 3.2 Biofilm-forming ability of L. monocytogenes (Lm), S. aureus (St) and Pseudomonas spp. (Ps) strains. Biofilm-forming ability: +, weak; ++, moderate; +++, strong .................................................................................................................................... 47
Table 4.1 Efficacy of PA on biofilms (Log CFU/cm2) formed by P. fluorescens Ps_019; *ND, not detectable, <1 CFU/cm2 ..... 100
Table 5.1 Sanitizing products used for biofilm treatments ............................................................................................................ 106
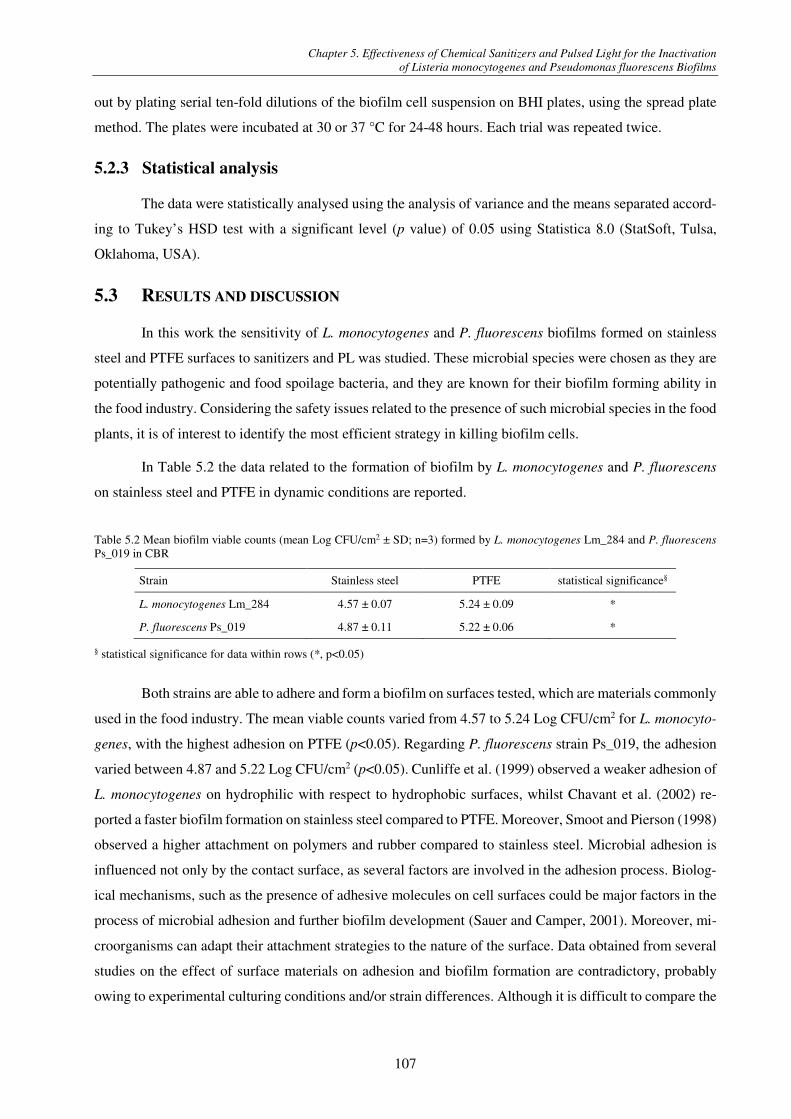
Table 5.2 Mean biofilm viable counts (mean Log CFU/cm2 ± SD; n=3) formed by L. monocytogenes Lm_284 and P. fluorescens Ps_019 in CBR .............................................................................................................................................................................. 107
Table 5.3 Reduction (mean -Log (Nt/N0 ± SD; n=3) of L. monocytogenes Lm_284 biofilms treated by commercial sanitizers; #ND, not detectable, < 1 CFU/cm2 ......................................................................................................................................................... 108
Table 5.4 Reduction (mean -Log (Nt/N0 ± SD; n=3) of P. fluorescens Ps_019 biofilms treated by commercial sanitizers; #ND, not detectable,< 1 CFU/cm2 ................................................................................................................................................................ 108
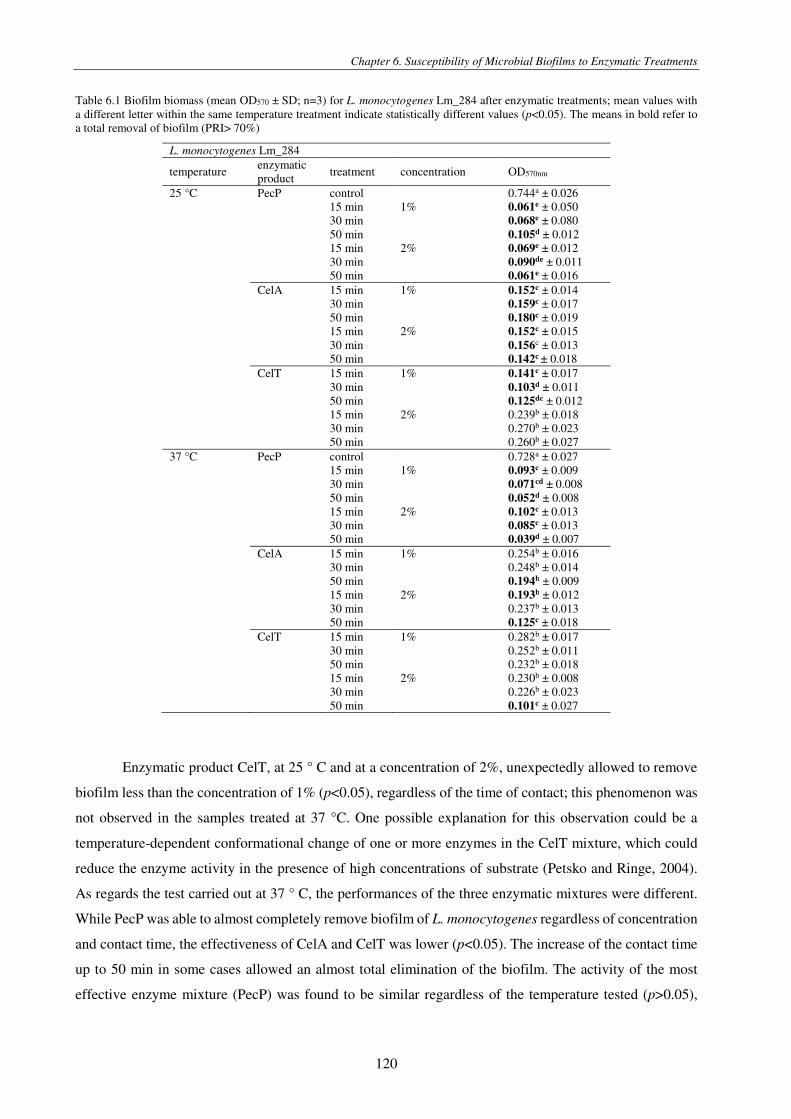
Table 6.1 Biofilm biomass (mean OD570 ± SD; n=3) for L. monocytogenes Lm_284 after enzymatic treatments; mean values with a different letter within the same temperature treatment indicate statistically different values (p<0.05). The means in bold refer to a total removal of biofilm (PRI> 70%) .......................................................................................................................................... 120
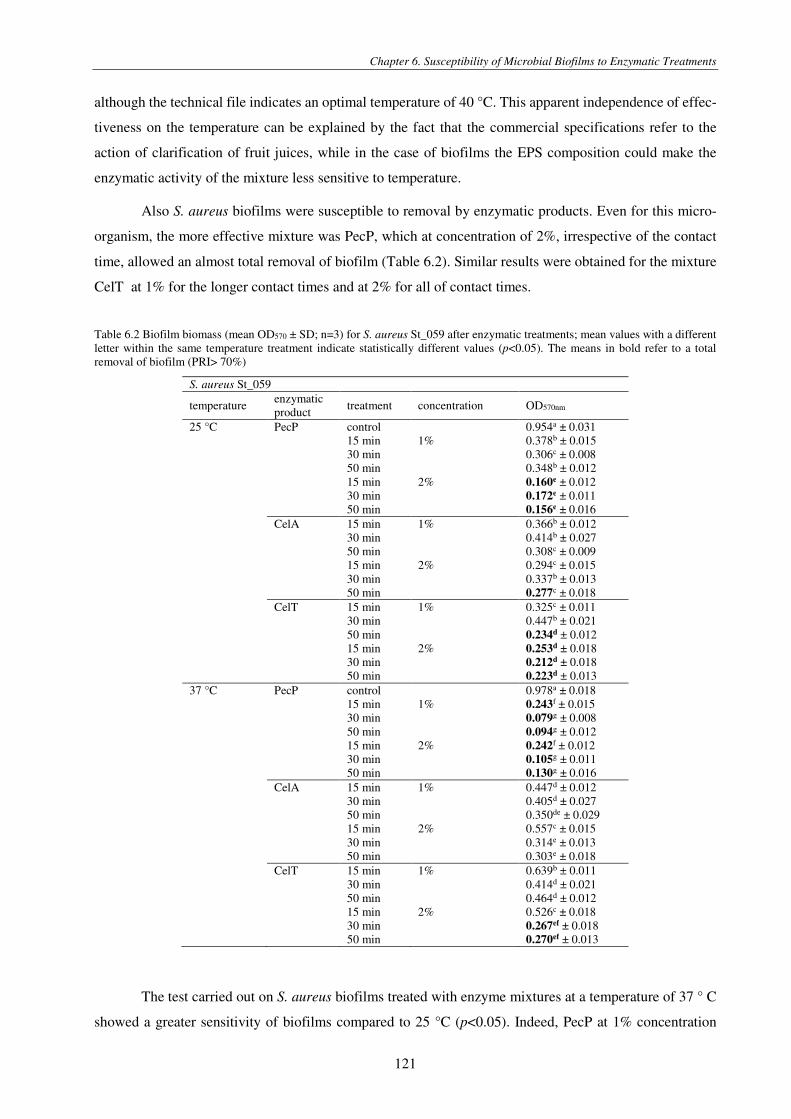
Table 6.2 Biofilm biomass (mean OD570 ± SD; n=3) for S. aureus St_059 after enzymatic treatments; mean values with a different letter within the same temperature treatment indicate statistically different values (p<0.05). The means in bold refer to a total removal of biofilm (PRI> 70%) .................................................................................................................................................... 121
Table 6.3 Biofilm biomass (mean OD570 ± SD; n=3) for P. fluorescens Ps_019 after enzymatic treatments; mean values with a different letter within the same temperature treatment indicate statistically different values (p<0.05). The means in bold refer to a total removal of biofilm (PRI> 70%) ............................................................................................................................................ 122
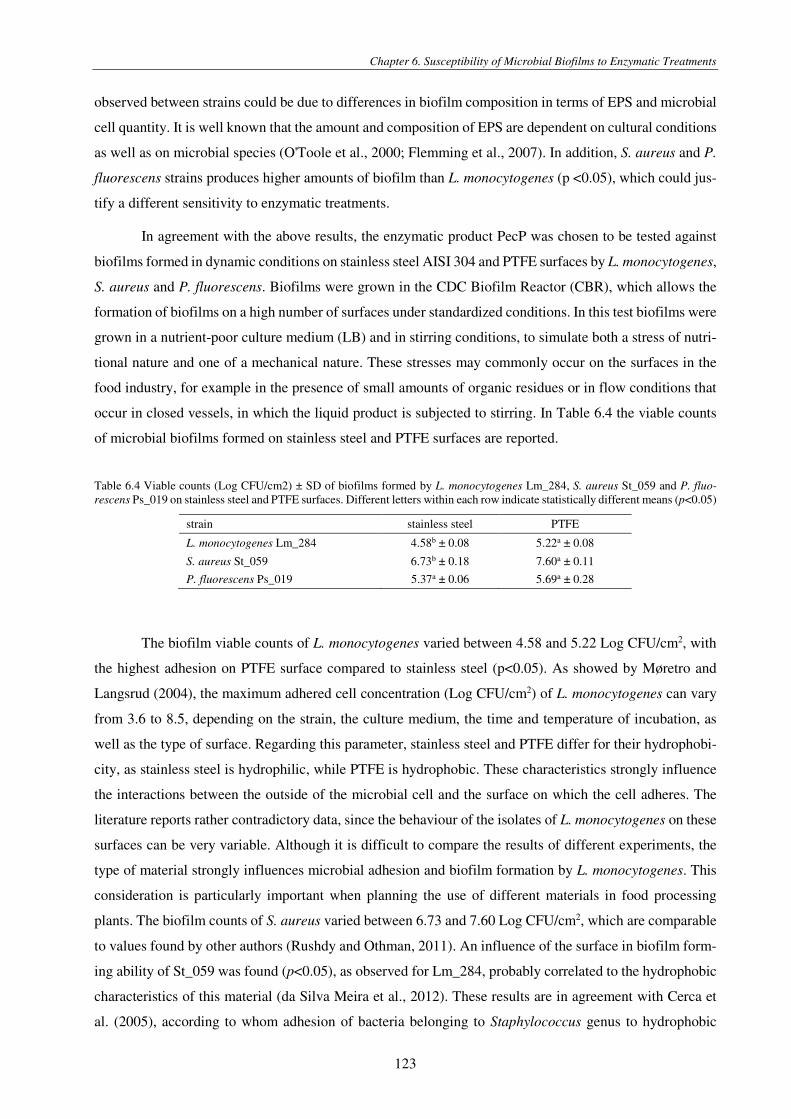
Table 6.4 Viable counts (Log CFU/cm2) ± SD of biofilms formed by L. monocytogenes Lm_284, S. aureus St_059 and P.
fluorescens Ps_019 on stainless steel and PTFE surfaces. Different letters within each row indicate statistically different means (p<0.05) ......................................................................................................................................................................................... 123
Table 7.1. Bacterial species isolated from microbrewery surfaces; *the first two letters indicate the sampling site (Bm, bottling machine; Cb, conveyor belt; Dp, drainage pit; Dv, fermenter drain valve; Pt, pipe thread), the first number indicates the sampling time (_1_, 1st sampling time; _2_, 2nd sampling time) ................................................................................................................... 139
2
LIST OF FIGURES
Figure 1.1 Schematic diagram of three distinct biofilm models, (A) comprising separated microbial stack, (B) penetrated water channel and (C) dense confluent structures. Microbial cells are in orange; the EPS matrix is in green; the solid surface is in light blue. The arrows indicate water channels. ....................................................................................................................................... 10
Figure 1.2 CLSM image of Pseudomonas fluorescens 5-days-old biofilm formed on stainless steel AISI 304. Biofilm matrix is in blue, viable cells are in green and dead cells are in red ................................................................................................................... 11
Figure 1.4 Important variables in cell attachment, biofilm formation and development (Simões et al., 2010) ................................ 15
Figure 1.5 Ranking of different materials with regard to support of biofilm growth (Meyer, 2003) ............................................... 19
Figure 1.6 Advantages and disadvantages of some disinfectants used in the food processes (Wirtanen and Salo, 2003) ............... 21
Figure 1.7 Effectiveness of benzalkonium chloride (BAC) against Staphylococcus aureus biofilms and planktonic cells after 48 h at 25 °C. MBEC: minimal biofilm eradication concentration; MBC: minimal bactericidal concentration (Vázquez-Sánchez et al., 2014) ............................................................................................................................................................................................... 22
Figure 1.8 Radiation sensitivity of three Salmonella isolates in planktonic and biofilm-associated forms (Niemira and Solomon, 2005) ............................................................................................................................................................................................... 23
Figure 1.9 Bacterial counts of Salmonella enterica serovar Enteritidis attached cells on stainless steel coupons AISI 304 after treatment with sanitizing solutions with lemongrass (Cymbopogon citrates) or peppermint (Mentha piperita) essential oils, expressed as Log CFU/cm2, after 240 h of biofilm formation (Valeriano et al., 2012) ................................................................... 24
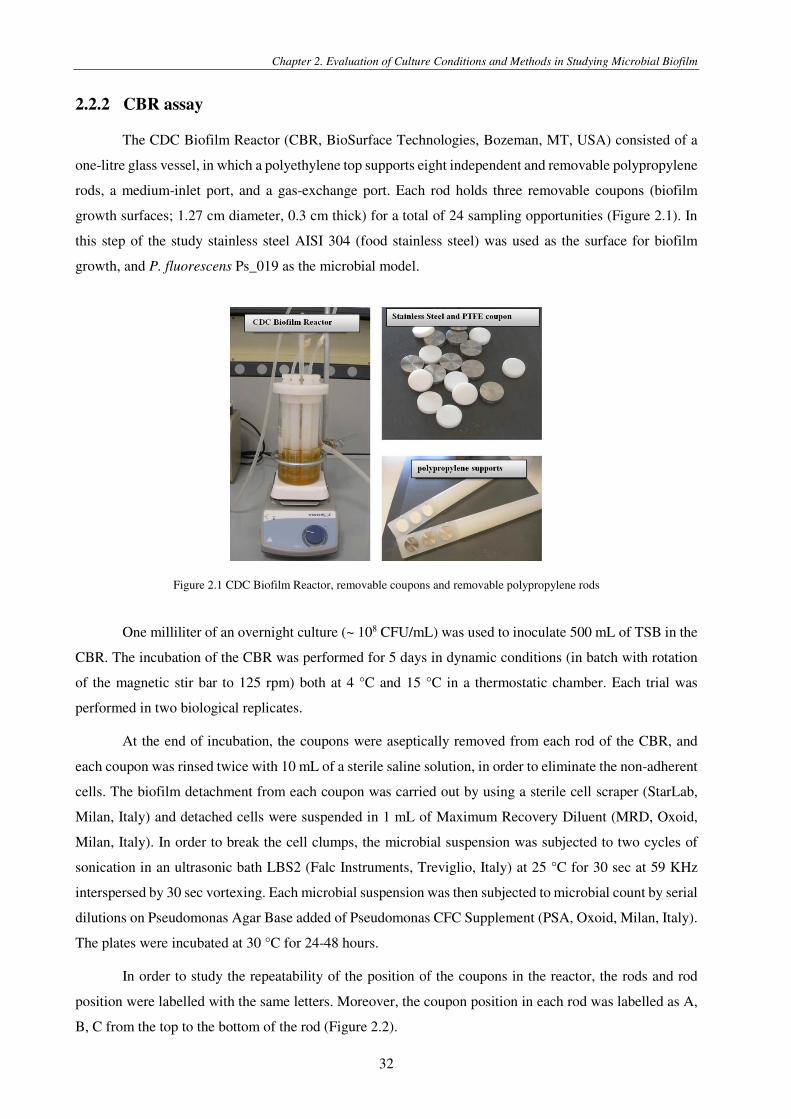
Figure 2.2 Labelled positions of rods (A) and coupons (B) within CBR ......................................................................................... 33
Figure 2.3 Biofilm biomass (mean OD570 ± SD; n=13) production by L. monocytogenes strains in different culture media .......... 35
Figure 2.4 Biofilm biomass (mean OD570 ± SD; n=3) production by each L. monocytogenes strain in BHI, TSB and LB ............. 36
Figure 2.5 Biofilm formation ability of L. monocytogenes strains on polystyrene .......................................................................... 37
Figure 2.6 Mean viable counts (Log CFU/cm2) ± SD of L. monocytogenes biofilms grown in microtiter plates (Lm_1, Lm_Scott A and Lm_278) (n=3) and in CBR (Lm_278*) (n=2) as evaluated by SP and DP methods .............................................................. 40
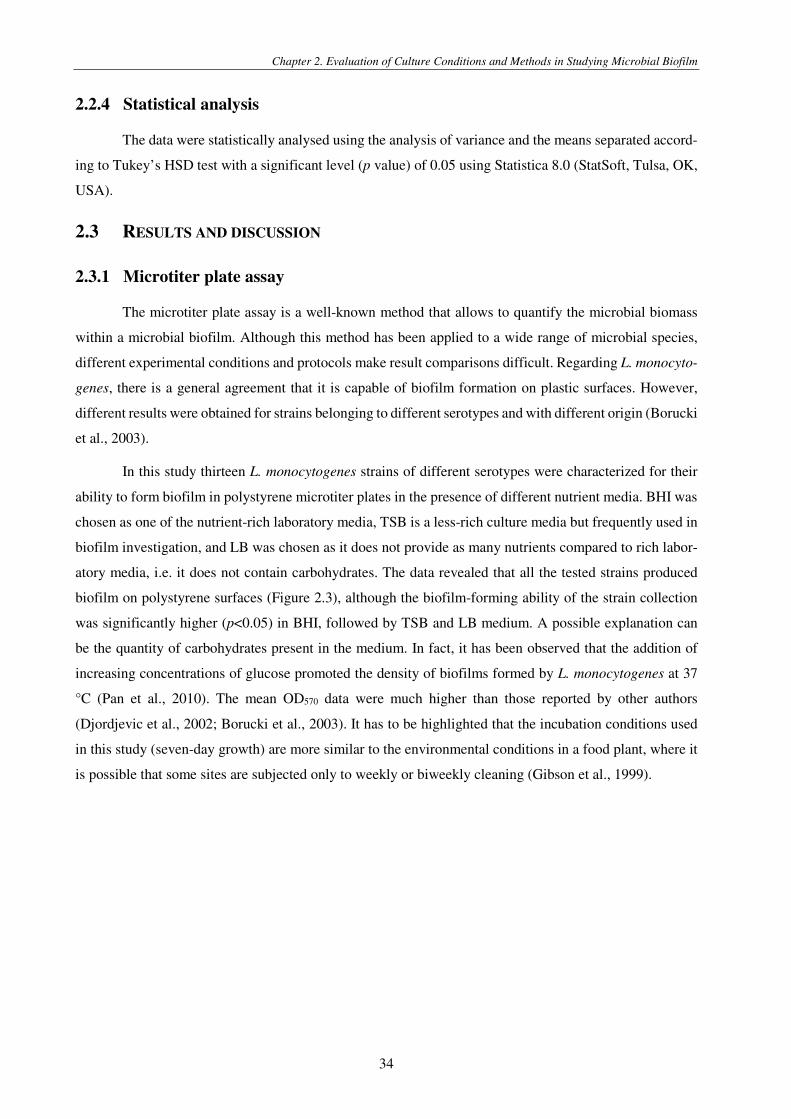
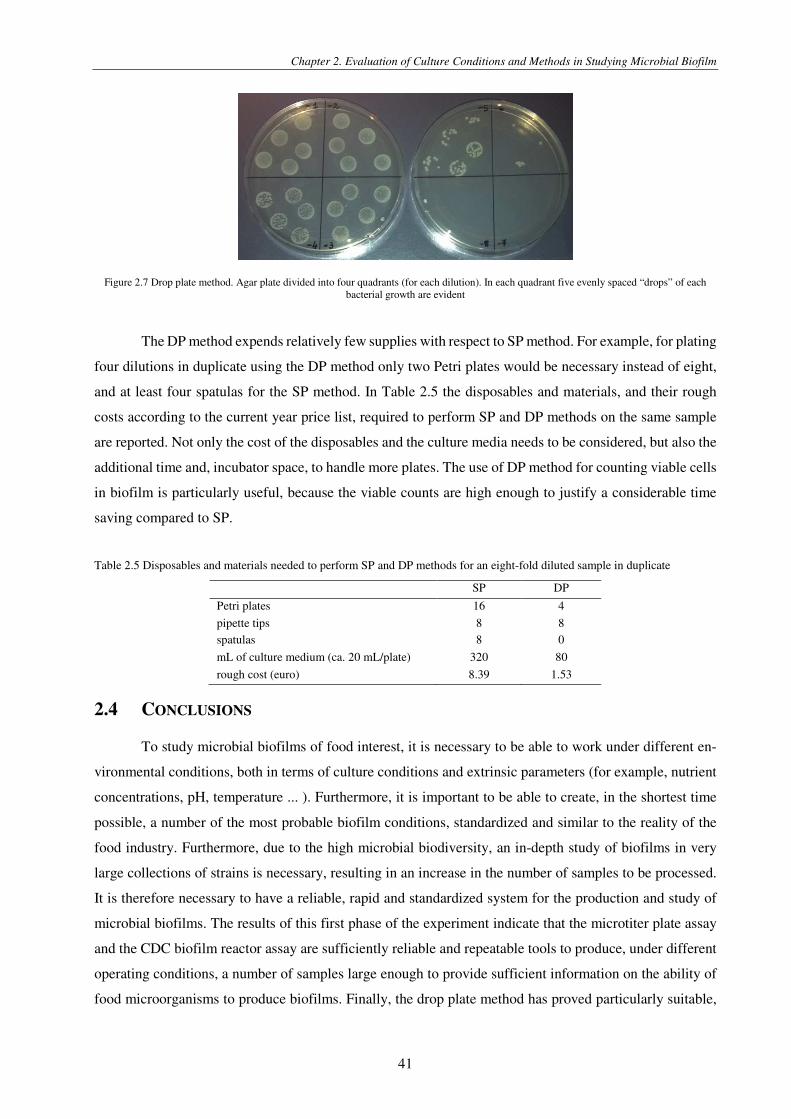
Figure 2.7 Drop plate method. Agar plate divided into four quadrants (for each dilution). In each quadrant five evenly spaced “drops” of each bacterial growth are evident ................................................................................................................................... 41
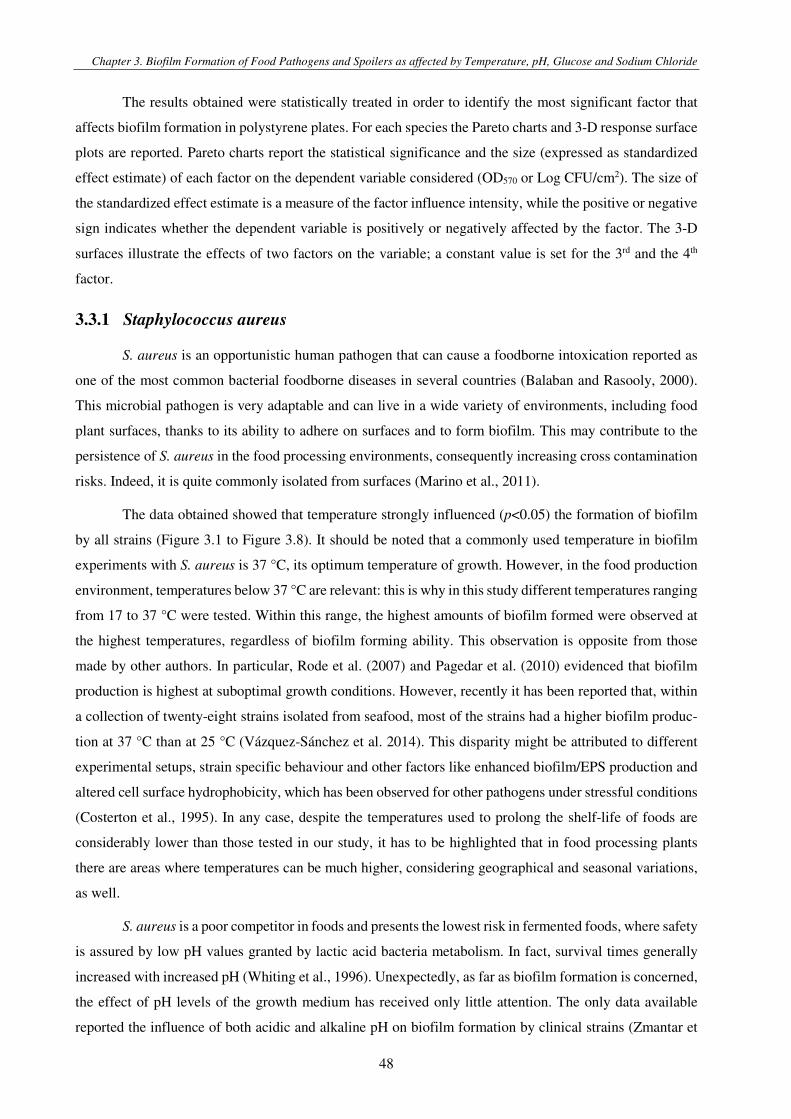
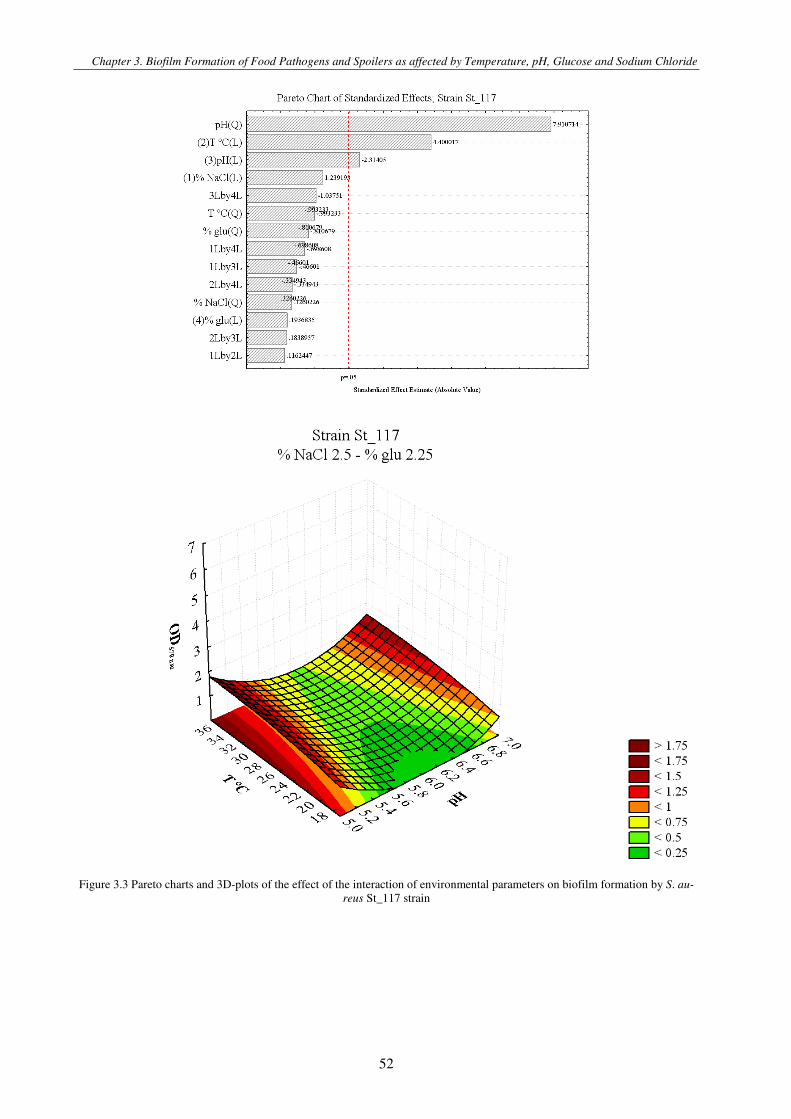
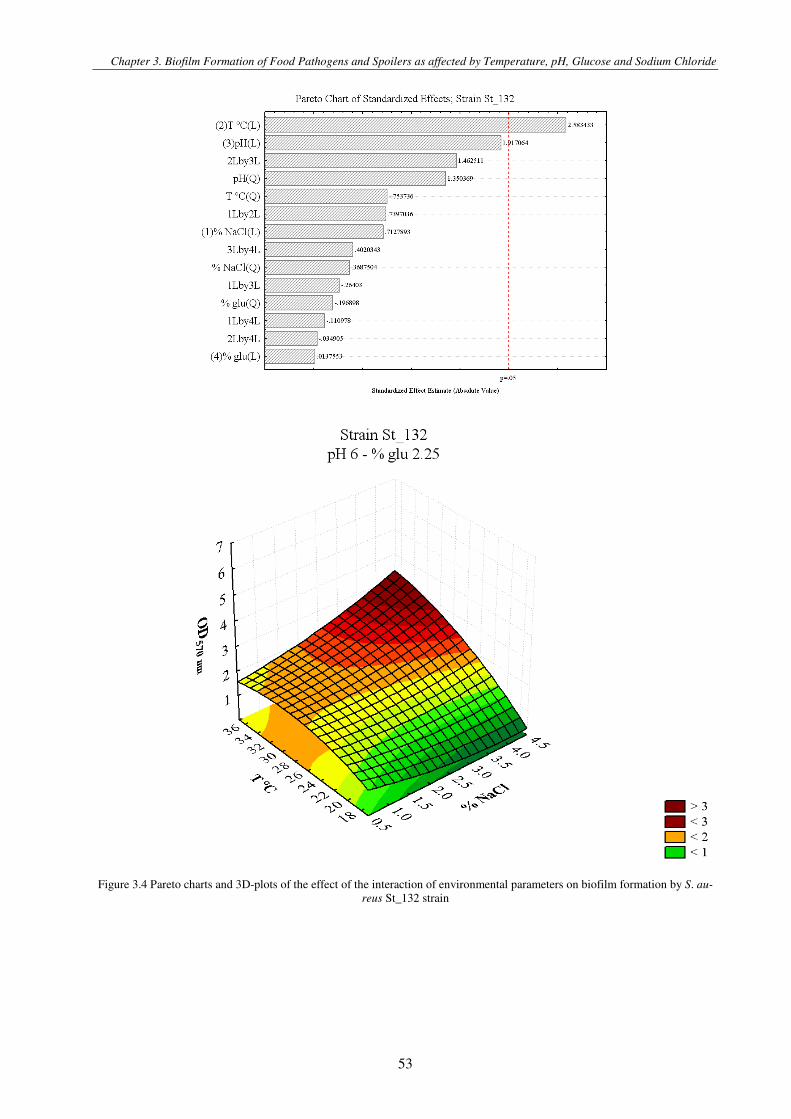
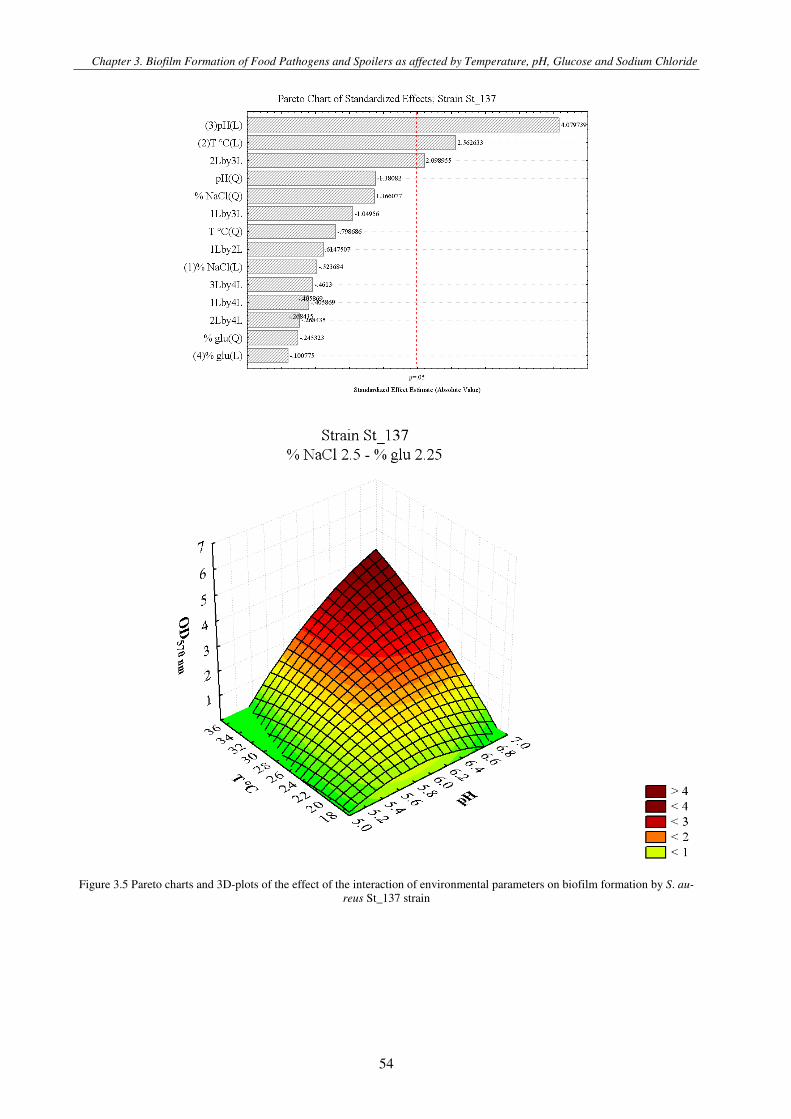
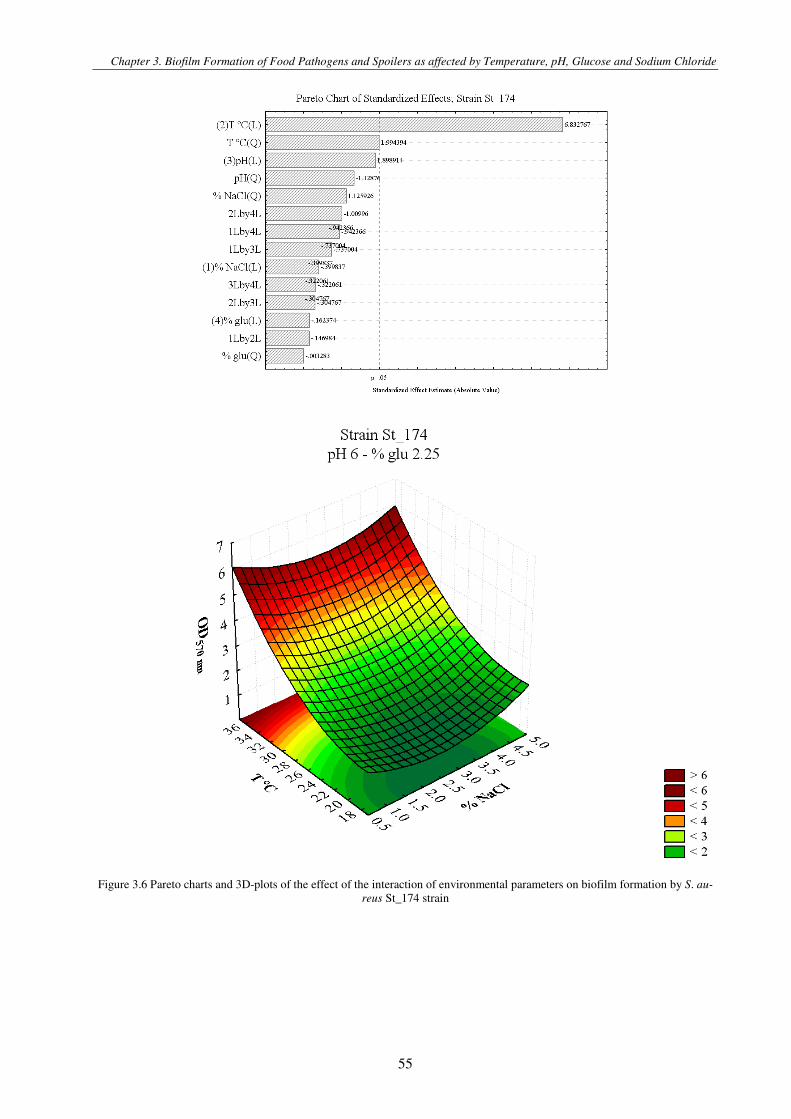
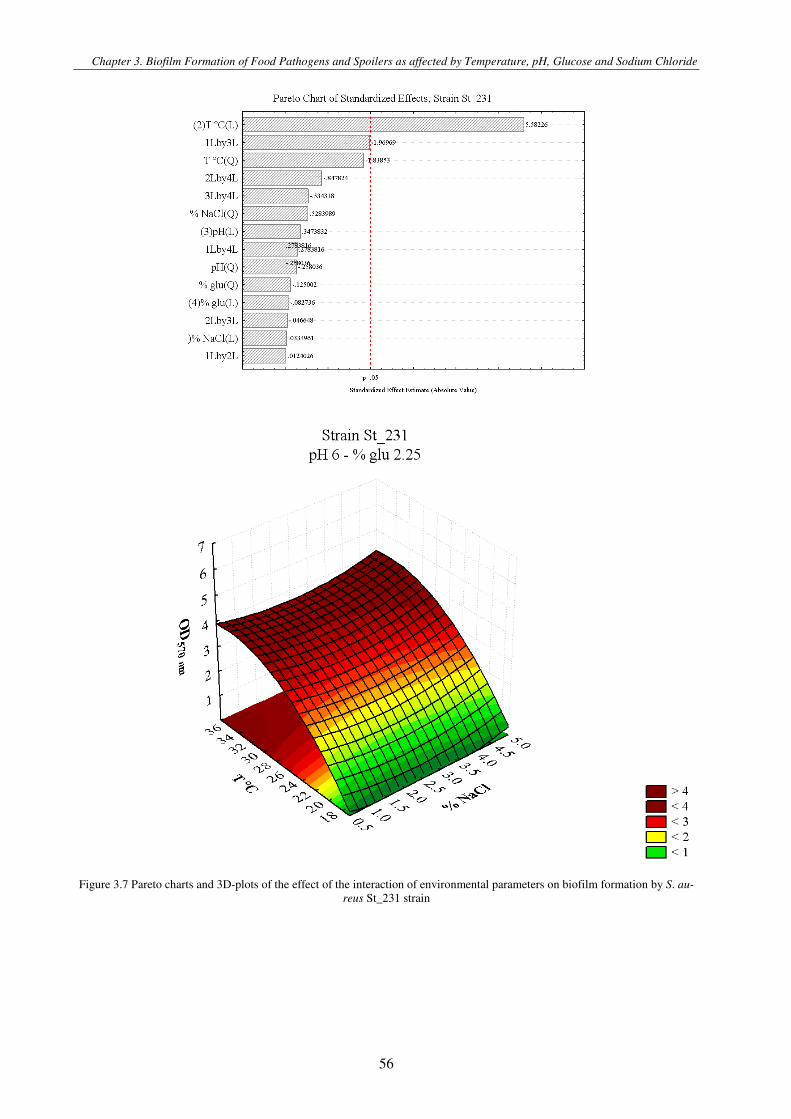
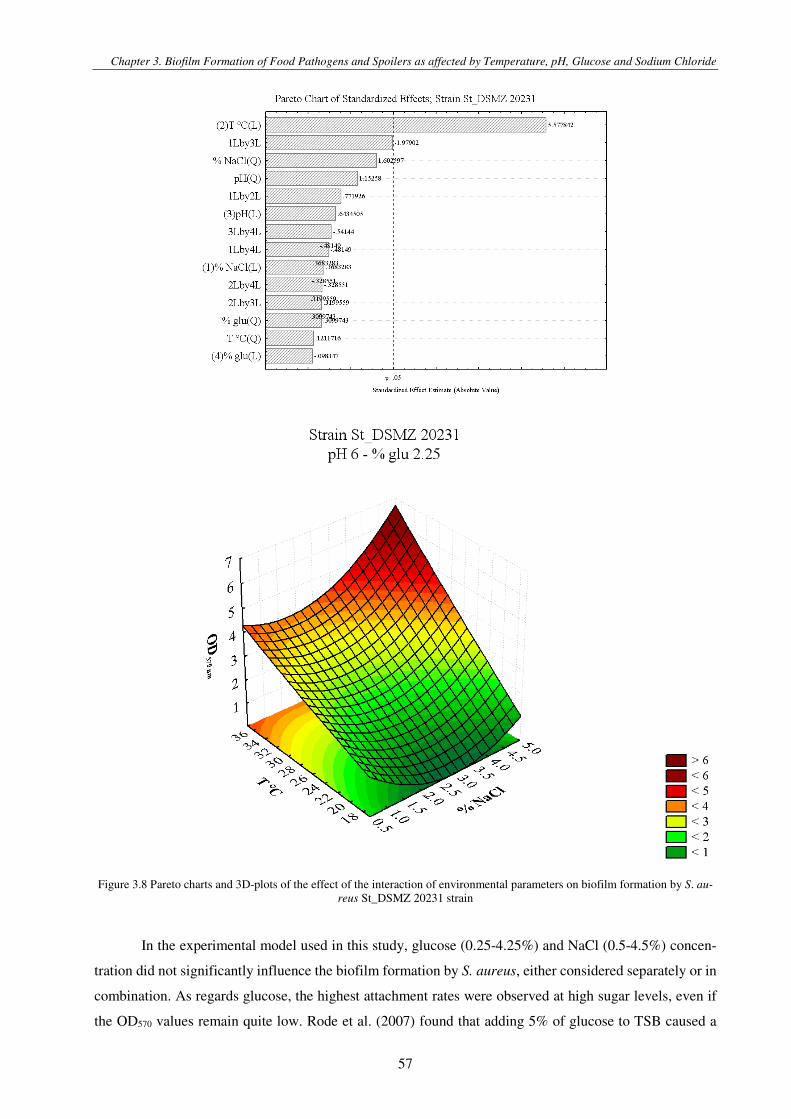
Figure 3.1 Pareto charts and 3D-plots of the effect of the interaction of environmental parameters on biofilm formation by S. aureus strains .............................................................................................................................................................................................. 57
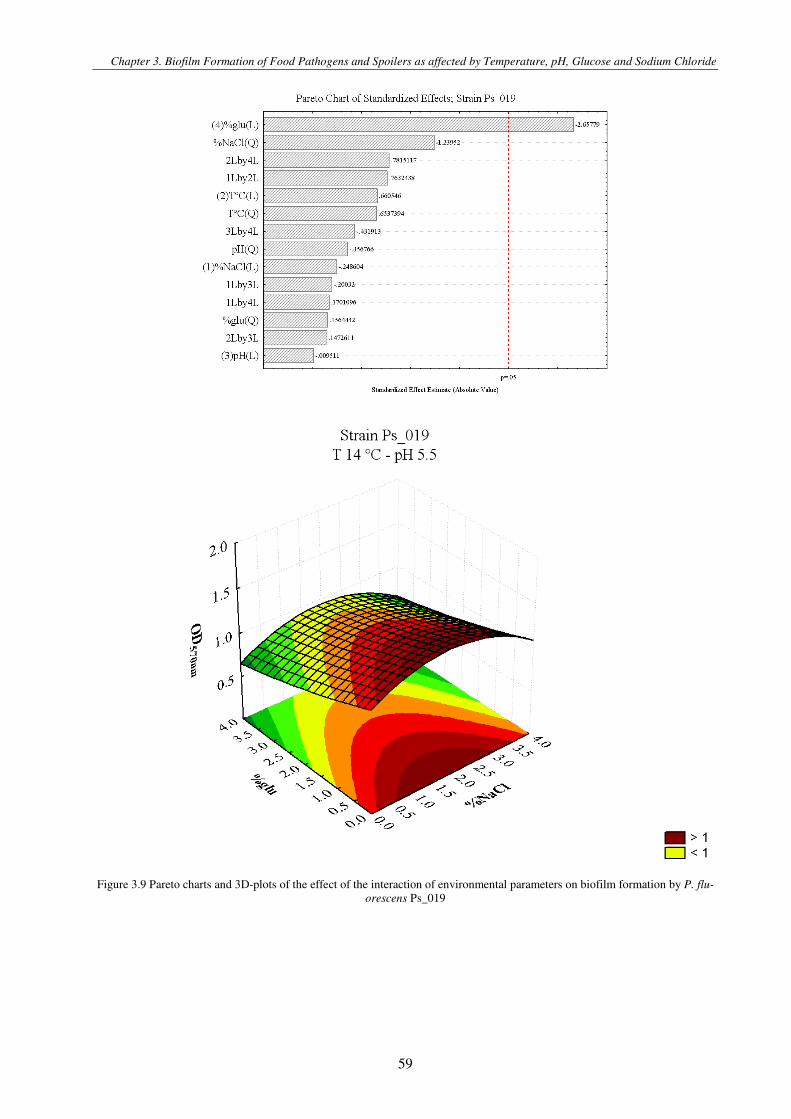
Figure 3.2 Pareto charts and 3D-plots of the effect of the interaction of environmental parameters on biofilm formation by P.
fluorescens Ps_019, P. fragi Ps_053 and P. putida Ps_071 ............................................................................................................. 61
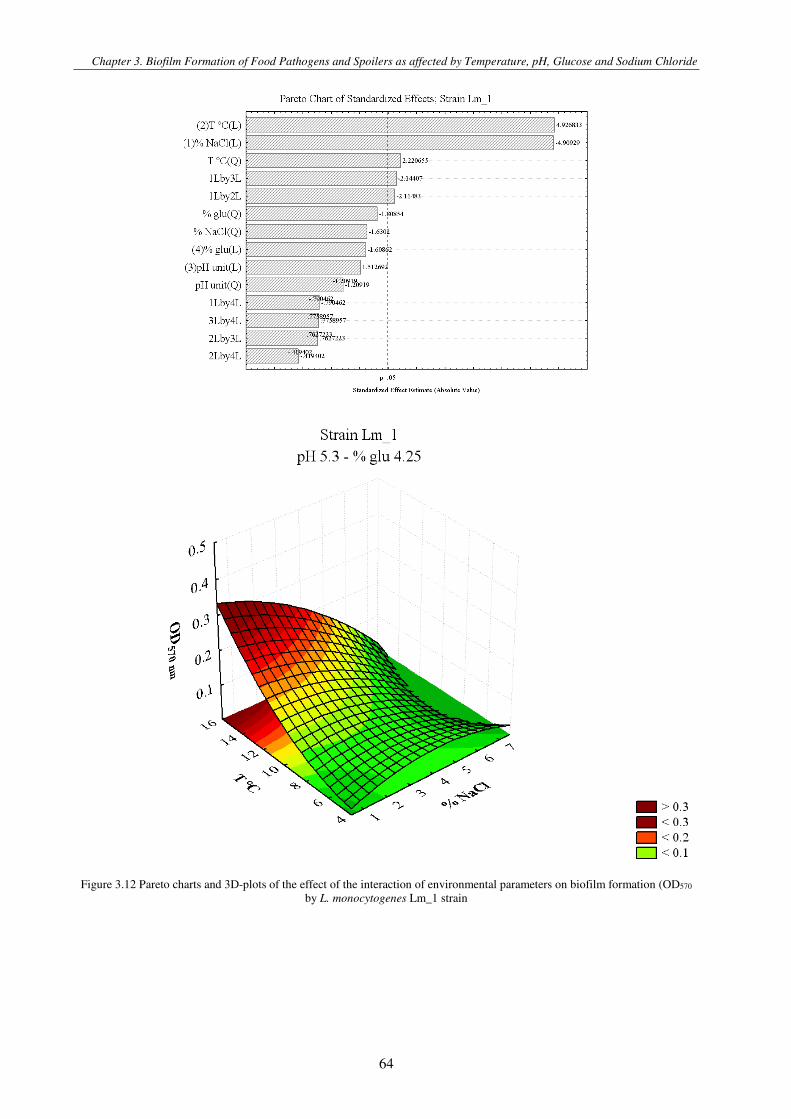
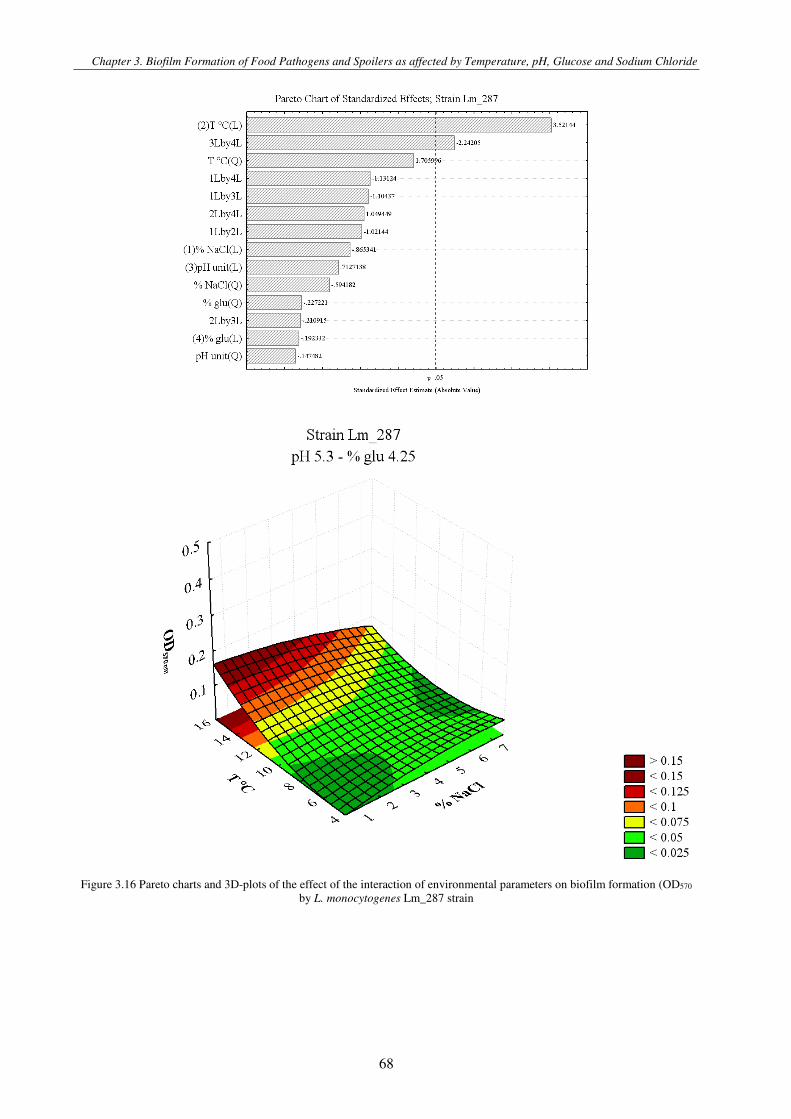
Figure 3.3 Pareto charts and 3D-plots of the effect of the interaction of environmental parameters on biofilm formation (OD570 by L. monocytogenes strains ................................................................................................................................................................. 71
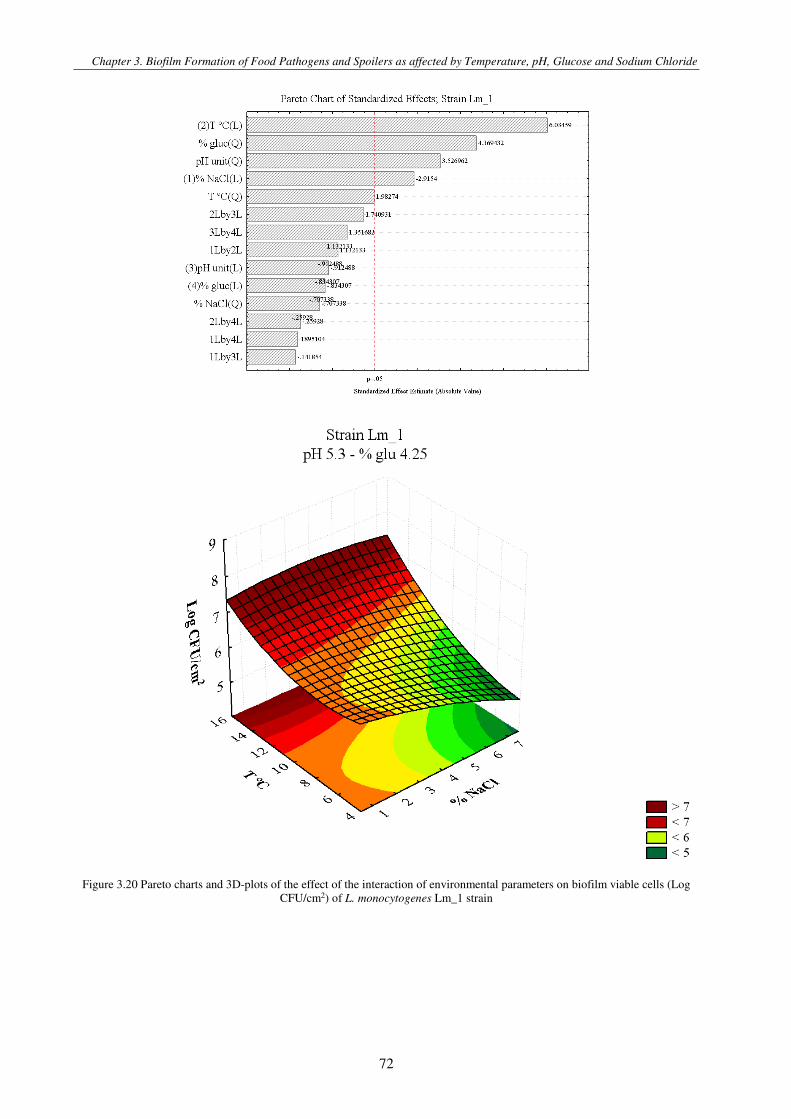
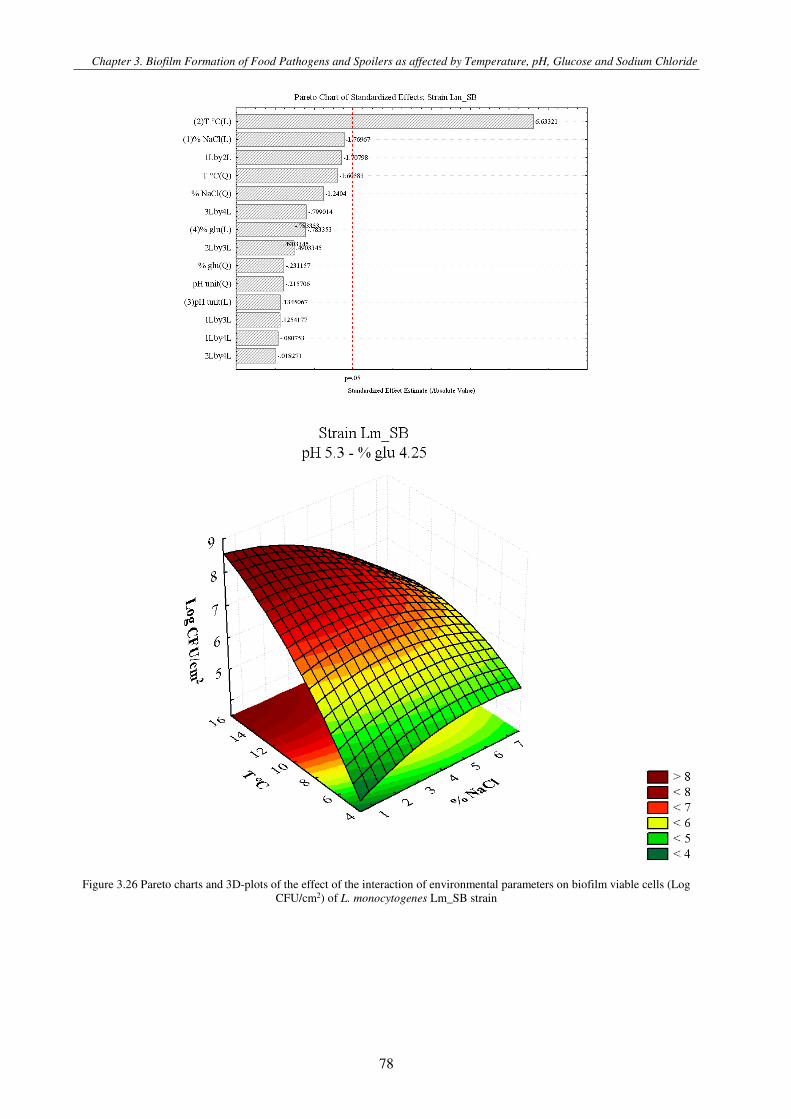
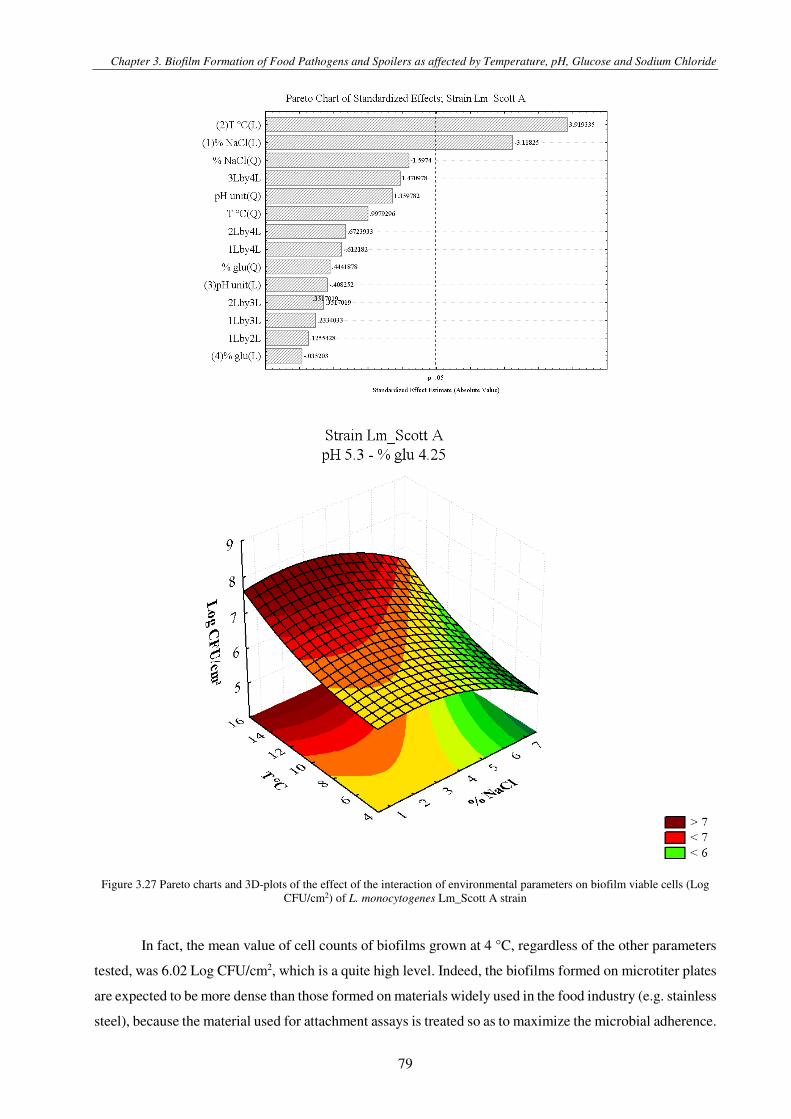
Figure 3.4 Pareto charts and 3D-plots of the effect of the interaction of environmental parameters on biofilm viable cells (Log CFU/cm2) of L. monocytogenes strain ............................................................................................................................................. 79
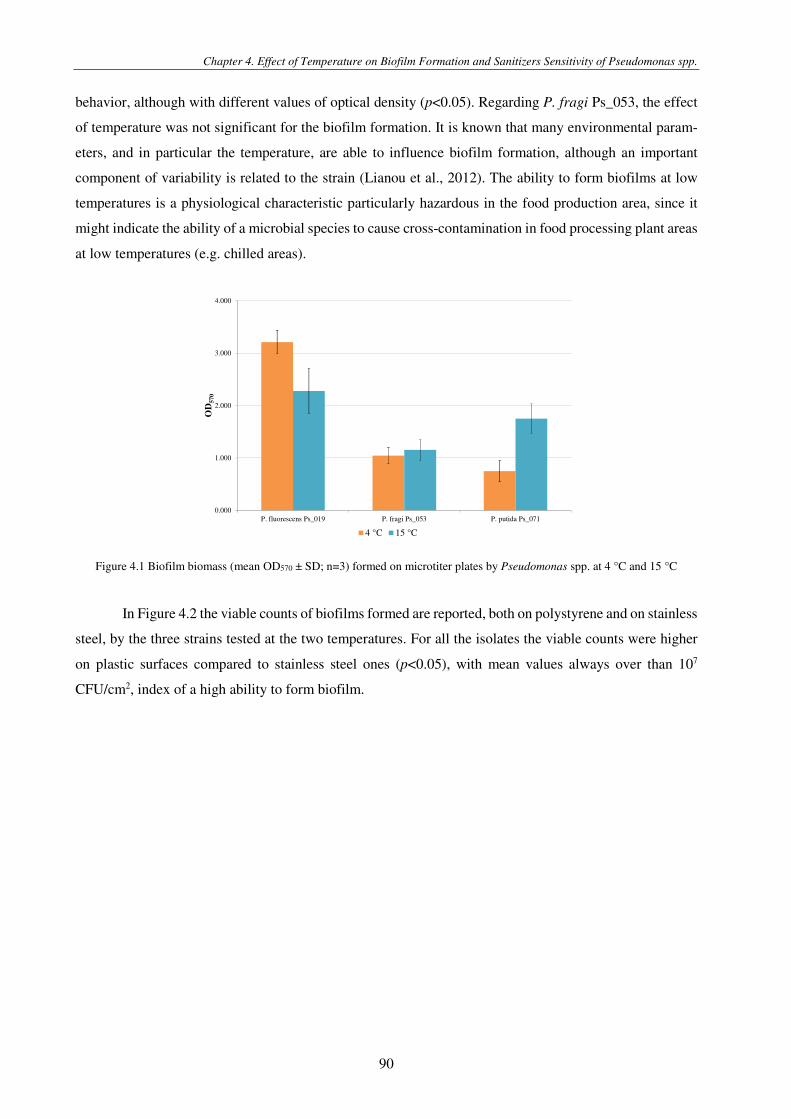
Figure 4.1 Biofilm biomass (mean OD570 ± SD; n=3) formed on microtiter plates by Pseudomonas spp. at 4 °C and 15 °C ......... 90
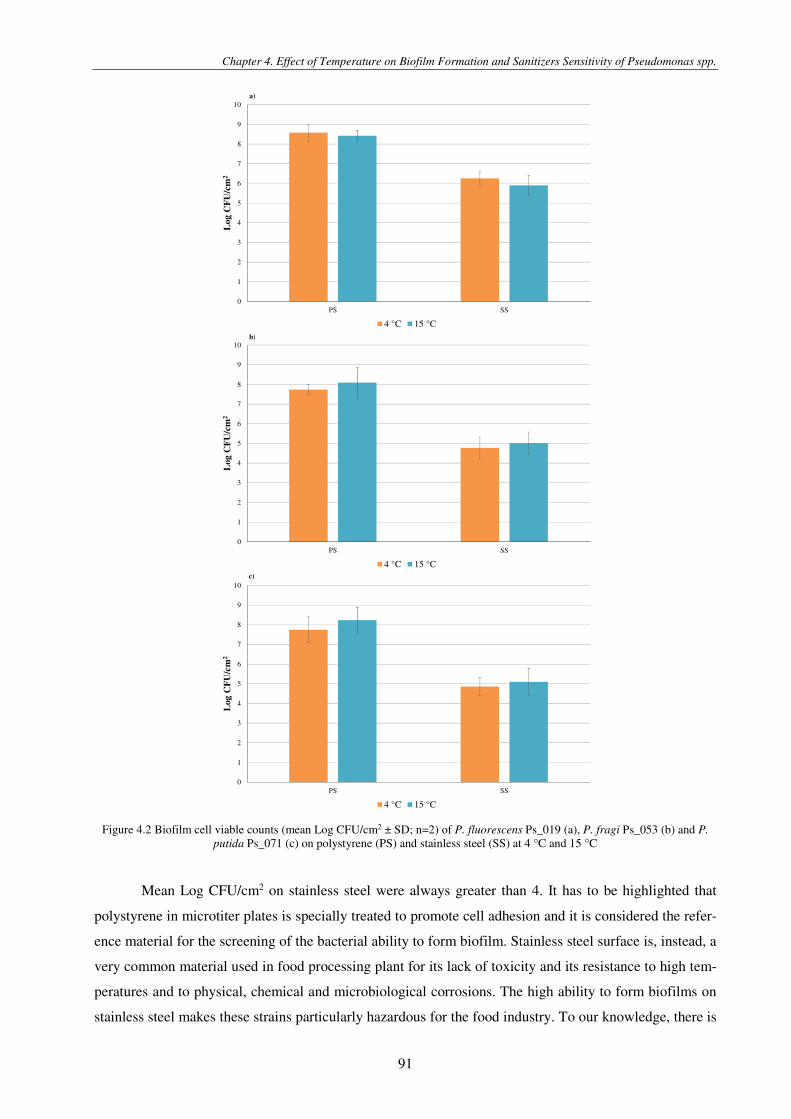
Figure 4.2 Biofilm cell viable counts (mean Log CFU/cm2 ± SD) of P. fluorescens Ps_019 (a), P. fragi Ps_053 (b) and P. putida Ps_071 (c) on polystyrene (PS) (n=3) and stainless steel (SS) (n=2) at 4 °C and 15 °C .................................................................. 91
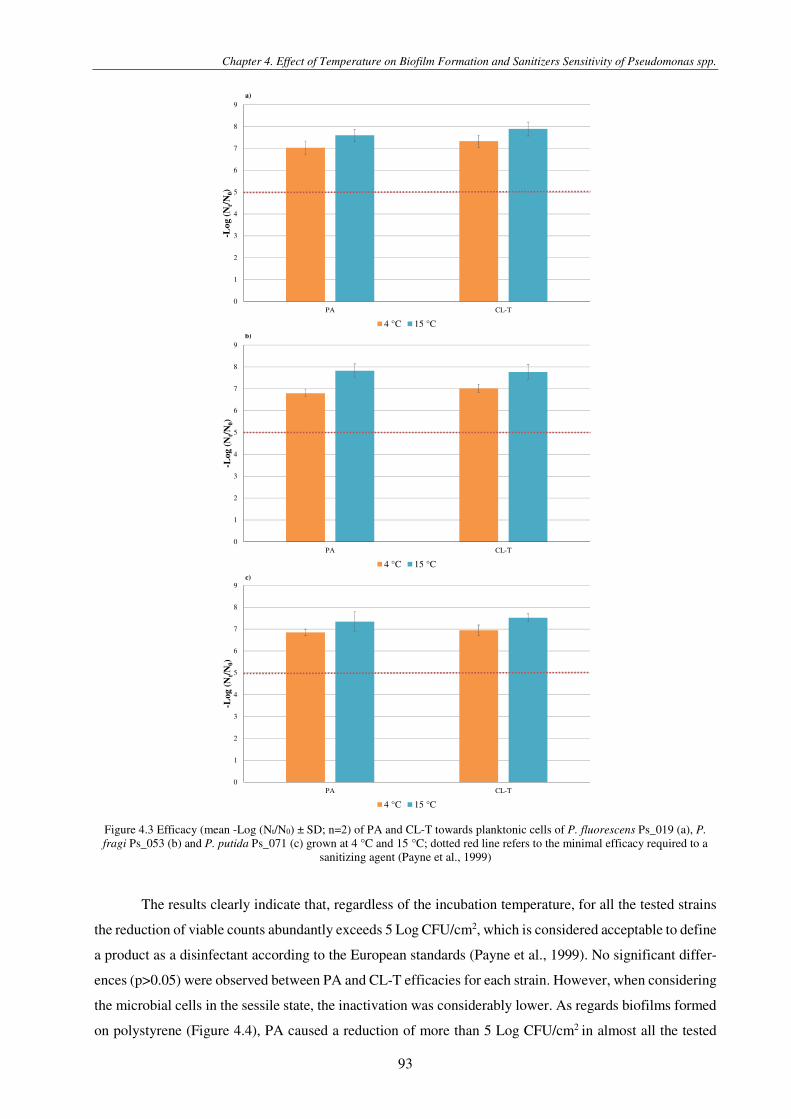
Figure 4.3 Efficacy (mean -Log (Nt/N0) ± SD; n=2) of PA and CL-T towards planktonic cells of P. fluorescens Ps_019 (a), P. fragi Ps_053 (b) and P. putida Ps_071 (c) grown at 4 °C and 15 °C; dotted red line refers to the minimal efficacy required to a sanitizing agent (Payne et al., 1999) ................................................................................................................................................................ 93
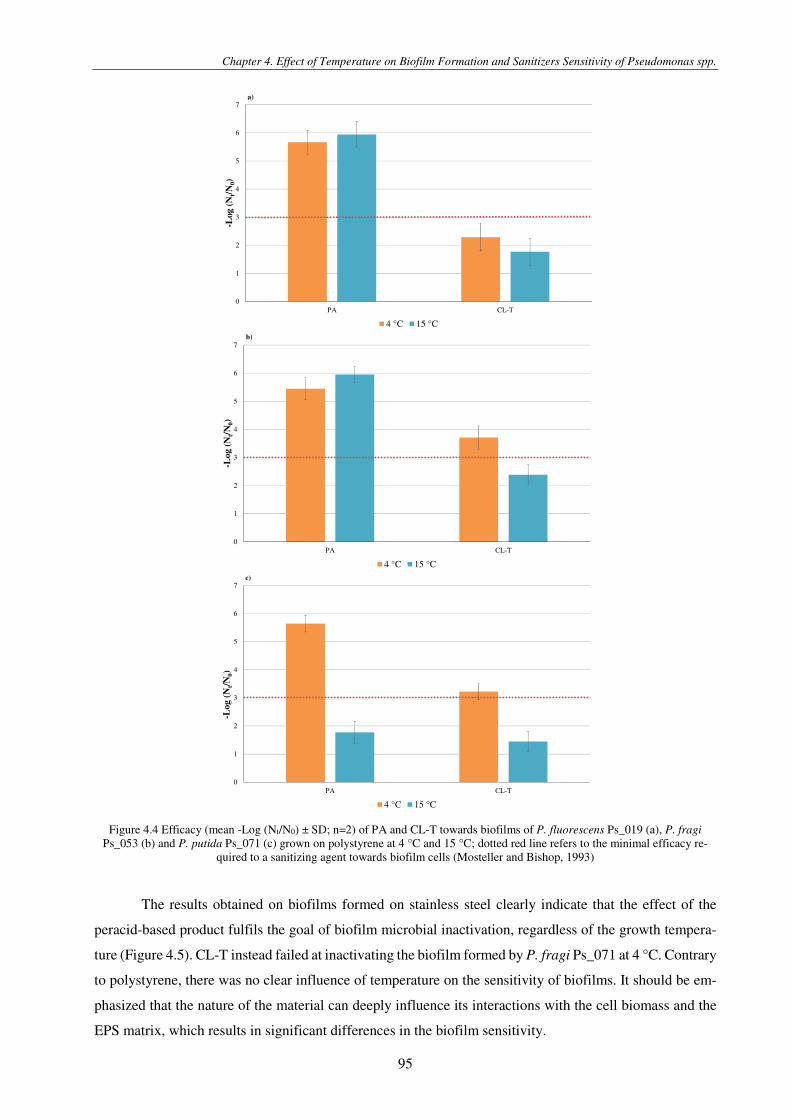
Figure 4.4 Efficacy (mean -Log (Nt/N0) ± SD; n=2) of PA and CL-T towards biofilms of P. fluorescens Ps_019 (a), P. fragi Ps_053 (b) and P. putida Ps_071 (c) grown on polystyrene at 4 °C and 15 °C; dotted red line refers to the minimal efficacy required to a sanitizing agent towards biofilm cells (Mosteller and Bishop, 1993) .............................................................................................. 95
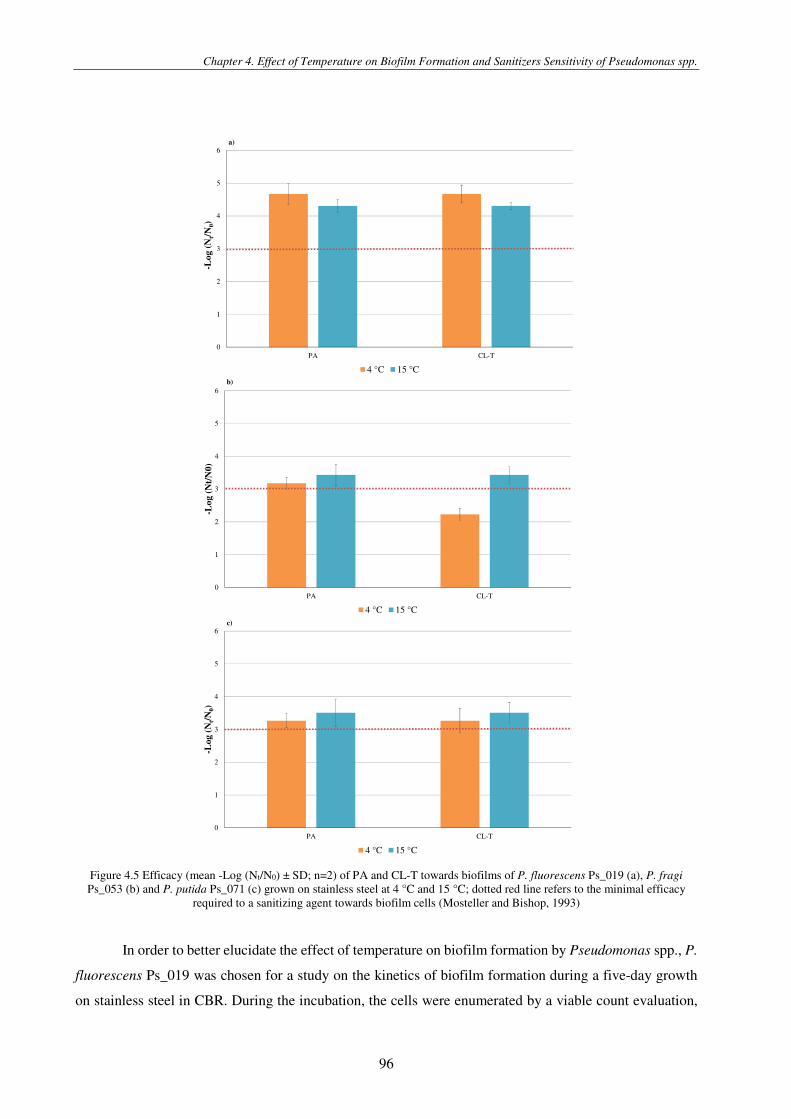
Figure 4.5 Efficacy (mean -Log (Nt/N0) ± SD; n=2) of PA and CL-T towards biofilms of P. fluorescens Ps_019 (a), P. fragi Ps_053 (b) and P. putida Ps_071 (c) grown on stainless steel at 4 °C and 15 °C; dotted red line refers to the minimal efficacy required to a sanitizing agent towards biofilm cells (Mosteller and Bishop, 1993) .............................................................................................. 96
3
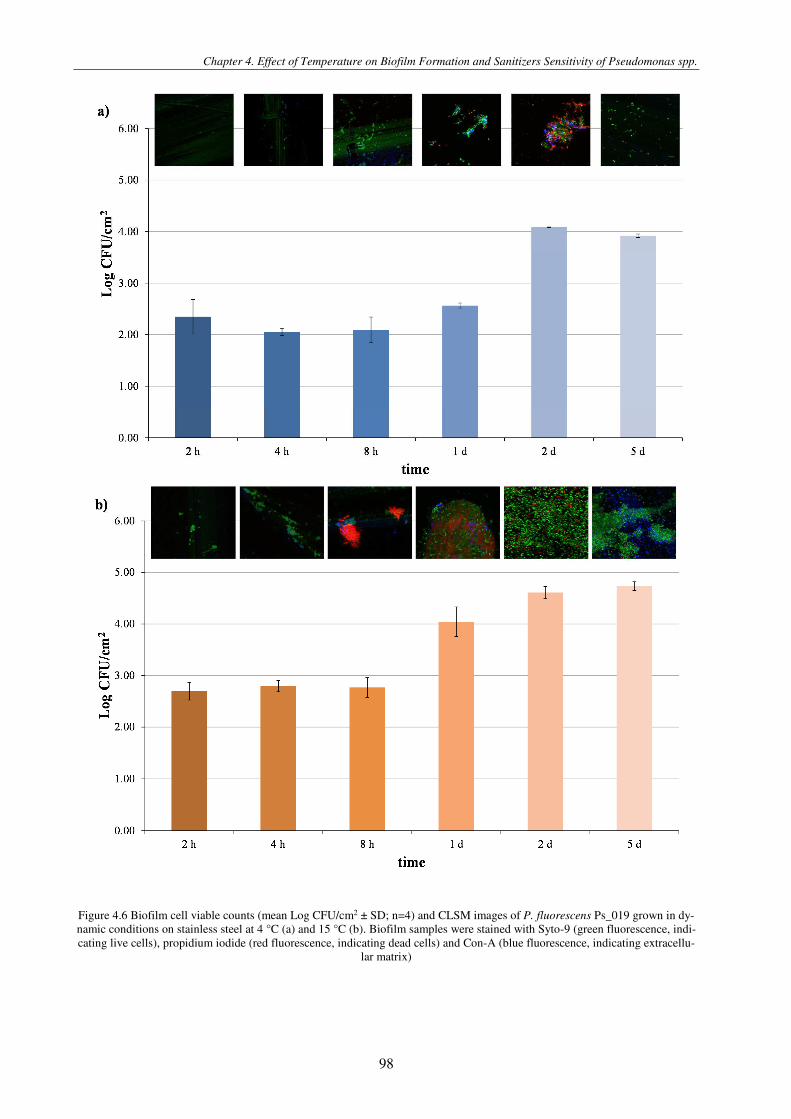
Figure 4.6 Biofilm cell viable counts (mean Log CFU/cm2 ± SD; n=4) and CLSM images of P. fluorescens Ps_019 grown in dynamic conditions on stainless steel at 4 °C (a) and 15 °C (b). Biofilm samples were stained with Syto-9 (green fluorescence, indicating live cells), propidium iodide (red fluorescence, indicating dead cells) and Con-A (blue fluorescence, indicating extracellular matrix) ........................................................................................................................................................................ 98
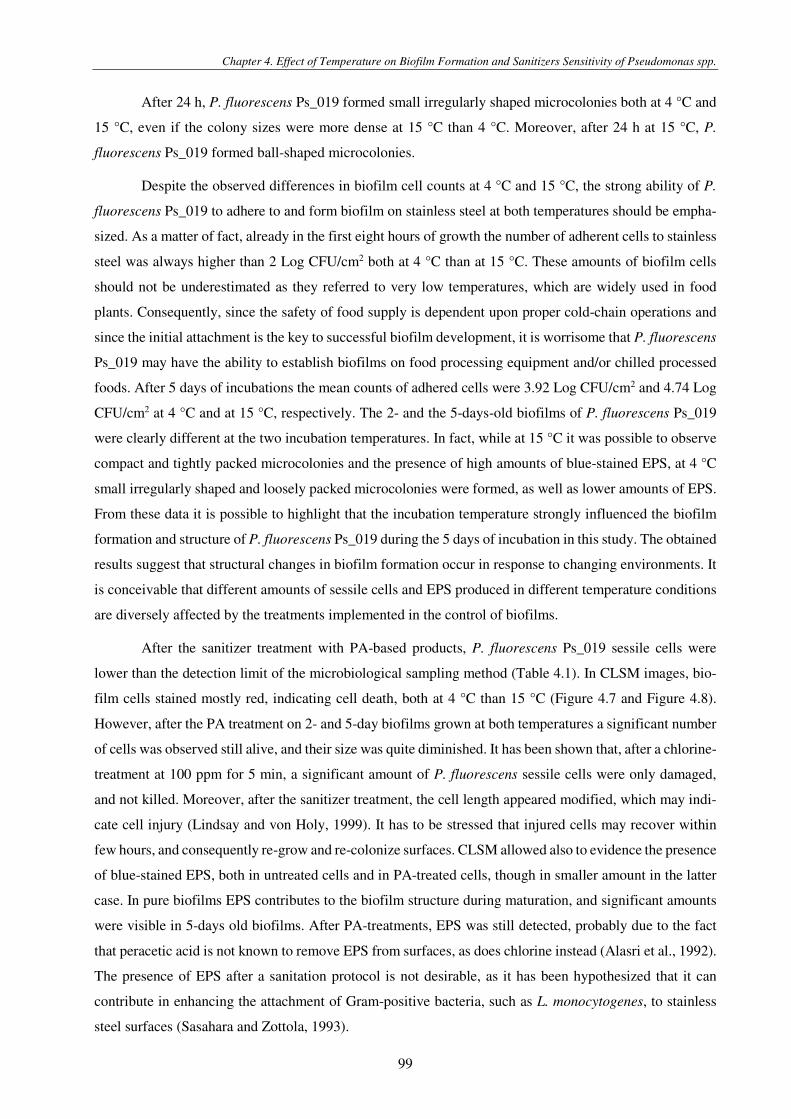
Figure 4.7 CLSM images of P. fluorescens biofilm formed at 4 °C; (a) 2-days-old biofilm before and (b) after sanitizer treatment, (c) 5-days-old biofilm before and (d) after sanitizer treatment ...................................................................................................... 101
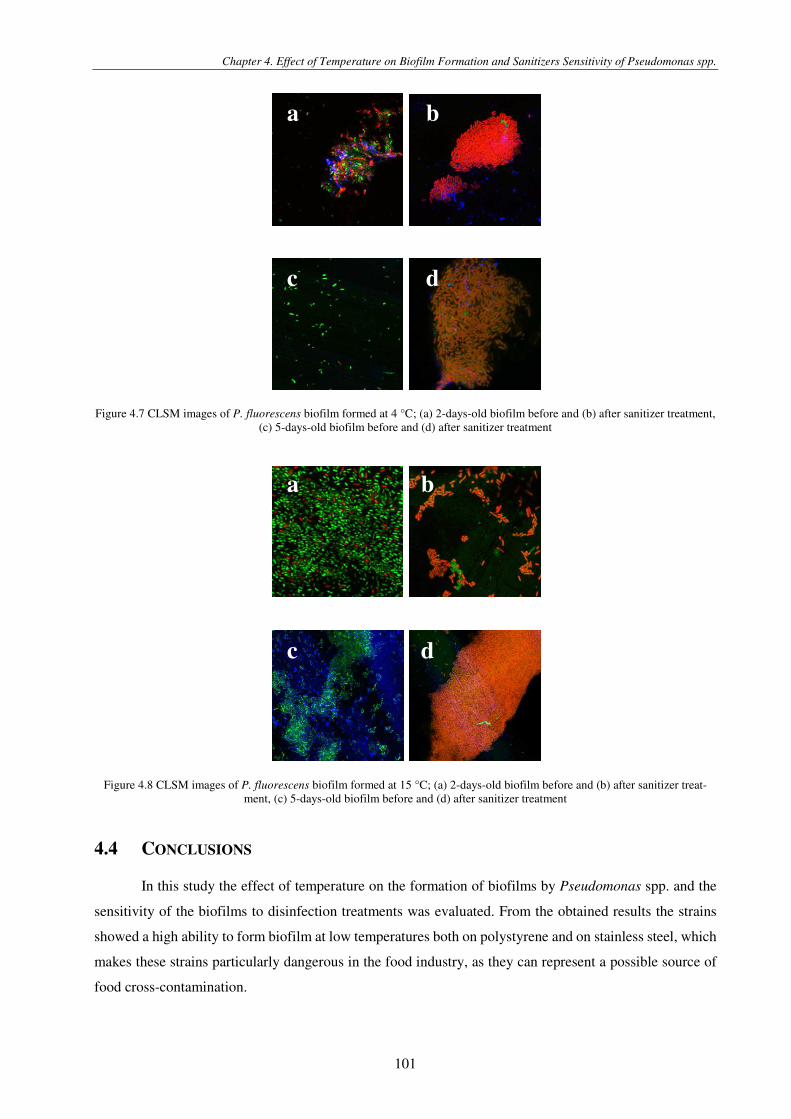
Figure 4.8 CLSM images of P. fluorescens biofilm formed at 15 °C; (a) 2-days-old biofilm before and (b) after sanitizer treatment, (c) 5-days-old biofilm before and (d) after sanitizer treatment ...................................................................................................... 101
Figure 5.1 PL inactivation (mean Log CFU/cm2 ± SD; n=2) of L. monocytogenes Lm_284 biofilms as affected by the distance between lamps and sample ............................................................................................................................................................ 109
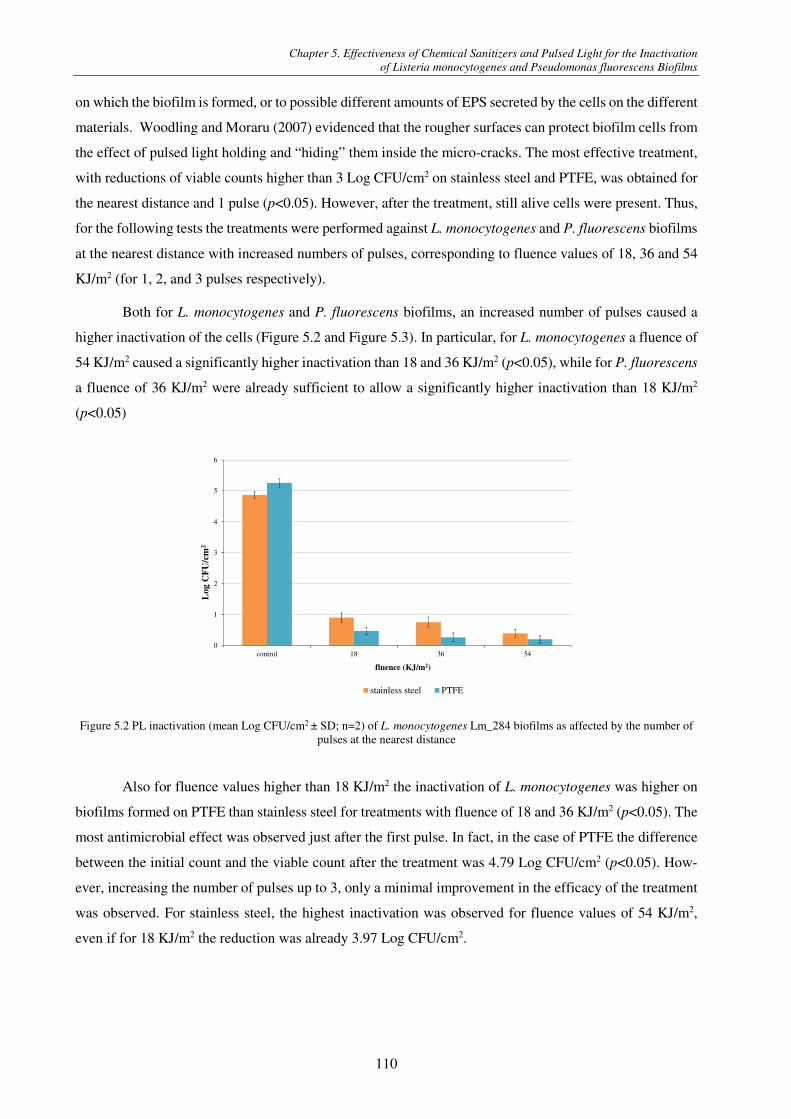
Figure 5.2 PL inactivation (mean Log CFU/cm2 ± SD; n=2) of L. monocytogenes Lm_284 biofilms as affected by the number of pulses at the nearest distance ......................................................................................................................................................... 110
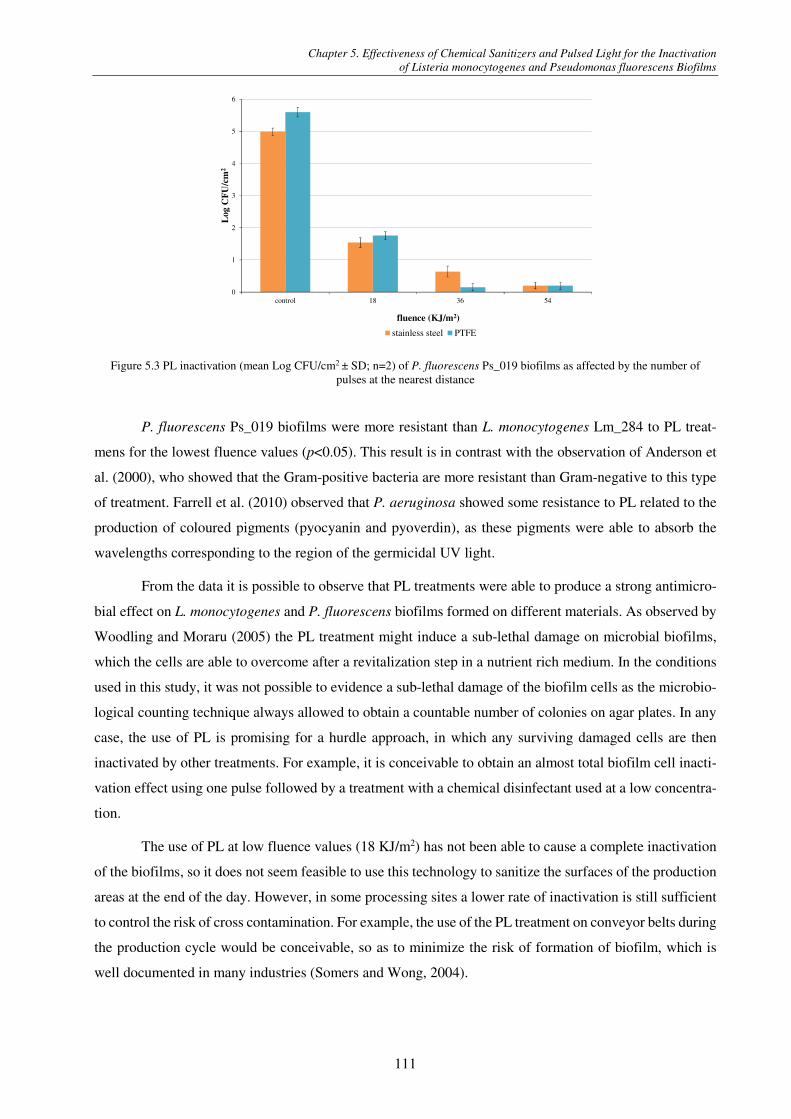
Figure 5.3 PL inactivation (mean Log CFU/cm2 ± SD; n=2) of P. fluorescens Ps_019 biofilms as affected by the number of pulses at the nearest distance .................................................................................................................................................................... 111
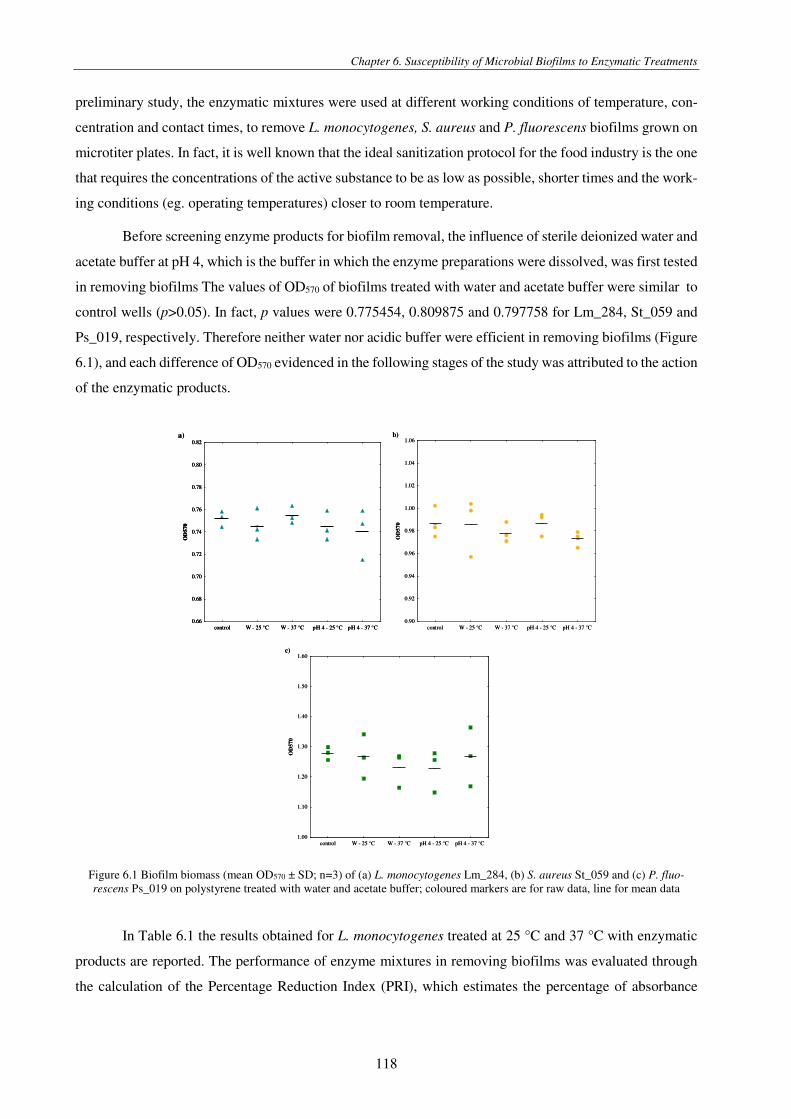
Figure 6.1 Biofilm biomass (mean OD570 ± SD; n=3) of (a) L. monocytogenes Lm_284, (b) S. aureus St_059 and (c) P. fluorescens Ps_019 on polystyrene treated with water and acetate buffer; coloured markers are for raw data, line for mean data .................. 118
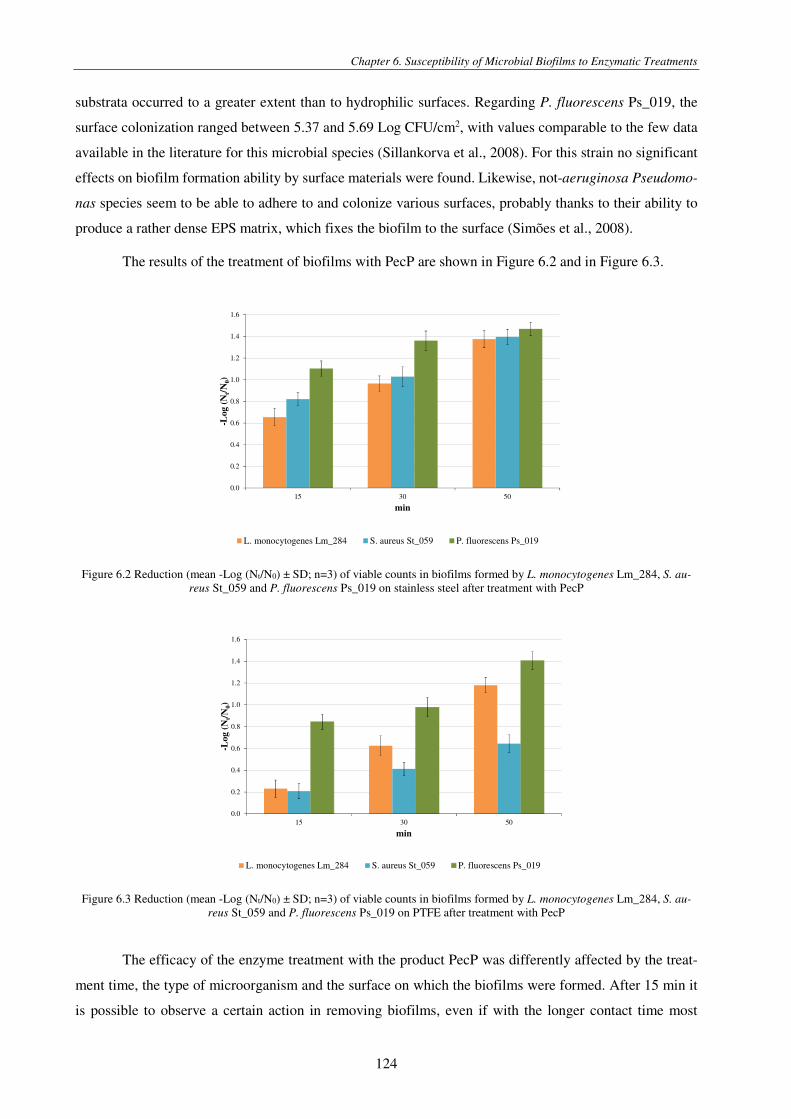
Figure 6.2 Reduction (mean -Log (Nt/N0) ± SD; n=3) of viable counts in biofilms formed by L. monocytogenes Lm_284, S. aureus St_059 and P. fluorescens Ps_019 on stainless steel after treatment with PecP ............................................................................ 124
Figure 6.3 Reduction (mean -Log (Nt/N0) ± SD; n=3) of viable counts in biofilms formed by L. monocytogenes Lm_284, S. aureus St_059 and P. fluorescens Ps_019 on PTFE after treatment with PecP ........................................................................................ 124
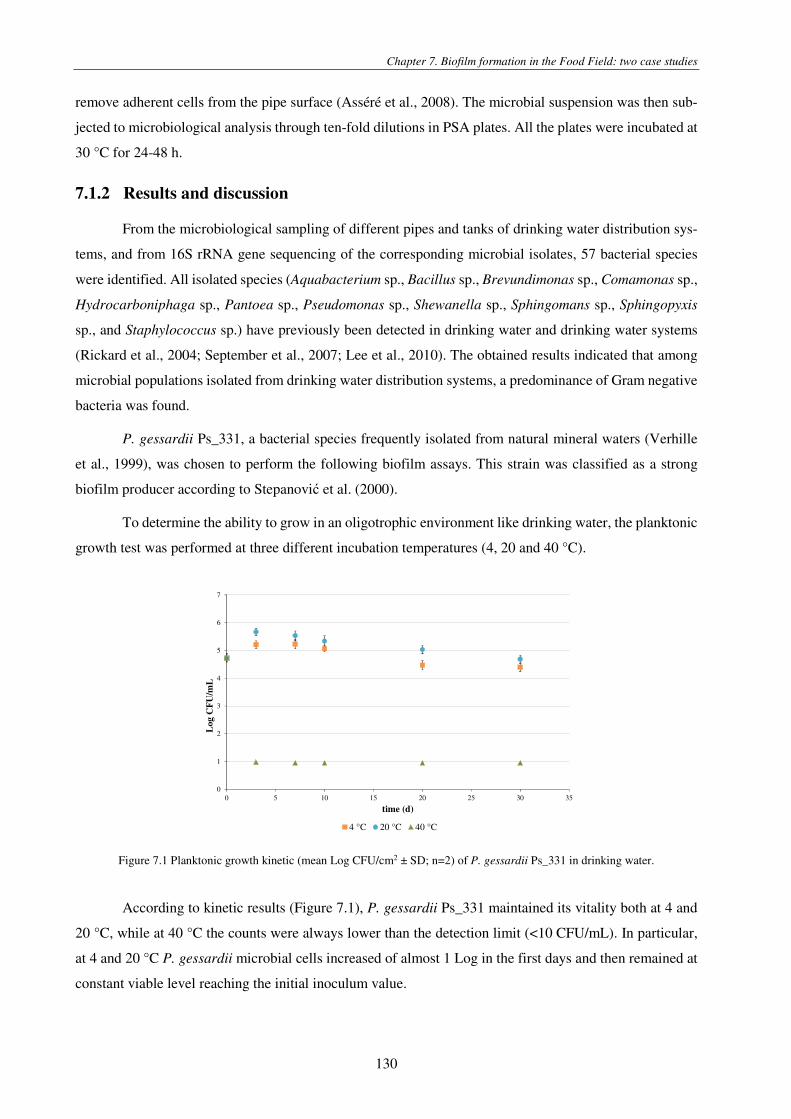
Figure 7.1 Planktonic growth kinetic (mean Log CFU/cm2 ± SD; n=2) of P. gessardii Ps_331 in drinking water. ...................... 130
Figure 7.2 Bacterial growth (mean Log CFU/cm2 ± SD; n=2) a) in drinking water in pipe A and (b) on the inner surface of pipe A. ...................................................................................................................................................................................................... 132
Figure 7.3 Bacterial growth (mean Log CFU/cm2 ± SD; n=2) (a) in drinking water in pipe B and (b) on the inner surface of pipe B ...................................................................................................................................................................................................... 133
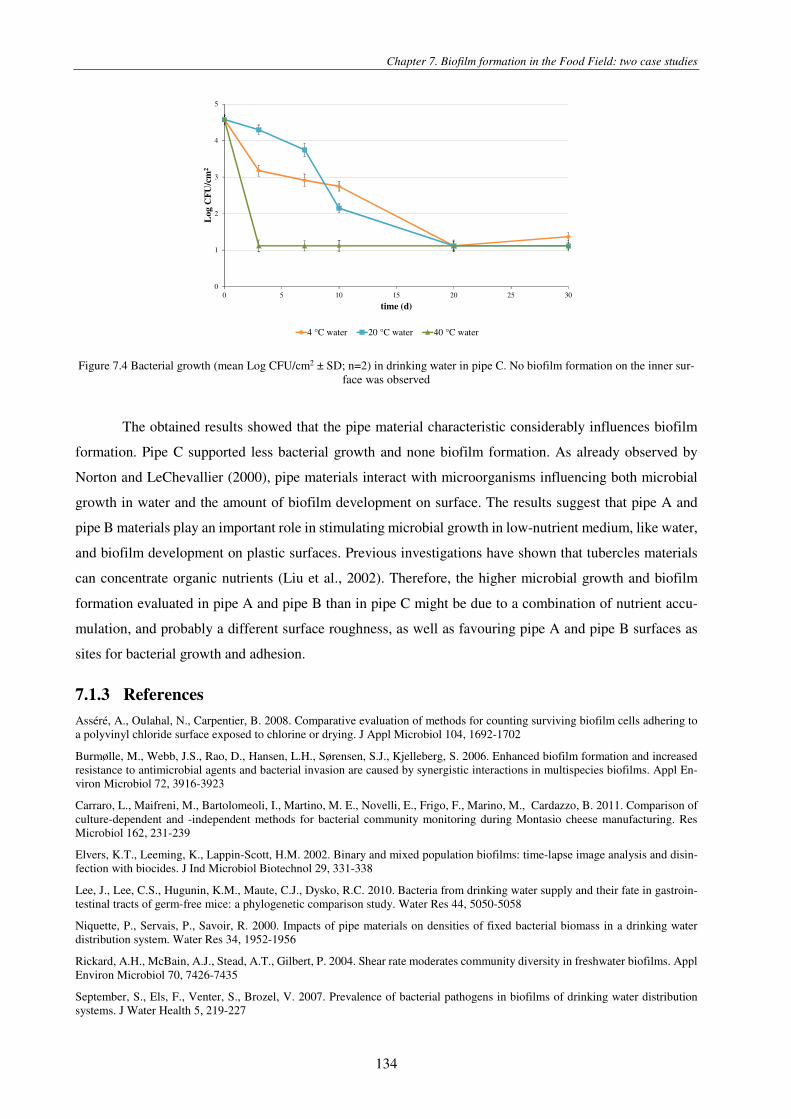
Figure 7.4 Bacterial growth (mean Log CFU/cm2 ± SD; n=2) in drinking water in pipe C. No biofilm formation on the inner surface was observed ................................................................................................................................................................................. 134
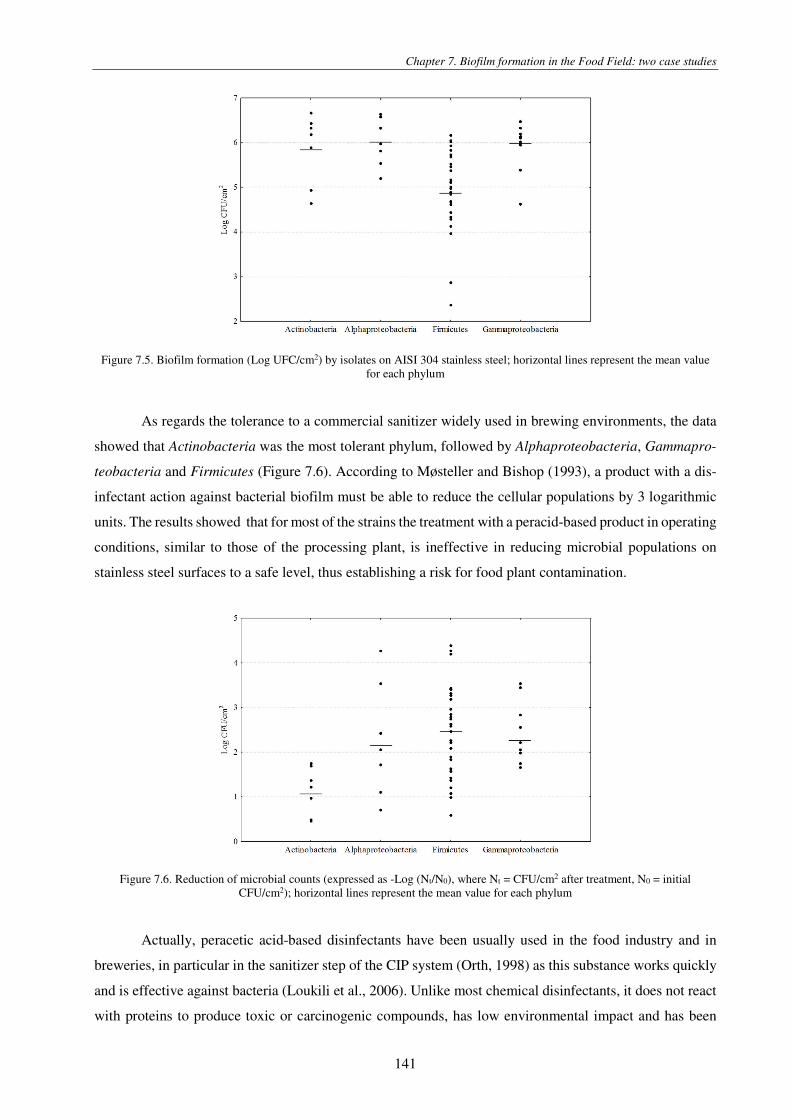
Figure 7.5. Biofilm formation (Log UFC/cm2) by isolates on AISI 304 stainless steel; horizontal lines represent the mean value for each phylum .................................................................................................................................................................................. 141
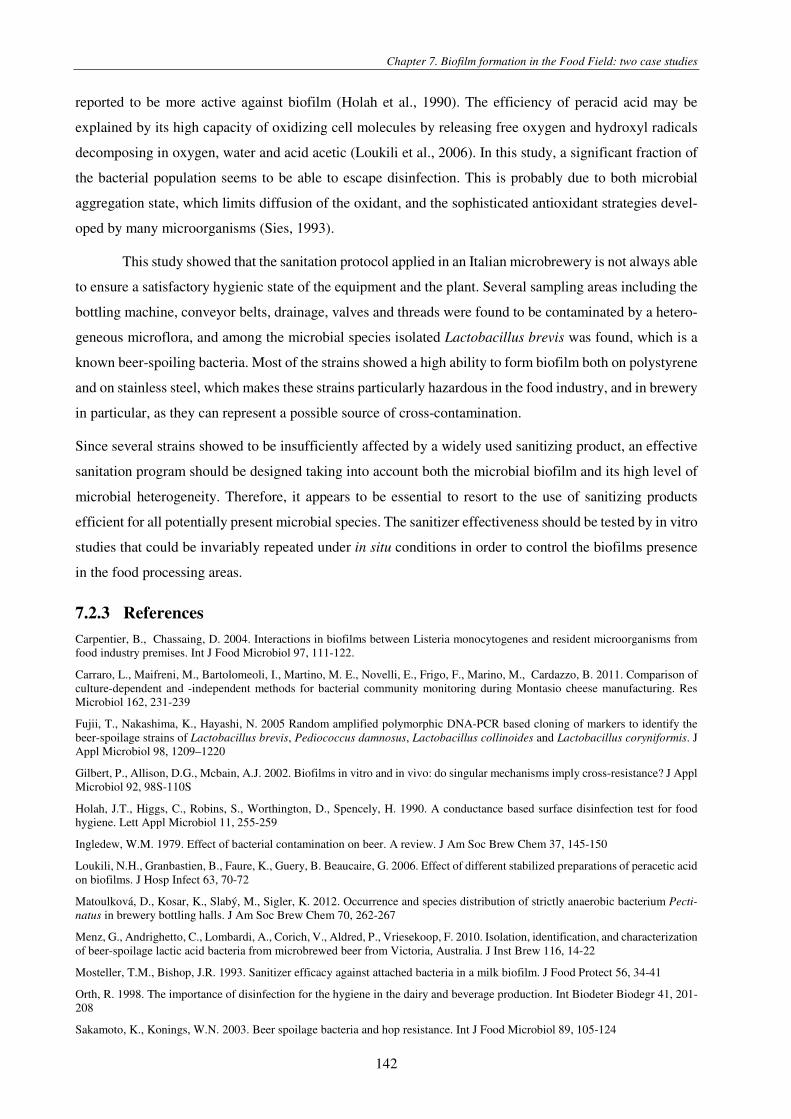
Figure 7.6. Reduction of microbial counts (expressed as -Log (Nt/N0), where Nt = CFU/cm2 after treatment, N0 = initial CFU/cm2); horizontal lines represent the mean value for each phylum ........................................................................................................... 141
4
SUMMARY
The main objective of this study was to examine in-depth the problems related to the formation of
microbial biofilms in food plants. Although it has long been known that the ability to form biofilms is a
common trend in natural environments including food processing environments, most of the studies in the
literature concern the medical context, where microbial biofilms are often the cause of serious hospital
infections. In the food field, however, the interest in biofilms has only recently arisen, even though the
formation of microbial biofilms appears to be the major cause of cross-contamination in food products.
Currently, data on microbial communities in the different food processing areas are only limited, and the
influence of environmental parameters on the characteristics of biofilms have been studied for only a few
microbial species. This knowledge is, however, necessary for the development of intervention strategies
for the prevention and removal of biofilms, which allows at the same time to obtain a high degree of hy-
gienic-sanitary safety of the surfaces, as well as to reduce the impact conventional strategies have on the
environment and on the safety of operators.
The study discussed in this thesis was carried out on specific groups of organisms known to be
pathogenic or food spoilers, including Listeria monocytogenes, Staphylococcus aureus and Pseudomonas
spp. The need for the availability of appropriate study models that allow to obtain, in as little time as pos-
sible, a high number of biofilm samples with homogeneous characteristics was addressed in Chapter 2,
where the use of a microtiter plate system and a reactor able to grow microbial biofilms was evaluated on
materials widely used in the food industry. In addition, to facilitate the microbiological laboratory activities,
two techniques of plate counts were compared in order to highlight problems and benefits in the context of
the study of biofilms for both. The microtiter plate assay and the CDC biofilm reactor assay showed to be
sufficiently reliable and repeatable tools to produce a number of samples large enough to provide sufficient
information on the ability of food microorganisms to produce biofilms under different operating conditions.
Moreover, the drop plate method has proved particularly suitable, sufficiently accurate and reliable, as well
as advantageous from the economic point of view, for the quantification of viable cells present in the bio-
film.
The influence of environmental parameters on biofilm formation was studied in Chapter 3 and
Chapter 4. In particular, in Chapter 3 the effect of the synergy of multiple parameters on the formation of
biofilms in a static model system was studied, both in terms of quantification of total the biomass (dead and
live cells and EPS matrix) and of the only evaluation of the cell count. The use of a Central Composite
Design allowed to mimic the real environmental conditions in the food industry and to obtain the greatest
amount of information limiting the number of experiments to be carried out. Therefore, useful data were
obtained to increase the information in the literature about the synergistic effects of the environmental
parameters on biofilm formation regarding the food sector. In Chapter 4 the effect of temperature on the
adhesion and on the biofilm structure, as well as on resistance to disinfectants commonly used in the food
industry sanitation plans was studied. The study showed that temperature significantly affects the kinetics
5
of adhesion, but also the cell density and the amount of EPS produced, and consequently the resistance to
biocides. The use of CLSM technique for microscopic observation allowed the study of biofilms in undis-
turbed conditions, and thus it is well suited to a possible use during the biofilm growth. The evaluation of
different strategies for the removal of biofilms was the subject of Chapter 5 and Chapter 6, in which con-
ventional and non-conventional approaches were considered. A comparison between chemical, physical
and biological treatments shows that a hurdle-approach, in which different strategies are used in sequence,
could help in limiting the health and hygiene problems related to microbial biofilms in the production of
foodstuffs. Finally, in Chapter 7 the gained knowledge was used to study the problem of biofilms in specific
food contexts.
6
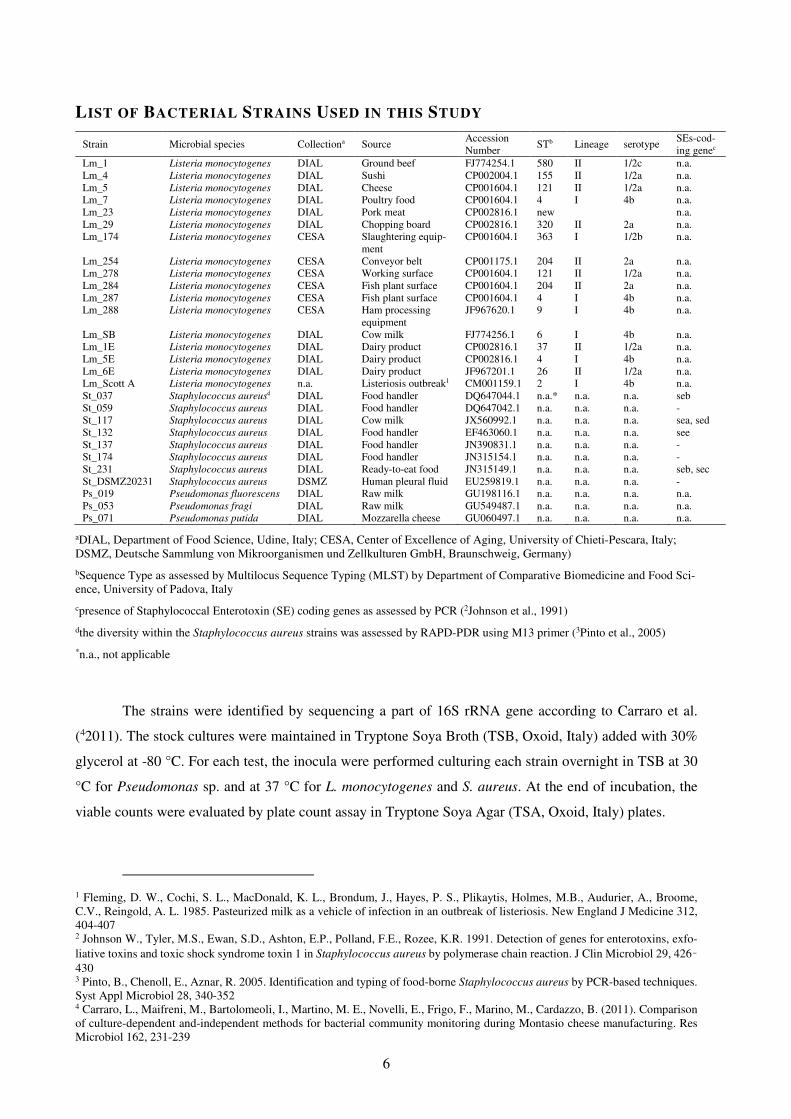
LIST OF BACTERIAL STRAINS USED IN THIS STUDY
Strain Microbial species Collectiona Source Accession Number
aDIAL, Department of Food Science, Udine, Italy; CESA, Center of Excellence of Aging, University of Chieti-Pescara, Italy; DSMZ, Deutsche Sammlung von Mikroorganismen und Zellkulturen GmbH, Braunschweig, Germany)
bSequence Type as assessed by Multilocus Sequence Typing (MLST) by Department of Comparative Biomedicine and Food Sci-ence, University of Padova, Italy
cpresence of Staphylococcal Enterotoxin (SE) coding genes as assessed by PCR (2Johnson et al., 1991)
dthe diversity within the Staphylococcus aureus strains was assessed by RAPD-PDR using M13 primer (3Pinto et al., 2005)
*n.a., not applicable
The strains were identified by sequencing a part of 16S rRNA gene according to Carraro et al.
(42011). The stock cultures were maintained in Tryptone Soya Broth (TSB, Oxoid, Italy) added with 30%
glycerol at -80 °C. For each test, the inocula were performed culturing each strain overnight in TSB at 30
°C for Pseudomonas sp. and at 37 °C for L. monocytogenes and S. aureus. At the end of incubation, the
viable counts were evaluated by plate count assay in Tryptone Soya Agar (TSA, Oxoid, Italy) plates.
1 Fleming, D. W., Cochi, S. L., MacDonald, K. L., Brondum, J., Hayes, P. S., Plikaytis, Holmes, M.B., Audurier, A., Broome, C.V., Reingold, A. L. 1985. Pasteurized milk as a vehicle of infection in an outbreak of listeriosis. New England J Medicine 312, 404-407 2 Johnson W., Tyler, M.S., Ewan, S.D., Ashton, E.P., Polland, F.E., Rozee, K.R. 1991. Detection of genes for enterotoxins, exfo-liative toxins and toxic shock syndrome toxin 1 in Staphylococcus aureus by polymerase chain reaction. J Clin Microbiol 29, 426–430 3 Pinto, B., Chenoll, E., Aznar, R. 2005. Identification and typing of food-borne Staphylococcus aureus by PCR-based techniques. Syst Appl Microbiol 28, 340-352 4 Carraro, L., Maifreni, M., Bartolomeoli, I., Martino, M. E., Novelli, E., Frigo, F., Marino, M., Cardazzo, B. (2011). Comparison of culture-dependent and-independent methods for bacterial community monitoring during Montasio cheese manufacturing. Res Microbiol 162, 231-239
7
LIST OF ABBREVIATIONS
BHI Brain Heart Infusion (Oxoid, Milan, Italy)
CBR CDC Biofilm Reactor
CFU Colony Forming Unit
CIP Cleaning In Place
CLSM Confocal Laser Scanning Microscopy
eDNA Extracellular DNA
EPS Extracellular Polymeric Substances
GSFA Gelatin Sugar Free Agar (Oxoid, Milan, Italy)
MRD Maximum Recovery Diluent (Oxoid, Milan, Italy)
MRS-A de Man Rogosa Sharpe Agar (Oxoid, Milan, Italy)
OD Optical Density
PCA Principal Component Analysis
PSA Pseudomonas Agar Base (Oxoid, Milan, Italy)
PTFE Polytetrafluoroethylene
TSA Tryptone Soya Agar (Oxoid, Milan, Italy)
TSB Tryptone Soya Broth (Oxoid, Milan, Italy)
8
Chapter 1. GENERAL INTRODUCTION
Chapter 1. General Introduction
9
Microorganisms are traditionally studied, characterized and identified as planktonic, freely sus-
pended cells and described on the basis of their growth characteristics in nutritionally rich culture media.
Nowadays, however, all detailed studies of microbial communities in different environments have led to
the conclusion that planktonic microbial growth rarely exists in nature. As a matter of fact, it is now ac-
cepted that it is a natural tendency of microorganisms to attach on wet surfaces, to multiply and to embed
themselves in a matrix composed of extracellular polymeric substances (EPS) that they produce, forming
the so called biofilm. Biofilms are defined as a matrix-enclosed bacterial populations which are attached to
each other and/or to surfaces or interfaces (Costerton et al., 1995).
The inclination of bacteria to colonize surfaces is a double-edged sword that can prove either ben-
eficial or potentially destructive. While nitrogen fixation and bioremediation of wastewater are beneficial
functions of biofilms, the contamination of medical devices and of food equipment as well as the obstruc-
tion of fluid flow through conduits, over surfaces, through filter, and corrosion are major economic and
public health risks of the medical and food field, as well as maritime and petroleum industries (Costerton
et al., 1987; Carpentier and Cerf, 1993).
Biofilms can comprise single or multiple microbial species, and can be formed on a wide variety
of surfaces, both biotic and abiotic, including living tissues, medical devices, industrial environment or
natural aquatic systems (Donlan, 2002). Although mixed-species biofilms predominate in most environ-
ments, single-species biofilms exist in a variety of infections and on the surface of medical implants (Adal
and Farr, 1996). Bacteria in biofilm (sessile form) profoundly differ from their free-floating (planktonic)
counterparts. It has been shown that when microorganisms attach to a surface and adopt a sessile growth
state, they show a modified gene expression which makes them phenotypically different from their plank-
tonic counterparts. As a matter of fact, both up- and down-regulation of a number of genes of cells occurs
during the attachment step of the biofilm formation upon initial interaction with the substratum. In this
regard, Davies and Geesey (1995) demonstrated in Pseudomonas aeruginosa, the up-regulation of the algC
gene for expression of essential enzyme for biosynthesis of alginate and a key point in the regulation of the
alginate pathway. Prigent-Combaret et al. (1999) opined that the expression of genes in biofilms is evidently
modulated by the dynamic physicochemical factors external to the cell and may involve complex regulatory
pathways. Due to these different gene expressions, bacteria grown in a biofilm can be up to 1000 times
more resistant to antibiotics, biocides and immune chemicals compared to the same bacteria grown in liquid
culture (Gristina et al., 1987; Prosser et al., 1987). Therefore, it can be said that microorganisms prefer to
live as sessile organisms as they will be protected from antimicrobial agents by the EPS matrix of their own
synthesis whereby they are encased (Donlan, 2000).
1.1 HISTORICAL BASIS OF BIOFILM STUDY
Antonie van Leeuwenhoek first found microorganisms attached on tooth surfaces and forming ses-
sile communities using his primitive light microscope, which could be considered as the first observation
Chapter 1. General Introduction
10
of a microbial biofilm (Leeuwenhoek, 1684). The subsequent studies, which started from the 1920s, were
related to marine bacteria on the surface of ship hulls. From these studies, it was found that for marine
microbes, growth and activity were enhanced by the presence of a surface onto which they could adhere
(the so called “bottle effect”) (Heukelekian and Heller, 1940). However, only the electron microscope al-
lowed a detailed examination of biofilms. By using a scanning and transmission electron microscopy and
a specific polysaccharide-stain called ruthenium red, Jones et al. (1969) showed that the matrix material
surrounding and enclosing cells in these biofilms was polysaccharidic. Costerton coined the term biofilm
in 1978 explaining the mechanisms whereby microorganisms adhere to biotic and abiotic materials and the
benefits accrued by this ecologic niche.
Over the last decades the study of biofilms has been based on the use of different techniques, such
as scanning electron microscopy (SEM) or standard microbiologic culture techniques. Although biofilm
formation has been a recognized and scientifically documented aspect of microbial physiology for more
than 50 years, only in the recent years the utilization of the confocal laser scanning microscopy (CLSM) to
characterize biofilm ultrastructure and the investigation of the genes involved in cell adhesion and biofilm
formation help to better understand the microbial biofilm structure and development.
1.2 BIOFILM STRUCTURE
The biofilm structure has been the subject of several studies; information collected by these works
allowed to propose three conceptual models of biofilm structure (Figure 1.1).
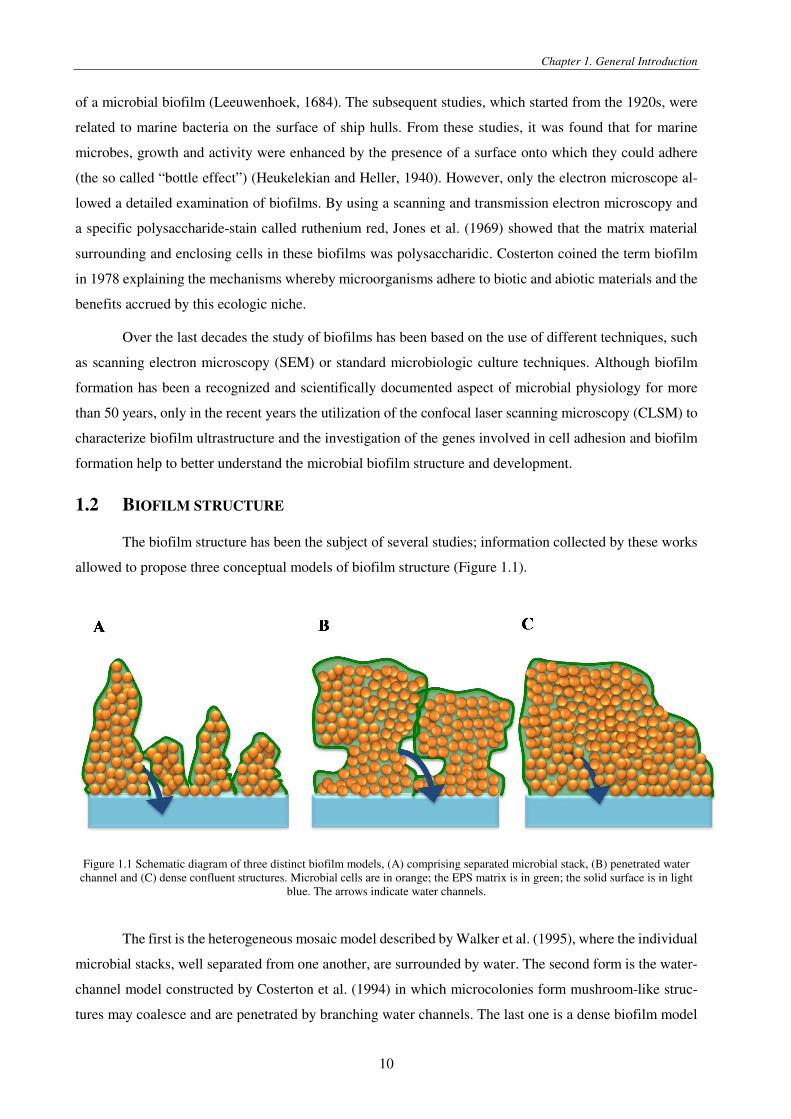
Figure 1.1 Schematic diagram of three distinct biofilm models, (A) comprising separated microbial stack, (B) penetrated water channel and (C) dense confluent structures. Microbial cells are in orange; the EPS matrix is in green; the solid surface is in light
blue. The arrows indicate water channels.
The first is the heterogeneous mosaic model described by Walker et al. (1995), where the individual
microbial stacks, well separated from one another, are surrounded by water. The second form is the water-
channel model constructed by Costerton et al. (1994) in which microcolonies form mushroom-like struc-
tures may coalesce and are penetrated by branching water channels. The last one is a dense biofilm model
Chapter 1. General Introduction
11
apparent in some medically important biofilms, where channels and fluid-filled voids were detectable (Law-
rence et al., 1998). In all these systems, the water channels permit the flow of nutrients, enzymes, metabo-
lites, waste products and other solutes, throughout the biofilm community. In the water channel, transport
is facilitated with passive diffusion or with the help of water. Facilitated transport also aids in the transport
of molecules to the inside of the biofilm. It is believed that the water channels participate in the transport
of oxygen to the inner areas (Costerton et al., 1995). Although these models represent three distinct forms,
in reality biofilms are a combination of all three, depending on many extrinsic factors. In particular, the
structure is largely dependent on substratum concentration. Moreover, the presence of polysaccharide-syn-
thesizing and -degrading enzymes in the biofilm means that the matrix composition will be constantly
changing (Sutherland, 2001a).
1.3 THE BIOFILM MATRIX AND ITS FUNCTIONS
The biofilm matrix is the extracellular material, mostly produced by the organisms themselves, in
which the biofilm cells are embedded (Figure 1.2) .
Figure 1.2 CLSM image of Pseudomonas fluorescens 5-days-old biofilm formed on stainless steel AISI 304. Biofilm matrix is in blue, viable cells are in green and dead cells are in red
Generally, it can be said that resident cells of biofilm, which may include many different species,
only account for about 5% of the total biomass. The remaining part of the biofilm is composed of matrix,
which has water as the major component, accounting for up to 97%. Apart from water, the other components
of the matrix include, in varying amounts, EPS (1-2%), globular glycoproteins and proteins, which include
lytic products and secreted enzymes (1-2%), extracellular DNA (eDNA) from lysed cells (1-2%), lipids,
phospholipids and sequestered ions from the surrounding environment (Godwin and Foster, 1989; Flem-
ming and Wingender, 2001). Recently it was found that eDNA is a significant component of EPS, as it
plays a very important role in the biofilm development (Spoering and Gilmore, 2006). It is believed that
eDNA is involved in maintaining the three-dimensional structures of biofilms and enhancing the exchange
of genetic materials (Molin and Tolker-Nielsen, 2003). Although it is commonly accepted that eDNA is
released manly from bacterial cell lysis (Webb et al., 2003), several studies have revealed that some active
secretion mechanisms may exist (Draghi and Turner, 2006). However, Whitchurch et al. (2002) showed
the possibility that eDNA is secreted actively via transport vescicles for the purpose of creating the biofilm
Chapter 1. General Introduction
12
matrix. The EPS is regarded as the major structural component of the matrix, providing a framework for
the biofilm complex. EPS may account for 50% to 90% of the total organic carbon of biofilms and may
vary in chemical and physical properties, but it is primarily composed of homo- and heteropolysaccharides,
in particular, of glucose, fructose, mannose, galactose, pyruvate and mannuronic acid- or glucoronic acid-
based complexes (Johansen et al., 1997). Essentially, the EPS provide the skeleton into which microbial
cells and their bioactive products are placed in. As a matter of fact, the EPS determine the immediate con-
ditions of life of biofilm cells living in this microenvironment by affecting porosity, density, water content,
charge, sorption properties, hydrophobicity and mechanical stability (Flemming and Wingender, 2002).
EPS produced by the microorganisms vary depending on whether the microorganisms are Gram-negative
or Gram-positive cells. Moreover, different organisms produce different amounts of EPS and the amount
of EPS increases with age of the biofilm (Leriche et al., 2000).
As reported by Sutherland (2001a), the biofilm matrix composition is influenced by a combination
of intrinsic factors, such as the genotype of the attached cells, and extrinsic factors, which include the sur-
rounding physico-chemical environment. Moreover, since the biofilm matrix is constantly changing as it is
influenced by changes in the surrounding macro-environment, it may be considered as dynamic. So, the
specific composition for any biofilm varies depending upon the organisms present, their physiological sta-
tus, the nature of the growth environment, the bulk fluid-flow dynamics, the substratum and the prevailing
physical conditions. The biofilm matrix allows the resident microorganisms to form stable aggregates of
different cell types, leading to the development of a functional, synergistic microconsortium. The spatial
arrangement of microorganisms gives rise to nutrient and gaseous gradients, as well as those of electron
acceptors, products and pH. Thus, aerobic and anaerobic habitats can arise in close proximity, and as a
consequence, the development of large variability of species can occur.
The biofilm matrix performs several functions for the benefit of the cells within the biofilm itself.
In general, it can be said that the biofilm matrix plays an important role in the structural stability due to the
occurrence of non-covalent interactions (electrostatic interactions and hydrogen bonds). These interactions
occur between the matrix components, in the attachment of cells to a surface thanks to the presence of the
EPS that are involved in the initial adhesion events, and in the protection, as the matrix acts as a protective
umbrella that physically prevents the access of antimicrobials to the cell surface (Allison, 2003). Another
function of the biofilm matrix is the protection of the biofilm cells against dehydration under water-limited
conditions, and other environmental conditions such as temperature fluctuations and osmotic shock thanks
to the high water content of the matrix. The outer layer of EPS can dry out under water-deficient conditions
and form a hard, protective layer, preventing dehydration of the inner cells (Sutherland, 2001b).
1.4 PROCESS OF BIOFILM FORMATION
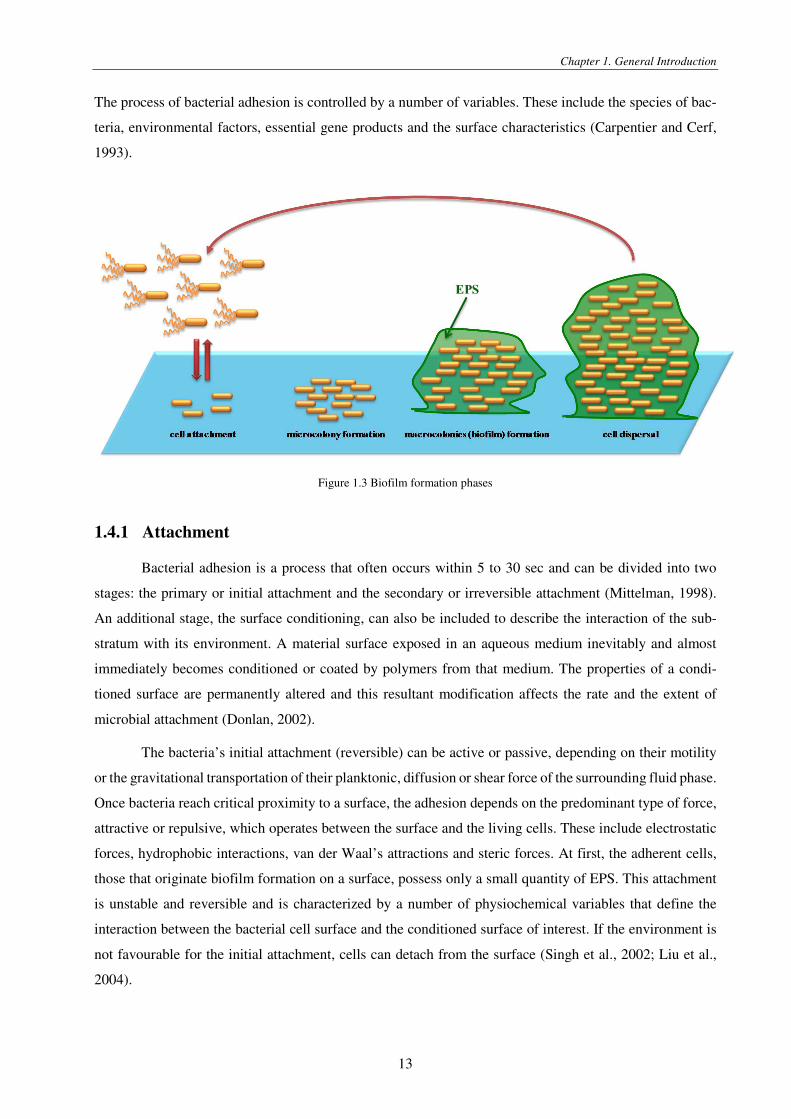
The biofilm formation is a stepwise and dynamic process involving the initial attachment of the
bacteria to a solid surface, the formation of micro-colonies on the surface, the differentiation of the micro-
colonies into mature biofilms encased in exopolysaccharides and the consequent detachment (Figure 1.3).
Chapter 1. General Introduction
13
The process of bacterial adhesion is controlled by a number of variables. These include the species of bac-
teria, environmental factors, essential gene products and the surface characteristics (Carpentier and Cerf,
1993).
Figure 1.3 Biofilm formation phases
1.4.1 Attachment
Bacterial adhesion is a process that often occurs within 5 to 30 sec and can be divided into two
stages: the primary or initial attachment and the secondary or irreversible attachment (Mittelman, 1998).
An additional stage, the surface conditioning, can also be included to describe the interaction of the sub-
stratum with its environment. A material surface exposed in an aqueous medium inevitably and almost
immediately becomes conditioned or coated by polymers from that medium. The properties of a condi-
tioned surface are permanently altered and this resultant modification affects the rate and the extent of
microbial attachment (Donlan, 2002).
The bacteria’s initial attachment (reversible) can be active or passive, depending on their motility
or the gravitational transportation of their planktonic, diffusion or shear force of the surrounding fluid phase.
Once bacteria reach critical proximity to a surface, the adhesion depends on the predominant type of force,
attractive or repulsive, which operates between the surface and the living cells. These include electrostatic
forces, hydrophobic interactions, van der Waal’s attractions and steric forces. At first, the adherent cells,
those that originate biofilm formation on a surface, possess only a small quantity of EPS. This attachment
is unstable and reversible and is characterized by a number of physiochemical variables that define the
interaction between the bacterial cell surface and the conditioned surface of interest. If the environment is
not favourable for the initial attachment, cells can detach from the surface (Singh et al., 2002; Liu et al.,
2004).
Chapter 1. General Introduction
14
The change from reversible to irreversible attachment is a shift from a weak interaction of the bac-
teria to a permanent bonding with the presence of EPS. Forces responsible for this type of attachment are
dipole, ionic, hydrogen or hydrophobic interactions. Several studies indicate that irreversible attachment
takes from 20 min to a maximum of 4 hours at 4 °C to 20 °C (Gilbert et al., 2001). Firm attachment of
bacterial cells to the surface is assisted by bacterial motility structures (flagella, pili), bacterial surface
structures (proteins, lipopolysaccharides (LPS) and exopolymers produced by bacteria. Flagella motility is
important to overcome the forces that repel bacteria from reaching many abiotic materials. Once they reach
the surface, the nonflagellar appendages as pili, curli, and outer membrane proteins (OMPs) are then re-
quired to achieve stable cell-to-cell and cell-to-surface attachments (Allison et al., 2000). Once the bacteria
have attached irreversibly to the surface, they undergo genotypic and phenotypic changes to ensure the
development and maturation of the biofilm. These changes result in the production of increased amounts
of EPS, increased resistance to antibiotics, increased UV resistance and higher productions of secondary
metabolites (O’Toole et al., 2000). After irreversible attachment, strong shear force or chemical breaking
of the attachment forces by enzymes, detergents, surfactants, sanitizers and/or heat is needed for biofilm
removal (Maukonen et al., 2003).
1.4.2 Microcolony formation and biofilm maturation
After the adherence of bacteria to the surface, the bacteria begin to multiply while sending out
chemical signals that “intercommunicate” among the bacterial cells, through mechanisms belonging to the
so called quorum sensing. As reported by several researchers, quorum sensing plays a role in cell attach-
ment, biofilm maturation and cell detachment from biofilms (Parsek and Greenberg, 2005). After cell irre-
versible attachment, once quorum sensing signal intensity exceeds a certain level, the genetic mechanisms
underlying exopolysaccharide production are activated. This way, the bacteria multiply within the embed-
ded exopolysaccharide matrix, thus giving rise to the formation of a microcolony. Microcolonies further
develop into macrocolonies that are divided by water channels and enclosed in an EPS matrix. Macrocolo-
nies, compared to microcolonies, are composed of a large amount of cells, produce more EPS and have a
higher metabolic and physiological heterogeneity (Ghannoum and O’Toole, 2004). Further increase in the
size of biofilm takes place by the deposition or attachment of other organic and inorganic solutes and par-
ticulate matter to the biofilm from the surrounding liquid phase. Factors that control biofilm maturation
include the availability of nutrients, the internal pH, oxygen, osmolarity, temperature, electrolyte concen-
tration and the surface type (O’Toole and Kolter, 1998).
At some point, the biofilm reaches a critical mass and a dynamic equilibrium is reached at which
the outermost layers of growth begin to generate planktonic organisms. These microorganisms are free to
escape the biofilm and colonize other surfaces (Dunne, 2002).
Chapter 1. General Introduction
15
1.4.3 Detachment and dispersal of cells from biofilms
As the biofilm ages, the attached bacteria, in order to survive and colonize new niches, must be
able to detach and disperse from the biofilm. The bacteria from the biofilm, mainly the daughter cells, get
detached individually or are sloughed off. Sloughing is a discrete process whereby periodic detachment of
relatively large particles of biomass from the biofilm occurs. This process happens for mechanical reasons
because some bacteria are shed from the colony due to the fluid dynamics and shear effects of the bulk
fluid. Other bacterial cells stop producing EPS and are released into the surrounding medium, due to the
presence of certain chemicals in the fluid environment or because of altered surface properties of the bac-
teria or substratum. The released bacteria can be transported to newer locations and again restart the biofilm
process (Marshall, 1992).
1.5 PARAMETERS INFLUENCING BIOFILM FORMATION
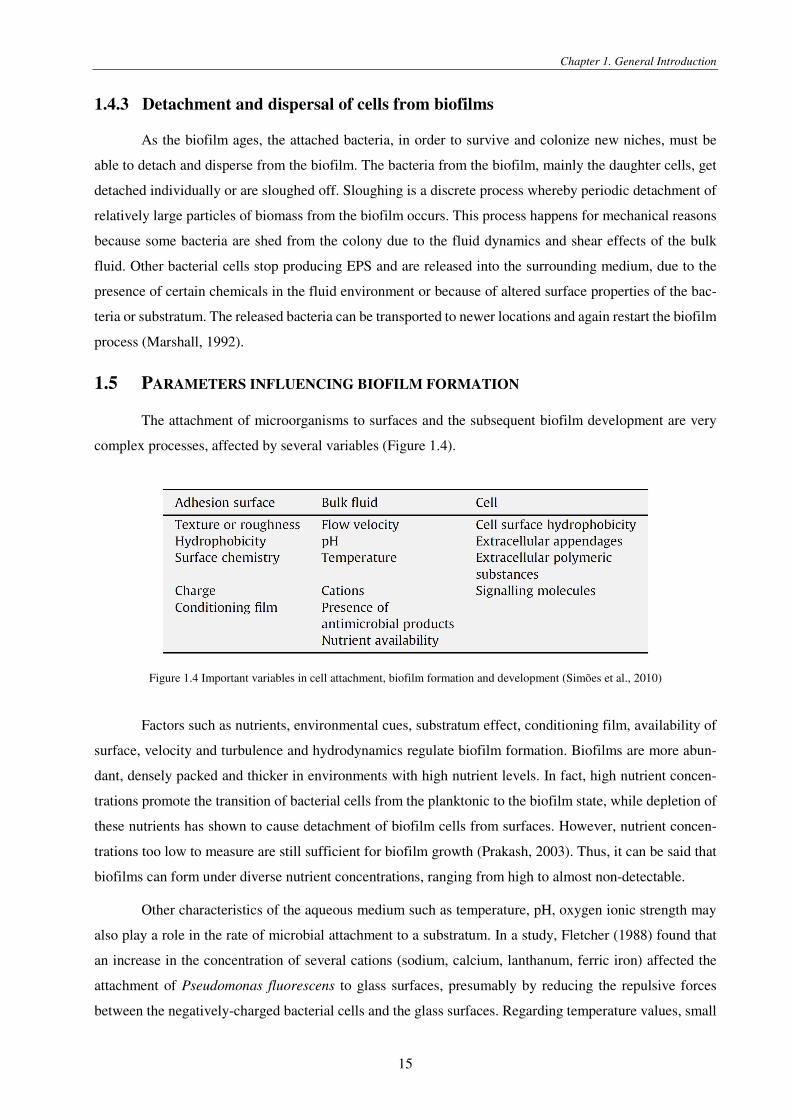
The attachment of microorganisms to surfaces and the subsequent biofilm development are very
complex processes, affected by several variables (Figure 1.4).
Figure 1.4 Important variables in cell attachment, biofilm formation and development (Simões et al., 2010)
Factors such as nutrients, environmental cues, substratum effect, conditioning film, availability of
surface, velocity and turbulence and hydrodynamics regulate biofilm formation. Biofilms are more abun-
dant, densely packed and thicker in environments with high nutrient levels. In fact, high nutrient concen-
trations promote the transition of bacterial cells from the planktonic to the biofilm state, while depletion of
these nutrients has shown to cause detachment of biofilm cells from surfaces. However, nutrient concen-
trations too low to measure are still sufficient for biofilm growth (Prakash, 2003). Thus, it can be said that
biofilms can form under diverse nutrient concentrations, ranging from high to almost non-detectable.
Other characteristics of the aqueous medium such as temperature, pH, oxygen ionic strength may
also play a role in the rate of microbial attachment to a substratum. In a study, Fletcher (1988) found that
an increase in the concentration of several cations (sodium, calcium, lanthanum, ferric iron) affected the
attachment of Pseudomonas fluorescens to glass surfaces, presumably by reducing the repulsive forces
between the negatively-charged bacterial cells and the glass surfaces. Regarding temperature values, small
Chapter 1. General Introduction
16
changes in temperature are likely to produce substantial changes in biofilm growth, because microbial ac-
tivity is very sensitive to temperature. For instance, studies have shown that biofilm thickness of Esche-
richia coli increased by 80% by raising the temperature from 30 to 35 °C (Melo and Bott, 1997).
The roughness and the physiochemical nature of the biotic or abiotic surface play an important role
in the number of cells that will attach to a surface. Microbial colonization appears to increase as the surface
roughness increases. This is because shear forces are less and surface area is more on rougher surfaces
(Prakash et al., 2003). It has been shown that hydrophobic nonpolar surfaces, (like Teflon® and other plas-
tics) are easier to colonize than hydrophilic surfaces (like glass and metals). This could be explained by the
hydrophobic interaction which occurs between the cell surface and the substratum that would enable the
cell to overcome the repulsive forces active within certain distance from the substratum surface and irre-
versibly attach (Prakash et al., 2003). Surface charge also affects the attachment of bacteria to surfaces.
Pasmore et al. (2002) demonstrated that surface with neutral or small negative charges allowed for easy
removal of biofilms, while surfaces with high charges (positive or negative) contained biofilms that were
not easy to remove. In general, attachment occurs most readily on surfaces that are rougher, more hydro-
phobic, and coated by surface conditioning films (Donlan et al., 2002; Simões et al., 2008).
Hydrodynamic conditions can influence the formation, structure, EPS production, thickness, mass
and metabolic activities of biofilms. Biofilms formed under turbulent flow can be described as “streamers”
and these are typically formed by filamentous bacteria. The microcolonies formed under these conditions
are stretched out in the direction of the current. Biofilms formed under low shear conditions (laminar flow
conditions) are characterized by spherical microcolonies divided by water channels (Stoodley et al., 2002).
1.6 BIOFILMS IN THE FOOD INDUSTRY
Food processing environments are susceptible to biofilm formation, and biofilms can lead to serious
hygienic problems and economic losses due to corrosion of equipment, reduction in heat transfer, obstruc-
tion of pipelines and loss of time when systems need to be stopped to remove biofilms (Mittelmann, 1998).
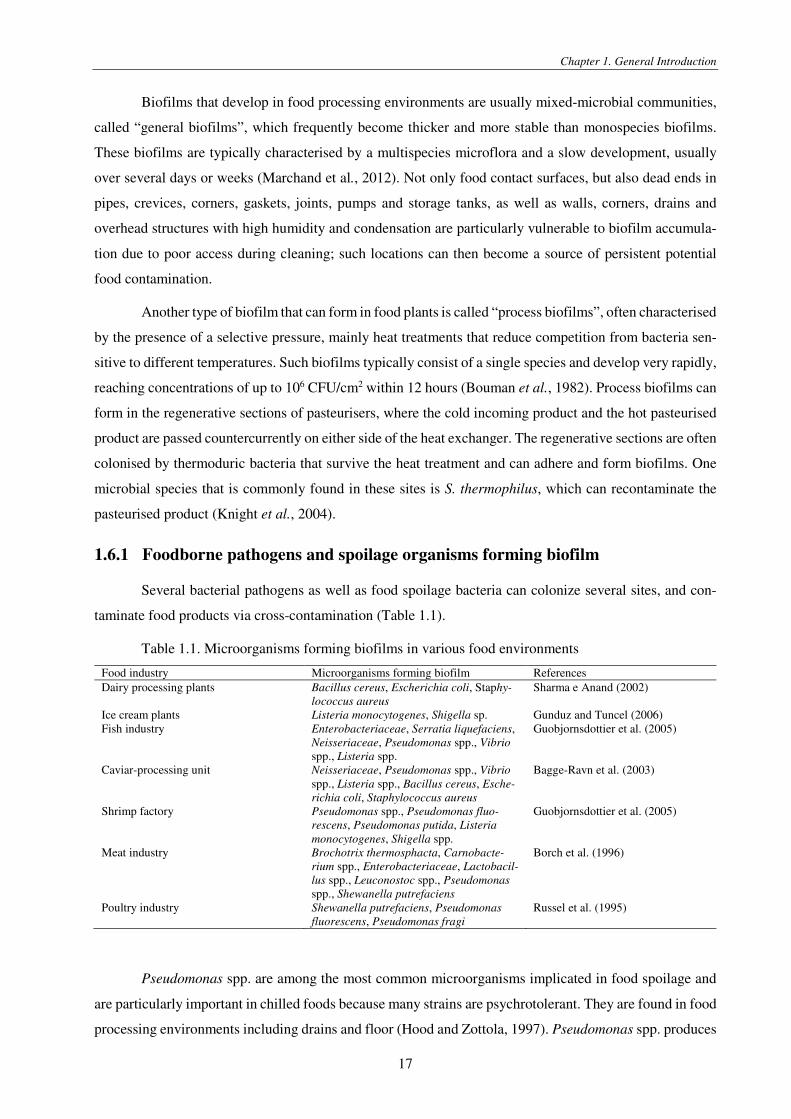
In addition to that, several food spoilage and pathogenic bacteria, including Pseudomonas species, She-
Poultry industry Shewanella putrefaciens, Pseudomonas
fluorescens, Pseudomonas fragi Russel et al. (1995)
Pseudomonas spp. are among the most common microorganisms implicated in food spoilage and
are particularly important in chilled foods because many strains are psychrotolerant. They are found in food
processing environments including drains and floor (Hood and Zottola, 1997). Pseudomonas spp. produces
Chapter 1. General Introduction
18
copious amounts of EPS and has been shown to attach and form biofilms on stainless steel surface. Several
studies relate the conditions of biofilm formation of Pseudomonas spp. to its antimicrobial susceptibility.
It was observed that biofilms grown in laminar regime are quite thick, have a high number of protuberances
and consequently are easily inactivated with biocides, while the biofilm formed in turbulent flow conditions
has a quite strong EPS matrix that can resist the action of antimicrobial substances (Simões et al., 2003).
Listeria monocytogenes is known for its ubiquity and resistance to environmental stresses. Alt-
hough L. monocytogenes is an environmental bacterium present on raw materials for food production, the
immediate source of product contamination is often the processing environment itself (Lundèn et a., 2003).
One of the major causes for concern about L. monocytogenes in food processing environments is its ability
to attach to many different surfaces and form biofilms. In fact, L. monocytogenes can be found not only in
food products, but can also be attached to food-processing facilities and equipment such as floors, walls,
salt hoppers, brine containers, drain grids, store boxes, gaskets, conveyor belts, slicing, dicing and packag-
ing machines, thereby increase the risk of food cross-contamination (Tresse et al., 2007). The ability of this
pathogen to survive at low temperatures, colonize surfaces in the form of biofilm-like structures, and resist
various food-related stresses is crucial for its persistence in the processing environments. Particularly, L.
monocytogenes may adhere to and grow on processing surfaces, where food residues are accumulated and
can persist also for years in food processing plants. Biofilms produced by L. monocytogenes are structurally
simple in comparison to those produced by many other microorganisms, and a mature biofilm community
can be established after 24 h making L. monocytogenes less susceptible to cleaning procedures (Rieu et al.,
2008) .
Also Staphylococcus aureus can live in a wide variety of environments thanks to its ability to form
biofilms on various materials and surfaces. This may contribute to the persistence of S. aureus in the food
processing environments, consequently increasing cross contamination risks as well as subsequent eco-
nomic losses due to recalls of contaminated food products. Several studies have shown attachment of S.
aureus on work surfaces such as polypropylene, polystyrene, stainless steel and glass as well as in food
products like poultry surfaces and meat (Pala and Sevilla, 2004; Marino et al., 2011).
1.7 BIOFILM CONTROL AND REMOVAL
1.7.1 Control
The first and most important thing to do against biofilm formation is to prevent it rather than treat
it. However, nowadays there is no known technique that is able to successfully prevent or control the for-
mation of biofilms without causing adverse side effects. The main strategy to prevent biofilm formation is
to clean and disinfect regularly before bacteria attach firmly to contact surfaces. A prerequisite for an effi-
cient sanitation programme is that the process equipment has been designed with high standards of hygiene.
Dead ends, corners, cracks, crevices, gaskets, valves and joints are vulnerable points for biofilm accumu-
lation (Chmielewski and Frank, 2004). The most effective sanitation programme cannot make up for basic
Chapter 1. General Introduction
19
deficiencies in equipment design, and if design faults exist, sanitation can never be totally effective. The
choice of materials used for contact surfaces must be made taking into account that different materials have
different attitudes to the development of biofilms. A ranking of different materials with regard to supports
for biofilm formation has been reported, although it can be asserted that, in fact, there is hardly any material
that does not allow biofilm formation (Figure 1.5).
Figure 1.5 Ranking of different materials with regard to support of biofilm growth (Meyer, 2003)
As a matter of fact, such rankings have to be evaluated with caution because biofilms may vary
with microbial species and with test conditions. For example, it has been demonstrated that L. monocyto-
genes adhered much more on hydrophobic than hydrophilic surfaces (Cunliffe et al., 1995), while other
authors reported that the adhesion force is greater on stainless steel than that one on polymers and rubber
(Smoot and Pierson, 1998). The most practical material in processing equipment is nevertheless steel, which
can be treated with mechanical grinding, brushing, lapping, and electrolytic or mechanical polishing.
Several attempts have been made to avoid biofilm formation by incorporation of antimicrobial
products into surface materials, coating surfaces with antimicrobials or modifying the surfaces physico-
chemical properties. In a study of biofilm control, microparticles coated with benzyldimethyldodec-
ylammonium chloride were found to effectively inactivate biofilm formation (Ferreira et al., 2011). Other
authors reported that biofilm formation was inhibited by coating surfaces with silver (Knetsch and Koole,
2011). These studies focused on biomedical applications but the approaches may also be useful in the food
industry if restricted to some parts of the process equipment such as valves, dead ends or where biofilms
are more prone to formation and difficult to control. In fact, possible carryover of antimicrobials into food
products is a concern when coatings release antimicrobial products. Finally, pre-conditioning the surface
with a surfactant has also been reported to prevent bacterial adhesion. Cloete and Jacobs (2001) evaluated
nonionic and anionic surfactants in preventing the adhesion of Pseudomonas aeruginosa to stainless steel
and glass surfaces. The surfactants gave more than 90% inhibition of adhesion. Nevertheless, the applica-
tion of such surface-active systems is restricted to some specific food contact materials, and their durability
and application costs need to be carefully considered.
Chapter 1. General Introduction
20
An efficient control programme evidently relies on adequate detection systems for biofilms. Several
methods are commonly used like conventional total viable count, different microscopy and spectroscopy
techniques, impedance measurement, ATP determination, colorimetry and flow cytometry techniques
(Janknecht and Melo, 2003). The conventional methods include agar plate counting of product samples,
swabbing or water flushes and contact plates, in order to indicate microbial contamination in the plant. In
general these methods are inexpensive and easy to use. However conventional counting is too slow to be
of practical use in food production. ATP bioluminescence test is a rapid biochemical method for estimating
total ATP collected by swabbing a surface. Total ATP is related to the amount of food residues and micro-
organisms collected by the swab. ATP bioluminescence is a good method for rapid enumeration of cleaning
effectiveness, since both food residues and microorganisms can be detected. Since the test is rapid, imme-
diate corrective action can be taken. However, the ATP bioluminescence test cannot detect low levels of
microorganisms (Griffiths, 1996). Impedance measurement, colorimetry and flow cytometry techniques
applied to the product or process samples are more rapid methods but, with the exception of flow cytometry,
they may still be too slow for process control or intervention purposes (Flint et al., 2001). All these tech-
niques have been applied in the laboratory, but may be too delicate for industrial use. Lack of sensitivity
may limit the ability to detect the early stages of development of biofilms that, nevertheless, have an impact
on food production. Biosensor technologies may provide further solutions to the food industry to monitor
biofilms. For example, a patented electrochemical probe can be installed in a line or tank to monitor biofilm
activity in real time (Brooks and Flint, 2008). At any rate, it can be affirmed that all these techniques have
advantages and constraints, and a well-chosen combination of detection methods guarantees the most effi-
cient detection.
1.7.2 Removal and eradication
1.7.2.1 Cleaning process and chemical disinfectants
In the food industry, there is debris everywhere, which would promote the accumulation of micro-
organisms and encourage biofilm formation. Therefore, regular cleaning is required so as to prevent the
contamination of food products. Adequate cleaning processes that break up and remove food residues de-
posited on the contact surfaces as well as biofilm matrix are important for the food processing industry,
because incomplete removal facilitates the reattachment of bacteria to the surface and formation of a novel
biofilm even if the bacteria from the previous biofilm are killed. Moreover, the disinfectants are less effec-
tive when food particles or dirt are present on the surfaces (Sinde and Carballo, 2000). The cleaning process
can remove 90% or more of microorganisms associated with the surface, but cannot be relied upon to kill
them. Bacteria can redeposit at other locations and, given time, water and nutrients can form a biofilm;
therefore, sanitation in addition to cleaning must be implemented. Temperature, pH, water hardness, chem-
ical inhibitors, concentration and contact time are important factors that affect the overall outcome of the
Chapter 1. General Introduction
21
cleaning process (Bremer et al., 2002). The removal of biofilms is also significantly facilitated by the ap-
plication of mechanical force (like brushing and scrubbing) to the surface during cleaning (Wirtanen et al.,
1996).
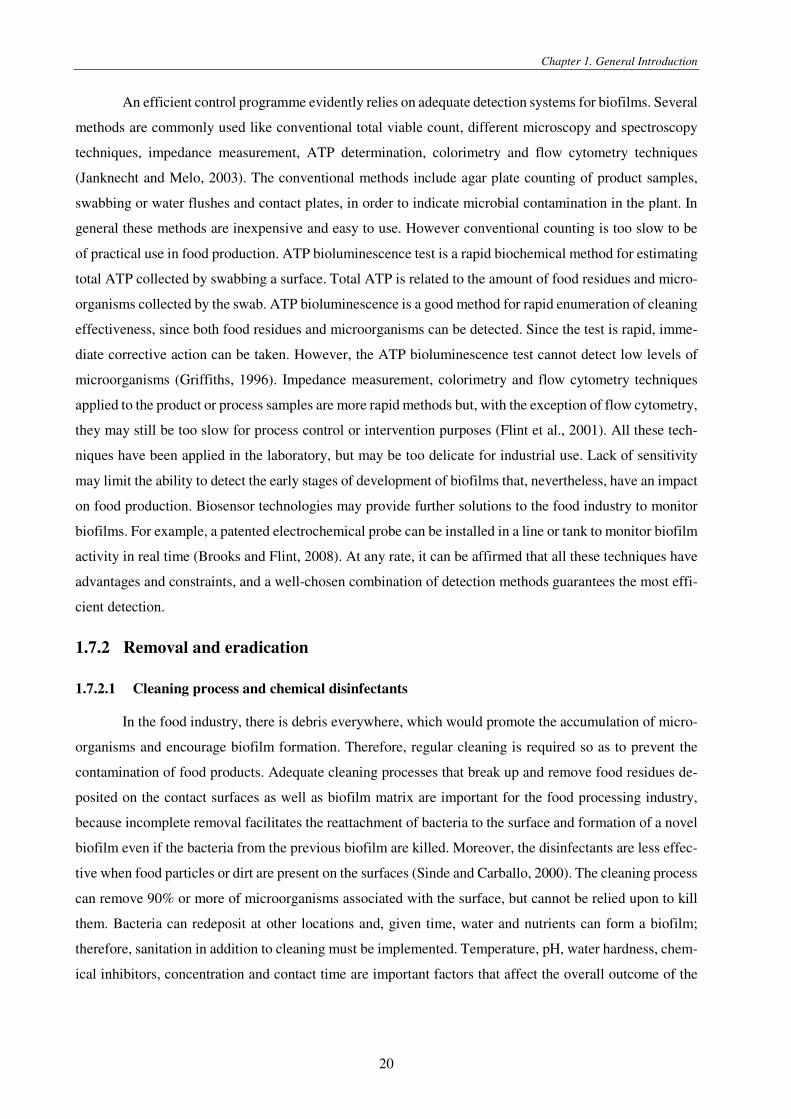
A wide range of chemical disinfectants is used in the food industry, which can be divided into
different groups according to their mode of action: (i) oxidizing agents including chlorine-based com-
pounds, hydrogen peroxide, ozone and peracetic acetic, (ii) surface-active compounds including quaternary
ammonium compounds and acid anionic compounds, and (iii) iodophores. In Figure 1.6 advantages and
disadvantages of some disinfectants used in the food industry are reported.
Figure 1.6 Advantages and disadvantages of some disinfectants used in the food processes (Wirtanen and Salo, 2003)
Disinfectants should be chosen based on the process. The use of disinfectants in food plants depends
on the material used and the adhering microbes. The efficiency of disinfection is influenced by water hard-
ness, pH, temperature, concentration, contact time and interfering organic substances like food particles
Chapter 1. General Introduction
22
and soil. Thus, cleaning agents like detergents and enzymes are frequently combined with disinfectants to
synergistically enhance disinfection efficiency (Jacquelin et al., 1994).
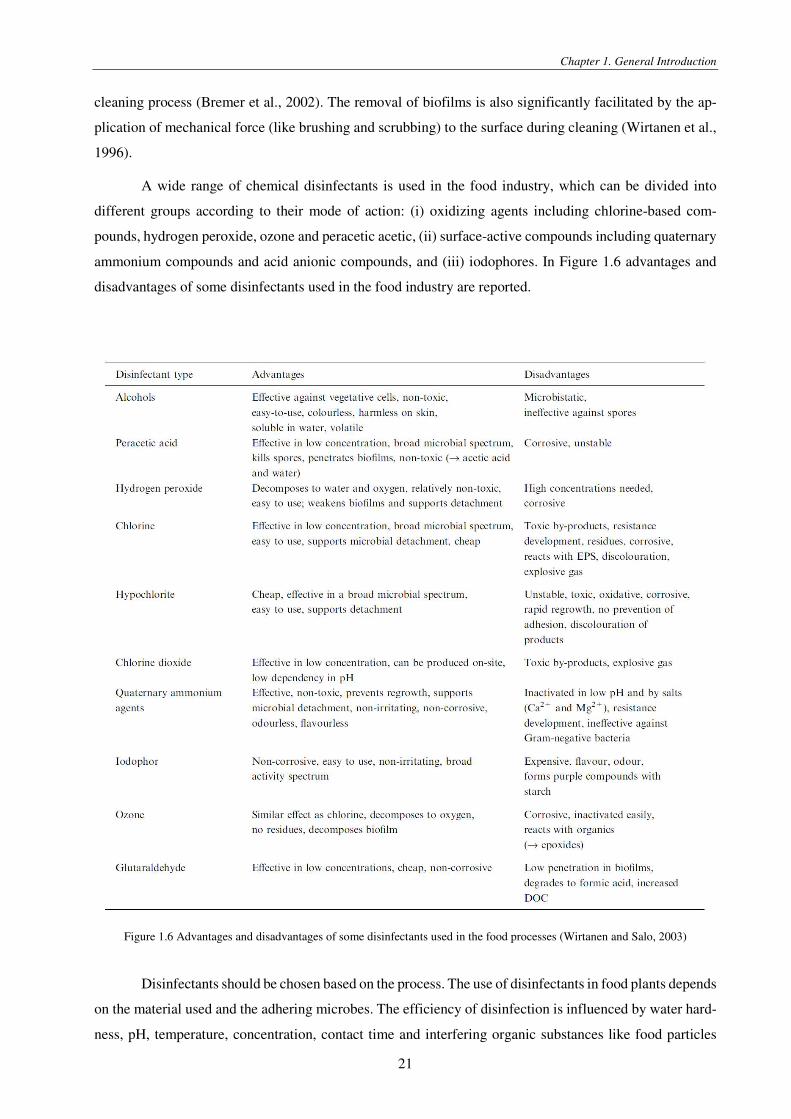
In the selection of the disinfectant, it should be considered that cells within a biofilm are more
resistant to biocides than their planktonic counterparts. For example, the antimicrobial efficacy of a widely
used disinfectant product, benzalkonium chloride, is lower for biofilm-associated than for planktonic Staph-
ylococcus aureus cells (Figure 1.7). Similarly, Listeria monocytogenes biofilms were more resistant to
cleaning agents and disinfectants including trisodium phosphate, chlorine, ozone, hydrogen peroxide,
peracetic acid and quaternary ammonium compounds as compared to planktonic cells (Robbins et al.,
2005).
Figure 1.7 Effectiveness of benzalkonium chloride (BAC) against Staphylococcus aureus biofilms and planktonic cells after 48 h at 25 °C. MBEC: minimal biofilm eradication concentration; MBC: minimal bactericidal concentration (Vázquez-Sánchez et al.,
2014)
Biofilm resistance to antimicrobial compounds is attributed to different mechanisms: a slow or
incomplete penetration of the biocide into the biofilm, an altered physiology of the biofilm cells, expression
of an adaptive stress response by some cells, or differentiation of a small subpopulation of cells into per-
sister cells (Van Houdt and Michiels, 2010).
The slow or incomplete penetration of the biocide into the biofilm is partly due to the presence of
the exopolymeric matrix, but primarily due to the neutralization of the active compound in the outermost
regions of the matrix. Biofilm cells, especially those placed deep in the biofilm, exhibit decreased growth
rates because of oxygen and nutrient gradients. The transition from exponential to slow or no growth is
generally accompanied by an increase in resistance to biocides, so older biofilms appear to be more resistant
against various disinfectants than younger biofilms. Another possible mechanism of biocide resistance is
that some of the biofilm cells are able to sense the biocide challenge and actively respond to it by deploying
protective stress responses more effectively than planktonic cells (Szomolay et al., 2005).
Chapter 1. General Introduction
23
1.7.2.2 Physical methods
Physical treatments have been studied as alternatives to the use of chemical disinfectants in the
food industry in particular for the sanitation of surfaces. Examples of technologies applied for disinfection
are radiation with ultraviolet (UV) light and ionizing radiation. UV-C light treatment (100 < λ < 280 nm)
has been widely used in the food industries and hospitals for air and surface sanitation (Sommers et al.,
2010). One of the newest technologies proposed as a non-thermal treatment based on UV-C light is pulsed
light treatment, which has been proven effective for killing a wide variety of microorganisms on foods and
food contact materials (Ozen and Floros, 2001).
Ionizing radiation was tested on Salmonella biofilm and was observed that this technique was
equally or more effective against biofilm cells than against planktonic cells of Salmonella spp. Therefore,
it can be said that ionizing radiation could be a useful sanitation treatment on a variety of foods and contact
surfaces (Figure 1.8).
Figure 1.8 Radiation sensitivity of three Salmonella isolates in planktonic and biofilm-associated forms (Niemira and Solomon, 2005)
A relatively recent technique, called atmospheric plasma inactivation, makes use of reactive oxygen
species and radicals generated by high voltage atmospheric pressure glow discharges to inactivate micro-
organisms. The technique appears to be effective against both biofilm and planktonic microorganisms
(Vleugels et al., 2005).
Ultrasonication is a well-known technique used in various food industry processes, namely freez-
ing, cutting, drying, tempering, bleaching, sterilization and extraction. It was reported to be also used as an
efficient biofilm removal method on food contact surfaces, especially when combined with other techniques
like the use of ozone or enzyme preparations (Baumann et al., 2009).
1.7.2.3 Biological methods
The use of enzyme-based detergents as bio-cleaners, also known as “green chemicals”, can serve
as a viable option to overcome the biofilm problem in the food industry. Since EPS is a heterogenic matrix,
Chapter 1. General Introduction
24
a mixture of enzymes may be necessary in order to degrade the complex. The enzymes efficiency in biofilm
removal may vary according to the species of bacteria, and it can also be enhanced in combination with
surfactants (Lequette et al., 2010). However, formulation containing several different enzymes seems to be
fundamental for a successful biofilm control strategy, like for example protease and polysaccharide hydro-
lyzing enzymes. Therefore, the specificity in the enzymes mode of action makes it a complex technique,
increasing the difficulty of identifying enzymes that are effective against all the different types of biofilm.
Another biological strategy is based on bacteriophages, which may provide a natural, highly specific, non-
toxic, feasible approach for controlling several microorganisms involved in biofilm formation. This tech-
nology has not yet been successfully developed and relatively little information is available on the action
of bacteriophages on biofilms. Moreover, the infection of biofilm cells by phages is extremely conditioned
by their chemical composition and the environmental factors, such as temperature, growth stage, media and
phage concentration (Sillankorva et al., 2008).
The negative consumer perception against artificial synthetic chemicals has shifted the research
effort towards the development of alternatives that consumers perceive as “natural”. Studies have indicated
that essential oils and extracts of edible and medicinal plants, herbs and spices constitute a class of very
potent antibacterial agents (Marino et al., 2001). Essential oils have been recently evaluated for their activity
against biofilm formation, even if the literature examining their use in sanitizing solutions for biofilm con-
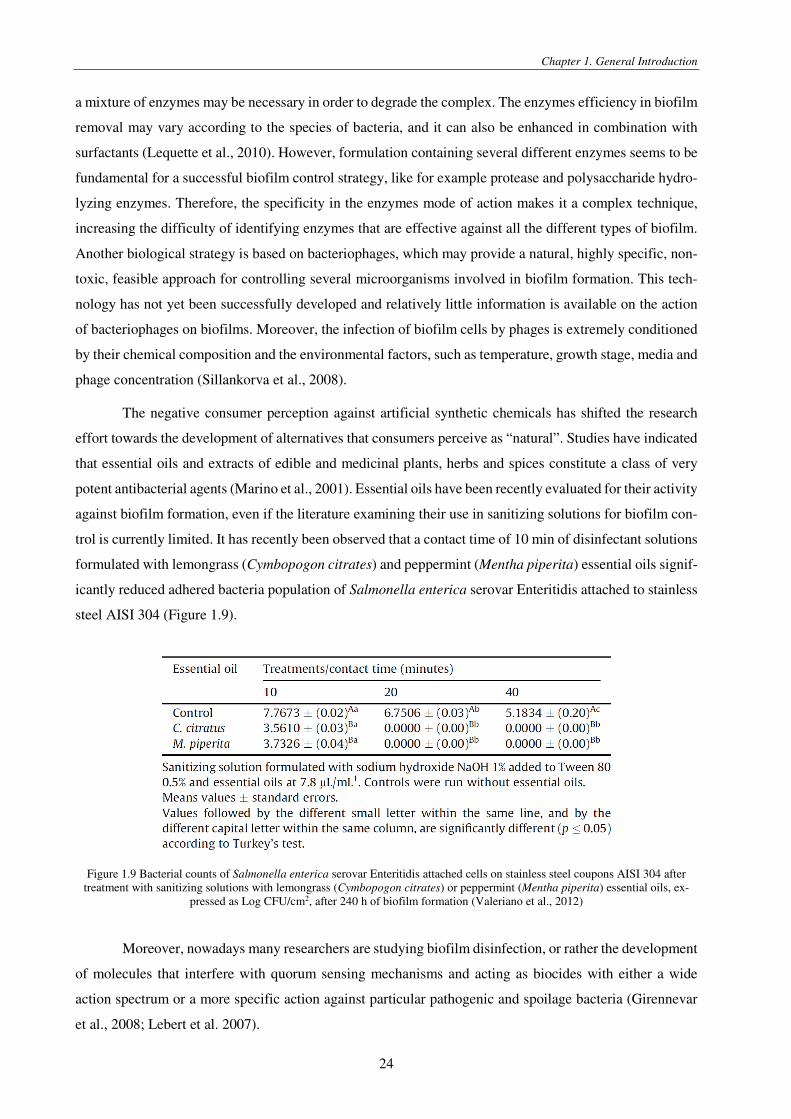
trol is currently limited. It has recently been observed that a contact time of 10 min of disinfectant solutions
formulated with lemongrass (Cymbopogon citrates) and peppermint (Mentha piperita) essential oils signif-
icantly reduced adhered bacteria population of Salmonella enterica serovar Enteritidis attached to stainless
steel AISI 304 (Figure 1.9).
Figure 1.9 Bacterial counts of Salmonella enterica serovar Enteritidis attached cells on stainless steel coupons AISI 304 after treatment with sanitizing solutions with lemongrass (Cymbopogon citrates) or peppermint (Mentha piperita) essential oils, ex-
pressed as Log CFU/cm2, after 240 h of biofilm formation (Valeriano et al., 2012)
Moreover, nowadays many researchers are studying biofilm disinfection, or rather the development
of molecules that interfere with quorum sensing mechanisms and acting as biocides with either a wide
action spectrum or a more specific action against particular pathogenic and spoilage bacteria (Girennevar
et al., 2008; Lebert et al. 2007).
Chapter 1. General Introduction
25
Finally, it can be said that probably the best technology to obtain biofilm cells eradication is the
combination of two or more different control techniques which have been proven to be effective. This
combination summarizes different obstacles to be administered to biofilms in order to provide a synergistic
effects. For example, DeQueiroz and Day (2007) studied the antimicrobial activity and effectiveness of a
combination of sodium hypochlorite and hydrogen peroxide in killing and removing Pseudomonas aeru-
ginosa biofilms from surfaces. The synergistic effect of ozone and ultrasound was also shown to be efficient
for biofilm cell reduction (Patil, 2010).
1.8 REFERENCES
Adal, K.A., Farr, B.M. 1996. Central venous catheter-related infections: a review. Nutrition 12, 208-213
Allison, D.G. 2003. The biofilm matrix. Biofouling 19, 139-150
Allison, D.G., Gilbert, P., Lappin-Scott, H.M., Wilson, M. 2000. Community structure and co-operation in biofilms. Cambridge University Press, Cambridge
Bagge-Ravn, D.,Ng,Y., Hjelm, M., Christiansen, J.N., Johansen, C., Gram, L. 2003. The microbial ecology of processing equip-ment in different fish industries—analysis of the microflora during processing and following cleaning and disinfection. I J Food Microbiol 87, 239-250
Barnes, L.M., Lo, M.F., Adams, M.R., Chamberlain, A.H.L. 1999. Effect of milk proteins on adhesion of bacteria to stainless steel surfaces. App Environ Microb 65, 4543-4548
Baumann, A.R., Martin, S.E., Feng, H. 2009. Removal of Listeria monocytogenes biofilms from stainless steel by use of ultrasound and ozone. J Food Protect 72, 1306-1309
Borch, E., Kant-Muermans, M.L., Blixt, Y. 1996. Bacterial spoilage of meat and cured meat products. I J Food Microbiol 33, 103-120
Bouman, S., Lund, D.B., Driessen, F.M. and Schmidt, D.G., 1982. Growth of thermoresistant streptococci and deposition of milk constituents on plates of heat-exchangers during long operating times. J Food Protect 45, 806-812
Bremer, P.J., Monk, I., Butler, R. 2002. Inactivation of Listeria monocytogenes/Flavobacterium spp. biofilms using chlorine: im-pact of substrate, pH, time and concentration. Lett Appl Microbiol 35, 321-325
Brooks, J.D., Flint, S.H. 2008. Biofilms in the food industry: problems and potential solutions. Int J Food Sci Tech 43, 2163-2176
Carpentier, B., Cerf, O. 1993. Biofilms and their consequences with particular reference to hygiene in the food industry. J Appl Bacteriol 75, 499-511
Chmielewski, R.A.N., Frank, J. F. 2003. Biofilm formation and control in food processing facilities. Compr Rev Food Sci Food Safety 2, 22-32
Chmielewski, R.A.N., Frank, J.F. 2004. A predictive model for heat inactivation of Listeria monocytogenes biofilm on stainless steel. J Food Protect 67, 2712-2718
Cloete, T.E., Jacobs, L. 2004. Surfactants and the attachment of Pseudomonas aeruginosa to 3CR12 stainless steel and glass. Water SA 27, 21-26
Costerton, J.W., Cheng, K.J., Geesey, G.G., Ladd, T.I., Nickel, J.C., Dasgupta, M., Marrie, T.J. 1987. Bacterial biofilms in nature and disease. Annu Rev Microbiol 41, 435-464
Costerton, J.W., Lewandowski, Z., Caldeweel, D.E., Korber, D.R., De Beer, D., James, G. 1994. Biofilms: the customized mi-croniche. J Bacteriol 176, 2137-2142
Cunliffe, D., Smart, C.A., Alexander, C., Vulfson, E.N. 1999. Bacterial adhesion at synthetic surfaces. App Environ Microb 65, 4995-5002
Davies, D.G., Geesey, G.G. 1995. Regulation of the alginate biosynthesis gene algC in Pseudomonas aeruginosa during biofilm development in continuous culture. Appl Environ Microb 61, 860-867
DeQueiroz, G.A., Day, D.F. 2007. Antimicrobial activity and effectiveness of a combination of sodium hypochlorite and hydrogen peroxide in killing and removing Pseudomonas aeruginosa biofilms from surfaces. J Appl Microbiol 103, 794-802
Donlan, R.M. 2000. Role of biofilms in antimicrobial resistance. Asaio J 46, S46-S52
Donlan, R.M. 2002. Biofilm: microbial life on surface. Emerg Infect Dis 8, 881-890
Chapter 1. General Introduction
26
Draghi, J.A., Turner, P.E. 2006. DNA secretion and gene-level selection in bacteria. Microbiology 152, 2683-2688
Dunne, W.M. 2002. Bacterial adhesion: seen any good biofilms lately? J Clin Microbiol 15, 155-166
Ferreira, C., Pereira, A.M., Pereira, M.C., Melo, L.F., Simões, M. 2011. Physiological changes induced by the quaternary ammo-nium compound benzyldimethyldodecylammonium chloride on Pseudomonas fluorescens. J Antimicrob Chemoth 66, 1036-1043
Flemming H.C., Wingender, J. 2001. Relevance of microbial extracellular polymeric substances (EPSs) – Part I: Structural and ecological aspects. Water Sci Technol 43, 1-8
Flemming, H.-C., Wingender, J. 2002. Extracellular polymeric substances: structure, ecological functions, technical relevance. In: Bitton, G. (ed.) Encyclopedia of environmental microbiology 3, 1223-1231. Wiley. New York, NY
Fletcher, M. 1988. Attachment of Pseudomonas fluorescens to glass and influence of electrolytes on bacterium-substratum sepa-ration distance. J Bacteriol, 170, 2027-2030
Flint, S., Palmer, J., Bloemen, K., Brooks, J., Crawford, R. 2001. The growth of Bacillus stearothermophilus on stainless steel. J Appl Microbiol 90, 151-157
Ghannoun, M., O’Toole, G.A. 2004. Microbial biofilms. ASM Press, Cleveland, USA
Gilbert, P., Evans, D.J., Evans, E., Duguid, I.G., Brown, M.R.W. 1991. Surface characteristics and adhesion of Escherichia coli and Staphylococcus epidermidis. J Appl Microbiol 71, 72-77
Girennavar, B., Cepeda, M.L., Soni, K.A., Vikram, A., Jesudhasan, P., Jayaprakasha, G.K., Pillai, S.D., Patil, B. S. 2008. Grapefruit juice and its furocoumarins inhibits autoinducer signaling and biofilm formation in bacteria. Int J Food Microbiol 125, 204-208
Godwin, J.A.S., Foster, C.F.A.N. 1989. Examination of the extracellular polymers produced by activated-sludge. Microbios 57, 2179-2185
Griffiths, M.W. 1996. The role of ATP bioluminescence in the food industry: new light on old problems. Food Technol 50, 62-73
Gristina, A.G., Hobgood, C.D., Webb, L.X., Myrvik, Q.N. 1987. Adhesive colonization of biomaterials and antibiotic resistance. Biomaterials 8, 423-426
Gunduz, G.T., Tuncel, G. 2006. Biofilm formation in an ice cream plant. Anton Leeuw, 89, 329-336
Guobjoernsdottir, B., Einarsson, H., Thorkelsson, G. 2005. Microbial adhesion to processing lines for fish fillets and cooked shrimp: influence of stainless steel surface finish and presence of gram-negative bacteria on the attachment of Listeria monocyto-
genes. Food Technol Biotech 43, 55-61
Heukelekian, H. and Heller, A. 1940. Relation between food concentration and surface for bacterial growth. J Bacteriol. 40, 547-558
Hood, S.K., Zottola, E.A. 1997. Isolation and identification of adherent gram-negative microorganisms from four meat-processing facilities. J Food Protect 60, 1135-1138
Jacquelin, L.F., Le Magrex, E., Brisset, L., Carquin, J., Berthet, A., Choisy, C. 1994. Synergism of the combination of enzymes or surfactants and a phenolic disinfectant on a bacterial biofilm. Pathol Biol 42, 425
Janknecht, P., Melo, L.F. 2003. Online biofilm monitoring. Rev Environ Sci Biotech 2, 269-283
Johansen, C., Faholt, P., Gram, L. Enzimatic removal and disinfection of bacterial biofilms. Appl Environ Microbiol 9, 3724-3728
Jones, H.C., Roth, I.L., Saunders, W.M III. 1969. Electron microscopic study of a slime layer. J Bacteriol 99, 316-325
Knetsch, M.L., Koole, L.H. 2011. New strategies in the development of antimicrobial coatings: the example of increasing usage of silver and silver nanoparticles. Polymers 3, 340-366
Knight, G.C., Nicol, R.S. and McMeekin, T.A., 2004. Temperature step changes: a novel approach to control biofilms of Strepto-
coccus thermophilus in a pilot plant-scale cheese-milk pasteurisation plant. Int J Food Microbiol 93, 305-318
Lawrence, JR, Neu, TR, Swerhone GDW. 1998. Application of multiple parameter imaging for the quantification of algal, bacterial and exopolymer components of microbial biofilms. J Microbial Meth 32, 253-261
Lebert, I., Leroy, S., Talon, R. 2007. Effect of industrial and natural biocides on spoilage, pathogenic and technological strains grown in biofilm. Food Microbiol 24, 281-287
Leeuwenhoek, A.V. 1684. Some microscopical observation about animals in the scurf of the teeth. Phil Trans 14, 568-574
Lequette, Y., Boels, G., Clarisse, M., Faille, C. 2010. Using enzymes to remove biofilms of bacterial isolates sampled in the food-industry. Biofoul 26, 421-431
Leriche, V., Sibille, P., Carpentier, B. 2000. Use o fan enzyme-linked lectinsorbent assay to monitor the shift in polysaccharide composition in bacterial biofilms. Appl Environ Microbiol 66, 1851-1856
Liu, Y., Yang, S.F., Li, Y., Xu, H., Qin, L., Tay, J.H. 2004. The influence of cell substratum surface hydrophobicities on microbial attachment. J Biotechnol 110, 251-256
Lundèn, J.M., Autio, T.J., Sjoberg, A.M., & Korkeala, H.J. 2003. Persistent and nonpersistent Listeria monocytogenes contamina-tion in meat and poultry processing plants. J Food Protect 66, 2062-2069
Chapter 1. General Introduction
27
Marchand, S., De Block, J., De Jonghe, V., Coorevitis, A., Heyndrickx, M. Herman, L. 2012. Biofilm formation in milk production and processing environments; influence on milk quality and safety. Compr Rev Food Sci F 11, 133-147
Marino, M., Bersani, C., Comi, G. 2001. Impedance measurements to study the antimicrobial activity of essential oils from Lami-
aceae and Compositae. Int J Food Microbiol 67, 187-195
Marino, M., Frigo, F., Bartolomeoli, I., Maifreni, M. 2011. Safety‐related properties of staphylococci isolated from food and food environments. J Appl Microbiol 110, 550-561
Marshall, K.C. 1992. Biofilms: an overview of bacterial adhesion, activity and control surfaces. Am Soc Microbiol News 58, 202-207
Maukonen, J., Mtt, J., Wirtanen, G., Raaska, L., Mattila-Sandholm, T., Saarela, M. 2003. Methodologies for the characterization of microbes in industrial environments: a review. J Ind Microbiol Biot 30, 327-356
Melo, L.F., Bott, T.R. 1997. Biofouling in water systems. Exp Therm Fluid Sci 14, 375-381
Meyer, B. 2003. Approaches to prevention, removal and killing of biofilms. Int Biodeter Biodegr 51, 249-253
Mittelman, M.W. 1998. Structure and functional characteristics of bacterial biofilms in fluid processing operations. J Dairy Sci 81, 2760-2764
Molin, S., Tolker-Nielsen, T. 2003. Gene transfer occurs with enhanced efficiency in biofilms and induces enhanced stabilisation of the biofilm structure. Curr Opin Biotech 14, 255-261
Niemira, B.A., Solomon, E.B. 2005. Sensitivity of planktonic and biofilm-associated Salmonella spp. to ionizing radiation. Appl Environ Microbiol 71, 2732-2736
O’Toole, G., Kaplan, H.B., Kolter, R. 2000. Biofilm formation as microbial development. Annu Rev Microbiol 54, 49-79
O’Toole, G.A., Kolter, R. 1998. Flagellar and twitching motility are necessary for Pseudomonas aeruginosa biofilm development. Mol Microbiol 30, 295-304
Ozen, B.F., Floros, J.D. 2001. Effects of emerging food processing techniques on the packaging materials. Trends Food Sci Technol 12, 60-67
Pala, T. R., Sevilla, A. 2004. Microbial contamination of carcasses, meat, and equipment from an Iberian pork cutting plant. J Food Protect 67, 1624-1629
Parsek, M.R., Greenberg, E.P. 2005. Sociomicrobiology: the connections between quorum sensing and biofilms. Trends Microbiol 13, 27-33.
Pasmore, M., Todd, P., Pfiefer, B., Rhodes, M., Bowman, C.N. 2002. Effect of polymer surface properties on the reversibility of attachment of Pseudomonas aeruginosa in the early stages of biofilm development. Biofouling 18, 65-71
Patil, 2010. Efficacy of ozone and ultrasound for microbial reduction in fruit juice. Dublin Institute of Technology
Prakash, B., Veeregowda, B.M., Krishnappa, G. 2003. Biofilms: a survival strategy of bacteria. Curr Sci 85, 1299-1307
Prigent-Combaret, C., Vidal, O., Dorel, C., Lejeune, P. 1999. Abiotic surface sensing and biofilm-dependent regulation of gene expression in Escherichia coli. J Bacteriol 181, 5993-6002
Prosser, B.L., Taylor, D., Dix, B.A., Cleeland, R. 1987. Method of evaluating effects of antibiotics on bacterial biofilm. Antimicrob Agents Chemomether 31, 1502-1506
Rieu, A., Briandet, R., Habimana, O., Garmyn, D., Guzzo, J., Piveteau, P. 2008. Listeria monocytogenes EGD-e biofilms: no mushrooms but a network of knitted chains. App Environ Microb 74, 4491-4497
Robbins, J.B., Fisher, C.W., Moltz, A.G., Martin, S.E. 2005. Elimination of Listeria monocytogenes biofilms by ozone, chlorine, and hydrogen peroxide. J Food Protect 68, 494-498
Sharma, M., Anand, S.K. 2002. Biofilms evaluation as an essential component of HACCP for food/dairy processing industry-a case. Food Control 13, 469-477
Sillankorva, S., Neubauer, P., Azeredo, J. 2008. Pseudomonas fluorescens biofilms subjected to phage phiIBB-PF7A. BMC Biotechnol 8, 79
Simões, M., Pereira, M.O., Vieira, M.J. 2003. Monitoring the effects of biocide treatment of Pseudomonas fluorescens biofilms formed under different flow regimes. Water Sci Technol 47, 217-223
Simões, M., Simões, L.C., Cleto, S., Pereira, M.O., Vieira, M.J. 2008. The effects of a biocide and a surfactant on the detachment of Pseudomonas fluorescens from glass surfaces. Int J Food Microbiol 121, 335-341
Simões, M., Simões, L.C., Vieira, M.J. 2010. A review of current and emergent biofilm control strategies. LWT-Food Sci Technol 43, 573-583
Sinde, E., Carballo, J. 2000. Attachment of Salmonella spp. and Listeria monocytogenesto stainless steel, rubber and polytetraflu-orethylene: the influence of free energy and the effect of commercial sanitizers. Food Microbiol 17, 439-447
Smoot, L.M., Pierson, M.D. 1998. Effect of environmental stress on the ability of Listeria monocytogenes Scott A to attach to food contact surfaces. J Food Protect 61, 1293-1298
Sommers, C.H., Sites, J.E., Musgrove, M. 2010. Ultraviolet light (254 nm) inactivation of pathogens on foods and stainless steel surfaces. J Food Safety 30, 470-479
Spoering, A.L., Gilmore, M.S. 2006. Quorum sensing and DNA release in bacterial biofilms. Curr Opin Microbiol 9, 133-137
Stoodley, P., Sauer, K., Davies, D.G., Costerton, J.W. 2002. Biofilms as complex differentiated communities. Annu Rev Microbiol 56, 187-209
Sutherland I.W. 2001a. The biofilm matrix-an immobilizer but dynamic environment. Trends Microbiol 9, 222-227
Sutherland, I.W. 2001b. Biofilm exopolysaccharides: a strong and sticky framework. Microbiol 147, 3-9
Szomolay, B., Klapper, I., Dockery, J., Stewart, P.S. 2005. Adaptive responses to antimicrobial agents in biofilms. Environ Micro-biol 7, 1186-1191
Tresse, O., Shannon, K., Pinon, A., Malle, P., Vialette, M., Midelet-Bourdin, G. 2007. Variable adhesion of Listeria monocytogenes isolates from food-processing facilities and clinical cases to inert surfaces. J Food Protect 70, 1569-1578
Valeriano, C., De Oliveira, T.L.C., De Carvalho, S.M., Cardoso, M.D.G., Alves, E., Piccoli, R.H. 2012. The sanitizing action of essential oil-based solutions against Salmonella enterica serotype Enteritidis S64 biofilm formation on AISI 304 stainless steel. Food Control 25, 673-677
Van Houdt, R., Michiels, C.W. 2010. Biofilm formation and the food industry, a focus on the bacterial outer surface. J Appl Microbiol 109, 1117-1131
Vázquez-Sánchez, D., Cabo, M.L., Ibusquiza, P.S., Rodríguez-Herrera, J.J. 2014. Biofilm-forming ability and resistance to indus-trial disinfectants of Staphylococcus aureus isolated from fishery products. Food Control 39, 8-16.
Vleugels, M., Shama, G., Deng, X.T., Greenacre, E., Brocklehurst, T., Kong, M.G. 2005. Atmospheric plasma inactivation of biofilm-forming bacteria for food safety control. Plasma Sci, 33, 824-828
Walker, J.T., Mackerness, C.W., Rogers, J., Keevil, C.W. 1995. Heterogeneous mosaic – a haven for waterborne pathogens. In: Lappin-Scoot, H.M., Costerton, J.W., Eds. Microbial biofilms. Cambridge University Press, Cambridge, UK 196-204
Webb, J.S., Thomposon, L.S., James, S., Charlton, T., Tolker-Nielsen, T., Koch, B., Givskov, M., Kjelleberg, S. 2003. Cell death in Pseudomonas aeruginosa biofilm development. J Bacteriol 185, 4585-4592
Whitchurch, C.B., Tolker-Nielsen, T., Ragas, P.C., Mattick, J.S. 2002. Extracellular DNA required for bacterial biofilm formation. Science 295, 1487
Wirtanen, G., Husmark, U., Mattila-Sandholm, T. 1996. Microbial evaluation of the biotransfer potential from surfaces with Ba-cillus biofilms after rinsing and cleaning procedures in closed food-processing systems. J Food Protect 59, 727-733
Wirtanen, G., Salo, S. 2003. Disinfection in food processing–efficacy testing of disinfectants. Rev Environ Sci Biotechnol 2, 293-306
29
Chapter 2. EVALUATION OF CULTURE CONDITIONS AND
METHODS IN STUDYING MICROBIAL BIOFILM
Chapter 2. Evaluation of Culture Conditions and Methods in Studying Microbial Biofilm
30
2.1 INTRODUCTION
Studies of biofilm development have the purpose to collect all possible information to better un-
derstand the bacterial ability to adhere to and to form biofilm on different surfaces. Over the last decades,
a broad range of model systems has been described for the in vitro study of biofilm formation and devel-
opment, as microtiter plate-based methods, drip-flow methods and batch-biofilm reactors. In all of them,
subsequently biofilm growth sessile bacteria are enumerated after detachment from the surface by scraping,
vortexing, sonication and plate counting, or the biomass quantified using the microtiter plates assay and
microscopy techniques (epifluorescence, confocal laser scanning microscopy, transmission electron and
scanning electron microscopy) (Coenye and Nelis, 2010).
Microtiter plate-based assays are among the most frequently used model systems to screen the abil-
ity to form biofilm by microbial strains. As a matter of fact, these methods can be used as rapid and simple
techniques to screen for differences in biofilm production between strains, or for evaluating of the efficacy
of biocides in killing sessile cells (Peeters et al., 2008). A microtiter plate is a polystyrene flat-bottom plate
with multiple wells, each of which holds a few hundred microlitres of liquid or culture medium. In each
plate several biofilms can be formed under different conditions. The microtiter plate assay is superior to
other static tests, e.g. tube test, in terms of objectivity, accuracy, simplicity and indirect measurement of
bacteria attached to the walls of the wells (Stepanović et al., 2000). The microtiter plate techniques allow
the quantification of matrix and both living and dead cells using the crystal violet staining, as well as the
viable cells and the matrix quantification, using for example ruthenium red staining of EPS (Borucki et al.,
2003).
Other in vitro systems for growing and testing biofilms include simple batch/static systems, batch
systems with introduced shear, flow cells and systems that can be operated under continuous-flow condi-
tions (Mittelman et al., 1992; Ceri et al., 1999). These systems generally provide a surface that can be
removed and examined once it is colonized to assess biofilm formation. Donlan et al. (2004) developed a
reactor (CDC Biofilm Reactor, CBR) that incorporated 24 removable biofilm growth surfaces made of
different materials (e.g stainless steel, rubber, glass, …) allowing biofilm formation under moderate to high
shear in batch or continuous-flow conditions. Studies that utilized this reactor showed that it could be used
for detecting biofilm formation, characterizing biofilm structure and assessing the effect of antimicrobial
agents on the biofilm. According to the results obtained by Goeres et al. (2005), the CBR system is a reliable
experimental tool for growing a standard biofilm in the laboratory and it can be adapted in order to study
several different microorganisms under a wide range of controllable conditions. For this reason, this system
must be set up for each strain since in literature there is CBR setting for only few microbial species.
In this study, preliminary experiments were performed to generate and to examine biofilms of food
relevant spoilage and pathogen microorganisms using different techniques such as the microtiter plate assay
and the CBR system. These methods were evaluated in order to study their applicability and repeatability
Chapter 2. Evaluation of Culture Conditions and Methods in Studying Microbial Biofilm
31
for the formation and quantification of bacterial biofilms. Moreover, the drop plate counting method was
tested and compared to the traditional plate counting.
2.2 MATERIALS AND METHODS
2.2.1 Microtiter plate assay
Thirteen L. monocytogenes strains belonging to different serotypes (see List of Strains) were used
in the microtiter plate assay (Lm_1, Lm_4, Lm_5, Lm_7, Lm_23, Lm_29, Lm_174, Lm_254, Lm_288,
Lm_SB, Lm_1E, Lm_5E and Lm_Scott A). All strains were cultured overnight at 37 °C (~ 108 CFU/mL).
Three different broth cultures were used to grow biofilms on microtiter plates, Brain Heart Infusion
CBR is engineered to emulate a specific real-world environment even if it is, in any case, a labor-
atory biofilm growth system. Because the choice of reactor affects the laboratory biofilm formation, it is
important for researchers to choose the appropriate reactor and growth conditions. The results clearly
showed that CBR system is a reliable experimental tool for growing a standard biofilm in the laboratory.
The high number of biofilm samples possible to obtain under the same experimental conditions could sup-
ply several opportunities in research aimed at studying biofilm growth kinetics, comparison of different
biofilm killing strategies, as well as the qualitative and quantitative characterization of biofilms grown in
different environmental and culture conditions.
Regarding the study of biofilm cell density, the results demonstrated that CBR, when operated in
dynamic conditions (i.e. in batch with rotation of the magnetic stir bar to 125 rpm), was capable of gener-
ating dense biofilms of P. fluorescens Pfl_019 on replicate stainless steel AISI 304 surfaces. According to
previous studies, P. fluorescens strain has a high ability to form biofilms on stainless steel (Somers and
Chapter 2. Evaluation of Culture Conditions and Methods in Studying Microbial Biofilm
39
Wong, 2004). The incubation temperature statistically influenced the quantity of biofilm formed by P. flu-
orescens (p<0.05), with an increased production at the lowest temperature value (Table 2.4), which is quite
common in refrigerated sites of food plants.
Table 2.4 Cell viable counts (mean Log CFU/cm2 ± SD; n=48) of biofilms grown for seven days on stainless steel at 4 °C and 15 °C. Mean values with a different letter indicate statistically different values (p<0.05)
Temperature Log CFU/cm2 ± SD
4 °C 5.46a ± 0.36
15 °C 4.62b ± 0.28
In conclusion, this preliminary study showed that CBR can be used to grow a standard biofilm for
addressing diverse research questions. It is important to emphasize that to obtain a rough statistical evalu-
ation, the working conditions of the reactor should be standardized and multiple experiments must be per-
formed on the microorganisms and the culture conditions to be tested.
2.3.3 Drop plate method
Studying microbial biofilms frequently require the quantification of viable counts grown on sur-
faces, and the “gold standard” method to obtain these data is the spread plate (SP) technique, in which a
series of decimal dilutions of the suspension containing biofilm cells is evenly distributed on at least dupli-
cate agar plates. This method requires the use of a high number of disposable consumables (e.g. dilution
tubes, pipette tips, spatulas, Petri dishes), culture media and is also time-consuming. These circumstances
greatly affect studies on microbial biofilms, both economically and in terms of time, where numerous sur-
faces have to be tested in order to obtain reliable information. Thus, alternative methods to enumerate bio-
film microrganisms are strongly appreciated. Among them, the drop plate (DP) method exhibits many pos-
itive characteristics, allowing easy execution of the plating process without sacrificing the accuracy of the
results.
In this step the DP and the SP methods were used to evaluate viability of L. monocytogenes biofilms
grown on microtiter plates and on stainless steel coupons in CBR. The results of viable cell counts of the
biofilms grown in microtiter plates and in CBR are shown in Figure 2.6.
Chapter 2. Evaluation of Culture Conditions and Methods in Studying Microbial Biofilm
40
Figure 2.6 Mean viable counts (Log CFU/cm2) ± SD of L. monocytogenes biofilms grown in microtiter plates (Lm_1, Lm_Scott A and Lm_278) (n=3) and in CBR (Lm_278*) (n=2) as evaluated by SP and DP methods
The analysis of variance performed on mean viable counts evaluated by SP and DP showed that no
significant statistical difference between the two methods of bacterial count for each strain existed, not even
for biofilms with very different densities formed on different surfaces. This was the case of the strain
Lm_278, which was tested both on microtiter plate, where the mean viable count was 9.18 Log CFU/cm2,
and in CBR, where the mean viable count was 5.20 Log CFU/cm2.
In addition to providing results not statistically different from the SP technique, the DP technique
offered a lot of operational and economic advantages. First of all, less time and effort are required to dis-
pense an equivalent volume of microbial suspension in drops on agar plates than to spread the same volume
using a spatula. This advantage can be much greater if an electronic micropipette with repetitive dispensing
is used. Furthermore, the sample volume dispensed in each drop and the number of drops for each dilution
can be modulated as a function of microbiological consideration (e.g. mean size of the colonies) and the
aim of the study. For example, in disinfection killing tests, it would be useful to dispense a high number of
drops (and consequently a high volume of suspension) to reduce the limit of detection of the method. An-
other significant advantage of DP is that, for the same decimal dilution, less time is required for counting
drop plates colonies compared to spread plates, because usually a lower suspension volume is sampled. The
colonies grown from DP plates cover a smaller area than SP plates, so the colony count can be done more
accurately and it is less tiring for the technician performing the counting (Figure 2.7).
0
2
4
6
8
10
12
L. monocytogenes Lm_1 L. monocytogenes Lm_Scott A L. monocytogenes Lm_278 L. monocytogenes Lm_278*
Lo
g C
FU
/cm
2
SP DP
p=0.6932
p=0.6329
p=0.7711
p=0.8145
Chapter 2. Evaluation of Culture Conditions and Methods in Studying Microbial Biofilm
41
Figure 2.7 Drop plate method. Agar plate divided into four quadrants (for each dilution). In each quadrant five evenly spaced “drops” of each bacterial growth are evident
The DP method expends relatively few supplies with respect to SP method. For example, for plating
four dilutions in duplicate using the DP method only two Petri plates would be necessary instead of eight,
and at least four spatulas for the SP method. In Table 2.5 the disposables and materials, and their rough
costs according to the current year price list, required to perform SP and DP methods on the same sample
are reported. Not only the cost of the disposables and the culture media needs to be considered, but also the
additional time and, incubator space, to handle more plates. The use of DP method for counting viable cells
in biofilm is particularly useful, because the viable counts are high enough to justify a considerable time
saving compared to SP.
Table 2.5 Disposables and materials needed to perform SP and DP methods for an eight-fold diluted sample in duplicate
SP DP
Petri plates 16 4
pipette tips 8 8
spatulas 8 0
mL of culture medium (ca. 20 mL/plate) 320 80
rough cost (euro) 8.39 1.53
2.4 CONCLUSIONS
To study microbial biofilms of food interest, it is necessary to be able to work under different en-
vironmental conditions, both in terms of culture conditions and extrinsic parameters (for example, nutrient
concentrations, pH, temperature ... ). Furthermore, it is important to be able to create, in the shortest time
possible, a number of the most probable biofilm conditions, standardized and similar to the reality of the
food industry. Furthermore, due to the high microbial biodiversity, an in-depth study of biofilms in very
large collections of strains is necessary, resulting in an increase in the number of samples to be processed.
It is therefore necessary to have a reliable, rapid and standardized system for the production and study of
microbial biofilms. The results of this first phase of the experiment indicate that the microtiter plate assay
and the CDC biofilm reactor assay are sufficiently reliable and repeatable tools to produce, under different
operating conditions, a number of samples large enough to provide sufficient information on the ability of
food microorganisms to produce biofilms. Finally, the drop plate method has proved particularly suitable,
Chapter 2. Evaluation of Culture Conditions and Methods in Studying Microbial Biofilm
42
sufficiently accurate and reliable, as well as advantageous from the economic point of view, for the quan-
tification of viable cells present in the biofilm.
2.5 REFERENCES
Borucki, M.K., Peppin, J.D., White, D., Loge, F., Call, D.R. 2003. Variation in biofilm formation among strains of Listeria mono-
cytogenes. Appl Environ Microbiol 69, 7336-7342
Ceri, H., Olson, M.E., Stremick, C., Read, R.R., Morck, D., Buret, A. 1999. The Calgary Biofilm Device: new technology for rapid determination of antibiotic susceptibilities of bacterial biofilms. J Clin Microbiol 37, 1771-1776
Chae, M.S., Schraft, H. 2000. Comparative evaluation of adhesion and biofilm formation of different Listeria monocytogenes strains. Int J Food Microbiol 62, 103-111
Coenye, T., Nelis, H.J. 2010. In vitro and in vivo model systems to study microbial biofilm formation. J Microbiol Meth 83, 89-105
Cotter, J.J., O'Gara, J.P., Casey, E. 2009. Rapid depletion of dissolved oxygen in 96‐well microtiter plate Staphylococcus epider-
midis biofilm assays promotes biofilm development and is influenced by inoculum cell concentration. Biotechnol Bioeng 103, 1042-1047
Di Bonaventura, G., Piccolomini, R., Paludi, D., D’orio, V., Vergara, A., Conter, M., Ianieri, A. 2008. Influence of temperature on biofilm formation by Listeria monocytogenes on various food‐contact surfaces: relationship with motility and cell surface hydro-phobicity. J Appl Microbiol 104, 1552-1561
Djordjevic, D., Wiedmann, M., McLandsborough, L.A. 2002. Microtiter plate assay for assessment of Listeria monocytogenes biofilm formation. Appl Environ Microbiol 68, 2950-2958
Donlan, R.M. 2002. Biofilms: microbial life on surfaces. Emerg Infect Dis 8, 881-890
Donlan, R.M., Piede, J.A., Heyes, C.D., Sanii, L., Murga, R., Edmonds, P., El-Sayed , I., El-Sayed, M. A. 2004. Model system for growing and quantifying Streptococcus pneumoniae biofilms in situ and in real time. Appl Environ Microbiol 70, 4980-4988
Fleming, D. W., Cochi, S. L., MacDonald, K. L., Brondum, J., Hayes, P. S., Plikaytis, Holmes, M.B., Audurier, A., Broome, C.V., Reingold, A. L. 1985. Pasteurized milk as a vehicle of infection in an outbreak of listeriosis. New England J Medicine 312, 404-407
Folsom, J.P., Siragusa, G.R., Frank, J.F. 2006. Formation of biofilm at different nutrient levels by various genotypes of Listeria
monocytogenes. J Food Protect 69, 826-834
Gibson, H., Taylor, J.H., Hall, K.E., Holah, J.T. 1999. Effectiveness of cleaning techniques used in the food industry in terms of the removal of bacterial biofilms. J Appl Microbiol 87, 41-48
Herigstad, B., Hamilton, M., Heersink, J. 2001. How to optimize the drop plate method for enumerating bacteria. J Microbiol Meth 44, 121-129
Mittelman, M.W., Kohring, L.L., White, D.C. 1992. Multipurpose laminar‐flow adhesion cells for the study of bacterial coloniza-tion and biofilm formation. Biofouling 6, 39-51
Norwood, D.E., Gilmour, A. 1999. Adherence of Listeria monocytogenes strains to stainless steel coupons. J Appl Microbiol 86, 576-582
Pan, Y., Breidt, F., Gorski, L. 2010. Synergistic effects of sodium chloride, glucose, and temperature on biofilm formation by Listeria monocytogenes serotype 1/2a and 4b strains. Appl Environ Microb 76, 1433-1441
Peel, M., Donachie, W., Shaw, A. 1988. Temperature-dependent expression of flagella of Listeria monocytogenes studied by elec-tron microscopy, SDS-PAGE and western blotting. J Gen Microbiol 134, 2171-2178
Peeters, E., Nelis, H.J., Coenye, T. 2008. Comparison of multiple methods for quantification of microbial biofilms grown in mi-crotiter plates. J Microbiol Meth 72, 157-165
Römling, U., Rohde, M. 1999. Flagella modulate the multicellular behavior of Salmonella typhimurium on the community level. FEMS Microbiol Lett 180, 91-102
Simões, L.C., Simões, M., Oliveira, R., Vieira, M.J. 2007. Potential of the adhesion of bacteria isolated from drinking water to materials. J Basic Microb 47, 174-183
Somers, E.B., Wong, A.C. 2004. Efficacy of two cleaning and sanitizing combinations on Listeria monocytogenes biofilms formed at low temperature on a variety of materials in the presence of ready-to-eat-meat residue. J Food Protect 67, 2218-2229
Stepanović, S., Vuković, D., Dakić, I., Savić, B., & Švabić-Vlahović, M. 2000. A modified microtiter-plate test for quantification of staphylococcal biofilm formation. J Microbiol Meth 40, 175-179
43
Chapter 3. BIOFILM FORMATION OF FOOD PATHOGENS
AND SPOILERS AS AFFECTED BY TEMPERATURE, PH, GLU-
COSE AND SODIUM CHLORIDE
Chapter 3. Biofilm Formation of Food Pathogens and Spoilers as affected by Temperature, pH, Glucose and Sodium Chloride
44
3.1 INTRODUCTION
Bacterial attachment and biofilm formation on surfaces is influenced by physico-chemical proper-
ties of the environment, surface and microorganism, as well as by other factors, including the medium in
which bacteria are grown, presence of organic residues, and cell-to-cell communication mechanisms
(Chmielewski and Frank, 2003). The environmental factors can influence biofilm formation through alter-
ations of the bacterial cell surface. For instance, curli expression and attachment to plastic surfaces by
enterotoxin-producing E. coli strains was found to be higher at 30 °C than at 37 °C (Szabo et al., 2005).
Likewise, expression of fimbriae in Salmonella Thyphimurium and in Aeromonas veronii strains isolated
from food was affected by temperature (28 and 20 °C, respectively) favouring expression and consequent
attachment (Romling et al., 1998; Kirov et al., 1995). Production of these outer surface structures at lower
temperatures could enhance surfaces attachment, and hence facilitate persistence and survival in food-pro-
cessing environments. The adhesion of L. monocytogenes to polystyrene after growth at pH 5 was lower
than at pH 7, and this could be attributed to the down-regulation of flagellin-synthesis (Tresse et al., 2006).
Regarding both planktonic and sessile growth conditions, the different environmental parameters
act, in synergy with each other. However, studies related to biofilm formation by food pathogens and/or
food spoilers only rarely report data about the synergy of different variables. For example, Smoot and
Pierson (1998) studied attachment of L. monocytogenes Scott A to Buna-N rubber and stainless steel, and
showed that exposing cells to sublethal levels of environmental stress, such as pH and temperature, can
affect the ability of this pathogen to attach to common food contact surfaces. Hamanaka et al. (2012)
showed that biofilm development of vegetable-related Pseudomonas cells was considerably affected by
incubation temperatures and nutrient conditions, and physically weak biofilms were developed under high
nutrient conditions, especially at low temperature. Rode et al. (2007) studied biofilm formation by S. aureus
under different conditions relevant in food production, and the phenotypic and genotypic results showed
highly diverse and complex patterns of biofilm formation in S. aureus. Food environment is characterized
by several areas with significant micro-environmental differences (in temperature, pH, nutrient level and
salt concentration), therefore it is important to identify the conditions under which microorganisms are able
to survive, multiply and attach to surfaces, with regard to food processing, storage and distribution, in order
to prevent biofilm formation.
The aim of this study was to analyze the effects of pH, concentration of glucose, concentration of
NaCl and temperature on the biofilm formation by L. monocytogenes, S. aureus, P. fluorescens, P. fragi
and P. putida. The combined effects of environmental parameters on biofilm formation were studied
through a 5 levels-4 variables central composite design (CCD). The quantification of the biofilm formation
was carried out by using the crystal violet assay and, in the case of L. monocytogenes, the viable count
assay was also used, as well.
Chapter 3. Biofilm Formation of Food Pathogens and Spoilers as affected by Temperature, pH, Glucose and Sodium Chloride
45
3.2 MATERIALS AND METHODS
3.2.1 Bacterial strains and culture conditions
Eight L. monocytogenes strains (Lm_1, Lm_4, Lm_278, Lm_287, Lm_288, Lm_SB, Lm_6E, and
Lm_Scott A), eight S. aureus strains (St_037, St_059, St_117, St_132, St_137, St_174 and St_231) and
three Pseudomonas strains (P. fluorescens Ps_019, P. fragi Ps_053 and P. putida Ps_071) were used as test
organisms (see List of Strains). In a preliminary phase the strains were classified based on their biofilm-
forming ability in TSB broth in microtiter plates as described by Stepanović et al. (2000) (Table 2.1).
The biofilm formation tests for CCD were carried out in three biological replicates in 96-well pol-
ystyrene flat bottom microtiter plates in culture broth modified in composition according to the established
concentrations of glucose and NaCl and pH. In order to avoid any alteration of the modified culture media
following to autoclave sterilization, sterile modified TSB or LB broths were obtained by 0.2 µm filtration.
Each well was filled with 200 µL of modified TSB for L. monocytogenes and S. aureus strains and
modified LB broth for Pseudomonas spp. strains, and inoculated with 10 µL of each overnight culture (~
108 CFU/mL). For each experiment, eight wells were filled with each strain. Eight wells were used as
controls and filled with not inoculated 200 µL of each condition. The microtiter plates were incubated for
48 hours at the requested temperature. At the end of the incubation, the microtiter plates were treated and
the wells stained, as reported in paragraph 2.2.1. For L. monocytogenes, which is a foodborne pathogen that
can cause a severe disease with a high case fatality rate, the quantification of the biofilm cells after incuba-
tion was also carried out using the Drop Plate method (paragraph 2.2.3). For each condition, three wells
were used to quantify the biofilm cells.
3.2.2 Central Composite Design and statistical analysis
The combined effects of temperature, pH, concentration of NaCl and concentration of glucose (fac-
tors) on biofilm formation were studied through a 5 levels-4 variables Central Composite Design (CCD)
planned for each species tested (Table 3.1). For each strain a total of 30 conditions were tested, each of
which was performed three times.
Chapter 3. Biofilm Formation of Food Pathogens and Spoilers as affected by Temperature, pH, Glucose and Sodium Chloride
46
Table 3.1 Coded levels of experimental design
Coded levels Temperature (° C) pH % NaCl (wt/vol) % glucose (wt/vol)
The data were statistically analysed using Statistica 8.0 (StatSoft, Tulsa, Oklahoma, USA).
3.3 RESULTS AND DISCUSSION
Environmental factors including temperature, salt, pH and nutrients, which are common in foods
and food-processing environments can have a big impact on microbial adhesion to surfaces and biofilm
formation. These environmental factors, e.g. temperature, can exist in a wide range of food plants, so it
could be very useful to obtain information about the behaviour of microorganisms in food plants with very
different environmental conditions, for example in cooling areas as opposed to sites near thermal treatment
plants, or sites near brines as opposed to areas with a very low presence of NaCl. For these reasons, the
effect of pH, temperature, % glucose and % NaCl on biofilm formation by well-known food pathogens and
food spoilers was investigated. For each microbial species, a different range of the tested variables was
chosen, based on considerations linked to the physiological features of microorganisms and to their poten-
tial development in specific sites of the food plants.
In a preliminary phase, L. monocytogenes, S. aureus and Pseudomonas spp. strains were classified
according to their ability to form biofilm (Table 3.2).
Chapter 3. Biofilm Formation of Food Pathogens and Spoilers as affected by Temperature, pH, Glucose and Sodium Chloride
47
Table 3.2 Biofilm-forming ability of L. monocytogenes (Lm), S. aureus (St) and Pseudomonas spp. (Ps) strains. Biofilm-forming ability: +, weak; ++, moderate; +++, strong
Strain Biofilm-forming ability
Lm_1 +++
Lm_4 +++
Lm_278 +++
Lm_287 +++
Lm_288 +++
Lm_SB +++
Lm_6E +++
Lm_Scott A +++
St_037 +++
St_059 +++
St_117 +
St_132 ++
St_137 +++
St_174 ++
St_231 ++
St_DSMZ 20231 ++
Ps_019 +++
Ps_053 ++
Ps_071 +
All the strains tested were able in forming biofilm on plastic surfaces, though at different levels.
For example, all L. monocytogenes showed to be strong biofilm-producers, while within S. aureus and
Pseudomonas spp. moderate and weak biofilm producers were present, as well. These results, obtained
under optimal cultural conditions, confirm previous findings, which showed that L. monocytogenes, S. au-
reus and Pseudomonas spp. are able to form biofilm on plastic surfaces (Stepanović et al., 2000; Djordjevic
et al., 2002; Simões et al., 2003). Polystyrene, the material used to produce microtiter plates, is a hydro-
phobic material, and it has been shown that most microorganisms adhere in high numbers to more hydro-
phobic materials (Donlan, 2002). The microtiter plate assay is widely used to screen the biofilm forming
ability of microbial strains. It has to be underlined that, if some environmental parameter is modified, for
example temperature or incubation time, it is possible to obtain different results. This is the case of strain
Lm_ScottA, which resulted a strong biofilm former, while under different conditions previously used it
resulted a moderate former (see Figure 2.4).
The experimental plan used to study the combined effects of environmental and nutritional param-
eters on the biofilm formation was a CCD, which could completely describe the influence of these factors
and their interactions on the ability to produce biofilm by L. monocytogenes, S. aureus and Pseudomonas
spp. The advantage of using a CCD is to obtain the highest amount of information while limiting the number
of experiments to be carried out. The CCD can describe the whole influence of the applied conditions and
their interactions on the ability to produce biofilm by the tested microorganisms. It has to be noted that only
little information is available in the literature about the synergistic effects of the environmental parameters
on biofilm formation regarding the food area. In fact, most authors tested only two or three combined var-
iables for a limited number of strains (Rode et al., 2007; Nilsson et al., 2011).
Chapter 3. Biofilm Formation of Food Pathogens and Spoilers as affected by Temperature, pH, Glucose and Sodium Chloride
48
The results obtained were statistically treated in order to identify the most significant factor that
affects biofilm formation in polystyrene plates. For each species the Pareto charts and 3-D response surface
plots are reported. Pareto charts report the statistical significance and the size (expressed as standardized
effect estimate) of each factor on the dependent variable considered (OD570 or Log CFU/cm2). The size of
the standardized effect estimate is a measure of the factor influence intensity, while the positive or negative
sign indicates whether the dependent variable is positively or negatively affected by the factor. The 3-D
surfaces illustrate the effects of two factors on the variable; a constant value is set for the 3rd and the 4th
factor.
3.3.1 Staphylococcus aureus
S. aureus is an opportunistic human pathogen that can cause a foodborne intoxication reported as
one of the most common bacterial foodborne diseases in several countries (Balaban and Rasooly, 2000).
This microbial pathogen is very adaptable and can live in a wide variety of environments, including food
plant surfaces, thanks to its ability to adhere on surfaces and to form biofilm. This may contribute to the
persistence of S. aureus in the food processing environments, consequently increasing cross contamination
risks. Indeed, it is quite commonly isolated from surfaces (Marino et al., 2011).
The data obtained showed that temperature strongly influenced (p<0.05) the formation of biofilm
by all strains (Figure 3.1 to Figure 3.8). It should be noted that a commonly used temperature in biofilm
experiments with S. aureus is 37 °C, its optimum temperature of growth. However, in the food production
environment, temperatures below 37 °C are relevant: this is why in this study different temperatures ranging
from 17 to 37 °C were tested. Within this range, the highest amounts of biofilm formed were observed at
the highest temperatures, regardless of biofilm forming ability. This observation is opposite from those
made by other authors. In particular, Rode et al. (2007) and Pagedar et al. (2010) evidenced that biofilm
production is highest at suboptimal growth conditions. However, recently it has been reported that, within
a collection of twenty-eight strains isolated from seafood, most of the strains had a higher biofilm produc-
tion at 37 °C than at 25 °C (Vázquez-Sánchez et al. 2014). This disparity might be attributed to different
experimental setups, strain specific behaviour and other factors like enhanced biofilm/EPS production and
altered cell surface hydrophobicity, which has been observed for other pathogens under stressful conditions
(Costerton et al., 1995). In any case, despite the temperatures used to prolong the shelf-life of foods are
considerably lower than those tested in our study, it has to be highlighted that in food processing plants
there are areas where temperatures can be much higher, considering geographical and seasonal variations,
as well.
S. aureus is a poor competitor in foods and presents the lowest risk in fermented foods, where safety
is assured by low pH values granted by lactic acid bacteria metabolism. In fact, survival times generally
increased with increased pH (Whiting et al., 1996). Unexpectedly, as far as biofilm formation is concerned,
the effect of pH levels of the growth medium has received only little attention. The only data available
reported the influence of both acidic and alkaline pH on biofilm formation by clinical strains (Zmantar et
Chapter 3. Biofilm Formation of Food Pathogens and Spoilers as affected by Temperature, pH, Glucose and Sodium Chloride
49
al., 2001). The data obtained in this study showed that biofilm formation seems to be inhibited by lowering
the pH in the range from pH 7.0 to pH 5.0. This factor was significant (p<0.05) for four out of eight strains.
Interestingly, for strains St_037 (Figure 3.1) and St_137 (Figure 3.5) an interactive effect between temper-
ature and pH was observed. In particular, for strain St_037 at 37 °C the biofilm formation was highest at
pH 7, whereas at 17 °C the biofilm formation appeared stimulated by the lowest pH tested. A similar be-
haviour was observed by Rode et al. (2007). Strain St_137, instead, at the highest temperatures produced
more biofilm at pH 7, whilst at 17 °C the biofilm formation appeared stimulated at intermediate pH levels
(i.e. pH 6.0).
Chapter 3. Biofilm Formation of Food Pathogens and Spoilers as affected by Temperature, pH, Glucose and Sodium Chloride
50
Figure 3.1 Pareto charts and 3D-plots of the effect of the interaction of environmental parameters on biofilm formation by S. au-
reus St_037 strain
Chapter 3. Biofilm Formation of Food Pathogens and Spoilers as affected by Temperature, pH, Glucose and Sodium Chloride
51
Figure 3.2 Pareto charts and 3D-plots of the effect of the interaction of environmental parameters on biofilm formation by S. au-
reus St_059 strain
Chapter 3. Biofilm Formation of Food Pathogens and Spoilers as affected by Temperature, pH, Glucose and Sodium Chloride
52
Figure 3.3 Pareto charts and 3D-plots of the effect of the interaction of environmental parameters on biofilm formation by S. au-
reus St_117 strain
Chapter 3. Biofilm Formation of Food Pathogens and Spoilers as affected by Temperature, pH, Glucose and Sodium Chloride
53
Figure 3.4 Pareto charts and 3D-plots of the effect of the interaction of environmental parameters on biofilm formation by S. au-
reus St_132 strain
Chapter 3. Biofilm Formation of Food Pathogens and Spoilers as affected by Temperature, pH, Glucose and Sodium Chloride
54
Figure 3.5 Pareto charts and 3D-plots of the effect of the interaction of environmental parameters on biofilm formation by S. au-
reus St_137 strain
Chapter 3. Biofilm Formation of Food Pathogens and Spoilers as affected by Temperature, pH, Glucose and Sodium Chloride
55
Figure 3.6 Pareto charts and 3D-plots of the effect of the interaction of environmental parameters on biofilm formation by S. au-
reus St_174 strain
Chapter 3. Biofilm Formation of Food Pathogens and Spoilers as affected by Temperature, pH, Glucose and Sodium Chloride
56
Figure 3.7 Pareto charts and 3D-plots of the effect of the interaction of environmental parameters on biofilm formation by S. au-
reus St_231 strain
Chapter 3. Biofilm Formation of Food Pathogens and Spoilers as affected by Temperature, pH, Glucose and Sodium Chloride
57
Figure 3.8 Pareto charts and 3D-plots of the effect of the interaction of environmental parameters on biofilm formation by S. au-
reus St_DSMZ 20231 strain
In the experimental model used in this study, glucose (0.25-4.25%) and NaCl (0.5-4.5%) concen-
tration did not significantly influence the biofilm formation by S. aureus, either considered separately or in
combination. As regards glucose, the highest attachment rates were observed at high sugar levels, even if
the OD570 values remain quite low. Rode et al. (2007) found that adding 5% of glucose to TSB caused a
Chapter 3. Biofilm Formation of Food Pathogens and Spoilers as affected by Temperature, pH, Glucose and Sodium Chloride
58
more dense biofilm to be produced, and the combination of glucose and NaCl enhanced much more the
attachment rate. A similar observation was made by Vázquez-Sánchez et al. (2013), probably due to the
sugar requirement during the EPS components production. S. aureus is highly salt tolerant and has been
reported to grow in NaCl concentrations up to 25% (Stewart et al., 2002). In our study S. aureus was dif-
ferently affected by NaCl concentrations, i.e. some strains produced the highest biofilm levels at low con-
centrations, whereas others did so at the highest. Different authors showed that NaCl could promote bacte-
rial aggregation, and enhance the stability of biofilm on polystyrene (Rode et al., 2007; Møretrø et al.,
2003). For some strains the effect of salt on biofilm formation was markedly affected by incubation tem-
peratures. Thus, a positive correlation between biofilm formation and salt concentration was observed at
37 °C, while at 17 °C strains appeared stimulated by the lowest concentrations. The presence of high con-
centrations of NaCl is relevant in food industry, for example in the case of brines used in cheesemaking
practices, so investigating the effect of this factor could be considered valuable.
3.3.2 Pseudomonas spp.
Pseudomonas spp. are ubiquitously present in nature, they are easily spread through food produc-
tion systems, and contamination with this microbial genus is almost inevitable. The genus Pseudomonas is
of great concern in the food industry, because it produces proteases, lipases, pectinases as well as pigments
and slimes, which can result in food spoilage, mostly in refrigerated foods (Rajmohan et al., 2002). Mem-
bers of the genus Pseudomonas have frequently been reported to produce exopolymers, and they have the
ability to attach rapidly to surfaces in the food industry, where they are frequently found (Leriche et al.,
2004). Within the Pseudomonas genus, P. aeruginosa is known for its ability to form biofilms on abiotic
surfaces (Giltner et al., 2006), but little is known about the biofilm-forming capacity of Pseudomonas spp.
isolated from food environments. Moreover, there are only few reports about the effect of environmental
factors on biofilm formation by Pseudomonas spp. and in particular about the interaction between the en-
vironmental stresses on biofilm production.
Pseudomonas strains tested in this study belonged to different species (P. fluorescens, P. fragi and
P. putida), and they were differently affected by the environmental factors (Figure 3.9 to Figure 3.11).
Chapter 3. Biofilm Formation of Food Pathogens and Spoilers as affected by Temperature, pH, Glucose and Sodium Chloride
59
Figure 3.9 Pareto charts and 3D-plots of the effect of the interaction of environmental parameters on biofilm formation by P. flu-
orescens Ps_019
Chapter 3. Biofilm Formation of Food Pathogens and Spoilers as affected by Temperature, pH, Glucose and Sodium Chloride
60
Figure 3.10 Pareto charts and 3D-plots of the effect of the interaction of environmental parameters on biofilm formation by P.
fragi Ps_053
Chapter 3. Biofilm Formation of Food Pathogens and Spoilers as affected by Temperature, pH, Glucose and Sodium Chloride
61
Figure 3.11 Pareto charts and 3D-plots of the effect of the interaction of environmental parameters on biofilm formation by P.
putida Ps_071
P. fluorescens Ps_019 produced high amounts of biofilm in the entire range of T, pH and NaCl %
tested (Figure 3.9), so its behaviour was not affected by those environmental factors. This microbial species
is isolated quite frequently from diverse food products, such as vegetables, fish, meat and dairy products,
and this behaviour could be regarded as a high metabolic flexibility. Indeed, essentially any habitat with a
Chapter 3. Biofilm Formation of Food Pathogens and Spoilers as affected by Temperature, pH, Glucose and Sodium Chloride
62
temperature range of 4-42°C, a pH between 4 and 8 and containing simple or complex organic compounds
is a potential habitat for P. fluorescens (Gennari and Dragotto, 1992; Arslan et al., 2011). This adaptability,
observed in this study also for the sessile state, might be one reason for the ubiquitous character of this
species in the food field. Interestingly, enhancing the glucose concentration in the tested range (0-4%)
resulted in an inhibition of surface colonization. From a hygienic point of view, it could be hypothesized
that such a strain could efficiently colonize food contact surfaces free of soil after the application of a
routine sanitation program. To our knowledge, this is the first report on the effect of glucose concentration
on the biofilm formation by P. fluorescens. The ability to form a more dense biofilm in deprived conditions
of glucose can be due to a bacterial survival strategy in nutritionally limited environments. For other Pseu-
domonadaceae, i.e. P. aeruginosa and P. putida, it is reported that glucose could function as a promoter
rather than a repressor of biofilm formation (Huang et al., 2009). A repressing effect of glucose on biofilm
formation by inhibiting the expression of a gene that is involved in surface colonization was only reported
for Bacillus subtilis (Stanley et al., 2003). P. fluorescens strain Ps_019, which was isolated from raw milk,
formed high amounts of biofilm both at low (8 °C) and high temperatures (20 °C): this behaviour might
contribute to its persistence in food plants, such as dairy-processing environments, where temperatures can
be 10 °C or less (e.g. brining and ripening areas), or more than 15 °C (cheesemaking area).
P. fragi Ps_053 was a less efficient surface-colonizer than P. fluorescens Ps_019 (Figure 3.10), and
its biofilm formation was affected by temperature, glucose and NaCl concentrations. The highest biofilm
production was limited to a narrow temperature range, between 18 °C and 20 °C, therefore this strain could
be considered less hazardous for cooling areas of the food plants. As P. fluorescens Ps_019, P. fragi Ps_053
showed enhanced biofilm formation at a low glucose concentration, and it was inhibited by high salt
amounts. A quite similar behaviour regarding the effect of temperature was observed for P. putida Ps_071,
which showed a high biofilm-forming ability at temperatures above 18 °C (Figure 3.11). However, this
strain resulted less affected by NaCl concentrations up to 2.5%, regardless of the pH value. A synergistic
effect (p<0.05) of pH and glucose concentration was also observed for P. putida Ps_071, which produced
the highest amounts of biofilm in the intermediate values of both factors, and the lowest at the extreme
values.
Usually acidic pH resulted in strong inhibition of Pseudomonadaceae, such as in fermented foods
(Carraro et al., 2011). However, according to the results of this study the sessile growth seemed to be quite
unaffected by pH solely. This behaviour is suggestive for an indication of the potential risk related to the
ability to colonize surfaces in a rather indiscriminate way, regardless of environmental conditions, and it
could be linked to a protective effect of the high amounts of EPS produced by this microbial group. The
ability to form biofilm on the surfaces of the food industry by Pseudomonas spp. is considered a potential
risk of cross-contamination, which can cause the spoilage of food products. Furthermore, it has been shown
that many psychrophilic microorganisms including P. putida, P. fragi, P. fluorescens and Flavobacterium
can enhance the adhesion, colonization and the formation of biofilms by L. monocytogenes, by protecting
the pathogen from desiccation (Daneshvar Alavi and Truelstrup Hansen, 2013).
Chapter 3. Biofilm Formation of Food Pathogens and Spoilers as affected by Temperature, pH, Glucose and Sodium Chloride
63
3.3.3 Listeria monocytogenes
L. monocytogenes is a foodborne pathogen of particular concern to the food processing industry
because of its ability to grow at refrigeration temperatures and its tolerance to environmental stresses, such
as acidic pH and high salt concentration. In almost all cases of contaminated food, this pathogen can be
isolated from the environment of the food plants from which the products originated, in particular in drains,
floors and food-contact surfaces, wet and refrigerated food processing plants (Cox et al., 1989). This is
explained by its ability to adhere to surfaces and to form biofilms that become less susceptible to cleaning
procedures (Cloete, 2003). The biofilm eventually constitutes a reservoir of dissemination and cross-con-
tamination in foods. It is hypothesized that environmental factors such as pH, water activity, temperature
and nutrient composition of the food soil can be important for the phenotypic transition of planktonic cells
to sessile form and for the consequent initial attachment to a surface. Therefore it is important to identify
factors that influence the colonization of surfaces, in order to better understand the implication of biofilm
formation to food safety.
As can be seen from the Pareto charts, in the range from 4 °C to 16 °C the temperature was the
parameter that significantly affected the quantity of biofilm (p<0.05) in all the strains. In fact the standard-
ized effects estimated were the highest for all the strains (Figure 3.12 to Figure 3.19 and Figure 3.27). In
particular, increasing the temperature resulted in higher Log CFU/cm2 and OD570 values, which is a measure
of the total biomass (cells and EPS matrix) adhered to the plastic surface. It has been demonstrated that L.
monocytogenes is flagellated and motile at temperatures below 30 °C, and generally non-flagellated and
non-motile at temperatures above 30 °C. At low temperatures flagella production by L. monocytogenes may
increase and it could be correlated to its adhesion ability to surfaces (Tresse et al., 2009). Moreover, biofilm
formation is significantly influenced by temperature, probably modifying cell surface hydrophobicity (Di
Bonaventura et al., 2008).
Chapter 3. Biofilm Formation of Food Pathogens and Spoilers as affected by Temperature, pH, Glucose and Sodium Chloride
64
Figure 3.12 Pareto charts and 3D-plots of the effect of the interaction of environmental parameters on biofilm formation (OD570 by L. monocytogenes Lm_1 strain
Chapter 3. Biofilm Formation of Food Pathogens and Spoilers as affected by Temperature, pH, Glucose and Sodium Chloride
65
Figure 3.13 Pareto charts and 3D-plots of the effect of the interaction of environmental parameters on biofilm formation (OD570 by L. monocytogenes Lm_4 strain
Chapter 3. Biofilm Formation of Food Pathogens and Spoilers as affected by Temperature, pH, Glucose and Sodium Chloride
66
Figure 3.14 Pareto charts and 3D-plots of the effect of the interaction of environmental parameters on biofilm formation (OD570 by L. monocytogenes Lm_6E strain
Chapter 3. Biofilm Formation of Food Pathogens and Spoilers as affected by Temperature, pH, Glucose and Sodium Chloride
67
Figure 3.15 Pareto charts and 3D-plots of the effect of the interaction of environmental parameters on biofilm formation (OD570 by L. monocytogenes Lm_278 strain
Chapter 3. Biofilm Formation of Food Pathogens and Spoilers as affected by Temperature, pH, Glucose and Sodium Chloride
68
Figure 3.16 Pareto charts and 3D-plots of the effect of the interaction of environmental parameters on biofilm formation (OD570 by L. monocytogenes Lm_287 strain
Chapter 3. Biofilm Formation of Food Pathogens and Spoilers as affected by Temperature, pH, Glucose and Sodium Chloride
69
Figure 3.17 Pareto charts and 3D-plots of the effect of the interaction of environmental parameters on biofilm formation (OD570 by L. monocytogenes Lm_288 strain
Chapter 3. Biofilm Formation of Food Pathogens and Spoilers as affected by Temperature, pH, Glucose and Sodium Chloride
70
Figure 3.18 Pareto charts and 3D-plots of the effect of the interaction of environmental parameters on biofilm formation (OD570 by L. monocytogenes Lm_SB strain
Chapter 3. Biofilm Formation of Food Pathogens and Spoilers as affected by Temperature, pH, Glucose and Sodium Chloride
71
Figure 3.19 Pareto charts and 3D-plots of the effect of the interaction of environmental parameters on biofilm formation (OD570 by L. monocytogenes Lm_Scott A strain
For all L. monocytogenes strains the lowest values of OD570 were evidenced at 4 °C, which is the
most commonly used refrigeration temperature. However, even if at 16 °C the highest biofilm formation
was observed for all strains, substantial adherence of L. monocytogenes still occurred at 4 °C. This obser-
vation was supported also by viable counts (Figure 3.20 to Figure 3.27).
Chapter 3. Biofilm Formation of Food Pathogens and Spoilers as affected by Temperature, pH, Glucose and Sodium Chloride
72
Figure 3.20 Pareto charts and 3D-plots of the effect of the interaction of environmental parameters on biofilm viable cells (Log CFU/cm2) of L. monocytogenes Lm_1 strain
Chapter 3. Biofilm Formation of Food Pathogens and Spoilers as affected by Temperature, pH, Glucose and Sodium Chloride
73
Figure 3.21 Pareto charts and 3D-plots of the effect of the interaction of environmental parameters on biofilm viable cells (Log CFU/cm2) of L. monocytogenes Lm_4 strain
Chapter 3. Biofilm Formation of Food Pathogens and Spoilers as affected by Temperature, pH, Glucose and Sodium Chloride
74
Figure 3.22 Pareto charts and 3D-plots of the effect of the interaction of environmental parameters on biofilm viable cells (Log CFU/cm2) of L. monocytogenes Lm_6E strain
Chapter 3. Biofilm Formation of Food Pathogens and Spoilers as affected by Temperature, pH, Glucose and Sodium Chloride
75
Figure 3.23 Pareto charts and 3D-plots of the effect of the interaction of environmental parameters on biofilm viable cells (Log CFU/cm2) of L. monocytogenes Lm_278 strain
Chapter 3. Biofilm Formation of Food Pathogens and Spoilers as affected by Temperature, pH, Glucose and Sodium Chloride
76
Figure 3.24 Pareto charts and 3D-plots of the effect of the interaction of environmental parameters on biofilm viable cells (Log CFU/cm2) of L. monocytogenes Lm_287 strain
Chapter 3. Biofilm Formation of Food Pathogens and Spoilers as affected by Temperature, pH, Glucose and Sodium Chloride
77
Figure 3.25 Pareto charts and 3D-plots of the effect of the interaction of environmental parameters on biofilm viable cells (Log CFU/cm2) of L. monocytogenes Lm_288 strain
Chapter 3. Biofilm Formation of Food Pathogens and Spoilers as affected by Temperature, pH, Glucose and Sodium Chloride
78
Figure 3.26 Pareto charts and 3D-plots of the effect of the interaction of environmental parameters on biofilm viable cells (Log CFU/cm2) of L. monocytogenes Lm_SB strain
Chapter 3. Biofilm Formation of Food Pathogens and Spoilers as affected by Temperature, pH, Glucose and Sodium Chloride
79
Figure 3.27 Pareto charts and 3D-plots of the effect of the interaction of environmental parameters on biofilm viable cells (Log CFU/cm2) of L. monocytogenes Lm_Scott A strain
In fact, the mean value of cell counts of biofilms grown at 4 °C, regardless of the other parameters
tested, was 6.02 Log CFU/cm2, which is a quite high level. Indeed, the biofilms formed on microtiter plates
are expected to be more dense than those formed on materials widely used in the food industry (e.g. stainless
steel), because the material used for attachment assays is treated so as to maximize the microbial adherence.
Chapter 3. Biofilm Formation of Food Pathogens and Spoilers as affected by Temperature, pH, Glucose and Sodium Chloride
80
Despite the lower adherence rates expected onto a real surface, the cell count in microbial biofilms formed
at low temperatures can be a great hygienic issue, considering the clinical importance of L. monocytogenes
as a foodborne pathogen. In fact, low temperatures tested in this study are comparable to those found in the
cooling areas of many food-processing plants, and refrigeration is one of the most common ways to increase
the shelf-life of foods. Therefore, biofilm produced by L. monocytogenes strains at refrigeration tempera-
tures must be taken into account, because it may be the rationale for the persistence of L. monocytogenes
in the food industries.
The presence of NaCl solely was significantly relevant (p<0.05) only for selected L. monocytogenes
strains. In particular, six out of eight strains were negatively influenced by the presence of NaCl in terms
of viable counts, even though the mean count at the highest values of salt was 5.74 Log CFU/cm2. In fact,
increasing salt presence resulted in a lower number of adhered cells, even though it is well known that L.
monocytogenes can survive and grow over a wide range of environmental conditions such as high salt
concentrations (Gandhi and Chikindas, 2007). The formation of biofilms in L. monocytogenes could be
stimulated in a medium supplemented with up to 5% of salt, which is in agreement with the findings from
previous studies (Pan et al., 2010; Caly et al., 2009). As regards OD570 values, the presence of NaCl was
statistically significant in a lower number of strains (three out of eight), which formed a less dense biomass
with increased NaCl concentrations. This is not surprising given that OD570 evaluates both viable cells and
EPS matrix, while the data obtained from DP method only quantify viable cells within the biofilm. It is
therefore conceivable that the expression of genes coding for EPS production is affected by salt concentra-
tion in a different manner as compared to cell replication within a biofilm. Another possible explanation of
decreasing biofilm formation is the repression of flagella expression at high salt concentrations, thus de-
creasing the adhesion capability of L. monocytogenes (Caly et al., 2009). An interesting observation made
within the study was that in six out of eight strains tested, a synergistic effect (p<0.05) of salt with another
factor (pH, temperature and glucose) was observed. These synergistic effects were observed only in the
case of OD570 values, and not for viable biofilm counts. It is therefore conceivable that L. monocytogenes
responses to environmental stresses mainly by modulating the production of biofilm matrix than replicating
itself, which can allow the persistence of the pathogen in the food processing lines.
OD570 values of L. monocytogenes were not affected by pH solely, whereas the opposite occurred
in viable cells for only two strains (Lm_1 and Lm_4, Figure 3.20 and Figure 3.21, respectively). In the
temperature range considered, L. monocytogenes produced approximately the same amount of biomass ir-
respective of the pH values in a range between pH 6.25 and pH 4.25. Similar observations were made by
Smoot and Pierson (1998), who evidenced that maximum levels of attached L. monocytogenes obtained on
Buna-N rubber after a 120-min exposure period were not affected by altering the pH within a range of 4 to
9. However, when cells were exposed to the test surfaces under alkaline conditions, lower numbers of
attached cells were observed when compared to neutral or acidic conditions. It is known that L. monocyto-
genes is a quite adaptable microorganism to stressful environmental conditions, able to overcome growth
obstacles also by transitioning from the planktonic to sessile form. It has been shown that exposing cells to
Chapter 3. Biofilm Formation of Food Pathogens and Spoilers as affected by Temperature, pH, Glucose and Sodium Chloride
81
sublethal levels of environmental stress, such as pH and temperature, can affect the ability of this pathogen
to attach to common food contact surfaces (Smoot and Pierson, 1998). The mechanisms related to the acidic
stress resistance and to the biofilm formation at low pH in L. monocytogenes could be related to variations
in the surface protein composition, as well as the downregulation of the flagellin synthesis under the acidic
conditions (Tresse et al., 2006). Moreover, stressful environmental conditions can activate the expression
of a general stress response in L. monocytogenes controlled by σB, an alternative sigma factor, which pro-
vides the organism with multiple, non-specific resistance to stress and thereby promotes growth and sur-
vival in adverse conditions (Wemekamp-Kamphuis et al., 2004).
Increasing glucose concentration resulted in a decrease of OD570 values for all tested strains, even
if this parameter proved to not statistically significant. In fact, the highest OD570 values were observed at
the lowest glucose concentrations. Regarding the effect of nutrients on L. monocytogenes biofilm formation,
conflicting results have been reported. For example, Pan et al. (2010) showed that the addition of glucose
stimulated bacterial cells to produce more EPS matrix material. On the contrary, Kim and Frank (1995)
evidenced that glucose levels did not affect biofilm development. These results suggest that the mechanisms
involved in the stimulation of biofilm formation by glucose for L. monocytogenes may be strain-specific.
Regarding the biofilm viable cell counts, the glucose concentration was statistically significant (p<0.05)
for two out of eight strains, and interestingly the viable counts of all strains were positively affected by
glucose, i.e. increasing nutrient concentration resulted in higher viable counts. It could be hypothesized that
the presence of high concentrations of nutrients promotes cell replication, while limited concentrations of
glucose would create stress for the microorganism and therefore favour the production of EPS, which has
the function to protect the biofilm cells.
The results obtained regarding L. monocytogenes clearly show that this pathogen is able to adapt
and form biofilm in a wide range of conditions including low temperatures, low pH, high salt concentrations
and low nutrient concentrations, although the mechanisms involved in surfaces colonization in stressful
conditions may depend on strain considered. The ability of L. monocytogenes to colonize surfaces in the
presence of the stressful conditions used in the food industry during processing and storing, may contribute
to the persistence of L. monocytogenes in the food processing lines and increase the probability of cross-
contamination with the consequent hazard for the consumer health.
3.4 CONCLUSIONS
The results of the present study showed that environmental stresses differently influenced the bio-
film formation by L. monocytogenes, S. aureus and Pseudomonas spp. strains. The increase in biofilm
production in stressful environments represents a form of survival response, and has largely been attributed
to stress-induced physiological adjustment in the cells resulting in an increased ability of the organism to
attach to surfaces. The use of a CCD allowed to mimic the real environmental conditions of a food envi-
ronment and to obtain the greatest amount of information while limiting the number of experiments to be
carried out. Therefore, useful data were obtained, increasing information available in the literature about
Chapter 3. Biofilm Formation of Food Pathogens and Spoilers as affected by Temperature, pH, Glucose and Sodium Chloride
82
the synergistic effects of environmental parameters on biofilm formation regarding the food sector. In fact,
both for L. monocytogenes and S. aureus, which are food pathogens, there is a need for more information
about them; for Pseudomonas spp., which are food spoilage bacteria, there are only few studies in literature.
Even if all the tested strains were able to produce biofilms in a wide range of the environmental
factors, this study pointed out a high variability among the bacterial species and mainly among the strains
belonging to the same species. The different behaviour within the same species subjected to several envi-
ronmental conditions highlighted that biofilms are dynamic structural entities in which detachment, growth
and microcolonies formation take place. This dynamic may be at the origin of dissemination of microor-
ganisms and contamination of surfaces in food industries. In fact, the finding that microbial adhesion and
biofilm formation may be promoted by environmental conditions present in the food industry indicates that
food producers should be aware of the importance of controlling biofilm formation by Pseudomonas spp.,
L. monocytogenes and S. aureus, which are important bacteria causing respectively food spoilage and food
poisoning after their consumption. Moreover, such results could provide valuable insights into the attach-
ment mechanisms and, perhaps, could lead to better methods of biofilm control in food plants.
3.5 REFERENCES
Arslan, S., Eyi, A., Özdemir, F., 2011. Spoilage potentials and antimicrobial resistance of Pseudomonas spp. isolated from cheeses. J Dairy Sci 94, 5851-5856
Balaban, N., Rasooly, A. 2000. Staphylococcal enterotoxins. Int J Food Microbiol 61, 1-10
Caly, D., Takilt, D., Lebret, V., Tresse, O. 2009. Sodium chloride affects Listeria monocytogenes adhesion to polystyrene and stainless steel by regulating flagella expression. Lett Appl Microbiol 49, 751-756
Carraro, L., Maifreni, M., Bartolomeoli, I., Martino, M. E., Novelli, E., Frigo, F., Marino, M., Cardazzo, B. 2011. Comparison of culture-dependent and-independent methods for bacterial community monitoring during Montasio cheese manufacturing. Res Mi-crobiol 162, 231-239
Chmielewski, R.A.N., Frank, J. F. 2003. Biofilm formation and control in food processing facilities. Compr Rev Food Sci Food Safety 2, 22-32
Cloete, T.E. 2003. Resistance mechanisms of bacteria to antimicrobial compounds. Int Biodeter Biodegr 51, 277-282
Cox, L.J., Kleiss, T., Cordier, J.L., Cordellana, C., Konkel, P., Pedrazzini, C., Beumer, R., Siebenga, A. 1989. Listeria spp. in food processing, non-food and domestic environments. Food Microbiol 6, 49-61
Daneshvar Alavi, H. E., Truelstrup Hansen, L. 2013. Kinetics of biofilm formation and desiccation survival of Listeria monocyto-
genes in single and dual species biofilms with Pseudomonas fluorescens, Serratia proteamaculans or Shewanella baltica on food-grade stainless steel surfaces. Biofouling, 29, 1253-1268
Di Bonaventura, G., Piccolomini, R., Paludi, D., D’orio, V., Vergara, A., Conter, M., Ianieri, A. 2008. Influence of temperature on biofilm formation by Listeria monocytogenes on various food‐contact surfaces: relationship with motility and cell surface hydro-phobicity. J Appl Microbiol 104, 1552-1561
Djordjevic, D., Wiedmann, M., McLandsborough, L.A. 2002. Microtiter plate assay for assessment of Listeria monocytogenes biofilm formation. Appl Environ Microbiol 68, 2950-2958
Donlan, R.M. 2002. Biofilms: microbial life on surfaces. Emerg Infect Dis 8, 881-890
Gandhi, M., Chikindas, M.L. 2007. Listeria: a foodborne pathogen that knows how to survive. Int J Food Microbiol 113, 1-15
Gennari, M., Dragotto, F., 1992. A study of the incidence of different fluorescent Pseudomonas species and biovars in the micro-flora of fresh and spoiled meat and fish, raw milk, cheese, soil and water. J Appl Microbiol 72, 281-288
Giltner, C.L., van Schaik, E.J., Audette, G.F., Kao, D., Hofges, R.S., Hassett, D.G., Irvin, R.T. 2006. The Pseudomonas aeruginosa type IV pilin receptor binding domain functions as an adhesin for both biotic and abiotic surfaces. Molec Microbiol 59, 1083-1096
Chapter 3. Biofilm Formation of Food Pathogens and Spoilers as affected by Temperature, pH, Glucose and Sodium Chloride
83
Hamanaka, D., Onishi, M., Genkawa, T., Tanaka, F., Uchino, T. 2012. Effects of temperature and nutrient concentration on the structural characteristics and removal of vegetable-associated Pseudomonas biofilm. Food Control 24, 165-170
Huang, C.Y., Hsieh, S.P., Kuo, P.A., Jane, W.N., Tu, J., Wang, Y.N., Ko, C.H. 2009. Impact of disinfectant and nutrient concen-tration on growth and biofilm formation for a Pseudomonas strain and the mixed cultures from a fine papermachine system. Int Biodeter Biodegr 63, 998-1007
Kim, K.Y., Frank, J.F. 1995. Effect of nutrients on biofilm formation by Listeria monocytogenes on stainless steel. J Food Protect 58, 24-28
Kirov, S.M., Jacobs, I., Hayward, L.J., Hapin, R.H. 1994. Electron microscopic examination of factors influencing the expression of filamentous surface structures on clinical and environmental isolates of Aeromonas veronii Biotype sobria. Microbiol Immunol 39, 329-338
Leriche, F., Bordessoules, A., Fayolle, K., Karoui, R., Laval, K., Leblanc, L., Dufour, E. 2004. Alteration of raw-milk cheese by Pseudomonas spp.: monitoring the sources of contamination using fluorescence spectroscopy and metabolic profiling. J Microbiol Met 59, 33-41
Marino, M., Frigo, F., Bartolomeoli, I., Maifreni, M. 2011. Safety‐related properties of staphylococci isolated from food and food environments. J Appl Microbiol 110, 550-561
Møretrø T., Hermansen L., Holck A.L., Sidhu M.S., Rudi K., Langsrud S. 2003 Biofilm formation and the presence of the inter-cellular adhesion locus ica among staphylococci from food and food-processing environments. Appl Environ Microbiol 69, 5648–5655
Nilsson, R.E., Ross, T., Bowman, J.P. 2011. Variability in biofilm production by Listeria monocytogenes correlated to strain origin and growth conditions. Int J Food Microbiol 150, 14-24
Pagedar, A., Singh, J., Batish, V.K. 2010. Surface hydrophobicity, nutritional contents affect Staphylococcus aureus biofilms and temperature influences its survival in preformed biofilms. J Basic Microbiol 50, S98-S106
Pan, Y., Breidt, F., Gorski, L. 2010. Synergistic effects of sodium chloride, glucose, and temperature on biofilm formation by Listeria monocytogenes serotype 1/2a and 4b strains. App Environ Microbiol 76, 1433-1441
Rajmohan, S., Dodd, C.E.R., Waites, W.M. 2002. Enzymes from isolates of Pseudomonas fluorescens involved in food spoilage. J Appl Microbiol 93, 205-213
Rode, T. M., Langsrud, S., Holck, A., Møretrø, T. 2007. Different patterns of biofilm formation in Staphylococcus aureus under food-related stress conditions. Int J Food Microbiol 116, 372-383
Römling, U., Sierralta, W.D., Eriksson, K., Normark, S. 1998. Multicellular and aggregative behaviour of Salmonella typhimurium strains is controlled by mutations in the agfD promoter. Mol Microbiol 28, 249-264
Simões, M., Pereira, M.O., Vieira, M.J. 2003. Monitoring the effects of biocide treatment of Pseudomonas fluorescens biofilms formed under different flow regimes. Water Sci Technol 47, 217-223
Smoot, L.M., Pierson, M.D. 1998. Effect of environmental stress on the ability of Listeria monocytogenes Scott A to attach to food contact surfaces. J Food Protect 61, 1293-1298
Stanley, N.R., Britton, R.A., Grossman, A.D., Lazazzera, B.A. 2003. Identification of catabolite repression as a physiological regulator of biofilm formation by Bacillus subtilis by use of DNA microarrays. J Bacteriol 185, 1951-1957
Stepanović, S., Vuković, D., Dakić, I., Savić, B., Švabić-Vlahović, M. 2000. A modified microtiter-plate test for quantification of staphylococcal biofilm formation. J Microbiol Meth 40, 175-179
Stewart, C.M., Cole, M.B., Legan, J.D., Slade, L., Vandeven, M.H., Schaffner, D.W. 2002. Staphylococcus aureus growth bound-aries: moving towards mechanistic predictive models based on solute-specific effects. Appl Environ Microbiol 68, 1864-1871
Szabo, E., Skedsmo, A., Sonnevend, A., Al-Dhaheri, K., Emödy, L., Usmani, A., Pál, T. 2005. Curli expression of enterotoxigenic Escherichia coli. Folia Microbiol 50, 40-46
Tresse, O., Lebret, V., Benezech, T., Faille, C. 2006. Comparative evaluation of adhesion, surface properties, and surface protein composition of Listeria monocytogenes strains after cultivation at constant pH of 5 and 7. J Appl Microbiol 101, 53-62
Tresse, O., Lebret, V., Garmyn, D., Dussurget, O. 2009. The impact of growth history and flagellation on the adhesion of various Listeria monocytogenes strains to polystyrene. Can J Microbiol 55, 189-196
Vázquez-Sánchez, D., Habimana, O., Holck, A. 2013. Impact of food-related environmental factors on the adherence and biofilm formation of natural Staphylococcus aureus isolates. Curr Microbiol 66, 110-121
Vázquez-Sánchez, D., Cabo, M.L., Ibusquiza, P.S., Rodríguez-Herrera, J.J. 2014. Biofilm-forming ability and resistance to indus-trial disinfectants of Staphylococcus aureus isolated from fishery products. Food Control 39, 8-16
Wemekamp-Kamphuis, H.H., Wouters, J.A., de Leeuw, P.P., Hain, T., Chakraborty, T., Abee, T. 2004. Identification of sigma factor σB-controlled genes and their impact on acid stress, high hydrostatic pressure, and freeze survival in Listeria monocytogenes EGD-e. Appl Environ Microbiol 70, 3457-3466
Whiting, R.C., Sackitey, S., Calderone, S., Morely, K., Phillips, J.G. 1996. Model for the survival of Staphylococcus aureus in nongrowth environments. Int J Food Microbiol 31, 231-243
Chapter 3. Biofilm Formation of Food Pathogens and Spoilers as affected by Temperature, pH, Glucose and Sodium Chloride
84
Zmantar, T., Bettaieb, F., Chaieb, K., Ezzili, B., Mora-Ponsonnet, L., Othmane, A., Jaffrézic, N., Bakhrouf, A. 2011. Atomic force microscopy and hydrodynamic characterization of the adhesion of Staphylococcus aureus to hydrophilic and hydrophobic substrata at different pH values. World J Microb Biot 27, 887-896
85
Chapter 4. EFFECT OF TEMPERATURE ON BIOFILM FOR-
MATION AND SANITIZERS SENSITIVITY OF PSEUDOMONAS
SPP.
Chapter 4. Effect of Temperature on Biofilm Formation and Sanitizers Sensitivity of Pseudomonas spp.
86
4.1 INTRODUCTION
Biofilms represent a significant problem for the food industry, because if not properly controlled,
they compromise the sanitation process causing hygienic issues and health risks. The main strategy in con-
trolling biofilm formation is to prevent microbial adhesion. This can be carried out, for example, through
an effective cleaning system which is essential for the control of biofilm development on surfaces in food
processing environments. Microorganisms growing in a biofilm surround themselves with EPS and form a
complex multicellular structure. EPS and three-dimensional structures are thought to play an important role
in biofilm resistance to sanitizers (Costerton et al., 1995). As a matter of fact, mature biofilms are generally
difficult to inactivate and remove, since the structural characteristics of biofilm, constituted of cells and
EPS, play protecting roles against various chemical and physical stresses (Kumar and Anand, 1998). There-
fore, clarifying the structural characteristics of biofilm is extremely important for obtaining more effective
inactivation and removal treatments. Understanding the mechanical and architectural properties of the ma-
trix is closely related with the use of suitable methods that permit accurate analysis of the matrix structure
and composition. Ideally, an in situ, non destructive approach should be used. In the recent years, confocal
laser scanning microscopy (CLSM) has been developed as a three-dimensional optical sectioning technol-
ogy for the visualization of viable biofilm systems. CLSM is currently one of the most frequently used tools
to study biofilm structure, because it allows to a direct in situ and non-destructive investigation of biofilm
cell structures using specific fluorescent markers. Moreover, dehydration and fixation are not needed in the
observation process of CLSM (Caldwell et al., 1992). CLSM has provided some new information on the
structural complexity of biofilms and has confirmed their heterogeneity (Stoodley, 1999). However, few
studies concerning CLSM observation of developing biofilms and before/after inactivation treatments have
been reported.
Members of the genus Pseudomonas have frequently been reported to produce exopolymers, and
they have the ability to attach rapidly to the surfaces of the food industry, where they are frequently found
(Leriche et al., 2004). Among the Pseudomonas genus, P. aeruginosa is known for its ability to form bio-
films on abiotic surfaces, but little is known about the biofilm-forming capacity of Pseudomonas spp. iso-
lated from food environments. It has to be highlighted that the Pseudomonas spp. relevant for the food
industry are psychrophilic, so their presence in food plant areas where the temperature is below the room
temperature could be a concern. The aim of this work was to evaluate the biofilm forming ability of three
strains belonging to the Pseudomonas genus at temperatures of 4 ° C and 15 ° C, in order to simulate
relevant temperatures of a food chain. Moreover, the sensitivity to two sanitizers of the biofilms formed at
the temperatures tested was evaluated. Furthermore, CLSM was used to follow the biofilm formation of a
Pseudomonas sp. strain on stainless steel under dynamic conditions, as well as its sensitivity to a sanitizer
product.
Chapter 4. Effect of Temperature on Biofilm Formation and Sanitizers Sensitivity of Pseudomonas spp.
87
4.2 MATERIALS AND METHODS
4.2.1 Biofilm formation by Pseudomonas spp.
P. fluorescens Ps_019, P. fragi Ps_053 and P. putida Ps_071 strains were used in this study (see
List of Strains). The biofilms were grown both on polystyrene microtiter plates and on stainless AISI 304.
The biofilm production assay in 96-well polystyrene flat bottom microtiter plates was performed
in Luria Bertani broth (LB) in three biological replicates as described in paragraph 2.2.1. The microtiter
plates were incubated at 4 °C and 15 °C for seven days. Every 48 hours the microtiter plates were subjected
to a refreshing of the exhausted broth with fresh LB. At the end of the incubation, the microtiter plates were
rinsed and stained as described in paragraph 2.2.1, and OD570 values were calculated.
Biofilms were also grown on stainless steel AISI 304 coupons in the CDC Biofilm Reactor (CBR)
in LB as described in paragraph 2.2.2. The incubation of the CBR was performed for seven days at 4 °C
and 15 °C. Each experiment was repeated twice. After incubation, the coupons were removed and rinsed,
as described in paragraph 2.2.2. Subsequently, the evaluation of viable counts was carried out using the
Drop Plate method (paragraph 2.2.3).
4.2.2 Biofilm susceptibility towards disinfectants
The strains in the sessile state (biofilms grown in microtiter plates and on stainless steel) were
subjected to a susceptibility test against a peracid-based product (PA; peracetic acid 7%, hydrogen peroxide
26%, acetic acid 6%) and a chloramine-T based product (CL-T; active chlorine minimum 24%). The prod-
ucts were tested respectively at concentrations of 1% and 0.3%, which are the recommended industrial use
conditions. In order to better understand the tolerance of the strains against sanitizers, they were also tested
in the planktonic state.
The test was carried out in 96-well polystyrene flat bottom microtiter plates to set up the biofilm
formation by the strains, as described in paragraph 2.2.1 using LB broth as the culture medium. The micro-
titer plates were incubated at 4 °C and 15 °C for seven days and were subjected to a refreshing of the
exhausted broth with fresh LB every 48 hours. For each strain four wells were treated with each disinfectant
and four wells were used as the controls. The treatment with sanitizer products was carried out as follows:
the medium was gently removed and each well was washed twice with 200 µL sterile saline solution (0.9%
NaCl). Each well was treated with 250 µL of 1% PA or 0.3% CL-T for 5 min at 20 °C; the sanitizer solutions
were then removed, replaced with 250 µL of neutralizer solution (0.5% sodium thiosulfate) and left in
contact for 5 min at 20 °C. In the control wells the sanitizer solutions were replaced with 250 µL of sterile
tap water at the same temperature and for the same contact time, and subsequently removed and replaced
by an equal volume of neutralizing solution through the same procedures described above. After the neu-
tralizer removal, biofilm cells were resuspended in 250 µL of Maximum Recovery Diluent (MRD), then
scraped with a pipette tip. Afterwards, the resuspended biofilm was transferred in 500 µL Eppendorf tubes
Chapter 4. Effect of Temperature on Biofilm Formation and Sanitizers Sensitivity of Pseudomonas spp.
88
and subjected to sonication as described in paragraph 2.2.2. The bacterial counts were assessed by plating
serial 10-fold dilutions of the biofilm cell suspension on Gelatin Sugar Free Agar (GSFA, Oxoid, Milan,
Italy) plates, using the spread plate method (see paragraph 2.2.3). The plates were incubated at 30 °C for
24-48 hours. Each experiment was conducted twice.
Regarding the biofilms formed on stainless steel AISI 304 coupons, the CDC Biofilm Reactor was
used, as described in the paragraph 4.2.1, using LB broth as culture medium. For each trial, two coupons
were used as the control and two were treated with each sanitizer product. After incubation, each coupon
was rinsed twice with a sterile saline solution to remove the non-adherent cells and subsequently placed in
contact with 15 mL of sanitizing solution at the appropriate concentration for 5 min at 20 °C. After the
treatment, the coupons were treated with 15 mL of neutralizing solution for 5 min at 20 °C. Then, the
biofilm cells were detached from coupons by using sterile cell-scrapers; detached cells were resuspended
in 1 mL of MRD and sonicated as described in paragraph 2.2.2. The bacterial counts were carried out by
plating serial ten-fold dilutions of the biofilm cell suspension on GSFA plates, using the spread plate
method. The plates were incubated at 30 °C for 24-48 hours. The coupons used as controls, after washing
twice with a sterile saline, were placed in contact with a sterile saline solution for 5 min and subsequently
subjected to detachment of the biofilm and microbiological count, as previously described. Each trial was
repeated twice.
As regards planktonic cells susceptibility test, 10 mL of LB were inoculated with 50 µL of an
overnight culture of each strain and incubated at 4 °C and 15 °C for seven days. Subsequently, 1 mL of
each culture was washed twice with a sterile saline and resuspended in 1 mL volume of sterile saline.
Afterwards, the suspension was placed in contact for 5 min at 20 °C with 9 mL of each sanitizer solution.
Then 1 mL of the suspension was put in contact for 5 min at 20 °C with 9 mL of neutralizing solution. The
bacterial counts were assessed by plating serial ten-fold dilutions of the cell suspension on GSFA using the
spread plate method. The plates were incubated at 30 °C for 48 hours. Each experiment was repeated twice.
For each type of treatment, both for sessile and planktonic cells, the efficacy of the disinfecting
treatments was evaluated by taking the ratio of the Log CFU/cm2 (or /mL) before (N0) and after treatment
(Nt), presented as -Log (Nt/N0) (Sudhaus et al., 2014).
4.2.3 Kinetics of adhesion and biofilm formation on stainless steel AISI 304, and re-
sistance to peracid-based sanitizer
The effect of incubation temperature on adhesion and biofilm formation by P. fluorescens Ps_019
was evaluated during a five-day incubation on stainless steel in CBR. During incubation viable counts were
evaluated and microscopic observation using CLSM was performed. Moreover, the sensitivity of biofilm
to peracid-based sanitizer was evaluated during incubation.
The biofilms were grown at 4 °C and at 15 °C on stainless steel in the CDC Biofilm Reactor, as
described in the paragraph 4.2.1, and subjected to microbiological and CLSM observation at times of 2, 4,
Chapter 4. Effect of Temperature on Biofilm Formation and Sanitizers Sensitivity of Pseudomonas spp.
89
8, 24, 48 h and 5 days. At each sampling time, three coupons (two for microbiological analysis and one for
CLSM observation) were rinsed twice with 10 mL of a sterile saline solution, in order to eliminate the non-
adherent cells. For microbiological analysis, two coupons were treated as described in paragraphs 2.2.2.
The bacterial counts were carried out by plating serial ten-fold dilutions of the biofilm cells suspension on
GSFA plates, incubated at 30 °C for 48 hours.
At the times of 48 h and 5 days, three coupons were rinsed with 10 mL of a sterile saline solution
and treated with 15 mL of 1% PA solution for 5 min at 20 °C. After treatment, the coupons were neutralized
with 15 mL of neutralizing solution for 5 min at 20 °C. Then, the biofilms were detached from two coupons
and subjected to microbiological analysis as previously described. The third coupon was used for the CLSM
observation.
4.2.3.1 CLSM Microscopy
After washing in the sterile saline solution, each coupon was stained with Live/Dead BacLight kit
(Molecular Probes, Italy) with a concentration of 6 µM for Syto-9 and of 30 µM for propidium iodide, and
Concanavalin A at a concentration of 200 µg/mL (Molecular Probe, Italy). The Live/Dead BacLight kit
monitors the viability of bacterial populations as a function of the membrane integrity of the cell. Cells with
a compromised membrane that are considered to be dead or dying will stain red (propidium iodide), whereas
cells with an intact membrane will stain green (Syto-9). After 15 min, each coupon was rinsed with 7 mL
of sterile phosphate buffer saline (pH 7.4) and observed. CLSM analysis was performed with an LSM 510
META laser scanning microscope attached to an Axiovert 200 microscope (Zeiss, Jena, Germany) using
100x oil NA 1.4 objective. The excitation wavelengths were 488, 543 and 633 nm for green, red and far
red emission respectively. The emitted fluorescence was filtered by a primary dichroic filter (488, 543, 633
nm), splitted with NTF 635 vis and recorded using BP 505-530 for green emission, BP 585-615 for red
emission while for far red emission the meta detector in the channel mode setting wavelength was used.
Reconstructions of imaged samples were obtained by x-y, y-z projections created by LSM Zeiss Image
Examiner (ver. 3.0).
4.3 RESULTS AND DISCUSSION
Three Pseudomonas species strains were tested in this study, firstly because the microorganisms
belonging to the genus Pseudomonas include psychrophilic bacteria known for their ability to contaminate
food products. The second reason comes from the evidence that these microorganisms are able to form
biofilms even at low temperatures, which makes them efficient colonizers of chilled zones in the food
industry. Moreover, in the literature the studies about biofilm formation by bacteria belonging to the genus
Pseudomonas regard almost exclusively P. aeruginosa strains of medical origin. Therefore, it was particu-
larly interesting to study in depth the biofilm ability of foodborne isolates belonging to this microbial group.
As shown in Figure 4.1 strain P. fluorescens Ps_019 evidenced a greater attitude in developing
biofilm at 4 ° C as compared to 15 ° C in polystyrene plates, while P. putida Ps_071 showed an opposite
Chapter 4. Effect of Temperature on Biofilm Formation and Sanitizers Sensitivity of Pseudomonas spp.
90
behavior, although with different values of optical density (p<0.05). Regarding P. fragi Ps_053, the effect
of temperature was not significant for the biofilm formation. It is known that many environmental param-
eters, and in particular the temperature, are able to influence biofilm formation, although an important
component of variability is related to the strain (Lianou et al., 2012). The ability to form biofilms at low
temperatures is a physiological characteristic particularly hazardous in the food production area, since it
might indicate the ability of a microbial species to cause cross-contamination in food processing plant areas
at low temperatures (e.g. chilled areas).
Figure 4.1 Biofilm biomass (mean OD570 ± SD; n=3) formed on microtiter plates by Pseudomonas spp. at 4 °C and 15 °C
In Figure 4.2 the viable counts of biofilms formed are reported, both on polystyrene and on stainless
steel, by the three strains tested at the two temperatures. For all the isolates the viable counts were higher
on plastic surfaces compared to stainless steel ones (p<0.05), with mean values always over than 107
CFU/cm2, index of a high ability to form biofilm.
0.000
1.000
2.000
3.000
4.000
P. fluorescens Ps_019 P. fragi Ps_053 P. putida Ps_071
OD
570
4 °C 15 °C
Chapter 4. Effect of Temperature on Biofilm Formation and Sanitizers Sensitivity of Pseudomonas spp.
91
Figure 4.2 Biofilm cell viable counts (mean Log CFU/cm2 ± SD; n=2) of P. fluorescens Ps_019 (a), P. fragi Ps_053 (b) and P.
putida Ps_071 (c) on polystyrene (PS) and stainless steel (SS) at 4 °C and 15 °C
Mean Log CFU/cm2 on stainless steel were always greater than 4. It has to be highlighted that
polystyrene in microtiter plates is specially treated to promote cell adhesion and it is considered the refer-
ence material for the screening of the bacterial ability to form biofilm. Stainless steel surface is, instead, a
very common material used in food processing plant for its lack of toxicity and its resistance to high tem-
peratures and to physical, chemical and microbiological corrosions. The high ability to form biofilms on
stainless steel makes these strains particularly hazardous for the food industry. To our knowledge, there is
0
1
2
3
4
5
6
7
8
9
10
PS SS
Log
CF
U/c
m2
a)
4 °C 15 °C
0
1
2
3
4
5
6
7
8
9
10
PS SS
Log
CF
U/c
m2
b)
4 °C 15 °C
0
1
2
3
4
5
6
7
8
9
10
PS SS
Log
CF
U/c
m2
c)
4 °C 15 °C
Chapter 4. Effect of Temperature on Biofilm Formation and Sanitizers Sensitivity of Pseudomonas spp.
92
a lack of information on the biofilm-forming ability of foodborne Pseudomonas spp. on surfaces present in
food plants, so these results could help in completing the picture on the characterization of species very
widespread in the food industry.
The conventional approach to microbial biofilms in the food field is the use of chemical disinfec-
tion, even if it is generally accepted that biofilm organisms are more resistant to biocides than their plank-
tonic counterparts. In this step of the study Pseudomonas strains were tested against two oxidizing agents,
i.e. one peracid-based product (PA) and one chlorine-releasing agent (CL-T), frequently used in food san-
itation programs. Usually the suspension test (performed on planktonic cells) is used to assess the bacteri-
cidal activity of a biocide against a specific microorganism (Holah et al., 2002). This test consists in expos-
ing planktonic cells to the product to be tested under specific conditions of time, temperature and concen-
tration, evaluating the survival rate to the treatment. There are some concerns about this protocol, as a good
test must be able to predict the efficacy of the used disinfectants. However, in practice, cells are found much
more frequently in the sessile form than in suspension, which makes them more resistant to the sanitation
treatments with respect to free cells. Thus, the use of the suspension test could overestimate the effective-
ness of a sanitation protocol, resulting in an increased risk of food cross-contamination. In the light of these
considerations, in this study the effectiveness of two oxidizing agents were tested against both planktonic
and sessile cells grown at the two tested temperatures.
In Figure 4.3 the efficacy of the disinfecting treatments was evaluated shown by graphing the ratio
of the Log CFU/cm2 (or /mL) before (N0) and after treatment (Nt), and is presented as -Log (Nt/N0).
Chapter 4. Effect of Temperature on Biofilm Formation and Sanitizers Sensitivity of Pseudomonas spp.
93
Figure 4.3 Efficacy (mean -Log (Nt/N0) ± SD; n=2) of PA and CL-T towards planktonic cells of P. fluorescens Ps_019 (a), P.
fragi Ps_053 (b) and P. putida Ps_071 (c) grown at 4 °C and 15 °C; dotted red line refers to the minimal efficacy required to a sanitizing agent (Payne et al., 1999)
The results clearly indicate that, regardless of the incubation temperature, for all the tested strains
the reduction of viable counts abundantly exceeds 5 Log CFU/cm2, which is considered acceptable to define
a product as a disinfectant according to the European standards (Payne et al., 1999). No significant differ-
ences (p>0.05) were observed between PA and CL-T efficacies for each strain. However, when considering
the microbial cells in the sessile state, the inactivation was considerably lower. As regards biofilms formed
on polystyrene (Figure 4.4), PA caused a reduction of more than 5 Log CFU/cm2 in almost all the tested
0
1
2
3
4
5
6
7
8
9
PA CL-T
-Lo
g (
Nt/
N0)
a)
4 °C 15 °C
0
1
2
3
4
5
6
7
8
9
PA CL-T
-Log (
Nt/N
0)
b)
4 °C 15 °C
0
1
2
3
4
5
6
7
8
9
PA CL-T
-Log (
Nt/N
0)
c)
4 °C 15 °C
Chapter 4. Effect of Temperature on Biofilm Formation and Sanitizers Sensitivity of Pseudomonas spp.
94
cases, except for P. putida Ps_071, whose biofilm, formed at 15 °C, was inactivated by less than 2 Log
CFU/cm2. According to Mosteller and Bishop (1993), a product with a disinfectant action against bacterial
biofilm must be able to reduce the cellular populations of 3 logarithmic units. P. putida Ps_071 formed
different amounts of biofilm mass on polystyrene at the two tested temperatures, as the OD570 values were
higher at 15 °C. Instead, the viable counts were not statistically different. It is therefore conceivable that in
response to different thermal stimuli this species produces different amounts of EPS, which can protect the
cells from the bactericidal agent. This hypothesis cannot be applied to P. fluorescens Ps_019, which showed
higher OD570 at 4 °C and similar reductions following PA contact.
Regarding CL-T, the effect of inactivation was lower than that obtained with PA. Mean efficacies
were statistically different (p<0.05) for each strain, except for P. putida Ps_071 grown at 15 °C. In most
cases the reduction of the biofilm cell population was lower than 3 Log CFU/cm2, which makes this com-
mercial product ineffective for the treatment of Pseudomonas biofilms. The lower effect of inactivation of
CL-T compared to PA could be due to the effect of EPS matrix, which can inactivate the chlorine-based
biocide, as observed by Toté et al. (2010). Regarding the biofilm treated with chloramine-T, the sensitivity
of the biofilm was quite different at the two tested temperatures: in particular, the biofilms formed at 15 °
C were more resistant, which could indicate a higher production of EPS in these conditions.
Chapter 4. Effect of Temperature on Biofilm Formation and Sanitizers Sensitivity of Pseudomonas spp.
95
Figure 4.4 Efficacy (mean -Log (Nt/N0) ± SD; n=2) of PA and CL-T towards biofilms of P. fluorescens Ps_019 (a), P. fragi
Ps_053 (b) and P. putida Ps_071 (c) grown on polystyrene at 4 °C and 15 °C; dotted red line refers to the minimal efficacy re-quired to a sanitizing agent towards biofilm cells (Mosteller and Bishop, 1993)
The results obtained on biofilms formed on stainless steel clearly indicate that the effect of the
peracid-based product fulfils the goal of biofilm microbial inactivation, regardless of the growth tempera-
ture (Figure 4.5). CL-T instead failed at inactivating the biofilm formed by P. fragi Ps_071 at 4 °C. Contrary
to polystyrene, there was no clear influence of temperature on the sensitivity of biofilms. It should be em-
phasized that the nature of the material can deeply influence its interactions with the cell biomass and the
EPS matrix, which results in significant differences in the biofilm sensitivity.
0
1
2
3
4
5
6
7
PA CL-T
-Log (
Nt/N
0)
a)
4 °C 15 °C
0
1
2
3
4
5
6
7
PA CL-T
-Log (
Nt/N
0)
b)
4 °C 15 °C
0
1
2
3
4
5
6
7
PA CL-T
-Log
(N
t/N
0)
c)
4 °C 15 °C
Chapter 4. Effect of Temperature on Biofilm Formation and Sanitizers Sensitivity of Pseudomonas spp.
96
Figure 4.5 Efficacy (mean -Log (Nt/N0) ± SD; n=2) of PA and CL-T towards biofilms of P. fluorescens Ps_019 (a), P. fragi Ps_053 (b) and P. putida Ps_071 (c) grown on stainless steel at 4 °C and 15 °C; dotted red line refers to the minimal efficacy
required to a sanitizing agent towards biofilm cells (Mosteller and Bishop, 1993)
In order to better elucidate the effect of temperature on biofilm formation by Pseudomonas spp., P.
fluorescens Ps_019 was chosen for a study on the kinetics of biofilm formation during a five-day growth
on stainless steel in CBR. During the incubation, the cells were enumerated by a viable count evaluation,
0
1
2
3
4
5
6
PA CL-T
-Lo
g (
Nt/
N0)
a)
4 °C 15 °C
0
1
2
3
4
5
6
PA CL-T
-Lo
g (
Nt/
N0)
b)
4 °C 15 °C
0
1
2
3
4
5
6
PA CL-T
-Log
(N
t/N
0)
c)
4 °C 15 °C
Chapter 4. Effect of Temperature on Biofilm Formation and Sanitizers Sensitivity of Pseudomonas spp.
97
and contextually the different components of the biofilm (cells and EPS matrix) were differentially stained
and observed using CLSM. Moreover, PA-treated biofilms were characterized in the same way.
Figure 4.6 reports the data related to the formation of biofilm by P. fluorescens Ps_019 at 4 °C and
15 °C. At 4 °C the adherence was similar in the first 24 h of incubation, whilst it was significantly higher
(p<0.05) after 2 d and 5 d. At 15 °C Log CFU/cm2 means were not affected by the incubation temperature
within the first 8 h of growth, while these values were significantly higher at 24 h and 2 d/5 d (p<0.05). The
adherence of P. fluorescens Ps_019 was higher (p<0.05) at 15 °C than at 4 °C at each sampling time, except
after 2 h. P. fluorescens Ps_019 attached on stainless steel in the first eight hours as single cells at 4 °C,
while at 15 °C they attached as loosely packed microcolonies. A greater difference in biofilm formation at
4 °C and 15 °C was observed after 24 h of incubation (p<0.05).
Chapter 4. Effect of Temperature on Biofilm Formation and Sanitizers Sensitivity of Pseudomonas spp.
98
Figure 4.6 Biofilm cell viable counts (mean Log CFU/cm2 ± SD; n=4) and CLSM images of P. fluorescens Ps_019 grown in dy-namic conditions on stainless steel at 4 °C (a) and 15 °C (b). Biofilm samples were stained with Syto-9 (green fluorescence, indi-cating live cells), propidium iodide (red fluorescence, indicating dead cells) and Con-A (blue fluorescence, indicating extracellu-
lar matrix)
Chapter 4. Effect of Temperature on Biofilm Formation and Sanitizers Sensitivity of Pseudomonas spp.
99
After 24 h, P. fluorescens Ps_019 formed small irregularly shaped microcolonies both at 4 °C and
15 °C, even if the colony sizes were more dense at 15 °C than 4 °C. Moreover, after 24 h at 15 °C, P.
fluorescens Ps_019 formed ball-shaped microcolonies.
Despite the observed differences in biofilm cell counts at 4 °C and 15 °C, the strong ability of P.
fluorescens Ps_019 to adhere to and form biofilm on stainless steel at both temperatures should be empha-
sized. As a matter of fact, already in the first eight hours of growth the number of adherent cells to stainless
steel was always higher than 2 Log CFU/cm2 both at 4 °C than at 15 °C. These amounts of biofilm cells
should not be underestimated as they referred to very low temperatures, which are widely used in food
plants. Consequently, since the safety of food supply is dependent upon proper cold-chain operations and
since the initial attachment is the key to successful biofilm development, it is worrisome that P. fluorescens
Ps_019 may have the ability to establish biofilms on food processing equipment and/or chilled processed
foods. After 5 days of incubations the mean counts of adhered cells were 3.92 Log CFU/cm2 and 4.74 Log
CFU/cm2 at 4 °C and at 15 °C, respectively. The 2- and the 5-days-old biofilms of P. fluorescens Ps_019
were clearly different at the two incubation temperatures. In fact, while at 15 °C it was possible to observe
compact and tightly packed microcolonies and the presence of high amounts of blue-stained EPS, at 4 °C
small irregularly shaped and loosely packed microcolonies were formed, as well as lower amounts of EPS.
From these data it is possible to highlight that the incubation temperature strongly influenced the biofilm
formation and structure of P. fluorescens Ps_019 during the 5 days of incubation in this study. The obtained
results suggest that structural changes in biofilm formation occur in response to changing environments. It
is conceivable that different amounts of sessile cells and EPS produced in different temperature conditions
are diversely affected by the treatments implemented in the control of biofilms.
After the sanitizer treatment with PA-based products, P. fluorescens Ps_019 sessile cells were
lower than the detection limit of the microbiological sampling method (Table 4.1). In CLSM images, bio-
film cells stained mostly red, indicating cell death, both at 4 °C than 15 °C (Figure 4.7 and Figure 4.8).
However, after the PA treatment on 2- and 5-day biofilms grown at both temperatures a significant number
of cells was observed still alive, and their size was quite diminished. It has been shown that, after a chlorine-
treatment at 100 ppm for 5 min, a significant amount of P. fluorescens sessile cells were only damaged,
and not killed. Moreover, after the sanitizer treatment, the cell length appeared modified, which may indi-
cate cell injury (Lindsay and von Holy, 1999). It has to be stressed that injured cells may recover within
few hours, and consequently re-grow and re-colonize surfaces. CLSM allowed also to evidence the presence
of blue-stained EPS, both in untreated cells and in PA-treated cells, though in smaller amount in the latter
case. In pure biofilms EPS contributes to the biofilm structure during maturation, and significant amounts
were visible in 5-days old biofilms. After PA-treatments, EPS was still detected, probably due to the fact
that peracetic acid is not known to remove EPS from surfaces, as does chlorine instead (Alasri et al., 1992).
The presence of EPS after a sanitation protocol is not desirable, as it has been hypothesized that it can
contribute in enhancing the attachment of Gram-positive bacteria, such as L. monocytogenes, to stainless
steel surfaces (Sasahara and Zottola, 1993).
Chapter 4. Effect of Temperature on Biofilm Formation and Sanitizers Sensitivity of Pseudomonas spp.
100
Table 4.1 Efficacy of PA on biofilms (mean Log CFU/cm2 ± SD; n=4) formed by P. fluorescens Ps_019; *ND, not detectable, <1 CFU/cm2
Temperature Biofilm age Untreated PA-treated
4 °C 2-day 4.09 ± 0.01 ND*
4 °C 5-day 3.92 ± 0.03 ND
15 °C 2-day 4.61 ± 0.11 ND
15 °C 5-day 4.74 ± 0.08 ND
Significant reductions in biofilm cells were observed after treatment with PA. The Log CFU/cm2
reductions obtained in the treatment of biofilms of these strains with peracetic acid were sufficient enough
to qualify the peracid-based product used in this study as an efficient sanitizer for biofilm control. In fact,
peracid-based disinfectants have been usually used in the food industry especially in the sanitation step of
the CIP system (Orth, 1998), as this substance works quickly and is effective against bacteria thanks to its
high oxidation capacity of cellular molecules by releasing free oxygen and hydroxyl radicals, which de-
compose in oxygen, water and acid acetic. Moreover, it does not produce toxic or carcinogenic compounds
as it does not react with proteins, it has low environmental impact and it has been reported to be more active
against biofilm (Loukili et al., 2006).
Chapter 4. Effect of Temperature on Biofilm Formation and Sanitizers Sensitivity of Pseudomonas spp.
101
Figure 4.7 CLSM images of P. fluorescens biofilm formed at 4 °C; (a) 2-days-old biofilm before and (b) after sanitizer treatment, (c) 5-days-old biofilm before and (d) after sanitizer treatment
Figure 4.8 CLSM images of P. fluorescens biofilm formed at 15 °C; (a) 2-days-old biofilm before and (b) after sanitizer treat-ment, (c) 5-days-old biofilm before and (d) after sanitizer treatment
4.4 CONCLUSIONS
In this study the effect of temperature on the formation of biofilms by Pseudomonas spp. and the
sensitivity of the biofilms to disinfection treatments was evaluated. From the obtained results the strains
showed a high ability to form biofilm at low temperatures both on polystyrene and on stainless steel, which
makes these strains particularly dangerous in the food industry, as they can represent a possible source of
food cross-contamination.
c d
a
d c
b
a b
Chapter 4. Effect of Temperature on Biofilm Formation and Sanitizers Sensitivity of Pseudomonas spp.
102
The study of biofilms formed on polystyrene and stainless steel have shown that temperature sig-
nificantly affects the kinetics of adhesion, but also the cell density and the amount of EPS produced, and
consequently the resistance to biocides. The use of the CLSM technique for microscopic observation al-
lowed the study of biofilms under undisturbed conditions, and thus is well suited to a possible online use.
The presence of alive, but probably damaged cells, observed using CLSM after a treatment with a peracid-
based biocide may represent a possible reserve of contamination and consequent alteration of food products.
It is expected that the findings of this study give useful information about the knowledge of sessile
organisms response to environmental stimuli, which could support the research for innovative strategies to
prevent, inactivate and remove the biofilm.
4.5 REFERENCES
Alasri, A., Roques, C., Cabassud, C., Michel, G., Aptel, P. 1992. Effects of different biocides on a mixed biofilm produced on a Tygon tube and on ultrafiltration membranes. J Spectra 168, 21-24
Caldwell, D.E., Korber, D.R., Lawrence, J.R. 1992. Imaging of bacterial cells by fluorescence exclusion using scanning confocal laser microscopy. J Microbiol Meth 15, 249-261
Holah, J.T., Taylor, J.H., Dawson, D.J., Hall, K.E. 2002. Biocide use in the food industry and the disinfectant resistance of persistent strains of Listeria monocytogenes and Escherichia coli. J Appl Microbiol 92, 111S-120S
Kumar, C.G, Anand, S.K. 1998. Significance of microbial biofilms in food industry: a review. Int J Food Microbiol 42, 9-27
Leriche, F., Bordessoules, A., Fayolle, K., Karoui, R., Laval, K., Leblanc, L., Dufour, E. 2004. Alteration of raw-milk cheese by Pseudomonas spp.: monitoring the sources of contamination using fluorescence spectroscopy and metabolic profiling. J Microbiol Met 59, 33-41
Lianou, A., Koutsoumanis, K.P. 2012. Strain variability of the biofilm-forming ability of Salmonella enterica under various envi-ronmental conditions. Int J Food Microbiol 160, 171-178
Lindsay, D., von Holy, A. 1999. Different responses of planktonic and attached Bacillus subtilis and Pseudomonas fluorescens to sanitizer treatment. J Food Protect 62, 368-379
Loukili, N.H., Granbastien, B., Faure, K., Guery, B., Beaucaire, G. 2006. Effect of different stabilized preparations of peracetic acid on biofilms. J Hospital Infect 63, 70-72
Mosteller, T.M., Bishop, J.R. 1993. Sanitizer efficacy against attached bacteria in a milk biofilm. J Food Protect 56, 34-41
Orth, R. 1998. The importance of disinfection for the hygiene in the dairy and beverage production. Int Biodeter Biodegr 41, 201-208
Payne, D.N., Babb, J.R., Bradley, C.R. 1999. An evaluation of the suitability of the European suspension test to reflect in vitro activity of antiseptics against clinically significant organisms. Lett Appl Microbiol 28, 7-12
Sasahara, K.C. Zottola, E.A. 1993. Biofilm formation by Listeria monocytogenes utilizes a primary colonising microorganism in flowing systems. J Food Protect 56, 1022-1028
Stoodley, P., Boyle, J.D., DeBeer, D., Lappin‐Scott, H.M. 1999. Evolving perspectives of biofilm structure. Biofouling 14, 75-90
Sudhaus, N., Nagengast, H., Pina-Pérez, M.C., Martínez, A., Klein, G. 2014. Effectiveness of a peracetic acid-based disinfectant against spores of Bacillus cereus under different environmental conditions. Food Control 39, 1-7
Toté, K., Horamans, T., Vanden Berghe, D., Maes, L., Cos, P. 2010. Inhibitory effect of biocides on the viable masses and matrices of Staphylococcus aureus and Pseudomonas aeruginosa biofilms. Appl Environ Microbiol 76, 3135-3142
103
Chapter 5. EFFECTIVENESS OF CHEMICAL SANITIZERS AND
PULSED LIGHT FOR THE INACTIVATION OF LISTERIA MONO-
CYTOGENES AND PSEUDOMONAS FLUORESCENS BIOFILMS
Chapter 5. Effectiveness of Chemical Sanitizers and Pulsed Light for the Inactivation
of Listeria monocytogenes and Pseudomonas fluorescens Biofilms
104
5.1 INTRODUCTION
Attached bacteria and biofilm formed on surfaces can represent a hygiene risk in food processing
due to possible cross-contaminations. The most common approach to fight biofilms is to prevent them or,
after their development, treat them with chemicals. It is well known that attached cells are more resistant
to biocide than planktonic cells, as the polysaccharide matrix provides a protective barrier limiting the
penetration of disinfectants. For instance, active chlorine concentrations as high as 1000 ppm are necessary
for a substantial reduction in bacterial numbers in multispecies biofilms compared to 10 ppm for planktonic
cells (Norwood and Gilmour, 2000). Therefore, biofilm elimination from food processing facilities repre-
sents a big challenge.
The selection of detergents and disinfectants for the food industry depends on the efficacy, safety
and rinsability of the agent, as well as on its corrosiveness or its effects on the sensory values of the manu-
factured products. The key to effective cleaning and disinfection of food plants is understanding the type
and nature of the soiling agent (sugar, fat, protein, mineral salts etc.) and the microbial growth to be re-
moved (Gibson et al., 1999). Oxidising substances like chlorine or peroxyacetic acid are frequently used.
Chlorine is commonly applied as a sanitizer due to its oxidizing and disinfecting power. Peracetic acid is
the most widely used among peracid sanitizers and it is often more effective than chlorine, since it maintains
activity in the presence of an organic load. Hence, peracetic acid is effective against biofilm bacteria and is
advantageous to use if biofilm contains food residues (Chmielewski and Frank, 2003). Other substances,
known as surfactants (e.g. acid anionics and quaternary ammonium compounds) are relatively unaffected
by an organic load or hard water and are fast acting on yeast but slower acting on bacteria, as reported by
Frank and Koffi (1990).
When a microbial population is put into contact with high concentrations of a biocide, susceptible
cells will be inactivated. However, some cells may possess a degree of natural resistance and physiological
plasticity or they may acquire it later, so they can survive and grow even after a sanification protocol.
Indeed, bacterial resistance to all classes of biocides has been reported in the literature, and anecdotal re-
ports within the biocide industry are common (Chapman, 2003). Thus, the increased biofilm resistance to
chemical treatments enhances the need to develop new control strategies. Moreover, conventional chemical
and mechanical cleaning and disinfection methods tend to be too harsh and time-consuming, and chemical
residues remaining on the surface might be a risk upon coming in contact with foods (Wirtanen and Salo,
2003). The use of disinfectants, which are often provided to the user in a concentrated form, is also a po-
tential risk to the safety of operators involved in the sanitation program if this is not properly instructed.
Also, it is important not to underestimate the possible consequences related to the emission of residual
materials, such as environmental pollution and the selection of microbial species, resistant/tolerant to anti-
microbial substances.
Chapter 5. Effectiveness of Chemical Sanitizers and Pulsed Light for the Inactivation
of Listeria monocytogenes and Pseudomonas fluorescens Biofilms
105
One alternative technology that can be applied for surface disinfection is the radiation with ultravi-
olet (UV) light. The antimicrobial activity of short-wave ultraviolet (UV) light in the “UV-C” band (200 to
280 nm) is well known to reduce microbial contamination in hospitals (Andersen et al., 2006), in the phar-
maceutical/medical industry (Rastogi et al., 2007), in the water treatment plants (Høibe et al., 2008) and on
the food products and contact surfaces (Woodling and Moraru, 2005; Sommers et al., 2009). UV-C light
does not contain or produce toxic compounds, it does not have legal restrictions or require extensive safety
equipment, and these characteristics make it an interesting disinfection principle for food processing. A
method that is receiving considerable attention is pulsed light (PL) radiation, a non-thermal technique for
decontaminating food, packaging, water and air. PL is an approach which kills microorganisms by using
ultra-short duration pulses of an intense broadband emission spectrum that is rich in UV-C germicidal light.
PL is produced using techniques that multiply power manifold by storing electricity in a capacitor over a
relatively long time (fractions of a sec) and releasing it in a short time (millionths or thousandths of a sec)
using sophisticated pulsed compression techniques. The emitted flash has a high peak power and usually
consists of a wavelength from 200 to 1100 nm broad spectrum light enriched with shorter germicidal wave-
lengths (Gómez-López et al., 2007). By killing the surface spoilage microflora, PL treatment was found to
inactivate microorganisms naturally present on vegetables, fruits, food powders and seeds (Gómez-López
et al., 2005). Currently, only little information is available on the PL effect on microbial biofilms formed
on materials used in food plants.
The objective of this study was to evaluate the performances of different approaches aimed to the
inactivation of L. monocytogenes and P. fluorescens biofilms. These microorganisms are known for their
ability to effectively colonize food processing surfaces and for representing a hygienic risk for food prod-
ucts. Thus, biofilms formed in dynamic flow conditions on two types of material were treated with both
commercial chemicals and PL, in order to compare the performances of both approaches and to acquire
useful information for the development of non-conventional strategies.
5.2 MATERIALS AND METHODS
5.2.1 Bacterial strains and culture conditions
The microorganisms used in this study were L. monocytogenes Lm_284 and P. fluorescens Ps_019
(see List of Strains). Both strains were classified as strong biofilm-producers according to Stepanović et al.
(2000).
5.2.2 Biofilm formation on stainless steel and PTFE
Biofilms were grown in the CDC Biofilm Reactor (CBR) on stainless steel AISI 304 and polytet-
rafluoroethylene (PTFE) coupons. In these trials, Luria Bertani broth (LB) was used as culture medium in
the CBR, which was inoculated as described in paragraph 2.2.2. The biofilm growth was carried out for 48
Chapter 5. Effectiveness of Chemical Sanitizers and Pulsed Light for the Inactivation
of Listeria monocytogenes and Pseudomonas fluorescens Biofilms
106
hours under dynamic conditions (in batch with rotation of the magnet to 125 rpm) at 20 °C. Each experiment
was repeated three times for each strain.
5.2.2.1 Biofilm treatment with disinfectants
After the biofilm growth, stainless steel and PTFE coupons were removed from each rod of the
CBR and subjected to rinsing, as described in paragraph 2.2.2. Afterwards, coupons were immersed for 5
min in 5 mL of each sanitizing solution at the concentrations recommended by the manufacturer. The com-
mercial products used in this test included formulations based on chlorine, iodophors, quaternary ammo-
§ statistical significance for data within rows (*, p<0.05)
All disinfectants had a significant effect on the viability of biofilm microbial cells, regardless of
species tested. Regarding L. monocytogenes, an almost total microbial inactivation of the formed biofilm
in all the experimental conditions was observed for QACs, iodophors, glycolic acid and alcohols and CL-
3, while two chlorine-based products and the peracid-based product were not sufficient to ensure a complete
inactivation of the biofilm cells. This finding is rather surprising as, according to many authors, chlorine-
based compounds and products containing oxidants like peracetic acid are the most used for the treatment
of microbial biofilms. As recommended by Mosteller and Bishop (1993), disinfectant products used against
biofilms must be able to ensure a microbial inactivation of at least 3 Log in the cell population. Therefore,
Chapter 5. Effectiveness of Chemical Sanitizers and Pulsed Light for the Inactivation
of Listeria monocytogenes and Pseudomonas fluorescens Biofilms
109
observing the data reported in Table 5.3, all the commercial products were found sufficiently effective
against L. monocytogenes, even though the survival of a number of cells, although limited, can generate the
formation of a new biofilm.
Regarding P. fluorescens, a lower sensitivity of biofilms to disinfectants compared to those of L.
monocytogenes was observed. The treatments with some disinfectants did not always guarantee 3 Log-
reductions of the biofilm viable cells. For example, the chlorine-based product CL-1 was rather ineffective.
The higher resistance of P. fluorescens biofilms could be related to the high amount of EPS secreted during
biofilm formation, which can protect the biofilm from the penetration of antimicrobials (Allison et al.,
1998) or it is linked to the reaction of chlorine species with organic matter in the surface layers of biofilm,
which is faster than their diffusion into the biofilm interior (Chen and Stewart, 1996). P. fluorescens bio-
films were quite sensitive to the other chlorine-based products (CL-2 and CL-3), probably due to the chem-
ical characteristics of the specific commercial formulations. Even glycolic acid and peracetic acid were
quite effective in inactivating P. fluorescens biofilm.
In order to investigate the potential of PL treatments in inactivating microbial biofilms, in a pre-
liminary step the effect of the distance between the light source and the sample was evaluated by treating
L. monocytogenes biofilms with 1 pulse at three different distances, conventionally defined near, mid and
far, corresponding to fluence values of 18, 12 and 8 KJ/m2. In the case of the farther distance, the samples
were also treated with 2 pulses (16 KJ/m2). As can be observed in Figure 5.1, the treatment with PL was
effective against L. monocytogenes biofilm cell viability, with higher inactivation at a decreased distance
of the lamp from the coupon. This effect was expected since decreasing distance strongly increases the
energy supplied to the sample, and consequently increases the antimicrobial effect.
Figure 5.1 PL inactivation (mean Log CFU/cm2 ± SD; n=2) of L. monocytogenes Lm_284 biofilms as affected by the distance between lamps and sample
The PL treatments caused higher inactivations on biofilms formed on PTFE with respect to stainless
steel (p<0.05). This difference can be linked to the interactions between the cell surface and the material
0
1
2
3
4
5
6
0 8 12 16 18
Log C
FU
/cm
2
fluence (KJ/m2)
stainless steel PTFE
Chapter 5. Effectiveness of Chemical Sanitizers and Pulsed Light for the Inactivation
of Listeria monocytogenes and Pseudomonas fluorescens Biofilms
110
on which the biofilm is formed, or to possible different amounts of EPS secreted by the cells on the different
materials. Woodling and Moraru (2007) evidenced that the rougher surfaces can protect biofilm cells from
the effect of pulsed light holding and “hiding” them inside the micro-cracks. The most effective treatment,
with reductions of viable counts higher than 3 Log CFU/cm2 on stainless steel and PTFE, was obtained for
the nearest distance and 1 pulse (p<0.05). However, after the treatment, still alive cells were present. Thus,
for the following tests the treatments were performed against L. monocytogenes and P. fluorescens biofilms
at the nearest distance with increased numbers of pulses, corresponding to fluence values of 18, 36 and 54
KJ/m2 (for 1, 2, and 3 pulses respectively).
Both for L. monocytogenes and P. fluorescens biofilms, an increased number of pulses caused a
higher inactivation of the cells (Figure 5.2 and Figure 5.3). In particular, for L. monocytogenes a fluence of
54 KJ/m2 caused a significantly higher inactivation than 18 and 36 KJ/m2 (p<0.05), while for P. fluorescens
a fluence of 36 KJ/m2 were already sufficient to allow a significantly higher inactivation than 18 KJ/m2
(p<0.05)
Figure 5.2 PL inactivation (mean Log CFU/cm2 ± SD; n=2) of L. monocytogenes Lm_284 biofilms as affected by the number of pulses at the nearest distance
Also for fluence values higher than 18 KJ/m2 the inactivation of L. monocytogenes was higher on
biofilms formed on PTFE than stainless steel for treatments with fluence of 18 and 36 KJ/m2 (p<0.05). The
most antimicrobial effect was observed just after the first pulse. In fact, in the case of PTFE the difference
between the initial count and the viable count after the treatment was 4.79 Log CFU/cm2 (p<0.05). How-
ever, increasing the number of pulses up to 3, only a minimal improvement in the efficacy of the treatment
was observed. For stainless steel, the highest inactivation was observed for fluence values of 54 KJ/m2,
even if for 18 KJ/m2 the reduction was already 3.97 Log CFU/cm2.
0
1
2
3
4
5
6
control 18 36 54
Log C
FU
/cm
2
fluence (KJ/m2)
stainless steel PTFE
Chapter 5. Effectiveness of Chemical Sanitizers and Pulsed Light for the Inactivation
of Listeria monocytogenes and Pseudomonas fluorescens Biofilms
111
Figure 5.3 PL inactivation (mean Log CFU/cm2 ± SD; n=2) of P. fluorescens Ps_019 biofilms as affected by the number of pulses at the nearest distance
P. fluorescens Ps_019 biofilms were more resistant than L. monocytogenes Lm_284 to PL treat-
mens for the lowest fluence values (p<0.05). This result is in contrast with the observation of Anderson et
al. (2000), who showed that the Gram-positive bacteria are more resistant than Gram-negative to this type
of treatment. Farrell et al. (2010) observed that P. aeruginosa showed some resistance to PL related to the
production of coloured pigments (pyocyanin and pyoverdin), as these pigments were able to absorb the
wavelengths corresponding to the region of the germicidal UV light.
From the data it is possible to observe that PL treatments were able to produce a strong antimicro-
bial effect on L. monocytogenes and P. fluorescens biofilms formed on different materials. As observed by
Woodling and Moraru (2005) the PL treatment might induce a sub-lethal damage on microbial biofilms,
which the cells are able to overcome after a revitalization step in a nutrient rich medium. In the conditions
used in this study, it was not possible to evidence a sub-lethal damage of the biofilm cells as the microbio-
logical counting technique always allowed to obtain a countable number of colonies on agar plates. In any
case, the use of PL is promising for a hurdle approach, in which any surviving damaged cells are then
inactivated by other treatments. For example, it is conceivable to obtain an almost total biofilm cell inacti-
vation effect using one pulse followed by a treatment with a chemical disinfectant used at a low concentra-
tion.
The use of PL at low fluence values (18 KJ/m2) has not been able to cause a complete inactivation
of the biofilms, so it does not seem feasible to use this technology to sanitize the surfaces of the production
areas at the end of the day. However, in some processing sites a lower rate of inactivation is still sufficient
to control the risk of cross contamination. For example, the use of the PL treatment on conveyor belts during
the production cycle would be conceivable, so as to minimize the risk of formation of biofilm, which is
well documented in many industries (Somers and Wong, 2004).
0
1
2
3
4
5
6
control 18 36 54
Log C
FU
/cm
2
fluence (KJ/m2)
stainless steel PTFE
Chapter 5. Effectiveness of Chemical Sanitizers and Pulsed Light for the Inactivation
of Listeria monocytogenes and Pseudomonas fluorescens Biofilms
112
5.4 CONCLUSIONS
In this study the effects of chemical and physical treatments on L. monocytogenes and P. fluo-
rescens biofilms formed in dynamic culture conditions and on two types of material were evaluated. From
the results it was possible to observe how the environmental conditions in which biofilms were formed
influenced their sensitivity to the individual treatment. In fact, the surface material on which biofilms were
formed might affect their sensitivity to treatment, probably due to a different production of EPS substances
by the cells.
A comparison between chemical and physical treatments shows that some chemical products used
for disinfection in the food industries are not effective in inactivating the biofilm cells, and unexpectedly
the products usually used for inactivating biofilms are not the most effective. The treatments made with PL
showed that this strategy proved to be very promising, since also at the lowest applied fluence a strong
inactivation of viable counts on stainless steel and PTFE was observed. Although survivor cells are present,
the PL treatments can be useful for the surface decontamination of equipment, for example conveyor belts,
during the production cycle. Moreover, thanks to the ability of this technology to inactivate or damage the
cells at a sub-lethal level, a treatment with PL might precede treatment with biocides applied at lower con-
centrations and for a shorter time than the routine uses, allowing a significant reduction of the risk for
operators and environmental damage. It is possible that the use of these techniques in a unique strategy for
the control of biofilm is able to guarantee the solution to problems of health and hygiene in the production
of foodstuffs.
5.5 REFERENCES
Allison, D.G, Ruiz, B., SanJose, C., Jaspe, A., Gilbert, P. 1998. Extracellular products as mediators of the formation and detachment of Pseudomonas fluorescens biofilms. FEMS Microbiol Lett 167, 179-184
Andersen, B.M., Bånrud, H., Bøe, E., Bjordal, O., Drangsholt, F. 2006. Comparison of UV C light and chemicals for disinfection of surfaces in hospital isolation units. Infect Cont Hosp Ep 27, 729-734
Anderson, J.G., Rowan, N.J., MacGregor, S.J., Fouracre, R.A., Farish, O. 2000. Inactivation of food-borne enteropathogenic bac-teria and spoilage fungi using pulsed light. IEEE T Plasma Sci 28, 83-88
Chapman, J.S. 2003. Disinfectant resistance mechanisms, cross-resistance, and co-resistance. Int Biodeter Biodegr 51, 271-276
Chen, X., Stewart, P.S. 1996. Chlorine penetration into artificial biofilm is limited by a reaction-diffusion interaction. Environ Sci Technol 30, 2078-2083
Chmielewski, R.A.N., Frank, J. F. 2003. Biofilm formation and control in food processing facilities. Compr Rev Food Sci Food Safety 2, 22-32
Cunliffe, D., Smart, C. A., Alexander, C., Vulfson, E.N. 1999. Bacterial adhesion at synthetic surfaces. Appl Environ Microbiol 65, 4995-5002
Farrell, H.P., Garvey, M., Cormican, M., Laffrey, J.G., Rowan, N.J. 2010. Investigation of critical inter-related factors affecting the efficacy of pulsed light for inactivating clinically relevant bacterial pathogens. J Appl Microbiol 108, 1484-1508
Frank, J.F., Koffi, R.A. 1990. Surface-adherent growth of Listeria monocytogenes is associated with increased resistance to sur-factant sanitizers and heat. J Food Protect 53, 550-554
Gibson, H., Taylor, J.H., Hall, K.E., Holah, J.T. 1999. Effectiveness of cleaning techniques used in the food industry in terms of the removal of bacterial biofilms. J Appl Microbiol 8, 41-48
Gomez-Lopez, V.M., Devlieghere, F., Bonduelle, V., Debevere, J. 2005. Intense light pulses decontamination of minimally pro-cessed vegetables and their shelf-life. Int J Food Microbiol 103, 79-89
Chapter 5. Effectiveness of Chemical Sanitizers and Pulsed Light for the Inactivation
of Listeria monocytogenes and Pseudomonas fluorescens Biofilms
113
Gómez-López, V.M., Ragaert, P., Debevere, J., Devlieghere, F. 2007. Pulsed light for food decontamination: a review. Trends Food Sci Technol 18, 464-473
Høibye, L., Clauson-Kaas, J., Wenzel, H., Larsen, H.F., Jacobsen, B.N., Dalgaard, O. 2008. Sustainability assessment of advanced wastewater treatment technologies. Water Sci Technol 58, 963-968
Mosteller, T.M., Bishop, J.R. 1993. Sanitizer efficacy against attached bacteria in a milk biofilm. J Food Protect 56, 34-41
Norwood, D.E., Gilmour, A. 2000. The growth and resistance to sodium hypochlorite of Listeria monocytogenes in a steady‐state multispecies biofilm. J Appl Microbiol 88, 512-520
Rastogi, V.K., Wallace, L., Smith, L.S. 2007. Disinfection of Acinetobacter baumannii-contaminated surfaces relevant to medical treatment facilities with ultraviolet C light. Mil Med 172, 1166-1169
Sauer, K., Camper, A.K. 2001. Characterization of phenotypic changes in Pseudomonas putida in response to surface-associated growth. J Bacteriol 183, 6579-6589
Smoot, L.M., Pierson, M.D. 1998. Effect of environmental stress on the ability of Listeria monocytogenes Scott A to attach to food contact surfaces. J Food Protect 61, 1293-1298
Somers, E.B., Wong, A.C.L. 2004. Efficacy of two cleaning and sanitizing combinations on Listeria monocytogenes biofilms formed at low temperature on a variety of materials in the presence of ready-to-eat meat residue. J Food Protect 67, 2218-2229
Sommers, C.H., Cooke, P.H., Fan, X., Sites, J.E. 2009. Ultraviolet light (254 nm) inactivation of Listeria monocytogenes on frank-furters that contain potassium lactate and sodium diacetate. J Food Sci 74, M114-M119
Stepanović, S., Vuković, D., Dakić, I., Savić, B., Švabić-Vlahović, M. 2000. A modified microtiter-plate test for quantification of staphylococcal biofilm formation. J Microbiol Meth 40, 175-179
Wirtanen, G., Salo, S. 2003. Disinfection in food processing–efficacy testing of disinfectants. Rev Environ Sci Biotechnol 2, 293-306
Woodling, S.E., Moraru, C.I. 2005. Influence of surface topography on the effectiveness of pulsed light treatment for the inactiva-tion of Listeria innocua on stainless‐steel surfaces. J Food Sci 70, M45-M351.
114
Chapter 6. SUSCEPTIBILITY OF MICROBIAL BIOFILMS TO
ENZYMATIC TREATMENTS
Chapter 6. Susceptibility of Microbial Biofilms to Enzymatic Treatments
115
6.1 INTRODUCTION
There are several strategies for biofilm removal that may be applied to food processing environ-
ments. The most widely used approach is the application of biocides and disinfectants, like hypochlorite,
peroxyacetic acid and quaternary ammonium compounds. However, the increased biofilm resistance to
conventional chemical treatments enhances the need to resort to alternative control strategies. An attractive
alternative to conventional chemical methods of sanitation processes is represented by the use of enzyme-
based detergents, also known as “green chemicals”. As a matter of fact, enzymes can be used for degrada-
tion of biofilm, although a mixture of enzyme activities may be necessary for a sufficient degradation of
bacterial biofilm, due to the heterogeneity of the extracellular polysaccharides in the biofilm (Sutherland,
1995). Promoting detachment is one of the least investigated possible strategies to remove biofilms. The
use of substances to induce biofilm removal by directly destroying the physical integrity of the biofilm
matrix represents an attractive alternative for food industrial applications, where complete biofilm removal
is essential. This approach has also the advantage of reducing reliance on inherently toxic antimicrobial
agents, whose continued use is fundamentally at odds with the trend towards increasingly restrictive envi-
ronmental regulations (Chen and Stewart, 2000). Augustin et al. (2004) demonstrated the efficacy of enzy-
matic cleaning products against biofilms formed by microorganisms commonly found in dairy products,
concluding that these products may be useful for inactivating biofilms produced in milk and other lipid
food residues that may remain after poor cleaning in many industrial types of equipment. Oulahal-Lagsir
et al. (2003) found interesting results when synergistically applying ultrasonic waves and proteolytic and
glycolytic enzymes against stainless steel biofilm cells of Escherichia coli developed with milk. Proteinase
disinfectants showed a good effect against P. aeruginosa biofilms, even if the performances of the disin-
fectants was reduced in presence of organic residues such as milk (Augustin and Ali-Vehmas, 2004). Am-
ylases are another type of enzyme widely used in the formulation of enzyme detergents, mainly for food
residue removal of starch-based foods. An α-amylase showed to be very efficient in removing P. fluo-
rescens biofilms from stainless steel (Lequette et al., 2010). At any rate, in each formulation there must be
either both protease and enzymes that break down carbohydrates, due to the heterogeneity of the matrix
(Meyer, 2003). Currently the use of enzymes as an alternative to chemical disinfectants is still limited due
to the expensive process to produce commercial formulations of enzymes compared with the low costs of
the chemicals, as technology and production of enzyme-based detergents are mostly patent-protected.
The aim of this study was to analyze the effectiveness of commercially available enzymes in re-
moving biofilms formed by L. monocytogenes, S. aureus and P. fluorescens. Three enzymatic products
were tested against L. monocytogenes, S. aureus and P. fluorescens biofilms preformed on microtiter plates
under different concentration and temperature conditions. Then, the most performing enzymatic product
was tested for removing L. monocytogenes, S. aureus and P. fluorescens biofilms preformed under dynamic
flow condition on stainless steel AISI 304 and PTFE coupons.
Chapter 6. Susceptibility of Microbial Biofilms to Enzymatic Treatments
116
6.2 MATERIALS AND METHODS
6.2.1 Biofilm formation on polystyrene microtiter plates and quantification by using
the crystal violet assay
L. monocytogenes Lm_284 (moderately adherent according to Stepanović et al., 2000; see para-
graph 2.2.1), S. aureus St_059 (strongly adherent) and P .fluorescens Ps_019 (strongly adherent) were used
in this study (see List of Strains). The biofilm production assay was performed in three biological replicates
in 96-well polystyrene flat bottom microtiter plates, as described in paragraph 2.2.1. Briefly, eight wells of
each microplate were filled with 200 µL of Tryptone Soya Broth (TSB, Oxoid, Milan, Italy) and inoculated
with 10 µL of each overnight culture (~ 108 CFU/mL). The microtiter plates were incubated for seven days
at 37 °C for L. monocytogenes and S. aureus and 30 °C for P. fluorescens. Every 48 h the microtiter plates
were subjected to a refreshing, i.e. the replacement of 150 µL of exhausted broth with an equal volume of
fresh broth. For each experiment, eight wells were used as negative controls and filled with 200 µL of TSB
not inoculated. At the end of the incubation, the microtiter plates were rinsed and stained as described in
paragraph 2.2.1.
6.2.2 Enzymatic products
The enzymatic products used in this study were: PecP (a mixture of pectinase, polygalacturonase
and pectinmetylesterase isolated from Aspergillus niger; Topt 40 °C, Trange 20-70 °C; pHopt 4.2, pHrange 2.4-
5.2; industrial use: apple and pear juice clarification by ultrafiltration), CelA (a mixture of cellulase and
hemicellulase isolated from Aspergillus niger; Topt 45 °C, Trange 20-60 °C; pHopt 3.85, pHrange 3.2-4.7; indus-
trial use: viscosity reduction and hydrolysis of substrates containing cellulose and pectins), and CelT (mix-
ture of cellulases isolated from Trichoderma reesei; Topt 50 °C, Trange 20-70 °C; pHopt 4.8, pHrange 4.5-6.5;
industrial use: modification and digestion of carbohydrates, such as cellulose, hemicellulose and ß-glucans).
6.2.3 Enzymatic treatment of biofilms developed in microtiter plates
After incubation, the biofilm growth medium was gently removed and each well was washed three
times with sterile saline (paragraph 2.2.1). Then for each treatment eight wells were filled with 200 µL of
enzyme solution dissolved in acetate buffer at pH 4. The treatment were performed at 25 and 37 °C at
different contact times (15, 30 and 50 min) and concentrations of the enzymatic product (1% and 2%). In
order to highlight a possible non-enzymatic action in removing biofilm, biofilms were also treated with 200
µL of acetate buffer and 200 µL of sterile water. At the end of the treatments, each well was washed with
200 µL of sterile saline and stained with crystal violet according to the procedure previously described
(paragraph 2.2.1). Each trial was performed in triplicate.
Chapter 6. Susceptibility of Microbial Biofilms to Enzymatic Treatments
117
6.2.4 Formation of biofilms developed on stainless steel and PTFE coupons
Biofilms were grown in triplicate in Luria Bertani broth (LB, Oxoid, Milan, Italy) in CDC Biofilm
Reactor (CBR) on stainless steel AISI 304 and PTFE coupons (paragraph 2.2.2). Biofilm growth was per-
formed for 48 h under dynamic conditions in batch with rotation of the magnet to 125 rpm at 20 °C. Each
experiment was repeated three times for each strain.
6.2.5 Enzymatic treatment of biofilms developed on stainless steel and PTFE cou-
pons
After incubation the coupons were removed from each rods of the CBR and subjected to rinsing,
as described in paragraph 2.2.2. Subsequently, the coupons were immersed in 5 mL of a 1% enzymatic
product for 15, 30 and 50 min at 18 °C. Afterward, the coupons were rinsed with 5 mL of a sterile saline
solution and subjected to microbiological analysis, as described in paragraph 2.2.2. For each treatment, two
coupons for each material were used as a control and treated at the above conditions with 5 mL of sterile
saline solution. Viable counts were estimated on BHI agar plates using the drop plate method (paragraph
2.2.3). Plates were incubated for 48 h at 37 °C for L. monocytogenes and S. aureus and at 30 °C for P.
fluorescens.
6.2.6 Statistical analysis
The data were statistically analysed using the analysis of variance and the means separated accord-
ing to Tukey’s HSD test with a significant level (p value) of 0.05 using Statistica 8.0 software (StatSoft,
Tulsa, Oklahoma, USA).
6.3 RESULTS AND DISCUSSION
The presence of bacterial biofilms in food processing lines is of great concern for the food industry.
Chemical products are commonly used in cleaning procedures for removing biofilms. However, in some
cases, these procedures are not always sufficient for removing cells and EPS of biofilms. Moreover, it is
well known that microbial biofilms can acquire a resistance to physical and chemical treatments applied
during sanitizing operations (Chmielewski and Frank, 2003). For these reasons, the enzymatic approach to
the removal of biofilms, mostly based on the destabilization of the EPS matrix, can be a possible choice
when traditional sanitizing protocols do not give satisfactory results in terms of biofilm eradication. In
addition, in industrial applications, this approach would also have the advantage of reducing reliance on
inherently toxic antimicrobial agents, whose continued use is in conflict with the trend towards increasingly
restrictive environmental regulations (Chen and Stewart, 2000).
Because biofilm EPS is typically composed of diverse substances, mostly polysaccharides (Flem-
ming and Wingender, 2001), three different commercial enzymatic products were used in this study. In a
Chapter 6. Susceptibility of Microbial Biofilms to Enzymatic Treatments
118
preliminary study, the enzymatic mixtures were used at different working conditions of temperature, con-
centration and contact times, to remove L. monocytogenes, S. aureus and P. fluorescens biofilms grown on
microtiter plates. In fact, it is well known that the ideal sanitization protocol for the food industry is the one
that requires the concentrations of the active substance to be as low as possible, shorter times and the work-
ing conditions (eg. operating temperatures) closer to room temperature.
Before screening enzyme products for biofilm removal, the influence of sterile deionized water and
acetate buffer at pH 4, which is the buffer in which the enzyme preparations were dissolved, was first tested
in removing biofilms The values of OD570 of biofilms treated with water and acetate buffer were similar to
control wells (p>0.05). In fact, p values were 0.775454, 0.809875 and 0.797758 for Lm_284, St_059 and
Ps_019, respectively. Therefore neither water nor acidic buffer were efficient in removing biofilms (Figure
6.1), and each difference of OD570 evidenced in the following stages of the study was attributed to the action
of the enzymatic products.
Figure 6.1 Biofilm biomass (mean OD570 ± SD; n=3) of (a) L. monocytogenes Lm_284, (b) S. aureus St_059 and (c) P. fluo-
rescens Ps_019 on polystyrene treated with water and acetate buffer; coloured markers are for raw data, line for mean data
In Table 6.1 the results obtained for L. monocytogenes treated at 25 °C and 37 °C with enzymatic
products are reported. The performance of enzyme mixtures in removing biofilms was evaluated through
the calculation of the Percentage Reduction Index (PRI), which estimates the percentage of absorbance
control W - 25 °C W - 37 °C pH 4 - 25 °C pH 4 - 37 °C0.66
0.68
0.70
0.72
0.74
0.76
0.78
0.80
0.82
OD
570
a)
control W - 25 °C W - 37 °C pH 4 - 25 °C pH 4 - 37 °C0.66
0.68
0.70
0.72
0.74
0.76
0.78
0.80
0.82
OD
570
control W - 25 °C W - 37 °C pH 4 - 25 °C pH 4 - 37 °C0.66
0.68
0.70
0.72
0.74
0.76
0.78
0.80
0.82
OD
570
a)
control W - 25 °C W - 37 °C pH 4 - 25 °C pH 4 - 37 °C0.90
0.92
0.94
0.96
0.98
1.00
1.02
1.04
1.06
OD
57
0
b)
control W - 25 °C W - 37 °C pH 4 - 25 °C pH 4 - 37 °C0.90
0.92
0.94
0.96
0.98
1.00
1.02
1.04
1.06
OD
57
0
b)
c)
control W - 25 °C W - 37 °C pH 4 - 25 °C pH 4 - 37 °C1.00
1.10
1.20
1.30
1.40
1.50
1.60
OD
57
0
c)
control W - 25 °C W - 37 °C pH 4 - 25 °C pH 4 - 37 °C1.00
1.10
1.20
1.30
1.40
1.50
1.60
OD
57
0
Chapter 6. Susceptibility of Microbial Biofilms to Enzymatic Treatments
119
values (OD570) in treated wells in comparison to the OD570 value of the control (Pitts et al., 2003). In par-
ticular, the removal was considered total if PRI>70%, and only partial if 30%<PRI<70%. All treatments
applied at 25 °C were effective in the removal of preformed biofilm (p<0.05), and in several conditions the
removal was total (PRI>70%). In particular, the treatment with PecP and CelA allowed higher biofilm
removal (p<0.05), regardless of the concentration used. The product CelT was effective in all cases at 25
°C, even though the amount of microbial biomass removed was lower compared to PecP and CelA (p<0.05).
Chapter 6. Susceptibility of Microbial Biofilms to Enzymatic Treatments
120
Table 6.1 Biofilm biomass (mean OD570 ± SD; n=3) for L. monocytogenes Lm_284 after enzymatic treatments; mean values with a different letter within the same temperature treatment indicate statistically different values (p<0.05). The means in bold refer to a total removal of biofilm (PRI> 70%)
L. monocytogenes Lm_284
temperature enzymatic product
treatment concentration OD570nm
25 °C PecP control 0.744a ± 0.026 15 min 1% 0.061e ± 0.050 30 min 0.068e ± 0.080 50 min 0.105d ± 0.012 15 min 2% 0.069e ± 0.012 30 min 0.090de ± 0.011 50 min 0.061e ± 0.016 CelA 15 min 1% 0.152c ± 0.014 30 min 0.159c ± 0.017 50 min 0.180c ± 0.019 15 min 2% 0.152c ± 0.015 30 min 0.156c ± 0.013 50 min 0.142c ± 0.018 CelT 15 min 1% 0.141c ± 0.017 30 min 0.103d ± 0.011 50 min 0.125dc ± 0.012 15 min 2% 0.239b ± 0.018 30 min 0.270b ± 0.023
50 min 0.260b ± 0.027 37 °C PecP control 0.728a ± 0.027 15 min 1% 0.093c ± 0.009 30 min 0.071cd ± 0.008 50 min 0.052d ± 0.008 15 min 2% 0.102c ± 0.013 30 min 0.085c ± 0.013 50 min 0.039d ± 0.007 CelA 15 min 1% 0.254b ± 0.016 30 min 0.248b ± 0.014 50 min 0.194b ± 0.009 15 min 2% 0.193b ± 0.012 30 min 0.237b ± 0.013 50 min 0.125c ± 0.018 CelT 15 min 1% 0.282b ± 0.017 30 min 0.252b ± 0.011 50 min 0.232b ± 0.018 15 min 2% 0.230b ± 0.008 30 min 0.226b ± 0.023 50 min 0.101c ± 0.027
Enzymatic product CelT, at 25 ° C and at a concentration of 2%, unexpectedly allowed to remove
biofilm less than the concentration of 1% (p<0.05), regardless of the time of contact; this phenomenon was
not observed in the samples treated at 37 °C. One possible explanation for this observation could be a
temperature-dependent conformational change of one or more enzymes in the CelT mixture, which could
reduce the enzyme activity in the presence of high concentrations of substrate (Petsko and Ringe, 2004).
As regards the test carried out at 37 ° C, the performances of the three enzymatic mixtures were different.
While PecP was able to almost completely remove biofilm of L. monocytogenes regardless of concentration
and contact time, the effectiveness of CelA and CelT was lower (p<0.05). The increase of the contact time
up to 50 min in some cases allowed an almost total elimination of the biofilm. The activity of the most
effective enzyme mixture (PecP) was found to be similar regardless of the temperature tested (p>0.05),
Chapter 6. Susceptibility of Microbial Biofilms to Enzymatic Treatments
121
although the technical file indicates an optimal temperature of 40 °C. This apparent independence of effec-
tiveness on the temperature can be explained by the fact that the commercial specifications refer to the
action of clarification of fruit juices, while in the case of biofilms the EPS composition could make the
enzymatic activity of the mixture less sensitive to temperature.
Also S. aureus biofilms were susceptible to removal by enzymatic products. Even for this micro-
organism, the more effective mixture was PecP, which at concentration of 2%, irrespective of the contact
time, allowed an almost total removal of biofilm (Table 6.2). Similar results were obtained for the mixture
CelT at 1% for the longer contact times and at 2% for all of contact times.
Table 6.2 Biofilm biomass (mean OD570 ± SD; n=3) for S. aureus St_059 after enzymatic treatments; mean values with a different letter within the same temperature treatment indicate statistically different values (p<0.05). The means in bold refer to a total removal of biofilm (PRI> 70%)
S. aureus St_059
temperature enzymatic product
treatment concentration OD570nm
25 °C PecP control 0.954a ± 0.031 15 min 1% 0.378b ± 0.015 30 min 0.306c ± 0.008 50 min 0.348b ± 0.012 15 min 2% 0.160e ± 0.012 30 min 0.172e ± 0.011 50 min 0.156e ± 0.016 CelA 15 min 1% 0.366b ± 0.012 30 min 0.414b ± 0.027 50 min 0.308c ± 0.009 15 min 2% 0.294c ± 0.015 30 min 0.337b ± 0.013 50 min 0.277c ± 0.018 CelT 15 min 1% 0.325c ± 0.011 30 min 0.447b ± 0.021 50 min 0.234d ± 0.012 15 min 2% 0.253d ± 0.018 30 min 0.212d ± 0.018 50 min 0.223d ± 0.013 37 °C PecP control 0.978a ± 0.018 15 min 1% 0.243f ± 0.015 30 min 0.079g ± 0.008 50 min 0.094g ± 0.012 15 min 2% 0.242f ± 0.012 30 min 0.105g ± 0.011 50 min 0.130g ± 0.016 CelA 15 min 1% 0.447d ± 0.012 30 min 0.405d ± 0.027 50 min 0.350de ± 0.029 15 min 2% 0.557c ± 0.015 30 min 0.314e ± 0.013 50 min 0.303e ± 0.018 CelT 15 min 1% 0.639b ± 0.011 30 min 0.414d ± 0.021 50 min 0.464d ± 0.012 15 min 2% 0.526c ± 0.018 30 min 0.267ef ± 0.018 50 min 0.270ef ± 0.013
The test carried out on S. aureus biofilms treated with enzyme mixtures at a temperature of 37 ° C
showed a greater sensitivity of biofilms compared to 25 °C (p<0.05). Indeed, PecP at 1% concentration
Chapter 6. Susceptibility of Microbial Biofilms to Enzymatic Treatments
122
allowed an almost total removal of biofilm, as well as CelT at concentration of 2% for a long time. This
result could be attributed to the temperature dependence of the enzymatic activity, which could promote,
for some mixtures, a better biofilm removal.
Regarding P. fluorescens, preformed biofilms were susceptible to the enzymatic removal , even if
the performances of the three enzymatic preparations were different. Also for this microorganism the more
effective mixture was PecP, which at both concentration and temperature, irrespective of the contact time,
allowed a total removal of biofilm (Table 6.3). The products CelA and CelT were effective (p<0.05) only
at the higher concentration and at 25 °C, while at 37 °C they were effective (p<0.05) only when the contact
time increased up to 50 min.
Table 6.3 Biofilm biomass (mean OD570 ± SD; n=3) for P. fluorescens Ps_019 after enzymatic treatments; mean values with a different letter within the same temperature treatment indicate statistically different values (p<0.05). The means in bold refer to a total removal of biofilm (PRI> 70%)
P. fluorescens Ps_019
temperature enzymatic product treatment concentration OD570nm 25 °C PecP control 1.280a ± 0.013 15 min 1% 0.214h ± 0.005 30 min 0.202h ± 0.008 50 min 0.142i ± 0.012 15 min 2% 0.123il ± 0.012 30 min 0.090l ± 0.011 50 min 0. 081l ± 0.016 CelA 15 min 1% 0.561b ± 0.014 30 min 0.521bc ± 0.017 50 min 0.510cd ± 0.019 15 min 2% 0.382f ± 0.015 30 min 0.380f ± 0.013 50 min 0.350fg ± 0.018 CelT 15 min 1% 0.485cde ± 0.017 30 min 0.472de ± 0.011 50 min 0.463e ± 0.012 15 min 2% 0.321g ± 0.018
30 min 0.318g ± 0.017
50 min 0.312g ± 0.015
37 °C PecP control 1.320a ± 0.016 15 min 1% 0.200g ± 0.013 30 min 0.198gh ± 0.013 50 min 0.157h ± 0.007 15 min 2% 0.185gh ± 0.013 30 min 0.174gh ± 0.013 50 min 0.168h ± 0.007 CelA 15 min 1% 0.692b ± 0.016 30 min 0.651b ± 0.014 50 min 0.634bc ± 0.009 15 min 2% 0.581c ± 0.012 30 min 0.463e ± 0.013 50 min 0.380f ± 0.018 CelT 15 min 1% 0.521cd ± 0.017 30 min 0.518cd ± 0.011 50 min 0.515cd ± 0.018 15 min 2% 0.520cd ± 0.008 30 min 0.503d ± 0.023 50 min 0.378f ± 0.027
According to the results of the preliminary screening, the most performing enzymatic product ap-
peared to be PecP, a mixture of pectinase, polygalacturonase and pectinmetylesterase. Different sensitivities
Chapter 6. Susceptibility of Microbial Biofilms to Enzymatic Treatments
123
observed between strains could be due to differences in biofilm composition in terms of EPS and microbial
cell quantity. It is well known that the amount and composition of EPS are dependent on cultural conditions
as well as on microbial species (O'Toole et al., 2000; Flemming et al., 2007). In addition, S. aureus and P.
fluorescens strains produces higher amounts of biofilm than L. monocytogenes (p <0.05), which could jus-
tify a different sensitivity to enzymatic treatments.
In agreement with the above results, the enzymatic product PecP was chosen to be tested against
biofilms formed in dynamic conditions on stainless steel AISI 304 and PTFE surfaces by L. monocytogenes,
S. aureus and P. fluorescens. Biofilms were grown in the CDC Biofilm Reactor (CBR), which allows the
formation of biofilms on a high number of surfaces under standardized conditions. In this test biofilms were
grown in a nutrient-poor culture medium (LB) and in stirring conditions, to simulate both a stress of nutri-
tional nature and one of a mechanical nature. These stresses may commonly occur on the surfaces in the
food industry, for example in the presence of small amounts of organic residues or in flow conditions that
occur in closed vessels, in which the liquid product is subjected to stirring. In Table 6.4 the viable counts
of microbial biofilms formed on stainless steel and PTFE surfaces are reported.
Table 6.4 Viable counts (Log CFU/cm2) ± SD of biofilms formed by L. monocytogenes Lm_284, S. aureus St_059 and P. fluo-
rescens Ps_019 on stainless steel and PTFE surfaces. Different letters within each row indicate statistically different means (p<0.05)
strain stainless steel PTFE
L. monocytogenes Lm_284 4.58b ± 0.08 5.22a ± 0.08
S. aureus St_059 6.73b ± 0.18 7.60a ± 0.11
P. fluorescens Ps_019 5.37a ± 0.06 5.69a ± 0.28
The biofilm viable counts of L. monocytogenes varied between 4.58 and 5.22 Log CFU/cm2, with
the highest adhesion on PTFE surface compared to stainless steel (p<0.05). As showed by Møretro and
Langsrud (2004), the maximum adhered cell concentration (Log CFU/cm2) of L. monocytogenes can vary
from 3.6 to 8.5, depending on the strain, the culture medium, the time and temperature of incubation, as
well as the type of surface. Regarding this parameter, stainless steel and PTFE differ for their hydrophobi-
city, as stainless steel is hydrophilic, while PTFE is hydrophobic. These characteristics strongly influence
the interactions between the outside of the microbial cell and the surface on which the cell adheres. The
literature reports rather contradictory data, since the behaviour of the isolates of L. monocytogenes on these
surfaces can be very variable. Although it is difficult to compare the results of different experiments, the
type of material strongly influences microbial adhesion and biofilm formation by L. monocytogenes. This
consideration is particularly important when planning the use of different materials in food processing
plants. The biofilm counts of S. aureus varied between 6.73 and 7.60 Log CFU/cm2, which are comparable
to values found by other authors (Rushdy and Othman, 2011). An influence of the surface in biofilm form-
ing ability of St_059 was found (p<0.05), as observed for Lm_284, probably correlated to the hydrophobic
characteristics of this material (da Silva Meira et al., 2012). These results are in agreement with Cerca et
al. (2005), according to whom adhesion of bacteria belonging to Staphylococcus genus to hydrophobic
Chapter 6. Susceptibility of Microbial Biofilms to Enzymatic Treatments
124
substrata occurred to a greater extent than to hydrophilic surfaces. Regarding P. fluorescens Ps_019, the
surface colonization ranged between 5.37 and 5.69 Log CFU/cm2, with values comparable to the few data
available in the literature for this microbial species (Sillankorva et al., 2008). For this strain no significant
effects on biofilm formation ability by surface materials were found. Likewise, not-aeruginosa Pseudomo-
nas species seem to be able to adhere to and colonize various surfaces, probably thanks to their ability to
produce a rather dense EPS matrix, which fixes the biofilm to the surface (Simões et al., 2008).
The results of the treatment of biofilms with PecP are shown in Figure 6.2 and in Figure 6.3.
Figure 6.2 Reduction (mean -Log (Nt/N0) ± SD; n=3) of viable counts in biofilms formed by L. monocytogenes Lm_284, S. au-
reus St_059 and P. fluorescens Ps_019 on stainless steel after treatment with PecP
Figure 6.3 Reduction (mean -Log (Nt/N0) ± SD; n=3) of viable counts in biofilms formed by L. monocytogenes Lm_284, S. au-
reus St_059 and P. fluorescens Ps_019 on PTFE after treatment with PecP
The efficacy of the enzyme treatment with the product PecP was differently affected by the treat-
ment time, the type of microorganism and the surface on which the biofilms were formed. After 15 min it
is possible to observe a certain action in removing biofilms, even if with the longer contact time most
0.0
0.2
0.4
0.6
0.8
1.0
1.2
1.4
1.6
15 30 50
-Log (
Nt/
N0)
min
L. monocytogenes Lm_284 S. aureus St_059 P. fluorescens Ps_019
0.0
0.2
0.4
0.6
0.8
1.0
1.2
1.4
1.6
15 30 50
-Log
(N
t/N
0)
min
L. monocytogenes Lm_284 S. aureus St_059 P. fluorescens Ps_019
Chapter 6. Susceptibility of Microbial Biofilms to Enzymatic Treatments
125
biofilm detachments were obtained. These results are in agreement with the few data present in the litera-
ture, according to which the enzyme mixtures, containing enzymes active towards saccharidic components,
are able to reduce the number of biofilm cells, depending on the type of microorganism, disaggregating the
EPS matrix (Johansen et al., 1997). The best performances of enzymatic preparation PecP were observed
on biofilms formed on stainless steel compared to those formed on PTFE, probably due to a different EPS
composition of biofilms on different surface materials (Chaignon et al., 2007). Moreover, the greater Log
reductions were obtained treating P. fluorescens biofilm, both for biofilms preformed on stainless steel and
on PTFE. Even this result can be explained through variations in the composition of the extracellular poly-
mers in P. fluorescens biofilms compared to those of L. monocytogenes and S. aureus. This result is in
contrast with Johansen et al. (1997), according to which S. aureus biofilms were more sensitive to enzy-
matic removal by enzymes than P. fluorescens, which formed the most resistant biofilm. The more efficient
activity in removing P. fluorescens biofilms was also observed by Lequette et al. (2010), according to which
polysaccharidase-degrading enzymes were effective in detaching P. fluorescens biofilms. Therefore, the
efficacy of enzymes strictly depended on bacterial species EPS matrix. As a matter of fact, the enzyme
product used is a mixture of enzymes that degrade the uronic acids present in the matrix of the biofilm
(pectinmethylesterase, polygalacturonase and endopectinlyase): this kind of approach could cause a desta-
bilization of the EPS matrix, allowing an easier detachment of the biofilm from surfaces. In all the tested
conditions, the biofilm cell removal was less than 2 Log units. However, the data are encouraging, since it
may be a good starting point for the development of more effective enzyme formulations and process con-
ditions. The use of products such as bio-enzymatic cleaners is certainly a “green” approach to solve the
problem of biofilms in the food industry, and may represent an optimal strategy, especially if a mixture of
enzymes capable of degrading the EPS matrix of a heterogeneous group of microorganisms with biofilm
forming ability is used. The enzymatic treatment may also be performed in conjunction with a chemical
strategy carried out at concentrations lower than those commonly used, allowing for a risk reduction both
for the operator and for the environment.
6.4 CONCLUSIONS
The results of this study clearly indicate that the enzymatic treatments were able to partially or
totally remove preformed biofilms of L. monocytogenes, S. aureus and P. fluorescens on polystyrene sur-
faces, even if less efficiently on biofilms formed on stainless steel and PTFE surfaces. The effects of the
concentration, contact time and temperature in removal biofilms were different in function of the tested
strain, and this is probably related to the different composition of the polysaccharide fraction of the EPS of
the strains. Although the biofilm forming ability in food processing plants is well known in L. monocyto-
genes, S. aureus and P. fluorescens, the data relating to the sensitivity of biofilms of these microorganisms
enzymatic treatments are very limited, if not completely missing regarding L. monocytogenes. The results
of this study can represent a first step in the development of non-conventional sanitation strategies for
reducing the risk of cross contamination caused by these microorganisms.
Chapter 6. Susceptibility of Microbial Biofilms to Enzymatic Treatments
126
6.5 REFERENCES
Augustin, M., Ali-Vehmas, T., Atroshi, F. 2004. Assessment of enzymatic cleaning agents and disinfectants against bacterial bio-films. J Pharm Pharm Sci 7, 55-64
Cerca, N., Pier, G. B., Vilanova, M., Oliveira, R., Azeredo, J. 2005. Quantitative analysis of adhesion and biofilm formation on hydrophilic and hydrophobic surfaces of clinical isolates of Staphylococcus epidermidis. Res Microbiol 156, 506-514
Chaignon, P., Sadovskaya, I., Ragunah, C., Ramasubbu, N., Kaplan, J.B., Jabbouri, S. 2007. Susceptibility of staphylococcal bio-films to enzymatic treatments depends on their chemical composition. App Microbiol Biotechnol 75, 125-132
Chen, X., Stewart, P.S. 2000. Biofilm removal caused by chemical treatments. Water Res 34, 4229-4233
Chmielewski R.A.N., Frank J.F. 2003. Biofilm formation and control in food processing facilities. Compr Rev Food Sci Food Safety 2,22-32
da Silva Meira, Q.G., de Medeiros Barbosa, I., Alves Aguiar Athayde, A.J., Pinto de Siqueira Júnior, J., Leite de Souza, E. 2011. Influence of temperature and surface kind on biofilm formation by Staphylococcus aureus from food-contact surfaces and sensi-tivity to sanitizers. Food Control 25, 469-475
Flemming H.C., Neu T.R., Wozniak D.J. 2007. The EPS matrix: the “house of biofilm cells”. J Bacteriol 189, 7945-7947
Flemming H.C., Wingender, J. 2001. Relevance of microbial extracellular polymeric substances (EPSs) – Part I: Structural and ecological aspects. Water Sci Technol 43, 1-8
Johansen C., Falholt P., Gram L. 1997. Enzymatic removal and disinfection of bacterial biofilms. Appl Environ Microbiol 9, 3724-3728
Lequette Y., Boels G., Clarisse M., Faille C. 2010. Using enzymes to remove biofilms of bacterial isolates sampled in the food-industry. Biofouling 26, 421-431
Meyer, B. 2003. Approaches to prevention, removal and killing of biofilms. Int Biodeter Biodegr 51, 249-253
Møretrø, T., Langsrud, S. 2004. Listeria monocytogenes: biofilm formation and persistence in food-processing environments. Bio-films 1, 107-121
O’Toole G., Kaplan H.B., Kolter R. 2000. Biofilm formation as microbial development. Annu Rev Microbiol 54, 49-79
Oulahal, N., Brice, W., Martial, A., Degraeve, P. 2008. Quantitative analysis of survival of Staphylococcus aureus or Listeria
innocua on two types of surfaces: polypropylene and stainless steel in contact with three different dairy products. Food Control 19,178-185
Petsko G.A., Ringe D. 2004. Protein structure and function. New Science Press Ltd, London, Uk.
Pitts B., Hamilton M.A., Zelver N., Stewart P.S. 2003. A microtiter-plate screening method for biofilm disinfection and removal. J Microbiol Meth 54, 269-276
Rushdy, A.A., Othman, A.S. 2011. Bactericidal efficacy of some commercial disinfectants on biofilm on stainless steel surfaces of food equipment. Ann Microbiol 61, 545-552
Sillankorva, S., Neubauer, P., Azeredo, J. 2008. Pseudomonas fluorescens biofilms subjected to phage phiIBB-PF7A BMC Bio-technol 8, 79-90
Simões, M., Simões, L.C., Cleto, S., Pereira, M.O., Vieira, M.J. 2008. The effects of a biocide and a surfactant on the detachment of Pseudomonas fluorescens from glass surfaces. Int J Food Microbiol 121, 335-341
Stepanović, S., Vuković, D., Dakić, I., Savić, B., Švabić-Vlahović, M. 2000. A modified microtiter-plate test for quantification of staphylococcal biofilm formation. J Microbiol Meth 40, 175-179
sp., and Staphylococcus sp.) have previously been detected in drinking water and drinking water systems
(Rickard et al., 2004; September et al., 2007; Lee et al., 2010). The obtained results indicated that among
microbial populations isolated from drinking water distribution systems, a predominance of Gram negative
bacteria was found.
P. gessardii Ps_331, a bacterial species frequently isolated from natural mineral waters (Verhille
et al., 1999), was chosen to perform the following biofilm assays. This strain was classified as a strong
biofilm producer according to Stepanović et al. (2000).
To determine the ability to grow in an oligotrophic environment like drinking water, the planktonic
growth test was performed at three different incubation temperatures (4, 20 and 40 °C).
Figure 7.1 Planktonic growth kinetic (mean Log CFU/cm2 ± SD; n=2) of P. gessardii Ps_331 in drinking water.
According to kinetic results (Figure 7.1), P. gessardii Ps_331 maintained its vitality both at 4 and
20 °C, while at 40 °C the counts were always lower than the detection limit (<10 CFU/mL). In particular,
at 4 and 20 °C P. gessardii microbial cells increased of almost 1 Log in the first days and then remained at
constant viable level reaching the initial inoculum value.
0
1
2
3
4
5
6
7
0 5 10 15 20 25 30 35
Log
CF
U/m
L
time (d)
4 °C 20 °C 40 °C
Chapter 7. Biofilm formation in the Food Field: two case studies
131
The biofilm formation of P. gessardii Ps_331 was performed testing three polypropylene pipes
with different characteristics (pipe A, pipe B and pipe C) at incubation temperatures of 4, 20 and 40 °C.
The biofilm growth was performed for 30 days. Results indicated a difference between pipe A, pipe B and
pipe C, both regarding biofilm formation on inner pipe surfaces and bacterial growth in drinking water in
each pipe. In Figure 7.2 the results obtained from bacterial growth kinetics in drinking water contained in
pipe A (a) and biofilm formation kinetics on the inner pipe A surface (b) of P. gessardii Ps_331 are reported.
Regarding the bacterial growth in drinking water, the results showed that, starting from an inoculum of 5.46
Log/mL, bacterial levels were reduced of 0.5 and 1 Log at 4 and 20 °C respectively, whilst the detection
limit of the microbiological method at 40 °C was reached. Bacterial levels remained at these approximate
values at the three temperatures over the time period of 30 days. Regarding the biofilm formation on the
inner surface of pipe A, biofilms rapidly developed within the pipe. The biofilms levels on the inner pipe
A surface averaged between 3 and 4 Log at 4 °C during the time of 30 days. At 20 °C results showed a
biofilm development delayed as it was formed after 10 days of incubation, reaching a biofilm level of 5.62
Log/cm2 and then decreasing to a average level of 2.73 Log/cm2 during the 20-day period. At 40 °C no
biofilm development on inner pipe A surface was evaluated, as for bacterial growth in drinking water within
this pipe.
Chapter 7. Biofilm formation in the Food Field: two case studies
132
Figure 7.2 Bacterial growth (mean Log CFU/cm2 ± SD; n=2) a) in drinking water in pipe A and (b) on the inner surface of pipe A.
In Figure 7.3 the results obtained from bacterial growth kinetics in drinking water contained in pipe
B (a) and biofilm formation kinetics on the inner pipe B surface (b) of P. gessardii Ps_331 are reported.
Regarding the bacterial growth in drinking water, the results showed that, starting from an inoculum of 5.46
Log/mL, after 30 days of incubation, the bacterial levels remained at the same value for temperatures of 4
and 20 °C, even if there were increasing and decreasing of about 1 Log in each sampling point at both
temperatures. At 40 °C bacterial level decreased to an average value of 3.38 Log/mL in the first days,
reaching values below the detection limit over the remaining days. As regards the biofilm formation on
inner surface of pipe B, even for this pipe, biofilms rapidly developed within the pipe. In particular, biofilm
levels on the inner pipe B surface averaged 3.38 and 3.51 Log/cm2 at the beginning of the sampling at 4
and 20 °C respectively. During a 30-day period, the biofilm levels at both temperatures increased until 5
Log/cm2. At 40 °C no biofilm development on the inner pipe B surface was evaluated, as for the bacterial
growth in drinking water within this pipe.
0
1
2
3
4
5
6
0 5 10 15 20 25 30
Lo
g C
FU
/mL
time (d)
a)
4 °C water 20 °C water 40 °C water
0
1
2
3
4
5
6
0 5 10 15 20 25 30
Lo
g C
FU
/cm
2
time (days)
b)
4 °C biofilm 20 °C biofilm 40 °C biofilm
Chapter 7. Biofilm formation in the Food Field: two case studies
133
Figure 7.3 Bacterial growth (mean Log CFU/cm2 ± SD; n=2) (a) in drinking water in pipe B and (b) on the inner surface of pipe B
In Figure 7.4 the results obtained from bacterial growth kinetics in drinking water contained in pipe
C of P. gessardii Ps_331 are reported. The results showed that, starting from an inoculum of 4.58 Log/mL,
after 30 days of incubation, the bacterial levels decreased in the first 10 days reaching values below the
detection limit for all temperatures, even if at 40 °C the decreasing was already in the first 3 days. As
regards the biofilm formation on the inner surface of pipe C, no biofilm formation was observed there.
0
1
2
3
4
5
6
7
0 5 10 15 20 25 30L
og
CF
U/m
L
time (d)
a)
4 °C water 20 °C water 40 °C water
0
1
2
3
4
5
6
7
0 5 10 15 20 25 30
Lo
g C
FU
/cm
2
time (d)
b)
4 °C biofilm 20 °C biofilm 40 °C biofilm
Chapter 7. Biofilm formation in the Food Field: two case studies
134
Figure 7.4 Bacterial growth (mean Log CFU/cm2 ± SD; n=2) in drinking water in pipe C. No biofilm formation on the inner sur-face was observed
The obtained results showed that the pipe material characteristic considerably influences biofilm
formation. Pipe C supported less bacterial growth and none biofilm formation. As already observed by
Norton and LeChevallier (2000), pipe materials interact with microorganisms influencing both microbial
growth in water and the amount of biofilm development on surface. The results suggest that pipe A and
pipe B materials play an important role in stimulating microbial growth in low-nutrient medium, like water,
and biofilm development on plastic surfaces. Previous investigations have shown that tubercles materials
can concentrate organic nutrients (Liu et al., 2002). Therefore, the higher microbial growth and biofilm
formation evaluated in pipe A and pipe B than in pipe C might be due to a combination of nutrient accu-
mulation, and probably a different surface roughness, as well as favouring pipe A and pipe B surfaces as
sites for bacterial growth and adhesion.
7.1.3 References
Asséré, A., Oulahal, N., Carpentier, B. 2008. Comparative evaluation of methods for counting surviving biofilm cells adhering to a polyvinyl chloride surface exposed to chlorine or drying. J Appl Microbiol 104, 1692-1702
Burmølle, M., Webb, J.S., Rao, D., Hansen, L.H., Sørensen, S.J., Kjelleberg, S. 2006. Enhanced biofilm formation and increased resistance to antimicrobial agents and bacterial invasion are caused by synergistic interactions in multispecies biofilms. Appl En-viron Microbiol 72, 3916-3923
Carraro, L., Maifreni, M., Bartolomeoli, I., Martino, M. E., Novelli, E., Frigo, F., Marino, M., Cardazzo, B. 2011. Comparison of culture-dependent and -independent methods for bacterial community monitoring during Montasio cheese manufacturing. Res Microbiol 162, 231-239
Elvers, K.T., Leeming, K., Lappin-Scott, H.M. 2002. Binary and mixed population biofilms: time-lapse image analysis and disin-fection with biocides. J Ind Microbiol Biotechnol 29, 331-338
Lee, J., Lee, C.S., Hugunin, K.M., Maute, C.J., Dysko, R.C. 2010. Bacteria from drinking water supply and their fate in gastroin-testinal tracts of germ-free mice: a phylogenetic comparison study. Water Res 44, 5050-5058
Niquette, P., Servais, P., Savoir, R. 2000. Impacts of pipe materials on densities of fixed bacterial biomass in a drinking water distribution system. Water Res 34, 1952-1956
Rickard, A.H., McBain, A.J., Stead, A.T., Gilbert, P. 2004. Shear rate moderates community diversity in freshwater biofilms. Appl Environ Microbiol 70, 7426-7435
September, S., Els, F., Venter, S., Brozel, V. 2007. Prevalence of bacterial pathogens in biofilms of drinking water distribution systems. J Water Health 5, 219-227
0
1
2
3
4
5
0 5 10 15 20 25 30
Log C
FU
/cm
2
time (d)
4 °C water 20 °C water 40 °C water
Chapter 7. Biofilm formation in the Food Field: two case studies
135
Stepanović, S., Vuković, D., Dakić, I., Savić, B., Švabić-Vlahović, M. 2000. A modified microtiter-plate test for quantification of staphylococcal biofilm formation. J Microbiol Meth 40, 175-179
Verhille, S., Baida, N., Dabboussi, F., Hamze, M., Izard, D., Leclerc, H. 1999. Pseudomonas gessardii sp. nov. and Pseudomonas
migulae sp. nov., two new species isolated from natural mineral waters. Int J Syst Bacteriol 49, 1559-1572
Chapter 7. Biofilm formation in the Food Field: two case studies
136
7.2 BACTERIAL BIOFILM FORMATION IN THE MICROBREWERY ENVIRONMENT
Beer is generally regarded as a safe beverage in terms of food-borne illnesses because it is hard to
spoil and has a remarkable microbiological stability. As a matter of fact, pathogens and many other micro-
organisms are not able to grow in beer due to the presence of ethanol and of the hop bitter compounds, the
high content of carbon dioxide, the low pH, the reduced content of oxygen and the presence in traces of
nutrient substances such as glucose, maltose and maltotriose. However, a bacterial contamination by spoil-
age microorganisms is possible because the fermentation process is prone to bacterial growth, due to the
nutrient-rich environment of wort and the additional growth factors produced by the brewing yeast (In-
gledew, 1979; Sakamoto and Konings, 2003). This is particularly true in the case of beer produced by
microbreweries, which usually is not a filtered and pasteurized product, more subjected to microbial con-
tamination than industrial beer (Menz et al., 2010). The sources of microbial beer contaminants originate
from the yeast, wort, fermentation, maturation or pressure tanks, as well as from bottling, canning or keg-
ging (Vaughan et al., 2005).
Beer production takes place mainly in closed systems, where cleaning-in-place (CIP) procedures
without the need for dismantling are applied. However, long runs between cleanings and short cleaning
programs are typical due to the favourable economic aspect. So, these systems are susceptible to bacterial
adhesion on surfaces and consequent formation of microbial biofilms which is a time-dependent process
(Zottola, 1994). The main causes of biofilm formation and the consequent contamination of beer are com-
monly due to improper cleaning and disinfection of equipment, mainly of the areas more difficult to clean
and disinfect, as bends, edges, dead ends in pipes, seals and joints. It should be highlighted that microbial
biofilms are more resistant to antimicrobials compared to planktonic cells and this make their elimination
from food processing facilities a big problem (Gilbert et al., 2002).
Beer contaminations by microbial biofilms can occur during production and during bottling, which
is considered the major source of the microbial problems in beer production. During production, beer spoil-
age microrganisms such as lactic acid bacteria, wild yeast and anaerobic bacteria are often present on the
equipment, as well as in the air and in the raw materials. These microorganisms can survive in niches like
seals, joints and valves, hardly reachable by sanitization, proliferate when residues are present, and con-
taminate the entire production (Timke et al., 2008). Other critical points are the heat exchangers, for their
conformation difficult to disinfect, and the fermentation and maturation tanks, for the presence of sugar not
yet fermented and the initial absence of ethanol. Fermentation tanks are usually contaminated by Gram
negative and acetic acid bacteria, while maturation tanks by lactic acid bacteria (Timke et al., 2005).
Biofilm production in the brewery environment is a problem when biofilm- producering microrgan-
isms are able to grow in beer and cause off-flavor or turbidity in the final product due to metabolites and
sediment production. Despite the fact that much research has focused on the detection of beer-spoiling
bacteria (Timke et al., 2008; Matoulková et al., 2012), only little information is available on the composition
of brewery biofilms and on the ability of biofilm bacterial isolates to grow in beer, although yeasts are
Chapter 7. Biofilm formation in the Food Field: two case studies
137
outnumbered by bacteria in brewery biofilms (Storgårds and Priha, 2009). Thus, the aim of this work was
to identify possible niches of bacterial biofilm formation, to verify the potential of isolates to grow in craft
beer, and to test the efficacy of a peracetic acid-based sanitizer against preformed biofilms.
7.2.1 Materials and Methods
One craft beer plant located in the North-East of Italy was monitored in this study. The hygienic
status of several plant surfaces was controlled for microbiological contamination at two different sampling
times at a distance of one month from each other.
7.2.1.1 Sampling of brewery processing plant surfaces
The samples were taken after the application of the sanitation plan, carried out as follows: rinsing
with cold water, cleaning with basic detergent (2% for 20 min at 70 °C), rinsing with cold water, disinfec-
tion with a 1.5% peroxide-based solution (1.5% peracetic acid/hydrogen peroxide for 15 min at room tem-
perature) and finally a rinse with cold water. Various surfaces of the processing plant, including fermenta-
were qualitatively sampled through the use of sterile cotton swabs, moistened using a sterile solution (par-
agraph 2.2.1) immediately before use. The surfaces were sampled, the swabs were then suspended in 5 mL
of the sterile saline solution and plated on Tryptone Soya Agar (TSA, Oxoid, Milan, Italy) and de Man
Rogosa Sharpe Agar (MRS-A, Oxoid, Milan, Italy). The plates were incubated at 30 °C for 48 h under
aerobic (TSA) or anaerobic conditions (MRS-A).
7.2.1.2 Isolation and identification of the strains
Pure cultures of representative colonies from TSA and MRS-A plates were characterized on the
basis of their colonial characteristics (colony elevation, size, shape, pigmentation, edge and consistency),
cell morphology and Gram-staining using an optical microscope at 1000x magnification, catalase and oxi-
dase activities, and motility, and grouped accordingly. One representative strain of each group was sub-
jected to DNA extraction by using InstaGene Matrix kit (BioRad, Italy). The strains were then submitted
to partial 16S rRNA gene amplification with primers 16S rRNA F and 16S rRNA R (Carraro et al., 2011).
The amplified fragments were sequenced and the sequences obtained were aligned with the closest se-
quences available in the GenBank database (≥98% of homology, http://www.ncbi.nml.nih.gov/BLAST).
7.2.1.3 Evaluation of beer-spoilage ability (forcing test)
A few colonies of each selected isolate grown on TSA or MRS-A plates were suspended in 5 mL
of a sterile saline solution and the turbidity was adjusted to 1.0 McFarland. A top-fermented beer containing
ethanol 5.0% v/v and 18 IBU (International Bitterness Units) was degassed in an ultrasound bath, filter-
sterilized and inoculated with 200 µL of each culture in two biological replicates in a final volume of 10
mL. The inoculated beers were incubated anaerobically in the dark at 20 °C for up to 6 weeks and examined
regularly for visible growth as compared to a sample of uninoculated beer (control).
Chapter 7. Biofilm formation in the Food Field: two case studies
138
7.2.1.4 Biofilm formation on polystyrene microtiter plates
The test was carried out in three biological replicates in 96-well polystyrene flat bottom microplates
in TSB broth or MRS , as reported in paragraph 2.2.1. The microplates were incubated for 7 days at 30 ° C
and subjected every 48 hours to refresh The strains were classified based on their biofilm-forming ability
as described by Stepanović et al. (2000).
7.2.1.5 Biofilm disinfection assay
Stainless steel AISI 304 coupons (50 x 25 x 1 mm) were sonicated in a hot alkali detergent solution
for 30 min in an ultrasonic water bath, rinsed in distilled water, sonicated in a 15% phosphoric acid solution
at 80 °C for 20 min, rinsed in distilled water for 20 min and sterilized in an autoclave. For each strain, two
sterile coupons were placed in a sterile Petri dish containing 15 mL of BHI or MRS broth, inoculated with
150 µL of an overnight culture (~ 108 CFU/mL) and incubated at 30 °C for 7 days. At the end of incubation,
each coupon was washed three times with a sterile saline solution and then immersed in 15 mL of 1%
peracid-based solution for 15 min at 20 °C. After disinfection the coupons were neutralized with 15 mL of
0.5% sodium thiosulphate for 15 min at 20 °C. Biofilm cells were scraped from each coupon, the detached
cells were resuspended in 1 mL of a Maximum Recovery Diluent and subjected to two cycles of sonication
(59 KHz for 1 min each), interspersed with vortexing for 30 sec. Then, ten-fold dilutions of each suspension
were analyzed through the spread plate method. The inactivation efficacy was evaluated by taking the ratio
of the Log CFU/cm2 before (N0) and after the treatment (Nt), presented as -Log (Nt/N0). Each trial was
performed in triplicate.
7.2.2 Results and discussion
The presence of beer-spoilers yeasts is well documented in surface-associated biofilms of the brew-
ery environment. On the other hand, studies related to the presence of bacterial species in brewery biofilms
are quite scarce, although it is rather known that many bacteria may cause an increase in turbidity and
unpleasant sensory changes in beer (Sakamoto et al., 2003). For this reason, an investigation of the bacterial
community present on process surfaces of a brewing plant was performed, and the impact of the isolates on
the hygienic risk was assessed by evaluating their ability to grow in beer and to form biofilms on abiotic
surfaces, as well as the tolerance of a preformed biofilm to a peroxide-based treatment.
In total, 253 isolates were obtained from TSA and MRS-A plates. After a colonial characterization,
cell morphology, Gram-staining, catalase and oxidase activities, and motility, fifty-eight strains were iden-
tified by partial sequencing of the 16S rRNA gene (Table 7.1). The strains were members of different taxa
with a focus on Firmicutes, Gammaproteobacteria Actinobacteria and Alphaproteobacteria. Within the 33
strains assigned to the phylum of Firmicutes five families were represented, including Bacillaceae, Enter-
ococcaceae, Lactobacillaceae, Paenibacillaceae and Staphylococcaceae. The well-known beer-spoiling
bacteria Lactobacillus brevis were detected in three different sampling sites.
Chapter 7. Biofilm formation in the Food Field: two case studies
139
Table 7.1. Bacterial species isolated from microbrewery surfaces; *the first two letters indicate the sampling site (Bm, bottling machine; Cb, conveyor belt; Dp, drainage pit; Dv, fermenter drain valve; Pt, pipe thread), the first number indicates the sampling time (_1_, 1st sampling time; _2_, 2nd sampling time)
Chapter 7. Biofilm formation in the Food Field: two case studies
140
Bacteria were isolated from several sampled areas, including different sites in the bottling machine,
drain valves from tanks, floor drains, and joints. No bacterial contamination was found on capping machine,
fermentation tanks, pipes, and heat exchanger. Interestingly, except in the case of the drain valves, the
bacterial contamination was present in all the sampling times, underlining that in case of resident biofilms
normal sanitation procedures are not sufficient and intensive protocols should be initiated. Bacterial con-
tamination was present mostly on external surfaces of the production plant, and this is a big hygienic issue
because it might be distributed throughout by people, splashes or air movements, and consequently reach
the final product or clean surfaces (Timke et al., 2005). Indeed, secondary contaminations originating from
opened surfaces are responsible for most events of spoilage of non-pasteurized beer (Storgårds and Priha,
2009).
Eleven strains were identified as belonging to the Gammaproteobacteria phylum. The presence of
members of this group, above all Pseudomonas species and Enterobacteriaceae, is in accordance with sev-
eral reports from breweries. The source of this species is usually wort, and they cannot multiply in bottled
beer, but they occur frequently in brewery biofilm communities (Timke et al., 2004). Indeed, the strains
isolated in this study were classified mostly as moderate or strong biofilm producers. The presence of bio-
film formers in the working area of a food processing plant should be regarded as a potential hygienic risk,
as it contributes to the overall microbial contamination of the environment, and increases the incidence of
cross-contamination. Other microbial groups, belonging to phyla Actinobacteria and Alphaproteobacteria,
were frequently isolated. Stenotrophomonas maltophilia, Bacillus spp., Microbacterium spp., Staphylococ-
cus warneri and Sphingomonas spp. are often isolated from food environment (Carpentier and Chassaing,
2004) and drinking water distribution systems, in particular regarding Sphingomonas sp. (Simões et al.,
2010). Even if they are non- beer-spoiling bacteria, they can fulfil important functions like primary surface
colonization of, matrix production, acidification and reduction of oxygen presence in the environment for
the beer-spoiling bacteria, which are usually facultative or obligate anaerobes and acidophilic or acidotol-
erant. For example, Acetobacter pasteurianus, which was isolated from the bottling machine, is known for
reducing the pH in the presence of oxygen, thus providing favorable conditions for the beer-spoilers bacte-
ria. Among Firmicutes, Lactobacillus brevis and Pediococcus pentosaceus were isolated. They represent a
potential hazard for the brewing industry as they can be responsible for most of the beer spoilage (Fujii et
al., 2005). In this study, two out of five strains belonging to these species were able to multiply in beer.
Within the isolated species, moderate and strong biofilm producers were present mainly within
Actinobacteria, Alphaproteobacteria and Gammaproteobacteria, while within Firmicutes several weak
producers were present. Similar results were obtained for biofilms grown on stainless steel (Figure 7.5). In
fact, regardless of the wide range of Log CFU/cm2 of viable counts on stainless steel, the mean values of
the different phyla clearly showed that Firmicutes adhered less efficiently on such surfaces, even if some
members of this phylum reached more than 6 Log CFU/cm2.
Chapter 7. Biofilm formation in the Food Field: two case studies
141
Figure 7.5. Biofilm formation (Log UFC/cm2) by isolates on AISI 304 stainless steel; horizontal lines represent the mean value for each phylum
As regards the tolerance to a commercial sanitizer widely used in brewing environments, the data
showed that Actinobacteria was the most tolerant phylum, followed by Alphaproteobacteria, Gammapro-
teobacteria and Firmicutes (Figure 7.6). According to Møsteller and Bishop (1993), a product with a dis-
infectant action against bacterial biofilm must be able to reduce the cellular populations by 3 logarithmic
units. The results showed that for most of the strains the treatment with a peracid-based product in operating
conditions, similar to those of the processing plant, is ineffective in reducing microbial populations on
stainless steel surfaces to a safe level, thus establishing a risk for food plant contamination.
Figure 7.6. Reduction of microbial counts (expressed as -Log (Nt/N0), where Nt = CFU/cm2 after treatment, N0 = initial CFU/cm2); horizontal lines represent the mean value for each phylum
Actually, peracetic acid-based disinfectants have been usually used in the food industry and in
breweries, in particular in the sanitizer step of the CIP system (Orth, 1998) as this substance works quickly
and is effective against bacteria (Loukili et al., 2006). Unlike most chemical disinfectants, it does not react
with proteins to produce toxic or carcinogenic compounds, has low environmental impact and has been
Chapter 7. Biofilm formation in the Food Field: two case studies
142
reported to be more active against biofilm (Holah et al., 1990). The efficiency of peracid acid may be
explained by its high capacity of oxidizing cell molecules by releasing free oxygen and hydroxyl radicals
decomposing in oxygen, water and acid acetic (Loukili et al., 2006). In this study, a significant fraction of
the bacterial population seems to be able to escape disinfection. This is probably due to both microbial
aggregation state, which limits diffusion of the oxidant, and the sophisticated antioxidant strategies devel-
oped by many microorganisms (Sies, 1993).
This study showed that the sanitation protocol applied in an Italian microbrewery is not always able
to ensure a satisfactory hygienic state of the equipment and the plant. Several sampling areas including the
bottling machine, conveyor belts, drainage, valves and threads were found to be contaminated by a hetero-
geneous microflora, and among the microbial species isolated Lactobacillus brevis was found, which is a
known beer-spoiling bacteria. Most of the strains showed a high ability to form biofilm both on polystyrene
and on stainless steel, which makes these strains particularly hazardous in the food industry, and in brewery
in particular, as they can represent a possible source of cross-contamination.
Since several strains showed to be insufficiently affected by a widely used sanitizing product, an effective
sanitation program should be designed taking into account both the microbial biofilm and its high level of
microbial heterogeneity. Therefore, it appears to be essential to resort to the use of sanitizing products
efficient for all potentially present microbial species. The sanitizer effectiveness should be tested by in vitro
studies that could be invariably repeated under in situ conditions in order to control the biofilms presence
in the food processing areas.
7.2.3 References
Carpentier, B., Chassaing, D. 2004. Interactions in biofilms between Listeria monocytogenes and resident microorganisms from food industry premises. Int J Food Microbiol 97, 111-122.
Carraro, L., Maifreni, M., Bartolomeoli, I., Martino, M. E., Novelli, E., Frigo, F., Marino, M., Cardazzo, B. 2011. Comparison of culture-dependent and -independent methods for bacterial community monitoring during Montasio cheese manufacturing. Res Microbiol 162, 231-239
Fujii, T., Nakashima, K., Hayashi, N. 2005 Random amplified polymorphic DNA-PCR based cloning of markers to identify the beer-spoilage strains of Lactobacillus brevis, Pediococcus damnosus, Lactobacillus collinoides and Lactobacillus coryniformis. J Appl Microbiol 98, 1209–1220
Gilbert, P., Allison, D.G., Mcbain, A.J. 2002. Biofilms in vitro and in vivo: do singular mechanisms imply cross-resistance? J Appl Microbiol 92, 98S-110S
Holah, J.T., Higgs, C., Robins, S., Worthington, D., Spencely, H. 1990. A conductance based surface disinfection test for food hygiene. Lett Appl Microbiol 11, 255-259
Ingledew, W.M. 1979. Effect of bacterial contamination on beer. A review. J Am Soc Brew Chem 37, 145-150
Loukili, N.H., Granbastien, B., Faure, K., Guery, B. Beaucaire, G. 2006. Effect of different stabilized preparations of peracetic acid on biofilms. J Hosp Infect 63, 70-72
Matoulková, D., Kosar, K., Slabý, M., Sigler, K. 2012. Occurrence and species distribution of strictly anaerobic bacterium Pecti-
natus in brewery bottling halls. J Am Soc Brew Chem 70, 262-267
Menz, G., Andrighetto, C., Lombardi, A., Corich, V., Aldred, P., Vriesekoop, F. 2010. Isolation, identification, and characterization of beer-spoilage lactic acid bacteria from microbrewed beer from Victoria, Australia. J Inst Brew 116, 14-22
Mosteller, T.M., Bishop, J.R. 1993. Sanitizer efficacy against attached bacteria in a milk biofilm. J Food Protect 56, 34-41
Orth, R. 1998. The importance of disinfection for the hygiene in the dairy and beverage production. Int Biodeter Biodegr 41, 201-208
Sakamoto, K., Konings, W.N. 2003. Beer spoilage bacteria and hop resistance. Int J Food Microbiol 89, 105-124
Chapter 7. Biofilm formation in the Food Field: two case studies
143
Sies, H. 1993. Strategies of antioxidant defense. Eur J Biochem 215, 213–219
Simeõs, L.C., Simões, M., Vieira, M.J. 2010. Influence of the diversity of bacterial isolates from rinking water on resistance o biofilms to disinfection. Appl Environ Microbiol 76, 6673-6679.
Stepanović, S., Vuković, D., Dakić, I., Savić, B., Švabić-Vlahović, M. 2000. A modified microtiter-plate test for quantification of staphylococcal biofilm formation. J Microbiol Meth 40, 175-179
Storgårds, E., and Priha, O. 2009. Biofilms and brewing. In P.M. Fratamico, B.A. Annous, N.W. Gunther (Eds.), Biofilms in the food and beverage industries, 432-454. Cambridge: Woodhead Publishing Ltd.
Timke, M., Wang-Lieu, N.Q., Altendorf, K., Lipski, A. 2005. Fatty acid analysis and spoilage potential of biofilms from two breweries. J Appl Microbiol 99, 1108-1122
Timke, M., Wang-Lieu, N.Q., Altendorf, K., Lipski, A. 2008. Identity, beer spoiling and biofilm forming potential of yeasts from beer bottling plant associated biofilms. Anton Leeuw 93, 151-161
Timke, M., Wolking, D., Wang-Lieu, N.Q., Altendorf, K., Lipski, A. 2004. Microbial composition of biofilms in a brewery inves-tigated by fatty acid analysis, fluorescence in situ hybridisation and isolation techniques. Appl Microbiol Biot 66, 100-107
Vaughan, A., O’Sullivan, T. , van Sideren, D. 2005. Enhancing the microbiological stability of malt and beer - a review. J Inst Brew 111, 355-371
Zottola, E.H. 1994. Microbial attachment and biofilm formation. A new problem for the food industry. Food Technol 48, 107-114
ACKNOWLEDGEMENTS
I would like to express my special appreciation to Dr. Michela Maifreni and Dr. Marilena Marino,
my Ph.D. Supervisors, for their support, help and guidance as advisors in this research project but also as
supporters in the everyday life.
I am also very grateful to my colleague Dr. Ingrid Bartolomeoli for her help and support during
these past three years of PhD course. I thank her for giving me, especially in times of discouragements, the
determination that only she is able to give!
I would also like to acknowledge: Dr. Simone Guarnieri, Dr. Di Bonaventura and his “female staff”
Dr. Arianna Pompilio, Dr. Valentina Crocetta and Dr. Serena De Nicola, for giving me the opportunity to
study microbial biofilms in a new way and for the time spent in Chieti; Dr. Fabio Spizzo, Dr. Monica
Celotto and Dr. Fiorella Trivillin (Electrolux Italia, S.p.A.) for their support, advice and equipment; Dr.
Lara Tat for the statistical support; Dr. Dobrila Braunstein for my English lessons and for my PhD thesis
corrections; Antonio Ellero for helping me in the “baracco” reconstruction and in every technical critical
moments that happen in a lab; the colleagues in the microbiology laboratory for making the lab work less
heavy.
I would like to thank all the members of my family for always supporting me.
A special thanks to my husband, Luca, for encouraging me and for loving me during my good and