34
| Date post: | 21-Dec-2015 |
| Category: |
Documents |
| View: | 217 times |
| Download: | 1 times |

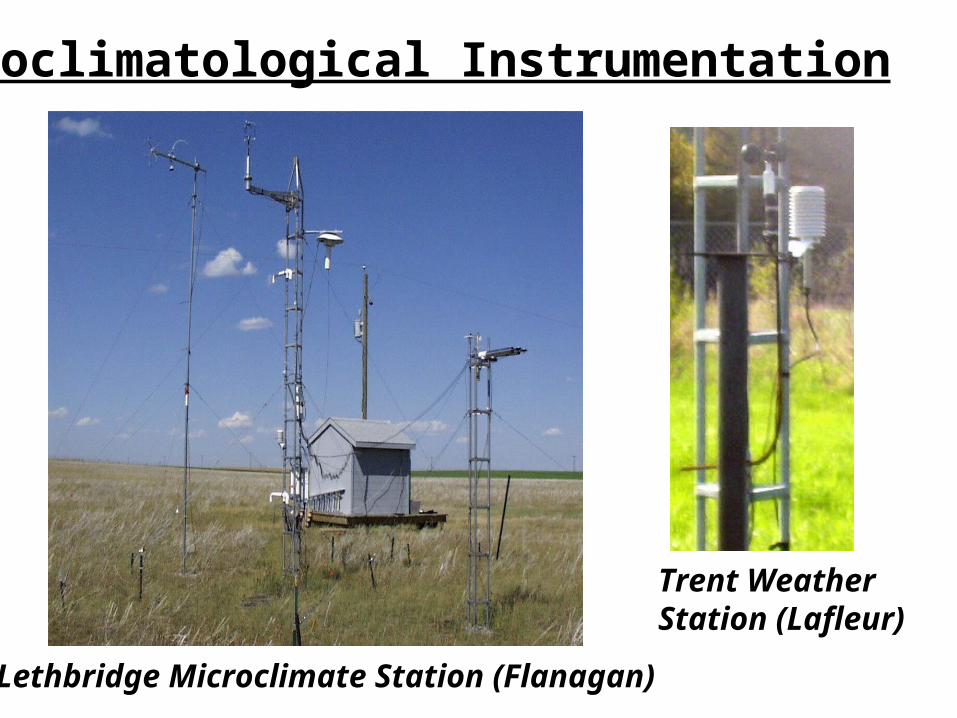
Microclimatological Instrumentation
Lethbridge Microclimate Station (Flanagan)
Trent Weather Station (Lafleur)

Temperature Measurement
Thermocouple
2 wires of different composiotion joined by an electrical sourceElectrical resistance sensitive to temperatureResistance is measured and coverted to temperature information
Thermister
The hotter it gets, the less power it lets throughResistance is measured and converted to temperature information

Temperature and Relative Humidity
Temperature and RH sensors housed in Gill Radiation Shield
Relative humidity sensordetects vapour adsorption onto a sulfonated polystyrene surface
Temperature Sensorthermister
Function of Shields:Protect sensor from radiation (especially incoming shortwave and outgoing longwave radiation) while allowing air to pass.

Stevenson Shield
An earlier radiation shield often used with wet and drybulb thermometers
Photo: Trent Weather Station

Rainfall and Snowfall Measurements
Precipitation Gauge with Nipher Shield


Wind Speed and Direction
Cup anemometersignal frequency converted to windspeed
Wind vane
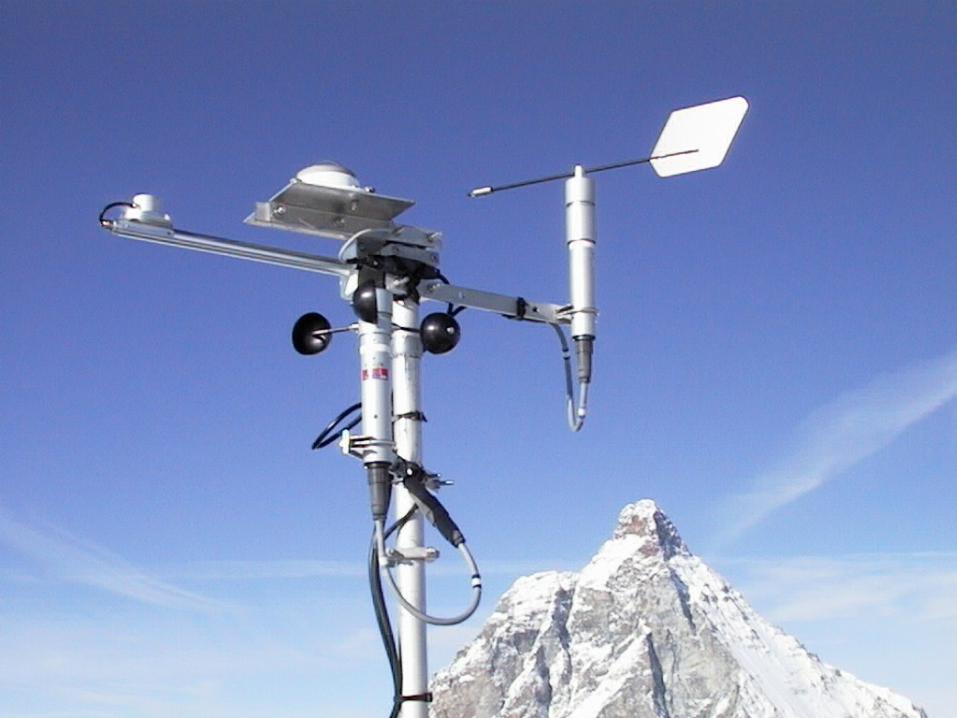
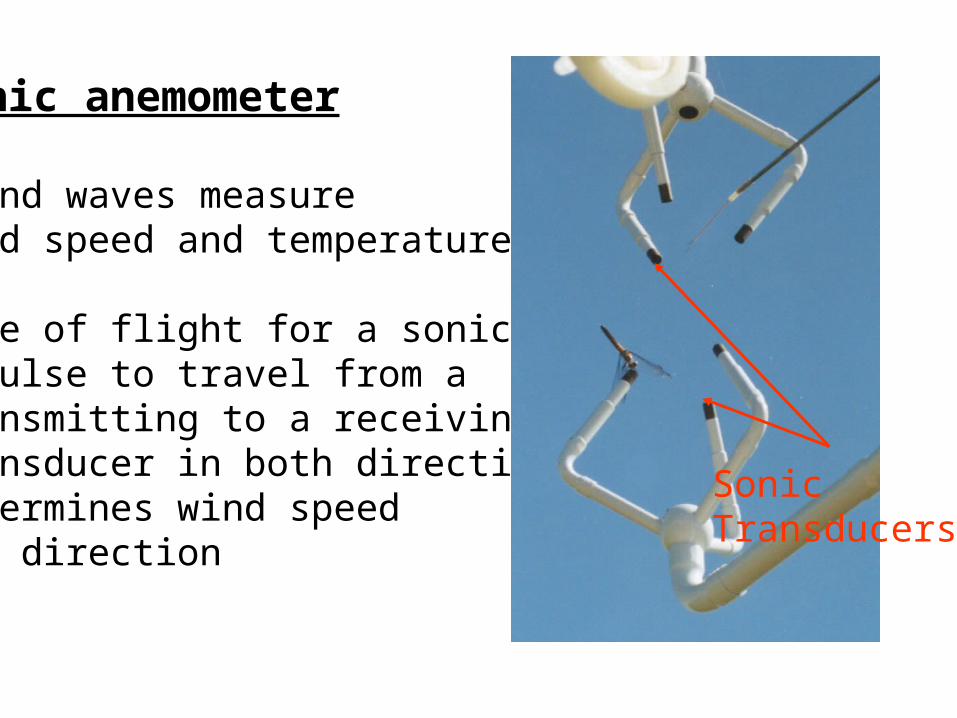
Sonic anemometer
Sound waves measure wind speed and temperature
Time of flight for a sonic impulse to travel from atransmitting to a receiving transducer in both directions determines wind speedand direction
SonicTransducers
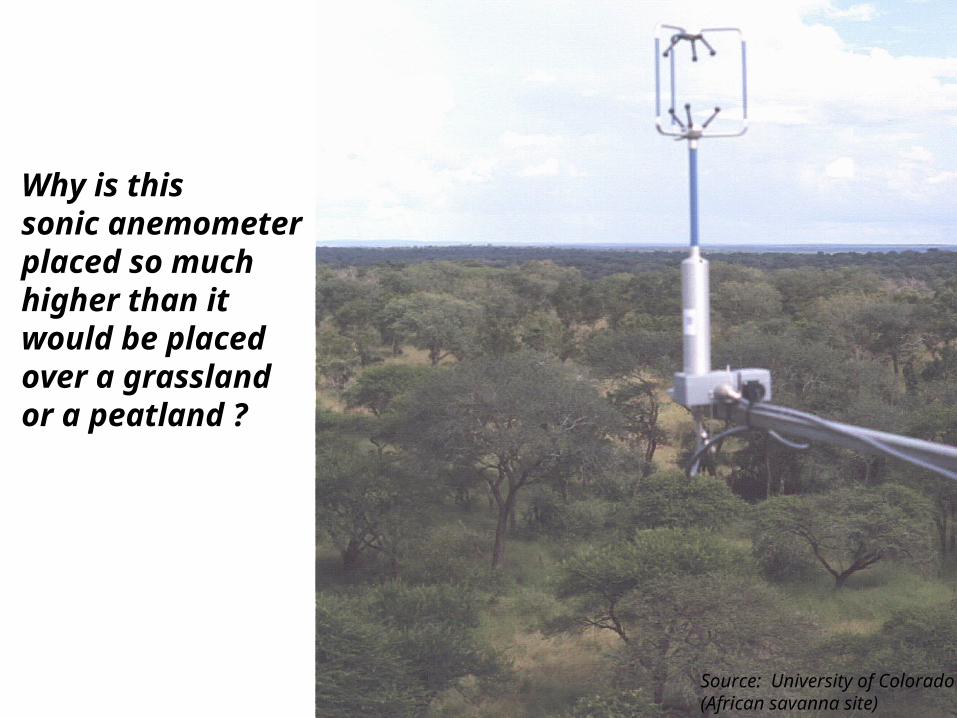
Why is thissonic anemometerplaced so much higher than it would be placedover a grasslandor a peatland ?
Source: University of Colorado(African savanna site)

Micrometeorological Tower

Yikes !

Radiation Measurements
Shields made of materials appropriate for desired wavelength(eg. polyethylene for net radiation – transparent to both longwaveand shortwave energy)
Millivolt signals areproportional to the radiation level
Net radiometer
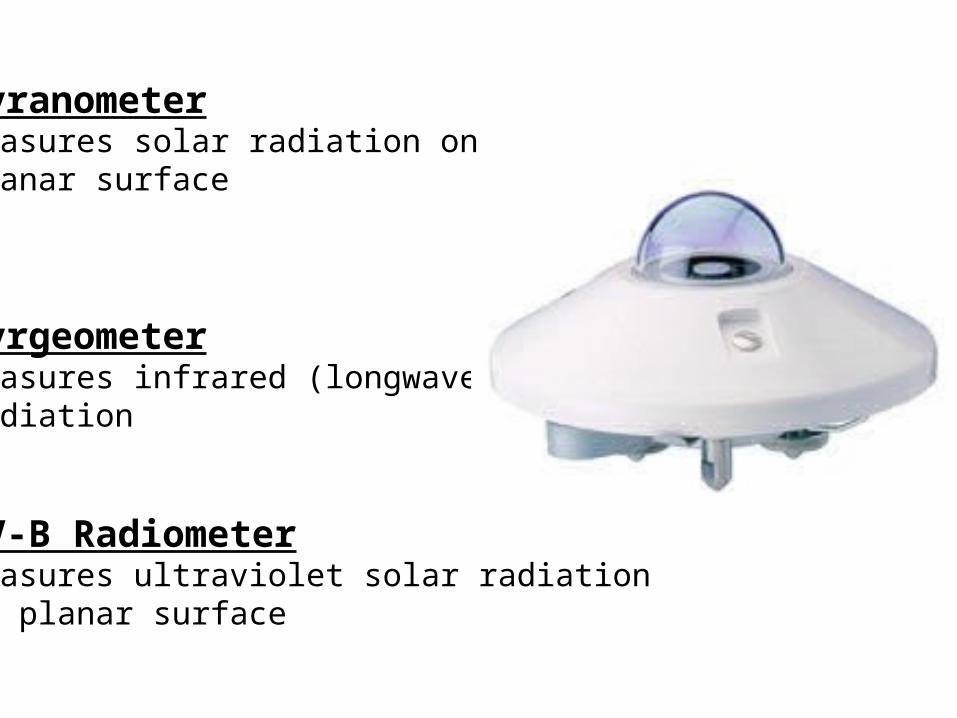
PyranometerMeasures solar radiation onplanar surface
PyrgeometerMeasures infrared (longwave)radiation
UV-B RadiometerMeasures ultraviolet solar radiationon planar surface

Field Station
Tambito al Cocal River
Base camp2º30´25´´N, 77º00´02´´W, 1450 m
Photo taken from microclimate station

Juntas,El Tambo,Cauca,Colombia
901 m asl

Radiation Measurements
Also: pyranometer for broadband incoming radiation
L
L K
K (not visible)
UV-A

0
200
400
600
800
1000
1200
1400
6 8 10 12 14 16 18
TMC F ( Dry)
TMC F (We t )
Max (TMCF Dry)
Max (TMCF We t )
Figure 5.1b. Solar radiation during the dry season and wet season (November) atCentro de Estudios Ambientales Tambito.
Hour
Solar radiation(W∙m-1)
0
5
10
15
20
25
30
6 8 10 12 14 16 18
TMCF (Dry )
TMCF (We t )
Max (TMCF We t )
Ma x (TMCF Dry )
Figure 5.6a Ultraviolet A radiation at Napo, and during the dry season (August) at Centro de Estudios Ambientales Tambito.
Figure 5.6b Ultraviolet A radiation during the dry season and wet season (November) at Centro de Estudios Ambientales Tambito.
Hour
Ultraviolet-A(W∙m-2)
Hour
Ultraviolet-A(W∙m-2)
Radiation Data

More radiation sensors…
Source: University of Colorado

Diffuse Radiation
Measured using a shade disk
Radiation from entire sky except from within 3 of Sun

Heat Flux Plate
Senses conductive heat transmission in the mediumwithin which it is buried
Used for soil energy balance studies
Voltage proportional to heat flux throughplate
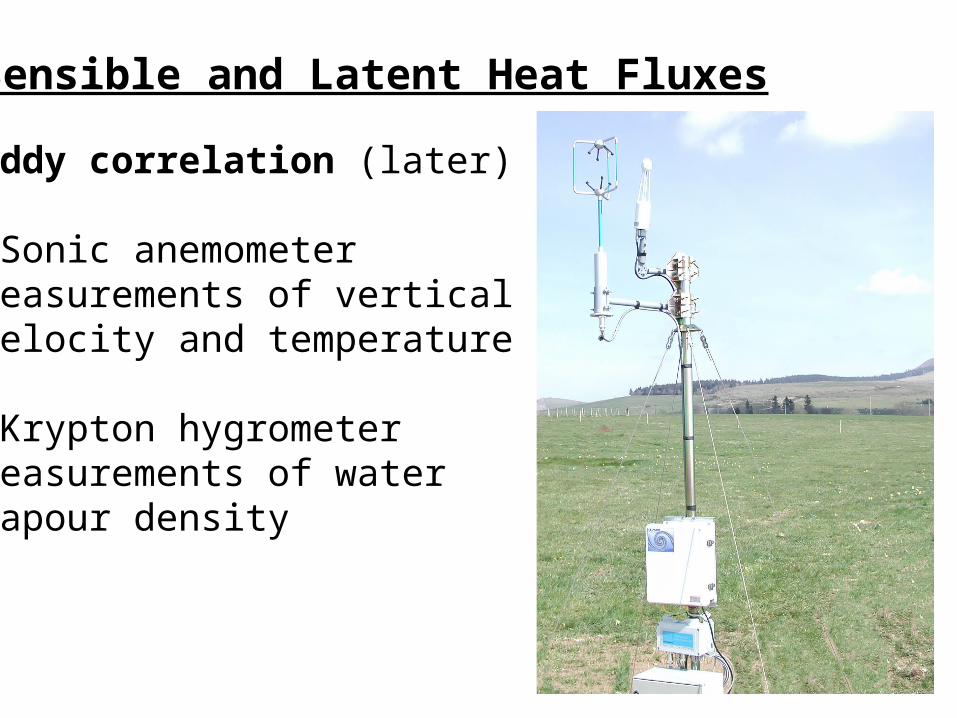
Sensible and Latent Heat Fluxes
Eddy correlation (later)
•Sonic anemometer measurements of vertical velocity and temperature
•Krypton hygrometer measurements of water vapour density
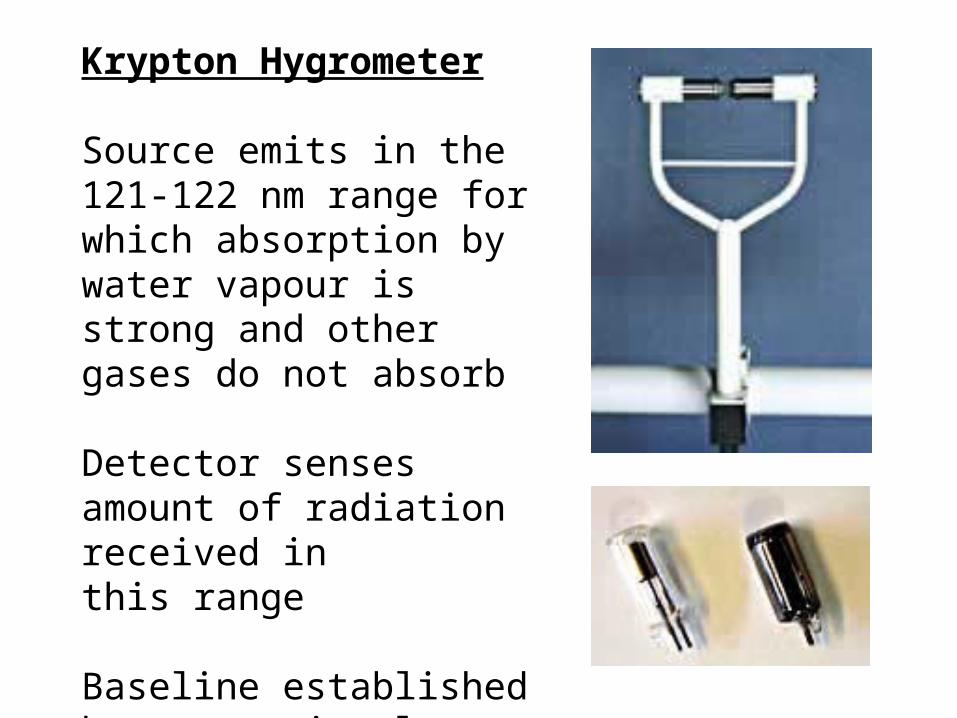
Krypton Hygrometer
Source emits in the 121-122 nm range for which absorption by water vapour is strong and other gases do not absorb
Detector senses amount of radiation received inthis range
Baseline established by conventional measurements
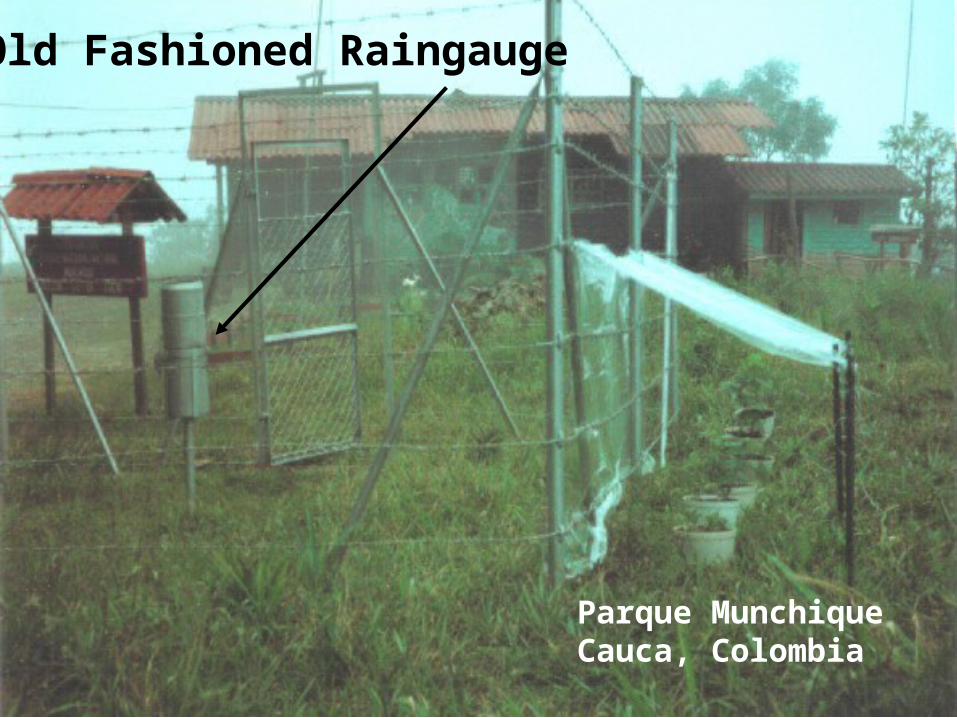
Old Fashioned Raingauge
Parque MunchiqueCauca, Colombia
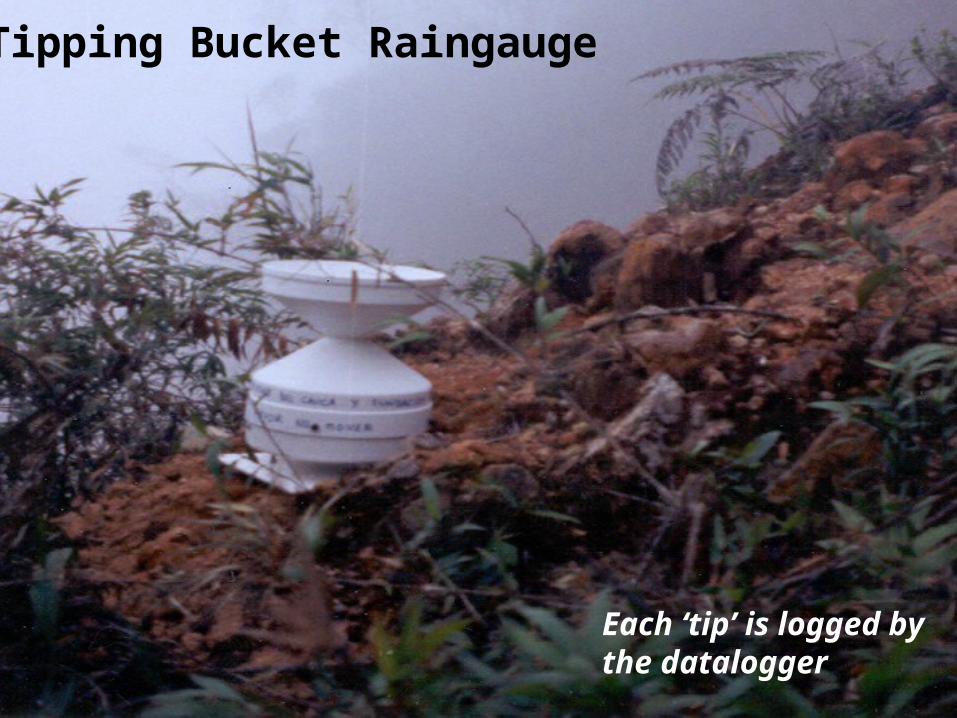
Tipping Bucket Raingauge
Each ‘tip’ is logged bythe datalogger

“Leaf’ Wetness Sensor

Figure 5.11a Average leaf wetness at 2.5, 5.0 and 10m height within the canopy of the Bosque station.
0
0,1
0,2
0,3
0,4
0,5
0,6
0,7
0,8
0,9
1
0 2 4 6 8 10 12 14 16 18 20 22
2.5 metres
5.0 metres
10 m etres
Proportional leaf wetness
Hour
0
0,1
0,2
0,3
0,4
0,5
0,6
0,7
0,8
0,9
1
0 200 400 600
2.5 metres
5.0 metres
10 metres
Figure 5.11b Complex pattern of leaf wetness at 2.5, 5.0 and 10m height within the canopy of the Bosque station.from August 9 to September 9, 1999.
9 Aug 19 Aug 29 Aug 7 Sept
Proportional leaf wetness
Day
Leaf Wetness Data
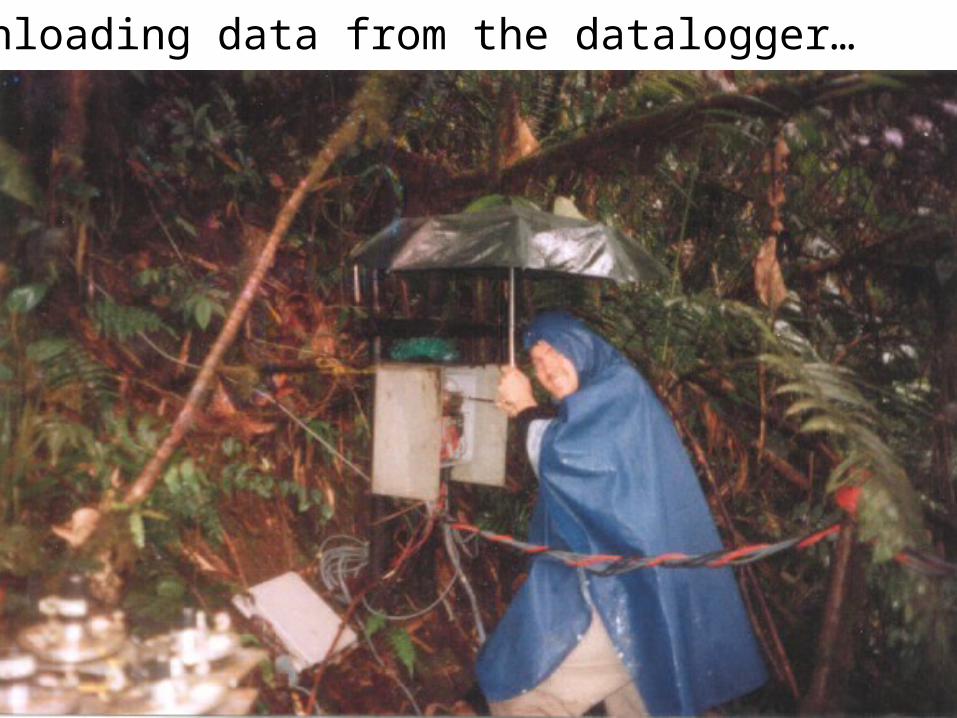
Downloading data from the datalogger…
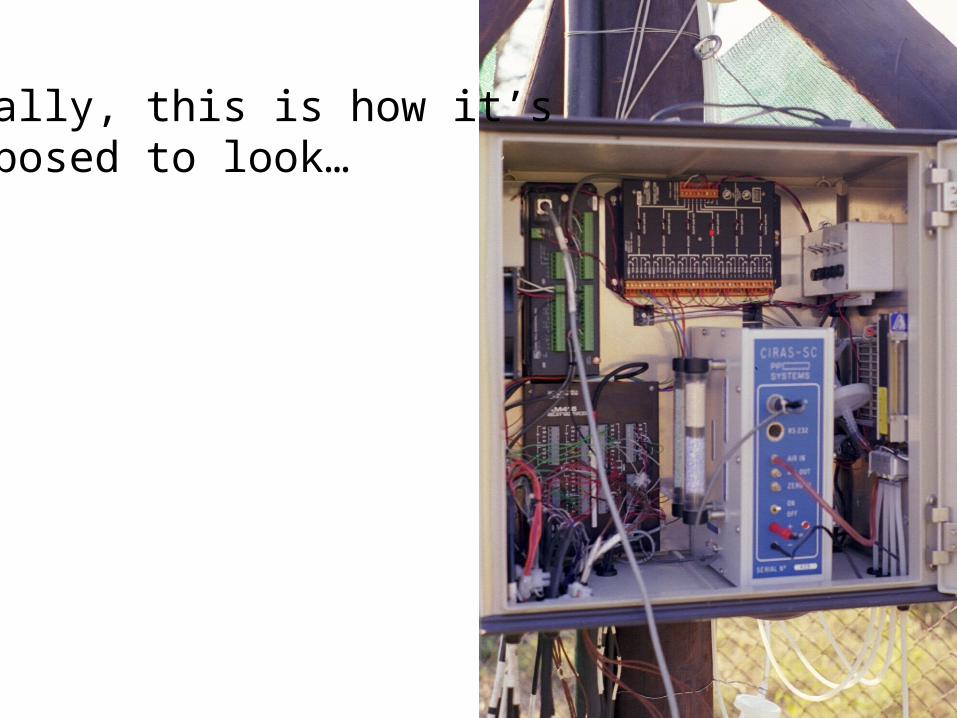
Ideally, this is how it’s supposed to look…

Power Supplies
Closed Path IRGAS
Data Acquisition Computer
CalibrationEquipment
Equipment Rack
(later)
Source: Dr. Larry Flanagan
Nice and organized !
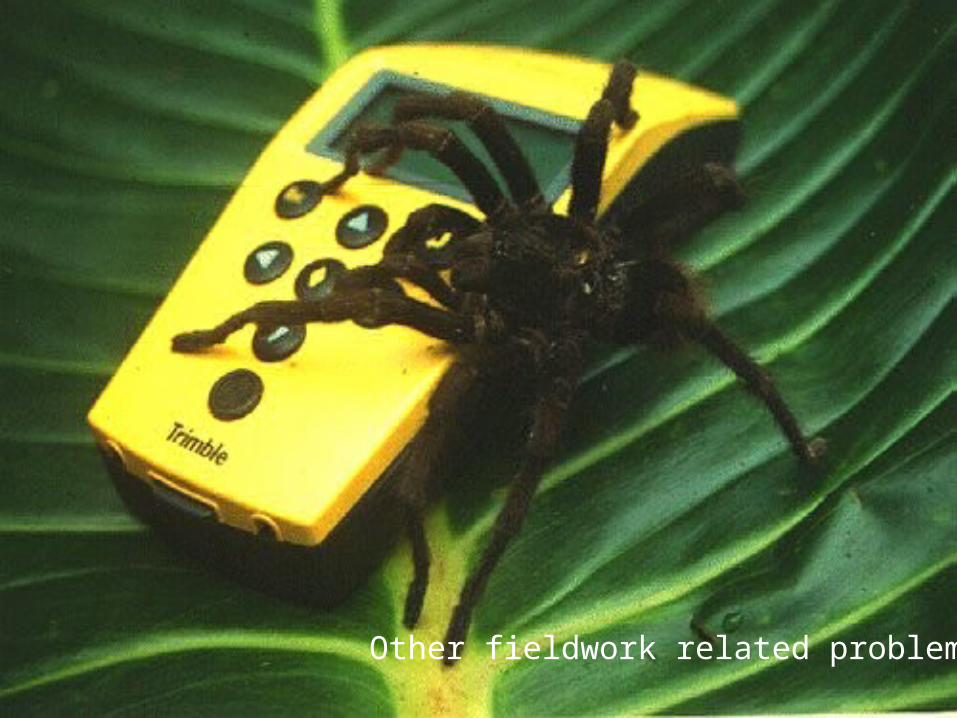
Other fieldwork related problems…

… turned out to be a ‘false’ Coral (phew!)
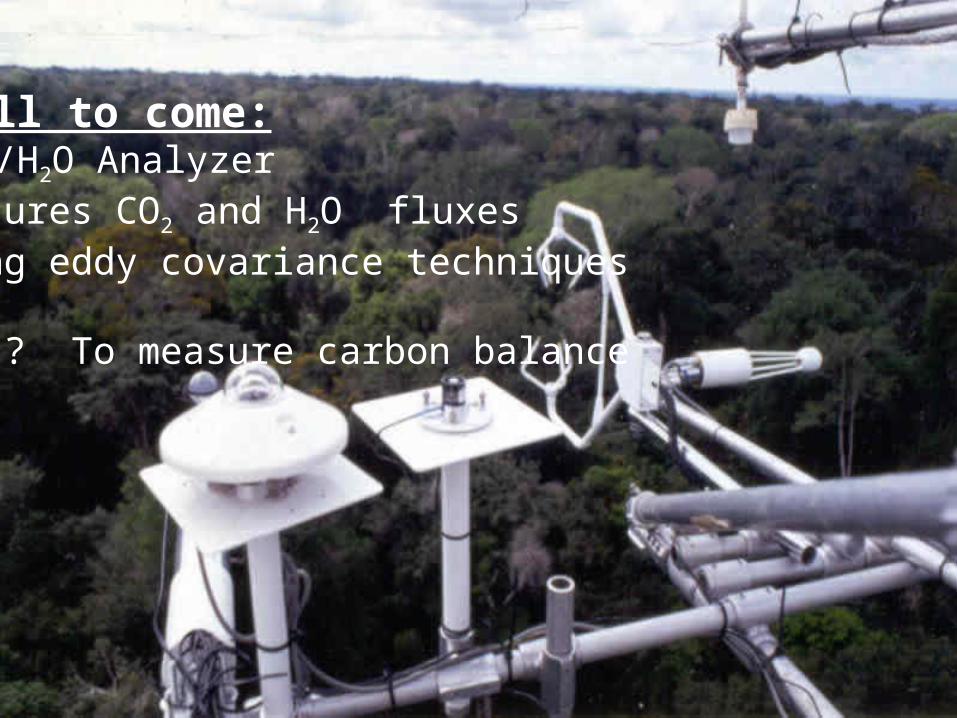
Still to come:•CO2/H2O AnalyzerMeasures CO2 and H2O fluxes using eddy covariance techniques
Why ? To measure carbon balance


