179
MICROENCAPSULATION OF A PALM OIL-BASED ALKYD BY AMINO RESINS FOR SELF-HEALING APPLICATION NURSHAFIZA BINTI SHAHABUDIN FACULTY OF SCIENCE UNIVERSITY OF MALAYA KUALA LUMPUR 2016

MICROENCAPSULATION OF A PALM OIL-BASED ALKYD BY AMINO RESINS FOR SELF-HEALING
APPLICATION
NURSHAFIZA BINTI SHAHABUDIN
FACULTY OF SCIENCE
UNIVERSITY OF MALAYA KUALA LUMPUR
2016

MICROENCAPSULATION OF A PALM OIL-BASED
ALKYD BY AMINO RESINS FOR SELF-HEALING
APPLICATION
NURSHAFIZA BINTI SHAHABUDIN
THESIS SUBMITTED IN FULFILMENT OF THE
REQUIREMENTS FOR THE DEGREE OF DOCTOR OF
PHILOSOPHY
FACULTY OF SCIENCE
UNIVERSITY OF MALAYA
KUALA LUMPUR
2016

ii
UNIVERSITY OF MALAYA
ORIGINAL LITERARY WORK DECLARATION
Name of Candidate : NURSHAFIZA BINTI SHAHABUDIN
I.C. No.: 831106-02-5458
Matric No.: SHC110093
Name of Degree: Doctoral
Title of Thesis (“this Work”): MICROENCAPSULATION OF A PALM OIL-
BASED ALKYD BY AMINO RESINS FOR
SELF-HEALING APPLICATION
Field of Study: Polymer Chemistry
I do solemnly and sincerely declare that:
(1) I am the sole author/writer of this Work;
(2) This Work is original;
(3) Any use of any work in which copyright exists was done by way of fair dealing
and for permitted purposes and any excerpt or extract from or reference to or
reproduction of any copyright work has been disclosed expressly and sufficiently
and the title of the Work and its authorship have been acknowledged in this Work;
(4) I do not have any actual knowledge nor do I ought reasonably to know that the
making of this work constitutes an infringement of any copyright work;
(5) I hereby assign all and every rights in the copyright to this Work to the University
of Malaya (“UM”), who henceforth shall be owner of the copyright in this Work
and that any reproduction or use in any form or by any means whatsoever is
prohibited without the written consent of UM having been first had and obtained;
(6) I am fully aware that if in the course of making this Work I have infringed any
copyright whether intentionally or otherwise, I may be subject to legal action or
any other action as may be determined by UM.
Candidate’s Signature Date: 13/09/2016
Subscribed and solemnly declared before,
Witness’s Signature Date: 13/09/2016
Name: PROF. DR. GAN SENG NEON
Designation: Professor, Department of Chemistry, University of Malaya.

iii
ABSTRACT
The failure of many structural polymers usually begins from the micro-cracks formed
within the materials. Materials which contain healing agents (in microcapsules) can
autonomously repair these cracks to prevent further propagation and failure. When cracks
occur and rupture the microcapsules, the healing agent released would solidify through
selected mechanism. In this work, a potential healing material was developed using an
alkyd from palm kernel oil (PKO). The alkyd was synthesized to have a controlled
amount of carboxylic groups (COOH), capable to form crosslinking reaction with the
epoxide groups in the epoxy matrix. The alkyd was encapsulated into poly(urea-
formaldehyde) (PUF) and poly(melamine-urea-formaldehyde) (PMUF) resins forming
the microcapsules, which were embedded into an epoxy matrix. The functional groups of
alkyd and shell materials in the microcapsules were confirmed by the appearance of the
respective characteristic peaks using attenuated total reflectance-Fourier transform
infrared (ATR-FTIR). Differential scanning calorimetry (DSC) analysis of the
microcapsules showed a glass transition (Tg) around −12° C due to the alkyd and sharp
melting temperature (Tm) at 148°C and 192°C due to the PUF and PMUF shells
respectively. Another broad Tm at 0−15°C was attributed to the alkyd core.
Thermogravimetric analysis (TGA) revealed that the PUF and PMUF microcapsules were
thermally stable up to 250°C and 260°C, respectively. Field emission scanning electron
microscopy (FESEM) examination of the broken shell of the microcapsules showed a
smooth inner surface and a rough outer surface. The outer surface consisted of layered
structures formed by PUF and PMUF nanoparticles. The microcapsules mix readily into
the epoxy and were found to disperse well in the matrix as revealed by images in optical
microscope and FESEM. Microcapsules of 1−3 wt. % could be incorporated into an
epoxy matrix without noticeably affecting the flexural strength and micro-indentation
hardness. To demonstrate the plausible healing reaction between the alkyd and the epoxy,

iv
a small amount of the amine hardener was replaced with the alkyd in the epoxy
formulation. Curing was carried out at room temperature for 24 h and 100°C for 2 h and
the blends hardened readily.

v
ABSTRAK
Kegagalan struktur kebanyakan polimer biasanya bermula dari retakan mikro yang
terbentuk dalam polimer tersebut. Bagi bahan swa-pulih, retakan boleh dibaiki atau
perambatan retak boleh dicegah. Apabila retakan berlaku dan mikrokapsul pecah, agen
pemulihan akan di keluarkan dan mengeras menggunakan mekanisme yang sesuai. Bahan
swa-pulih yang berpotensi telah dibangunkan menggunakan pada alkid daripada minyak
isirong sawit. Alkid ini mempunyai jumlah karboksil (COOH) tertentu yang mampu
membentuk rangkai silang dengan kumpulan epoksida dalam matriks epoksi. Kumpulan-
kumpulan berfungsi alkid dan bahan kulit kapsul telah disahkan oleh kemunculan puncak
berciri menggunakan “attenuated total reflectance-Fourier transform infrared” (ATR-
FTIR). Analisis “differential scanning calorimetry” (DSC) terhadap mikrokapsul
menunjukkan suhu peralihan kaca (Tg) sekitar −12°C, dan suhu lebur yang tajam (Tm)
pada 148°C dan 192°C dan satu lagi Tm pada 0−15°C. “Thermogravimetric analysis”
(TGA) mendedahkan mikrokapsul poli(uria-formaldehid) (PUF) dan poli(melamin-uria-
formaldehid) (PMUF) adalah stabil sehingga 250°C dan 260°C. Pemeriksaan “field
emission scanning electron microscopy” (FESEM) terhadap kulit mikrokapsul yang
dipecahkan menunjukkan permukaan dalaman yang licin dan permukaan luaran yang
kasar, yang terbentuk daripada partikel nano PUF dan PMUF. Mikrokapsul telah
dicampurkan ke dalam epoksi dan didapati bersurai dengan baik dalam matriks seperti
yang ditunjukkan oleh imej mikroskop optikal dan FESEM. Penambahan 1−3 %
mikrokapsul ke dalam matriks epoksi tidak mengubah kekuatan lenturan dan kekerasan
mikro (Vickers). Untuk menunjukkan tindak balas swa-pulih di antara alkid dan epoksi,
sedikit pengeras amina telah digantikan dengan alkid dalam formulasi epoksi. Campuran
alkid dan epoksi telah mengeras apabila di “cure” pada suhu bilik selama 24 j dan hanya
2 j pada suhu 100°C.

vi
ACKNOWLEDGEMENTS
Praise be to Allah, the Most Gracious and the Most Merciful, for given me the
opportunity to complete this study.
I would like to express my sincerest gratitude and utmost appreciation to my
supervisors: Professor Dr Gan Seng Neon and Professor Dr Rosiyah Yahya for their
generous guidance, support and motivation throughout this study. All patience and help
during my candidature and the tireless proofreading efforts for published works from both
of them are highly appreciated. Special thanks to Professor Gan who had given me this
project.
I thank the staff of Chemistry Department for all their support, particularly: Prof.
Rauzah Hashim and the FSSA team (especially Dr Malinda, Dr Idayu and Mr Melloney)
for their cooperation and generosity with the instruments at their laboratory; Dr Desmond,
Dr Noordini and Dr Masmira for their scientific insights; Mr Shukri and Ms Noor Nadila
for the help with FESEM and NMR analyses. My appreciation also goes to the
Biomaterial research laboratory (BRL) at the Faculty of Dentistry, UM, in particular: Dr
Noor Azlin for allowing me to conduct my research at BRL; Mrs Zarina and Mrs
Chantiriga for their support with the mechanical testing. I acknowledge the staff of
INFRA Analysis Laboratory of Research Management & Innovation, UM, particularly
Mr Zulhizan Zakaria for his help with the FESEM analysis of the microcapsules and Mrs
Fatimah Zahrah for her support with STA. I also acknowledge the proofreading favor by
Prof Jawakhir Mior.
I am also indebted to the former and current members of Prof. Gan’s research group.
It has been a real pleasure to work with them, especially Sonja who had set the foundation
of the encapsulation work at the laboratory and had been a good mentor; Yoke Kum,
vii
Siang Yin and Mei Chan for their guidance with the alkyd synthesis and polymer
characterizations; Mrs Rohani A. Bakar for her technical assistance with the GPC and
scientific discussions; Pedram, Pejvak and W. Nurhidayah for their help and info-sharing;
Hazira, Irma and Mariam for their support in the laboratory. I also thank Prof. Rosiyah’s
group members in particular Danial for the support with the literature; Farhana and
Vidhya for their assistance at the department.
I would like to reserve a special mention to my beloved family who has been the
fundamental base for every success and to whom this work is dedicated, especially my
parents, Mr Shahabudin and Mrs A’ishah, my sisters and brothers, for their endless
support, preserverance and patience throughout my study years. I could not have done
this without any of them.
This study was supported by the Ministry of Science, Technology and Innovation,
Malaysia (MOSTI) (03-01-03-SF0874) and University of Malaya (PG050-2014A). I also
acknowledge the funding of my presentations at conferences: Faculty of Science
postgraduate fund, PPP Travel Fund of University of Malaya and IUPAC for MACRO
2014 student support. Finally, I am truly grateful to the Ministry of Higher Education,
Malaysia (MOHE) for the MyBrain15−Ph.D scholarship.

viii
TABLE OF CONTENTS
Abstract ............................................................................................................................ iii
Abstrak .............................................................................................................................. v
Acknowledgements .......................................................................................................... vi
Table of Contents ........................................................................................................... viii
List of Figures ................................................................................................................ xiv
List of Tables ................................................................................................................. xix
List of Abbreviations ...................................................................................................... xx
List of Appendices ......................................................................................................... xxi
CHAPTER 1: INTRODUCTION .................................................................................. 1
1.1 Background of Study ............................................................................................... 1
1.2 Problem Statement ................................................................................................... 3
1.3 A Selected Alkyd as Healing Agent ........................................................................ 5
1.4 Research Objectives ................................................................................................ 6
CHAPTER 2: LITERATURE REVIEW ...................................................................... 7
2.1 Introduction ............................................................................................................. 7
2.2 Self-Healing and Its Development .......................................................................... 7
2.3 Epoxy in Industries ................................................................................................ 13
2.4 Self-Healing Epoxy ............................................................................................... 16
2.4.1 Intrinsic Self-Healing Epoxy .................................................................... 16
2.4.2 Vascular-Based Self-Healing Epoxy ........................................................ 17
2.4.3 Microcapsules-Based Self-Healing Epoxy ............................................... 17
2.4.4 Self-Healing Epoxy Coating .................................................................... 24
2.5 Alkyd as Potential Healing Agent ......................................................................... 26

ix
2.5.1 Epoxy/Alkyd Reaction ............................................................................. 26
2.5.2 Palm Kernel Oil as Source of Fatty Acids and the Polyol ....................... 27
2.5.3 Alkyd Synthesis ........................................................................................ 28
2.6 Microencapsulation for Self-Healing .................................................................... 29
2.6.1 Amino Resins ........................................................................................... 32
2.6.2 Urea-Formaldehyde Resin (UF) and Melamine-Modified UF (MUF) Resin
as Shell of Microcapsules ......................................................................... 33
2.6.3 Encapsulation Technique for Self-Healing .............................................. 34
2.6.4 Process Parameters ................................................................................... 35
2.6.4.1 Core and shell weight ratio ....................................................... 35
2.6.4.2 Concentration and types of emulsifiers ..................................... 35
2.6.4.3 Viscosity of organic and aqueous phases .................................. 37
2.6.4.4 Agitation rate ............................................................................. 39
2.7 Assessment of Healing Performance ..................................................................... 40
2.7.1 Recovery of Mechanical Properties ......................................................... 41
2.7.2 Qualitative Assessment ............................................................................ 43
2.7.3 Recovery of Corrosion Protection ............................................................ 44
2.8 Mechanical Testing of the Modified and Unmodified of Polymeric Materials and
Composites ............................................................................................................ 45
2.8.1 Micro-Indentation Hardness (Microhardness) ......................................... 45
2.8.2 Flexural Strength ...................................................................................... 46
2.9 Concluding Remarks ............................................................................................. 48
CHAPTER 3: EXPERIMENTAL ............................................................................... 49
3.1 Synthesis and Characterization of Palm Oil-Based Alkyd as Core Material of
Microcapsules ........................................................................................................ 49
3.1.1 Palm Kernel Oil (PKO) ............................................................................ 49
3.1.2 Materials ................................................................................................... 50

x
3.1.3 Formulation of Alkyd ............................................................................... 51
3.1.4 Synthesis of AlkydPKO65 ....................................................................... 55
3.1.5 Characterization of AlkydPKO65 ............................................................ 56
3.1.5.1 Determination of acid value (AN) and amount of –COOH group
of alkyd ...................................................................................... 56
3.1.5.2 Viscosity analysis ...................................................................... 58
3.1.5.3 Attenuated total reflectance-Fourier transform infrared (ATR-
FTIR) analysis ........................................................................... 58
3.1.5.4 Proton nuclear magnetic resonance (1H-NMR) analysis .......... 59
3.1.5.5 Gel permeation chromatography (GPC) analysis ..................... 59
3.1.5.6 Differential scanning calorimetry (DSC) analysis .................... 60
3.1.5.7 Thermogravimetric analysis (TGA) .......................................... 61
3.2 Microencapsulation of Alkyd by Amino Resins ................................................... 62
3.2.1 Materials ................................................................................................... 62
3.2.2 Synthesis of Microcapsules Filled with Alkyd ........................................ 63
3.2.3 Spectroscopic Analyses of Core Content ................................................. 65
3.2.4 Characterization of Microcapsules ........................................................... 66
3.2.4.1 Yield of microcapsules .............................................................. 66
3.2.4.2 Size and particles distribution ................................................... 66
3.2.4.3 Calculation of core content ....................................................... 66
3.2.4.4 Viscosity of core content and selected epoxy resins ................. 67
3.2.5 Differential Scanning Calorimetry (DSC) Analysis ................................. 67
3.2.6 Thermogravimetric Analysis (TGA) ........................................................ 67
3.2.7 Simultaneous Thermal Analysis (STA) ................................................... 68
3.2.8 Surface Morphology and Shell Wall Thickness ....................................... 68
3.2.9 Storage of Microcapsules ......................................................................... 68
3.3 Microcapsules in Epoxy Matrix: Mechanical Properties and Epoxy/Alkyd Reaction
68
xi
3.3.1 Mold Preparation ...................................................................................... 69
3.3.2 Samples Preparation for Mechanical Tests .............................................. 69
3.3.3 Morphology and Dispersion of Microcapsules in Epoxy Matrix ............. 70
3.3.4 Three-Point Bend Test ............................................................................. 70
3.3.5 Micro-Indentation Hardness (Vickers) Test ............................................. 70
3.3.6 Preparation and Characterization of Epoxy/Alkyd (EA) Blends ............. 70
3.4 Summary ................................................................................................................ 71
CHAPTER 4: ALKYD RESIN FROM PALM KERNEL OIL ................................ 72
4.1 Alkyd Synthesis ..................................................................................................... 72
4.2 1H-NMR Spectroscopy .......................................................................................... 72
4.3 ATR-FTIR Spectroscopy ....................................................................................... 75
4.4 Viscosity of Alkyd ................................................................................................. 77
4.5 Molecular Weight Determination .......................................................................... 78
4.6 Thermal Analysis ................................................................................................... 80
4.7 Summary ................................................................................................................ 81
CHAPTER 5: MICROENCAPSULATION OF ALKYD BY AMINO RESINS .... 82
5.1 Synthesis of Microcapsules ................................................................................... 82
5.2 Influence of Reaction Parameters on the Microencapsulation .............................. 85
5.2.1 Core/Shell Weight Ratio Variation in Method 1 ...................................... 86
5.2.2 Core/Shell Weight Ratio Variation in Method 2 ...................................... 89
5.2.3 Agitation Rate .......................................................................................... 92
5.2.4 Concentration of Emulsifier and Viscosity of the Aqueous Phase .......... 95
5.2.5 Melamine/Urea Ratio ............................................................................... 96
5.2.6 Different Alkyd as Core Content.............................................................. 98
5.2.7 Sonication ............................................................................................... 100

xii
5.3 Spectroscopic Characterizations of Alkyd and Microcapsules ........................... 102
5.4 Thermal Analysis ................................................................................................. 105
5.4.1 Differential Scanning Calorimetry (DSC) .............................................. 106
5.4.2 Thermogravimetric Analysis (TGA) ...................................................... 107
5.5 Morphology of Microcapsules ............................................................................ 108
5.6 Storage Stability of Microcapsules ...................................................................... 109
5.7 Summary .............................................................................................................. 112
CHAPTER 6: MICROCAPSULES IN EPOXY MATRIX AND EPOXY/ALKYD
REACTION 113
6.1 Microcapsules Distribution in Epoxy Matrix ...................................................... 113
6.2 Flexural and Micro-Indentation Hardness of Epoxy Matrix Loaded with 1%–6%
Microcapsules ...................................................................................................... 116
6.3 Reactions of the Alkyd Blended with Epoxy Resin and Hardener...................... 118
6.4 Summary .............................................................................................................. 121
CHAPTER 7: CONCLUSION AND FUTURE WORK ......................................... 122
REFERENCES ............................................................................................................. 124
LIST OF PUBLICATIONS AND PAPERS PRESENTED ......................................... 136
APPENDIX A: Publication (Front Page) ..................................................................... 137
APPENDIX B: Microencapsulation procedure of Method 3........................................ 140
APPENDIX C: ATR-FTIR spectra ............................................................................... 141
APPENDIX D: 1H-NMR spectra of AlkydFA35 and the extracted core of D1
microcapsules ................................................................................................................ 143
APPENDIX E: DSC thermograms and characterization data ...................................... 144
APPENDIX F: TGA thermograms ............................................................................... 148
APPENDIX G: STA thermograms ............................................................................... 151
APPENDIX H: FESEM micrographs ........................................................................... 153
APPENDIX I: Mechanical test data.............................................................................. 154

xiii
APPENDIX J: Formulation of the epoxy/alkyd blends & core content data ............... 155
APPENDIX K: Publications of smart materials in Malaysia ....................................... 156

xiv
LIST OF FIGURES
Fig. 1.1: SEM micrograph of fracture surface with microcracks. Adapted from Li et al.
(2014) ................................................................................................................................ 1
Fig. 1.2: Blood clotting in an injured vessel. Reproduced from MSD manuals consumer
version (Moake, 2016) © Merck & Co. Inc ...................................................................... 2
Fig. 1.3: Concept of microcapsules-based self-healing. Adapted from Cho et al., 2009.. 3
Fig. 2.1: The effect of healing time on the stress-strain behavior of hard elastic
polypropylene fibers at room temperature. Reproduced from Wool RP (ed. L.H-Lee) ©
1980 Plenum Press ............................................................................................................ 9
Fig. 2.2: Autonomous self-healing concept introduced by White and co-researchers in
2001. Reproduced from White et al. © 2001 Nature Pub. Group ................................... 10
Fig. 2.3: Evolution of the amount of papers published on self-healing materials.
Reproduced from Tittelboom and de Belie © 2013 MDPI ............................................. 10
Fig. 2.4: Chemical structure of DGEBA resin ................................................................ 14
Fig. 2.5: Scheme of curing reaction between epoxy resin and carboxylic acid functional
polyester hardener ........................................................................................................... 15
Fig. 2.6: Approaches to self-healing (a) intrinsic (b) vascular-based (c) (micro/nano)
capsule-based. Adapted from Blaiszik et al. © 2010 Annual Reviews .......................... 16
Fig. 2.7: Number of publications per year (2005-2014) shown by Google Scholar and
ScienceDirect; keywords “Microcapsules based self-healing materials”. Reproduced
from Ullah et al. © 2015 Taylor & Francis ..................................................................... 18
Fig. 2.8: (a) Design cycle of microcapsules-based self-healing material (b) approaches of
microcapsules loading into matrix. Reproduced from Blaiszik et al. © 2010 Annual
Reviews ........................................................................................................................... 19
Fig. 2.9: Polydimethylsiloxane (PDMS)-based self-healing is achieved through the tin-
catalyzed polycondensation of phase-separated droplets. Reproduced from Cho et al.
©2006 Wiley-VCH ......................................................................................................... 24
Fig. 2.10: (a,b) Optical images after 120 h immersion in salt water of (a) control sample
(b) self-healing coating; (c,d) SEM images of the scribed region of (c) the control coating
(d) the self-healing coating after healing. Reproduced from Cho et al. © 2009 Wiley-
VCH ................................................................................................................................ 26
Fig. 2.11: Chemical structures of UF and MF resins ...................................................... 32

xv
Fig. 2.12: Damage modes in polymer composites. Reproduced from Blaiszik et al. © 2010
Annual Reviews .............................................................................................................. 40
Fig. 2.13: A specimen prepared (a) before testing (b) after tear testing. (c) A schematic
representation of a tear specimen during lap shear test. Scale bar = 10 mm. From Keller
et al. © Wiley-VCH ........................................................................................................ 43
Fig. 2.14: SEM micrographs of the scribed region: (a) control coating (b) the healed
coating ............................................................................................................................. 44
Fig. 2.15: Vickers indentation on the experimental sample of (scale is in µm).............. 46
Fig. 2.16: Set up of the three-point-bend test using universal testing machine .............. 47
Fig. 2.17: Stress-strain curve of experimental epoxy samples ........................................ 48
Fig. 3.1: Experimental set up of (a) alcoholysis process (b) esterification process,
equipped with Dean-stark decanter to collect water ....................................................... 55
Fig. 3.2: Synthesis of alkyd using palm kernel oil (by alcoholysis and esterification
processes) ........................................................................................................................ 56
Fig. 3.3: Experimental set up of microencapsulation process ........................................ 64
Fig. 3.4: General microencapsulation procedure of alkyd .............................................. 65
Fig. 4.1: Acid number change vs. esterification time ..................................................... 72
Fig. 4.2: 1H-NMR spectra of (a) PKO (b) AlkydPKO65 ................................................ 74
Fig. 4.3: (a) Plausible structure of AlkydPKO65 (b) saturated caprylic acid (c) unsaturated
linoleic acid ..................................................................................................................... 75
Fig. 4.4: FTIR spectra of (a) PKO (b) AlkydPKO65. ..................................................... 76
Fig. 4.5: Plausible synthesis route of AlkydPKO65; R= fatty acid chains from PKO ... 77
Fig. 4.6: GPC curves of (a) AlkydPKO65 (b) EpikoteTM 240 ........................................ 79
Fig. 4.7: TGA thermogram of AlkydPKO65 .................................................................. 80
Fig. 4.8: DSC thermogram of AlkydPKO65; inset: enlarged Tg area ............................. 81
Fig. 5.1: Digital microscope images of reaction medium after (a) 60 min (b) 120 min (c)
180−240 min; (d) microcapsules after washed and filtered ............................................ 83

xvi
Fig. 5.2: A suspension or emulsion polymerization where polymer is deposited at an
aqueous/organic interface, yielding a polymer shell wall around a stabilized droplet that
becomes the core solution. From Esser-Kahn et al. © 2011 ACS .................................. 83
Fig. 5.3: (a) Reactions of urea and formaldehyde to form mono- and di-methylol urea (b)
reactions between methylol urea to form linkages (c) reaction between methylol and
resorcinol (as crosslinking agent) ................................................................................... 84
Fig. 5.4: (a) Chemical structure of melamine resin (Cymel 303®); (b) plausible
crosslinking reaction of melamine resin; (c) plausible crosslinking reaction of alkyd with
methylol urea and –N-CH2-O-CH3 of melamine resin ................................................... 85
Fig. 5.5: Microencapsulation procedures of alkyd (a) Method 1 (b) Method 2. ............. 86
Fig. 5.6: Digital microscope images of PMUF microcapsules (Series 1), prepared at
different core/shell weight ratios..................................................................................... 88
Fig. 5.7: (a) Smooth surface of 1-E microcapsule (b) magnified shell surface of PMUF
microcapsule by Method 1 .............................................................................................. 89
Fig. 5.8: Digital microscope images of PUF microcapsules (Series 2) prepared with
Method 2 ......................................................................................................................... 90
Fig. 5.9: FESEM micrographs of sample 2-C microcapsule and its shell surface
morphology ..................................................................................................................... 91
Fig. 5.10: Size distribution (left) and digital microscopic images of microcapsules (right,
50×), prepared at different agitation rates (rpm): (a) 500; (b) 400; (c) 300 .................... 93
Fig. 5.11: Digital microscope images of PUF microcapsules (200×): (a) A1 (b) A2 (c) A3
......................................................................................................................................... 94
Fig. 5.12: Size of microcapsules with agitation rate ....................................................... 94
Fig. 5.13: Digital microscopic images of microcapsules (200×) synthesized at different
EMA concentrations (wt. %): (a) 1.0; (b) 2.5; (c) 5.0..................................................... 95
Fig. 5.14: Viscosity of the solution of EMA as the aqueous phase of the
microencapsulation process, at 26°C and 55°C .............................................................. 96
Fig. 5.15: Digital microscopic images of microcapsules with increasing M/U ratio: (a) 0;
(b) 0.03; (c) 0.06; (d) 0.12; (e) 0.29 ................................................................................ 97
Fig. 5.16: Size distributions of microcapsules in B series compared to A2 microcapsules:
(a) A2; (b) B1; (c) B2; (d) B3. ........................................................................................ 98
Fig. 5.17: Size distribution and mean diameter of D1 microcapsules ............................ 99

xvii
Fig. 5.18: Optical microscope images of D1 microcapsules at low and high
magnifications ................................................................................................................. 99
Fig. 5.19: FESEM micrographs of microcapsules prepared with sonication: (a-b) C1 (c-
d) C2 .............................................................................................................................. 101
Fig. 5.20: ATR-FTIR spectra of AlkydPKO65 and the extracted core of A2, B2 and C2
microcapsules ................................................................................................................ 102
Fig. 5.21: ATR-FTIR spectra of AlkydFA35 and the extracted core of D1 microcapsules
....................................................................................................................................... 103
Fig. 5.22: ATR-FTIR spectra of the neat melamine resin and the extracted shell materials
of A2, B2 and C2 microcapsules .................................................................................. 104
Fig. 5.23: 1H-NMR spectra of AlkydPKO65 and the extracted core of A2, B2, C2
microcapsules ................................................................................................................ 105
Fig. 5.24: DSC thermograms of (a) AlkydPKO65 (b) B2 (c) A2 (d) PUF shell (e) PMUF
shell ............................................................................................................................... 107
Fig. 5.25: TGA thermograms of B2 microcapsules, neat alkyd and PMUF shell ........ 108
Fig. 5.26: FESEM micrographs of B2 microcapsule at: (a) 600×; (b) 10 000×
magnifications ............................................................................................................... 109
Fig. 5.27: FESEM micrographs of ruptured B2 microcapsule at: (a) 500×; (b) 4000×
magnifications ............................................................................................................... 109
Fig. 5.28: Digital microscope images of B2 microcapsules at: (a) freshly prepared (b) 1
month at 26°C (c) 5 months at 26°C (d) 5 months at 10°C .......................................... 111
Fig. 5.29: DSC thermograms of A2 and B2 microcapsules after certain period of times
stored at 10°C ................................................................................................................ 112
Fig. 6.1: Optical microscope images of B2 microcapsules that were embedded in the
epoxy matrix (a) 40× (b) 100× ...................................................................................... 113
Fig. 6.2: Optical microscope images of C2 microcapsules embedded in epoxy matrix: (a)
50 – 500 µm (100×) (b) <50 µm (100×) ....................................................................... 115
Fig. 6.3: FESEM micrographs of sliced epoxy matrix showing cavities previously
occupied by B2 microcapsules: (a) 180× (b) 350× ....................................................... 116
Fig. 6.4: FESEM micrographs of sliced epoxy matrix showing cavities previously
occupied by C2 microcapsules: (a) 300× (b) 1800× (c) 300× (d) 1500× ..................... 116
xviii
Fig. 6.5: Effect of the microcapsules loading on the flexural strength and micro-
indentation hardness (Vickers) of the epoxy matrix ..................................................... 118
Fig. 6.6: Epoxy matrix with 1% of B2 microcapsules .................................................. 118
Fig. 6.7: Scheme of plausible reactions of carboxylic groups of alkyd with (a) epoxy and
(b) amino group ............................................................................................................. 119
Fig. 6.8: FTIR spectra of neat alkyd, epoxy resin and cured epoxy, EA1, EA2 and EA3
samples .......................................................................................................................... 120

xix
LIST OF TABLES
Table 2.1: The selected epoxy resins .............................................................................. 14
Table 2.2: Characteristics of Epikure F205 curing agent................................................ 15
Table 2.3: Important factors for construction of microcapsule-based self-healing system
......................................................................................................................................... 31
Table 3.1: Fatty acid composition of Malaysian palm kernel oil.................................... 49
Table 3.2: Commonly used symbols and definitions in alkyd technology ..................... 51
Table 3.3: Formulation of AlkydPKO65 ........................................................................ 52
Table 3.4: Value of parameters and formulation of AlkydPKO65 ................................. 54
Table 3.5: Details of series of microcapsules ................................................................. 62
Table 4.1: Peak assignments for 1H-NMR spectrum of PKO and AlkydPKO65 ........... 73
Table 4.2: Viscosity of AlkydPKO65 ............................................................................. 78
Table 4.3: Mn , Mw and polydispersity index (PDI) of alkyd and epoxy resins ............... 79
Table 4.4: Characterization data of AlkydPKO65 .......................................................... 81
Table 5.1: Formulation and characterization data of PMUF microcapsules, prepared using
Method 1 ......................................................................................................................... 87
Table 5.2: Formulation and characterization data of PUF microcapsules, prepared using
Method 2 ......................................................................................................................... 90
Table 5.3: Characterization data of PUF microcapsules – Series A ............................... 92
Table 5.4: Characterization data of PMUF microcapsules – Series B and D ................. 97
Table 5.5: Viscosity of core content and epoxy resins ................................................... 99
Table 5.6: Characterization data of microcapsules prepared with sonication............... 101
Table 5.7: TGA data of PUF and PMUF microcapsules .............................................. 108
Table 5.8: Summary of storage conditions of A2 and B2 microcapsules ..................... 110
Table 6.1: Reactions of alkyd, epoxy and amine hardener in different blends ............. 119

xx
LIST OF ABBREVIATIONS
AlkydFA35 : Alkyd with acid number of 55 mg KOH/g alkyd
AlkydPKO65 : Alkyd with 65 % oil length and acid number of 15 mg KOH/g alkyd
DCPD : Dicyclopentadiene
DGEBA : Diglycidyl ether of Bisphenol-A
DSC : Differential scanning calorimeter
EMA : Ethylene(maleic anhydride)
FESEM : Field-emission scanning electron microscopy
1H-NMR : Proton nuclear magnetic resonance
OM : Optical microscope
PDES : Polydiethoxysiloxane
PDMS : Poly(dimethylsiloxane)
PKO : Palm kernel oil
PMMA : Poly(methyl methacrylate)
PMF : Poly(melamine-formaldehyde)
PMUF : Poly(melamine-urea-formaldehyde)
PUF : Poly(urea-formaldehyde)
SENB : Single-edge notched bending
STA : Simultaneous thermal analyzer
TDCB : Tapered double cantilever beam
Tg : Glass transition
TGA : Thermogravimetric analysis
Tm : Melting temperature
WTDCB : Width-tapered double cantilever beam

xxi
LIST OF APPENDICES
Appendix A. Publications (Front page)...…………………………………......... 137
Appendix B: Microencapsulation procedure of Method 3……………………... 140
Appendix C: ATR-FTIR spectra………………………………………………… 141
Appendix D: 1H-NMR spectra ………………………………………………….. 143
Appendix E: DSC thermograms ………………………………………………… 144
Appendix F: TGA thermogram …………………………………………………. 148
Appendix G: STA thermogram …………………………………………………. 151
Appendix H: FESEM micrographs……………………………………………… 153
Appendix I: Mechanical test data ……………………………………………….. 154
Appendix J: Formulation of the epoxy/alkyd blends & core content data ............ 155
Appendix K: Publications of smart materials in Malaysia..................................... 156

1
CHAPTER 1: INTRODUCTION
1.1 Background of Study
The failure of many polymers begins from microcracks formed within the materials
(Kessler, 2012). The undetected or inaccessible microcracks made early repair
unavailable. The microcracks (Fig. 1.1) will then propagate until failure occurs and
consequently will result in major losses. Traditional repairs such as welding and patching
are limited to visible damages and only applicable when the failure has already occurred
or worsened. Furthermore, inspection is needed as these methods are not autonomic nor
instantaneous (Hia et al., 2016).
Fig. 1.1: SEM micrograph of fracture surface with microcracks. Adapted from Li
et al. (2014)
Therefore, self-healing materials was introduced about 15 years ago (White et al.,
2001) to overcome these limitations and intense research has been going on in this field
for the past decade. Self-healing or self-repairing in materials in general and polymers in
particular, is demonstrated by the ability to regain original properties lost during external
damage. Partial recovery of the main functionality of the material also can be considered
as a self-healing ability (Zheludkevich, 2009). Self-healing also can be defined as the
ability of a material to repair damages autonomously, i.e. without any external
intervention. However, the incorporation of self-healing properties in manmade materials

2
very often cannot perform the healing action without an external trigger, thus according
to Ghosh (2009), self-healing can be autonomic or non-autonomic (i.e. needs human
intervention). Synthetically mimicking the biological system of wound healing, materials
should be able to sense and respond to damage over its lifetime, restoring chemical and
physical features without adverse effects (Urban, 2015). Fig. 1.2 shows the healing
mechanism of human skin, where an injury causes a blood vessel wall to break and thus
platelets are activated. They can change shape from round to spiny, stick to the broken
vessel wall and each other and begin to plug the break. Besides, they also interact with
other blood proteins to form fibrin, which forms a net that entraps more platelets and
blood cells, producing a clot that plugs the break. This phenomena has inspired material
scientists in the last two decades to mimic the natural self-healing of living organisms.
Fig. 1.2: Blood clotting in an injured vessel. Reproduced from MSD manuals
consumer version (Moake, 2016) © Merck & Co. Inc
Amongst other methods, self-healing can be achieved particularly via microcapsules-
based. In microcapsules-based self-healing, healing agent is loaded into a matrix material
using microcapsules. When microcracks occur, the microcapsules will break and release
the healing agent to polymerize or cure after reacting with the already embedded catalyst
or even with the matrix host itself. This concept is illustrated in Fig. 1.3.

3
Fig. 1.3: Concept of microcapsules-based self-healing. Adapted from Cho et al.,
2009
1.2 Problem Statement
Different healing agents are introduced to function in different polymeric materials,
involving selected healing mechanism. In particular, there were many research works on
self-healing of epoxy materials. The thermosetting epoxies are useful in a wide variety of
applications, which range from aerospace engineering down to coatings, adhesives and
microelectronics. This is due to their excellent adhesion, thermal and mechanical
properties, superior chemical and corrosion resistance, low shrinkage and good electrical
insulation. However, they are inherently brittle rendering them susceptible to damage in
the form of micro cracks. Material failure generally begins at the nano-scale, which then
develops to the micro- and macro-scales until failure occurs (Takahashi & Ushijima,
2007). Thus, developing self-healing epoxy composites that can repair themselves to
fully/partially recover its functionality is an important venture. Likewise, the introduction
of self-healing functionality into protective epoxy coating is also a better alternative for
long term corrosion protection of metallic structures (Vijayan & AlMaadeed, 2016).
The encapsulated dicyclopentadiene (DCPD) could react with a Grubbs’ catalyst in a
thermosetting epoxy matrix (White et al., 2001). However, the catalyst could lost its
activity upon prolonged exposure to air and moisture. It could interact with
diethylenetriamine (DETA) and loss its ability to crosslink DCPD (Jones et al., 2006). It
was also inevitably expensive and less robust (Coope et al., 2011), besides having a
4
tendency to agglomerate and led to delamination within the samples (Kessler et al., 2003).
Following that, a number of research had been carried out to encapsulate different healing
agents in poly(urea-formaldehyde) (PUF), poly(melamine-formaldehyde) (PMF),
poly(melamine-urea-formaldehyde) (PMUF) and poly(methyl methacrylate) (PMMA)
shells for self-healing epoxy composites and coatings. The healing agents include organic
solvents (Caruso et al., 2007), drying oils (Suryanarayana et al., 2008) and epoxy resin
itself as curing agent. Epoxy was encapsulated as it is more thermally stable than DCPD
and can be applied to polymer manufactured at low and elevated temperatures (>100°C)
(Yuan et al., 2006). To encapsulate the curing agent, particularly amine, which is
amphoteric and highly reactive in nature, is challenging and Yuan et al. (2008) have
proposed the use of PMF instead of PUF, to encapsulate mercaptan (as hardener instead
of amine). Another alternative is to use PMMA as shell material to encapsulate the
hardener as suggested by Li et al. (2013b). Some others variant were also recommended
such as the use of hollow capsules, where the amine was infiltrated by vacuum to
encapsulate the amine inside PUF microcapsules (Jin et al., 2012). Some more recent
research suggested a more complex method of using Pickering emulsion to encapsulate
the amine in the solid particles (McIlroy et al., 2010; Yi et al., 2015).
In general, the microcapsules containing self-healing materials must be able to
withstand the conditions of high temperatures epoxy resins application. Besides, the
preferred should be healing agent that is reasonably priced. Thus, the introduction of less
expensive and more environmental friendly components would be beneficial. The use of
catalyst-free healing agents such as solvents and epoxy resins have been developed in
search of cost reduction (Vijayan & AlMaadeed, 2016), but there are still room for
improvement.

5
1.3 A Selected Alkyd as Healing Agent
In this work, an alkyd resin, a bio-based and relatively cheap healing agent derived
from renewable palm oil, was proposed as healing agent for epoxy matrix. Alkyds are
actually polyesters that were first developed about 87 years ago (Kienle & Ferguson,
1929). They are tough resins typically synthesized from polybasic acid, polyhydric
alcohol and vegetable oil (a triglyceride) such as soya, castor, rapeseed and linseed oils
or the free fatty acids derived from triglyceride. Alkyds are conventionally used in paints,
adhesives, inks and coatings. They have become one of the major synthetic resins in the
coating industry. Alkyd can offer an alternative to their petroleum-based counterpart as it
is relatively cheaper as it is renewable and also very versatile.
The versatility of alkyd is due to its compatibility with a number of polymers such as
nitrocellulose, chlorinated and cyclized rubber and many resins such as phenolic, epoxy,
amino, silicone, hydrocarbon and acrylic. Alkyd resins can also be designed to suit a
broad range of applications by changing the oil length and modifying the chain stopping
agents and the related resins (Hofland, 2012). Moreover, alkyd is high gloss, has good
film performance and fast drying property (Nabuurs et al., 1996).
Normally, the drying or curing mechanism of an alkyd is attributed to the air oxidation
of the unsaturated alkyd structure. Palm oil and palm kernel oil (PKO) are classified as
non-drying oils because of their low level of unsaturation, making their alkyd unable to
air dry. However, this lack of unsaturation can be counteracted by adding a certain
amounts of carboxylic (–COOH) and hydroxyl (–OH) groups, which could be the reactive
sites for other reactions. Here, the reaction of the carboxylic group of alkyd with the
epoxide group of epoxy resin is proposed for the self-healing epoxy. Selection of palm
oil-based alkyds as potential healing agent was also due to their high thermal stability up
to 200°C (Teo et al., 2015), which is suitable for the high temperature process of epoxy
curing.

6
1.4 Research Objectives
Therefore, this study is guided by these three main objectives:
1) Alkyd from palm oil will be synthesized and characterized. Characterization
includes its chemical structure and some relevant physical properties.
2) The alkyd will be encapsulated using amino resins, mainly urea-formaldehyde
(UF) and melamine-urea-formaldehyde (MUF). Factors affecting the synthesis
of the microcapsules be investigated and optimized, i.e. the agitation rates,
core/shell weight ratio, the viscosity of the medium and the emulsifier. The
microcapsules formed will be characterized using thermal and microscopy
analyses. Other relevant characterizations such as chemical structures, size and
yield of microcapsules and the core loading will also be determined.
3) The performance of the microcapsules in the epoxy matrix will be evaluated.
Effect of the inclusion of microcapsules on the mechanical properties of the
epoxy matrix will be investigated. Furthermore, a curing reaction of alkyd with
the epoxy will be examined using blending of epoxy/alkyd and the reaction
will be studied using FTIR.

7
CHAPTER 2: LITERATURE REVIEW
2.1 Introduction
This chapter gives a review on the use of microencapsulation in self-healing polymeric
materials, particularly in epoxy composites and coatings. The microencapsulation process
and related parameters are discussed. The choice of a selected alkyd as healing agent for
epoxy matrix will be explained.
2.2 Self-Healing and Its Development
Ancient Roman and Egyptian civilizations may not know about the self-healing
mechanism, when they created concrete as construction materials. However, they knew
through observations that the construction of a long lasting materials is needed to last
their empire. Their constructions of arches, pipes and monuments such as the Pantheon
and the pyramids are all evidences of long-lasting materials construction technology
(Binder, 2013).
In modern times, the first self-healing material was reported by Malinskii et al. who
studied the laminates of aluminum foil-poly(vinyl acetate). They concluded that self-
healing occurs at the tip of a crack of an unloaded specimen, which led to an increase of
strength during the relaxation time, relative to the strength of an unhealed specimen. This
increase of strength (characterized by the value of the relaxation coefficient β) increases
with temperature, especially near the glass transition and flow temperatures of the
polymer (Malinskii et al., 1969). Several studies of crack healing materials with manual
intervention then appeared in 1970s. Wiederhorn and Townsend (1970) reported 80%
strength recovery of cracks in soda-lime-silica glass during crack closure, due to highly
active surface fracture with dangling bonds and strained Si-O bonds. Inagaki et al. tested
similar glass using an indentation method and concluded that the crack healing was more

8
prevalent in an inert atmosphere, occurring only minimally in air while earlier work by
Wiederhorn and Townsend reported a bigger fracture energy when tested using a double-
cantilever-cleavage technique in dry nitrogen (Inagaki et al., 1985).
The crack healing behavior in hard elastic polypropylene, styrene-butadiene-styrene
(SBS) block copolymers and carbon black filled vulcanized natural rubber was studied.
It is concluded that the microvoids could heal instantaneously or slowly, depending on
the microstructural damage and molecular rearrangements incurred during the debonding
process. The crack healing rate increased with temperature and no healing was observed
below effective Tg of active molecular healing component. The second cycle stress
response depended on the healing time of the fibers between deformation cycles, as
shown in Fig. 2.1. At short healing time (t), considerable stress softening was observed
but at longer times, the original mechanical properties of the fibers were restored as the
crack healed (Wool, 1980).
The studies on crack repairs in polymers used thermal or solvent processes, where the
polymer is softened by heating or by using solvents and the cracks weld themselves in
several stages (Wang et al., 1994). However, to apply the same treatment to a large
composite structure is not practical (Wool, 2001).

9
Fig. 2.1: The effect of healing time on the stress-strain behavior of hard elastic
polypropylene fibers at room temperature. Reproduced from Wool RP (ed. L.H-
Lee) © 1980 Plenum Press
A passive self-repair concept was introduced in the construction field (Dry, 1994),
followed by in polymers (Dry, 1996), where in the latter adhesives and crosslinking or
air cured polymers/ monomers were investigated. Controlled release of adhesive or crack
filler material from a stretched or cracked repair fiber is then used to seal matrix
microcracks and re-bond damaged interfaces. Materials that are capable of passive, smart
self-repair consist of: 1) an agent of internal deterioration such as dynamic loading, which
induces cracking; 2) a stimulus to release the repairing chemical; 3) a fiber; 4) a coating
or fiber wall , which can be removed or changed in response to the stimulus; 5) a chemical
carried inside the fiber; and 6) a method of hardening the chemical in the matrix in the
case of crosslinking polymers or a method of drying the matrix in the case of a monomer
(Dry, 1996; Dry & Sottos, 1993).
The previous manual crack repairs leads to the finding of an autonomous self-healing
approach using microcapsules. White et al., have demonstrated an approach to use
microcapsules containing dicyclopentadiene (DCPD) instead of fibers. The concept is
illustrated in Fig. 2.2, where microencapsulated healing agent is embedded in a structural

10
epoxy matrix containing a catalyst (Grubb’s) capable of polymerizing DCPD.
Microcracks form in the matrix; (a) and rupture the microcapsules to release the healing
agent into the crack plane (b). Then, the DCPD comes in contact with the catalyst, which
is randomly distributed in the matrix and (c) triggers the polymerization reaction that
helps to heal the damage by bonding the crack surfaces (White et al., 2001).
Fig. 2.2: Autonomous self-healing concept introduced by White and co-researchers
in 2001. Reproduced from White et al. © 2001 Nature Pub. Group
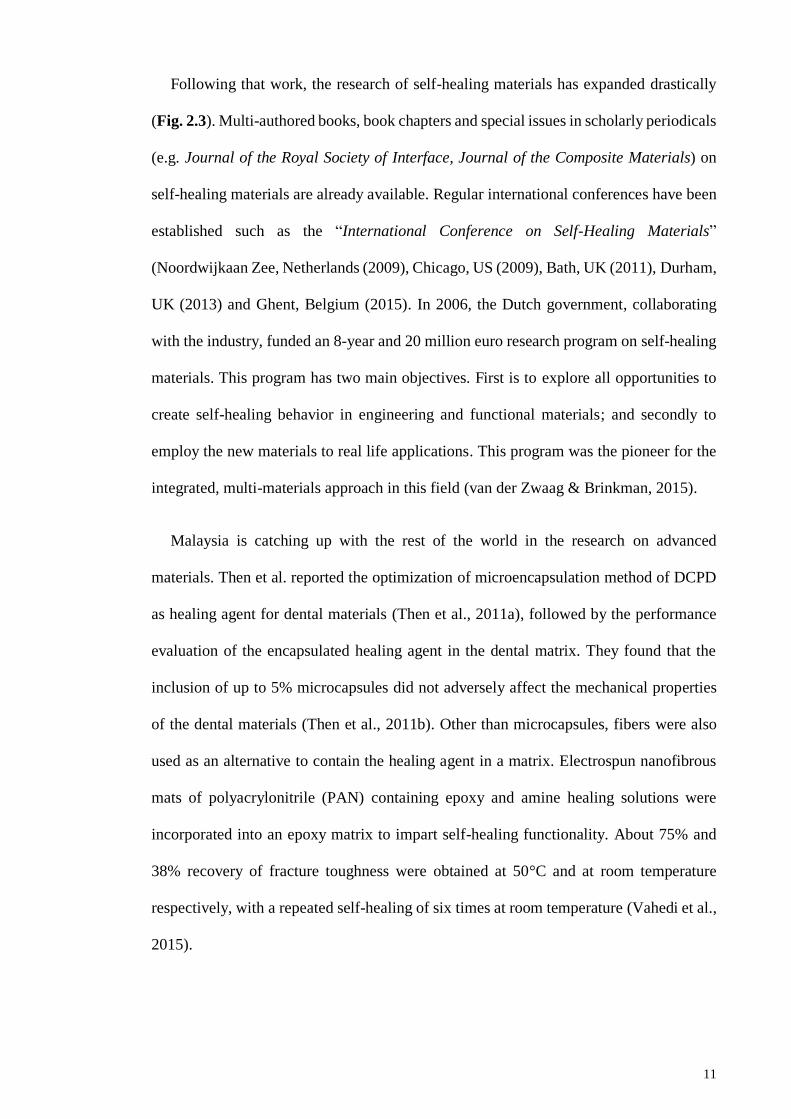
Fig. 2.3: Evolution of the amount of papers published on self-healing materials.
Reproduced from Tittelboom and de Belie © 2013 MDPI
11
Following that work, the research of self-healing materials has expanded drastically
(Fig. 2.3). Multi-authored books, book chapters and special issues in scholarly periodicals
(e.g. Journal of the Royal Society of Interface, Journal of the Composite Materials) on
self-healing materials are already available. Regular international conferences have been
established such as the “International Conference on Self-Healing Materials”
(Noordwijkaan Zee, Netherlands (2009), Chicago, US (2009), Bath, UK (2011), Durham,
UK (2013) and Ghent, Belgium (2015). In 2006, the Dutch government, collaborating
with the industry, funded an 8-year and 20 million euro research program on self-healing
materials. This program has two main objectives. First is to explore all opportunities to
create self-healing behavior in engineering and functional materials; and secondly to
employ the new materials to real life applications. This program was the pioneer for the
integrated, multi-materials approach in this field (van der Zwaag & Brinkman, 2015).
Malaysia is catching up with the rest of the world in the research on advanced
materials. Then et al. reported the optimization of microencapsulation method of DCPD
as healing agent for dental materials (Then et al., 2011a), followed by the performance
evaluation of the encapsulated healing agent in the dental matrix. They found that the
inclusion of up to 5% microcapsules did not adversely affect the mechanical properties
of the dental materials (Then et al., 2011b). Other than microcapsules, fibers were also
used as an alternative to contain the healing agent in a matrix. Electrospun nanofibrous
mats of polyacrylonitrile (PAN) containing epoxy and amine healing solutions were
incorporated into an epoxy matrix to impart self-healing functionality. About 75% and
38% recovery of fracture toughness were obtained at 50°C and at room temperature
respectively, with a repeated self-healing of six times at room temperature (Vahedi et al.,
2015).

12
In another approach, a vibration analysis was used to study the healing of hybrid epoxy
composite with carbon fibers and shape memory alloy (SMA) wires. Alebrahim et al.
used the Timoshenko beam model and used various volume fractions of wires in the
epoxy. They found that a volume fraction of 2.5% can repair the defected beam as healthy
one. It was observed that, using high volume fraction of SMA wires can significantly
reduce deflection (Alebrahim et al., 2015).
An interesting work has investigated two local indigenous micro-organisms, P.
mirabilis and P. vulgaris, which were isolated from soil and can produce calcium
carbonate. Broken concrete was treated by a medium culture containing micro-organisms.
The result showed that cracked concrete could be filled by calcium carbonate after the
treatment, although it has affected the strength of concrete (Talaiekhozani et al., 2014).
Application of a grounded group decision-making (GGDM) model to find the optimal
inoculation method of the bacteria used in biological self-healing concrete has also been
developed (Keyvanfar et al., 2014).
In a different approach, encapsulated zeolite in PUF microcapsules were incorporated
into an anti-fouling coating. This was to prevent corrosion induced by bacteria in saline
environment (Ahdash et al., 2014). The corrosion behavior was investigated through salt
spray test and immersion tests in nutrient rich simulated seawater (NRSS) medium with
Pseudomonas aeruginosa bacteria. The thickness for self-healing coating was between
50 μm to 175 μm. The embedded microcapsules did not affect the adhesion of the coating
on steel substrates. The release of the core material after rupturing the microcapsules gave
total healing for the crack after 21 days left at room temperature. Both specimens
immersed in salt spray chamber and NRSS medium with the bacteria showed excellent
anti-corrosion properties (Hamzah & Ahdash, 2016).

13
In other work, epoxy/mercaptan microcapsules were dispersed into a commercialized
two-part epoxy adhesive layer of about 180 um thickness. 12% to 28% recovery of the
shear strength were achieved after self-healing depending on the microcapsules content.
The self-healing adhesives exhibited recovery of both cohesion and adhesion properties
with room temperature healing (Ghazali et al., 2016a). Similar encapsulated healing
agents with 1:1 ratio in carbon fiber/epoxy laminates were also tested, giving a 80%
recovery of fracture toughness when measured using width-tapered double cantilever
beam (WTDCB). It was also observed that the recovery of fracture toughness was directly
correlated with the amount of healant covering the fracture plane, with the highest healing
efficiency obtained for the laminate with large capsules (Ghazali et al., 2016b).
In intrinsic healing, Sirajudin and co-researchers demonstrated a 92% of tensile
strength recovery in their poly(2-hydroxyethylmethacrylate) (HEMA) hydrogel, using 1-
cystine as a crosslinker (Sirajuddin et al., 2014). They used the fluorescence by UV light
to capture the image of healed gel, to demonstrate the diffusion of the gel. The
intermolecular diffusion mechanism was proposed to be responsible for the healing
(Sirajuddin & Jamil, 2015). Summary of the other self-healing works in Malaysia are
available in Appendix K.
2.3 Epoxy in Industries
Epoxy resin is one of the important class of polymeric materials, characterized by the
presence of more than one three-membered ring known as the epoxy, epoxide or oxirane
group. By strict definition, epoxy resins refer only to un-crosslinked monomers or
oligomers containing epoxy groups. However, in practice, the term epoxy resins is loosely
used to include cured epoxy systems (Pham & Marks, 2005). The most commonly used
epoxy resins is the diglycidylether of bisphenol-A (DGEBA) and its structure is shown
in Fig. 2.4. This resin is commercially available under the tradenames such as Epikote

14
828 or Epon 828 (Hexion), DER (Dow Chemical Company) and Araldite (BASF) to
name a few.
C
CH3
CH3
O OH2C C
H
H2C
OH
OH2C C
CH3
CH3
OH2C C
HCH2
O
CH
H2C
O
Fig. 2.4: Chemical structure of DGEBA resin
Epoxy resins are also available in other variants with different viscosity and epoxy
equivalent. For example, Epikote 240, a relatively lower epoxy resin than Epikote 828, is
a blend of a bisphenol A resin (produced from bisphenol A and epichlorohydrin) and a
bisphenol F resin (produced from bisphenol F and epichlorohydrin), with added
proportion of a mono-epoxidised alcohol as a reactive diluent. The weight of epoxy
equivalent of this resin is in the same range as that of Epikote 828. Properties of selected
epoxy resins are listed in Table 2.1.
Table 2.1: The selected epoxy resins
Epoxy resin Viscosity at
25°C (Pa.s)
Epoxy group
content (mmol/kg)
Epoxy equivalent
(g/equivalent)
Epikote 828 12.0 – 14.0 5260 – 5420 184 – 190
Epikote 240 0.7–1.1 5100 – 5400 185 – 196
Source: Hexion Inc. technical datasheet (Hexion.com, 2005, 2007).
Crosslinking agents are used to convert epoxy resins into hard, infusible thermoset
networks. These crosslinkers, hardeners or curing agents promote crosslinking or curing
of the epoxy. Curing occurs by either homopolymerization initiated by a catalytic curing
agent or a polyaddition/ copolymerization reaction with multifunctional curing agent
(Ellis, 1993). A wide choice of hardeners are available for cure at room or elevated
temperatures. These include amines and derivatives, amides, carboxylic acid functional
polyesters, anhydrides, phenol-formaldehyde resins and amino-formaldehyde resins are
available as hardeners. However, the most common used curing agents are from the amine

15
groups. A modified cycloaliphatic amine, Epikure F205 was used as hardener in this study
and its properties are listed in Table 2.2.
Table 2.2: Characteristics of Epikure F205 curing agent
Epikure F205 Characteristics
Viscosity at 25°C (Pa.s) 0.5 – 0.7
Basic nitrogen content (% M / m) 6.0 – 8.0
Hydrogen equivalent (g/equivalent) 102 – 106
Recommended proportion of
Epikote 828 (parts resin per
hundreds part resins, p.h.r)
58
Source: Hexion Inc. technical datasheet (Hexion.com, 2006).
Carboxylic acid functional polyesters and anhydrides are the second most important
family of curing agents for epoxy resins. The mechanism of the curing reaction involves
two stages: (a) addition of carboxyl group to the epoxy functionality and (b) esterification
with the secondary hydroxyls on the epoxy backbone (Fig. 2.5).
Fig. 2.5: Scheme of curing reaction between epoxy resin and carboxylic acid
functional polyester hardener
Although having excellent thermal and chemical resistance, good adhesion and
mechanical properties, epoxies are brittle in nature and susceptible to damage induced by
mechanical, chemical, thermal, UV-radiationor a combination of these factors. Thus, it
can be seen that the development of autonomous self-healing epoxy is a rapidly growing
research and certain examples are presented in the next sections.

16
2.4 Self-Healing Epoxy
Self-healing can be categorized into two major types; first is the intrinsic self-healing
(Fig. 2.6 (a)), where healing is achieved by the material itself through its chemical nature.
The self-repair is achieved through reversibility of bonding of the polymer matrix. It can
be accomplished through several approaches, i.e. via thermally reversible reactions,
hydrogen bonding, ionomeric arrangementsor molecular diffusion and entanglement.
Second is the extrinsic self-healing, where the healing property is obtained by adding
healing agent/s (in/through microcapsules or vasculatures) to the material , which is to be
healed. Here, the agent is loaded using pipelines or vascular channels or filled
microcapsules as the material itself lacks self-healing mechanism, as illustrated in Fig.
2.6 (b-c). For vascular materials (b), the healing agent is stored in hollow channels or
fibers until damage ruptures the vasculature and releases the healing agent. In
(micro/nano) capsule-based self-healing materials (c), the healing agent is stored in
capsules until they are ruptured by damage or dissolved.
Fig. 2.6: Approaches to self-healing (a) intrinsic (b) vascular-based (c)
(micro/nano) capsule-based. Adapted from Blaiszik et al. © 2010 Annual Reviews
2.4.1 Intrinsic Self-Healing Epoxy
As demonstrated by Wudl and his co-researchers, the intrinsic self-healing utilized the
reversible reactions of furan-maleimide to produce healing (Chen et al., 2002; Chen et
al., 2003; Murphy et al., 2008). The reversible reaction however, is not possible for
17
thermoset system such as epoxy. The curing reactions of epoxy with hardeners are
generally irreversible, thus conventional epoxy can hardly exhibit re-mendable behavior
due to lack of the ability of the broken molecules to be recombined. However, two new
epoxy with furan and maleimide functionalities later have been introduced. This new
group of thermoset was found to possess similar mechanical properties as the commercial
epoxy and was also thermally mendable through the reactions of Diels-Alder (DA) and
reversed Diels-Alder (rDA) (Tian et al., 2010; Tian et al., 2009). In another approach,
Hayes et al. and Pingkarawat et al. have used blends of thermoplastic in epoxy resin to
induce intrinsic healing with thermal stimulus of 150°C for a short period (Hayes et al.,
2007; Pingkarawat et al., 2015).
2.4.2 Vascular-Based Self-Healing Epoxy
In this type of extrinsic healing, the healing agent is introduced into the vascular
network after the network has been integrated in the matrix host. It provides multiple
connection points and access to a larger reservoir of healing agents, which increases the
reliability of the system (Blaiszik et al., 2010). One of its advantages is the easier refilling
of the healing agent. One-dimensional vascular network was introduced by Dry and co-
workers, to obtain healing abilities in epoxies with glass pipettes preloaded with
cyanoacrylate or a separated two-epoxy system (Dry, 1996; Dry & Sottos, 1993). Toohey
and co-workers demonstrated a 3D network of microchannels , which utilized the epoxy-
Grubb’s catalyst (Toohey et al., 2007) and two-part epoxy chemistries (Toohey et al.,
2009), that showed 7 and 16 repeated healing cycles for respective systems.
2.4.3 Microcapsules-Based Self-Healing Epoxy
Although vascular design has allowed multiple healing and is highly reliable, the
complexity in designing/manufacturing the networks limits its usage. Thus, the use of
microcapsule-based systems has attracted more attention during the last decade. The

18
advantages of this system include the aesthetic recovery combined with the very fast
release of healing agent from the microcapsules (Ullah et al., 2016). Moreover, the
microcapsule-based approach are easily integrated in most polymer systems, although
their function is locally depleted after a single damage event (Blaiszik et al., 2010). The
importance of the microcapsules-based self-healing study was reflected in the number of
publications as shown in Fig. 2.7.
Fig. 2.7: Number of publications per year (2005-2014) shown by Google Scholar
and ScienceDirect; keywords “Microcapsules based self-healing materials”.
Reproduced from Ullah et al. © 2015 Taylor & Francis
The design cycle for microcapsules-based self-healing materials, according to Blaiszik
et al., can be divided into 5 steps: the development (encapsulation), integration or
incorporation, mechanical characterization, triggering and healing evaluation. The steps
are illustrated in Fig. 2.8 (a). The first step is to determine the optimal encapsulation
method for the healing agent and its curing/healing mechanism. The encapsulation
parameters such as solubility, reactivity, viscosity and volatility need to be considered.
Next is the integration/ embedment of the microcapsules into the matrix host. The shear
forces, induced on the microcapsules during mixing, processing temperature, capsules-
matrix reactivity and capsules size may vary. UF, MF/MUF and PU capsules used for

19
self-healing have shown the ability to withstand processing conditions in common
thermoset resins and composites manufacturing. After incorporation of capsules into
matrix host, the mechanical properties, triggering mechanism and healing performance
can be characterized. Several characteristics of microcapsules such as their bond strength
with the matrix, volume fraction and stiffness may affect mechanical properties of the
healed materials such fracture toughness, tensile and hardness (Blaiszik et al., 2010).
This work will focus on the development of the encapsulation of the selected healing
agent, the integration of the microcapsules into a selected epoxy matrix and the selected
mechanical characterization of the epoxy matrix. Only preliminary work of the healing
evaluation will be presented.
Several types of microcapsules have been designed for self-healing, which include the
microcapsules-catalyst system, dual/ multi-capsules system, microcapsules with latent
hardener and phase separation, as shown in Fig. 2.8 (b).
Fig. 2.8: (a) Design cycle of microcapsules-based self-healing material (b)
approaches of microcapsules loading into matrix. Reproduced from Blaiszik et al.
© 2010 Annual Reviews

20
Following White et al., approach in using Grubb’s catalyst for self-healing (White et
al., 2001), subsequently, Jin and co-workers demonstrated a self-healing epoxy adhesive
by incorporating a two-part healing system of 15 wt. % micro-encapsulated DCPD and
2.5 wt. % Grubbs’ catalyst. The addition of both components to the neat resin epoxy
increased the virgin fracture toughness by 26% and a 56% recovery of fracture toughness
after 24 h healing at room temperature (Jin et al., 2011). Later, they expanded the self-
healing work to a high temperature (110°C for 3 h) cured rubber-toughened epoxy
adhesive of ca. 750 mm thickness. Endo-DCPD was encapsulated in a more thermally
stable, double-walled polyurethane (PU)/UF, which was designed to survive the specific
epoxy’s harsh curing conditions. Recovery of virgin fracture toughness ranging from 20%
to 58% were obtained after assessment with WTDCB test (Jin et al., 2013).
As has been observed, the microcapsules and catalyst self-healing system also has few
drawbacks. A poor dispersion of the catalyst and the amine hardener (diethylenetriamine,
DETA) destructive attack on the Grubb’s catalyst have been reported, which limit the
healing efficiency. A new system of encapsulating the catalyst was introduced by Rule et
al. The reactivity of the catalyst can be preserved when they were included into the wax
microspheres, before being dispersed in the epoxy matrix. A good dispersion of the
catalyst was also observed, resulting in efficient healing (maximum 93%) with
significantly lower amount of embedded catalyst than the non-wax-encapsulated catalyst
(Rule et al., 2005). Although Grubbs’ catalyst has a nearly ideal chemical selectivity, its
high cost, restricted availability and limited temperature stability preclude its use in high
volume, commercial composite and polymeric parts.
An alternative catalyst for DCPD polymerization was introduced, which is cost-
effective, widely available and tolerant of moderate temperature excursions.
Tungsten(VI) chloride was used as a catalyst precursor for the ring-opening metathesis
21
polymerization of exo-DCPD and have demonstrated an in situ healing using 15 wt. %
microcapsules with efficiency of approximately 20% (Kamphaus et al., 2008).
Meanwhile, Coope et al. have demonstrated another type of chemistry, which used
metal triflates as effective Lewis acid catalyst to initiate DGEBA curing. This catalyst
was chosen due to its catalytic activity, relatively low cost and toxicity, high stability and
availability (Yadav et al., 2006). The epoxy matrix was embedded with DGEBA, ethyl
phenyl acetate microcapsules and scandium(III) triflate catalyst particles as self-healing
agents. The achieved healing performances, which were tested using modified tapered
double cantilever beam (TDCB) specimen, were comparable to the more expensive and
less robust (air and moisture sensitive) Grubbs’ catalyst/ DCPD-capsule system (Coope
et al., 2011).
In the multi-capsules type of self-healing, a two-part resin system, containing an epoxy
resin and its hardener (mercaptan) was introduced whereby the PMF shell was chosen
due to its inert properties towards the core. Healing effect was observed at low capsule
content, i.e. 43.5% healing efficiency with 1 wt. % capsules and 104.5% healing
efficiency with 5 wt. % capsules at 20 °C for 24 h (Yuan et al., 2008). Several years
before, a similar approach but using hollow fibers or vascular method was demonstrated
by Pang and Bond (2005).
In another approach, a two-component microcapsules system consisting of epoxy and
boron trifluoride diethyl etherate ((C2H5)2O·BF3) as hardener was introduced for self-
healing epoxy composites. Boron trifluoride diethyl etherate has been commercially used
as a hardener for low temperature, fast-cure epoxy adhesives. Curing of epoxy by this
hardener is by cationic chain polymerization, which is a fast reaction at ambient
temperature with low catalyst concentration. A recovery of 80% of impact strength was
detected within 30 min at 20°C, at only 5 wt. % epoxy- and 1wt. % of ((C2H5)2O·BF3)-
22
loaded microcapsules. The mechanical properties of the matrix were retained due to the
healing effect at low microcapsules content. In addition, stoichiometric ratio between the
polymerizable component and its hardener was unnecessary and the healing ability
remained unchanged within 5 months. The only drawback of this system was that the
high reaction rate of the healing agent resulted in incomplete curing of the epoxy (Xiao
et al., 2009).
Jin et al., later introduced a new approach to encapsulate the amine (as epoxy
hardener). One microcapsule contained the diluted epoxy resin while another contained
the amine. The hardener-containing microcapsules were prepared by vacuum-infiltrating
the amine into hollow PUF microcapsules while the epoxy microcapsules were prepared
by an in situ polymerization method. A 91% recovery of mode-I fracture toughness was
obtained in the epoxy matrix with the optimal mass ratio of amine: epoxy microcapsules
of 4:6. The aforementioned healing efficiency was achieved with 7 wt. % and 10.5 wt. %
of amine and epoxy microcapsules respectively. Moreover, a six month storage stability
was demonstrated at ambient conditions (Jin et al., 2012).
Recently, to overcome the challenges in encapsulating the hardener for epoxy resins,
a possibility to use PMMA as shell instead of the amino resins was demonstrated. The
PMMA microcapsules can withstand 6-12 months storage at room temperature (Li et al.,
2013b). They have obtained 43.5% and 84.5% fracture toughness recovery with 5 wt. %
and 15 wt. % of microcapsules respectively, at room temperature for 24 h curing (Li et
al., 2013a).
In the third approach, microcapsules-latent functionality concept was used where the
healing agent is encapsulated or dispersed as particles and the polymerizer is residual
reactive functionality in the matrix or an environmental stimulus (Blaiszik et al., 2010).
This type of self-healing was first introduced by Yin and colleagues. They used an epoxy

23
resin as curing agent and distributed a well dispersed latent hardener in a matrix, which
is also epoxy-based. As a result, repair of the cracked sites was completed through curing
of the released epoxy (Yin et al., 2007). Another example of this system as shown by
Caruso et al., utilizes solvents as healing agent. Here, residual amine functionality in an
epoxy matrix is used to initiate polymerization with healing agent (Caruso et al., 2007).
Other works have incorporated a meltable, thermally polymerizable epoxy microspheres
into epoxy composite materials to induce self-healing (Zako & Takano, 1999) and also
water-soluble, self-curing epoxy-amine adduct particles in a protective film on a steel
substrate (Sauvant-Moynot et al., 2008).
In the fourth approach, a simplified processing method of capsules-catalyst has been
suggested by Cho et al. by encapsulating the catalyst and dispersed the healing agent
throughout the matrix. Although encapsulated-catalyst healing system was used, the
siloxane-based healing agents, i.e. hydroxyl end-functionalized polydimethylsiloxane
(HOPDMS) and polydiethoxysiloxane (PDES) mixture were not encapsulated. Owing to
their low solubility, the siloxane-based polymers and the encapsulated butyltin di-laurate
catalyst mixture were directly blended with the vinyl ester prepolymer, forming a
distribution of stable phase-separated droplets and protected catalyst (Fig. 2.9). No
reactions took place between the HOPDMS and PDES prior to exposure to the catalyst.
The authors claimed a stable healing chemistry in humid or wet environments and a stable
system for elevated temperature (important for higher thermoset-curing system). The
siloxane-based are also widely available and comparatively low in cost (Cho et al., 2006).

24
Fig. 2.9: Polydimethylsiloxane (PDMS)-based self-healing is achieved through the
tin-catalyzed polycondensation of phase-separated droplets. Reproduced from Cho
et al. ©2006 Wiley-VCH
2.4.4 Self-Healing Epoxy Coating
Another attractive application of self-healing is in the epoxy coating. A self-healing
epoxy coating system was first introduced by Toohey and co-workers when they included
microvascular networks into an epoxy coating. The networks bring the healing agent
when cracks occur, thus healed the cracks (Toohey et al., 2007). A concept of self-healing
using a drying oil was introduced in low molecular epoxy coating diluted with solvents.
Cracks in a paint film were healed when linseed oil was released from microcapsules
ruptured under simulated mechanical action. The linseed oil healed area was found to
prevent corrosion of the substrate (Suryanarayana et al., 2008).
The encapsulated linseed oil along with solvents and dispersing agent were added to
the epoxy coating. Two types of coatings were compared; one was filled with talc as
fillers and the other was filled with microcapsules. At the same amount of filler, the latter
formed fewer and smaller cracks. The enhanced impact resistance of the microcapsules-
filled coating might be due to higher elasticity of microcapsule polymeric material
compared to hard inorganic filler particles (i.e. plasticizer effect). The addition of
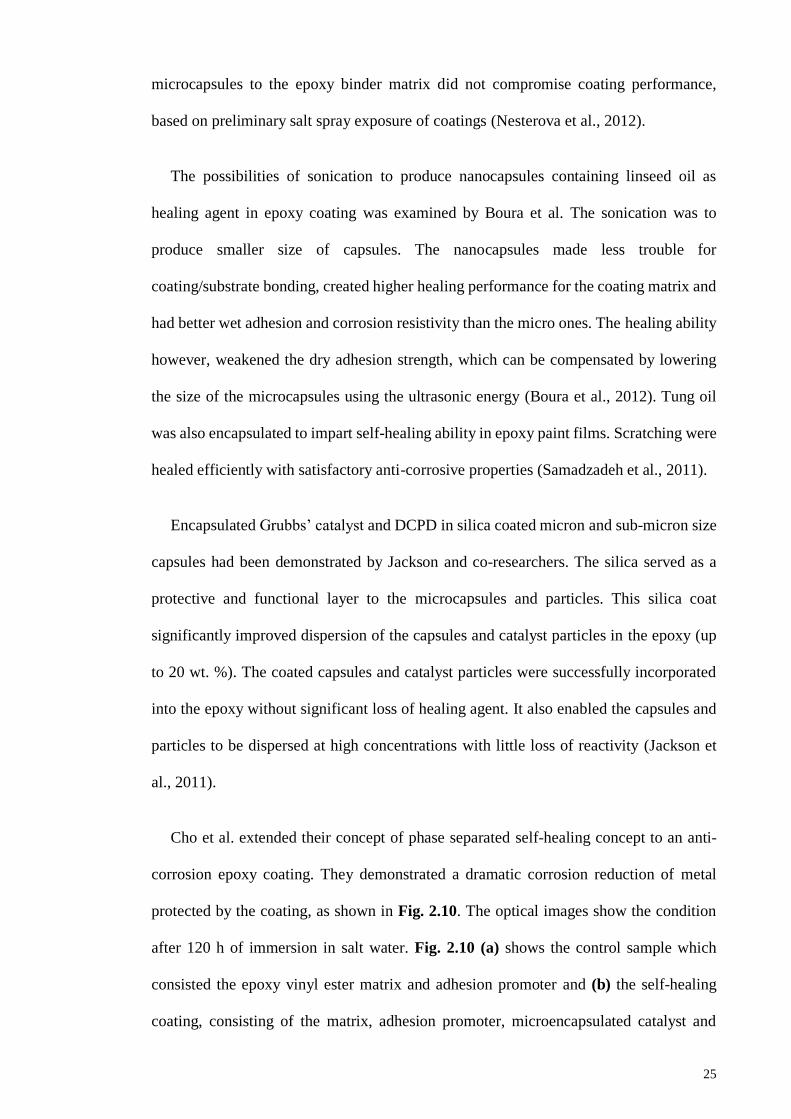
25
microcapsules to the epoxy binder matrix did not compromise coating performance,
based on preliminary salt spray exposure of coatings (Nesterova et al., 2012).
The possibilities of sonication to produce nanocapsules containing linseed oil as
healing agent in epoxy coating was examined by Boura et al. The sonication was to
produce smaller size of capsules. The nanocapsules made less trouble for
coating/substrate bonding, created higher healing performance for the coating matrix and
had better wet adhesion and corrosion resistivity than the micro ones. The healing ability
however, weakened the dry adhesion strength, which can be compensated by lowering
the size of the microcapsules using the ultrasonic energy (Boura et al., 2012). Tung oil
was also encapsulated to impart self-healing ability in epoxy paint films. Scratching were
healed efficiently with satisfactory anti-corrosive properties (Samadzadeh et al., 2011).
Encapsulated Grubbs’ catalyst and DCPD in silica coated micron and sub-micron size
capsules had been demonstrated by Jackson and co-researchers. The silica served as a
protective and functional layer to the microcapsules and particles. This silica coat
significantly improved dispersion of the capsules and catalyst particles in the epoxy (up
to 20 wt. %). The coated capsules and catalyst particles were successfully incorporated
into the epoxy without significant loss of healing agent. It also enabled the capsules and
particles to be dispersed at high concentrations with little loss of reactivity (Jackson et
al., 2011).
Cho et al. extended their concept of phase separated self-healing concept to an anti-
corrosion epoxy coating. They demonstrated a dramatic corrosion reduction of metal
protected by the coating, as shown in Fig. 2.10. The optical images show the condition
after 120 h of immersion in salt water. Fig. 2.10 (a) shows the control sample which
consisted the epoxy vinyl ester matrix and adhesion promoter and (b) the self-healing
coating, consisting of the matrix, adhesion promoter, microencapsulated catalyst and

26
phase-separated PDMS healing agent. The SEM images of the scribed region of (c) the
control coating and (d) the self-healing coating after healing were also shown (Cho et al.,
2009).
Fig. 2.10: (a,b) Optical images after 120 h immersion in salt water of (a) control
sample (b) self-healing coating; (c,d) SEM images of the scribed region of (c) the
control coating (d) the self-healing coating after healing. Reproduced from Cho et
al. © 2009 Wiley-VCH
2.5 Alkyd as Potential Healing Agent
Alkyds are mostly used for surface coatings such as in paints, enamels, lacquers and
varnishes, in which the resins function as binders, forming a tough continuous film that
adheres to the coated object. Other uses include as ink binders, caulks, adhesives and
plasticizers (Jones, 2012). As it is versatile, it can be tailored to have functionalities such
as carboxyl and hydroxyl, which are used in crosslinking reactions with other resins.
2.5.1 Epoxy/Alkyd Reaction
The interaction between alkyd and epoxy resins normally exists in the form of
blending. Epoxy and alkyd are normally blended in order to improve properties of

27
individual resin, usually for coating application. Blending can be physical or chemical
combination making use of each resin’s superior properties. Several works have studied
the blending of alkyds and epoxies, their characteristics and performance in coatings.
Coatings with better drying time, hardness, flexibility and gloss amongst others, were
reported by blending a nahar seed oil-based alkyd with epoxy (Dutta et al., 2006). A palm
oil-based alkyd have also been used to blend with epoxy, also meant for coating
applications (Issam et al., 2011; Ong et al., 2015). Assanvo et al. used a Ricinodendron
heudelotii oil-based alkyd blended with epoxy resin to improve the performance of
potential coatings (Assanvo et al., 2015). All these works showed good compatibility of
the blending and have improved the coating properties. In different application, a
Jatropha curcas oil-based alkyd/epoxy blends was used as bio-reinforced composites and
been reinforced with expanded graphite (Gogoi et al., 2014).
Palm oil-based alkyds were also found to be compatible with epoxidized natural rubber
(ENR) and formed some crosslinking, which could modify the properties of rubber
compounds (Khong & Gan, 2013; Lee et al., 2011). Moreover, the crosslinking reaction
between carboxylic acid functional polyesters with epoxy resins is used for the epoxy
cure as has been detailed earlier (Section 2.3). As alkyd is versatile and can be
synthesized with a certain amount of carboxylic acid, the reaction of crosslinking between
these two resins is being proposed in this work as a healing reaction in an epoxy matrix.
2.5.2 Palm Kernel Oil as Source of Fatty Acids and the Polyol
Palm oil is extracted from palm tree, a versatile plant oil compared to other vegetable
oils (Basiron, 2007) and has become an important raw material in the world’s oil and fat
(Kongsager & Reenberg, 2012). Oil palm in Malaysia is a century old and was introduced
as an ornamental in 1871. The oil palm was commercially exploited as an oil crop from
1911, when the first palm plantation was established (Basiron & Weng, 2004). Malaysia

28
is the second largest producer and the largest exporter of the world palm oil. Until 2005,
palm oil has accounted for 11% of the world’s production of oils and fats and 26% of
export trade of oils and fats (Sime Darby, 2011).
Palm fruit contains an outer mesocarp, which produces palm oil and the hard, inside
layer kernel that gives palm kernel oil (PKO). These two oils are different in their fatty
acid composition, while PKO is similar to coconut oil in terms of fatty acids composition.
The PKO is also called the lauric oil due to its high content of lauric acid. Palm kernel
production is about 10% of the quantity of palm oil produced (Basiron, 2007). While
palm oil is used mainly for food, PKO goes mainly into the oleochemical industry for
making soaps, detergents and toiletry products. PKO was used as a source of fatty acid in
this work, to synthesize the alkyd. PKO has low unsaturation or double bonds, as reflected
in their Iodine value (Wijs) of ~18. It is yellow in color, semi-solid at room temperature
and is refined physically for edible and inedible purposes.
2.5.3 Alkyd Synthesis
Alkyds are polyesters that can be obtained by the polycondensation of three
monomers; polyols, dicarboxylic acids or anhydrides and natural fatty acids or
triglycerides. They can be made directly from oils (monoglyceride process) or from the
fatty acids; and either with or without solvents (fusion). These two have respective
advantages, for instance, solvent cook gives better temperature and viscosity control
while fusion cook requires simpler preparation and less expensive to operate (Patton,
1962).
In monoglycerides process, the oil is first reacted with sufficient glycerol to give the
total desired glycerol content. Phthalic anhydride (PA) is one of the most commonly used
anhydride in alkyd cook. Since it is not soluble in the oil, but is soluble in the glycerol,
transesterification of oil with glycerol must be carried out as a separate step before the

29
PA is added; otherwise, glyceryl phthalate gel particles would form early in the process
(Wicks, 2002). This two-stage procedure is often called the monoglyceride process. Here,
the insoluble polyol and glycerides phases are converted into a single monoglyceride
phase. Although the process is called the monoglyceride process, the transesterification
reaction actually results in a mixture of unreacted glycerol, monoglycerides, diglycerides
and unconverted drying oil. The composition depends on the ratio of glycerol to oil and
on catalyst, time and temperature (Wicks, 2002). The transesterification runs at 230–
250°C in the presence of a catalyst, such as calcium hydroxide and lithium hydroxide.
The completion of reaction is measured by the change of acidity of the reacted PA and
the extent of reaction can be calculated by measuring the acid number of the alkyd
produced.
In the other method, fatty acids are used instead of oils, hence the name, fatty acid
process. Here, the synthesis can be performed in a single step with reduced time in the
reactor. Any polyol, polyol blends, fatty acid or fatty acid blends can produce alkyd, with
greater freedom in formulation and improved performance properties (Patton, 1962).
However, the cost of separating fatty acids from the reaction mixture increases the cost
of the alkyd (Wicks, 2002). Other drawbacks include the corrosive nature of fatty acids,
which necessitates the use of corrosion resistant equipment and the susceptibility of this
type of alkyd to discoloration during storage (Patton, 1962).
2.6 Microencapsulation for Self-Healing
Microencapsulation is the process of coating small solid particles, liquid droplets or
gas bubbles with a thin film of coating or shell materials. Microcapsule is used to describe
particles with diameters between 1 and 1000 µm (Thies, 2005). Microcapsules consist of
a core-shell structure where the active substance is surrounded by a membrane (reservoir
system) and the particles range from ca. 1-1000 µm in diameters (Lamprecht & Bodmeier,

30
2010). The shell or wall material of the microcapsules and the process of encapsulation
are selected according to the physical properties of the core and the intended application.
There are many reasons certain materials are encapsulated. The microcapsules are used
to increase the storage life of a volatile compound. Core substance can also be protected
from the effects of UV rays, moisture and oxygen using microcapsules. Besides, chemical
reaction between two active species can be prevented by physical separation using
microencapsulation. Microcapsules are also able to preserve a substance in a finely
divided state so the substance can be released as required. Encapsulation of liquid can
effectively convert the liquid to a fine powder solid form, while preserving the reactivity
of the liquid core. By doing this, it can improve the ease in the handling of the liquid
reactants.
Since around 1950s (Green & Schleicher, 1957), microencapsulation technology has
widely been used in various fields including imaging applications, toners for
electrophotography and thermo-sensitive printing paper. Carbonless copy paper was the
first large scale commercial application of microcapsules (Konishi et al., 1974).
Microencapsulation is currently widely applied in the pharmaceutical industry to mask
the taste and odor of the drugs and also for drug delivery. Microcapsules are used in
biomedical and biological applications, food ingredients or additives and pesticides and
agrochemicals. They have also been used to encapsulate fragrances, catalysts, edible and
inedible oils and self-healing agent.
Microcapsules containing self-healing agents are embedded into polymeric materials
during its manufacturing stage. In the case of a crack, these microcapsules are ruptured
and the agent is poured into cracks and solidifies when reacted with the catalyst or the
matrix itself. Liquid active agents including monomers, dyes, catalysts and hardeners are
encapsulated to suit the chemistry of the intended matrix and applications. These active

31
agents behave like internal glue that seal the polymeric matrix from inside the system.
Some materials that have been developed to have self-healing capabilities include
ionomers, concrete, elastomers, ceramics, metals and alloys and polymeric materials.
There are several important factors to be considered in designing a microcapsules-
based self-healing system. These include the healing agent must be inert to the polymer
shell and the microcapsules should be compatible with the host matrix. The monomer/
healing agent should has low volatility and low viscosity to promote capillary flow to
cracks. The characteristics of each factor are summarized in Table 2.3.
Table 2.3: Important factors for construction of microcapsule-based self-healing
system
Parameters Influencing factors
Microcapsule Healing agent must be inert to the polymer shell
Longer shelf life of the capsules
Compatibility with the dispersion polymer medium
Weak shell wall to enhance rupture
Proximity to catalyst
Strong interfacial attraction between polymer matrix and
capsule shell wall to promote shell rupture
Monomer Low viscosity monomer to flow to the crack upon capillary
action
Less volatility to allow sufficient time for
polymerization/curing
Polymerization/curing
mechanism
Should be fast
Stress relaxation and no cure induced shrinkage
Ideally room temperature polymerization
Catalyst Dissolve in monomer
No agglomeration with matrix polymer
Healing Must be fast
Multiple
Monomer Low viscosity monomer to flow to the crack upon capillary
action
Less volatility to allow sufficient time for
polymerization/curing
Source: Ghosh (2009).

32
2.6.1 Amino Resins
Amino resins are thermosetting plastic materials that are produced by the reaction
between amino group (NH bearing compounds such as aniline, guanamines, urea,
melamines, thiourea, ethylene urea and sulfonamide) and formaldehyde. The two most
popular amino resins are urea-formaldehyde (UF) and melamine-formaldehyde (MF).
The structures of UF and MF resins are shown in Fig. 2.11. Amino resins are also used
as curing agents for epoxy resins: first, through the etherification process with loss of
water or alcohol; second through the addition reaction of N-methylol groups to the epoxy
functionality (Ellis, 1993).
Fig. 2.11: Chemical structures of UF and MF resins
In addition to their light color, both UF and MF resins exhibit enhanced water and
heat resistance. The major producer of MF resins is American Cyanamid Company,
having begun the first commercial manufacture in the U.S. in 1939. Other manufacturers
include Fiberite Corp., Ciba-Geigy Corp. and Allied Corp (Ibeh, 1998). These resins are
widely used in industries as adhesives, impregnating resins, molding materials,
strengtheners for building materials, flame retardant coatings, foamed resins for many
purposes, grinding wheels, ion-exchange resins, sewage flocculants and microcapsule
production. However, the woodworking industry shown the largest usage of amino resins,

33
for examples as resin glues in the particle board, plywood and furniture industries (Diem
et al., 2010).
2.6.2 Urea-Formaldehyde Resin (UF) and Melamine-Modified UF (MUF) Resin
as Shell of Microcapsules
As mentioned earlier, urea-formaldehyde (UF) resins are widely used in adhesives,
particleboard, molded objects and in specialized applications such as in the fabrication of
natural fiber reinforced polymers (Singha & Thakur, 2008). UF has also been used in the
preparation of microcapsules due to several reasons. It can be crosslinked to form the
shells that protect the healing agents. Nanoparticles of UF would deposit on the shell, to
form a rough surface that aids in the adhesion of the microcapsules with the polymer
matrix (Murphy & Wudl, 2010; Nesterova et al., 2011). During the preparation, a low
molecular weight pre-polymer is formed from the condensation of urea and formaldehyde
at the initial stage. Subsequently, the pre-polymer becomes attached onto the surface of
the dispersed core material and polymerizes to form the shell (Brown et al., 2003).
Liu and co-researchers have reported the modification of poly(urea formaldehyde)
(PUF) resin by mixing urea with melamine-formaldehyde pre-polymer forming
poly(melamine-urea-formaldehyde) (PMUF) for encapsulating 5-ethylidene-2-
norbornene (ENB) and its crosslinking agent (Liu et al., 2009). Microcapsules with
PMUF shell are more robust and easier to handle than those with PUF shell. Tong and
colleagues have replaced up to 12 wt. % of urea with melamine in the formulation, to
encapsulate an epoxy resin. They reported that the PMUF microcapsules exhibited better
resistance against solvent, acid and alkali (Tong et al., 2010). Other researchers had
replaced 1%–5% of urea with a commercially available melamine resin, Cymel 303®, as
shell materials for microcapsules containing DCPD. The microcapsules were strong
enough to withstand the mixing with a viscous restorative dental resin (Then et al.,
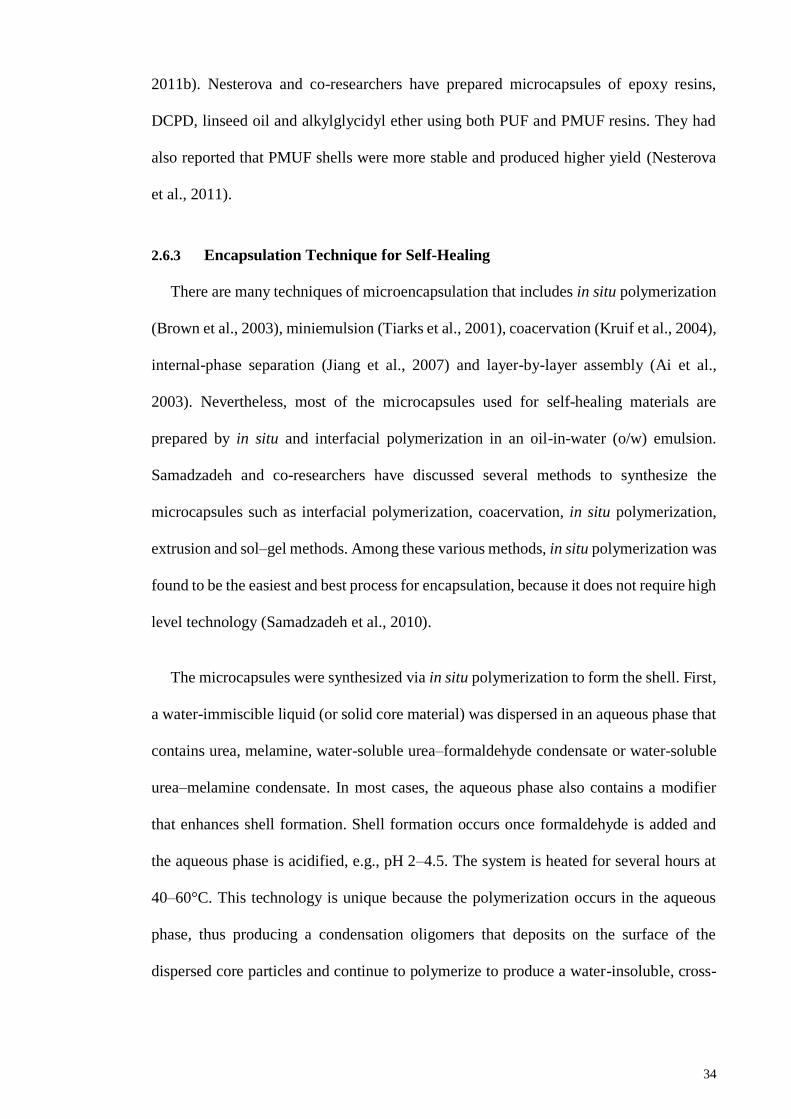
34
2011b). Nesterova and co-researchers have prepared microcapsules of epoxy resins,
DCPD, linseed oil and alkylglycidyl ether using both PUF and PMUF resins. They had
also reported that PMUF shells were more stable and produced higher yield (Nesterova
et al., 2011).
2.6.3 Encapsulation Technique for Self-Healing
There are many techniques of microencapsulation that includes in situ polymerization
(Brown et al., 2003), miniemulsion (Tiarks et al., 2001), coacervation (Kruif et al., 2004),
internal-phase separation (Jiang et al., 2007) and layer-by-layer assembly (Ai et al.,
2003). Nevertheless, most of the microcapsules used for self-healing materials are
prepared by in situ and interfacial polymerization in an oil-in-water (o/w) emulsion.
Samadzadeh and co-researchers have discussed several methods to synthesize the
microcapsules such as interfacial polymerization, coacervation, in situ polymerization,
extrusion and sol–gel methods. Among these various methods, in situ polymerization was
found to be the easiest and best process for encapsulation, because it does not require high
level technology (Samadzadeh et al., 2010).
The microcapsules were synthesized via in situ polymerization to form the shell. First,
a water-immiscible liquid (or solid core material) was dispersed in an aqueous phase that
contains urea, melamine, water-soluble urea–formaldehyde condensate or water-soluble
urea–melamine condensate. In most cases, the aqueous phase also contains a modifier
that enhances shell formation. Shell formation occurs once formaldehyde is added and
the aqueous phase is acidified, e.g., pH 2–4.5. The system is heated for several hours at
40–60°C. This technology is unique because the polymerization occurs in the aqueous
phase, thus producing a condensation oligomers that deposits on the surface of the
dispersed core particles and continue to polymerize to produce a water-insoluble, cross-

35
linked polymer shell. The process has already been commercialized and produces a range
of commercial capsules (Thies, 2005).
2.6.4 Process Parameters
There are several process parameters affecting the formation and the size of the
microcapsules. The factors are discussed as follows.
2.6.4.1 Core and shell weight ratio
The core/shell weight ratio was calculated based on the weight of core over the weight
of the total raw materials forming the shell. Brown and his colleague have used a 6.2/1
ratio in the UF- in situ polymerization (Brown et al., 2003). This ratio has been adopted
by a number of other researchers (Noh & Lee, 2013; Then et al., 2011a; Tong et al., 2010).
Blaiszik et al. however, increased the ratio to 6.45/1 to get the intended microcapsules,
which were spherical and well-formed. Initially by using the ratio by Brown et al., they
got microcapsules with a thick layer of porous UF on the surface, which caused
agglomerations in solution (Blaiszik et al., 2009).
The diameters of microcapsules have been found to increase with the enhancement of
weight ratio of core–shell material. Keeping the other processing parameters constant, an
increase in the core/shell weight ratio increases the size of core droplet in emulsion.
Consequently, the core material and the size of microcapsules increase and the shell wall
thickness may decrease. However, excess core materials cause poor dispersion,
promoting aggregation of core droplets, resulting in lower yield of microcapsule and
fragility of microcapsules due to the thinner shell wall (Yuan et al., 2006).
2.6.4.2 Concentration and types of emulsifiers
The concentration of emulsifiers has a crucial role during the in situ polymerization,
too low, the droplets will tend to agglomerate into bigger sizes while an increase in

36
concentration will maintain the sizes of the droplets (Guo & Zhao, 2008; Tiarks et al.,
2001). Sodium dodecyl benzene sulfonate (SDBS) is one of the surfactant used in the
production of microcapsules by in situ polymerization (Yuan et al., 2006), while sodium
dodecyl sulfate (SDS), gum Arabic and gelatin are normally used in coacervation method
(Guo & Zhao, 2008; Song et al., 2007). Poly(vinyl alcohol) (PVA) is also used in PUF
encapsulation (Yin et al., 2007; Suryanarayana et al. 2008). However, the polyelectrolyte
species are most commonly used emulsifiers in the production of PUF microcapsules,
such as ethylene maleic anhydride (EMA) copolymer, methylvinyl ether maleic
anhydride copolymer and styrene maleic anhydride copolymer (Salaün et al., 2009).
The use of surfactant lowers the interfacial tension between the two phases (oil and
water phase) and prevents the regrouping of the particles formed. The adsorption at the
interface between water and air reduces the surface tension (Salaün et al., 2009). When
the concentration of stabilizer is increased, finer emulsion is produced. Consequently, the
size of microcapsules will be reduced and their size distribution will be narrowed down
(Yuan et al., 2006; Zhu et al., 2013). However, an increase in nanoparticles formation
will also occur, which will caused problem during filtration (Nesterova et al., 2012). In a
separate study, Fan and Zhou (2010) have also observed pH variation as they increased
the concentration of EMA.
The effect of different concentrations of emulsifiers has been studied by Ting et al. At
low concentration, agglomeration of microcapsules occurred. The microcapsules were
also had irregular shapes and unevenly distributed. An increase of concentration to 3 wt.
% improved the size distribution, but if in excess, the microcapsules appeared very small
with uneven distribution (Ting et al., 2010). Overall, the concentration of emulsifier or
surfactant must be optimized to get the desired size and a good yield.
37
2.6.4.3 Viscosity of organic and aqueous phases
The successful production of microcapsules is greatly affected by the method of
encapsulation. It is difficult to generalize on the relative importance of individual aspects
of the encapsulation, however, the viscosity of the organic phase (alkyd/ oils/ others) and
viscosity of the aqueous phase have been shown to be significant (Jyothi et al., 2010;
Thies, 2005). The viscosity of the aqueous phase of microencapsulation can be controlled
or adjusted by the use of emulsifier or viscosity adjuster.
Meanwhile, the viscosity of the organic phase differs according to the core content
used. Commonly encapsulated materials such as inks, fragrances and pesticides are
liquids with low viscosity. According to Ghosh (2009), the monomers for self-healing
materials should have low viscosity in order to flow into the microcracks, once the
microcapsules are ruptured. For this purpose, encapsulated healing agents are mostly
liquid or resin, which has low viscosity, such as DCPD, solvents, oils and amine.
Although commonly available as high molecular weight resin with medium to high
viscosity, epoxy resins can be diluted with either reactive or non-reactive diluents, prior
to encapsulation. For example, DGEBA resin was diluted with reactive diluent 1-butyl
glycidyl ether (BGE) with 0.2 wt. ratio of BGE/DGEBA (Yuan et al., 2006). In another
work, 40 g of E-51 (bisphenol-A epoxy resin) was diluted with 800 mL sodium
polyacrylate prior to encapsulation to produce self-healing epoxy composites (Yin et al.,
2007).
An un-diluted epoxy resin, diglycidyl tetrahydro-o- phthalate (DTHP), with 0.36 Pa·s
viscosity, was encapsulated for self-healing epoxy (Yuan et al., 2008). In further work,
they studied the effect of using epoxy resins with different viscosities (with similar
epoxide value) on the healing efficiency. EPON 828, Epoxy 731 and Epoxy 711 resins
with viscosity values of 12.5 Pa·s, 0.85 Pa·s and 0.53 Pa·s respectively, were used without
38
any dilution. The lowest viscosity epoxy resin (Epoxy 711) achieved the highest mixing
efficiency (83.4%), as compared with Epoxy 731 (79.3%) and EPON 828 (63.7%). They
concluded that, amongst other factors, the healing reaction would be favored when the
encapsulated epoxy prepolymer has rather low viscosity (Yuan et al., 2009).
Blaiszik et al. screened a number of solvents to be used as diluent for epoxy resins
(EPON 828 and EPON 862) and recommended solvents ideally should have dielectric
constant (ɛ) between 5 and 38. The selection is based on 3 parameters: dielectric constant
(ɛ), boiling point and flash point. The solvents chosen for their study were chlorobenzene
and the less toxic and have low flammability phenylacetate (PA) and ethyl phenylacetate
(EPA). The combination of 60 mL of epoxy-15 pph EPA was concluded as best
combination for solvent-promoted self-healing epoxy (Blaiszik et al., 2009).
Using different core content, PDMS resin was used as healing agent (S31 and S35).
Due to their high molecular weight and thus higher viscosity, S31 and S35 were added
with 30 wt. % and 53 wt. % xylenes respectively, prior to encapsulation. Yet, the addition
of solvent was set to a minimum in order to maximize the quantity of healing agent
delivered. These microcapsules with solvents were compared with microcapsules
containing only PDMS resin as control. The control showed best microcapsules
production with good shape, free flowing and little debris. On the other hand,
microcapsules containing S31 and S35 were less uniform in shape with more debris and
had a tendency to cluster, which required sieving. The inclusion of solvent also lowered
their thermal stability. In terms of healing efficiency, S35 showed highest healing
efficiency at certain loading limit and the efficiency decreased when the content loading
exceeded 0.3 mg/cm2. This observation was explained; as the molecular weight of PDMS
resin increases, the strength of the polymerized PDMS also increases. However, there is
a trade-off when using a high molecular weight PDMS, which increases the viscosity of

39
the core therefore requiring solvent. The use of solvents degrades capsule quality and
thermal stability (Mangun et al., 2010).
In a separate study, Nesterova et al. encapsulated different healing agents for epoxy
coating, which include linseed oil, 5-ethylidene-2-norbornene (ENB), DGEBA diluted
with BGE and DCPD. They concluded that microcapsule stability is core material-
dependent and low stability was observed in microcapsules formed with more viscous
agents. They explained this was possibly due to the higher elasticity of more viscous
compounds, which can put more stress on the shell material during handling of the
capsules (Nesterova et al., 2011).
Overall, viscosity of the core content is an important parameter for encapsulation of
healing agents although a low viscosity core is preferred for self-healing application. The
encapsulation process is unique depending on the core used and the process needs to be
optimized accordingly. Viscosity of the core can be modified with certain diluents.
However, the inclusion of diluents may or may not has an impact on the encapsulation of
the healing efficiency, as the literature suggests the encapsulation process is exclusive for
a selected core.
2.6.4.4 Agitation rate
According to Cosco and co-workers, the agitation rate has a great influence on the
epoxy microcapsules. As the stirring rate is reduced, the epoxy/water interfacial surface
is lowered. Thus, the reaction between urea and formaldehyde will occur mostly in the
aqueous phase instead on the interfacial surface. This will result in lots of aggregates,
which consequently will reduce the encapsulation capability (Cosco et al., 2007). A high
agitation rate can produce smaller core droplets and subsequently smaller microcapsules.
However, too high rate leads to frequent collisions that cause the deposition of PUF and
core content on the stirrer and reactor’s wall, giving low yield (Brown et al., 2003). The
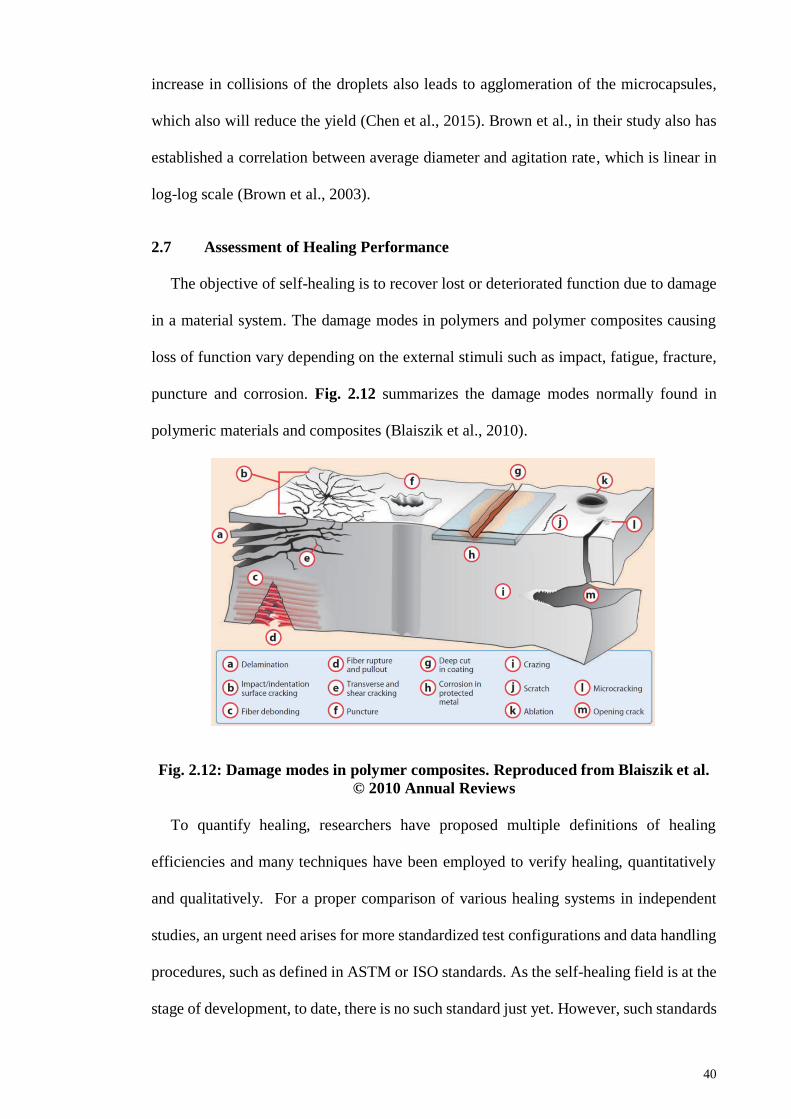
40
increase in collisions of the droplets also leads to agglomeration of the microcapsules,
which also will reduce the yield (Chen et al., 2015). Brown et al., in their study also has
established a correlation between average diameter and agitation rate, which is linear in
log-log scale (Brown et al., 2003).
2.7 Assessment of Healing Performance
The objective of self-healing is to recover lost or deteriorated function due to damage
in a material system. The damage modes in polymers and polymer composites causing
loss of function vary depending on the external stimuli such as impact, fatigue, fracture,
puncture and corrosion. Fig. 2.12 summarizes the damage modes normally found in
polymeric materials and composites (Blaiszik et al., 2010).
Fig. 2.12: Damage modes in polymer composites. Reproduced from Blaiszik et al.
© 2010 Annual Reviews
To quantify healing, researchers have proposed multiple definitions of healing
efficiencies and many techniques have been employed to verify healing, quantitatively
and qualitatively. For a proper comparison of various healing systems in independent
studies, an urgent need arises for more standardized test configurations and data handling
procedures, such as defined in ASTM or ISO standards. As the self-healing field is at the
stage of development, to date, there is no such standard just yet. However, such standards

41
are expected in the near future due the fast growing commercial interest in developing
self-healing materials (Bose et al., 2013). Some of the healing assessments available in
the literature are briefly reviewed in this section.
2.7.1 Recovery of Mechanical Properties
Crack healing in thermoplastic polymers were quantified by comparing the fracture
toughness of the virgin material to the fracture toughness measured after crack closure
and healing (Wool and Connor, 1981; Jud et al., 1981). Based on these studies, White et
al. later defined an efficiency of healing as the ratio of the fracture toughness (KIC) of
healed and virgin materials, where η is the healing efficiency (Eqn. 2.1).
η = KIC healed / KIC virgin Eqn. 2.1
They used the TDCB specimen, introduced by Mostovoy et al., to undergo the fracture
test (mode I). In fracture toughness mode I, a method originally developed for adhesives,
tensile force is applied normal to the crack plane. TDCB geometry was chosen because
using this, the crack growth can be controlled to be across the center of a brittle epoxy
sample (White et al., 2001). Therefore, the fracture toughness measured depends only on
the applied load and is independent of the crack length (Mostovoy & Ripling, 1966).
Later, the assessments of healing through the recovery of fracture properties become
quite common in epoxy composites (Brown et al., 2002; Brown et al., 2004; Kamphaus
et al., 2008; Rule et al., 2005; Rule et al., 2007). The highest healing measure for epoxy
composite using this measurement was observed by Caruso et al. with 82−100% recovery
using the solvent and solvent with epoxy resin healing approach (Caruso et al., 2008;
Caruso et al., 2007). Yuan and his co-researchers also quantified healing based on fracture
properties and obtained a 104% recovery based of the fracture toughness tested with

42
similar method (Yuan et al., 2008). A slightly different, mode I single-edge notched
bending (SENB) method was also used to quantify healing based on fracture toughness
recovery. A maximum 111% of healing was obtained (Yin et al., 2007).
Tensile testing has also been used widely to determine the relations of stress–strain of
polymers, using rectangular or dog-bone geometries. For self-healing studies, tensile
experiments can be performed on the fractured and healed samples. However, challenges
arise in order to have proper alignment of the healed samples and surface roughness.
However, it can still be considered suitable for systems above a threshold rigidity and the
problems can be slightly overcomed by using samples with smaller cross-sectional area
and smaller gage (Bose et al, 2013).
The lap shear test can be used to measure tensile adhesion for self-healing systems as
demonstrated by Keller et al., in their siloxane-based self-healing elastomer. Fig. 2.13
shows a PDMS tear specimens and testing used by Keller and co-workers (Keller et al.,
2007). Yuan and his co-workers complemented their fracture test by determining the
adhesion of the epoxy composite using the lap shear test to quantify healing (Yuan et al.,
2008) . The advantageous of this test include a controlled re-arrangement of the fractured
surfaces and its reproducibility of clamping conditions (Bose et al., 2013).

43
Fig. 2.13: A specimen prepared (a) before testing (b) after tear testing. (c) A
schematic representation of a tear specimen during lap shear test. Scale bar = 10
mm. From Keller et al. © Wiley-VCH
2.7.2 Qualitative Assessment
Analyses such as FTIR, NMR or Raman spectroscopies can be used to monitor the
progress of healing at a molecular level, where certain bonds appear or disappear in the
course of self-healing (Peterson et al., 2009). This analysis can be qualitative as well as
quantitative. FTIR was used to quantitatively estimate the extent of conversion of cyanate
ester group in their self-healing system, consisting cyanate ester and poly(phenylene
oxide) resins (Yuan et al., 2014). Meanwhile, NMR can also be used to confirm the core
content of the ruptured microcapsules, where the adhesion between the two glass slides
was confirmed due to the presence of the poly(glycidyl methacrylate) (PGMA) (Zhu et
al., 2013).
Visualization techniques can also be used in accessing healing while optical
microscopy is used to observe change in healed coating. A wide range of magnifications
and the relative ease of operation are the main advantages of conventional optical
microscopy to monitor damage located at the surface of the sample. However, resolution
will be a limitation for optical microscopy. For example, the small (remaining) crack

44
openings and hair-line cracks, will be difficult to be measured with some accuracy (Bose
et al., 2013). The scanning electron microscope (SEM) could offers a much higher
resolution than optical microscopes. The acceleration voltage determines the resolution
of the SEM. An example of FESEM usage was demonstrated by Cho et al., as depicted
in Fig. 2.14. In a nutshell, the information from optical microscopy is generally
qualitative and need to be complemented by other qualitative or quantitative methods.
Fig. 2.14: SEM micrographs of the scribed region: (a) control coating (b) the
healed coating
2.7.3 Recovery of Corrosion Protection
The performance of linseed oil as a healing agent was evaluated by exposing
specimens coated with paint, containing filled microcapsules to salt spray. After 72 h of
exposure, specimens with paint-containing microcapsules were found to be corrosion-
free at the scribed lines, unlike the control panels, which have corroded after 48 h of
exposure. The linseed oils were released from the ruptured microcapsules, filled the crack
and formed a film by oxidative polymerization with atmospheric oxygen. This has
prevented the admission of moisture and oxygen and therefore inhibited the corrosion
(Suryanarayana et al., 2008).
Cho et al. examined multicomponent PDMS-based healing systems in epoxy and vinyl
ester coatings on steel. In both phase-separated version and PU capsules-based systems,
PDMS, a catalyst and an adhesion promoter were distributed in the matrix so that the

45
components would combine and cross-link within scratch damage. The electrical
conduction measurements of the healed sample (from the phase-separated system)
showed a significant reduction of conductance compared to the controls, which confirmed
the healing (Cho et al., 2009).
2.8 Mechanical Testing of the Modified and Unmodified of Polymeric Materials
and Composites
Mechanical properties evaluation of the self-healing materials were performed to
determine the effects of inclusion of healing materials to the original unmodified
properties. A list of testings can be done for instance, flexural, tensile, impact and
hardness. The hypothesis is that the addition of microcapsules with healing agents up to
certain limit will not compromise the mechanical properties of the polymeric materials
and composites.
2.8.1 Micro-Indentation Hardness (Microhardness)
The hardness of a material is defined as its resistance to penetration by another body.
Hardness is a very complex quantity that depends on Young’s modulus, yield stress and
stress hardening. There is no general definition of hardness applicable to all materials,
neither does a universally applicable testing method. All methods measure the hardness
of surfaces and not of the interior of the specimen (Elias & Mülhaupt, 2015).
Micro-indentation hardness (or microhardness) testing is widely used to study fine
scale changes in hardness. The applied load and the resulting indent size are small relative
to bulk tests, but the same hardness number is obtained. In general, the Vickers indenter
is better suited for determining bulk (average) properties, as Vickers hardness is not
altered by the choice of the test force, from 25 to 1000 gf. This is because the indent
geometry is constant as a function of indent depth (ASTM E384). In the Vickers test, the

46
load is applied without impact, forcing the indenter into the test piece. The indenter is
held in place for 10 or 15 seconds. After the load is removed, the two impression
diagonals are measured and averaged. The Vickers hardness (HV) is calculated using:
HV = 1854.4 L
d2 Eqn. 2.2
where the load L is in gf and the average diagonal d is in µm. This produces hardness
number units of gf/µm2 although practically the numbers are reported without the units.
An example of a well formed Vickers micro-indentation is exhibited in Fig. 2.15.
Fig. 2.15: Vickers indentation on the experimental sample of (scale is in µm)
2.8.2 Flexural Strength
To determine the strength of bulk epoxy materials is complicated due to their complex
failure mechanisms. In general, the strength of an epoxy resin is determined by the
presence and interactions of defects (e.g., voids and microcracks), the generation of the
tensile stresses at these defects and the stress gradient along the fracture path. Flexural
testing is considered an appropriate measure of the strength because it combines elements
of compression, tension and shear, which more closely mimics in vivo stresses than either

47
compression or tension testing alone (Fard et al., 2014). Flexural strength (σ) is defined
by maximum flexural stress sustained by the test specimen during a bending test (ASTM).
It is calculated according to Eqn. 2.3;
σ = 3 F l / 2 b h 2 Eqn. 2.3
where σ is the maximum stress (Pa); F is the applied force or maximum load (N); l is
the distance between the supports (mm); b is the width of the specimen (mm); h is the
height or depth of the specimen (mm). The setup of the 3-point bend test is shown in Fig.
2.16. The maximum force needed to fracture the sample is normally used to characterize
the strength of the material (Fig. 2.17). A strong material reveals high flexural strength
values whereas low values indicate a weak material (Then, 2011).
Fig. 2.16: Set up of the three-point-bend test using universal testing machine

48
Fig. 2.17: Stress-strain curve of experimental epoxy samples
2.9 Concluding Remarks
This chapter has included a review on several key topics related to the study. The
historical development of self-healing materials, the categories, healing assessment and
related mechanical testing have been reviewed particularly for epoxy materials.
Techniques of encapsulation and the process parameters and the background of alkyd as
potential healing agent was explained.
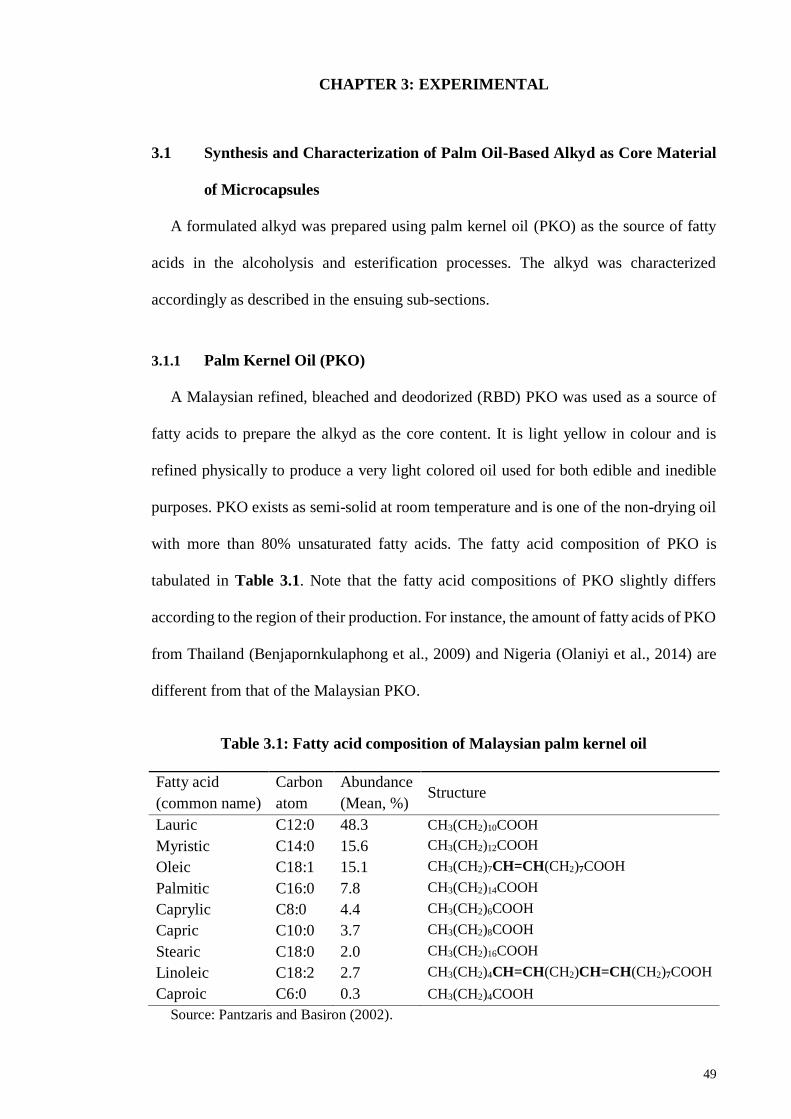
49
CHAPTER 3: EXPERIMENTAL
3.1 Synthesis and Characterization of Palm Oil-Based Alkyd as Core Material
of Microcapsules
A formulated alkyd was prepared using palm kernel oil (PKO) as the source of fatty
acids in the alcoholysis and esterification processes. The alkyd was characterized
accordingly as described in the ensuing sub-sections.
3.1.1 Palm Kernel Oil (PKO)
A Malaysian refined, bleached and deodorized (RBD) PKO was used as a source of
fatty acids to prepare the alkyd as the core content. It is light yellow in colour and is
refined physically to produce a very light colored oil used for both edible and inedible
purposes. PKO exists as semi-solid at room temperature and is one of the non-drying oil
with more than 80% unsaturated fatty acids. The fatty acid composition of PKO is
tabulated in Table 3.1. Note that the fatty acid compositions of PKO slightly differs
according to the region of their production. For instance, the amount of fatty acids of PKO
from Thailand (Benjapornkulaphong et al., 2009) and Nigeria (Olaniyi et al., 2014) are
different from that of the Malaysian PKO.
Table 3.1: Fatty acid composition of Malaysian palm kernel oil
Fatty acid
(common name)
Carbon
atom
Abundance
(Mean, %) Structure
Lauric C12:0 48.3 CH3(CH2)10COOH
Myristic C14:0 15.6 CH3(CH2)12COOH
Oleic C18:1 15.1 CH3(CH2)7CH=CH(CH2)7COOH
Palmitic C16:0 7.8 CH3(CH2)14COOH
Caprylic C8:0 4.4 CH3(CH2)6COOH
Capric C10:0 3.7 CH3(CH2)8COOH
Stearic C18:0 2.0 CH3(CH2)16COOH
Linoleic C18:2 2.7 CH3(CH2)4CH=CH(CH2)CH=CH(CH2)7COOH
Caproic C6:0 0.3 CH3(CH2)4COOH
Source: Pantzaris and Basiron (2002).

50
3.1.2 Materials
Refined, bleached and deodorized (RBD) PKO and glycerol (99% purity) were
obtained from Emery Oleochemicals (M) Sdn. Bhd, Selangor, Malaysia. PKO
(saponification value 245 mg KOH/ g oil) is a highly saturated oil, which is the extract
from the nut of the oil palm fruit (Elaeis guineensis Jacq.). It consists of a mixture of C6
to C18:2 fatty acids of about >80% saturated fatty acids. The major fatty acid
compositions are: lauric acid (C12:0, 48.3%), myristic acid (C14:0, 15.6%), oleic acid
(C18:1, 15.1%), palmitic acid (C16:0, 7.8%), caprylic acid (C8:0, 4.4%), capric acid
(C10:0, 3.7%), stearic acid (C18:0, 2.0%), linoleic acid (C18:2, 2.7%) and caproic acid
(C6:0, 0.3%) (Pantzaris & Basiron, 2002). The same batch of PKO and glycerol were
used throughout the study without further purification to minimize the compositional
variations.
Phthalic anhydride (PA, 2-benzofuran-1,3-dione, C8H4O3, Mw = 148.10 g mol-1) was
from Hanwha Chemical (M) Sdn. Bhd., Malaysia and lithium hydroxide (LiOH, Mw =
23.95 g mol-1, J. T. Baker) was from Center Valley, PA, USA. Potassium hydrogen
phthalate (KHP, C8H5KO4, Mw = 204.23 g mol-1) was from R&M, Essex, UK. Deuterated
chloroform (CDCl3, Mw = 120.38 g mol-1 99.8 atom % D) and phenolphthalein (3,3-bis(4-
hydroxyphenyl)isobenzofuran-1(3H)-one, C20H14O24, Mw = 318.33 g mol-1, ACS) were
from Merck. Potassium hydroxide (KOH, Mw = 56.11 g mol-1, ChemAR 85% essay) was
from Systerm, Selangor, Malaysia. Tetrahydrofuran (THF, C4H8O, Mw = 72.11 g mol-1)
of gel permeation chromatography grade, stabilized with 0.025% butylated
hydroxytoluene (BHT) was from Fisher Scientific (M) Sdn. Bhd., Malaysia. Toluene
(C7H8, Mw = 92.14 g mol-1) and ethanol (denatured alcohol, C2H5OH, Mw= 46.07 g mol-
1) were from R&M, Essex, UK. All materials were used as received.

51
3.1.3 Formulation of Alkyd
Alkyd resin is an oil-based polyester, which is synthesized by reacting polyhydric
alcohol and polybasic acid. The most commonly used polyhydric alcohol and polybasic
acid are glycerol and phthalic anhydride (PA) respectively. A general rule of thumb for
alkyd formulation is that the amount of polyhydric alcohol varies between 5 to 40 wt. %.
If it exceeds 40 wt. %, the unreacted polyhydric alcohols in the system will give rise to
the adsorption of moisture. Whereas, if the content is less than 5 wt. %, the molecular
weight of the finished alkyd resin is difficult to improve (Hattori et al., 2007).
While for polybasic acids, the desirable amount varies from 10 to 50 wt. %. Excess
amount of polybasic acid of more than 50% by weight may cause an increase in side
reactions during synthesis, which will be accountable for the gel formation at high
temperature. Moreover, the extra amount of polybasic acid can affect the tackiness of the
finished alkyd, resulting in alkyd resin with low tackiness. Table 3.2 defines the
commonly used symbols in alkyd technology while Table 3.3 lists the alkyd’s
formulation and the related equations.
Table 3.2: Commonly used symbols and definitions in alkyd technology
M molecular weight (= W/m = FE )
m number of moles (= W/M = e/F )
m0 total moles present at start of reaction (m0 = eA + eB )
E equivalent weight (= W/e = M/F )
e number of equivalents (= W/E = Fm)
e0 total equivalents present at start of reaction
eA number of acid equivalents
eB number of hydroxyl equivalents
F functionality (= M/E = e/m)
W weight
Source: Patton (1962).

52
Table 3.3: Formulation of AlkydPKO65
Component Wt.% W (g) E e0
(mol)
eA
(mol)
eB
(mol)
F m0
(mol)
PKO 63.4 750 233.7 3.21 - - - - Glycerol from PKO - - - - - 3.21 3 1.0700 Fatty acid from PKO - - - - 3.21 - 1 3.2100
Glycerol 16.4 194 30.7 6.32 - 6.32 3 2.1067
PA 20.2 239 74.1 3.23 3.21 - 2 1.6050
Total ( 1183 - 12.75 6.42 9.53 - 7.99
Here, the oil length was first set to 65% and the amount of polyhydric alcohol and the
polybasic acid were fixed to ~16 wt. % and 20 wt. % respectively. By doing this, the
alkyd constant (K) or Patton’s gel point was from K = m0 / eA = 7.99/6.42 = 1.24. K is
defined as the point when gelation is expected to occur. According to Patton (1962), in
order to ensure that no gelation occurs, this value should be larger than 1.00 so that
gelation would not occur at 100% of reaction conversion. Referring to Table 3.4, at K
value of 1.24, AlkydPKO65 is expected to have no gelation at 100% reaction conversion.
Next, the percentage of oil or oil length refers to the oil portion of an alkyd expressed
as a percentage of the finished alkyd weight. Alkyds of different oil lengths have different
properties suitable for different applications. For instance, alkyds with long oil length is
used for brushing application due to their good flow-ability and ease of grinding. On the
other hand, a short oil length alkyd is more suitable for spraying application because it
has the lacquer type of dry properties and high viscosity. The medium oil length alkyds
have properties somewhere in between short and long oil length alkyds. They can be used
in paints along with long oil length alkyd to improve metal adhesion. In this work,
AlkydPKO65 is a long oil length alkyd with relatively low viscosity was prepared to be
emulsified and encapsulated.
53
R value refers to the excess of hydroxyl groups (–OH) over the –COOH groups present
in the alkyd cook. It is defined as the ratio of eB to eA as listed in Table 3.4. AlkydPKO65
was formulated with excess of –OH groups to avoid premature gelation during the alkyd
synthesis and the expected hydroxyl value in the finished alkyd is expressed as mg KOH
in 1 g of alkyd.
Acid value or acid number is defined as the amount of KOH (in mg) required to
neutralize the free carboxylic groups (–COOH) in 1 g of alkyd. Initial acid value of an
alkyd cook is calculated based on the number of acids equivalent (eA) value of the dibasic
acid introduced in the cook. The final acid value and amount of –COOH groups was
determined experimentally as described in Section 3.1.5.1.
Finally, the alkyd reaction usually releases a simple by-product molecule (commonly
water) during the molecular bonding of polyhydric alcohol and polybasic acid. When the
alkyd is cooked from oil (PKO) that is already esterified, water evolved was from the
esterification of the PA with glycerol (9 weight units per equivalent of anhydride).
Therefore, the expected weight of water collected from the alkyd cook can also be
calculated. The complete amount of water collection could mark the completion of the
alkyd synthesis.

54
Table 3.4: Value of parameters and formulation of AlkydPKO65
Parameters Formula Calculation Alkyd constant (K) or Patton gel point
K = Σ m0 / Σ eA 𝐾 =
7.99 𝑚𝑜𝑙
6.42 𝑚𝑜𝑙= 1.24
Oil length / percentage of oil
𝑂𝑖𝑙 𝑙𝑒𝑛𝑔𝑡ℎ =𝑤𝑒𝑖𝑔ℎ𝑡 𝑜𝑓 𝑜𝑖𝑙 (𝑔)
𝑓𝑖𝑛𝑖𝑠ℎ𝑒𝑑 𝑎𝑙𝑘𝑦𝑑 (𝑔)
𝑂𝑅
= 𝑤𝑒𝑖𝑔ℎ𝑡 𝑜𝑓 𝑜𝑖𝑙 (𝑔)
𝑡𝑜𝑡𝑎𝑙 𝑟𝑒𝑎𝑐𝑡𝑎𝑛𝑡 𝑐ℎ𝑎𝑟𝑔𝑒𝑑 − 𝑤𝑎𝑡𝑒𝑟 𝑒𝑣𝑜𝑙𝑣𝑒𝑑 (𝑔)
𝑂𝑖𝑙 𝑙𝑒𝑛𝑔𝑡ℎ = 750 𝑔
1183−28.89 × 100 %
= 65 %
R value
R = Σ eB / Σ eA
𝑅 = 9.53 𝑚𝑜𝑙
6.42 𝑚𝑜𝑙
= 1.48
Initial acid value / acid number (AN)
AN initial
= 56100. eA / W Total
56100 = molecular weight of KOH in mg/mol
𝐴𝑁 𝑖𝑛𝑖𝑡𝑖𝑎𝑙 = 56100
𝑚𝑔
𝑚𝑜𝑙×6.42 𝑚𝑜𝑙
1183 𝑔
= 304.45 𝑚𝑔 𝐾𝑂𝐻/ 𝑔 𝑎𝑙𝑘𝑦𝑑
Final acid value 𝐴𝑁 𝑓𝑖𝑛𝑎𝑙 (𝑒𝑥𝑝𝑒𝑟𝑖𝑚𝑒𝑛𝑡𝑎𝑙)
= 56.1 × 𝑁 × (𝑉 − 𝑉𝑏)
𝑊
= 15 𝑚𝑔 𝐾𝑂𝐻/𝑔 𝑎𝑙𝑘𝑦𝑑
𝐴𝑚𝑜𝑢𝑛𝑡 𝑜𝑓 𝑓𝑟𝑒𝑒 − 𝐶𝑂𝑂𝐻 𝑔𝑟𝑜𝑢𝑝𝑠
= 𝐴𝑁 𝑓𝑖𝑛𝑎𝑙
56100 𝑚𝑔/𝑚𝑜𝑙
= 2.67 × 10⁻⁴ 𝑚𝑔/𝑚𝑜𝑙
Percentage of excess –OH
% 𝑜𝑓 𝑒𝑥𝑐𝑒𝑠𝑠 − 𝑂𝐻 𝑔𝑟𝑜𝑢𝑝𝑠 =100% × (𝑅 − 1)
% 𝑜𝑓 𝑒𝑥𝑐𝑒𝑠𝑠 − 𝑂𝐻 𝑔𝑟𝑜𝑢𝑝𝑠 =100% × (1.48 − 1) = 48%
Expected hydroxyl value
= (ΣeB − ΣeA) × 56100 / (ΣW−Wwater)
= (9.53 𝑚𝑜𝑙 − 6.42 𝑚𝑜𝑙) × 56100
1183 𝑔 − 28.89 𝑔
= 151. 17 𝑚𝑔 𝐾𝑂𝐻/𝑔 𝑎𝑙𝑘𝑦𝑑
Expected weight of water
= (eA from PA) × 9 g/mol
= 3.21 𝑚𝑜𝑙 × 9 𝑔/𝑚𝑜𝑙 = 28.89 𝑔

55
3.1.4 Synthesis of AlkydPKO65
The alkyd AlkydPKO65 was synthesized according to the following procedure. 750 g
PKO, 107 g glycerol and 0.7 g lithium hydroxide were charged into a reactor flask
equipped with a reflux condenser, thermometer and mechanical agitator, as shown in Fig.
3.1 (a). The mixture was heated at 220°C for about 2 h to complete the alcoholysis
process. The complete conversion of the oil to monoglycerides was checked by the
solubility test of the product in ethanol. Heating was turned off, the temperature was
allowed to drop to 180°C and a Dean-stark decanter was attached to the reactor, in order
to collect water as a by-product from the esterification process, as shown in Fig. 3.1 (b).
Next, 230 g phthalic anhydride and 87 g glycerol were added. The polycondensation was
carried out at 210–220°C and the progress of the reaction was monitored by acid number
determination according to ASTM D1639-90. The reaction was stopped when the acid
number (AN) has dropped to about 5% of the initial value. The product was a viscous
liquid and dark brown in color. Fig. 3.2 summarizes the preparation steps of the alkyd.
Fig. 3.1: Experimental set up of (a) alcoholysis process (b) esterification process,
equipped with Dean-stark decanter to collect water

56
Fig. 3.2: Synthesis of alkyd using palm kernel oil (by alcoholysis and esterification
processes)
3.1.5 Characterization of AlkydPKO65
Alkyd usually is characterized by conventional techniques in the same way as its raw
material to determine the physical properties such as acid, iodine and hydroxyl values,
viscosity, volatile matter content and specific gravity. The results from the acid value,
iodine value, hydroxyl value and viscosity indicate the level of free carboxylic groups,
level of unsaturation, degree of free hydroxyl groups and the alkyd’s processability,
respectively. The structural analysis, molecular weight determination, rheological
behavior and thermal characterization are carried out by techniques such as Fourier
transform infrared (FTIR), nuclear magnetic resonance (NMR), gel permeation
chromatography (GPC), rheometry analysis, differential scanning calorimetry (DSC) and
thermogravimetric analysis (TGA).
3.1.5.1 Determination of acid value (AN) and amount of –COOH group of alkyd
Acid value or AN is an indication of the amount of KOH (in mg) required to neutralize
the free acids contained in 1 g of alkyd. It denotes the level of free carboxylic acid groups

57
in the alkyd. The decrease of AN is a measure of the usage of the polybasic acids in the
esterification process that could thus determine the completion of the polyesterification
process.
(a) Preparation and standardization of 0.05 N ethanolic potassium hydroxide
An ethanolic potassium hydroxide solution was prepared by dissolving 2.8 g of KOH
in a 1.0 L volumetric flask and the volume was made up to 1.0 L with ethanol. The
solution was then standardized using potassium hydrogen phthalate (KHP). The KHP was
dried in an oven at 110°C for 2 h and cooled in a desiccator prior usage. About 0.5 g of
KHP was weighed into a conical flask and was then completely dissolved with 50 mL of
distilled water and ~0.5 mL of 1% phenolphthalein indicator. The KHP solution was
titrated with the 0.05 N of ethanolic KOH from a burette, until a tint of pale red persisted
in the solution for 30 seconds. Titration was done in duplicate; the volume of KOH was
recorded and the normality of KOH solution was calculated based on Eqn. 3.1:
Normality of KOH = W KHP
0.2042 × V KOH Eqn. 3.1
where W KHP is weight of KHP and V KOH is the volume of KOH solution used to
neutralize the KHP.
(b) Preparation of sample and blank titration
About 2 g of alkyd was weighed in a conical flask and dissolved in 50 mL of solvent
mixture, which composed of 3:2 parts by volume of toluene and ethanol. Subsequently,
the alkyd was titrated with standardized KOH solution that contained ~0.5 mL 1%
phenolphthalein indicator. The titration was complete when a tint of pale red persisted in
the solution for 30 seconds and the volume of KOH solution required for the titration was
recorded. The titration was done in duplicate and the AN was calculated using Eqn. 3.2:

58
Acid number (AN) final = 56.1 × N × (V−Vb)
W Eqn. 3.2
where N is the normality of KOH solution, V and Vb are the volumes (mL) of KOH
solution required to titrate the sample and blank respectively. The amount of –COOH
groups in alkyd can be calculated according to Eqn. 3.3.
Amount of free –COOH groups = (AN final / 56100) mg·mol-1 Eqn. 3.3
3.1.5.2 Viscosity analysis
The rheological behavior of alkyd resins such as viscosity, the variations of viscosity
with time, temperature and shear rate (τ) , the variations of storage modulus, loss modulus
and loss factor with frequency, can be determined by capillary and oscillation viscometer
or rheometer (Karak, 2012). Here, the viscosity of alkyd was determined using a
rheometer (Physica MCR, Anton Paar GmbH, Graz, Austria) with a double gap)
accessory (DG 26.7), equipped with a temperature regulator (Viscotherm VT, Anton Paar
GmbH, Graz, Austria). Approximately 10–12 mL of alkyd were loaded into the sample
holder and measurement was performed at 26°C at shear rate (τ) of 1−100 s-1. The
measurement of the viscosity was recorded using Rheoplus/32 software v3.60 (Anton
Paar).
3.1.5.3 Attenuated total reflectance-Fourier transform infrared (ATR-FTIR)
analysis
The Fourier transformed infrared (FTIR) is widely used in the qualitative and
quantitative determination of polymers composition. A fast and well recognized
fingerprinting method, it is used to determine functional groups such as carboxyl, ester,
hydroxyl, unsaturation and aromatic ring, which are present in the structures of oil and

59
alkyd, specifically. FTIR spectrometers are used to analyze solids, liquids and gases by
means of transmitting the infrared radiation directly through the sample (Perkin Elmer,
2005). The technique of attenuated total reflectance (ATR) overcomes the challenging
aspects of FTIR, which are the sample preparation and spectral reproducibility. It is the
most widely used FTIR sampling method today that allows qualitative or quantitative
analysis of samples. In contrast to the traditional FTIR sampling by transmission, where
the sample must be diluted and put onto IR transparent salt, pressed into a pellet or pressed
to a thin film, ATR-FTIR requires little or no sample preparation. This significantly
speeds up sample analysis (Pike Technologies, 2011).
In this study, a spectrometer, ATR-FTIR (Perkin-Elmer Spectrum 400, Perkin Elmer,
Waltham, MA, USA) was used to obtain the FTIR spectra. The spectra of alkyd and PKO
were recorded after eight scans, from 4000−450 cm-1 at 4 cm-1 resolution.
3.1.5.4 Proton nuclear magnetic resonance (1H-NMR) analysis
Proton nuclear magnetic resonance (1H-NMR) can play an important role in
understanding the actual structures of a range of polyesters and their precursors. It can be
used to structurally identify the oil and the alkyd. It also provides quantitative
determination of oil, anhydride and polyol components present in the alkyd (Karak,
2012). In this work, 1H-NMR spectrum of the alkyd and PKO were recorded on the
samples dissolved in CDCl3 and analyzed using a JNM-ECX400 II FT-NMR (JEOL,
Tokyo Japan) spectrometer, operating at 400 MHz at ambient temperature. The samples
were prepared by dissolving ~0.1 g of PKO and alkyd in approximately 3−4 mL CDCl3.
3.1.5.5 Gel permeation chromatography (GPC) analysis
The average molecular weight (Mn) and distribution of multiple molecular weights
normally found within a polymer influence both the processability of the material and its
mechanical properties. Gel permeation chromatography (GPC) is a secondary method

60
used for fast determination of molecular weight distribution (MWD, Mw/Mn), after light
scattering technique. It is the most frequently used commercial technique due to its ease
of use, low cost and short time for analysis (Furches, 2004).
GPC is a form of liquid column chromatography, in which carrier solvent is passed at
a constant rate through a column, consisting of cross-linked polymer beads previously
allowed to swell in the same solvent (Elgert, 2000). Dilute polymer solutions are placed
on top of a column filled with a porous carrier. Molecules with low molecular mass can
enter the pores, but not the molecules with higher molecular mass. Medium-sized
molecules enter the column with difficulty and remain for shorter times than the
molecules with low molecular mass. Higher molar masses are thus eluted first, followed
by medium and smaller sized molecules that gives the last peak in the chromatogram.
This final peak defines the total permeation limit.
The Mn and MWD of the alkyd are determined by GPC (Viscotek, Malvern
Instruments, Worcestershire, UK). Alkyd sample of 0.02 g was dissolved in 10 mL of
THF and left overnight before being filtered into the sample vials. A non-sterile nylon
filter 25 mm in diameter and 0.22 microns of pore size was used in the filtration process.
The GPC was calibrated with monodispersed polyisoprene and 100 µL of sample (0.2%
w/v of sample in THF) was injected into the column at 25°C. The chromatograms and
integrated data were recorded using OmniSEC 4.6 software.
3.1.5.6 Differential scanning calorimetry (DSC) analysis
Differential scanning calorimetry (DSC) is the most commonly used thermal analysis
technique to obtain information about the phase and chemical changes, by measuring the
difference between the heat flows from the sample and the reference of a sensor. The
measurement gives an enthalpy change, due to the physical and chemical changes, as a
function of temperature or time. It is used extensively in polymer science as most

61
polymers display glass transition, a condition where the material changes from a glassy
to a rubbery state, with a simultaneous rise in specific heat capacity. Glass-transition
temperature (Tg) measurements are used to characterize polymeric material such as to
obtain thermal history, crystallinity, extent of cure and plasticizer content of a polymer.
For instance, amorphous polymers normally exhibit crystallization exotherm while
thermosetting polymers such as epoxy show curing exotherm (Warrington & Höhne,
2000).
DSC thermogram of the alkyd was recorded using a differential scanning calorimeter
(DSC822e, Mettler Toledo GmbH, Giessen, Germany) equipped with a sub-ambient
cooling accessory (HAAKE EK/90, Mettler Toledo GmbH, Giessen, Germany).
Calibration was carried out using high purity indium before each measurement to ensure
accuracy. Approximately 5−10 mg of sample was weighed and sealed in an aluminum
pan. The sample was analyzed over a temperature range of -60 to 300°C at a scanning
rate of 20°C min-1, under nitrogen atmosphere. Tg was obtained and was defined as the
middle point of the inflection in the DSC curves.
3.1.5.7 Thermogravimetric analysis (TGA)
Thermogravimetric analysis (TGA) observes the change in the mass of a material
during a controlled temperature ramp. It can be used to determine the types of polymers
by comparison of degradation curves. The derivative curve of TGA (dTG) can be used to
improve the determination of onset and end point of decomposition in multi-polymer
systems (Furches, 2004). The thermal characterization of alkyd resin is generally carried
out using this technique, where the patterns and kinetics of degradation and char residues
can also be determined (Karak, 2012). The thermal stability of alkyd in certain
environments can also be studied using TGA. Here, about 5−8 mg of alkyd sample was
analyzed using TGA (TGA 6, Perkin Elmer, Waltham, MA, USA), in a nitrogen

62
environment at a flow rate of 20 mL min-1. The measurement was carried out from 30°C
to 700°C at the heating rate of 20°C min-1.
3.2 Microencapsulation of Alkyd by Amino Resins
For optimization of the alkyd encapsulation process, a number of series of
microcapsules were prepared and the detail of each series are listed in Table 3.5.
Table 3.5: Details of series of microcapsules
Series of
microcapsules
Shell
material/s
Melamine
used Method Core Others
1 PMUF Monomer 1 AlkydPKO65 -
2 PUF - 2 AlkydPKO65 -
A PUF - 2 AlkydPKO65 -
B PMUF Resin 2 AlkydPKO65 -
C PUF;
PMUF
Resin 3 AlkydPKO65 Sonication,
PVA added
D PMUF Resin 2 AlkydFA35* -
*AlkydFA35 is a commercially available alkyd, encapsulated for comparison with AlkydPKO65; PUF=
poly(urea-formaldehyde); PMUF= poly(melamine-urea-formaldehyde); Method 1= shell materials were
added followed by the emulsification of alkyd; Method 2= alkyd was emulsified prior to addition of shell
materials; Method 3 is a modified method 2 with additional sonication (Refer Appendix B).
3.2.1 Materials
Urea (CH4N2O, Mw = 60.06 g mol-1, ACS), 1-octanol (C8H18O, Mw = 130.23 g mol-1,
ACS), resorcinol (1,3-dihydroxybenzol, C6H4-1,3-(OH)2, Mw = 110.11 g mol-1, Riedel de-
Haën), ethylene maleic anhydride copolymer (EMA, C2H6O, M = 46.07 g mol-1, Mw =
400 000, Riedel de-Haën), ammonium chloride (NH4Cl, Mw = 53.49 g mol-1, Fluka),
melamine (C3H6N6 99%, Mw = 126.12 g mol-1, Aldrich) and poly(vinyl alcohol) (PVA,
fully hydrolyzed, –[CH2CHOH]–n, Sigma) were from Sigma-Aldrich. Formaldehyde
(37% aqueous, CH2O, Mw = 30.03 g mol-1, ChemAR) was from Systerm®, Selangor,
Malaysia. Hexamethoxymethyl melamine or Cymel 303® (melamine resin)
(C15H30N6O6, Mw = 390.44 g mol-1) was from Cytec Industries (M) Sdn. Bhd., Selangor,
Malaysia.
63
Deuterated chloroform (CDCl3, Mw = 120.38 g mol-1, 99.8% atom D) and sodium
hydroxide (NaOH, Mw = 40.00 g mol-1, Emsure® ISO) were from Merck. AlkydPKO65
was synthesized as described in Section 3.1.2 whereas alkyd AlkFA35 (acid number 55
mg KOH·g-1) was obtained from Jadi Imaging Technologies Sdn. Bhd., Malaysia.
Acetone (C3H6O, Mw = 58.08 g mol-1) and ethanol (denatured alcohol, C2H5OH, Mw=
46.07 g mol-1) were from R&M, Essex, UK.
The epoxy resin used was Epikote 240, which is a low-viscosity resin with an epoxy
molar mass of 185–190 g per equivalent. Epikure F205 (cycloaliphatic amine) was used
as the curing agent. Both the epoxy and its curing agent were from Hexion Inc.,
Columbus, Ohio, USA. Vinyl polysiloxane (VPS) (silicone rubber) impression material
(Take 1 Advanced Putty) was from Kerr Corp., Orange, CA, USA (Lot 71040, 2017-3,
part #34070). All materials were used as received.
3.2.2 Synthesis of Microcapsules Filled with Alkyd
The general microencapsulation procedure are as follows (denotes as Method 2 in
Table 3.5). 25 mL of 2.5 wt. % EMA and 100 mL of distilled water were mixed in a 500
mL beaker, suspended in a water bath at ambient temperature (28−33°C). Pre-weighed
amount of alkyd was poured slowly into the aqueous mixture to be emulsified and agitated
by a mechanical stirrer with a 4-bladed-propeller at 300−500 rotation per minute (rpm).
After 10 min of agitation, 2.50 g urea, 0.25 g ammonium chloride and 0.25 g resorcinol
were added into the emulsion. pH of the emulsion was changed to 3.50 by dropwise
addition of 10% sodium hydroxide solution and 37% hydrochloric acid. Finally, 6.35 g
of formaldehyde solution was added into the emulsion. Temperature of the bath was
elevated at 1.5°C min-1 rate to 55°C. The experimental setup is shown in Fig. 3.3. The
polymerization was done for 4 h, until a white slurry in the water was formed. Next, the
stirring was reduced to 200 r.p.m and the slurry was let to cool overnight. The slurry was

64
washed thoroughly with distilled water and rinsed with ethanol to remove unreacted
monomers. It was then filtered under suction and dried under fan for 1 h to get the free-
flowing microcapsules. Subsequently, they were filtered using sieves (Endecotts,
certified acc. to BS410, ISO 3310) with mesh sizes of 50, 150, 200, 300 and 500 microns.
The microcapsules of larger than 500 microns and smaller than 50 microns were
negligible and discarded. Certain modifications were done for different series as listed in
Table 3.5 and they are described in detail in CHAPTER 5. Fig. 3.4 summarizes the
general microencapsulation method.
Fig. 3.3: Experimental set up of microencapsulation process

65
Fig. 3.4: General microencapsulation procedure of alkyd
3.2.3 Spectroscopic Analyses of Core Content
The chemical structure of the alkyd in the microcapsule can be analyzed by different
spectroscopic methods such as attenuated total reflectance-Fourier transform infrared
spectroscopy (ATR-FTIR) and proton nuclear magnetic resonance (1H-NMR). The
microcapsules of 0.2−0.3 g were crushed with a pestle in a mortar. The core content was
extracted with acetone and the insoluble shell materials were filtered, washed and dried
at 70°C for 24 h in a vacuum oven. For the 1H-NMR analysis, the core content was
extracted using deuterated chloroform (CDCl3).
FTIR spectra of the samples were collected from a spectrometer (ATR-FTIR Perkin-
Elmer Spectrum 400) with eight scans, in the range of 4000−450 cm-1 wavenumbers at 4
cm-1 resolution. The spectra of the extracted core were compared with the spectra of the
neat alkyd. The spectra of the shell materials were also obtained. All data were processed
by Spectrum v6.3.1.0132 (Perkin Elmer) software.
Solution state 1H-NMR spectrum of the extracted core content was recorded on the
sample dissolved in CDCl3. The shell was insoluble in CDCl3, thus could not be analyzed
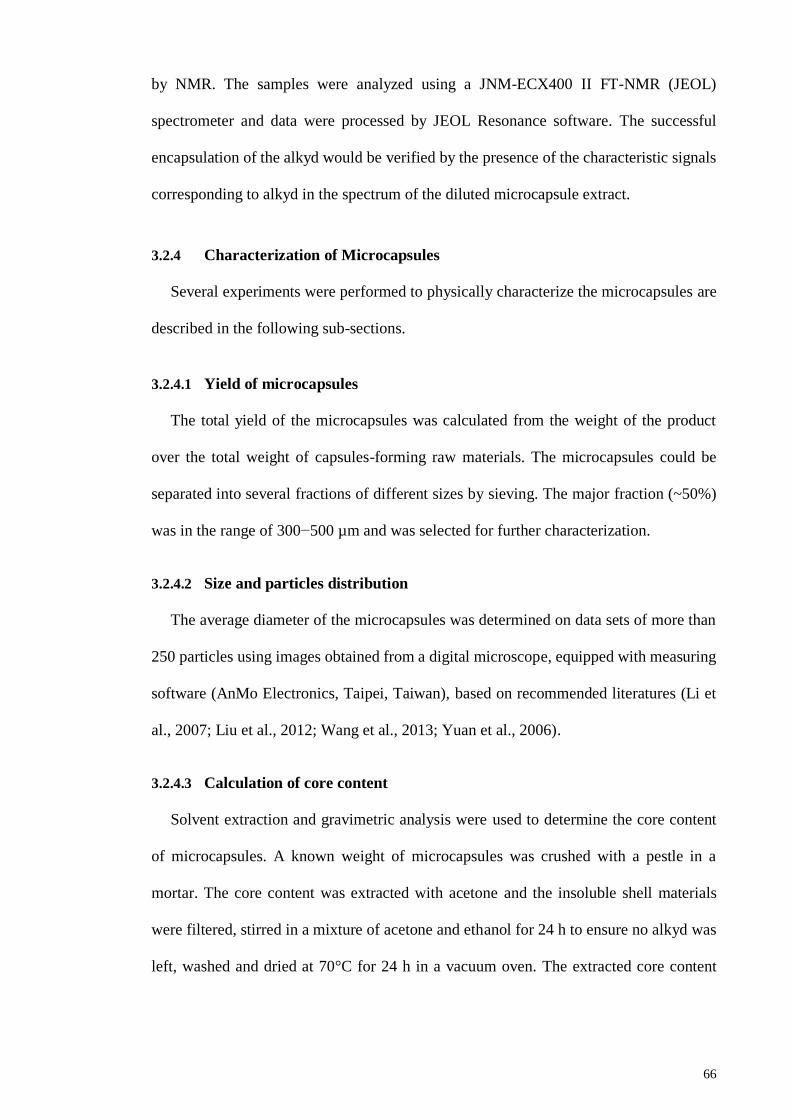
66
by NMR. The samples were analyzed using a JNM-ECX400 II FT-NMR (JEOL)
spectrometer and data were processed by JEOL Resonance software. The successful
encapsulation of the alkyd would be verified by the presence of the characteristic signals
corresponding to alkyd in the spectrum of the diluted microcapsule extract.
3.2.4 Characterization of Microcapsules
Several experiments were performed to physically characterize the microcapsules are
described in the following sub-sections.
3.2.4.1 Yield of microcapsules
The total yield of the microcapsules was calculated from the weight of the product
over the total weight of capsules-forming raw materials. The microcapsules could be
separated into several fractions of different sizes by sieving. The major fraction (~50%)
was in the range of 300−500 µm and was selected for further characterization.
3.2.4.2 Size and particles distribution
The average diameter of the microcapsules was determined on data sets of more than
250 particles using images obtained from a digital microscope, equipped with measuring
software (AnMo Electronics, Taipei, Taiwan), based on recommended literatures (Li et
al., 2007; Liu et al., 2012; Wang et al., 2013; Yuan et al., 2006).
3.2.4.3 Calculation of core content
Solvent extraction and gravimetric analysis were used to determine the core content
of microcapsules. A known weight of microcapsules was crushed with a pestle in a
mortar. The core content was extracted with acetone and the insoluble shell materials
were filtered, stirred in a mixture of acetone and ethanol for 24 h to ensure no alkyd was
left, washed and dried at 70°C for 24 h in a vacuum oven. The extracted core content
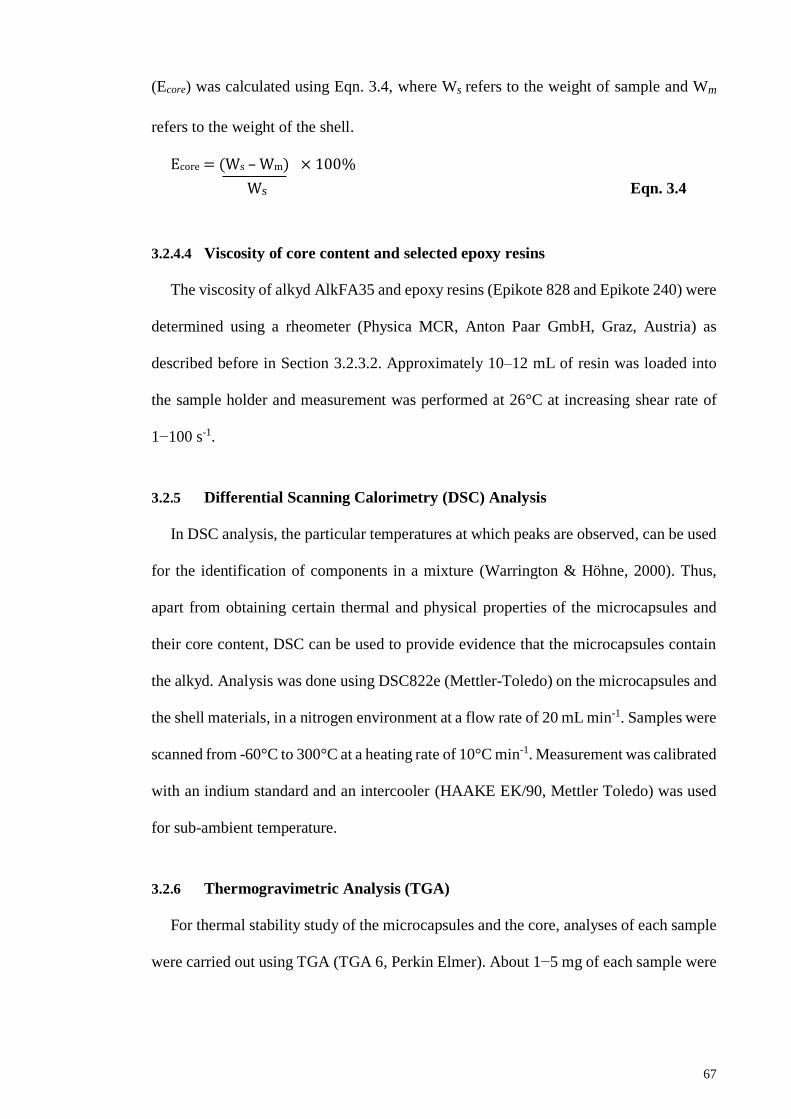
67
(Ecore) was calculated using Eqn. 3.4, where Ws refers to the weight of sample and Wm
refers to the weight of the shell.
Ecore = (Ws – Wm) × 100%
Ws Eqn. 3.4
3.2.4.4 Viscosity of core content and selected epoxy resins
The viscosity of alkyd AlkFA35 and epoxy resins (Epikote 828 and Epikote 240) were
determined using a rheometer (Physica MCR, Anton Paar GmbH, Graz, Austria) as
described before in Section 3.2.3.2. Approximately 10–12 mL of resin was loaded into
the sample holder and measurement was performed at 26°C at increasing shear rate of
1−100 s-1.
3.2.5 Differential Scanning Calorimetry (DSC) Analysis
In DSC analysis, the particular temperatures at which peaks are observed, can be used
for the identification of components in a mixture (Warrington & Höhne, 2000). Thus,
apart from obtaining certain thermal and physical properties of the microcapsules and
their core content, DSC can be used to provide evidence that the microcapsules contain
the alkyd. Analysis was done using DSC822e (Mettler-Toledo) on the microcapsules and
the shell materials, in a nitrogen environment at a flow rate of 20 mL min-1. Samples were
scanned from -60°C to 300°C at a heating rate of 10°C min-1. Measurement was calibrated
with an indium standard and an intercooler (HAAKE EK/90, Mettler Toledo) was used
for sub-ambient temperature.
3.2.6 Thermogravimetric Analysis (TGA)
For thermal stability study of the microcapsules and the core, analyses of each sample
were carried out using TGA (TGA 6, Perkin Elmer). About 1−5 mg of each sample were

68
scanned from 30°C to 700°C at 20°C min-1, in a nitrogen environment at a flow rate of
20 mL min-1.
3.2.7 Simultaneous Thermal Analysis (STA)
Approximately 5 mg of samples from the C and D series were analyzed using
simultaneous thermal analyzer (STA 6000, Perkin Elmer, Waltham, MA, USA) due to
unavailability of the previous instrument. They were scanned from 30°C to 800°C at 20°C
min-1, in a nitrogen environment at a flow rate of 20 mL min-1.
3.2.8 Surface Morphology and Shell Wall Thickness
The morphology of microcapsules was examined using two different field-emission
scanning electron microscopes (FESEM) (Hitachi SU8220, Hitachi Hi-Tech Corp.,
Tokyo, Japan and Quanta FEG 450, FEI, Oxford, UK). Samples were mounted on a
single-stub sample holder and some of the microcapsules were sliced with a razor blade
to facilitate examination of the interior of the microcapsules. The analysis was carried out
under low vacuum using an electron acceleration voltage of 2.0 and 5.0 kV.
3.2.9 Storage of Microcapsules
After the isolation and sieving processes, the microcapsules were kept in tightly sealed
vials. They were stored in two refrigerators with the average temperature of 25−26°C and
8−9°C respectively. After a certain period of time, microcapsules were inspected using
digital microscope and tested using DSC.
3.3 Microcapsules in Epoxy Matrix: Mechanical Properties and Epoxy/Alkyd
Reaction
The prepared microcapsules were embedded to a selected epoxy matrix and certain
mechanical properties of the epoxy composite were tested. Next, the curing of epoxy with

69
alkyd were evaluated by blending the epoxy and alkyd. The blends were cured with amine
hardener.
3.3.1 Mold Preparation
Bar- and disc-shaped molds were prepared using VPS impression material (silicone
rubber). The base material was mixed with its catalyst in a 1:1 ratio. They were kneaded
until a dough was formed. The soft dough was pressed and quickly shaped to form the
required shape of mold. The mold hardened within 1−1.5 min. It was cured after 4 min at
room temperature (25−26°C). Gloves were used to prevent heat transfer from hands that
would accelerate the curing process. The mold was used to cast the epoxy resins.
3.3.2 Samples Preparation for Mechanical Tests
B2 and C2 microcapsules of 1, 3 and 6 wt. % were mixed with 5.0 g epoxy resin, in
small beakers. The mixtures were stirred for 5 min. Then, 2.9 g of amine hardener (58
parts resin per hundred resin (p.h.r) were added to each mixture and carefully stirred for
5 min. As the epoxy resin started to react with the hardener, the mixtures gradually
thickened. They were transferred to rectangular silicone rubber molds with a dimension
of 25 mm × 2 mm × 2 mm to produce five samples for a three-point-bend test. Another
set of 2 samples with the specified amount of microcapsules, were prepared with
dimension of 2 mm diameter and 8 mm height according to modified ASTM E 384:1990
for micro-indentation hardness (Vickers) test. The excess mixture was removed using
spatula. The samples were cured for 24 h at ambient temperature followed by 100°C for
2 h to complete the curing process. The same procedure was employed to make neat
epoxy samples as controls for each respective tests.

70
3.3.3 Morphology and Dispersion of Microcapsules in Epoxy Matrix
To ensure good distribution of microcapsules in the epoxy matrix, all samples were
visually inspected using digital microscope prior to testing (AnMo Electronics, Taiwan).
For further observation using FESEM, after the thickened mix was transferred to the
mold, it was cooled in liquid nitrogen for 2 min and quickly sliced using a razor blade.
The sliced pieces were then cured at 100°C for 2 h, followed by examination using
FESEM (Hitachi SU8220) at suitable voltage and magnifications.
3.3.4 Three-Point Bend Test
The samples prepared in Section 3.4.2 were subjected to a three-point-bend test. The
test was carried out using a universal testing machine (AG-X Shimadzu, Shimadzu Corp.,
Kyoto, Japan). The setup consists of two rods of 2 mm in diameter, mounted parallel with
20 mm distance. Then, 5 kN load cell were applied at a crosshead speed of 1 mm min-1
until 5% strain. Each reported flexural strength was the average of four repeated samples.
3.3.5 Micro-Indentation Hardness (Vickers) Test
The Vickers test was performed on a microhardness measuring machine (HMV-2,
Shimadzu Corp., Kyoto, Japan) with test force of 98.07 mN (HV 0.01). Each sample was
subjected to three indentations at different spots for 5 s duration per indent and the three
readings were averaged.
3.3.6 Preparation and Characterization of Epoxy/Alkyd (EA) Blends
To probe the viability of the healing reactions, small amounts of alkyd were blended
with epoxy and hardener at different ratios. They were cured at room temperature for 24
h and at 100°C for 2 h. Each of the un-cured blend was dropped and sandwiched between
two PET plastic and left to cure at room and elevated temperature (100°C). The cured

71
film were analyzed using ATR-FTIR (Perkin-Elmer Spectrum 400), with 4 cm-1
resolution from eight scans at 4000−450 cm-1 wavenumber.
3.4 Summary
Overall, an alkyd as the bio-based polymer, served as potential healing agent for epoxy
matrix, was synthesized, followed by its encapsulation using amino resins. It was done
using in situ polymerization of PUF and PMUF forming the shell around the droplets of
the emulsified alkyd. The microcapsules were characterized and incorporated to the
epoxy matrix. The effect of its inclusion on the mechanical properties were studied.
Finally, the potential reaction of alkyd and epoxy was examined through blending
experiment. The findings of this study will be presented in three parts according to the
three main research objectives determined previously.

72
CHAPTER 4: ALKYD RESIN FROM PALM KERNEL OIL
4.1 Alkyd Synthesis
The alkyd was synthesized by alcoholysis and esterification processes. The acid
number decreased with increasing reaction time as shown in Fig.4.1. The initial acid
number of 305 mg KOH g−1 was reduced to 15 mg KOH g−1 in 450 min, indicating the
reaction has achieved >95% completion.
Fig. 4.1: Acid number change vs. esterification time
4.2 1H-NMR Spectroscopy
The proton-NMR (1H-NMR) spectra of PKO and alkyd are shown in Fig. 4.2 and the
assignment of the peaks is given in Table 4.1. For PKO, peaks at 0.8 and 1.3 ppm
represent the methyl and methylene protons from the hydrocarbon chain of fatty acids.
The unsaturated fatty acids in PKO such as oleic and linoleic acid are reflected from the
resonance of the allylic and vinylic protons at 2.0 and 5.3 ppm respectively. Other peaks
observed at 1.6 ppm, 2.3 ppm and 4.1-4.3 ppm correspond to the methylene protons that
directly attached to the carbon and oxygen atom of the ester unit.
AlkydPKO65 shows the similar spectrum as its starting materials. Peaks a, b, c, d, e
and g represent the fatty acid chains contained in the PKO. Significant amount of ester
0
50
100
150
200
250
300
350
0 100 200 300 400 500
Acid
nu
mb
er
(mg
KO
H·g
−1
)
Reaction time (min)

73
linkages present in the alkyd has resulted in broader peaks at 3.6 to 4.4 ppm (labelled as
f), compared to the peaks of PKO. Two peaks at 7.5 ppm and 7.6 ppm from the alkyd are
attributed to the aromatic protons from PA (labelled as h). Based on this spectrum, a
plausible structure of AlkydPKO65 was derived and is shown in Fig. 4.3, with the
assignments of peaks from the selected fatty acids chain. It is useful to note that the
structure proposed is one of the plausible structure. The two fatty acids shown are
randomly chosen for proton-NMR peaks assignment and may not represent the dominant
species.
Table 4.1: Peak assignments for 1H-NMR spectrum of PKO and AlkydPKO65
Palm kernel oil (PKO) AlkydPKO65
Chemical shifts
(ppm) Proton assignment
Chemical shifts
(ppm) Proton assignment
0.8 -R-CH3- 0.8 -R-CH3-
1.3 -R-CH2-R- 1.3 -R-CH2-R-
1.6 -OOC-CH2-CH2- 1.6 -OOC-CH2-CH2-
2.0 -C=C-CH2- 2.0 -C=C-CH2-
2.3 -OOC-CH2- 2.3 -OOC-CH2-
4.1-4.3 -COO-CH2- 3.6-4.4 -COO-CH2-
5.3 -HC=CH- 5.3 -HC=CH-
7.51, 7.69 aromatic –CH=CH-
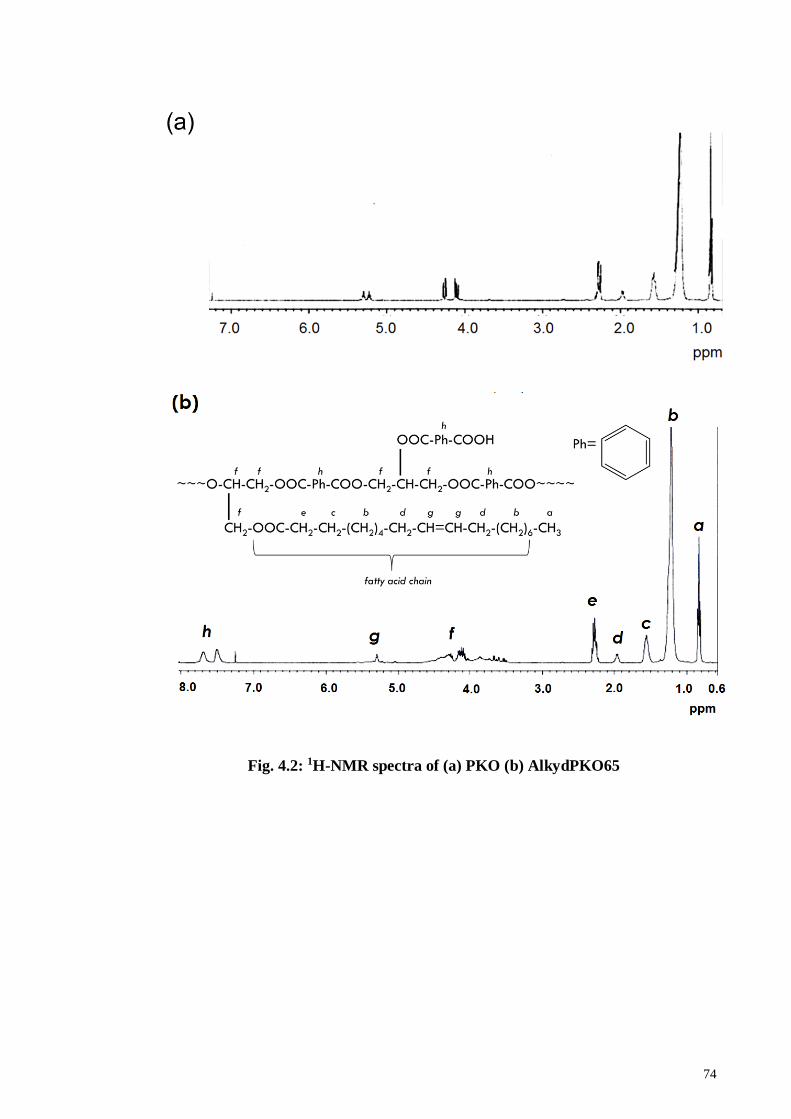
74
Fig. 4.2: 1H-NMR spectra of (a) PKO (b) AlkydPKO65
75
Fig. 4.3: (a) Plausible structure of AlkydPKO65 (b) saturated caprylic acid (c)
unsaturated linoleic acid
4.3 ATR-FTIR Spectroscopy
Fig. 4.4 (a) shows the FTIR spectrum of PKO which is the characteristics of a
triglyceride structure. The absorption bands of the hydrocarbon chains of fatty acids
observed at 2924 cm−1 and 2854 cm−1 were attributed to C–H stretching of –CH3 and –
CH2 groups, 1462 cm−1 was due to C–H bending of –CH2 group, 1378 cm−1 was due to
C–H bending of –CH3 and 722 cm−1 was due to –CH2 rocking. Ester linkages in PKO are
represented by peaks at 1744 cm−1 which is due to C=O stretching of ester and peaks at
1156 cm−1 and 1111 cm−1 that are attributed to C–O stretching of ester.
The FTIR spectrum of AlkydPKO65 is shown in Fig. 4.4 (b). The characteristic peaks
observed are as follows: broad band at 3449 cm−1 (O–H stretching), sharp peaks at 2923
and 2854 cm−1 (C–H stretching) and strong peak at 1727 cm−1 (C=O of carboxyl groups),
small peaks at 1600 and 1581 cm−1 (aromatic ring) and 1459 and 1378 cm−1 (C–H and C–
R bending modes). The small peaks at 1072, 1119 and 1268 cm−1 (C–O groups) and the
weak peak at 743 cm−1 (aromatic =C–H bending).

76
Fig. 4.4: FTIR spectra of (a) PKO (b) AlkydPKO65.
The alkyd shows additional peaks at 3449 cm−1 and 1268 cm−1 as exhibited in Fig. 4.4
(b). During the alcoholysis process, triglycerides in PKO were converted to a
predominant mixture of monoglycerides through reaction with glycerol. This reaction
contributes to high amount of –OH groups in the system. Subsequently, the –OH groups
were consumed in the esterification reaction with PA, therefore producing a significant

77
amount of ester linkages as shown by the strong –C−O stretching peak of the ester groups
at 1268 cm−1. Even with the consumption of –OH groups during esterification, the –OH
stretching at 3483 cm−1 in the spectrum was relatively strong as AlkydPKO65 was
formulated with 48 % excess of –OH groups. The additional small peaks at 1600 cm−1
and 1581 cm−1 were attributed to the aromatic rings from the incorporated PA. The strong,
sharp –C=O peak of triglycerides ester has also shifted from 1744 to 1727 cm−1. Finally,
a plausible synthetic route of the alkyd is presented in Fig. 4.5.
Fig. 4.5: Plausible synthesis route of AlkydPKO65; R= fatty acid chains from PKO
4.4 Viscosity of Alkyd
The correct rheological properties including the viscosity of alkyd resin are essential
for their effective utilization across a variety of fields. These properties are mainly

78
influenced by the presence of the chain entanglement, coiling, different inter- and
intramolecular attractive forces, cross-linking density, rigidity and by molecular weight
distribution (Karak, 2012). In this work, the viscosity of alkyd was determined using a
rheometer, with a rotating disc.
Typical microencapsulation process or in situ emulsion polymerization of the amino
resins was performed at temperature of 55−70°C. The chosen temperature for
microencapsulation in this work was 55°C. Therefore, the viscosity of the potential core
content was tested at 55°C, at increasing shear rates (0 −100 s−1). At elevated temperature,
the viscosity of AlkydPKO65 decreases by 84% to 0.33 ± 0.04 Pa·s, as shown in Table
4.2.
Table 4.2: Viscosity of AlkydPKO65
Sample Temperature
(°C)
Viscosity (η, Pa·s)
At 100 s-1 At 0−100 s-1
AlkydPKO65 25 2.14 (0.01) 2.07 (0.01)
55 − 0.33 (0.04)
4.5 Molecular Weight Determination
The gel permeation or size exclusion chromatograms of AlkydPKO and epoxy resin
used as matrix host for microcapsules are presented in Fig. 4.6. The chromatogram of
alkyd shows a peak at a slightly lower elution volume, at 32.4 mL, indicating a slightly
higher molecular weight compared to the epoxy resin (elution volume of 33.3 mL). The
number average molecular weight (Mn), weight average molecular weight (Mw) and
polydispersity for the resins are listed in Table 4.3.

79
Fig. 4.6: GPC curves of (a) AlkydPKO65 (b) EpikoteTM 240
Table 4.3: Mn , Mw and polydispersity index (PDI) of alkyd and epoxy resins
Sample code
Concentration
(% w/v)
Mn Mw PDI= Mw/ Mn
AlkydPKO65 0.2 642 1042 1.63
EpikoteTM 240 0.2 248 321 1.29
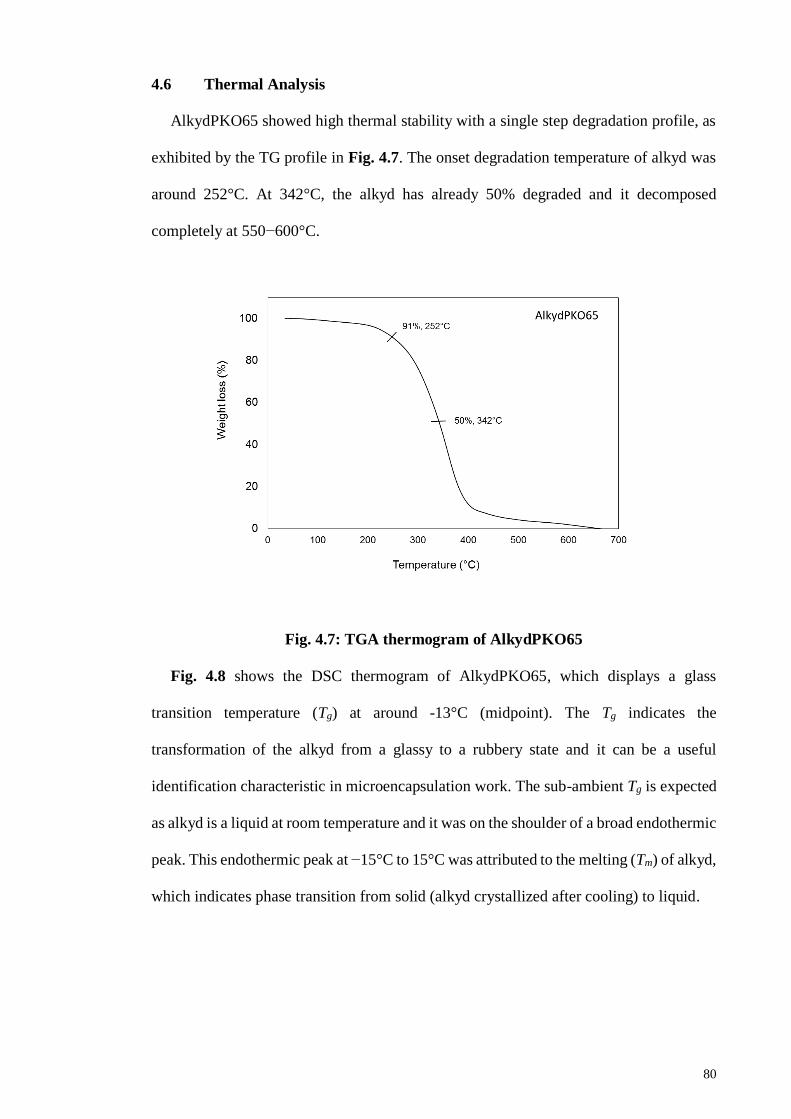
80
4.6 Thermal Analysis
AlkydPKO65 showed high thermal stability with a single step degradation profile, as
exhibited by the TG profile in Fig. 4.7. The onset degradation temperature of alkyd was
around 252°C. At 342°C, the alkyd has already 50% degraded and it decomposed
completely at 550−600°C.
Fig. 4.7: TGA thermogram of AlkydPKO65
Fig. 4.8 shows the DSC thermogram of AlkydPKO65, which displays a glass
transition temperature (Tg) at around -13°C (midpoint). The Tg indicates the
transformation of the alkyd from a glassy to a rubbery state and it can be a useful
identification characteristic in microencapsulation work. The sub-ambient Tg is expected
as alkyd is a liquid at room temperature and it was on the shoulder of a broad endothermic
peak. This endothermic peak at −15°C to 15°C was attributed to the melting (Tm) of alkyd,
which indicates phase transition from solid (alkyd crystallized after cooling) to liquid.
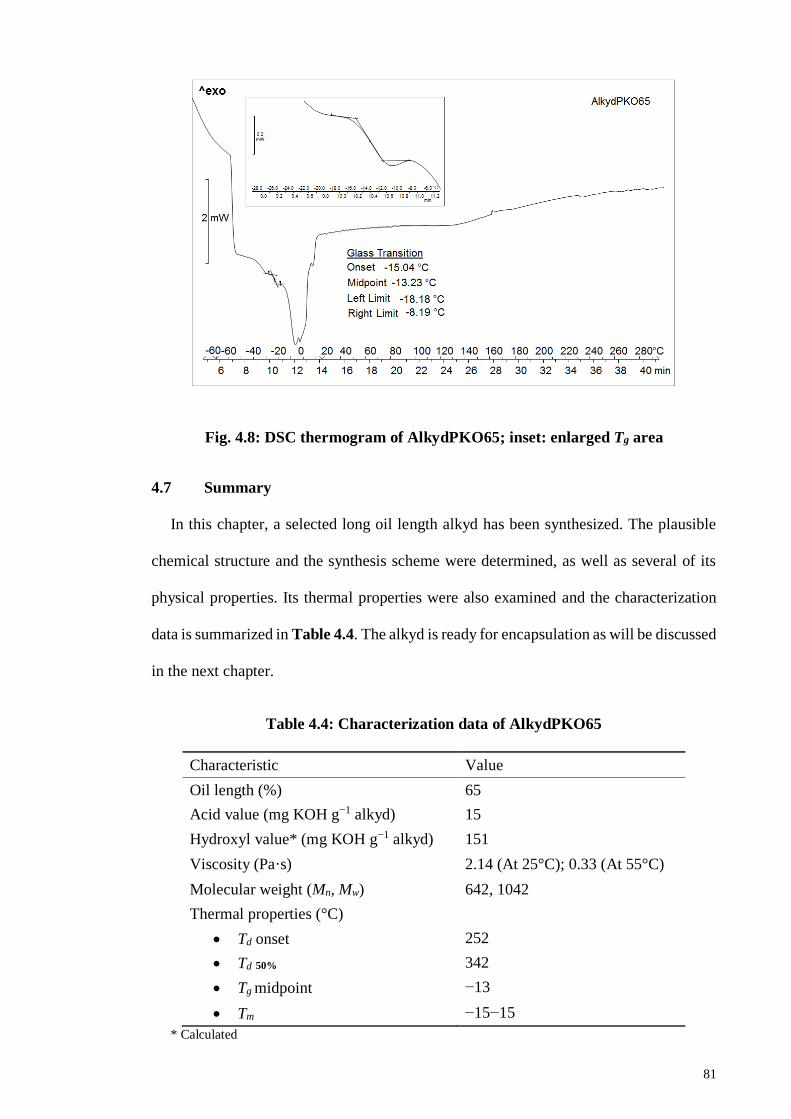
81
Fig. 4.8: DSC thermogram of AlkydPKO65; inset: enlarged Tg area
4.7 Summary
In this chapter, a selected long oil length alkyd has been synthesized. The plausible
chemical structure and the synthesis scheme were determined, as well as several of its
physical properties. Its thermal properties were also examined and the characterization
data is summarized in Table 4.4. The alkyd is ready for encapsulation as will be discussed
in the next chapter.
Table 4.4: Characterization data of AlkydPKO65
Characteristic Value
Oil length (%) 65
Acid value (mg KOH g−1 alkyd) 15
Hydroxyl value* (mg KOH g−1 alkyd) 151
Viscosity (Pa·s) 2.14 (At 25°C); 0.33 (At 55°C)
Molecular weight (Mn, Mw) 642, 1042
Thermal properties (°C)
Td onset 252
Td 50% 342
Tg midpoint −13
Tm −15−15
* Calculated

82
CHAPTER 5: MICROENCAPSULATION OF ALKYD BY AMINO RESINS
5.1 Synthesis of Microcapsules
The general process described in Section 3.3.2 produced poly(urea-formaldehyde)
(PUF) and poly(melamine-urea-formaldehyde) (PMUF) microcapsules with alkyd core
over a size range of 50-500 microns. Yield of the preparation, as defined by the ratio of
the mass of recovered microcapsules to the total mass of alkyd and shell constituents are
in the range of 15−65 %. The microcapsules were spherical and free flowing after drying.
Under high shear condition, microcapsules could fractured resulting in lower yields as
agitation increases. Similar observation has been reported in Brown et al. (2003).
In this work, the in situ polymerization of amino resins to encapsulate the alkyd could
be described in three phases. During phase 1, after about 60 min of reaction, alkyd
droplets separate from aqueous medium when agitation stops, as shown in Fig. 5.1 (a).
Urea (U) and formaldehyde (F) or melamine (M)-urea and formaldehyde react and form
methylol ureas, which further condenses under acidic condition to form the shell
materials. The encapsulation of alkyd takes place simultaneously during the formation of
crosslinked UF/ MUF polymer. At this point, melamine, urea and formaldehyde are
soluble in water. When the pH is changed to acidic and heated to 55°C, the oligomers
react to form poly(UF) or poly(MUF).
In the second phase, which was after 120 min of reaction, microcapsules have already
formed, with a density lower than the medium. Clumping will occur if the agitation stops.
As shown in Fig. 5.1 (b), the reaction solution turns milky due to the formation of
emulsion. The number of polar groups will gradually reduce as the molecular weight of
polymer increases. After attaining a certain molecular weight, hydrophilicity of UF/ MUF
polymer will reduce. This will separate the polymers from the aqueous phase and they

83
will get deposited on the suspended or emulsified alkyd droplets. Similar observations
were observed and explained in literatures (Brown et al., 2003; Kouhi et al., 2013).
In the final phase (Fig. 5.1 (c)), which was after 180−240 min, the reaction mixture
started to turn clear as the UF/ MUF nanoparticles were attached to the microparticles of
the alkyd. This process continues and a thin shell is formed over the alkyd’s droplet. The
density of the particles now are higher than that of the medium and they will form a white
slurry and settle at the bottom of the beaker when the agitation stops. Fig. 5.1 (d) shows
the final product of microcapsules after washing and filtration processes. The process of
UF/MUF condensation to form the shell of microcapsules can be illustrated as in Fig. 5.2.
Fig. 5.1: Digital microscope images of reaction medium after (a) 60 min (b) 120
min (c) 180−240 min; (d) microcapsules after washed and filtered
Fig. 5.2: A suspension or emulsion polymerization where polymer is deposited at
an aqueous/organic interface, yielding a polymer shell wall around a stabilized
droplet that becomes the core solution. From Esser-Kahn et al. © 2011 ACS
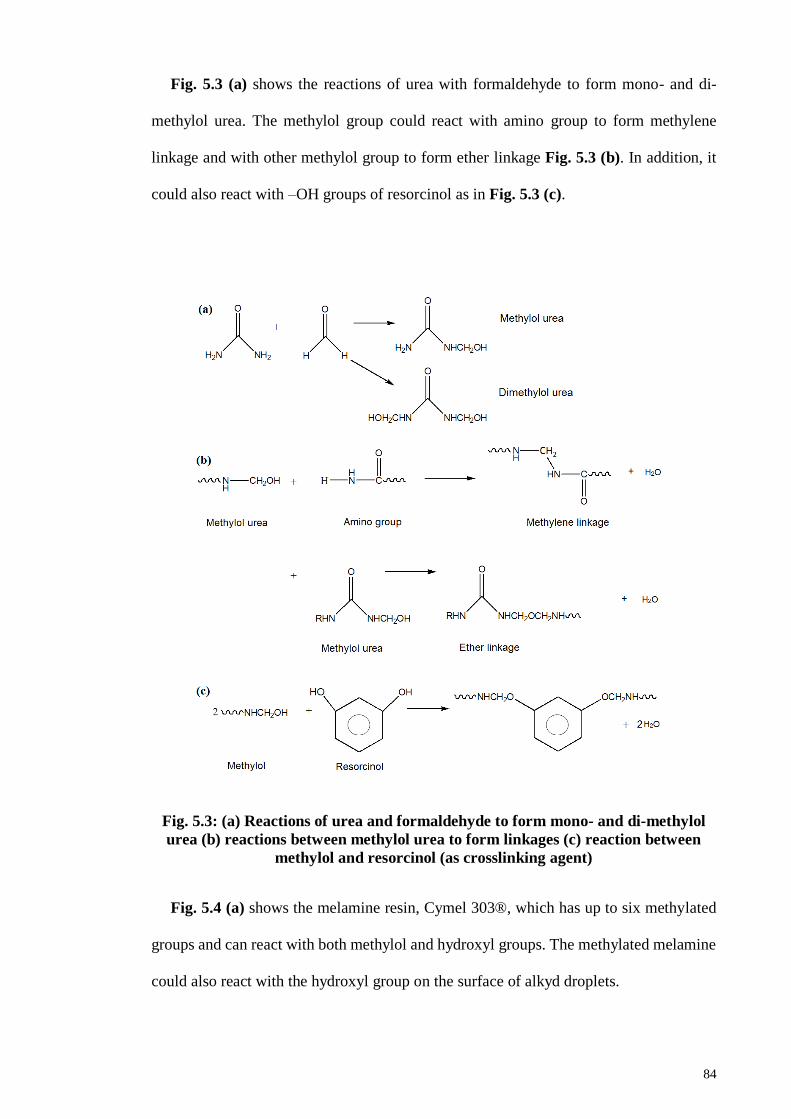
84
Fig. 5.3 (a) shows the reactions of urea with formaldehyde to form mono- and di-
methylol urea. The methylol group could react with amino group to form methylene
linkage and with other methylol group to form ether linkage Fig. 5.3 (b). In addition, it
could also react with –OH groups of resorcinol as in Fig. 5.3 (c).
Fig. 5.3: (a) Reactions of urea and formaldehyde to form mono- and di-methylol
urea (b) reactions between methylol urea to form linkages (c) reaction between
methylol and resorcinol (as crosslinking agent)
Fig. 5.4 (a) shows the melamine resin, Cymel 303®, which has up to six methylated
groups and can react with both methylol and hydroxyl groups. The methylated melamine
could also react with the hydroxyl group on the surface of alkyd droplets.

85
Fig. 5.4: (a) Chemical structure of melamine resin (Cymel 303®); (b) plausible
crosslinking reaction of melamine resin; (c) plausible crosslinking reaction of
alkyd with methylol urea and –N-CH2-O-CH3 of melamine resin
5.2 Influence of Reaction Parameters on the Microencapsulation
To obtain a good yield of alkyd microcapsules, several important parameters of
encapsulation were investigated and elaborated in the following sections. Two methods,
namely Method 1 and Method 2 were adopted. Fig. 5.5 summarizes the encapsulation
steps and highlights the differences between the two. Method 1 was based on reference
(Brown et al., 2003).

86
Fig. 5.5: Microencapsulation procedures of alkyd (a) Method 1 (b) Method 2.
5.2.1 Core/Shell Weight Ratio Variation in Method 1
Brown and his colleague has used a 6.2: 1 core/shell weight ratio in the in situ
polymerization of UF (Brown et al., 2003). This ratio has been adopted by a number of
other researchers (Noh & Lee, 2013; Then et al., 2011a; Tong et al., 2010). The effect of
different core/shell weight ratios (samples 1-A to 1-F) on the surface morphology of

87
microcapsules were investigated. The microcapsules were prepared using Method 1 and
the ratio was varied from 6.0 to 13.9 as tabulated in Table 5.1.
Table 5.1: Formulation and characterization data of PMUF microcapsules,
prepared using Method 1
Sample
Core/shell
(wt. ratio)
Core
(g)
Shell materials (g) Yield
(%)
MCs description U F M
1-A 6.0 30 2.35 6.35 0.32 25 Fragile, not free flowing
1-B 8.0 40 2.35 6.35 0.32 34 Fragile, not free flowing
1-C 9.0 45 2.35 6.35 0.32 42 Fragile, not free flowing
1-D 10.0 50 2.35 6.35 0.32 32 Fragile, not free flowing
1-E 12.0 60 2.35 6.35 0.32 52 Fragile, not free flowing
1-F 13.9 70 2.35 6.35 0.32 40 Fragile, not free flowing
U: urea; M: melamine (pure 99 %); F: formaldehyde of 37% aqueous; EMA: ethylene
(maleic anhydride); 2.5 wt. % of EMA were used as emulsifier for this series.
Fig. 5.6 shows the digital microscope images of Series 1 microcapsules becoming
smoother with the increase of core material. Increasing the core material could increase
the number of droplets in the emulsion, while size of the droplets remains the same, since
the stirring rate was kept constant at 500 rpm. When the number of droplets increases, the
surface area increases and deposition of PMUF nanoparticles on the droplets surface
becomes more even, thus the yield of capsules increases. Less agglomerated PMUF was
also being observed when core content was increased. However, if the core was in excess,
(as in 1-F where amount of shell material was relatively less) thinner wall of the
encapsulated particles were obtained. This explains why 1-F microcapsules were easily
ruptured and the yield decreased. At room temperature, they ruptured in 1 day. Alkyd
core diffused out, causing the capsules to stick to each other and appeared yellowish,
which was the color of the alkyd. Fig. 5.7 (a) shows the 1-E microcapsules as round-
spherical in shape with smooth surface. Blown up micrograph (Fig. 5.7 (b)) shows thin

88
deposition of PMUF nanoparticles on the microcapsules surface. Generally, the
microcapsules produced a typical UF rough outer surface but differs upon core loading
content. In this series although in the beginning, there were microcapsules produced, all
of them tend to be fragile after 1-2 days and were no longer free flowing.
Fig. 5.6: Digital microscope images of PMUF microcapsules (Series 1), prepared at
different core/shell weight ratios

89
Fig. 5.7: (a) Smooth surface of 1-E microcapsule (b) magnified shell surface of
PMUF microcapsule by Method 1
5.2.2 Core/Shell Weight Ratio Variation in Method 2
With reference to Table 5.2, samples 2-A to 2-C were synthesized using Method 2,
where the alkyd was emulsified before addition of the urea and formaldehyde. Shell was
formed through the polycondensation reaction of urea-formaldehyde. The core/shell
weight ratios were varied from 6.2 to 2.1. Lower ratios were chosen in this series because
at high amount of alkyd core, the microcapsules formed were too fragile and ruptured
during processing and consequently very few microcapsules were stable enough for
isolation. Referring to Fig. 5.8, some microcapsules that were successfully isolated can
be seen in 2-B, but the sample was contaminated by some agglomerated UF particles. 2-
C shows the microcapsules with minimum UF particles, whereas 2-A consisted of fragile
microcapsules with lots of UF debris. Apparently the size of the microcapsules did not
decrease with the decrease of core content and was still maintained in the range of 300 to
500 microns.
The microcapsules were further investigated with FESEM to check their surface
morphology. They appeared round-spherical shape as shown in the micrograph (Fig. 5.9
(a)), having rough shell that consisted of the high molecular weight of PUF. The blown

90
up image (Fig. 5.9 (b)) shows that the PUF formed layers on top of each other from the
polycondensation of urea and formaldehyde.
Table 5.2: Formulation and characterization data of PUF microcapsules, prepared
using Method 2
Sample
Core/shell
(wt. ratio)
Core
(g)
Shell materials (g) Yield
(%)
MCs description Urea Formaldehyde
2-A 6.2 30 2.50 6.35 - Fragile, not free flowing 2-B 2.7 15 2.50 6.35 9 Fragile, not free flowing 2-C 2.1 10 2.50 6.35 17 Adequately coated, free
flowing Formaldehyde: aqueous solution of 37 %; EMA: ethylene (maleic anhydride); EMA used was 2.5
% for all samples.
Fig. 5.8: Digital microscope images of PUF microcapsules (Series 2) prepared with
Method 2

91
Fig. 5.9: FESEM micrographs of sample 2-C microcapsule and its shell surface
morphology
Reduction of core material and difference in procedure could produce significant
differences in the capsules. Sample 2-A was at nearly similar ratio of core to shell as 1-
A, except no melamine was used. Sample 2-A has produced mainly the agglomerated UF
resin particles. When the core content was reduced (sample 2-B), about 9% of
microcapsules were formed. Further reduction of the core-shell ratio in sample 2-C has
led to the formation of 17% of microcapsules. All the microcapsules have similar
spherical shape with rough outer shell surface consisting of a layer of nanoparticles of
amino resin. Fig. 5.9 (c) shows a ruptured microcapsule (sample 2-C) where the outer
surface of the shell was rough. The inner shell had a thickness of 800 nm to 1.6 microns
(Fig. 5.9 (d)).
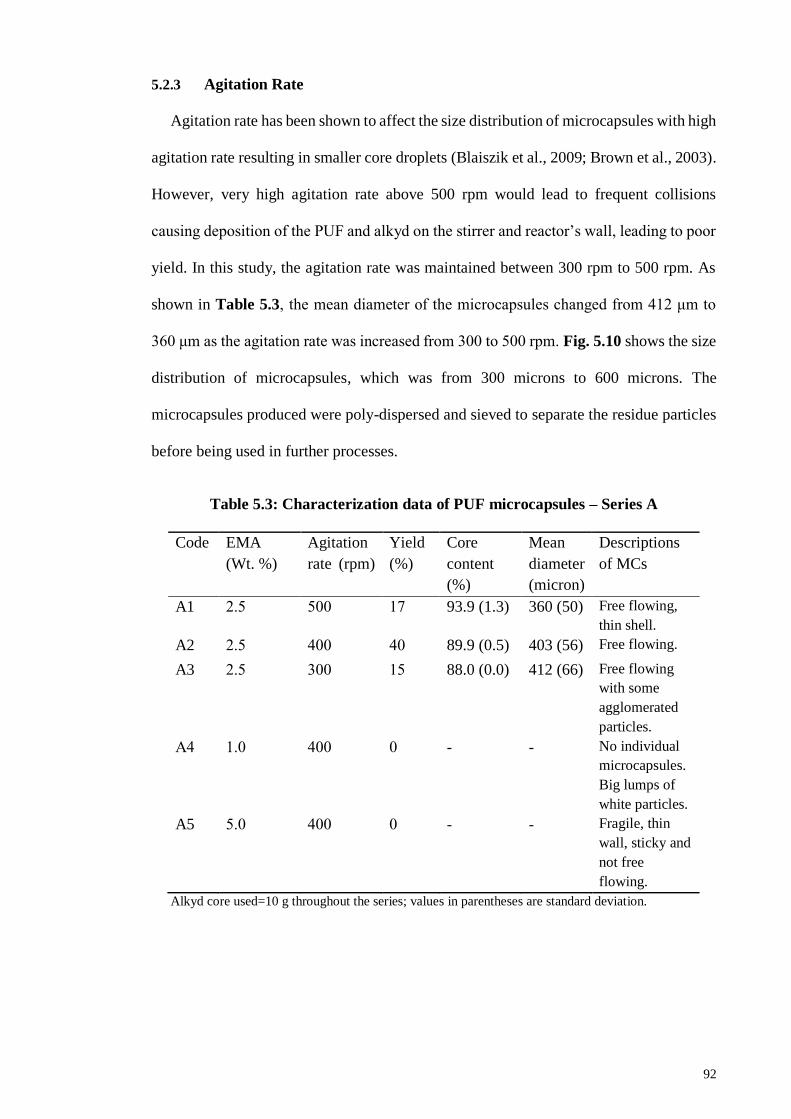
92
5.2.3 Agitation Rate
Agitation rate has been shown to affect the size distribution of microcapsules with high
agitation rate resulting in smaller core droplets (Blaiszik et al., 2009; Brown et al., 2003).
However, very high agitation rate above 500 rpm would lead to frequent collisions
causing deposition of the PUF and alkyd on the stirrer and reactor’s wall, leading to poor
yield. In this study, the agitation rate was maintained between 300 rpm to 500 rpm. As
shown in Table 5.3, the mean diameter of the microcapsules changed from 412 μm to
360 μm as the agitation rate was increased from 300 to 500 rpm. Fig. 5.10 shows the size
distribution of microcapsules, which was from 300 microns to 600 microns. The
microcapsules produced were poly-dispersed and sieved to separate the residue particles
before being used in further processes.
Table 5.3: Characterization data of PUF microcapsules – Series A
Code EMA
(Wt. %)
Agitation
rate (rpm)
Yield
(%)
Core
content
(%)
Mean
diameter
(micron)
Descriptions
of MCs
A1 2.5 500 17 93.9 (1.3) 360 (50) Free flowing,
thin shell.
A2 2.5 400 40 89.9 (0.5) 403 (56) Free flowing.
A3 2.5 300 15 88.0 (0.0) 412 (66) Free flowing
with some
agglomerated
particles.
A4 1.0 400 0 - - No individual
microcapsules.
Big lumps of
white particles.
A5 5.0 400 0 - - Fragile, thin
wall, sticky and
not free
flowing.
Alkyd core used=10 g throughout the series; values in parentheses are standard deviation.

93
Fig. 5.10: Size distribution (left) and digital microscopic images of microcapsules
(right, 50×), prepared at different agitation rates (rpm): (a) 500; (b) 400; (c) 300
Sample A1 prepared at agitation rate of 500 rpm has produced 17% yield of the
microcapsules. As exhibited in Fig. 5.11, these microcapsules have relatively thin wall
and contain up to 94 % core, whereas, sample A2, which was made with agitation rate of
400 rpm produced a higher yield (40 %) with more stable and more free flowing
microcapsules. The faster stirring dispersed the alkyd into smaller droplets. However,
extremely high stirring rate can lead to collisions between the droplets leading to
agglomeration of the microcapsules, thus lowering the yield (Chen et al., 2015). On the
other hand, sample A3 prepared with lower agitation rate (300 rpm) produced
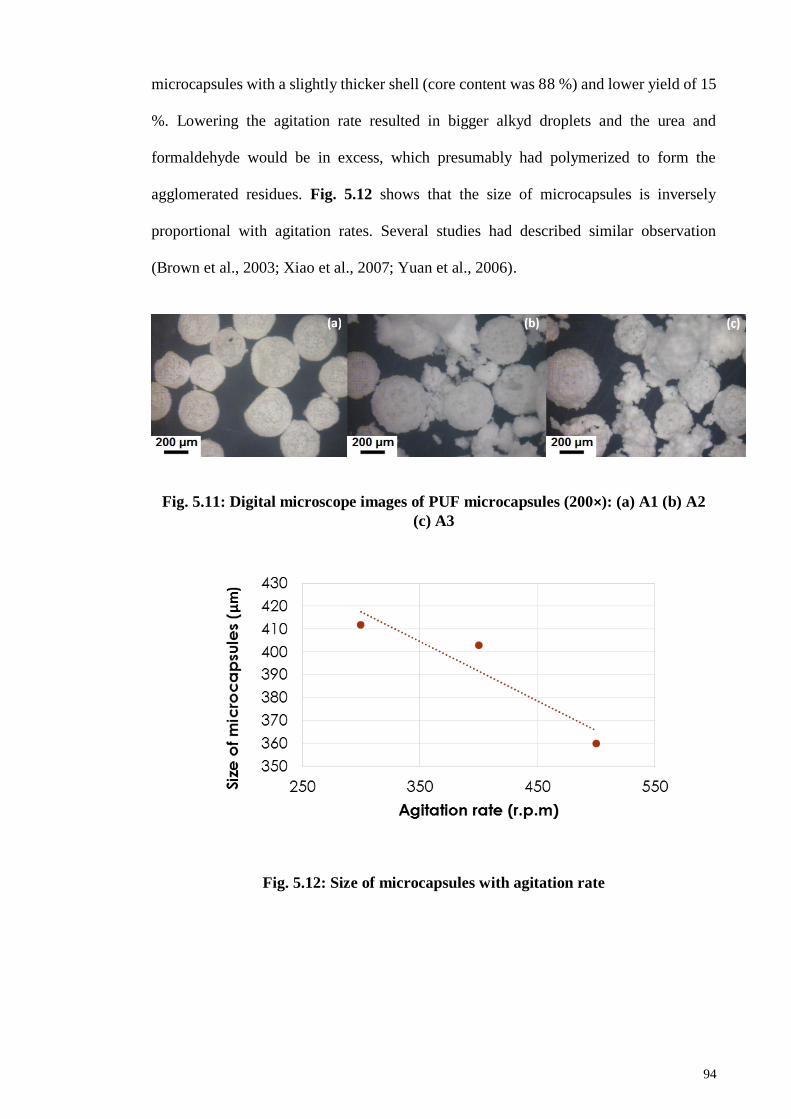
94
microcapsules with a slightly thicker shell (core content was 88 %) and lower yield of 15
%. Lowering the agitation rate resulted in bigger alkyd droplets and the urea and
formaldehyde would be in excess, which presumably had polymerized to form the
agglomerated residues. Fig. 5.12 shows that the size of microcapsules is inversely
proportional with agitation rates. Several studies had described similar observation
(Brown et al., 2003; Xiao et al., 2007; Yuan et al., 2006).
Fig. 5.11: Digital microscope images of PUF microcapsules (200×): (a) A1 (b) A2
(c) A3
Fig. 5.12: Size of microcapsules with agitation rate
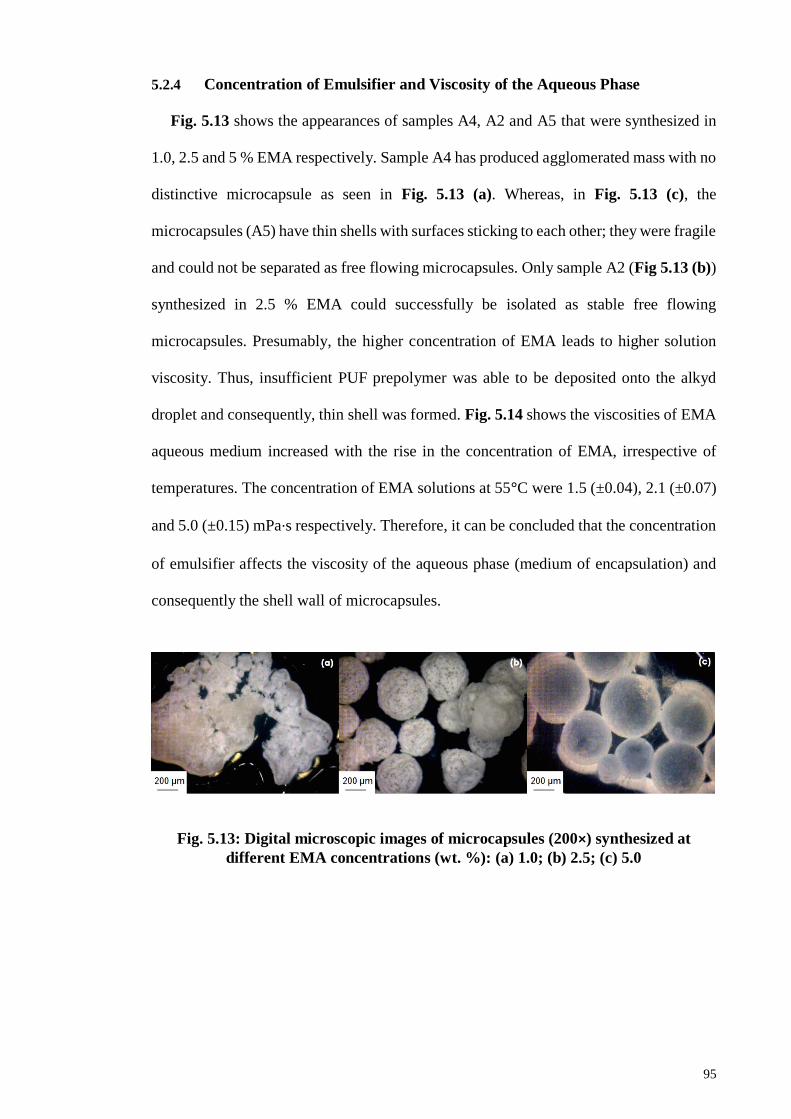
95
5.2.4 Concentration of Emulsifier and Viscosity of the Aqueous Phase
Fig. 5.13 shows the appearances of samples A4, A2 and A5 that were synthesized in
1.0, 2.5 and 5 % EMA respectively. Sample A4 has produced agglomerated mass with no
distinctive microcapsule as seen in Fig. 5.13 (a). Whereas, in Fig. 5.13 (c), the
microcapsules (A5) have thin shells with surfaces sticking to each other; they were fragile
and could not be separated as free flowing microcapsules. Only sample A2 (Fig 5.13 (b))
synthesized in 2.5 % EMA could successfully be isolated as stable free flowing
microcapsules. Presumably, the higher concentration of EMA leads to higher solution
viscosity. Thus, insufficient PUF prepolymer was able to be deposited onto the alkyd
droplet and consequently, thin shell was formed. Fig. 5.14 shows the viscosities of EMA
aqueous medium increased with the rise in the concentration of EMA, irrespective of
temperatures. The concentration of EMA solutions at 55°C were 1.5 (±0.04), 2.1 (±0.07)
and 5.0 (±0.15) mPa·s respectively. Therefore, it can be concluded that the concentration
of emulsifier affects the viscosity of the aqueous phase (medium of encapsulation) and
consequently the shell wall of microcapsules.
Fig. 5.13: Digital microscopic images of microcapsules (200×) synthesized at
different EMA concentrations (wt. %): (a) 1.0; (b) 2.5; (c) 5.0

96
Fig. 5.14: Viscosity of the solution of EMA as the aqueous phase of the
microencapsulation process, at 26°C and 55°C
5.2.5 Melamine/Urea Ratio
With reference to the results in Table 5.4, sample A2 that used urea and formaldehyde
(without melamine resin) produced microcapsules that were low in yield (40%). With the
addition of a small amount of melamine resin, at M/U ratio of 0.03, the yield of
microcapsules has increased as in B1 to 65%. In addition, the microcapsules have become
more robust. This could be explained by the crosslinking ability of the melamine resin
that has up to six -N–CH2OCH3 groups per molecule. The plausible reactions of the
melamine resin are previously shown in Fig. 5.4 (b) and (c). Further increase in M/U
ratio to 0.06 and 0.12 as in samples B2 and B3 saw a drop in the yield of microcapsules
to 60 % and 49 % respectively. The larger amount of melamine resin has increased the
crosslinking reactions with the urea-formaldehyde prepolymer in the aqueous medium,
forming more agglomerated particles and consequently fewer microcapsules. As
presented in Fig. 5.15, sample B4 at M/U ratio of 0.29, started to lose their spherical
shape and formed mixtures of microcapsules and the irregular-shape agglomerated
particles, which explains the drop in yield to 34 %. The melamine-modified PUF

97
microcapsules in the B series were poly-dispersed with a size range of 200-550 µm as
shown in Fig. 5.16.
Table 5.4: Characterization data of PMUF microcapsules – Series B and D
Sample M/U
(wt.
ratio)
M
(g)
U
(g)
Yield
(%)
Core-
content
(wt. %)
Mean
diameter
(µm)
Description of
MCs
Ref./A2 0 0 2.50 40 89.9 (0.5) 403 (56) Spherical, free
flowing
B1 0.03 0.08 2.49 65 94.8 (0.3) 383 (56) Spherical, free
flowing
B2 0.06 0.16 2.47 60 92.0 (1.3) 380 (60) Spherical, free
flowing
B3 0.12 0.30 2.45 49 91.9 (0.4) 384 (55) Spherical, free
flowing
B4 0.29 0.70 2.40 34 63.1 (0.4) - Less spherical,
free flowing MCs
with rougher outer
surface
D1 0.03 0.08 2.49 46 91.6 (0.3) 396 (62) Spherical, free
flowing M: melamine resin; U: urea. The same amount of formaldehyde was used in all cases. Values in
parentheses are the standard deviation)
Fig. 5.15: Digital microscopic images of microcapsules with increasing M/U ratio:
(a) 0; (b) 0.03; (c) 0.06; (d) 0.12; (e) 0.29

98
Fig. 5.16: Size distributions of microcapsules in B series compared to A2
microcapsules: (a) A2; (b) B1; (c) B2; (d) B3.
5.2.6 Different Alkyd as Core Content
In this work, another alkyd, AlkydFA35 with higher viscosity (14 Pa·s) and acid value
than that of AlkydPKO65 (2 Pa·s) was encapsulated to produce D1 microcapsules.
Comparing D1 and B2 microcapsules, both microcapsules were not significantly different
in diameter size, considering the high standard deviation of each microcapsules series.
D1 microcapsules have slightly bigger mean diameter (396 ± 62 µm) compared to B2
microcapsules (380 ± 60 µm), which contained AlkydPKO65 (refer Table 5.4). The size
distributions of D1 ranging from 300 to 600 µm and they were also poly-dispersed as
exhibited in Fig. 5.17. D1 formed the typical spherical and free flowing PMUF
microcapsules (Fig. 5.18), with ~92% of alkyd loading and 46% yield. AlkydFA35 has
much higher acid free carboxylic group (based on its acid number) and may promote
higher crosslinking with residual epoxy in epoxy matrix, which would be useful for
healing reaction. Table 5.5 tabulates the viscosity values of alkyd and epoxy resins tested.

99
Table 5.5: Viscosity of core content and epoxy resins
Resin Viscosity
(Pa·s, 26°C)
Viscosity
(Pa·s, 55°C)
Acid number
(mg KOH/ g alkyd)
AlkydPKO65 2.14 ± 0.01 0.33 ± 0.04 15
AlkydFA35 13.95 ± 0.01 1.25 ± 0.05 55
Epikote 828 10.36 ± 0.01 0.38 ± 0.04 -
Epikote 240
(matrix host) 0.62 ± 0.01 0.10 ± 0.01 -
Fig. 5.17: Size distribution and mean diameter of D1 microcapsules
Fig. 5.18: Optical microscope images of D1 microcapsules at low and high
magnifications
In addition, the viscosity of Epikote 828 is in agreement with the literature value (refer
Table 2.1). It is one of the most common epoxy resin encapsulated for the development
100
of self-healing epoxy. AlkydPKO65 has far lower viscosity than Epikote 828 thus the use
of diluent may not be necessary. Epikote 240 is a low viscosity epoxy resin, which has
similar epoxy per weight equivalent as Epikote 828. Thus, it was chosen to be used as the
matrix material in this study. Microcapsules were incorporated into this resin and it was
cured with amine hardener. The low viscosity made the incorporation process easier and
air entrapment was less or reduced.
5.2.7 Sonication
Sonication was introduced to further reduce the size of the dispersion of the oil phase,
hence the size of the microcapsules. Method 3 was adopted with additional sonication at
15% intensity for 3 min (Appendix B), performed after 10 min alkyd was agitated. The
microcapsules produced are coded as C1-C4 and the results are summarized in Table 5.6.
Here, EMA concentration has to be optimized, other than the usage of the additional co-
stabilizer (3% PVA). C1 microcapsules is a sonicated version of A2 and C2 is a sonicated
version of B2, which both resulted white and free flowing powder. C1 produced smaller
and clustered microcapsules compared to A2, as revealed by FESEM Fig. 5.19 (a-b). The
encapsulation was also verified with the occurrence of Tg of alkyd in the microcapsules
when scanned with DSC (Appendix E).

101
Table 5.6: Characterization data of microcapsules prepared with sonication
Sample M/U
(Wt.
ratio)
M
(g)
U (g) EMA
(Wt.
%)
Yield
(%)
Core-
content
(wt. %)
Description of
physical MCs
DSC analysis
C1 0 0 2.50 2.5 5 NA White & free
flowing
powder
Tg of alkyd
was observed.
C2 0.06 0.16 2.47 5.0 48 54 (3.1) White & free
flowing
powder
Tg of alkyd
was observed.
C3 0.06 0.16 2.47 3.5 NA NA A mixture of
clumped and
free flowing
white powder
Tg of alkyd
was observed
(not clear).
C4 0.06 0.16 2.47 2.5 NA NA Clumped,
white
particles
Tg of alkyd
was not
observed.
M: melamine resin; U: urea; EMA: ethylene (maleic anhydride); the same amount of formaldehyde was
used in all cases (6.35 g of 37 % formaldehyde solution); NA: not available; 10 mL of 3% poly(vinyl
alcohol) (PVA) was used as co-stabilizer; value in parenthesis is standard deviation.
Fig. 5.19: FESEM micrographs of microcapsules prepared with sonication: (a-b)
C1 (c-d) C2
At 2.5% EMA concentration, sample C4 yielded clumped white particles. Increase of
EMA concentration to 3.5% in sample C3 yielded a mixture of clumped and free flowing
powder. Further increase of EMA to 5.0% (sample C2) finally yielded free flowing
microcapsules. DSC analysis confirmed the Tg of alkyd were also observed in samples

102
C2 and C3, proving the successful encapsulation. FESEM analysis of sample C2 revealed
the formation of smaller and clustered microcapsules compared to B2, as shown in Fig.
5.19 (c-d).
5.3 Spectroscopic Characterizations of Alkyd and Microcapsules
In this section forward, only selected microcapsules from A, B, C and D series were
used for further characterizations. Structural analysis of the extracted core content of A2,
B2, C2 and D1 microcapsules were done using ATR-FTIR. Each of them showed a good
match with the neat alkyd, confirming the successful encapsulation (refer Fig. 5.20 and
Fig. 5.21). The characteristic peaks of alkyd are observed; O−H broad peak at 3580 cm−1,
strong –C=O peak at 1730 cm−1 due to carboxyl group, small twin peaks at 1600 and
1500 cm−1 attributed to aromatic ring from PA that formed the alkyd and C−O of esters
at 1270 cm−1.
Fig. 5.20: ATR-FTIR spectra of AlkydPKO65 and the extracted core of A2, B2 and
C2 microcapsules

103
Fig. 5.21: ATR-FTIR spectra of AlkydFA35 and the extracted core of D1
microcapsules
In addition, the extracted shell materials of A2, B2 and C2 microcapsules also showed
the characteristic peaks of PUF/PMUF. As shown in Fig. 5.22, peaks at 2900 & 2800
cm−1 attributed to CH and peaks at 1600 cm−1 and 1500 cm−1 due to NH and C−N
respectively, are observed together with N−H of amine at 3300 cm−1. The spectrum of
extracted shell of C2 had an extra peak at 1730 cm−1 due alkyd residue from the extraction
process. All polymerized shell materials showed no appearance of characteristic peak of
melamine resin, at 814 cm−1 due to the triazine ring out-of-plane vibrations of 3 C−N.
This suggests that all melamine resins had been utilized in the formation of the shells.
The FTIR spectra for other microcapsules also showed similar characteristic peaks of
alkyd and PUF as shown in Appendix C.
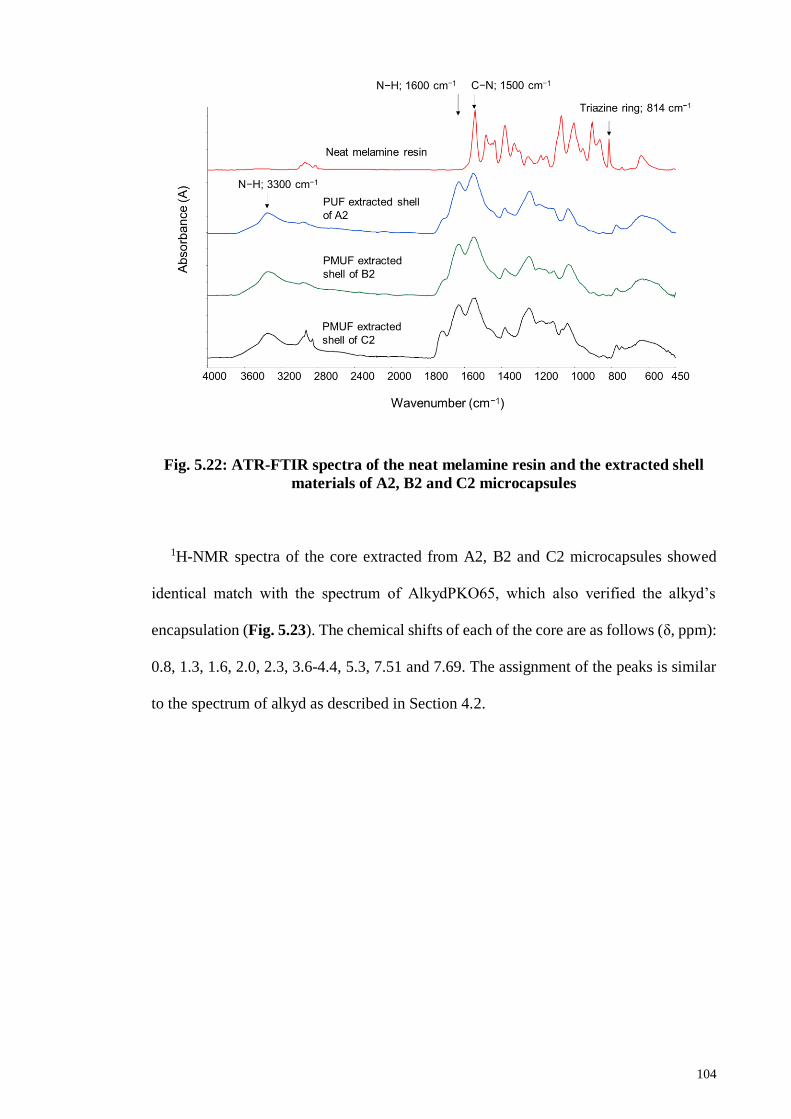
104
Fig. 5.22: ATR-FTIR spectra of the neat melamine resin and the extracted shell
materials of A2, B2 and C2 microcapsules
1H-NMR spectra of the core extracted from A2, B2 and C2 microcapsules showed
identical match with the spectrum of AlkydPKO65, which also verified the alkyd’s
encapsulation (Fig. 5.23). The chemical shifts of each of the core are as follows (δ, ppm):
0.8, 1.3, 1.6, 2.0, 2.3, 3.6-4.4, 5.3, 7.51 and 7.69. The assignment of the peaks is similar
to the spectrum of alkyd as described in Section 4.2.
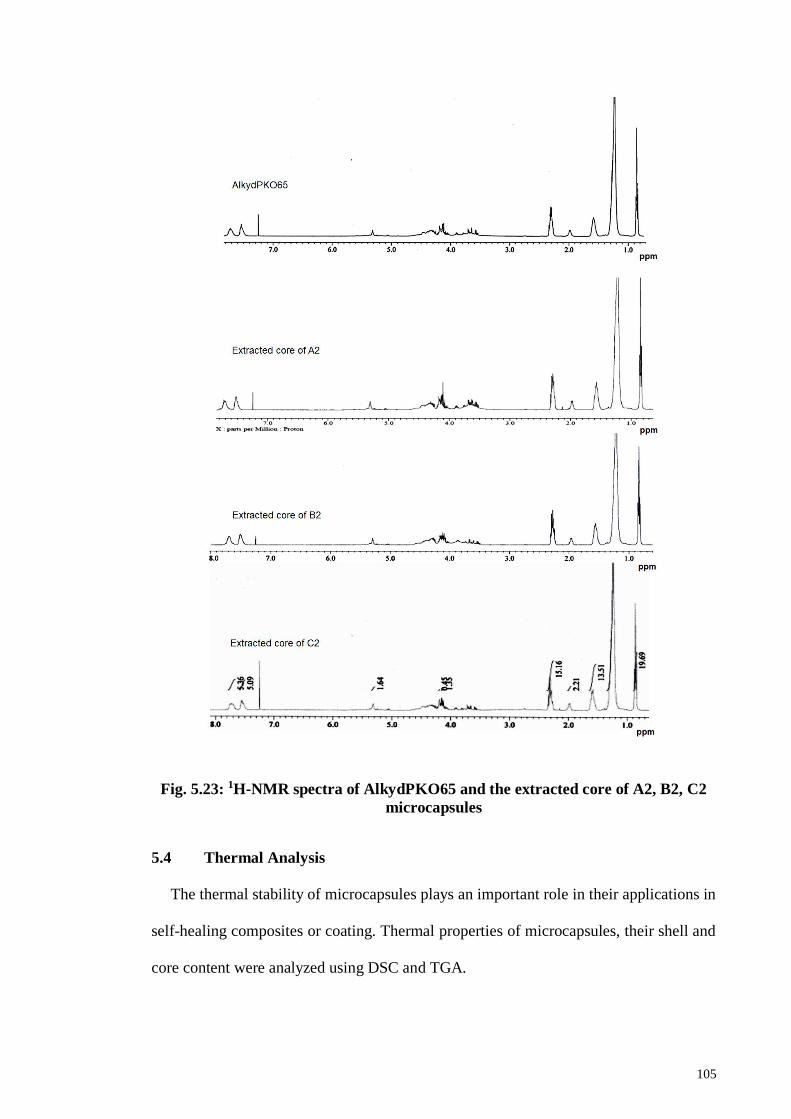
105
Fig. 5.23: 1H-NMR spectra of AlkydPKO65 and the extracted core of A2, B2, C2
microcapsules
5.4 Thermal Analysis
The thermal stability of microcapsules plays an important role in their applications in
self-healing composites or coating. Thermal properties of microcapsules, their shell and
core content were analyzed using DSC and TGA.

106
5.4.1 Differential Scanning Calorimetry (DSC)
Fig. 5.24 shows the DSC diagram of the neat alkyd, microcapsules samples A2 and
B2 and the respective amino shells. Fig. 5.24 (a) shows the thermogram of neat alkyd
with one broad endothermic broad at peak −15°C to 15°C, which corresponds to the
melting of the alkyd and a glass transition temperature (Tg) at −13°C.
Two endothermic peaks appeared in the DSC curves of A2 and B2. The first
endothermic peaks at 0°C to 15°C were due to the melting of alkyd content in the
microcapsules, which were similar to the thermogram of neat alkyd. The second ones
appeared at higher temperature range with sharp melting peaks (Tm) at 148C and 192C
respectively, which correspond to the melting of PUF and PMUF shell walls. The Tm of
microcapsules were higher than the Tm of PUF and PMUF shell alone. Both A2 and B2
also showed Tg at −13.0C and −11.6C respectively, which correspond to the Tg of
encapsulated alkyd.
The higher Tg and Tm of B2 compared to the Tg and Tm of A2 indicates the possibility
of some reactions between the melamine resin with the –OH group on the surface of alkyd
droplet. These reactions might also have shifted the Tm of the extracted shell materials;
from 130°C to 148°C for A2 and from 156°C to 192°C for B2. A small amount of
melamine resin was introduced in sample B2 to increase the amount of crosslinking
reactions, in order to achieve a more robust shell. The shell however, was not 100%
crosslinked hence the Tm, increased from 148C to 192C.
A subtle endothermic peak observed at ~85°C in PUF extracted shell (Fig. 5.24 (d)),
was attributed to evaporation of water and free formaldehyde. Other two endothermic
peaks at 210°C and 242°C were due to the decomposition of shell material. The PMUF
extracted shell also showed a broad endothermic peak near 220°C due to the
decomposition of UF/MUF (Fig. 5.25 (e)) (Camino et al., 1983). The DSC

107
characterization data for other microcapsules can be found in Appendix E. The
observation of the Tm and Tg in the microcapsules verifies the encapsulation of alkyd.
Fig. 5.24: DSC thermograms of (a) AlkydPKO65 (b) B2 (c) A2 (d) PUF shell (e)
PMUF shell
5.4.2 Thermogravimetric Analysis (TGA)
Fig. 5.25 shows the thermal degradations of B2 microcapsules, the neat alkyd and the
PMUF shell. B2 was thermally stable up to 258°C and subsequently decomposed
completely within the range of 260−550C. Degradation of PMUF occurred around
220−300C, while the alkyd started to break down around 250C. The thermal
degradations of the core and shell occurred in overlapping temperature ranges;
consequently, TGA could not be used to determine the amount of core and shell
accurately. The TGA data of the other samples are summarized in Table 5.7. All
microcapsules were thermally stable up to ~250°C. T50 % is the temperature at 50% weight
loss and the results showed that half of the microcapsules thermally degraded around
325°C to 375°C.

108
Fig. 5.25: TGA thermograms of B2 microcapsules, neat alkyd and PMUF shell
Table 5.7: TGA data of PUF and PMUF microcapsules
Sample Td onset (°C) T50% (°C)
A1 250 355
A2 250 352
A3 230 348
B1 250 375
B2 258 375
B3 245 369
B4 200 341
C2* 216 325
D1* 207 350
AlkydPKO65 250 342
PUF shell 220 310
PMUF shell 220 331
Td: onset degradation temperature; * measurement with STA.
5.5 Morphology of Microcapsules
As shown in Fig. 5.26 (a), the PMUF microcapsule is spherical in shape. Fig. 5.26 (b)
shows the magnified region of the rough outer surface, which consisted of PMUF
nanoparticles. The examination on a broken microcapsule shows that the microcapsule

109
had smooth inner surface and rough outer surface, as shown in Fig. 5.28. The rough outer
surface could provide good bonding with the film matrix, which will facilitate in breaking
the microcapsules under stress due to cracking (Suryanarayana et al., 2008).
Fig. 5.26: FESEM micrographs of B2 microcapsule at: (a) 600×; (b) 10 000×
magnifications
Fig. 5.27: FESEM micrographs of ruptured B2 microcapsule at: (a) 500×; (b)
4000× magnifications
5.6 Storage Stability of Microcapsules
Storage study is necessary to evaluate the performance of microcapsules to be able to
store the healing agent until the time it is needed. In this work, microscopy observation
within a certain period of time was done, accompanied by thermal analysis using DSC.

110
Fig. 5.28 (a) shows the digital microscope images of B2 microcapsules when they were
freshly synthesized, which were spherical in shape and free flowing. After being stored
for a month at 25°C, the microcapsules began to be less spherical. The alkyd could has
diffused out of the capsules, resulted in wet and sticky microcapsules as shown in
Fig.5.28 (b). At (c), they became worse as most of them were already ruptured. On the
contrary, when stored at 10°C, the microcapsules lasted longer, retained their spherical
shape and were still free flowing (Fig. 5.28 (d)). As shown in Fig. 5.29, DSC analysis
shows that there were no significant difference in Tg of A2 and B2 after 8 and 12 months
of storage at 10°C, respectively. A marginal difference of Tm values were also observed
after 8 and 12 months of storage at 10°C for both microcapsules. These observations
indicate that the microcapsules can be safely stored at 10°C to preserve their quality up
to 8-12 months. The details of the storage are summarized in Table 5.8.
Table 5.8: Summary of storage conditions of A2 and B2 microcapsules
Characteristics A2 microcapsules B2 microcapsules
Yield (wt. %) 40 64
Storage stability at 26°C 5 months 25 days
Storage stability at 10°C 12 months 8 months
Mean diameter (µm) 403 ± 56 380 ± 60
Core content (%) 89.9 ± 0.5 92.0 ± 1.3
Tg (°C) -13.0 after 6 months -11.0 after 2 months
-13.4 after 12 months -11.7 after 8 months
Tm (°C) 148 after 6 months 192 after 2 months
157 after 12 months 176 after 8 months

111
Fig. 5.28: Digital microscope images of B2 microcapsules at: (a) freshly prepared
(b) 1 month at 26°C (c) 5 months at 26°C (d) 5 months at 10°C

112
Fig. 5.29: DSC thermograms of A2 and B2 microcapsules after certain period of
times stored at 10°C
5.7 Summary
This chapter has identified influence of several factors to get the optimized and most
yielded method for alkyd encapsulation. The characterizations of the microcapsules were
described in details including thermal, morphology and storage stability. In the next
chapter, the microcapsules performance in a selected epoxy system is discussed.

113
CHAPTER 6: MICROCAPSULES IN EPOXY MATRIX AND EPOXY/ALKYD
REACTION
6.1 Microcapsules Distribution in Epoxy Matrix
Fig. 6.1 shows the optical microscope images of microcapsules B2, which embedded
in the selected epoxy matrix. The microcapsules retained their spherical shape, even after
epoxy curing process with amine hardener at 100°C.
Fig. 6.1: Optical microscope images of B2 microcapsules that were embedded in
the epoxy matrix (a) 40× (b) 100×
C2 microcapsules are those prepared with sonication to help disperse the alkyd
emulsion in order to reduce the size of resultant microcapsules. Before being embedded
into the epoxy matrix, C2 were sieved to separate them into two fractions of size, 50−500
µm and <50 µm. As shown in Fig. 5.19 (in previous chapter), C2 were smaller than B2
and existed in clusters. To help distribute the microcapsules evenly in the matrix, the
mixture of epoxy with microcapsules, was put in a sonication bath before it hardened.
Fig. 6.2 (a) shows the distribution of the bigger fraction of C2 microcapsules, which
spread individually as well as in groups, throughout the matrix. The smaller fraction,
below 50 µm, also consists of small microcapsules, dispersed in the host matrix as shown
in Fig. 6.2 (b). This indicates that the sonication introduced before hardening of the epoxy
has helped separate the agglomerated microcapsules to some extent.

114
Further inspection of the sliced matrix using FESEM revealed the cavities previously
occupied by B2 microcapsules (Fig. 6.3). The size distributions of C2 microcapsules
observed is rather large as shown in Fig. 6.4. Fig. 6.4 (a-b) show bigger microcapsules
incorporated into the matrix, while Fig. 6.4 (c-d) show smaller individual and groups of
microcapsules embedded in the matrix. The sonication of the epoxy mixture before
setting has not fully dispersed the clustered of small capsules. Nevertheless, the
microcapsules and the matrix also show good bonding through the embedment of the
microcapsules’ rough shell with the epoxy matrix, as observed by FESEM shown in Fig.
6.3 (b) and 6.4 (b).

115
Fig. 6.2: Optical microscope images of C2 microcapsules embedded in epoxy
matrix: (a) 50 – 500 µm (100×) (b) <50 µm (100×)
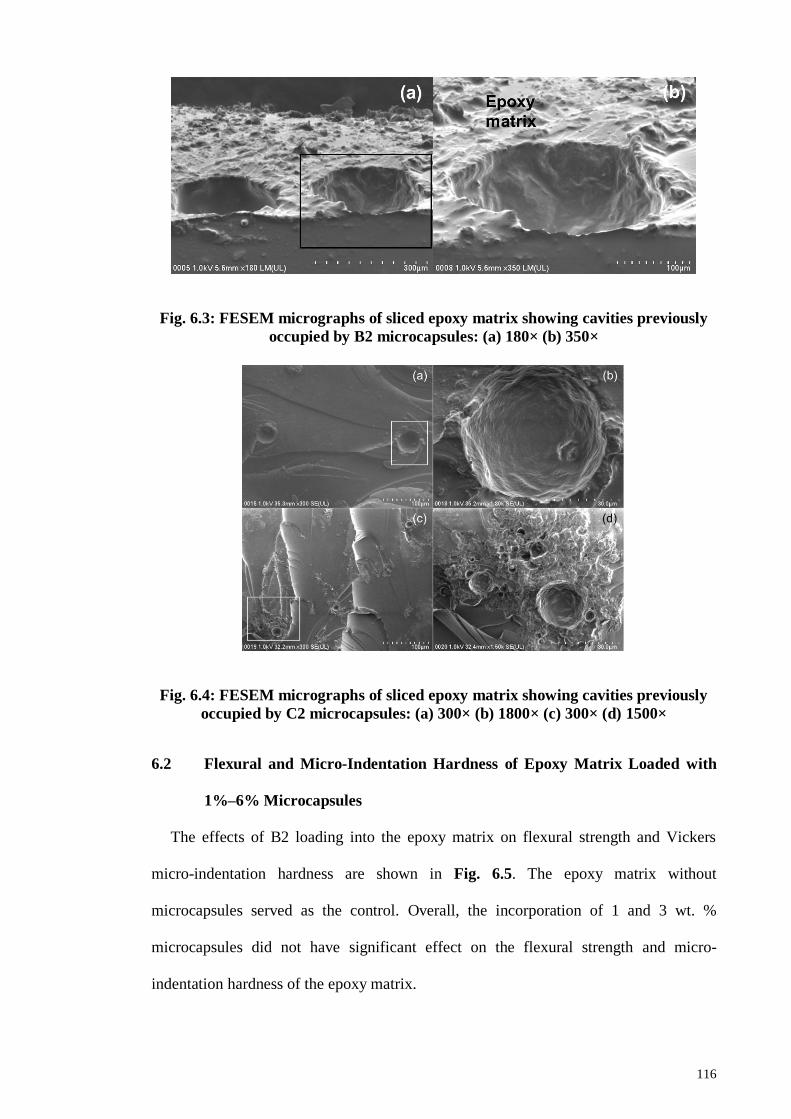
116
Fig. 6.3: FESEM micrographs of sliced epoxy matrix showing cavities previously
occupied by B2 microcapsules: (a) 180× (b) 350×
Fig. 6.4: FESEM micrographs of sliced epoxy matrix showing cavities previously
occupied by C2 microcapsules: (a) 300× (b) 1800× (c) 300× (d) 1500×
6.2 Flexural and Micro-Indentation Hardness of Epoxy Matrix Loaded with
1%–6% Microcapsules
The effects of B2 loading into the epoxy matrix on flexural strength and Vickers
micro-indentation hardness are shown in Fig. 6.5. The epoxy matrix without
microcapsules served as the control. Overall, the incorporation of 1 and 3 wt. %
microcapsules did not have significant effect on the flexural strength and micro-
indentation hardness of the epoxy matrix.
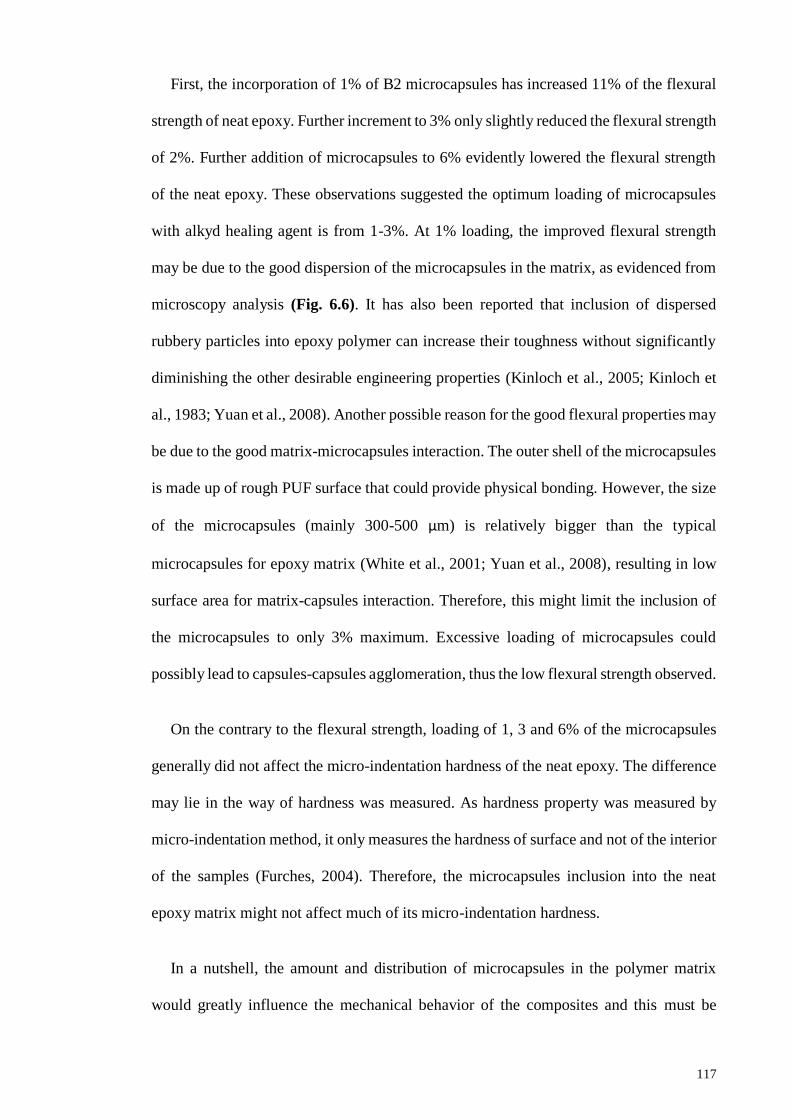
117
First, the incorporation of 1% of B2 microcapsules has increased 11% of the flexural
strength of neat epoxy. Further increment to 3% only slightly reduced the flexural strength
of 2%. Further addition of microcapsules to 6% evidently lowered the flexural strength
of the neat epoxy. These observations suggested the optimum loading of microcapsules
with alkyd healing agent is from 1-3%. At 1% loading, the improved flexural strength
may be due to the good dispersion of the microcapsules in the matrix, as evidenced from
microscopy analysis (Fig. 6.6). It has also been reported that inclusion of dispersed
rubbery particles into epoxy polymer can increase their toughness without significantly
diminishing the other desirable engineering properties (Kinloch et al., 2005; Kinloch et
al., 1983; Yuan et al., 2008). Another possible reason for the good flexural properties may
be due to the good matrix-microcapsules interaction. The outer shell of the microcapsules
is made up of rough PUF surface that could provide physical bonding. However, the size
of the microcapsules (mainly 300-500 µm) is relatively bigger than the typical
microcapsules for epoxy matrix (White et al., 2001; Yuan et al., 2008), resulting in low
surface area for matrix-capsules interaction. Therefore, this might limit the inclusion of
the microcapsules to only 3% maximum. Excessive loading of microcapsules could
possibly lead to capsules-capsules agglomeration, thus the low flexural strength observed.
On the contrary to the flexural strength, loading of 1, 3 and 6% of the microcapsules
generally did not affect the micro-indentation hardness of the neat epoxy. The difference
may lie in the way of hardness was measured. As hardness property was measured by
micro-indentation method, it only measures the hardness of surface and not of the interior
of the samples (Furches, 2004). Therefore, the microcapsules inclusion into the neat
epoxy matrix might not affect much of its micro-indentation hardness.
In a nutshell, the amount and distribution of microcapsules in the polymer matrix
would greatly influence the mechanical behavior of the composites and this must be

118
optimized to achieve the best balance between incorporating self-healing property while
retaining good mechanical performance of the composites.
Fig. 6.5: Effect of the microcapsules loading on the flexural strength and micro-
indentation hardness (Vickers) of the epoxy matrix
Fig. 6.6: Epoxy matrix with 1% of B2 microcapsules
6.3 Reactions of the Alkyd Blended with Epoxy Resin and Hardener
The alkyd, epoxy resin and its hardener were blended by different equivalent ratios as
shown in Table 6.1. The blends, EA2 and EA3, were formulated with excess equivalent
(Eq.) of epoxy resin. Mixing was carried out manually and all the blends were able to
cure to non-sticky solid at room temperature (rt) in 24 h. Similar observation was obtained

119
with EA samples cured at elevated temperature. The plausible reaction of the alkyd and
the epoxy resin is shown in Fig. 6.7. The carboxylic acid groups of the alkyd could also
react with the amino group of the hardener.
Table 6.1: Reactions of alkyd, epoxy and amine hardener in different blends
Sample Eq. wt. ratio of
epoxy/amine/alkyd
Epoxy/Alkyd
wt. ratio
Epoxy
(g)
Amine
(g)
Alkyd
(g)
After
24 h at
rt
Control 1/1/0 100/0 1 0.58 0 Cured,
solid
EA1 1/0.8/0.02 100/39 1 0.44 0.39 Cured,
solid
EA2 1/0.8/0.01 100/20 1 0.44 0.20 Cured,
solid
EA3 1/0.7/0.01 100/20 1 0.39 0.20 Cured,
solid
Fig. 6.7: Scheme of plausible reactions of carboxylic groups of alkyd with (a) epoxy
and (b) amino group

120
Fig. 6.8 shows the FTIR spectra of neat alkyd, neat epoxy resin and the samples that
were cured at room temperature for 24 h. The spectrum of neat epoxy resin showed a
strong adsorption at 2900–2800 cm−1 due to C–H stretching. The adsorption peaks at
1607 and 1508 cm−1 were attributed to C=C stretching and C–C stretching of aromatic
ring, respectively. The strong peaks at 1240–1030 cm−1 were due to C–O–C stretching of
ether group. The adsorption at 914 cm−1 was attributed to the oxirane group. The spectra
of the cured blends (EA1, EA2 and EA3) showed the peak at 914 cm−1 has diminished as
the epoxy group was consumed in reactions. The carboxylic acid groups of alkyd at 1727
cm−1 has shifted to 1734 cm−1 in the cure samples, presumably due to conversion to ester.
Fig. 6.8: FTIR spectra of neat alkyd, epoxy resin and cured epoxy, EA1, EA2 and
EA3 samples

121
6.4 Summary
Chapter 6 has presented and discussed the incorporation of the microcapsules into a
selected epoxy matrix. The microcapsules can be randomly distributed in the matrix,
although sonication was needed for smaller microcapsules to ensure good dispersion.
Flexural strength and micro-indentation hardness of the epoxy matrix were not
jeopardized by the incorporation of 1−3% of B2 microcapsules. The FTIR of epoxy/alkyd
blends showed a diminished peak of epoxide group and occurrence of ester bond that
suggests the crosslinking reaction.

122
CHAPTER 7: CONCLUSION AND FUTURE WORK
A long oil with medium viscosity (2.14 Pa·s), with low acid value (15−17 mg KOH/ g
alkyd) was successfully synthesized using alcoholysis and esterification of a palm kernel
oil. The spectroscopic analyses of the alkyd confirmed the formation of alkyd from PKO.
Thermal characterizations of the alkyd showed its stability up to 250°C, a glass transition
at −13°C and a broad melting point at 0−15°C.
UF and MUF resin were used as a polymeric shell to encapsulate the synthesized
alkyd. Melamine resin was used to modify the UF shell in order to obtain more robust
and high yield of microcapsules. For alkyd encapsulation, 0.03−0.12 M/U ratio is
suggested. Melamine resin addition has increased shell robustness and thermal stability
to ~260°C. The best yielding formulation was with 10 g alkyd as core with 2.1 core/shell
weight ratio. The alkyd needs to be emulsified prior to addition of shell materials, with
400 rpm of agitation rate and 2.5 % EMA, which acts as emulsifier or viscosity adjuster.
Sonication was used to obtain smaller microcapsules for certain application.
Microcapsules obtained were free flowing, have smooth inner shell and rough and layered
outer shell. The core loading were 86−91 %, 63−95 % and 54 % for A2, B2 and C2
microcapsules respectively. They were thermally stable to 250°C, 260°C and 216°C for
respective microcapsules.
The microcapsules formed could survived the incorporation process into the epoxy
matrix and their distribution in the matrix was random. Generally, the embedment of B2
microcapsules did not affect the flexural strength and micro-indentation hardness of the
epoxy matrix, if not more than 3 wt. %. Self-healing was proposed via the crosslinking
reaction of alkyd and epoxy, as evidenced by FTIR analyses of the EA blends and the
healed epoxy coating and the preliminary microscopic examinations of the healed
scratched-epoxy coating.

123
The scope of this study was limited in terms of the storage stability of the
microcapsules. B2 needs cold storage to keep them in good shape probably due to the
high viscosity and polar nature of the alkyd due to excess hydroxyl content. The shell can
be adjusted to be thicker to improve the stability of the microcapsules. A2 with slightly
thicker shell gives better storage stability at 25°C but the yield of production was low. C2
is stable at room temperature but the yield of production was low and their clustered
condition needs pre-sonication prior to embedment into the epoxy matrix.
The mechanical properties of the matrix carried out in this work were based on two
tests due to time constraint. Further mechanical tests such as tensile and impact tests can
be done to investigate more on the influence of the microcapsules incorporation to the
epoxy matrix. More research is required to determine the self-healing efficiency of the
epoxy matrix; the efficiency of epoxy coating healing at different temperatures. The
quantitative healing efficiency of epoxy composites also can be measured using suitable
mechanical properties, such as lap-shear test and fracture toughness. The quantitative
corrosion test also may be applicable for the protective epoxy coating, which can produce
improved proof of self-healing. The optimization method to get proper smaller size
microcapsules also seems necessary due to requirement for coating application. The small
size of microcapsules is important for ease of dispersion and formation of thin layer of
coatings. It is also to maintain the good adhesion of coating on substrates.
Another interesting prospect is to study the effect of the introduction of alkyd with
higher COOH content to promote faster crosslinking with epoxy. A different type of
alkyd with higher acid value can be synthesized and its effect on the epoxy-alkyd
crosslinking can be studied. The kinetics of curing of alkyd with the epoxy can also be
studied to optimize the healing reaction in the epoxy matrix. Modified alkyds with
unsaturation could also be investigated for potential healing agent.

124
REFERENCES
Ahdash, A., Hamzah, E., Ourdjini, A., & Abdolahi, A. (2014). Characterizations of
zeolite, polyaniline and zeolite/polyaniline as antifouling materials for marine
applications. Advanced Materials Research, 845, 91-95.
Ai, H., Jones, S. A., & Lvov, Y. M. (2003). Biomedical applications of electrostatic layer-
by-layer nano-assembly of polymers, enzymes and nanoparticles. Cell
Biochemistry and Biophysics, 39(1), 23-43.
Alebrahim, R., Haris, S. M., Mohamed, N. A. N., & Abdullah, S. (2015). Vibration
analysis of self-healing hybrid composite beam under moving mass. Composite
Structures, 119, 463-476.
Assanvo, E. F., Gogoi, P., Dolui, S. K., & Baruah, S. D. (2015). Synthesis,
characterization and performance characteristics of alkyd resins based on
Ricinodendron heudelotii oil and their blending with epoxy resins. Industrial
Crops and Products, 65, 293-302.
ASTM E384-11 (2011) Standard Test Method for Knoop and Vickers Hardness of
Materials, ASTM International, West Conshohocken, PA, www.astm.org
ASTM D445-15a (2015) Standard Test Method for Kinematic Viscosity of Transparent
and Opaque Liquids (and Calculation of Dynamic Viscosity), ASTM
International, West Conshohocken, PA, 2015, www.astm.org
ASTM E384-16 (2016) Standard Test Method for Microindentation Hardness of
Materials, ASTM International, West Conshohocken, PA, www.astm.org
ASTM D790-15e2 (2015) Standard Test Methods for Flexural Properties of Unreinforced
and Reinforced Plastics and Electrical Insulating Materials, ASTM International,
West Conshohocken, PA, www.astm.org
ASTM D1639-90(1996)e1 (1996) Standard Test Method for Acid Value of Organic
Coating Materials (Withdrawn 2005), ASTM International, West Conshohocken,
PA, www.astm.org
Basiron, Y. (2007). Palm oil production through sustainable plantations. European
Journal of Lipid Science and Technology, 109(4), 289-295.
Basiron, Y., & Weng, C. K. (2004). The oil palm and its sustainability. Journal of Oil
Palm Research, 16(1), 1-10.
Benjapornkulaphong, S., Ngamcharussrivichai, C., & Bunyakiat, K. (2009). Al2O3-
supported alkali and alkali earth metal oxides for transesterification of palm kernel
oil and coconut oil. Chemical Engineering Journal, 145(3), 468-474.
Binder, W. H. (2013). Self-healing Polymers: From Principles To Applications.
Weinheim: Wiley-VCH Verlag GmbH & Co. KGaA.

125
Blaiszik, B. J., Caruso, M. M., McIlroy, D. A., Moore, J. S., White, S. R., & Sottos, N.
R. (2009). Microcapsules filled with reactive solutions for self-healing materials.
Polymer, 50(4), 990-997.
Blaiszik, B. J., Kramer, S. L. B., Olugebefola, S. C., Moore, J. S., Sottos, N. R., & White,
S. R. (2010). Self-healing polymers and composites. Annual Review of Materials
Research, 40, 179-211.
Bose, R. K., Lafont, U., Vega, J. M., Garcia, S. J., & Swaag, S. v. d. (2013). Methods to
monitor and quantify (self-) healing in polymers and polymer systems. In W. H.
Binder (Ed.), Self Healing Polymers: From Principles to Applications. Weinheim:
Wiley-VCH Verlag GmbH & Co.
Boura, S. H., Peikari, M., Ashrafi, A., & Samadzadeh, M. (2012). Self-healing ability and
adhesion strength of capsule embedded coatings—Micro and nano sized capsules
containing linseed oil. Progress in Organic Coatings, 75(4), 292-300.
Brown, E. N., Kessler, M. R., Sottos, N. R., & White, S. R. (2003). In situ poly(urea-
formaldehyde) microencapsulation of dicyclopentadiene. Journal of
Microencapsulation, 20(6), 719-730.
Brown, E. N., Sottos, N. R., & White, S. R. (2002). Fracture testing of a self-healing
polymer composite. Experimental Mechanics, 42, 372-379.
Brown, E. N., White, S. R., & Sottos, N. R. (2004). Microcapsule induced toughening in
a self-healing polymer composite. Journal of Materials Science, 39(5), 1703-
1710.
Camino, G., Operti, L., & Trossarelli, L. (1983). Mechanism of thermal degradation of
urea-formaldehyde polycondensates. Polymer Degradation and Stability, 5, 161-
172.
Caruso, M. M., Blaiszik, B. J., White, S. R., Sottos, N. R., & Moore, J. S. (2008). Full
recovery of fracture toughness using a nontoxic solvent‐based self‐healing
system. Advanced Functional Materials, 18(13), 1898-1904.
Caruso, M. M., Delafuente, D. A., Ho, V., Sottos, N. R., Moore, J. S., & White, S. R.
(2007). Solvent-promoted self-healing epoxy materials. Macromolecules, 40(25),
8830-8832.
Chen, M., Liu, J., Liu, Y., Guo, C., Yang, Z., & Wu, H. (2015). Preparation and
characterization of alginate–N-2-hydroxypropyl trimethyl ammonium chloride
chitosan microcapsules loaded with patchouli oil. RSC Advances, 5(19), 14522-
14530.
Chen, X., Dam, M. A., Ono, K., Mal, A., Shen, H., Nutt, S. R., . . . Wudl, F. (2002). A
thermally re-mendable cross-linked polymeric material. Science, 295(5560),
1698-1702.
Chen, X., Wudl, F., Mal, A. K., Shen, H., & Nutt, S. R. (2003). New thermally
remendable highly cross-linked polymeric materials. Macromolecules, 36(6),
1802-1807.

126
Cho, S. H., Andersson, H. M., White, S. R., Sottos, N. R., & Braun, P. V. (2006).
Polydimethylsiloxane‐Based Self‐Healing Materials. Advanced Materials, 18(8),
997-1000.
Cho, S. H., White, S. R., & Braun, P. V. (2009). Self‐healing polymer coatings. Advanced Materials, 21(6), 645-649.
Coope, T. S., Mayer, U. F., Wass, D. F., Trask, R. S., & Bond, I. P. (2011). Self‐healing
of an epoxy resin using scandium (III) triflate as a catalytic curing agent.
Advanced Functional Materials, 21(24), 4624-4631.
Cosco, S., Ambrogi, V., Musto, P., & Carfagna, C. (2007). Properties of poly (urea‐formaldheyde) microcapsules containing an epoxy resin. Journal of Applied
Polymer Science, 105(3), 1400-1411.
Darby, Sime. (2011). Palm oil facts and figures Retrieved 31/5/2016 from
www.simedarbyplantation.com /upload/PalmOilFactsAndFigures.pdf
Diem, H., Matthias, G., & Wagner, R. A. (2010). Amino Resins Ullmann's Encyclopedia
of Industrial Chemistry. Weinheim: Wiley-VCH Verlag GmbH & Co. KGaA.
Dry, C. (1994). Matrix cracking repair and filling using active and passive modes for
smart timed release of chemicals from fibers into cement matrices. Smart
Materials and Structures, 3(2), 118.
Dry, C. (1996). Procedures developed for self-repair of polymer matrix composite
materials Composite Structures, 35, 263-269.
Dry, C., & Sottos, N. R. (1993). Passive smart self-repair in polymer matrix composite
materials. Paper presented at 1993 North American Conference on Smart
Structures and Materials (pp. 438-444).
Dutta, N., Karak, N., & Dolui, S. (2006). Alkyd–epoxy blends as multipurpose coatings.
Journal of Applied Polymer Science, 100(1), 516-521.
Elgert, K.-F. (2000). Plastics, General Survey, 1. Definition, Molecular Structure and
Properties Ullman's Encyclopedia of Industrial Chemistry. Weinheim: Wiley-
VCH Verlag GmbH & Co. KGaA.
Elias, H. G., & Mülhaupt, R. (2015). Plastics, General Survey, 1. Definition, Molecular
Structure and Properties. Ullmann's Encyclopedia of Industrial Chemistry.
Weinheim: Wiley VCH Verlag GmbH & Co. KGaA.
Ellis, B. (1993). Chemistry and Technology of Epoxy Resins. Netherlands: Springer-
Science+Business Media, B.V.
Fan, C., & Zhou, X. (2010). Influence of operating conditions on the surface morphology
of microcapsules prepared by in situ polymerization. Colloids and Surfaces A:
Physicochemical and Engineering Aspects, 363(1), 49-55.
Furches, B. J. (2004). Plastics Testing Kirk-Othmer Encyclopedia of Chemical
Technology. New Jersey, US: John Wiley & Sons, Inc.

127
Ghazali, H., Ye, L., & Zhang, M.-Q. (2016a). Lap shear strength and healing capability
of self-healing adhesive containing epoxy/mercaptan microcapsules. Paper
presented at Proceedings of PPS-31: The 31st International Conference of the
Polymer Processing Society, Jeju, South Korea.
Ghazali, H., Ye, L., & Zhang, M. Q. (2016b). Interlaminar fracture of CF/EP composite
containing a dual-component microencapsulated self-healant. Composites Part A:
Applied Science and Manufacturing, 82, 226-234.
Ghosh, S. K. (2009). Self-Healing Materials: Fundamentals, Design Strategies, And
Applications. Weinheim: Wiley-VCH Verlag GmbH & Co. KGaA.
Gogoi, P., Boruah, M., Bora, C., & Dolui, S. K. (2014). Jatropha curcas oil based
alkyd/epoxy resin/expanded graphite (EG) reinforced bio-composite: Evaluation
of the thermal, mechanical and flame retardancy properties. Progress in Organic
Coatings, 77(1), 87-93.
Green, B. K., & Schleicher, L. (1957). Oil-containing microscopic capsules and method
of making them. US Patent.
Guo, H., & Zhao, X. (2008). Preparation of microcapsules with narrow-size distribution
by complex coacervation: Effect of sodium dodecyl sulphate concentration and
agitation rate. Journal of Microencapsulation, 25(4), 221-227.
Hamzah, E., & Ahdash, A. S. I. (2016). Characterizations and performance of zeolite
self-healing coating as an antifouling material for marine applications. Paper
presented at the International Symposium on Coatings and Corrosion
(ISCC2016), Kuala Lumpur.
Hattori, T., Terakawa, K., Ichikawa, N., Sakaki, T., Choong, D. H., Gan, S. N., & Lee, S.
Y. (2007). Rubber composition for tire and pneumatic tire using the same. US
Patent.
Hayes, S., Jones, F., Marshiya, K., & Zhang, W. (2007). A self-healing thermosetting
composite material. Composites Part A: Applied Science and Manufacturing,
38(4), 1116-1120.
Hexion.com. (2005). Epikote™ resin 828 product datasheet. Retrieved 30/4/2016 from
www.hexion.com/Products/TechnicalDataSheet.aspx?id=3942
Hexion.com. (2006). Technical data sheet Epikure F205. Retrieved 30/4/2016 from
https://www.hexion.com/Products/TechnicalDataSheet.aspx?id=26193
Hexion.com. (2007). Epikote™ resin 240 product datasheet. Retrieved 30/4/2016 from
www.hexion.com/products/technicaldatasheet.aspx?id=4586
Hia, I. L., Vahedi, V., & Pasbakhsh, P. (2016). Self-healing polymer composites:
prospects, challenges and applications. Polymer Reviews, 56(2), 225-261.
Hofland, A. (2012). Alkyd resins: From down and out to alive and kicking. Progress in
Organic Coatings, 73, 274-282.

128
Ibeh, C. C. (1998). Amino and Furan Resins. Handbook of Thermoset Plastics. CA, USA:
William Andrew Publishing, Elsevier.
Inagaki, M., Urashima, K., Toyomasu, S., Goto, Y., & Sakai, M. (1985). Work of fracture
and crack healing in glass. Journal of The American Ceramic Society, 68(12),
704-706.
Issam, A., Khizrien, A. N., & Mazlan, I. (2011). Physical and mechanical properties of
different ratios of palm oil-based alkyd/epoxy resins. Polymer-Plastics
Technology and Engineering, 50(12), 1256-1261.
Jackson, A. C., Bartelt, J. A., Marczewski, K., Sottos, N. R., & Braun, P. V. (2011).
Silica‐protected micron and sub‐micron capsules and particles for self‐healing at
the microscale. Macromolecular Rapid Communications, 32(1), 82-87.
Jiang, Y., Wang, D., & Zhao, T. (2007). Preparation, characterization, and prominent
thermal stability of phase-change microcapsules with phenolic resin shell and n-
hexadecane core. Journal of Applied Polymer Science, 104, 2799–2806.
Jin, H., Mangun, C. L., Stradley, D. S., Moore, J. S., Sottos, N. R., & White, S. R. (2012).
Self-healing thermoset using encapsulated epoxy-amine healing chemistry.
Polymer, 53, 581-587.
Jin, H., Miller, G. M., Pety, S. J., Griffin, A. S., Stradley, D. S., Roach, D., . . . White, S.
R. (2013). Fracture behavior of a self-healing, toughened epoxy adhesive.
International Journal of Adhesion and Adhesives, 44, 157-165.
Jin, H., Miller, G. M., Sottos, N. R., & White, S. R. (2011). Fracture and fatigue response
of a self-healing epoxy adhesive. Polymer, 52(7), 1628-1634.
Jones, F. N. (2012). Alkyd Resins (Vol. 2). Weinheim: Wiley-VCH Verlag GmbH & Co.
KGaA.
Jyothi, N. V. N., Prasanna, P. M., Sakarkar, S. N., Prabha, K. S., Ramaiah, P. S., &
Srawan, G. (2010). Microencapsulation techniques, factors influencing
encapsulation efficiency. Journal of Microencapsulation, 27(3), 187-197.
Kamphaus, J. M., Rule, J. D., Moore, J. S., Sottos, N. R., & White, S. R. (2008). A new
self-healing epoxy with tungsten (VI) chloride catalyst. Journal of The Royal
Society Interface, 5(18), 95-103.
Karak, N. (2012). Vegetable Oil-Based Polymers: Properties, Processing And
Applications. Cambridge, UK: Woodhead Publishing Limited.
Keller, M. W., White, S. R., & Sottos, N. R. (2007). A self‐healing poly (dimethyl siloxane) elastomer. Advanced Functional Materials, 17(14), 2399-2404.
Kessler, M. R. (2012). Polymer matrix composites: A perspective for a special issue of
Polymer Reviews. Polymer Reviews, 52(3), 229-233.
Keyvanfar, A., Majid, M. Z. A., Shafaghat, A., Lamit, H., Talaiekhozan, A., Hussin, M.
W., . . . Fulazzaky, M. A. (2014). Application of a grounded group decision-
129
making (GGDM) model: a case of micro-organism optimal inoculation method in
biological self-healing concrete. Desalination and Water Treatment, 52(19-21),
3594-3599.
Khong, Y. K., & Gan, S. N. (2013). Blends of phthalic anhydride‐modified palm stearin
alkyds with high carboxylic acid contents with epoxidized natural rubber. Journal
of Applied Polymer Science, 130(1), 153-160.
Kienle, R. H., & Ferguson, C. S. (1929). Alkyd resins as film-forming materials.
Industrial & Engineering Chemistry, 21(4), 349-352.
Kinloch, A., Mohammed, R., Taylor, A., Eger, C., Sprenger, S., & Egan, D. (2005). The
effect of silica nano particles and rubber particles on the toughness of multiphase
thermosetting epoxy polymers. Journal of Materials Science, 40(18), 5083-5086.
Kinloch, A., Shaw, S., Tod, D., & Hunston, D. (1983). Deformation and fracture
behaviour of a rubber-toughened epoxy: 1. Microstructure and fracture studies.
Polymer, 24(10), 1341-1354.
Kongsager, R., & Reenberg, A. (2012). Contemporary land-use trasitions: The global oil
palm expansion. Department of Geography and Geology, University of
Copenhagen.
Konishi, A., Takahashi, M., Kimura, F., & Toguchi, T. (1974). Microcapsules for
carbonless copying paper, US Patent.
Kouhi, M., Mohebbi, A., Mirzaei, M., & Peikari, M. (2013). Optimization of smart self-
healing coatings based on micro/nanocapsules in heavy metals emission
inhibition. Progress in Organic Coatings, 76(7–8), 1006-1015.
Kruif, C. G. d., Weinbrecka, F., & Vriesc, R. d. (2004). Complex coacervation of proteins
and anionic polysaccharides. Current Opinion in Colloid & Interface Science, 9,
340-349.
Lamprecht, A., & Bodmeier, R. (2010). Microencapsulation Ullman's Encyclopedia of
Industrial Chemistry. Weinheim: Wiley VCH Verlag GmbH & Co. KGaA.
Lee, S. Y., Gan, S. N., Hassan, A., Terakawa, K., Hattori, T., Ichikawa, N., & Choong,
D. H. (2011). Reactions between epoxidized natural rubber and palm oil‐based alkyds at ambient temperature. Journal of Applied Polymer Science, 120(3), 1503-
1509.
Li, H., Tong, W., Cui, J., Zhang, H., Chen, L., & Zuo, L. (2014). Heat treatment of
centrifugally cast high-vanadium alloy steel for high-pressure grinding roller.
Acta Metallurgica Sinica (English Letters), 27(3), 430-435.
Li, Q., Kim, N. H., Hui, D., & Lee, J. H. (2013a). Effects of dual component
microcapsules of resin and curing agent on the self-healing efficiency of epoxy.
Composites Part B: Engineering, 55, 79-85.
Li, Q., Mishra, A. K., Kim, N. H., Kuila, T., Lau, K.-T., & Lee, J. H. (2013b). Effects of
processing conditions of poly (methylmethacrylate) encapsulated liquid curing

130
agent on the properties of self-healing composites. Composites Part B:
Engineering, 49, 6-15.
Li, W., Zhang, X.-X., Wang, X.-C., & Niu, J.-J. (2007). Preparation and characterization
of microencapsulated phase change material with low remnant formaldehyde
content. Materials Chemistry and Physics, 106(2), 437-442.
Liu, H., Wang, C., Zou, S., Wei, Z., & Tong, Z. (2012). Facile fabrication of
polystyrene/halloysite nanotube microspheres with core–shell structure via
Pickering suspension polymerization. Polymer Bulletin, 69(7), 765-777.
Liu, X., Sheng, X., Lee, J. K., & Kessler, M. R. (2009). Synthesis and characterization of
melamine‐urea‐formaldehyde microcapsules containing ENB‐based self‐healing
agents. Macromolecular Materials and Engineering, 294(6‐7), 389-395.
Malinskii, Y. M., Prokopenko, V. V., Ivanova, N. A., & Kargin, V. A. (1969).
Investigation of self-healing of cracks in polymers I. Effect of temperature and
crosslinks on self-healing of cracks in polyvinyl acetate. Mekhanika Polimerov,
2, 271-275.
Mangun, C., Mader, A., Sottos, N., & White, S. (2010). Self-healing of a high temperature
cured epoxy using poly (dimethylsiloxane) chemistry. Polymer, 51(18), 4063-
4068.
McIlroy, D. A., Blaiszik, B. J., Caruso, M. M., White, S. R., Moore, J. S., & Sottos, N.
R. (2010). Microencapsulation of a reactive liquid-phase amine for self-healing
epoxy composites. Macromolecules, 43(4), 1855-1859.
Moake, J. L. (2016). How Blood Clots (Consumer version). Retrieved 31/5/2016 from
http://www.msdmanuals.com/home/blood-disorders/blood-clotting-
process/how-blood-clots
Mostovoy, S., & Ripling, E. (1966). Fracture toughness of an epoxy system. Journal of
Applied Polymer Science, 10(9), 1351-1371.
Murphy, E. B., Bolanos, E., Schaffner-Hamann, C., Wudl, F., Nutt, S. R., & Auad, M. L.
(2008). Synthesis and characterization of a single-component thermally
remendable polymer network: Staudinger and Stille revisited. Macromolecules,
41(14), 5203-5209.
Murphy, E. B., & Wudl, F. (2010). The world of smart healable materials. Progress in
Polymer Science, 35(1-2), 223-251.
Nabuurs, T., Baijards, R., & German, A. (1996). Alkyd-acrylic hybrid systems for use as
binders in waterborne paints. Progress in Organic Coatings, 27(1), 163-172.
Nesterova, T., Dam-Johansen, K., & Kiil, S. (2011). Synthesis of durable microcapsules
for self-healing anticorrosive coatings: A comparison of selected methods.
Progress in Organic Coatings, 70(4), 342-352.
131
Nesterova, T., Dam-Johansen, K., Pedersen, L. T., & Kiil, S. (2012). Microcapsule-based
self-healing anticorrosive coatings: Capsule size, coating formulation, and
exposure testing. Progress in Organic Coatings, 75(4), 309-318.
Noh, H., & Lee, J. (2013). Microencapsulation of self-healing agents containing a
fluorescent dye. Express Polymer Letters, 7, 88-94.
Olaniyi, A. P., Babalola, O. O., & Oyediran, A. M. (2014). Physicochemical properties
of palm kernel oil. Current Research Journal of Biological Sciences, 6(5), 205-
207.
Ong, H. R., Khan, M. M. R., Ramli, R., & Yunus, R. M. (2015). Effect of CuO
nanoparticle on mechanical and thermal properties of palm oil based alkyd/epoxy
resin blend. Procedia Chemistry, 16, 623-631.
Pang, J. W., & Bond, I. P. (2005). A hollow fibre reinforced polymer composite
encompassing self-healing and enhanced damage visibility. Composites Science
and Technology, 65(11), 1791-1799.
Pantzaris, T. P., & Basiron, Y. (2002). The lauric (coconut and palmkernel) oils. In F. D.
Gunstone (Ed.), Vegetable Oils in Food Technology: Composition, Properties
and Uses. UK: Blackwell Publishing.
Patton, T. C. (1962). Alkyd resins technology: Formulating Techniques And Allied
Calculations. New York: Interscience, John Wiley and Sons, Inc.
Perkin, Elmer. (2005). FT-IR Spectroscopy Attenuated Total Reflectance (ATR).
Technical Note FT-IR spectroscopy. Retrieved 30/4/2016 from
http://www.utsc.utoronto.ca/~traceslab/ATR_FTIR.pdf
Peterson, A. M., Jensen, R. E., & Palmese, G. R. (2009). Reversibly cross-linked polymer
gels as healing agents for epoxy− amine thermosets. ACS Applied Materials &
Interfaces, 1(5), 992-995.
Pham, H. Q., & Marks, M. J. (2005). Epoxy Resins Ullmann's Encyclopedia of Industrial
Chemistry. Weinheim: Wiley-VCH Verlag GmbH & Co. KGaA.
Pingkarawat, K., Dell’Olio, C., Varley, R., & Mouritz, A. (2015). An efficient healing
agent for high temperature epoxy composites based upon tetra-glycidyl diamino
diphenyl methane. Composites Part A: Applied Science and Manufacturing, 78,
201-210.
Rule, J. D., Brown, E. N., Sottos, N. R., White, S. R., & Moore, J. S. (2005). Wax‐protected catalyst microspheres for efficient self‐healing materials. Advanced Materials, 17(2), 205-208.
Rule, J. D., Sottos, N. R., & White, S. R. (2007). Effect of microcapsule size on the
performance of self-healing polymers. Polymer, 48, 3520-3529.
Salaün, F., Devaux, E., Bourbigot, S., & Rumeaud, P. (2009). Influence of process
parameters on microcapsules loaded with n-hexadecane prepared by in situ
polymerization. Chemical Engineering Journal, 155, 457-465.

132
Samadzadeh, M., Boura, S. H., Peikari, M., Ashrafi, A., & Kasiriha, M. (2011). Tung oil:
An autonomous repairing agent for self-healing epoxy coatings. Progress in
Organic Coatings, 70(4), 383-387.
Samadzadeh, M., Boura, S. H., Peikaria, M., Kasiriha, S. M., & Ashrafic, A. (2010). A
review on self-healing coatings based on micro/nanocapsules. Progress in
Organic Coatings, 68, 159-164.
Sauvant-Moynot, V., Gonzalez, S., & Kittel, J. (2008). Self-healing coatings: An
alternative route for anticorrosion protection. Progress in Organic Coatings,
63(3), 307-315.
Singha, A. S., & Thakur, V. K. (2008). Effect of fibre loading on urea-formaldehyde
matrix based green composites. Iranian Polymer Journal, 17(11), 861-873.
Sirajuddin, N. A., & Jamil, M. S. M. (2015). Self-healing of poly (2-hydroxyethyl
methacrylate) hydrogel through molecular diffusion. Sains Malaysiana, 44(6),
811-818.
Sirajuddin, N. A., Jamil, M. S. M., Mat, M. L., & Shah, M. A. (2014). Effect of cross-
link density and the healing efficiency of self-healing poly (2-hydroxyethyl
methacrylate) hydrogel. e-Polymers, 14(4), 289-294.
Song, J. K., Choi, H. J., & Chin, I. (2007). Preparation and properties of electrophoretic
microcapsules for electronic paper. Journal of Microencapsulation, 24(1), 11-19.
Suryanarayana, C., Rao, K. C., & Kumar, D. (2008). Preparation and characterization of
microcapsules containing linseed oil and its use in self-healing coatings. Progress
in Organic Coatings, 63(1), 72-78.
Takahashi, I., & Ushijima, M. (2007). Detection of fatigue cracks at weld toes by crack
detection paint and surface SH wave. Materials Transactions (Special Issue on
Advances in Non-Destructive Inspection and Materials Evaluation), 48(6), 1190-
1195.
Talaiekhozani, A., Keyvanfar, A., Andalib, R., Samadi, M., Shafaghat, A., Kamyab, H.,
. . . Hussin, M. W. (2014). Application of Proteus mirabilis and Proteus vulgaris
mixture to design self-healing concrete. Desalination and Water Treatment,
52(19-21), 3623-3630.
Technologies, Pike. (2011). ATR – Theory and Applications: Application Note.
Retrieved 30/4/2016 from http://www.piketech.com/files/pdfs/ATRAN611.pdf
Teo, S. Y., Lee, S. Y., Coombes, A., Rathbone, M. J., & Gan, S. N. (2016). Synthesis and
characterization of novel biocompatible palm oil‐based alkyds. European Journal
of Lipid Science and Technology, 118(8), 1193–1201
Then, S., Gan, S. N., & Kasim, N. H. A. (2011a). Optimization of microencapsulation
process for self-healing polymeric material. Sains Malaysiana, 40(7), 795-802.

133
Then, S., Gan, S. N., & Kasim, N. H. A. (2011b). Performance of melamine modified
urea–formaldehyde microcapsules in a dental host material. Journal of Applied
Polymer Science, 122(4), 2557-2562.
Thies, C. (2005). Microencapsulation Kirk-Othmer Encyclopedia of Chemical
Technology. New Jersey, US: Wiley Blackwell, John Wiley & Sons, Inc.
Tian, Q., Rong, M. Z., Zhang, M. Q., & Yuan, Y. C. (2010). Synthesis and
characterization of epoxy with improved thermal remendability based on Diels‐Alder reaction. Polymer International, 59(10), 1339-1345.
Tian, Q., Yuan, Y. C., Rong, M. Z., & Zhang, M. Q. (2009). A thermally remendable
epoxy resin. Journal of Materials Chemistry, 19(9), 1289-1296.
Tiarks, F., Landfester, K., & Antonietti, M. (2001). Preparation of polymeric
nanocapsules by miniemulsion polymerization. Langmuir, 17(3), 908-918.
Ting, Z., Min, Z., Xiao‐Mei, T., Feng, C., & Jian‐Hui, Q. (2010). Optimal preparation and characterization of poly (urea–formaldehyde) microcapsules. Journal of
Applied Polymer Science, 115(4), 2162-2169.
Tong, X.-M., Zhang, T., Yang, M.-Z., & Zhang, Q. (2010). Preparation and
characterization of novel melamine modified poly (urea–formaldehyde) self-
repairing microcapsules. Colloids and Surfaces A: Physicochemical and
Engineering Aspects, 371(1), 91-97.
Toohey, K. S., Hansen, C. J., Lewis, J. A., White, S. R., & Sottos, N. R. (2009). Delivery
of two‐part self‐healing chemistry via microvascular networks. Advanced Functional Materials, 19(9), 1399-1405.
Toohey, K. S., Sottos, N. R., Lewis, J. A., Moore, J. S., & White, S. R. (2007). Self-
healing materials with microvascular networks. Nature Materials, 6(8), 581-585.
Ullah, H., Azizli, K. A. M., Man, Z. B., Ismail, M. C., & Khan, M. I. (2016). The potential
of microencapsulated self-healing materials for microcracks recovery in self-
healing composite systems: A Review. Polymer Reviews, 1-57.
Urban, M. W. (2015). Self-Reparing Polymeric Materials, Kirk-Othmer Encyclopedia of
Chemical Technology. New Jersey, US: Wiley-Interscience, John Wiley & Sons.
Vahedi, V., Pasbakhsh, P., Piao, C. S., & Seng, C. E. (2015). A facile method for
preparation of self-healing epoxy composites: using electrospun nanofibers as
microchannels. Journal of Materials Chemistry A, 3(31), 16005-16012.
van der Zwaag, S., & Brinkman, E. (2015). Self Healing Materials: Pioneering Research
in the Netherlands. Amsterdam, Netherlands: IOS Press.
Vijayan, P., & AlMaadeed, M. (2016). 'Containers' for self-healing epoxy composites and
coating: Trends and advances. Express Polymer Letters, 10(6), 506-524.

134
Wang, P. P., Lee, S., & Harmon, J. P. (1994). Ethanol-induced crack healing in poly(
methyl methacrylate). Journal of Polymer Science: Part B Polymer Physics, 32,
1217-1227.
Wang, X., Xing, F., Zhang, M., Han, N., & Qian, Z. (2013). Experimental study on
cementitious composites embedded with organic microcapsules. Materials, 6(9),
4064-4081.
Warrington, S. B., & Höhne, G. W. (2000). Thermal analysis and calorimetry. Ullmann's
Encyclopedia of Industrial Chemistry. Weinheim: Wiley-VCH Verlag GmbH &
Co. KGaA
White, S. R., Sottos, N. R., Geubelle, P. H., Moore, J. S., Kessler, M. R., Sriram, S. R., .
. . Viswanathan, S. (2001). Autonomic healing of polymer composites. Nature,
409, 794-797.
Wicks, Z. W. (2002). Alkyd Resins (Vol. 2). Kirk-Othmer Encyclopedia of Chemical
Technology. New Jersey, US: John Wiley & Sons.
Wiederhorn, S. M., & Townsend, P. R. (1970). Crack healing in glass. Journal of The
American Ceramic Society, 53(9), 486-489.
Wool, R. P. (1980). Crack healing in semicrystalline polymers, block copolymers and
filled elastomers. Adhesion and Adsorption of Polymers. New York, US: Plenum
Press/ Springer.
Wool, R. P. (2001). A material fix. Nature, 409, 773-774.
Xiao, D. S., Rong, M. Z., & Zhang, M. Q. (2007). A novel method for preparing epoxy-
containing microcapsules via UV irradiation-induced interfacial
copolymerization in emulsions. Polymer, 48, 4765-4776.
Xiao, D. S., Yuan, Y. C., Rong, M. Z., & Zhang, M. Q. (2009). Self-healing epoxy based
on cationic chain polymerization. Polymer, 50(13), 2967-2975.
Yadav, J., Satyanarayana, M., Balanarsaiah, E., & Raghavendra, S. (2006).
Phosphomolybdic acid supported on silica gel: a mild, efficient and reusable
catalyst for the synthesis of 2,3-unsaturated glycopyranosides by Ferrier
rearrangement. Tetrahedron Letters, 47(34), 6095-6098.
Yi, H., Yang, Y., Gu, X., Huang, J., & Wang, C. (2015). Multilayer composite
microcapsules synthesized by Pickering emulsion templates and their application
in self-healing coating. Journal of Materials Chemistry A, 3(26), 13749-13757.
Yin, T., Rong, M. Z., Zhang, M. Q., & Yang, G. C. (2007). Self-healing epoxy composites
– Preparation and effect of the healant consisting of microencapsulated epoxy and
latent curing agent. Composites Science and Technology, 67, 201-212.
Yuan, L., Huang, S., Hu, Y., Zhang, Y., Gu, A., Liang, G., . . . Nutt, S. (2014).
Poly(phenylene oxide) modified cyanate resin for self‐healing. Polymers for
Advanced Technologies, 25(7), 752-759.

135
Yuan, L., Liang, G., Xie, J. Q., Li, L., & Guo, J. (2006). Preparation and characterization
of poly(urea-formaldehyde) microcapsules filled with epoxy resins. Polymer,
47(15), 5338-5349.
Yuan, Y. C., Rong, M. Z., Zhang, M. Q., Chen, J., Yang, G. C., & Li, X. M. (2008). Self-
healing polymeric materials using epoxy/mercaptan as the healant.
Macromolecules, 41(14), 5197-5202.
Yuan, Y. C., Rong, M. Z., Zhang, M. Q., & Yang, G. C. (2009). Study of factors related
to performance improvement of self-healing epoxy based on dual encapsulated
healant. Polymer, 50(24), 5771-5781.
Zako, M., & Takano, N. (1999). Intelligent material systems using epoxy particles to
repair microcracks and delamination damage in GFRP. Journal of Intelligent
Material Systems and Structures, 10(10), 836-841.
Zheludkevich, M. (2009). Self-healing anticorrosion coatings. In S. K. Ghosh (Ed.), Self-
healing Materials: Fundamentals, Design Strategies, and Applications.
Weinheim: Wiley-VCH Verlag GmbH & Co. KGaA.
Zhu, D. Y., Rong, M. Z., & Zhang, M. Q. (2013). Preparation and characterization of
multilayered microcapsule-like microreactor for self-healing polymers. Polymer,
54(16), 4227-4236.
136
LIST OF PUBLICATIONS AND PAPERS PRESENTED
Shahabudin, N., Yahya, R., & Gan, S. (2016). Microcapsules filled with a palm oil-based
alkyd as healing agent for epoxy matrix. Polymers, 8(4), 125. Doi:
10.3390/polym8040125 (ISI).
Shahabudin, N., Yahya, R., & Gan, S. N. (2016). Microcapsules of poly(urea-
formaldehyde) (PUF) containing alkyd from palm oil. Materials Today:
Proceedings, 3, Supplement 1, S88-S95. Doi:10.1016/j.matpr.2016.01.012
(SCOPUS).
Shahabudin, N., Yahya, R., & Gan, S. N. (2015). Microencapsulation of a palm oil‐based
alkyd by amino resins. Macromolecular Symposia, 354(1), 305-313. Doi:
10.1002/masy.201400085 (ISI).
Shahabudin, N., Yahya, R., & Gan, S. (2016). Epoxy/alkyd reactions for self-healing
epoxy coating (submitted to Composites Interfaces).
Nurshafiza Shahabudin, Rosiyah Yahya and Seng Neon Gan. Alkyd-loaded
microcapsules in epoxy: Mechanical properties and epoxy-alkyd curing reaction.
International Symposium of Advanced Polymeric Materials (IMTCE-ISAPM 2016)
under auspices of 10th International Materials and Technology Conference and
Exhibition (IMTCE), 16-19th May 2016, PWTC, Kuala Lumpur, Malaysia. – Oral
presentation.
Nurshafiza Shahabudin, Rosiyah Yahya and Seng Neon Gan. Poly(melamine-urea-
formaldehyde) microcapsules containing palm oil-based alkyd. 5th International
Conference of Functional Materials and Devices (ICFMD 2015), 4-6th August 2015,
New York Hotel, Johor Bharu, Malaysia. – Oral presentation.
Nurshafiza Shahabudin, Rosiyah Yahya and Seng Neon Gan. Preparation of
microcapsules containing alkyd resin as core. World Polymer Congress MACRO
2014, 6-11th July 2014, Chiangmai, Thailand. – Poster presentation.
Nurshafiza Shahabudin, Rosiyah Yahya and Seng Neon Gan. Preparation of
microcapsules containing alkyd resin as core. 5th Trilateral Seminar UM-CU-NUS,
11-12th February 2014, Chemistry Department, University of Malaya, Kuala
Lumpur, Malaysia. – Poster presentation.

137
APPENDIX A: Publication (Front Page)
A.1 Paper 1
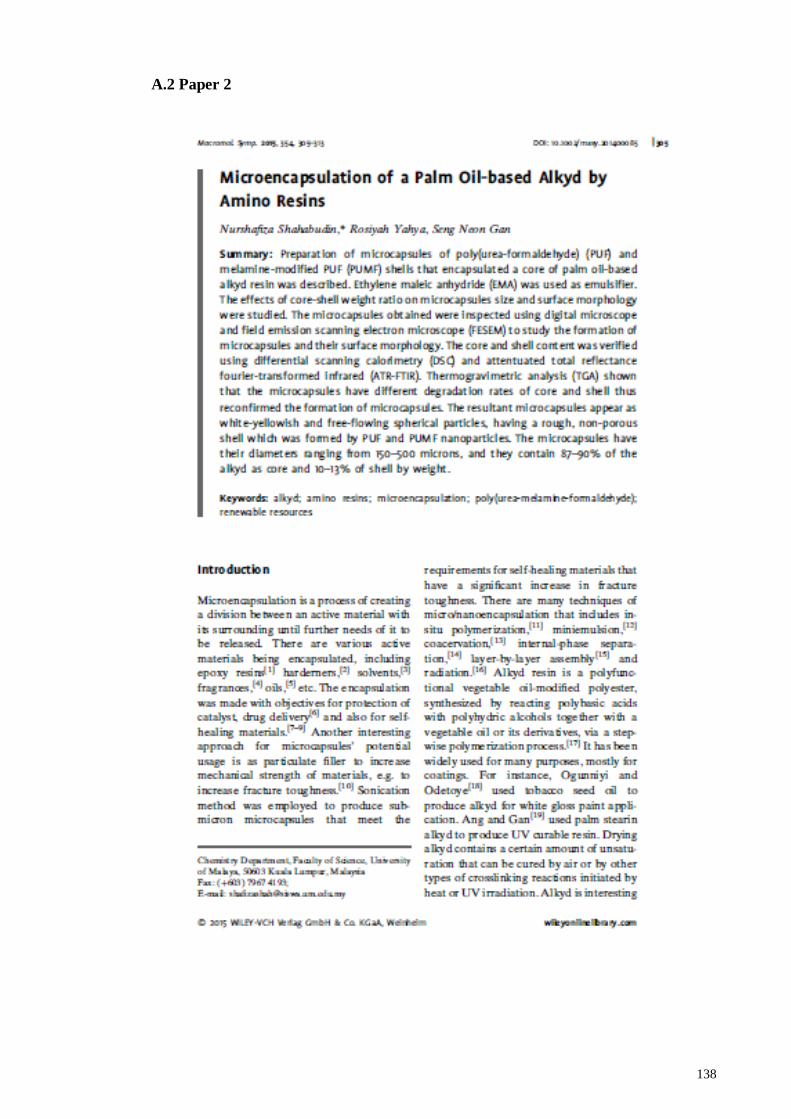
138
A.2 Paper 2
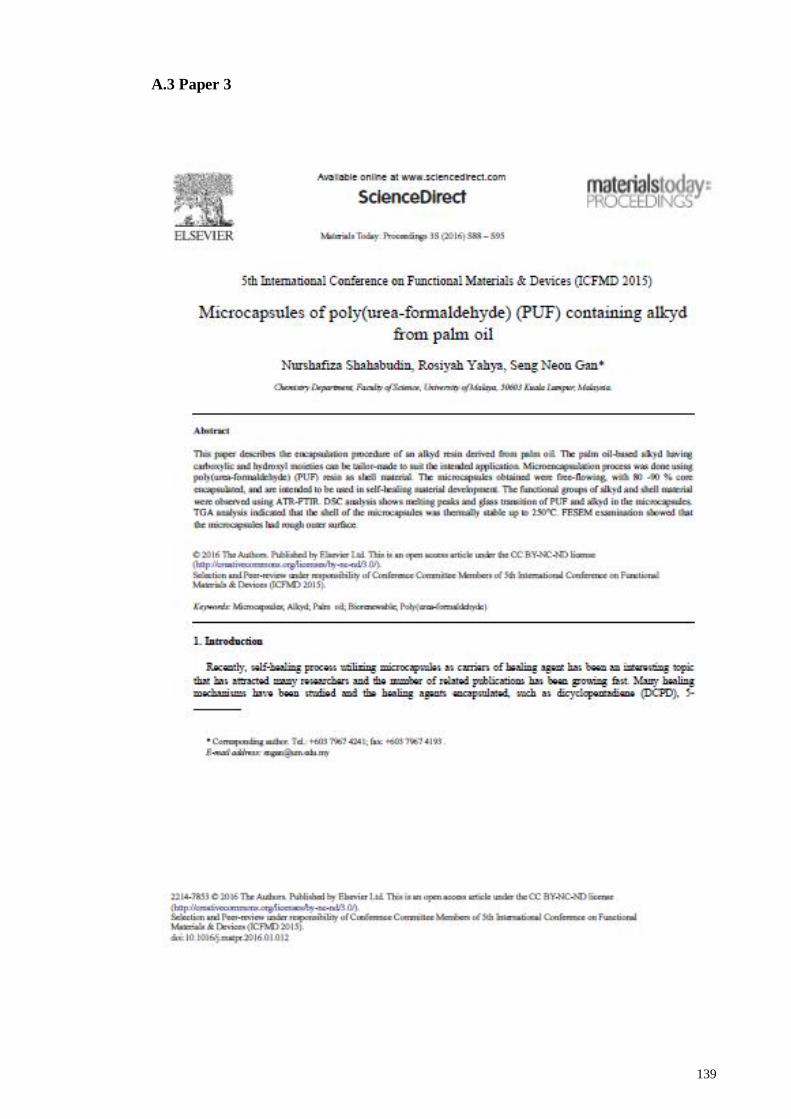
139
A.3 Paper 3
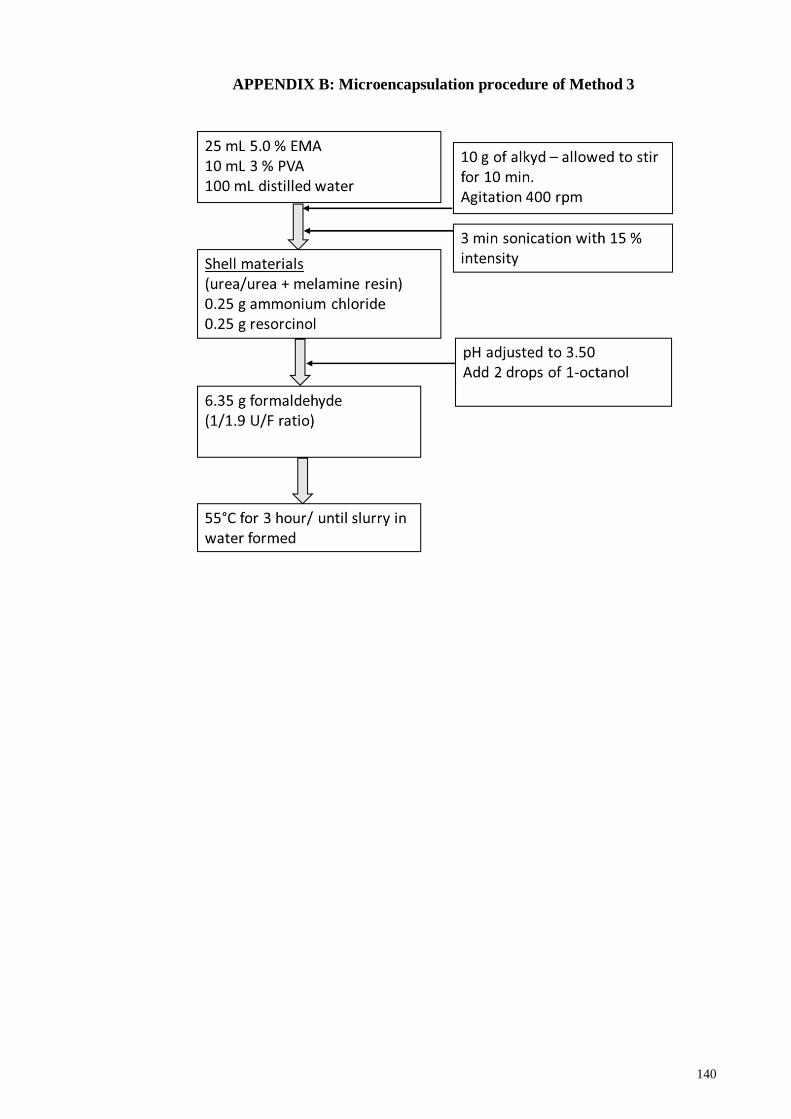
140
APPENDIX B: Microencapsulation procedure of Method 3
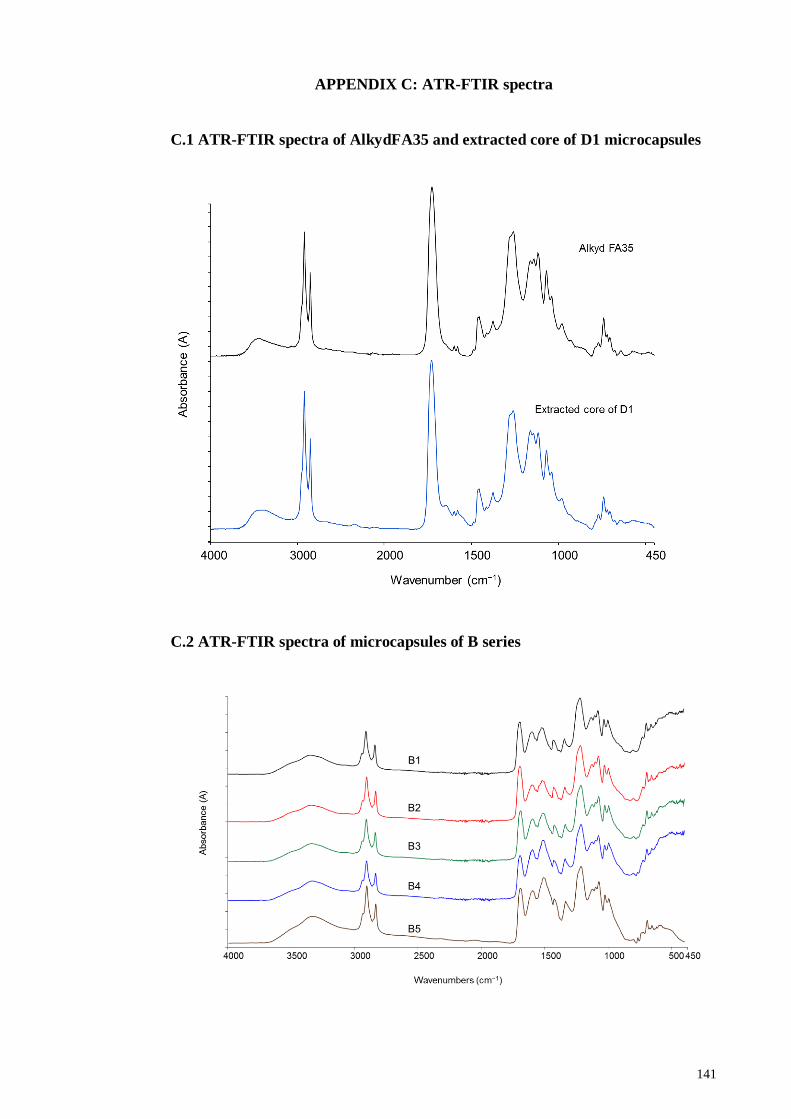
141
APPENDIX C: ATR-FTIR spectra
C.1 ATR-FTIR spectra of AlkydFA35 and extracted core of D1 microcapsules
C.2 ATR-FTIR spectra of microcapsules of B series

142
C.3 ATR-FTIR spectra of neat alkyd, epoxy resin and cured epoxy,
EA1, EA2 and EA3 samples cured at 100°C for 2 h.

143
APPENDIX D: 1H-NMR spectra of AlkydFA35 and the extracted core of D1
microcapsules

144
APPENDIX E: DSC thermograms and characterization data
E.1 DSC thermograms of microcapsules of Series A, the alkyd core and PUF shell.
E.2 DSC thermograms of microcapsules of Series B, the alkyd and PMUF shell

145
E.3 DSC thermograms of D1 microcapsules and AlkydFA35
E.4 DSC characterization data of PUF and PMUF microcapsules
Sample Tg of
alkyd (°C)
Tm of alkyd
(°C)
Tm of shell
(°C)
Td onset
(°C)
Td peak
(°C)
AlkydPKO65 −13.2 −15−15 − n.d. n.d.
Extracted PUF − − 130 204 219, 241
Extracted
PMUF − − 156 204 225
A1 −10.2 0−15 155 200 218
A2 −13.1 0−15 148 205 220
A3 −13.2 0−15 132 208 220, 245
B1 −11.2 0−15 156 205 220
B2 −10.4 0−15 192 n.d. n.d.
B3 −13.1 0−15 164 208 228
B4 −12.7 0−15 142 215 250
D1 −22.9 −15−20 147 220 230, 255
AlkydFA35 −22.9 −15−20 − n.d. n.d.
*n.d. = not detected.

146
E.5 DSC thermograms of C1-C3 microcapsules
E.6 Enlarged Tg area of C1 microcapsules

147
E.7 DSC thermogram of C4 microcapsules
E.8 DSC characterization data of C series microcapsules
Sample Tg of alkyd (°C) Tm of shell (°C)
C1 -16.2 133.3
C2 -11.0 141.2
C3 -9.4 132.7
C4 n.d. 137.1

148
APPENDIX F: TGA thermograms
F.1 TGA thermogram of A2 microcapsules, PUF shell and AlkydPKO65
F.2 TG and dTG of A1 microcapsules

149
F.3 TG and dTG of A2 microcapsules
F.4 TG and dTG of A3 microcapsules

150
F.5 TG of microcapsules from Series B, AlkydPKO65 and PMUF shell
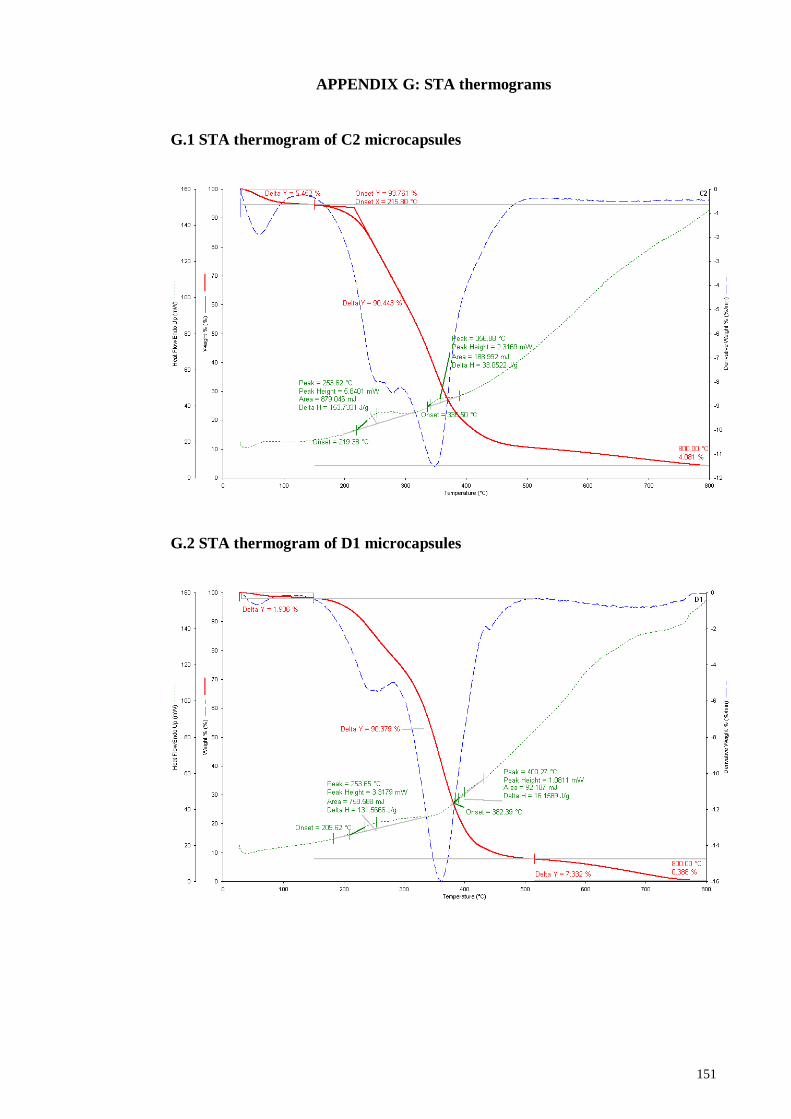
151
APPENDIX G: STA thermograms
G.1 STA thermogram of C2 microcapsules
G.2 STA thermogram of D1 microcapsules

152
G.3 STA characterizations data of C2 and D1 microcapsules
Sample Td onset
(from wt. %)
T50% (from
wt. %)
Td onset
(from heat
flow)
Td peak
(from heat
flow)
C2 216 325 219 254
D1 207 350 210 254
Td onset= onset temperature of degradation; T50% = temperature at 50 % weight loss.

153
APPENDIX H: FESEM micrographs
H.1 FESEM micrographs of A2 microcapsule at magnification: (a) 800×; (b) 2500x
(c) 12 000×
H.2 FESEM micrographs of rupture A2 microcapsules at magnification: (a) 600×
(b) 5000×

154
APPENDIX I: MECHANICAL TEST DATA
I.1 Flexural strength (MPa) of epoxy samples filled with microcapsules B2
Instrument: Shimadzu AG-X high precision universal testing machine Software: TrapeziumX Test Mode: Single Test Type: 3 Point Bend Speed: 1 mm/min Shape: Plate Qty/Batch: 4 Test result: Max Stress in [MPa] Load cell: 5 kN Test date: 29/9/2015 Microcapsules
loading (wt. %)
0/ Neat epoxy 1 3 6
Reading 1 40.2358 50.0845 44.5174 30.6440
Reading 2 43.5061 42.9353 42.2094 34.0377
Reading 3 45.4667 50.7838 42.4937 32.4460
Reading 4 43.4370 49.2310 40.2658 33.1200
Average 43.16 48.26 42.37 32.56
Std. Deviation
(SD)
1.9 3.1 1.5 1.2
% SD 4.3 6.5 3.6 3.8
1.2 Vickers micro-indentation hardness (HV) of epoxy samples filled with
microcapsules B2
Instrument: Shimadzu Micro Hardness Tester HMV-2 Series
Software: EasyTest V1.1.0.0, Shimadzu AD
Test force: HV 0.01 = 98.07 mN
Measurement mode: Simple test
Duration time: 5 sec
Indenter type: Vickers
Test result: Vickers Hardness
Test date: 28/10/2015
Microcapsules
loading (wt. %)
Micro-indentation hardness (HV)
Indent 1 Indent 2 Indent 3 Mean SD % SD
0/ Neat epoxy 9.75 9.56 9.52 9.6 0.1 1
1 9.29 9.6 9.52 9.5 0.1 1
3 9.36 9.17 9.48 9.3 0.1 1
6 9.4 9.36 9.51 9.4 0.1 1

155
APPENDIX J: FORMULATION OF THE EPOXY/ALKYD BLENDS & CORE
CONTENT DATA
Eq. wt. of epoxy = 191 g (from manufacturer)
Eq. wt. of amine = 111 g (from manufacturer)
Eq. wt. of AlkydPKO65 (based on OH)
= 56100 / 151 mg KOH/ g alkyd (calculated OHV)
= 372 g.
Eq. wt. of AlkydPKO65 (based on COOH)
= 56100 / 15 mg KOH/ g alkyd (experimental acid number)
= 3740 g.
Therefore, 191 g epoxy eq. to 111 g amine OR 1 g epoxy eq. to 0.58 g amine
Therefore, 191 g of epoxy eq. to 372 g of OH alkyd OR 191 g of epoxy eq. to
3740 g of COOH alkyd
1 g epoxy eq. to 1.95 g OH alkyd OR 1 g epoxy eq. to 19.6 g COOH alkyd
Code M/U wt. ratio
Rep. Ws W empty
filter paper
W dried
shell and
filter paper Wm Ecore
Ecore
(mean) S.D.
A1 0 1 0.3272 0.9077 0.9318 0.0241 92.6
93.9 1.3 2 0.3055 0.9025 0.9173 0.0148 95.2
A3 0 1 0.3115 0.9030 0.9405 0.0375 88.0 88.0 0.0
2 0.3292 0.8797 0.9191 0.0394 88.0
A2 0 1 0.3070 0.8801 0.9128 0.0327 89.3 89.9 0.5
2 0.3080 0.9081 0.9376 0.0295 90.4
B1 0.03 1 0.3031 0.8889 0.9056 0.0167 94.5 94.8 0.3
2 0.3367 0.8905 0.9068 0.0163 95.2
B2 0.06 1 0.3107 0.8844 0.9052 0.0208 93.3 92.0 1.3
2 0.3022 0.8884 0.9164 0.0280 90.7
B3 0.12 1 0.3100 0.8832 0.9096 0.0264 91.5 91.9 0.4
2 0.3079 0.9109 0.9347 0.0238 92.3
B4 0.29 1 0.3135 0.9070 1.0239 0.1169 62.7 63.1 0.4
2 0.3071 0.9004 1.0124 0.1120 63.5
C2 0.03 1 0.3073 0.7959 0.9459 0.1500 51.2 54.3 3.1
2 0.3032 0.8592 0.9888 0.1296 57.3
Ws - Weight of sample; Wm - weight of the shell.

156
APPENDIX K: Publications of smart materials in Malaysia
Field Institution/
collaborator
Author/year Type of
publication/
Journal
Tier/Index/
Publisher
Self-healing
polymers and
polymer
composites
UM Then et al., 2011 Research paper/
Sains Malaysiana
Q3/ Penerbit UKM
Then et al., 2011 Research paper/ J.
App. Polym. Sc.
Q2/ Wiley
Sonja Then,
2011
Thesis UM
Monash
University,
Malaysia
Vahedi et al.,
2015
Research paper/ J.
Mater. Chem. A
Q1/ RSC
Hia et al., 2016
Review/ Polymer
Rev.
Q1/ Taylors & Francis
UTM Kam & Kueh,
2015.
Review/J. Teknol. Scopus/ Penerbit UTM
Press.
UTP Ullah, H. et al.,
2016
Review/ Polymer
Rev.
Q1/ Taylors & Francis
Intrinsic self-
healing epoxy
UKM Jamil and Jones,
2012
Proceeding paper Scopus/ AACM
Muhamad et al.,
2014
Research
paper/MJAS
Scopus/ ANALIS
Makenan et al.,
2014
Research
paper/MJAS
Scopus/ ANALIS
Jamil et al., 2015 Research paper/
Sains Malaysiana
Q3/ Penerbit UKM
Jamil et al., 2015 Research
paper/MJAS
Scopus/ ANALIS
Muhamad et al.,
2015
Research
paper/MJAS
Scopus/ ANALIS
Sirajudin et al.,
2015
Research
paper/MJAS
Scopus/ ANALIS
Intrinsic self-
healing hydrogel
UKM Sirajudin et al.,
2015
Research paper/ e-
Polymers
Q3/ De Gruyter
Sirajudin et al.,
2015
Research
paper/MJAS
Scopus/ ANALIS
Sirajudin et al.,
2015
Research paper/
Sains Malaysiana
Q3/ Penerbit UKM
USM Ullah, F. et al.,
2015
Review/Mat. Sc.
Eng. C
Q1/ Elsevier

157
Self-healing
concrete
UKM Alebrahim et al.,
2015
Research
paper/Comp.
Struct.
Q1/ Elsevier
UTM Taleikhozani,
Keyvanfar et al.,
2013
Research paper/
Desaline Water
Treat.
Q2/ Taylor & Francis
Keyvanfar et al.,
2014
Research paper/
Desaline Water
Treat.
Q2/ Taylor & Francis
Taleikhozani et
al., 2014
Review/ JETT
Non-ISI/ non-Scopus
Arifin et al.,
2015
Research
paper/Const.
Building. Mater.
Q1/ Elsevier
Arifin et al.,
2015
Research paper/J.
Teknol.
Scopus/ Penerbit UTM
Press.
Huseien et al.,
2015
Research paper/J.
Teknol.
Scopus/ Penerbit UTM
Press.
Sam et al., 2015 Research paper/J.
Teknol.
Scopus/ Penerbit UTM
Press.
i. Muhammad et
al., 2016
Review/ Construc.
Building Mater.
Q1/ Elsevier
UMP Shahid et al.,
2014
Research
paper/JMES
Scopus/ UMP Publisher
UMS Lim &
Pickering, 2014
Research paper/ J.
App. Sc.
Q3/ Asian Network for
Sc. Information
UiTM-Delft
TU
Yunus et al.,
2015/
Proceeding
Extended abstract ICSHM 2015
Supramolecular
photo
rheological
fluids
UiTM-
Cambridge
Tan et al., 2015 Research paper/
Polym. Chem.
Q1/ RSC
Self-healing
adhesives
UMS-
Australia
Ghazali et al.,
2016.
Self-healing anti
corrosion coating
UTM Hamzah et al.,
2016
Proceeding 10th IMTCE 2016
Shape-memory
alloy
UNIKL-
RMIT
Australia
Jani et al., 2014 Review/ Mater.
Design
Q1/ Elsevier
ANALIS: Malaysian Analytical Sciences Society; UM: University of Malaya; UKM: Universiti Kebangsaan Malaysia;
UTM: Universiti Teknologi Malaysia; USM: Universiti Sains Malaysia; UTP: Universiti Teknologi Malaysia; UNIKL: Universiti Kuala Lumpur; UMP: Universiti Malaysia Perlis; UMS: Universiti Malaysia Sabah; UiTM: Universiti
Teknologi Mara; RSC: Royal Science Society; ICSHM: International Conference on Self-healing Materials; AACM:
Asian-Australasian Conference on Composite Materials; JETT: Journal of Environmental Treatment Technique; JMES:
Journal of Mechanical Engineering and Sciences; Delft TU: Delft Technology University, Netherland; IMTCE: International Materials and Technology Conference and Exhibitions.


