Innovative Finance for Social Justice Microfinance and risk management: Impact evaluation of an integrated risk management and microinsurance client training TYM, Vietnam Microfinance for Decent Work Working Paper No. 69 2015 Social Finance Programme & Mannheim University
Transcript
Innovative Finance for Social Justice
Microfinance and risk management: Impact evaluation of an integrated risk management and microinsurance client training TYM, Vietnam Microfinance for Decent Work
Working Paper No. 69 2015 Social Finance Programme & Mannheim University
Publications of the International Labour Office enjoy copyright under Protocol 2 of the Universal Copyright Convention. Nevertheless, short excerpts from them may be reproduced without authorization, on condition that the source is indicated. For rights of reproduction or translation, application should be made to ILO Publications (Rights and Permissions), International Labour Office, CH-1211 Geneva 22, Switzerland, or by email: [email protected]. The International Labour Office welcomes such applications.
Libraries, institutions and other users registered with reproduction rights organizations may make copies in accordance with the licences issued to them for this purpose. Visit www.ifrro.org to find the reproduction rights organization in your country.
Froelich, Markus; Kemper, Niels; Poppe, Robert; Breda, Vale ́rie; Richter, Patricia Microfinance and risk management: Impact evaluation of an integrated risk management and microinsurance client training, TYM Vietnam; International Labour Office, Social Finance Programme & Mannheim University. Geneva: ILO, 2015 ISBN: 9789221305033 (print); 9789221305040 (web pdf) International Labour Office Social Finance Programme. microfinance / financial management / credit / risk management / bank / informal employment / decent work / workers education / aid programme / role of ILO / Cambodia
ILO Cataloguing in Publication Data 11.02.2
The designations employed in ILO publications, which are in conformity with United Nations practice, and the presentation of material therein do not imply the expression of any opinion whatsoever on the part of the International Labour Office concerning the legal status of any country, area or territory or of its authorities, or concerning the delimitation of its frontiers.
The responsibility for opinions expressed in signed articles, studies and other contributions rests solely with their authors, and publication does not constitute an endorsement by the International Labour Office of the opinions expressed in them. Reference to names of firms and commercial products and processes does not imply their endorsement by the International Labour Office, and any failure to mention a particular firm, commercial product or process is not a sign of disapproval.
ILO publications can be obtained through major book sellers or ILO local offices in many countries, or direct from ILO Publications, International Labour Office, CH-1211 Geneva 22, Switzerland. Catalogues or lists of new publications are available free of charge from the above address, or by email: [email protected]
Visit our website: www.ilo.org/publns
Printed by the International Labour Office, Geneva, Switzerland
Microfinance and risk management: Impact evaluation of an integrated
risk management and microinsurance client training,
TYM Vietnam
Final Report
Markus Froelich, Niels Kemper and Robert Poppe Valerie Breda and Patricia Richter**
Authors from Chair of Econometrics, Department of Economics and Business Administration, University of Mannheim, Germany. Responsible for sections 4, 5, 6 and appendix. Corresponding author: [email protected].
** Authors from ILO Social Finance Programme. Responsible for sections 1, 2, 3 and 6. Corresponding
Entrepreneurs in the informal economy, and the employees that work in those businesses, are often exposed to difficult and dangerous working conditions. The tools used to identify, prevent and rectify such conditions in the formal economy – including social dialogue between employers and employees, labour inspection and other applications of labour law – generally do not apply to the unregistered enterprises that proliferate in many emerging economies. Consequently, alternative approaches are required. But how can one reach these enterprises and influence their conditions? Microfinance institutions (MFIs) are a potential conduit. In many emerging markets, they have significant outreach, providing financial services to thousands of small and micro enterprises. Since their primary relationship with these entrepreneurs often involves an enterprise loan, they could theoretically use that leverage to encourage improvements to conditions in the business. Why would microfinance institutions be interested in doing that? Many MFIs have a social agenda, or a double bottom line approach that strives to combine social and commercial objectives. These organizations are often looking for new tools and approaches that allow them to efficiently enhance their social impact, especially since recent research has raised serious questions about the welfare benefits derived from microfinance. It is also possible that such interventions enhance business objectives, which would be of interest even to MFIs without a social agenda. With this concept in mind, and with the generous support from the German Ministry of Labour and Social Affairs, the International Labour Organization (ILO) launched an action research programme to assess if MFIs could use their relationship with entrepreneurs to target decent work deficits and improve the plight of workers in the informal economy. This Working Paper presents the results of an intervention of TYM, Vietnam and is part of a series of impact reports that present the outcomes of this action research programme. The primary target audiences are MFI managers who will hopefully be inspired by their colleagues’ ingenuity, educated about the impact of innovative approaches, and informed about the challenges of conducting action research (but not scared off). Other microfinance actors, including networks and associations, investors and funders, regulators and policymakers, academics and anyone interested in the social performance of microfinance will also find this paper informative. For the ILO’s constituents – employers’ and workers’ organizations and Ministries of Labour – the findings of this research present them with a new instrument in their policy toolkit to improve the circumstances of entrepreneurs and workers in the informal economy. Through this initiative, the ILO wishes to promote its “Decent Work Agenda” among MFIs and also to demonstrate that MFIs can improve livelihoods of their clients through more comprehensive approaches, often including the provision of both financial and non-financial services. For anyone interested in reading the other impact studies and the synthesis report, click on the MF4DW button on the Social Finance website (www.ilo.org/socialfinance).
Preface ................................................................................................... i
Acknowledgements .................................................................................. iv
Executive summary .................................................................................. v
Abbreviations and acronyms ...................................................................... vi
1. Background: The ILO Microfinance for Decent Work action research ............... 1
2. The decent work innovation: An integrated client training on risk management and microinsurance ............................................................................. 2
4. Surveys, data and evaluation methodology ................................................ 6 4.1 Surveys and data........................................................................... 6 4.2 Evaluation methodology .................................................................. 7 4.3 Household characteristics at baseline ..................................................... 7
5. Evaluation Results ............................................................................... 9 5.1 Understanding of and satisfaction with the MAF ..................................... 9 5.2 Impact on financial attitude ............................................................ 10 5.3 Impact on risk management strategies ............................................... 13 5.4 Impact on asset building ................................................................ 16 5.5 Impact on over-indebtedness/multiple borrowing ................................. 18 5.6 Impact on vulnerability .................................................................. 20
6. Conclusion and recommendations ......................................................... 22
Social Finance Working Papers since 2000 ................................................... 48
List of Tables
Table 4.1.1: Sample sizes reached during each data collection .............................. 6
Table 4.3.1: Summary statistics of client households at baseline ............................ 8
Table 5.2.1: Impact of the training programme on debt- and precaution-related financial attitudes .................................................................... 10
Table 5.3.1: Impact of the client training on risk management and microinsurance on risk management strategies ..................................................... 14
Table 5.4.1: Impact of the client training on asset building .................................. 16
Table 5.5.1: Impact of the client training on over-indebtedness/multiple borrowing ... 18
Table 5.6.1: Impact of the client training on vulnerability ................................... 20
Table A2.1. Illustration of the difference-in-difference methodology ...................... 26
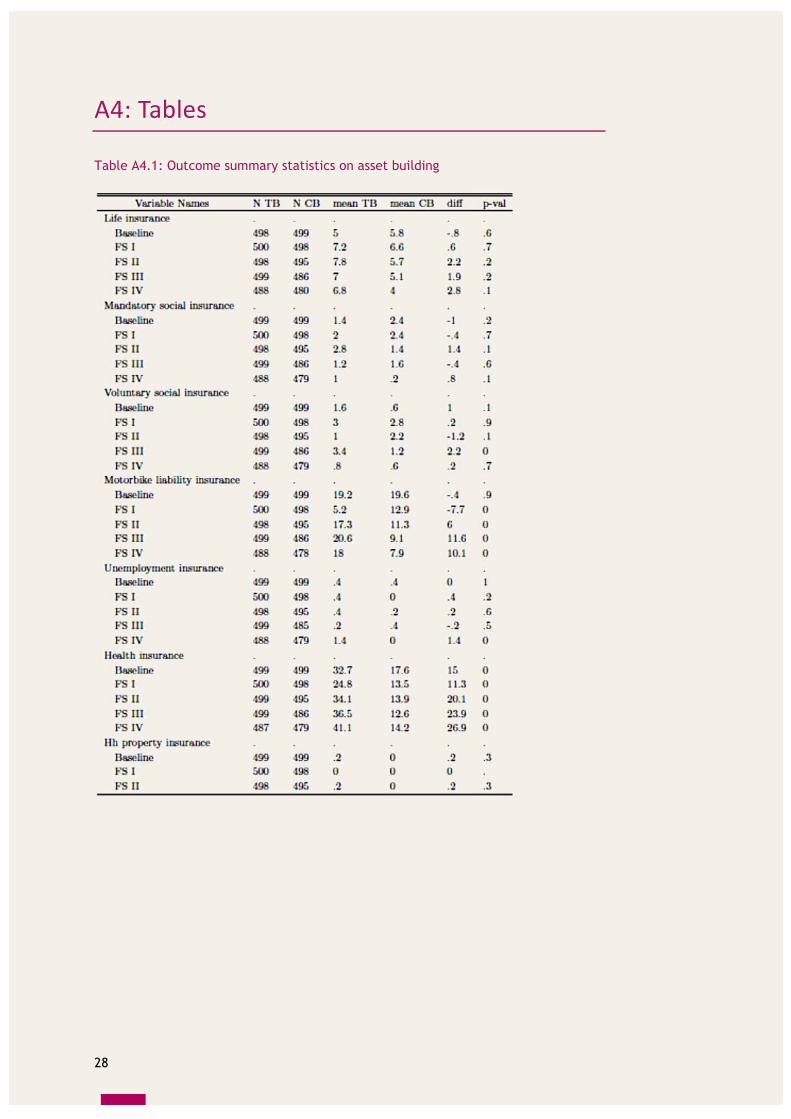
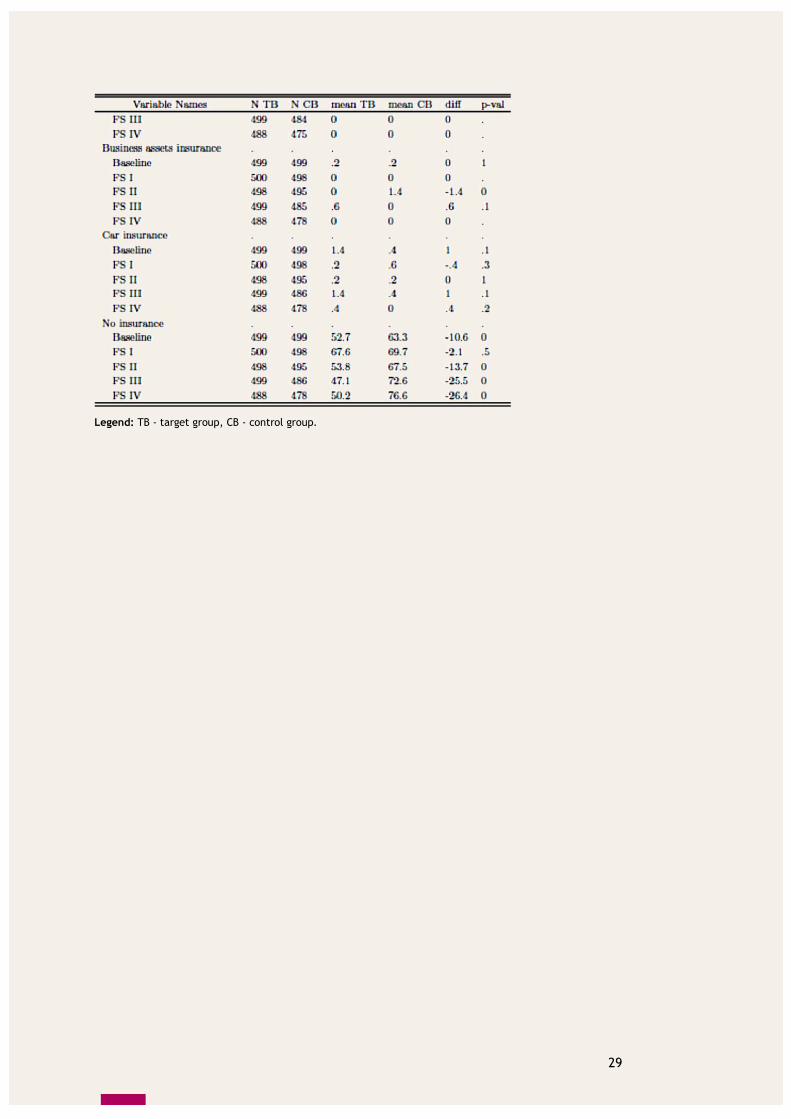
Table A4.1: Outcome summary statistics on asset building ................................... 28
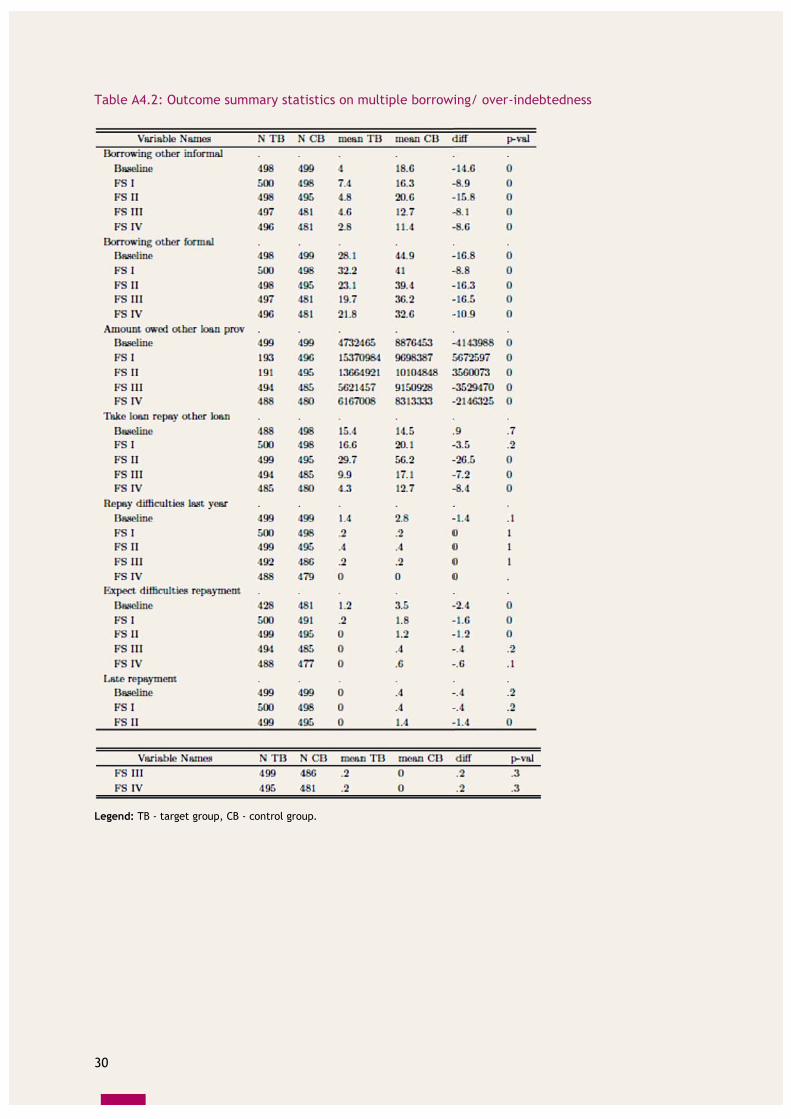
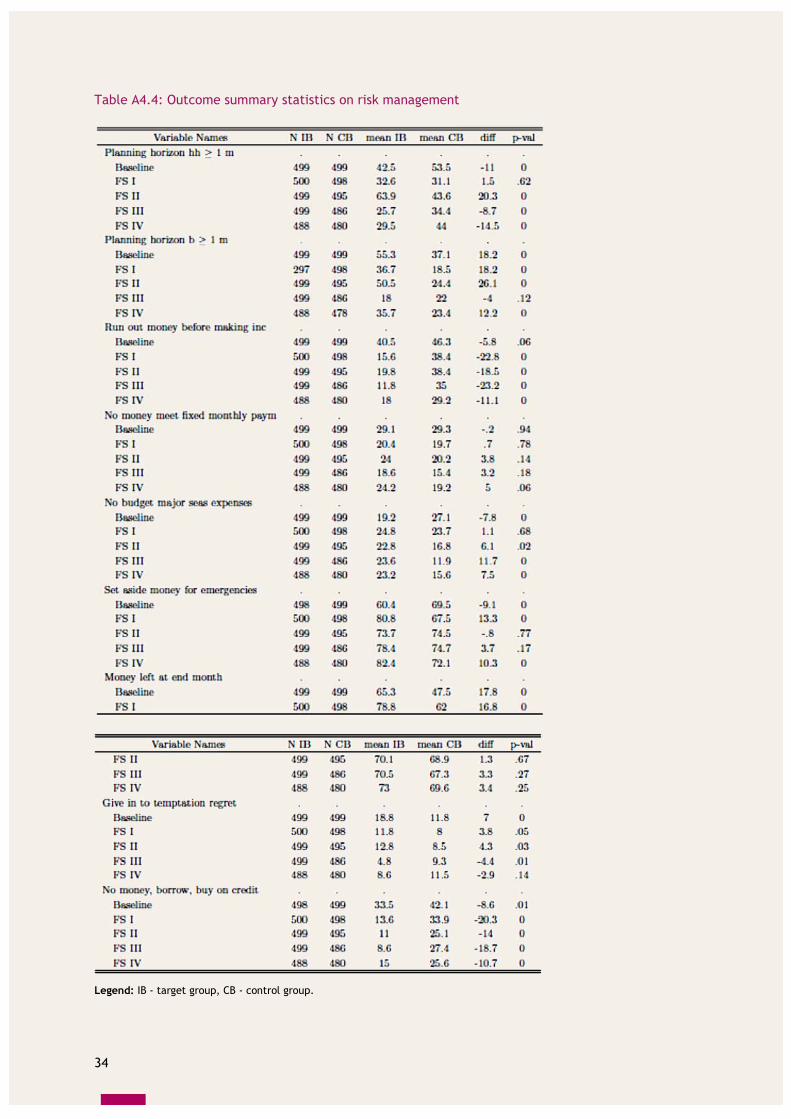
Table A4.4: Outcome summary statistics on risk management .............................. 34
Table A4.5: Outcome summary statistics on vulnerability .................................... 35
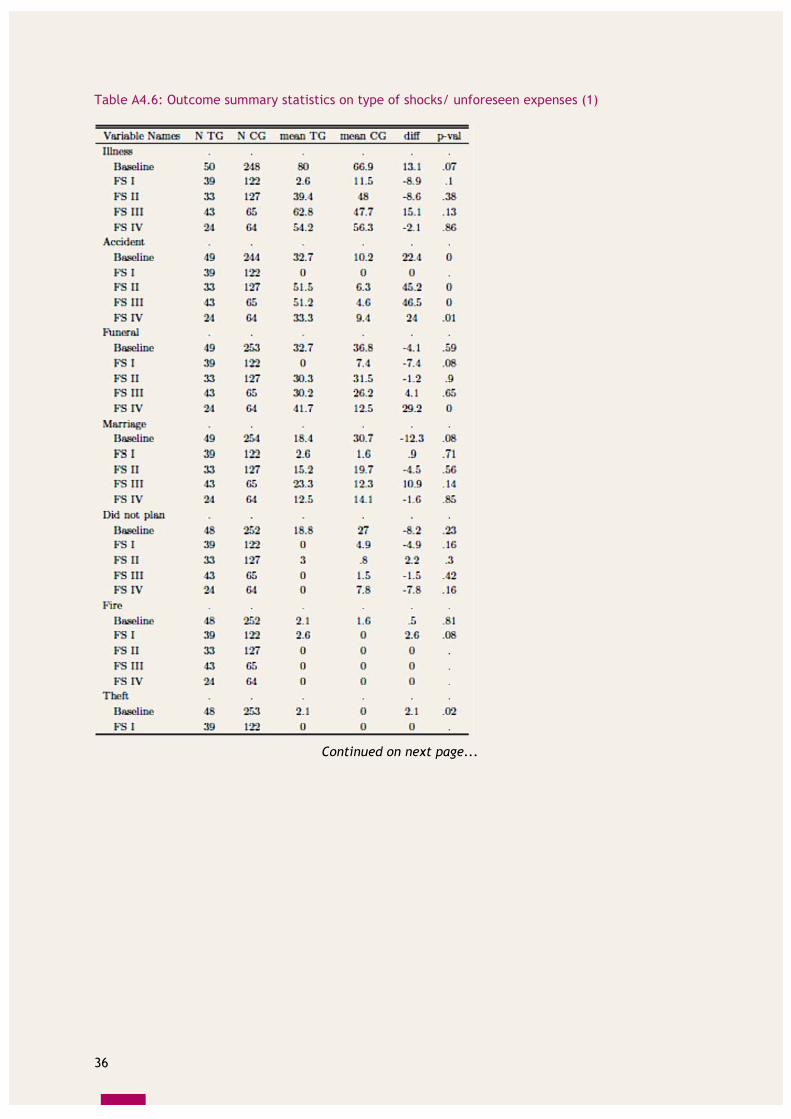
Table A4.6: Outcome summary statistics on type of shocks/ unforeseen expenses (1) . 36
Table A4.6: Outcome summary statistics on type of shocks/ unforeseen expenses (2) . 37
Table A4.7: Outcome summary statistics on MAF (1) .......................................... 38
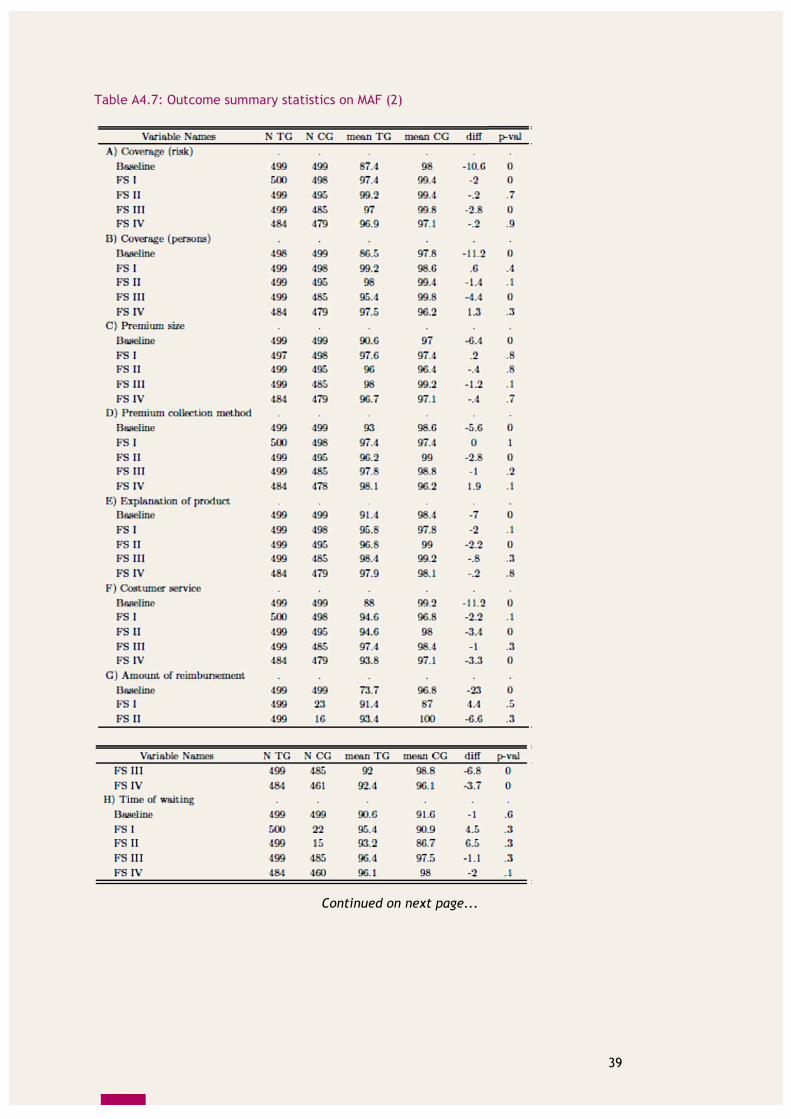
Table A4.7: Outcome summary statistics on MAF (2) .......................................... 39
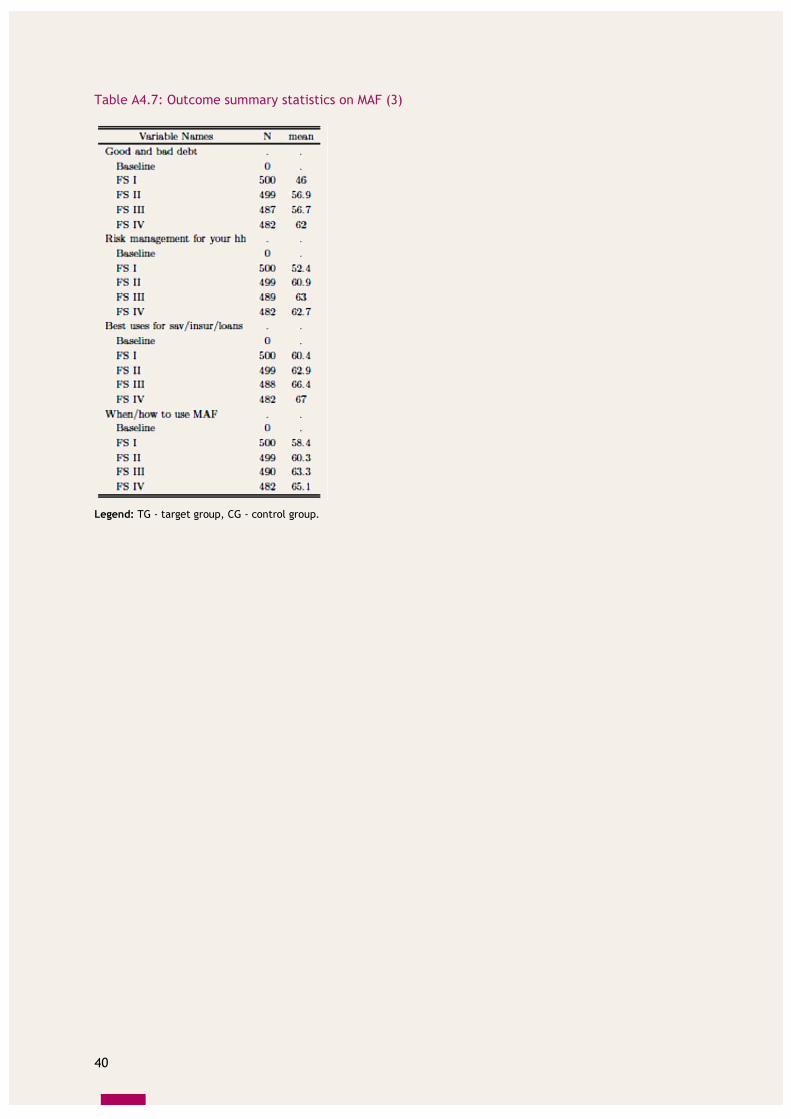
Table A4.7: Outcome summary statistics on MAF (3) .......................................... 40
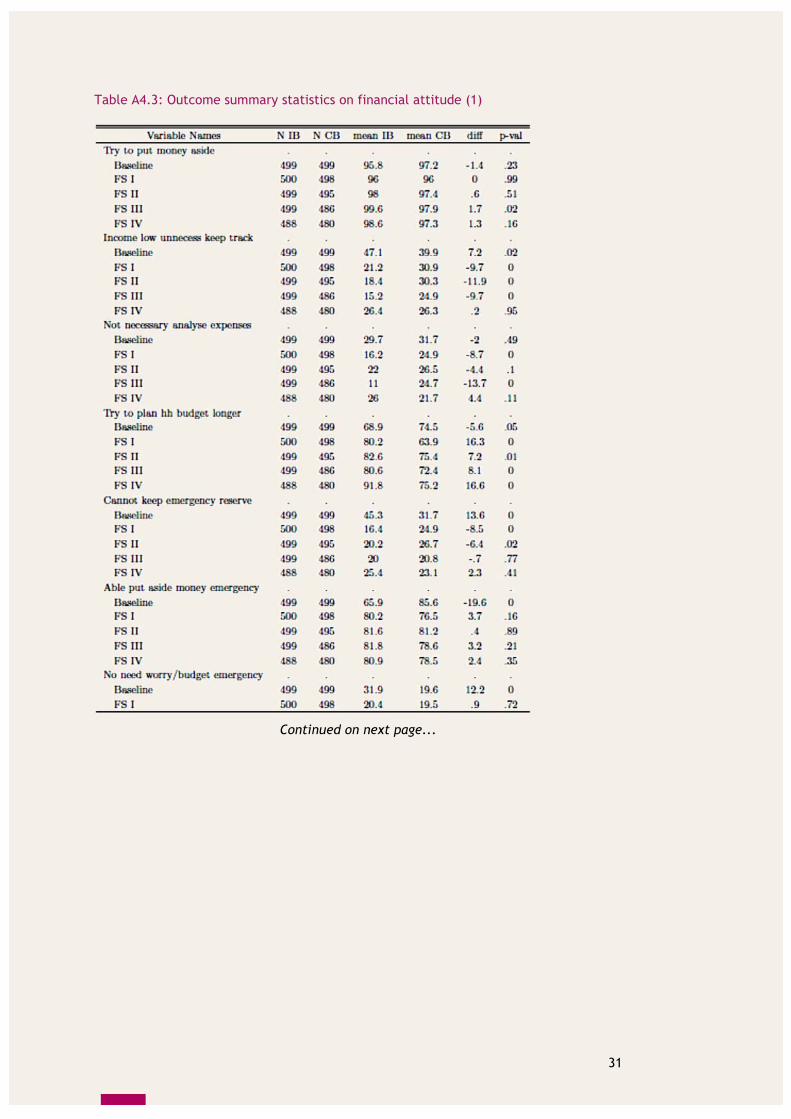
Table A4.8: Impact on financial attitude (1) .................................................... 41
Table A4.8: Impact on financial attitude (2) .................................................... 42
Table A4.8: Impact on financial attitude (3) .................................................... 43
Table A4.9: Impact on risk management ......................................................... 44
Table A4.10: Impact on asset building ............................................................ 45
Table A4.11: Impact on multiple borrowing/over-indebtedness ............................. 46
Table A4.12: Impact on vulnerability ............................................................. 47
List of Figures
Figure 1: Results chain of TYM’s client training on risk management and microinsurance. ........................................................................ 4
Figure 5.2.1: Percentage of clients who agree that it is not necessary to analyse expenses ................................................................................ 12
Figure 5.2.2: Percentage of clients who agree that it is impossible to save because of expenses ............................................................................ 12
Figure 5.2.3: Percentage of clients who agree that loan is only last resort ............... 13
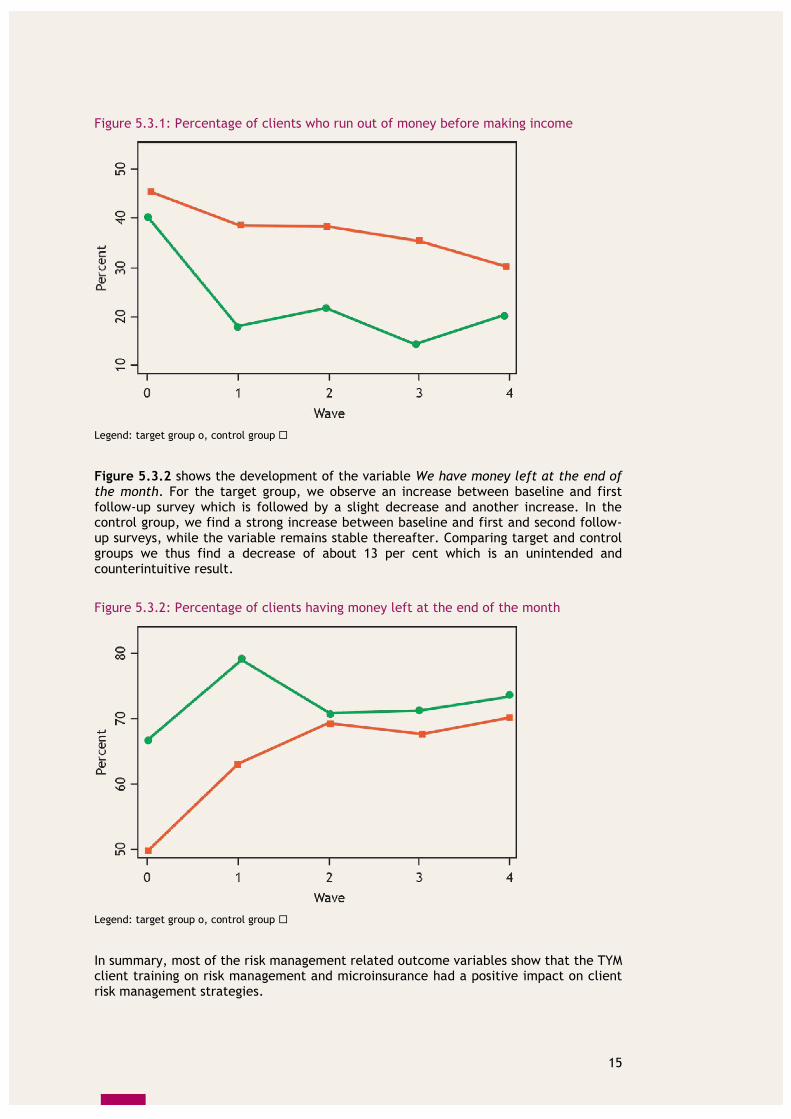
Figure 5.3.1: Percentage of clients who run out of money before making income ....... 15
Figure 5.3.2: Percentage of clients having money left at the end of the month ......... 15
Figure 5.4.1: Percentage of clients with motorbike liability insurance ..................... 17
Figure 5.4.2: Percentage of clients with life insurance ....................................... 17
Figure 5.5.1: Percentage of clients with late payments ....................................... 19
Figure 5.5.2: Percentage of clients with difficulties repaying ............................... 19
Figure 5.6.1: Percentage of clients who could cover unforeseen household expenses .. 21
Figure 5.6.2: Percentage of clients who could cover unforeseen business expenses .... 21
iv
Acknowledgements
We would like to thank Markus Froelich, Niels Kemper and Robert Poppe from the University of Mannheim for their active collaboration in writing this working paper. Many thanks also to Ms Duong Thi Ngoc Linh, Ms Nguyen Thi Ha, Ms Duong Thi Hai Yen, Mr Nguyen Duy Truong and other TYM team members for their enthusiasm and continuous support in implementing and testing the innovation and responding to our questions.
v
Executive summary
Tao Yeu May (TYM), a microfinance institution in Vietnam, participated in the ILO Microfinance for Decent Work (MF4DW) action research from 2008-2012. As part of this global experimental research, TYM introduced an integrated risk management and microinsurance client training in two rural branches. The training aimed to address challenges that clients faced in regard to the risk management strategies they use and their levels of indebtedness. The impact of the training on clients’ financial attitudes, risk management strategies, asset building, over-indebtedness and multiple borrowing, and vulnerability, was measured employing a difference-in-difference methodology. The econometric analysis was based on a balanced five-wave panel data set with target and control groups. The evaluation showed that TYM’s integrated risk management and microinsurance client training had the strongest effect on the financial attitudes of clients, especially on planning attitudes and on attitudes related to savings. The percentage of clients in the target compared to the control group that agreed to be able to put money aside for emergency expenses increased by a remarkable 22 per cent and the attitude towards planning household budgets for longer than a year improved by 17 per cent. Impact on client risk management behaviour was also strong by contributing to improving a number of situations that clients face. For example, clients who had access to the training less often ran out of money before making income than clients who did not have access to the training (decrease of 13 per cent). Interestingly, the observed change in financial attitudes regarding savings and planning already reflected in changed financial behaviour related to the same as we saw a 17 per cent increase in the ability to set aside money for emergencies as well as a 13 percent increase in clients with longer planning horizons. The analysis also showed some insignificant and some unexpected results for other outcome variables, which may be due to some issues with the experimental design of the research and the survey instrument. It is therefore possible that the innovation may have had a stronger impact than actually measured.
vi
Abbreviations and acronyms
CG Control group
DiD Difference-in-difference
ILO International Labour Organization
MAF Mutual Assistance Fund
MFI Microfinance institution
MFO Microfinance Opportunities
MF4DW Microfinance for Decent Work
TG Target group
ToT Training of Trainers
TYM Tao Yeu May
1
1. Background: The ILO Microfinance for Decent Work action research
The Microfinance for Decent Work (MF4DW) action research aimed at building knowledge about the effects of innovations on microfinance clients’ livelihoods. Launched by the ILO Social Finance Programme in 2008, the MF4DW action research started by identifying specific work-related challenges among microfinance clients and to address them, implemented tailor-made innovations with 16 microfinance institutions (MFIs) worldwide. The MF4DW action research set out to apply an experimental research design to measure the impact of these innovations overtime. The MF4DW action research concluded in June 2012. At the outset of the MF4DW action research, each participating MFI conducted a diagnostic survey among 200 of its clients to determine their most pressing work-related challenges. The analysis was guided by ILO’s vision of decent work for all and its goal to promote opportunities for women and men to obtain decent and productive work, in conditions of freedom, equity, security and human dignity. Within this framework, the diagnostic determined child labour, working conditions, formalisation, job creation and productive employment, risk management/over-indebtedness, and women’s empowerment, as key challenges for microfinance clients to obtain decent work. Informed by the diagnostic results, each MFI developed an innovation to address the work-related challenge that most affected its clients and started implementing the innovations from 2009 onwards. The innovations included new or upgraded
non-financial services (training, awareness campaign), or
mechanisms for delivering services (organisational restructuring). The MF4DW action research used an experimental research design meaning that one group of clients received the innovation (target group) while another group of clients did not (control group). Ideally, clients of each group were selected randomly. Before the introduction of the innovations, all clients of the target and control groups were interviewed to establish a baseline against which changes could be compared. Depending on the implementation timeline, up to four follow-up surveys were conducted once the innovation was launched. The last follow-up surveys were completed in February 2012. This report presents the final impact results of the innovation implemented by Tao Yeu May (TYM) in Vietnam1. TYM is one of the largest MFIs in Vietnam and the first one to have become officially licensed to establish and operate a small-scale finance institution in the country in 20102. It has 17 branches and operates in 10 provinces in the North and Centre of the country. As of December 2012, it served 78,818 women with a staff of 3663. TYM provides a range of financial services such as group and individual loans, savings products, mutual assistance fund and training, mostly in rural areas of Vietnam. TYM conducted the MF4DW action research in two provinces: Hanoi province and Nam Dinh province. The TYM branches in these two provinces were selected as they tend to have comparable characteristics. They are both in rural areas and were created in 1999, their clients are engaged in similar economic activities, the average loan amount, the drop out and repayment rates are rather close. Me Linh 7 (Hanoi province) provided the target branch (where the innovation was introduced) while Y Yen 8 (Nam Dinh province) provided the control branch.
1 In May 2013, TYM officially was renamed as Tinh Thuong One member Limited Liability Microfinance
Institution. This report refers to the name used during the research period which is TYM. 2 As of 31/12/2012, only 2 MFIs were licensed in Vietnam, i.e. TYM and M7 microfinance institution.
3 Source: http://mixmarket.org/mfi/tym/report (accessed 17 October 2014).
2. The decent work innovation: An integrated client training on risk management and microinsurance
The initial diagnostic that TYM conducted in 2008 identified risk management as one of the most pressing challenges for TYM clients:
27 per cent of respondents stated that they had been confronted with large unforeseen expenses, mainly due to illness/accident, death, or natural disaster in the past year.
68.5 per cent of respondents covered the large unforeseen expenses by withdrawing savings, 55.6 per cent by taking a loan, 18.5 per cent by working extra, and 15.5 per cent by using microinsurance. Only 2 per cent covered large unforeseen expenses in the last year by using insurance.
While 100 per cent of the respondents are members of TYM’s Mutual Assistance Fund (a compulsory microinsurance programme), only 91 per cent acknowledged being a member.
61 per cent of the respondents stated taking loans from other sources (mostly from banks) and among them 6.5 per cent said they used the loan to pay back another loan.
These diagnostic findings showed that client understanding of risk management and the role of different financial products, in particular TYM’s Mutual Assistance Fund (MAF), in managing risks is still low. As a result, the client strategies to cope with risk are not optimal and unforeseen shocks can have negative impact on their livelihoods. In an earlier attempt to improve the situations of its clients, TYM introduced the Mutual Assistance Fund in 1996 to provide a credit life insurance product as well as health and death benefits to its clients (including spouse/children). However, given the very small compulsory contributions, the limited benefits and low awareness among TYM clients, the product was not appropriate to cover health and death related expenses of clients and thus mitigate the financial pressure. In an effort to better address the needs of its clients and offer meaningful benefits, TYM upgraded the MAF in early 2009. In parallel, TYM started to work on setting up a separate legal entity dedicated to microinsurance to offer more and better insurance products to its clients. The new entity was expected to be registered under Government Decree 18 in 2013 when all legal and financial requirements were to be met. To support the introduction of the upgraded MAF product, and to address the still limited awareness among TYM clients about the use of the MAF and other risk management strategies, TYM introduced an integrated client training on risk management and microinsurance. The curriculum and training material was developed by TYM, in particular by the MAF team in collaboration with the TYM training department. TYM built on its internal training capacity and adapted the Microfinance Opportunities (MFO) curriculum on microinsurance and savings on which TYM staff had been capacitated during a Training of Trainers (ToT) course organised by MFO in Vietnam in 2008. In addition, a local ILO expert on microinsurance reviewed the materials. The training aimed to equip clients with skills and knowledge on risk management so that they can make informed and sound financial decisions about spending, saving or borrowing, especially for emergency purposes, and using insurance.
The curriculum covered five topics:
1) Introduction to risk management
2) Savings
3) Concepts of insurance
3
4) Insurance terms and types of common insurance
5) Use of the Mutual Assistance Fund
The material included a trainer’s manual and visual aids (posters and brochures) to facilitate the transfer of knowledge to the clients. The client training on risk management and microinsurance was implemented in three steps: First, TYM at central level trained 16 of its provincial staff (ToT on 19-22 November 2009). The ToT covered all five topics of the curriculum and introduced the training materials and adult learning methods to the participants. The participants included one area manager, two branch managers, 11 loan officers and two area accountants. Among the 16 trained staff, TYM selected 12 to deliver the client training in the target branch (Me Linh 7). The training was first pilot tested on 26-27 December 2009 for 30 clients. Contents and methodology were refined taking into account clients’ and trainers’ feedback. Second, from January to June 2010, TYM target branch staff delivered 59 two half-day training courses to the 1’567 clients of the branch. The two half-day training course covered the whole curriculum, i.e. the five topics mentioned above. The training courses were organized during weekends and holidays to accommodate TYM staff schedule. Third, as of July 2010, once all target branch clients had received the two half-day training, the branch staff delivered briefing sessions at the end of weekly and monthly client meetings to refresh the clients’ knowledge on the five training topics and reinforce client skills. After the regular client meeting activities were completed (such as collecting loan repayments and savings), the branch staff reiterated the key messages of one training topic using participatory methods and visual aids. Each briefing session lasted from 15 to 20 minutes. In September 2010, TYM organised a consultative meeting in Hanoi to take stock of the action research including the progress of the risk management and microinsurance training, achievements and challenges, and planning for the following months. Around 25 TYM staff from central level and from the two participating branches (Me Lynh 7 and Y Yen) attended the consultative meeting. As an outcome, the training curriculum was slightly modified to better reflect client needs. In particular, the fourth topic “Insurance terms and types of common insurance” was replaced by “The civil responsibility of motor vehicle owners”. The change was based on the fact that most clients do have motorbike insurance (it is compulsory); however, they do not have a clear understanding of what it covers and how it shall be used. In addition, it was decided to organize a refresher ToT for the trainers at branch level and to revise some of the training aids (posters) to make them better fit with the local context. A refresher ToT was therefore organized fourteen months after the launch of the risk management and microinsurance training, on 18-20 March 2011. The objectives were to share and discuss lessons learnt from the client training, strengthen branch staff’s knowledge on risk management and enhance their training skills. Fifteen participants, including the eight Me Lyn branch officers who delivered the training sessions as well as the TYM training department and the MAF team at central level, attended the refresher training.
4
3. Intended outcomes
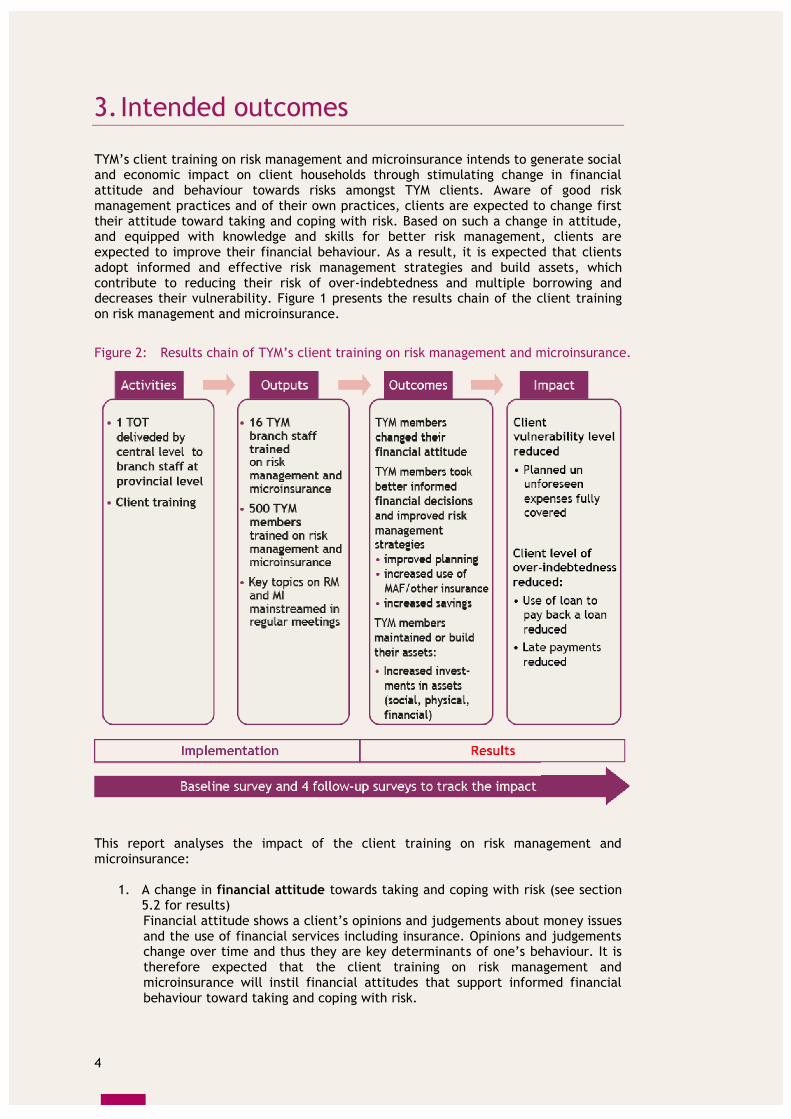
TYM’s client training on risk management and microinsurance intends to generate social and economic impact on client households through stimulating change in financial attitude and behaviour towards risks amongst TYM clients. Aware of good risk management practices and of their own practices, clients are expected to change first their attitude toward taking and coping with risk. Based on such a change in attitude, and equipped with knowledge and skills for better risk management, clients are expected to improve their financial behaviour. As a result, it is expected that clients adopt informed and effective risk management strategies and build assets, which contribute to reducing their risk of over-indebtedness and multiple borrowing and decreases their vulnerability. Figure 1 presents the results chain of the client training on risk management and microinsurance.
Figure 2: Results chain of TYM’s client training on risk management and microinsurance.
This report analyses the impact of the client training on risk management and microinsurance:
1. A change in financial attitude towards taking and coping with risk (see section 5.2 for results) Financial attitude shows a client’s opinions and judgements about money issues and the use of financial services including insurance. Opinions and judgements change over time and thus they are key determinants of one’s behaviour. It is therefore expected that the client training on risk management and microinsurance will instil financial attitudes that support informed financial behaviour toward taking and coping with risk.
5
2. An improvement in client's risk management strategies (see section 5.3 for results) It is expected that financially informed clients will be able to better assess the risks in their daily lives (health shocks, disasters, business failure, and over-indebtedness) and take effective steps to eliminate or reduce them. For example, it is expected that clients use financial planning to take decisions about business and household spending, that they consider their needs and capacity to repay as well as the risk of default before taking a loan, that they spend wisely to be able to save for emergencies and build their assets, and that they use a mix of financial services including the TYM Mutual Assistance Fund and other insurance products to protect themselves against risk.
3. The building of assets (see section 5.4 for results)
It is expected that financially informed clients will be in a better position to build and maintain their financial assets (savings, life insurance).
4. A reduction in over-indebtedness (see section 5.5 for results)
As a result of 1 to 3, it is expected that financially informed clients will be able to better balance the number of active loans and corresponding amounts of money owed to formal and informal financial service providers. As a consequence, they should be able to minimize their repayment difficulties, late repayments and defaults.
5. A reduction in clients’ vulnerability (see section 5.6 for results)
Likewise, it is expected that financially informed clients will be in a better position to meet their monthly expenses (including loan repayments) no matter if they are planned or unexpected and reduce income variability. It is hoped that the clients’ need to sell assets in times of hardship will be reduced.
This report analyses the causal relationships between the innovation and the intended outcomes in (1) to (5) without imposing ad-hoc relationships within the outcomes. As the impact of the training on risk management and microinsurance cannot be measured with a single indicator, sets of indicators will be used for each of the intended outcomes in the empirical analysis below.
6
4. Surveys, data and evaluation methodology
4.1 Surveys and data
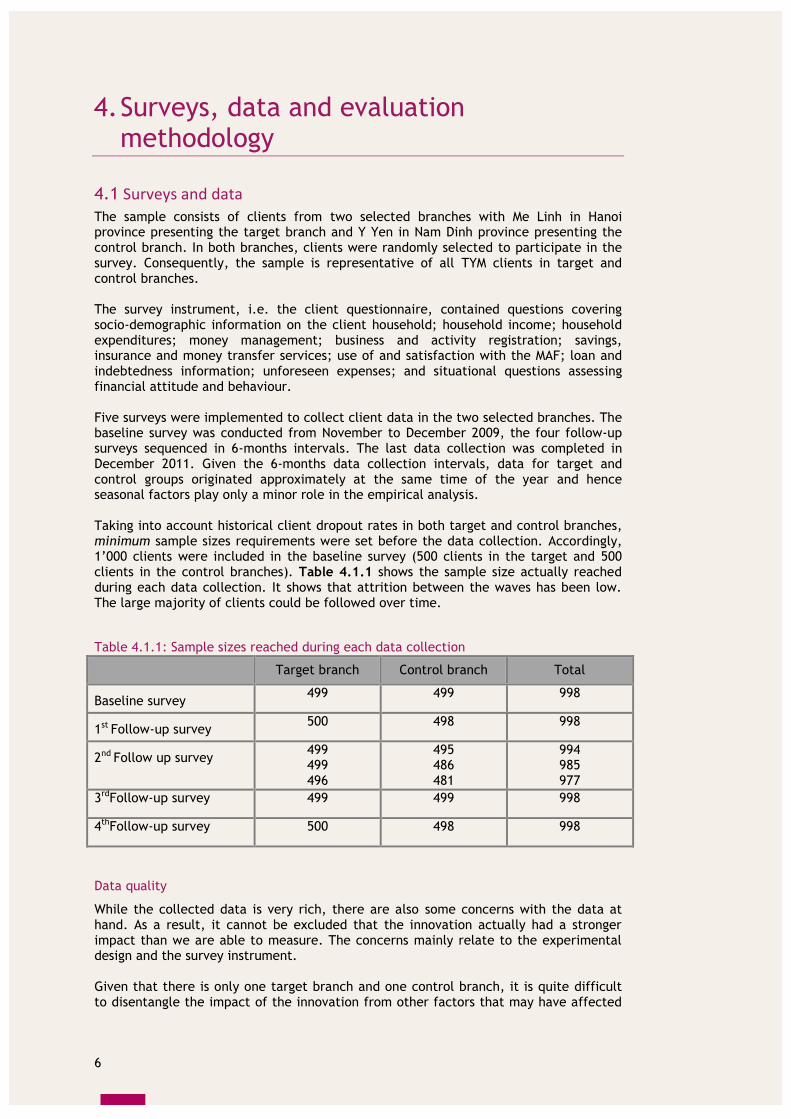
The sample consists of clients from two selected branches with Me Linh in Hanoi province presenting the target branch and Y Yen in Nam Dinh province presenting the control branch. In both branches, clients were randomly selected to participate in the survey. Consequently, the sample is representative of all TYM clients in target and control branches. The survey instrument, i.e. the client questionnaire, contained questions covering socio-demographic information on the client household; household income; household expenditures; money management; business and activity registration; savings, insurance and money transfer services; use of and satisfaction with the MAF; loan and indebtedness information; unforeseen expenses; and situational questions assessing financial attitude and behaviour. Five surveys were implemented to collect client data in the two selected branches. The baseline survey was conducted from November to December 2009, the four follow-up surveys sequenced in 6-months intervals. The last data collection was completed in December 2011. Given the 6-months data collection intervals, data for target and control groups originated approximately at the same time of the year and hence seasonal factors play only a minor role in the empirical analysis. Taking into account historical client dropout rates in both target and control branches, minimum sample sizes requirements were set before the data collection. Accordingly, 1’000 clients were included in the baseline survey (500 clients in the target and 500 clients in the control branches). Table 4.1.1 shows the sample size actually reached during each data collection. It shows that attrition between the waves has been low. The large majority of clients could be followed over time.
Table 4.1.1: Sample sizes reached during each data collection
Target branch Control branch Total
Baseline survey 499 499 998
1st Follow-up survey 500 498 998
2nd Follow up survey 499 499 496
495 486 481
994 985 977
3rdFollow-up survey 499 499 998
4thFollow-up survey 500 498 998
Data quality
While the collected data is very rich, there are also some concerns with the data at hand. As a result, it cannot be excluded that the innovation actually had a stronger impact than we are able to measure. The concerns mainly relate to the experimental design and the survey instrument. Given that there is only one target branch and one control branch, it is quite difficult to disentangle the impact of the innovation from other factors that may have affected
7
the intended outcomes (see appendix A3 for two examples). To be more specific: It is quite possible that a positive effect occurred as a consequence of the innovation, but that it was overlaid by some unobserved factor in the control branch. One solution would be to increase the number of target and control branches to average out this unobserved factors. Ideally, the assignment to target and control branches takes place through a randomized control trial, which offers the most credible approach to measuring the impact of such an innovation. The survey instrument also raises some concerns, in particular with respect to content validity. For example, does the measurement of a concept, such as financial attitude, really capture the concept in all its dimensions? In psychology, attitude is defined as a positive or negative evaluation of people, objects, events, activities, ideas etc. This implies that a questionnaire, which attempts to elicit financial attitude, needs to check positive and negative messages to understand the full effect of financial education. In the case of TYM, the questionnaire asks with respect to savings:
When things are going well, I try to put money aside to see me through difficult times.
In addition to this negative reference event, it should also ask for the positive reference event like “When things are going well, I try to put money aside for happy future events” which the questionnaire omitted. Furthermore, if such questions were included, they could either be asked to the same individual or randomized so that the former question is asked to half of the clients while the latter question is asked to the other half of the clients to get an average effect for all clients.4
4.2 Evaluation methodology
This evaluation employs a difference-in-difference (DiD) methodology to evaluate the impact of the financial education programme. In a nutshell, it compares changes in the target group before and after the implementation of the innovation to changes in the control group before and after the implementation. Given that the innovation works and that the experimental design is clean, one should see a change in outcomes in the target group (because there is an innovation) but no change in the control group (because there is no innovation).5 The difference between the changes in the two groups is then the effect of the innovation on a particular outcome. Appendix A1 discusses the evaluation methodology in detail. In addition, appendix A2 illustrates the DiD methodology with an example and section 4.1 plus appendix A3 describe the limitations of the research design.
4.3 Household characteristics at baseline
For a better credibility of the empirical analysis, the target and control groups must be as similar as possible before the implementation of the innovation. The sample of the baseline survey consisted of 998 clients (499 in target branch and 499 in control branch); all of them were female clients. Table 4.3.1 shows some descriptive statistics on clients and client households at baseline.
4 Given that the order of the questions may influence the response it may make sense not to ask both
questions to the same individual. In general, research in decision theory shows that individuals treat gains and losses differently. In particular, individuals tend to strongly prefer avoiding losses to acquiring gains.
5 To be more precise: There may be changes in target and control branch. However, if they are unrelated
to the innovation these changes must be the same for both groups (common trend assumption).
8
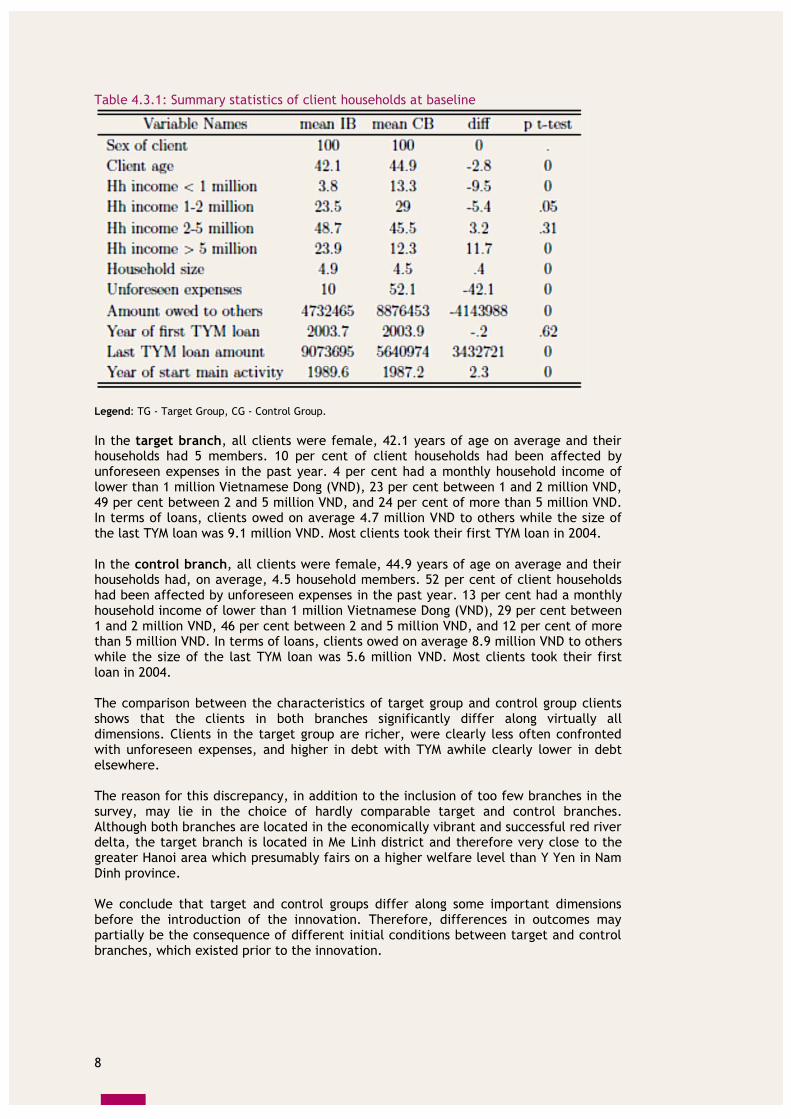
Table 4.3.1: Summary statistics of client households at baseline
Legend: TG - Target Group, CG - Control Group. In the target branch, all clients were female, 42.1 years of age on average and their households had 5 members. 10 per cent of client households had been affected by unforeseen expenses in the past year. 4 per cent had a monthly household income of lower than 1 million Vietnamese Dong (VND), 23 per cent between 1 and 2 million VND, 49 per cent between 2 and 5 million VND, and 24 per cent of more than 5 million VND. In terms of loans, clients owed on average 4.7 million VND to others while the size of the last TYM loan was 9.1 million VND. Most clients took their first TYM loan in 2004. In the control branch, all clients were female, 44.9 years of age on average and their households had, on average, 4.5 household members. 52 per cent of client households had been affected by unforeseen expenses in the past year. 13 per cent had a monthly household income of lower than 1 million Vietnamese Dong (VND), 29 per cent between 1 and 2 million VND, 46 per cent between 2 and 5 million VND, and 12 per cent of more than 5 million VND. In terms of loans, clients owed on average 8.9 million VND to others while the size of the last TYM loan was 5.6 million VND. Most clients took their first loan in 2004. The comparison between the characteristics of target group and control group clients shows that the clients in both branches significantly differ along virtually all dimensions. Clients in the target group are richer, were clearly less often confronted with unforeseen expenses, and higher in debt with TYM awhile clearly lower in debt elsewhere. The reason for this discrepancy, in addition to the inclusion of too few branches in the survey, may lie in the choice of hardly comparable target and control branches. Although both branches are located in the economically vibrant and successful red river delta, the target branch is located in Me Linh district and therefore very close to the greater Hanoi area which presumably fairs on a higher welfare level than Y Yen in Nam Dinh province. We conclude that target and control groups differ along some important dimensions before the introduction of the innovation. Therefore, differences in outcomes may partially be the consequence of different initial conditions between target and control branches, which existed prior to the innovation.
9
5. Evaluation Results
This chapter summarises the analytical results from the application of the difference-in-difference methodology and illustrates them through representative graphs.
5.1 Understanding of and satisfaction with the MAF
The survey questionnaire asked clients about their knowledge of and satisfaction with the Mutual Assistance Fund (MAF). Detailed analytical results are shown in table A4.7 in appendix A4. Below, we first present the summary results regarding client understanding of the terms of the MAF and second, the results regarding their satisfaction with the MAF.
Client understanding of the MAF
The MAF is mandatory and hence covers all TYM clients. However, are clients aware of that coverage? The survey found that nearly 100 per cent of clients in both target and control branches know about the MAF coverage across all waves. Asking about which services are covered by the MAF, we find a similar response. Nearly 100 per cent of clients are aware that costs related to hospitalization and deaths of family members are covered. Findings between target and control groups hardly differ. Control questions that asked clients whether household and business assets and vehicle damage are covered yield less than 2.5 per cent yes, and therefore wrong, answers. We conclude that clients understand the terms of the MAF well in both target and control groups. This equally applies to all waves.
Client satisfaction with the MAF
Satisfaction with the risks covered by the MAF is high: 87 per cent of the target group clients answered that they were “very satisfied” or “satisfied” at baseline. This percentage increased to 97 per cent in the first follow-up survey and remained close to 100 per cent through the end of the research period. In the control group, satisfaction was high from the very beginning: 98 per cent of clients were satisfied at baseline. Satisfaction remained close to 100 per cent for all subsequent waves. Satisfaction with the persons covered by the MAF evolved similar: 87 per cent of the target group clients answered that they were “very satisfied” or “satisfied” at baseline. This percentage increased to 99 per cent in the first follow-up survey. It remained close to 100 per cent through the end of the research period with the exception of the third follow-up survey when it dropped to 95 per cent but went up to 98 per cent in the final wave. In the control group, satisfaction was high from the very beginning: 98 per cent were satisfied at the baseline. For all following waves satisfaction remained close to 100 per cent with the exception of the last follow-up survey where it dropped to 96 per cent. Clients also seemed satisfied with the premium that they paid for being covered by the MAF. In both target and control groups more than 96 per cent were satisfied for all follow-up waves. Nearly the same satisfaction rates apply out for the premium collection method, the explanation of the product and the customer service. The satisfaction with the amount of reimbursement fluctuated more strongly. For the target group it varied between 74 and 93 per cent and for the control group between 87 and 100 per cent. We conclude that overall client satisfaction with the MAF is very high in both target and control groups. This finding equally applies to all waves.
10
5.2 Impact on financial attitude
Financial attitude measures a client’s state of mind on money issues and the use of financial services. As such, financial attitude reflects a client’s opinions and judgements and can change over time. The action research investigated financial attitudes in two broad categories: debt-related and precaution-related.6 Clients were asked to which extent they agreed or disagreed with given statements covering these two categories.7 The results of 19 variables are shown in table 5.2.1. The symbol “+” indicates a significant increase in the number of clients in the target group agreeing with certain financial attitudes as compared to the control group after the introduction of the innovation, the symbol “o” indicates an insignificant change and the symbol “-“ indicates a significant decrease in the number of clients in the target group agreeing with certain financial attitudes as compared to the control group. Looking at the impact, six of the outcome variables show a significant increase, five an insignificant change and eight a significant decrease. In addition to showing the actual impact results, table 5.2.1 also compares them to intended results in column 1 to see whether the observed effects are going in the expected direction. Here we see that the majority of variables, all together 13, follow the expected trend while only one goes against expectations. The remaining five variables did neither follow nor oppose the expected trend.
Table 5.2.1: Impact of the training programme on debt- and precaution-related financial attitudes
Impact
Intent Actual
+ - - + - + - + - + + - - - -
o - o + - + - + - + + - - - -
Debt-related attitudes / opinions When things are going well, I try to put money aside to see me through difficult times. When your income is low, it is not necessary to keep detailed track of your monthly income and expenses. It is not necessary to analyze which expenses are the most important for the family because, anyway, there is not enough money to pay for everything. I try to plan my household budget for a period longer than a year. I cannot keep an emergency reserve because my income is so low that there is never any money left. I am able to put aside enough money for emergency expenses to make their impact less severe. There is no need to worry in advance and budget for emergencies. It is worth saving even if your income is low. It does not make sense to save since you do not know what tomorrow will bring. Pre-caution related attitudes / opinions I try to save these days, even if these are just small amounts. Even small savings can improve your stability and security in the future. It is impossible to save because there are always expenses coming up that force you to use your savings. I don’t need insurance because nothing is happening. Insurance is expensive. I don’t need insurance to solve own problems.
6
Based on Matul, Michal (2010): “Financial Behaviours and Vulnerability to Poverty in Transition Context”. 7
To simplify the econometric analysis theses variables were aggregated in binary variables if clients
answer “I definitely agree” and “I rather agree” and zero if they answer “I rather disagree” and “I definitely disagree”.
11
Impact
Intent Actual
+ - + -
o + o o
Insurance companies are reliable. We can achieve our goals more quickly with borrowed money. We consider a loan only as a last resort. Insurance benefit is not much.
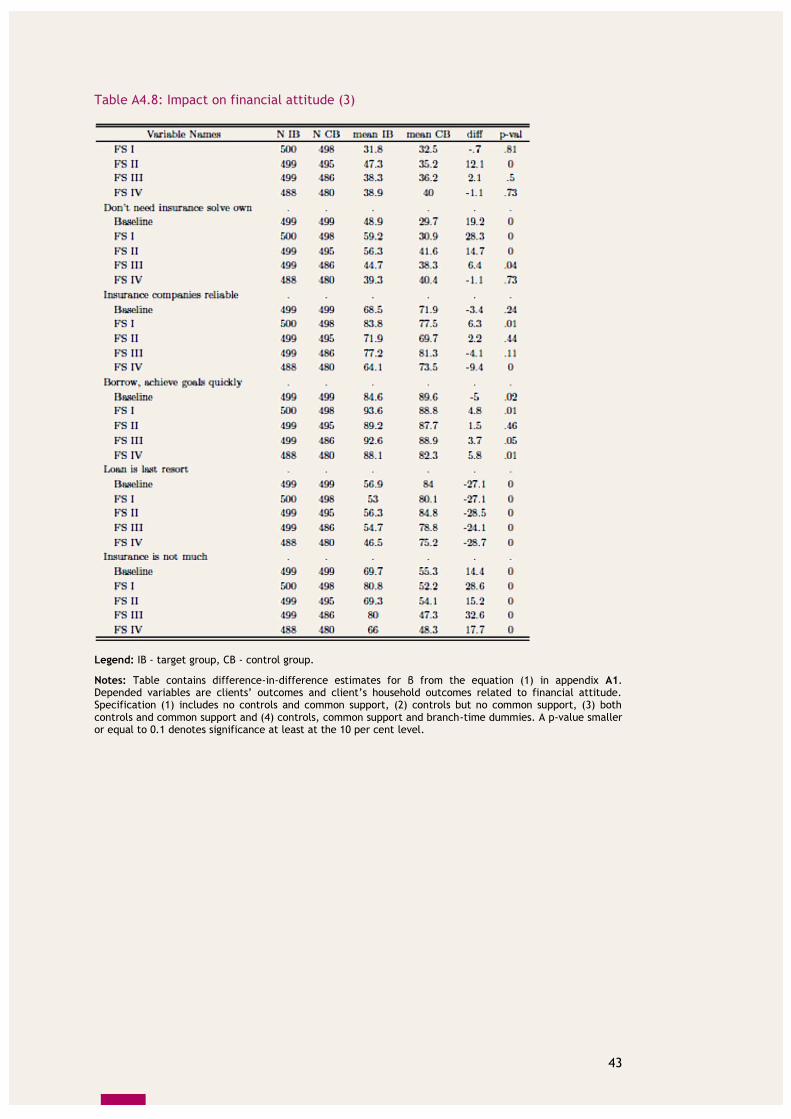
In addition to comparing actual results to intended effects in table 5.2.1, it is interesting to explore the detailed analytical results which are presented in table A4.8 in appendix A4. It presents the percentage changes for the target group relative to the control group. The strongest findings – meaning that there is a significantly higher change in agreement for clients in the target group as compared to clients in the control group after the introduction of the innovation – exist for the following statements:
I am able to put aside enough money for emergency expenses to make their impact less severe (22 per cent),
I try to plan my household budget for a period longer than a year (17 per cent),
It is worth saving even if your income is low (10 per cent),
I try to save these days, even if these are just small amounts (10 per cent), and
Even small savings can improve your stability and security in the future (5 per cent).
Further, we find a 9 per cent increase in agreement with the statement We can achieve our goals more quickly with borrowed money in the target relative to the control group. Given that fewer clients in the target group took a loan to repay another loan we interpret this as a positive outcome. We find additional strong results – this time meaning that clients in the target group disagree significantly more often as compared to the control group – for the following statements:
It does not make sense to save since you do not know what tomorrow will bring (17 per cent),
I cannot keep an emergency reserve because my income is so low that there is never any money left (by 17 per cent),
There is no need to worry in advance and budget for emergencies (16 per cent),
When your income is low, it is not necessary to keep detailed track of your monthly income and expenses (15 per cent), and
It is not necessary to analyze which expenses are the most important for the family because, anyway, there is not enough money to pay for everything (4 per cent).
As an illustration, figure 5.2.1 shows the development of the variable It is not necessary to analyse expenses. We see that the percentage of clients in the target group who agree the statement fluctuates across the waves with two strong decreases between baseline and the first follow-up survey as well as between the second and third follow-up survey. In contrast, it only slightly decreases for the control group. The net effect is a clear decrease in the target group as compared to the control group.
12
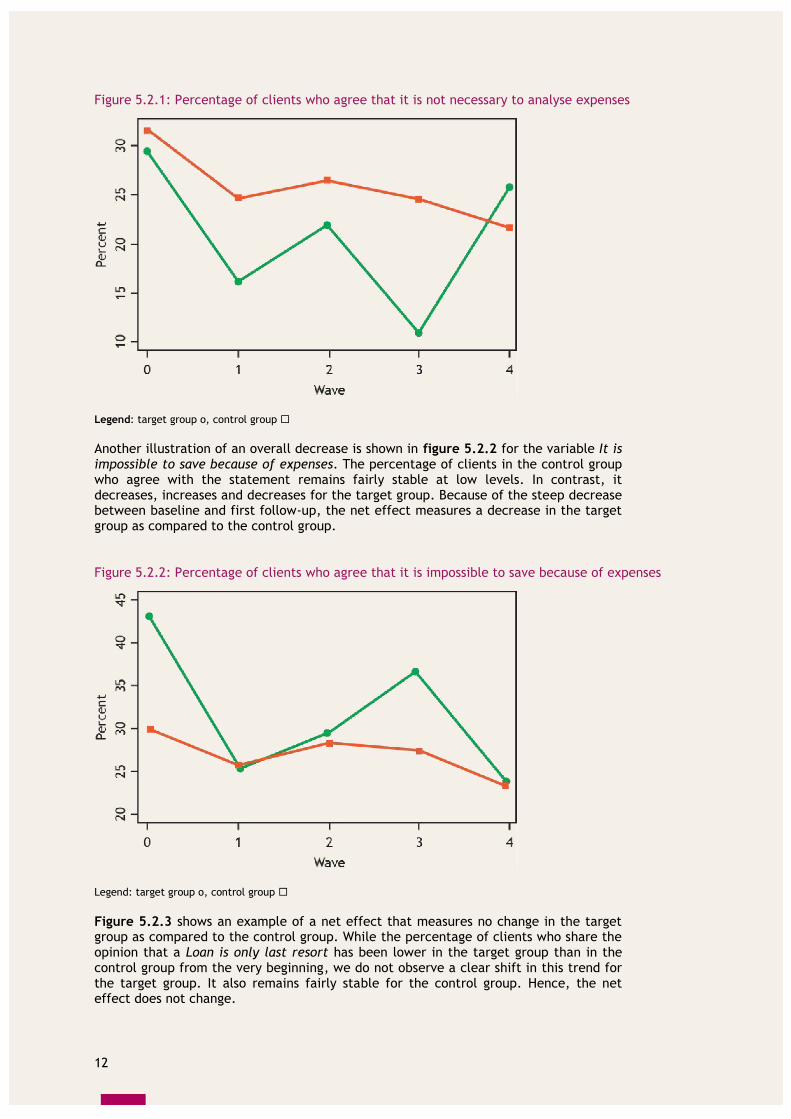
Figure 5.2.1: Percentage of clients who agree that it is not necessary to analyse expenses
Legend: target group o, control group Another illustration of an overall decrease is shown in figure 5.2.2 for the variable It is impossible to save because of expenses. The percentage of clients in the control group who agree with the statement remains fairly stable at low levels. In contrast, it decreases, increases and decreases for the target group. Because of the steep decrease between baseline and first follow-up, the net effect measures a decrease in the target group as compared to the control group.
Figure 5.2.2: Percentage of clients who agree that it is impossible to save because of expenses
Legend: target group o, control group Figure 5.2.3 shows an example of a net effect that measures no change in the target group as compared to the control group. While the percentage of clients who share the opinion that a Loan is only last resort has been lower in the target group than in the control group from the very beginning, we do not observe a clear shift in this trend for the target group. It also remains fairly stable for the control group. Hence, the net effect does not change.
13
Figure 5.2.3: Percentage of clients who agree that loan is only last resort
Legend: target group o, control group Lastly, fewer clients in the target group think that There is no need to worry in advance and budget for emergencies after the introduction of the innovation. This result may seem counterintuitive. One possible explanation is that clients in the target group are wealthier and therefore better able to self-insure as compared to clients in the control group. This might also explain why fewer clients in the target group think that Insurance benefit is not much. Overall, most outcome variables suggest that the training on risk management and microinsurance had a very strong, and desired, impact on TYM clients’ financial attitude.
5.3 Impact on risk management strategies
While chapter 5.2 showed how the financial attitude of clients changed over time, the following chapter presents the impact of the risk management and microinsurance training on the financial behaviour and the risk management strategies that clients engage in. This outcome category was tested with a set of situational questions on actual behaviour as well as on variation in income sources of clients. These included, for example, questions regarding clients’ planning horizons or how unforeseen expenses are covered with a special focus on the Mutual Assistance Fund (MAF). The results of 9 risk management variables are shown in Table 4.1 5.3.1 in column 2 and compared to intended impact in column 1. Similar to sub-section 5.2, the symbol “+” indicates a significant increase in the number of clients in the target group agreeing with certain financial behaviour as compared to the control group after the introduction of the innovation, the symbol “o” indicates an insignificant change and the symbol “-“ indicates a significant decrease in the number of clients in the target group agreeing with certain financial behaviour as compared to the control group. Detailed analytical results for the impact of the innovation on risk management strategies can be found in Table A.4.9 in appendix A4.
14
Table 5.3.1: Impact of the client training on risk management and microinsurance on risk management strategies
Impact
Intent Actual
+ + - - - + + - -
+ o - o + + - - -
We have planning horizon of more than a month (household). We have planning horizon of more than a month (business). We run out of money before making income. We do not have enough money left to meet fixed monthly payments. Major seasonal expenses have a negative impact on our living standard in the month when they occur because we do not budget for them in advance. We set aside money for future emergencies. At the end of the month, we have some money left that can be put into savings or spent on extra purchases. We give in to the temptation and buy things, which we later regret. When we run out of money, we borrow or buy on credit and pay debts a later.
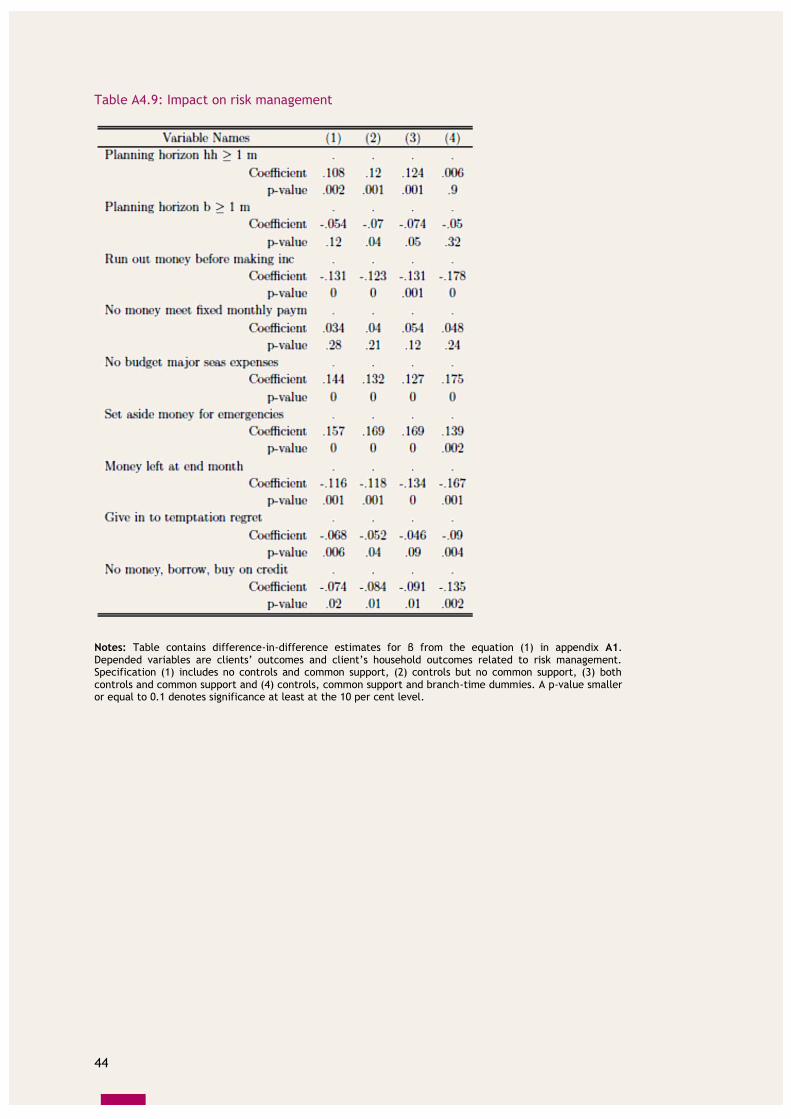
In summary, we find that five variables follow the expected trend while two show counterintuitive results. Further, two variables neither follow the expected trend nor do they counter it. Looking more closely, we see that in the target group as compared to the control group clients significantly less often agree with the following situations: We run out of money before making income, We give in to the temptation and buy things which we later regret and when we run out of money, we borrow or buy on credit and pay debts later after the introduction of the innovation. Furthermore, clients in the target group more often agree with the following statements: We have planning horizon of more than a month (household) and We set aside money for future emergencies. While the innovation was expected to create these impacts, the increase in the ability to set aside money for emergencies is the most remarkable result with a plus of 17 per cent followed by a 13 percent increase in clients with longer planning horizons as well as a 13 per cent decrease in clients running out of money before making income. While the former outcomes were intended, we also find counterintuitive results as clients in the target group less often state that At the end of the month, we have some money left that can be put into savings or spent on extra purchases (decrease of 13 per cent) after the introduction of the innovation. We also find more target group clients agreeing with the statement Major seasonal expenses have a negative impact on our living standard in the month when they occur because we do not budget for them in advance (plus 13 per cent), although we do not know whether this has to be interpreted as higher awareness among target group clients that seasonal expenses constrain the budget (due to the training) or that target group clients did manage to cyclically balance their budget with respect to seasonal expenses (despite the training). The training did not have any impact on the following two variables: We have planning horizon of more than a month (business) and We do not have enough money left to meet fixed monthly payments. The below two figures graphically illustrate some of the findings. Figure 5.3.1 shows the percentage of clients agreeing with the statement that We run out of money before making income. We see a clear decrease for the target group between baseline and first follow-up survey. Thereafter, the percentage remains at a low level. The control group shows a very slight downward trend, which, however, does not show any clear shift around the introduction of the innovation. This is expected as the control group did not receive the training. Comparing target and control groups we thus find a significant decrease of 13 per cent. The innovation had a strong impact on this variable.
15
Figure 5.3.1: Percentage of clients who run out of money before making income
Legend: target group o, control group
Figure 5.3.2 shows the development of the variable We have money left at the end of the month. For the target group, we observe an increase between baseline and first follow-up survey which is followed by a slight decrease and another increase. In the control group, we find a strong increase between baseline and first and second follow-up surveys, while the variable remains stable thereafter. Comparing target and control groups we thus find a decrease of about 13 per cent which is an unintended and counterintuitive result.
Figure 5.3.2: Percentage of clients having money left at the end of the month
Legend: target group o, control group
In summary, most of the risk management related outcome variables show that the TYM client training on risk management and microinsurance had a positive impact on client risk management strategies.
16
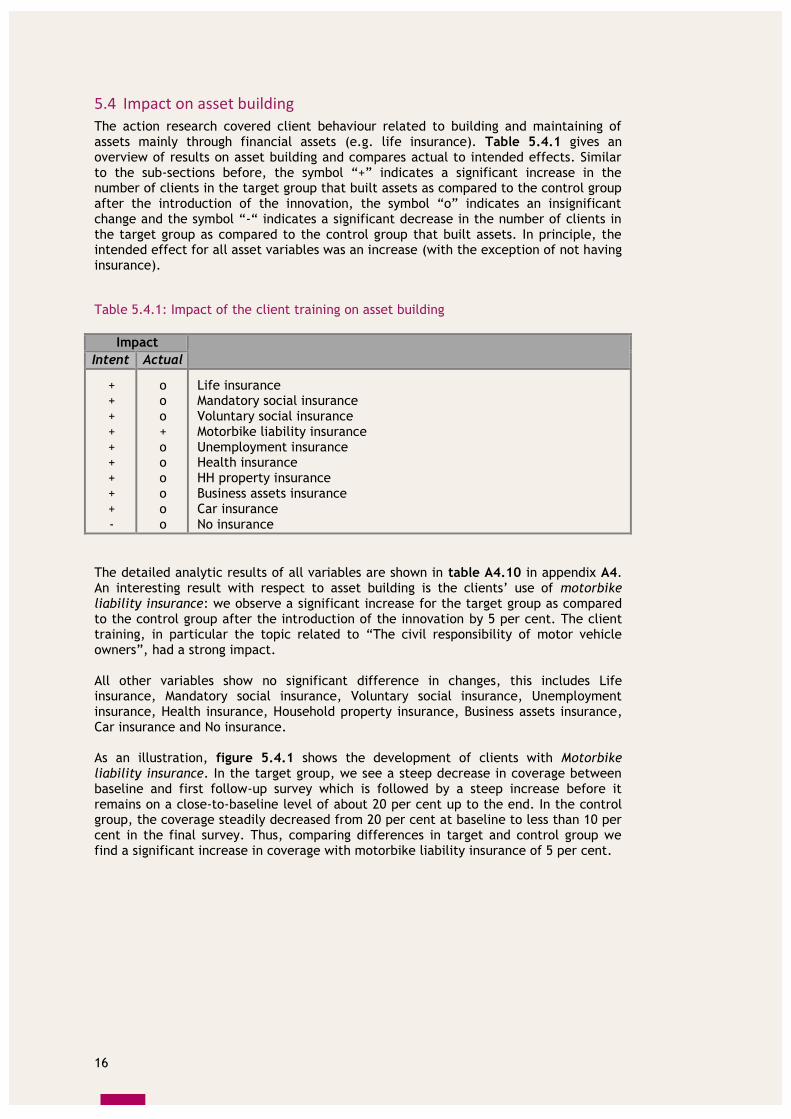
5.4 Impact on asset building
The action research covered client behaviour related to building and maintaining of assets mainly through financial assets (e.g. life insurance). Table 5.4.1 gives an overview of results on asset building and compares actual to intended effects. Similar to the sub-sections before, the symbol “+” indicates a significant increase in the number of clients in the target group that built assets as compared to the control group after the introduction of the innovation, the symbol “o” indicates an insignificant change and the symbol “-“ indicates a significant decrease in the number of clients in the target group as compared to the control group that built assets. In principle, the intended effect for all asset variables was an increase (with the exception of not having insurance).
Table 5.4.1: Impact of the client training on asset building
Impact
Intent Actual
+ + + + + + + + + -
o o o + o o o o o o
Life insurance Mandatory social insurance Voluntary social insurance Motorbike liability insurance Unemployment insurance Health insurance HH property insurance Business assets insurance Car insurance No insurance
The detailed analytic results of all variables are shown in table A4.10 in appendix A4. An interesting result with respect to asset building is the clients’ use of motorbike liability insurance: we observe a significant increase for the target group as compared to the control group after the introduction of the innovation by 5 per cent. The client training, in particular the topic related to “The civil responsibility of motor vehicle owners”, had a strong impact. All other variables show no significant difference in changes, this includes Life insurance, Mandatory social insurance, Voluntary social insurance, Unemployment insurance, Health insurance, Household property insurance, Business assets insurance, Car insurance and No insurance. As an illustration, figure 5.4.1 shows the development of clients with Motorbike liability insurance. In the target group, we see a steep decrease in coverage between baseline and first follow-up survey which is followed by a steep increase before it remains on a close-to-baseline level of about 20 per cent up to the end. In the control group, the coverage steadily decreased from 20 per cent at baseline to less than 10 per cent in the final survey. Thus, comparing differences in target and control group we find a significant increase in coverage with motorbike liability insurance of 5 per cent.
17
Figure 5.4.1: Percentage of clients with motorbike liability insurance
Legend: target group o, control group While results for other variables were not significant in statistical terms, some trends are nonetheless interesting. Figure 5.4.2 shows the percentage of clients that were covered by Life insurance. Compared to the baseline survey, we see a steep increase in coverage for the target group between baseline and second follow-up survey which was followed by a slight decline. For the control group, which started at higher levels than the target group, coverage decreased from roughly 6 per cent in the baseline to roughly 4 per cent in the last survey. Thus, comparing the difference in changes between target and control groups we find an increase in life insurance coverage; however, it is not significant in statistical terms.
Figure 5.4.2: Percentage of clients with life insurance
Legend: target group o, control group
18
5.5 Impact on over-indebtedness/multiple borrowing
Financially informed clients are expected to reduce the number of their active loans and corresponding amounts of money owed to formal and informal financial service providers as a result of the innovation. They should also be able to minimize their repayment difficulties, late repayments and defaults. Table 5.5.1 gives an overview of the results of six variables related to over-indebtedness and multiple borrowing following the same structure as before: the table presents actual impact results (column 2) and compares to intended effects (column 1). The symbol “+” indicates a significant increase in the number of clients in the target group showing a certain indebtedness-related financial behaviour as compared to the control group after the introduction of the innovation, the symbol “o” indicates an insignificant change and the symbol “-“ indicates a significant decrease. In principle, the intended effect for all indebtedness-related variables was a decrease.
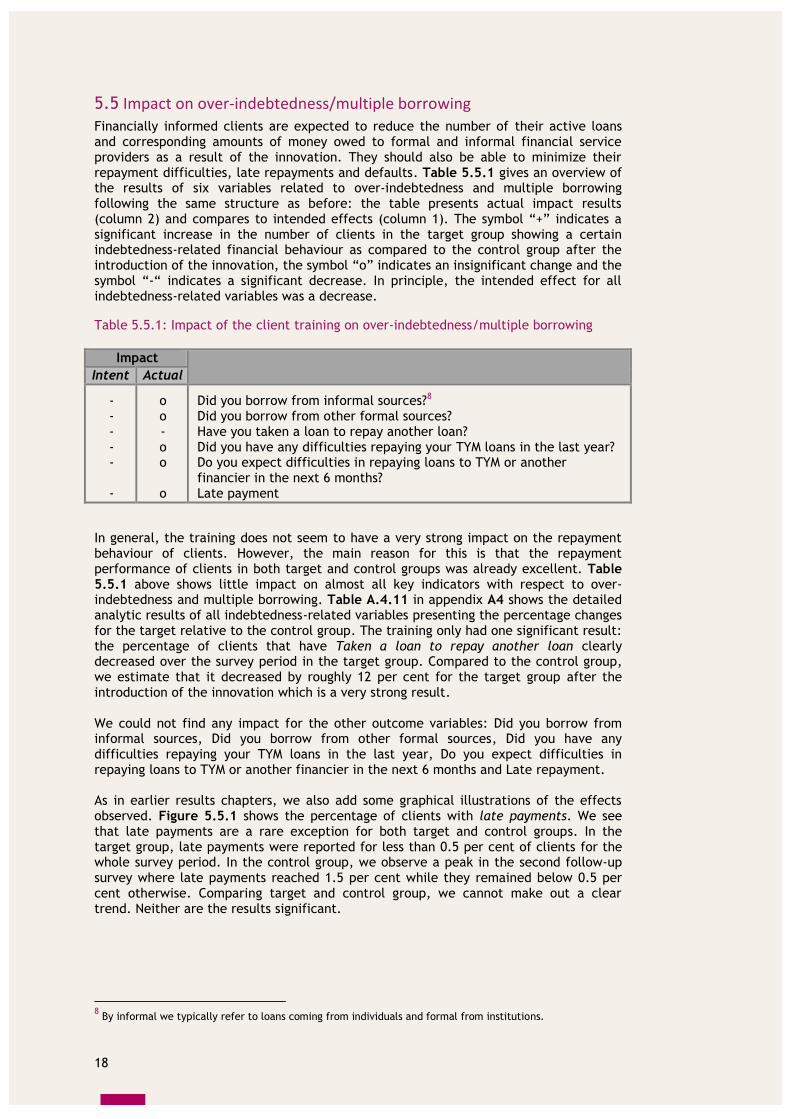
Table 5.5.1: Impact of the client training on over-indebtedness/multiple borrowing
Impact
Intent Actual
- - - - - -
o o - o o o
Did you borrow from informal sources?8 Did you borrow from other formal sources? Have you taken a loan to repay another loan? Did you have any difficulties repaying your TYM loans in the last year? Do you expect difficulties in repaying loans to TYM or another financier in the next 6 months? Late payment
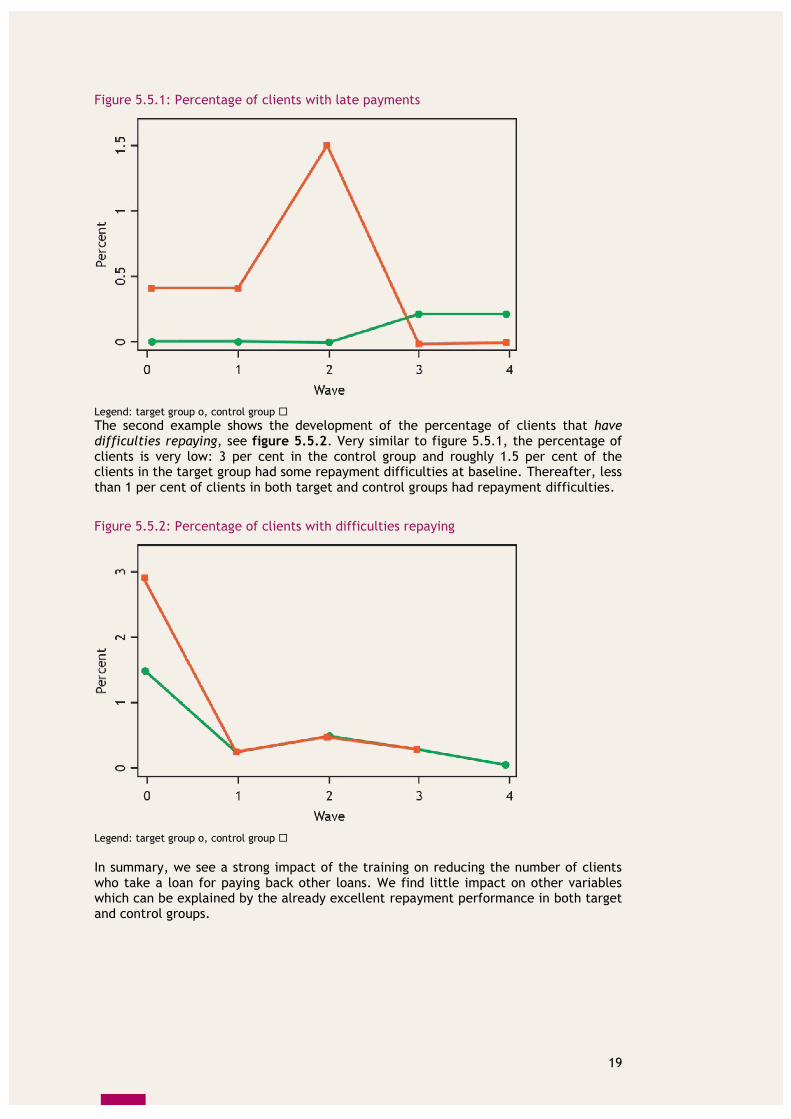
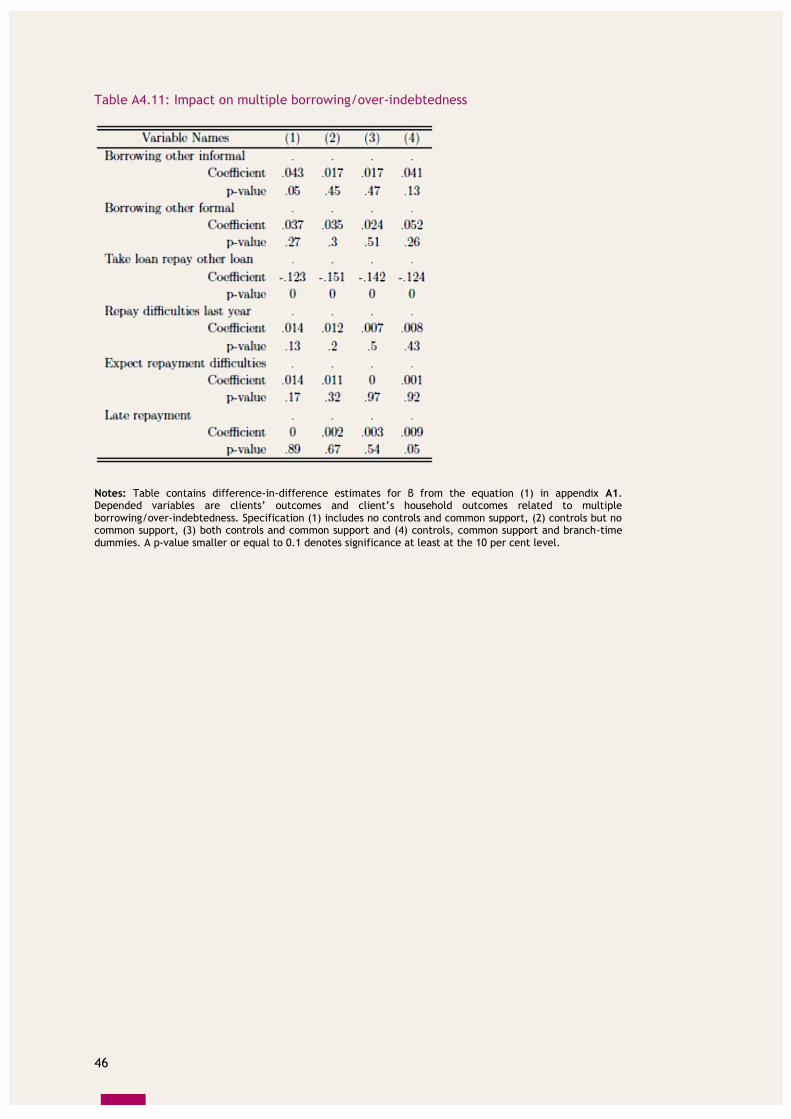
In general, the training does not seem to have a very strong impact on the repayment behaviour of clients. However, the main reason for this is that the repayment performance of clients in both target and control groups was already excellent. Table 5.5.1 above shows little impact on almost all key indicators with respect to over-indebtedness and multiple borrowing. Table A.4.11 in appendix A4 shows the detailed analytic results of all indebtedness-related variables presenting the percentage changes for the target relative to the control group. The training only had one significant result: the percentage of clients that have Taken a loan to repay another loan clearly decreased over the survey period in the target group. Compared to the control group, we estimate that it decreased by roughly 12 per cent for the target group after the introduction of the innovation which is a very strong result. We could not find any impact for the other outcome variables: Did you borrow from informal sources, Did you borrow from other formal sources, Did you have any difficulties repaying your TYM loans in the last year, Do you expect difficulties in repaying loans to TYM or another financier in the next 6 months and Late repayment. As in earlier results chapters, we also add some graphical illustrations of the effects observed. Figure 5.5.1 shows the percentage of clients with late payments. We see that late payments are a rare exception for both target and control groups. In the target group, late payments were reported for less than 0.5 per cent of clients for the whole survey period. In the control group, we observe a peak in the second follow-up survey where late payments reached 1.5 per cent while they remained below 0.5 per cent otherwise. Comparing target and control group, we cannot make out a clear trend. Neither are the results significant.
8 By informal we typically refer to loans coming from individuals and formal from institutions.
19
Figure 5.5.1: Percentage of clients with late payments
Legend: target group o, control group The second example shows the development of the percentage of clients that have difficulties repaying, see figure 5.5.2. Very similar to figure 5.5.1, the percentage of clients is very low: 3 per cent in the control group and roughly 1.5 per cent of the clients in the target group had some repayment difficulties at baseline. Thereafter, less than 1 per cent of clients in both target and control groups had repayment difficulties.
Figure 5.5.2: Percentage of clients with difficulties repaying
Legend: target group o, control group In summary, we see a strong impact of the training on reducing the number of clients who take a loan for paying back other loans. We find little impact on other variables which can be explained by the already excellent repayment performance in both target and control groups.
20
5.6 Impact on vulnerability
The action research measured vulnerability by the clients’ capacity to cover their monthly expenses (planned or unexpected), by income variability and the clients’ need to sell assets in times of hardship. Table 5.6.1 gives an overview of the results of seven vulnerability variables following the same structure as before: the table presents actual impact results (column 2) and compares to intended effects (column 1). The symbol “+” indicates a significant increase in the number of clients in the target group showing a certain vulnerability-related financial behaviour as compared to the control group after the introduction of the innovation, the symbol “o” indicates an insignificant change and the symbol “-“ indicates a significant decrease in the number of clients in the target group showing a certain vulnerability-related financial behaviour as compared to the control group. Detailed analytic results of all variables are presented in table A4.12 in appendix A4.
Table 5.6.1: Impact of the client training on vulnerability
Impact
Intent Actual
+ + + + - + -
+ o o o - o o
Did household income cover all household expenses in the last 12 months? To what extent could client cover unforeseen household expenses in the last 12 months? To what extent could client cover unforeseen business expenses in the last 12 months? Used savings to cover unforeseen expenses Sold assets to cover unforeseen expenses Used microinsurance to cover unforeseen expenses Sacrificed household expenses to cover unforeseen expenses
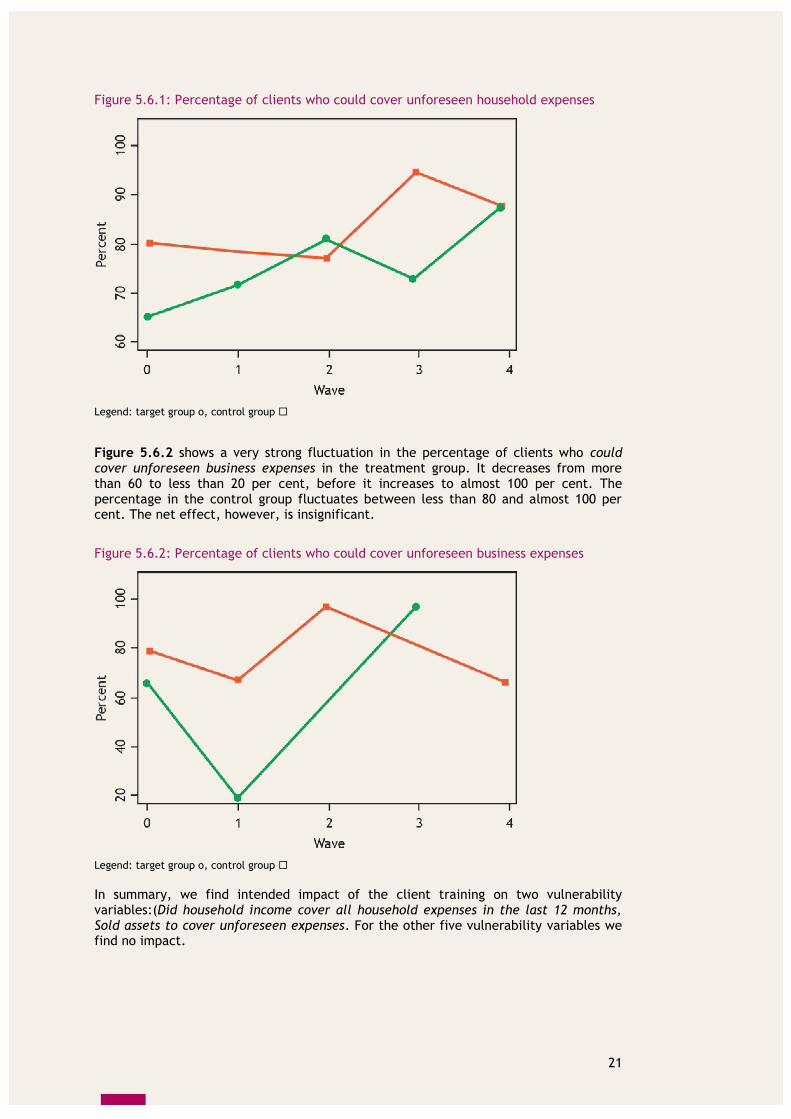
Comparing the results in the target and control groups, we find that two variables develop in the intended direction while five show neither positive nor negative change. None of the variables shows unintended results. The percentage of clients who positively responded to the question Did household income cover all household expenses in the last 12 months increased significantly by 3.3 per cent in the target group as compared to the control group after the introduction of the innovation. In addition, we find that significantly fewer households, approximately 10 per cent, sold assets to cover unforeseen expenses. These results show that the innovation created the intended impact. For the remaining five variables, results are not significant and hence we cannot report any impact of the training on them. To end this subchapter, we graphically illustrate the observed effects for the percentage of clients that could cover unforeseen household or business expenses. Figure 5.6.1 shows that both target and control groups started at different percentages at baseline for the question Did household cover unforeseen expenses in the last 12 months but closed at the same level at the end of the research. The target group increased from below 70 per cent to a little more than 80 per cent in the second follow-up survey, and then dropped slightly before increasing to 90 percent. The control group started at roughly 80 per cent which remained fairly constant through the second follow-up survey after which it increased to more than 90 per cent and slightly dropped again in the last survey. However, comparing target and control group results we find no significant impact.
21
Figure 5.6.1: Percentage of clients who could cover unforeseen household expenses
Legend: target group o, control group
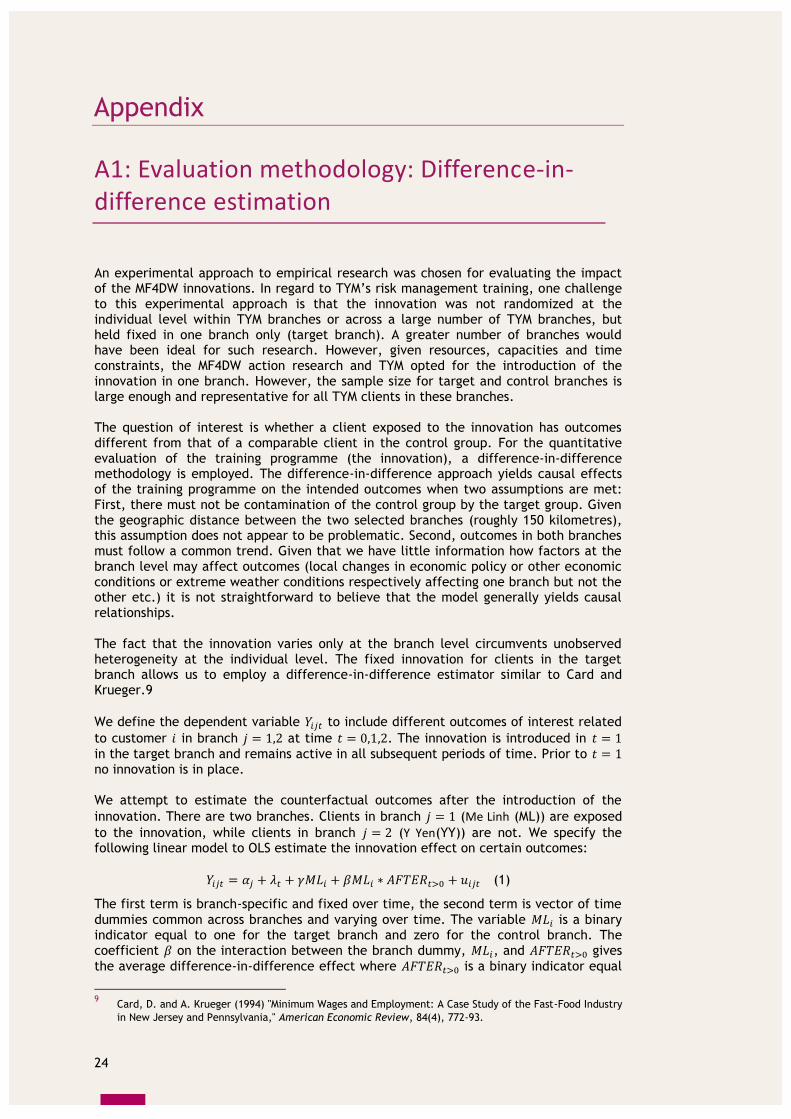
Figure 5.6.2 shows a very strong fluctuation in the percentage of clients who could cover unforeseen business expenses in the treatment group. It decreases from more than 60 to less than 20 per cent, before it increases to almost 100 per cent. The percentage in the control group fluctuates between less than 80 and almost 100 per cent. The net effect, however, is insignificant.
Figure 5.6.2: Percentage of clients who could cover unforeseen business expenses
Legend: target group o, control group In summary, we find intended impact of the client training on two vulnerability variables:(Did household income cover all household expenses in the last 12 months, Sold assets to cover unforeseen expenses. For the other five vulnerability variables we find no impact.
22
6. Conclusion and recommendations
This report presented findings from an evaluation of an integrated client training on risk management and microinsurance that the MFI TYM introduced in Vietnam. The training put a special emphasis on the Mutual Assistance Fund (MAF) that TYM offers to its clients. The evaluation employed a difference-in-difference methodology to estimate the effects of the training on client livelihood outcomes including a change in financial attitude and behaviour, building and maintaining of assets, vulnerability, and over-indebtedness and multiple borrowing of clients. Overall, the research showed that the client training did produce some of the intended results. First, data clearly demonstrated that clients understood very well the terms of the MAF and that they were also quite satisfied with the product. This applied to all waves. Second, the evaluation found that the training had very strong impact on financial attitude especially on planning and on attitudes related to savings. The percentage of clients in the target compared to the control group that agreed being able to put money aside for emergency expenses increased by a remarkable 22 per cent and the attitude towards planning household budgets for longer than a year improved by 17 per cent. Third, the training also had impact on client risk management behaviour by contributing to improving a number of situations that clients face. For example, clients who had access to the training less often ran out of money before making income than clients who did not have access to the training (decrease of 13 per cent). Interestingly, the observed change in financial attitude regarding savings and planning already also reflected in changed financial behaviour as we saw a 17 per cent increase in the ability to set aside money for emergencies as well as a 13 percent increase in clients with longer planning horizons. Fourth, the training seems to have had limited impact on asset building and multiple borrowing/ over-indebtedness. The reason, however, is that repayment rates in target and control groups had been high from the very beginning and left little room for improvement. Lastly, with respect to vulnerability outcomes we found positive impact as the ability of households to cover their expenses increased and as fewer clients sold assets to cover unforeseen expenses. However, we did not find an effect for the other vulnerability outcome variables. In summary, the evaluation showed strong impact of the integrated risk management and microinsurance training on financial attitude and risk management, some impact on vulnerability and little impact on multiple borrowing/ over-indebtedness and asset building. The analysis also showed some insignificant and some unexpected results which may be due to some issues with the experimental design of the research and the survey instrument. It is therefore possible that the innovation may have had a stronger impact than actually measured and reported in this document. Based on the overall research process and conclusions, the ILO would like to make the following recommendations to TYM regarding the future of the integrated risk management training and the Mutual Assistance Fund: 1) Continue to implement the integrated client training on risk management and
microinsurance at defined moments during interactions with clients and roll out the training to other branches;
23
2) Continue to track progress on the client level as part of TYM’s social performance agenda;
3) Monitor the quality of training delivery and regularly strengthen the risk management knowledge and training skills of TYM staff;
4) Strengthen the capacity of TYM staff to efficiently manage the Mutual Assistance Fund; and
5) Share tools, methodologies, and findings from the action research through national and international MFI networks to encourage efforts in improving clients’ risk management and to promote the concept of Decent Work.
An experimental approach to empirical research was chosen for evaluating the impact of the MF4DW innovations. In regard to TYM’s risk management training, one challenge to this experimental approach is that the innovation was not randomized at the individual level within TYM branches or across a large number of TYM branches, but held fixed in one branch only (target branch). A greater number of branches would have been ideal for such research. However, given resources, capacities and time constraints, the MF4DW action research and TYM opted for the introduction of the innovation in one branch. However, the sample size for target and control branches is large enough and representative for all TYM clients in these branches. The question of interest is whether a client exposed to the innovation has outcomes different from that of a comparable client in the control group. For the quantitative evaluation of the training programme (the innovation), a difference-in-difference methodology is employed. The difference-in-difference approach yields causal effects of the training programme on the intended outcomes when two assumptions are met: First, there must not be contamination of the control group by the target group. Given the geographic distance between the two selected branches (roughly 150 kilometres), this assumption does not appear to be problematic. Second, outcomes in both branches must follow a common trend. Given that we have little information how factors at the branch level may affect outcomes (local changes in economic policy or other economic conditions or extreme weather conditions respectively affecting one branch but not the other etc.) it is not straightforward to believe that the model generally yields causal relationships. The fact that the innovation varies only at the branch level circumvents unobserved heterogeneity at the individual level. The fixed innovation for clients in the target branch allows us to employ a difference-in-difference estimator similar to Card and Krueger.9
We define the dependent variable 𝑌𝑖𝑗𝑡 to include different outcomes of interest related
to customer 𝑖 in branch 𝑗 = 1,2 at time 𝑡 = 0,1,2. The innovation is introduced in 𝑡 = 1
in the target branch and remains active in all subsequent periods of time. Prior to 𝑡 = 1 no innovation is in place. We attempt to estimate the counterfactual outcomes after the introduction of the
innovation. There are two branches. Clients in branch 𝑗 = 1 (Me Linh (ML)) are exposed
to the innovation, while clients in branch 𝑗 = 2 (Y Yen(YY)) are not. We specify the following linear model to OLS estimate the innovation effect on certain outcomes:
The first term is branch-specific and fixed over time, the second term is vector of time
dummies common across branches and varying over time. The variable 𝑀𝐿𝑖 is a binary indicator equal to one for the target branch and zero for the control branch. The coefficient 𝛽 on the interaction between the branch dummy, 𝑀𝐿𝑖, and 𝐴𝐹𝑇𝐸𝑅𝑡>0 gives
the average difference-in-difference effect where 𝐴𝐹𝑇𝐸𝑅𝑡>0 is a binary indicator equal
9 Card, D. and A. Krueger (1994) "Minimum Wages and Employment: A Case Study of the Fast-Food Industry
in New Jersey and Pennsylvania," American Economic Review, 84(4), 772-93.
25
to one for all time periods during which the innovation was in place. This imposes the restriction that the innovation has the same effect in every period of time.
For 𝑡 = 1, the sample analog of above regression formulation of the difference-in-differences estimator yields double differences in sample means, that is the difference
in outcomes across the branches and time periods: 𝐷𝐷 = (𝑌11 − 𝑌10) − (𝑌01 − 𝑌00). We modify the basic specification in equation (1) in a number of ways to check the stability of our estimated coefficients. Our biggest concern is the possibility of omitted variables at the branch and wave level. We estimate the equation in (1) under four specifications for each outcome. First, we estimate the basic model without further controls and common support. Second, we include controls (see Table 4.3.1 for a list of controls) but no common support. Third, we include controls and restrict sample to common support. And, fourth, we include additional branch-time dummies to the latter specification. With respect to inference we present results with clustered standard.
26
A2: Evaluation methodology: Interpretation of difference-in-difference estimates
It is necessary to clarify how the impact of the innovation on intended outcomes has to be interpreted. Comparing target and control branches, we compare clients who were trained in risk management and microinsurance to those who were not. If we see a difference in outcomes comparing the two branches, then the change in clients’ financial attitude and behaviour results from an exposure to the training programme. We illustrate the difference-in-difference approach with a simple example. The exposure to the innovation is determined by being a client in the target branch after the introduction of the innovation. Table A.2.1 below is a two-by-two table for target and control branch for wave 2 and the baseline. Column (1) and (2) respectively display the mean of an outcome variable (in this case difficulties of loan repayment by clients, but it could be any other outcome variable) for the innovation and control branch for, respectively, row (A) and row (B), the second wave of the survey and the baseline.
Table A2.1. Illustration of the difference-in-difference methodology
Note: Illustration of the difference-in-difference approach using repayment difficulties. The figures presented are sample means for target branch (1) and control branch (2) for respectively wave 2 (A) and baseline (B) for the outcome variable clients with repayment difficulties (figures can be interpreted as percentage values). Single differences can be calculated as (1) - (2) for either (A) or (B) and (A) - (B) for either (1) or (2). The difference-in-difference is either (A) - (B) for (1) minus (A) - (B) for (2) or (1) - (2) for (A) minus (1) - (2) for (B). For instance, column (1) and row (A) state that 12 per cent of the clients in the target branch had repayment difficulties in wave 2. Column (1) and row (B) state that 15 per cent of the clients in the target branch had repayment difficulties in the baseline. Taking the difference (A) - (B) for column (1), we obtain -3 per cent. This is the single difference for clients with repayment difficulties in the target branch before and after the modification of the innovation. Consequently, the percentage of clients with repayment difficulties decreased over the survey period. Making the same exercise for the control branch we find that the percentage of clients with repayment difficulties stayed the same over the survey period. The single difference is 0 per cent. The difference-in-differences are now calculated as the difference between the single differences, that is -3 per cent minus 0 per cent. The difference-in-difference is thus -3 per cent. Clients in the target branch see a reduction of 3 per cent in repayment difficulties as compared to clients in the control branch after the introduction of the innovation. The idea behind this approach can be understood in an experimental context. While we should see an effect of the innovation in the target branch by looking at the difference before and after, we should not see such an effect in the control branch. The difference-in-difference should hence be driven by the first difference (before and after in the target branch) and not the second difference (before and after in the control branch).
27
A3: Limitations to the evaluation of the training programme
Although we received some qualitative reports on factors that may have affected outcomes at the branch level, the picture is not fully complete. In particular, more quantitative data on these factors would allow for a better analysis. Consequently, results presented in appendix A4 may not generally present causal relationships. Just to give some examples of such factors:
A drop in food prices (e.g. for rice) around the target branch but not the control branch increases the clients’ capacity at the former to make all necessary household expenses. If we see a difference in clients’ capacity to make all necessary expenses this might be the result of changing food prices - and not the modification of the innovation.
The local economy around the target branch may have grown at a faster rate than the one around the control branch. Then differences in business profits made are the consequence of the more favourable economic development around the target branch and not due to the modification in the innovation.
28
A4: Tables
Table A4.1: Outcome summary statistics on asset building
29
Legend: TB - target group, CB - control group.
30
Table A4.2: Outcome summary statistics on multiple borrowing/ over-indebtedness
Legend: TB - target group, CB - control group.
31
Table A4.3: Outcome summary statistics on financial attitude (1)
Continued on next page...
32
Table A4.3: Outcome summary statistics on financial attitude (2)
Continued on next page...
33
Table A4.3: Outcome summary statistics on financial attitude (3)
Legend: IB - target group, CB - control group.
34
Table A4.4: Outcome summary statistics on risk management
Legend: IB - target group, CB - control group.
35
Table A4.5: Outcome summary statistics on vulnerability
Legend: TB - target group, CB - control group.
36
Table A4.6: Outcome summary statistics on type of shocks/ unforeseen expenses (1)
Continued on next page...
37
Table A4.6: Outcome summary statistics on type of shocks/ unforeseen expenses (2)
Legend: TG - target group, CG - control group.
38
Table A4.7: Outcome summary statistics on MAF (1)
39
Table A4.7: Outcome summary statistics on MAF (2)
Continued on next page...
40
Table A4.7: Outcome summary statistics on MAF (3)
Legend: TG - target group, CG - control group.
41
Table A4.8: Impact on financial attitude (1)
Continued on next page...
42
Table A4.8: Impact on financial attitude (2)
Continued on next page...
43
Table A4.8: Impact on financial attitude (3)
Legend: IB - target group, CB - control group.
Notes: Table contains difference-in-difference estimates for β from the equation (1) in appendix A1. Depended variables are clients’ outcomes and client’s household outcomes related to financial attitude. Specification (1) includes no controls and common support, (2) controls but no common support, (3) both controls and common support and (4) controls, common support and branch-time dummies. A p-value smaller or equal to 0.1 denotes significance at least at the 10 per cent level.
44
Table A4.9: Impact on risk management
Notes: Table contains difference-in-difference estimates for β from the equation (1) in appendix A1. Depended variables are clients’ outcomes and client’s household outcomes related to risk management. Specification (1) includes no controls and common support, (2) controls but no common support, (3) both controls and common support and (4) controls, common support and branch-time dummies. A p-value smaller or equal to 0.1 denotes significance at least at the 10 per cent level.
45
Table A4.10: Impact on asset building
Notes: Table contains difference-in-difference estimates for β from the equation (1) in appendix A1. Depended variables are clients’ outcomes and client’s household outcomes related to asset building. Specification (1) includes no controls and common support, (2) controls but no common support, (3) both controls and common support and (4) controls, common support and branch-time dummies. A p-value smaller or equal to 0.1 denotes significance at least at the 10 per cent level.
46
Table A4.11: Impact on multiple borrowing/over-indebtedness
Notes: Table contains difference-in-difference estimates for β from the equation (1) in appendix A1. Depended variables are clients’ outcomes and client’s household outcomes related to multiple borrowing/over-indebtedness. Specification (1) includes no controls and common support, (2) controls but no common support, (3) both controls and common support and (4) controls, common support and branch-time dummies. A p-value smaller or equal to 0.1 denotes significance at least at the 10 per cent level.
47
Table A4.12: Impact on vulnerability
Notes: Table contains difference-in-difference estimates for β from the equation (1) in appendix A1. Depended variables are clients’ outcomes and client’s household outcomes related to vulnerability. Specification (1) includes no controls and common support, (2) controls but no common support, (3) both controls and common support and (4) controls, common support and branch-time dummies. A p-value smaller or equal to 0.1 denotes significance at least at the 10 per cent level.
48
Social Finance Working Papers since 2000
No. 22 2000 J. Roth Informal micro-finance schemes: the case of funeral Insurance in South Africa
No. 23 2000 L. Mayoux Micro-finance and the empowerment of women: a review of key issues
No. 24 2000 SFP Institutional Assessment for NGOs and self-help Organisations Managing Guarantee schemes
No. 25 2000 A. McDonagh Microfinance Strategies for HIV/AIDS mitigation and prevention In Sub-Saharan Africa
No. 26 2001 B. Balkenhol & H. Schütte
Collateral, collateral law and collateral substitutes
No. 27 2002 D. M. Gross Financial Intermediation: a contributing factor to economic growth and employment
No. 28 2002 L. Deelen & K.O. Bonsu
Equipment finance for small contractors in public work programmes
No. 29 2002 M. Aliber, A. Ido Micro-insurance in Burkina Faso
No. 30 2002 E.S. Soriano, E.A Barbin & C.Lomboy
A field study of microinsurance in the Philippines
No. 31 2002 L. Manje & C. Churchill
The demand for risk-managing financial services in low-income communities: evidence from Zambia
No. 32 2002 I. Guerin Microfinance et autonomie féminine
No. 33 2003 M. Aliber South African Microinsurance Case-Study
No. 34 2003 Ebony Consulting Int.
Private equity and capitalisation of SMMEs in South Africa: quo vadis?
No. 35 2003 Bankers’ Institute Property rights and collateral:: how gender makes a difference
No. 36 2003 F.L. Galassi D.M. Gross
How trustable are Western African mutual savings and loan institutions? An application of PASMEC Databank
No. 37 2003 M.S. de Gobbi The role of a professional association in mutual microfinance: the case of Madagascar
No. 38 2003 T. Siddiqui C.R. Abrar
Migrant worker remittances and microfinance in Bangladesh
No. 39 2003 S. Thieme Savings and credit associations and remittances: the case of Far West Nepalese labour migrants in Delhi, India