Contents lists available at SciVerse ScienceDirect
Neurobiology of Disease
j ourna l homepage: www.e lsev ie r .com/ locate /ynbd i
Microglial activation is not equivalent to neuroinflammation in alcohol-inducedneurodegeneration: The importance of microglia phenotype
S. Alex Marshall, Justin A. McClain, Matthew L. Kelso 1, Deann M. Hopkins, James R. Pauly, Kimberly Nixon ⁎Department of Pharmaceutical Sciences, The University of Kentucky, Lexington, KY 40536-0596, USA
Abbreviations: ABC, Avidin-Biotin Complex; AUD,Blood Brain Barrier; BEC, Blood Ethanol Concentratio3,3′-diaminobenzidine tetrahydrochloride; DG, DentateImmuno-Sorbent Assay; MHC-II, Major HistoCompatibReceptor; TSPO, Translocator Protein.⁎ Corresponding author at: University of Kentucky, Co
of Pharmaceutical Sciences, 789 S. Limestone St., BPC 4USA. Fax: +1 859 257 7585.
E-mail address: [email protected] (K. Nixon).Available online on ScienceDirect (www.scienced
1 Present address: Department of Pharmacy PracticCenter, Omaha, NE 68198-6045, USA.
Excessive alcohol intake, a defining characteristic of an alcohol use disorder (AUD), results inneurodegeneration in the hippocampus and entorhinal cortex that has been linked to a variety of cognitivedeficits. Neuroinflammation is thought to be a factor in alcohol-induced neurodegeneration, and microgliaactivation is a key but not sole component of an inflammatory response. These experiments investigate theeffects of ethanol exposure in a well-accepted model of an AUD on both microglial activation and blood brainbarrier disruption (BBB) in order to understand their relationship to classical definitions of inflammationand alcohol-induced neurodegeneration. Following a four-day binge ethanol paradigm, rat hippocampal andentorhinal cortex tissue was examined using three distinct approaches to determine microglia phenotype andBBB disruption: immunohistochemistry, autoradiography, and ELISA. After ethanol exposure, there was anincrease in [3H]-PK-11195 binding and OX-42 immunoreactivity indicative of microglial activation; however,microglia were not fully activated since both OX-6 and ED-1 immunoreactive microglia were absent. This datawas supported by functional evidence as there was no increase in the proinflammatory cytokines IL-6 orTNF-α, but a 26% increase in the anti-inflammatory cytokine, IL-10, and a 38% increase in the growth factor,TGF-β, seven days after exposure. Furthermore, there was no evidence of a disruption of the BBB. These datasuggest that the four-day binge model of an AUD, which produces neurodegeneration in corticolimbic regions,does not elicit classical neuroinflammation but instead produces partially activated microglia. Partial activationofmicroglia following binge ethanol exposure suggest thatmicroglia in thismodel have beneficial or homeostaticroles rather than directly contributing to neurodegeneration and are a consequence of alcohol-induced-damageinstead of the source of damage.
Whether microglial activation is the cause or consequence ofneurodegeneration is hotly debated in studies of neurodegenerativedisease. Although not traditionally classified as a neurodegenerativedisease due to its preventable nature, alcohol use disorders (AUDs)and specifically the characteristic excessive consumption of alcohol,result in corticolimbic neurodegeneration that underlies a variety ofcognitive deficits in alcoholics (Crews and Nixon, 2009; Obernieret al., 2002a; Pfefferbaum et al., 1992; Sullivan et al., 1995). As
Alcohol Use Disorder; BBB,n; CA, Cornu Ammonis; DAB,Gyrus; ELISA, Enzyme-Linkedility Complex II; TLR, Toll-like
llege of Pharmacy, Department73, Lexington, KY 40536-0596,
irect.com).e, 986045 Nebraska Medical
rights reserved.
alcohol-induced neurodegeneration is thought to be a critical step inthe development of an AUD (Crews, 1999; Crews and Boettiger, 2009;Koob and Le Moal, 1997), understanding how excessive alcohol con-sumption results in neuronal loss is crucial for the development of pre-vention and treatment strategies. It has been hypothesized that alcohol-induced neuroinflammation directly contributes to neurodegenerationand the development of AUDs (Crews et al., 2011). Neuroinflammationhas been inferred from the upregulation of a variety of proinflammatorygenes and cytokines involved in the innate immune system (Crews etal., 2006; He and Crews, 2008; Knapp and Crews, 1999; Qin et al.,2008). For example, chronic ethanol exposure induces innate immunesignaling cascades through activation of the proinflammatory transcrip-tion factor nuclear factor-kappa B (NFκB; Crews et al., 2006, 2011; Valleset al., 2004). Others have shown that a variety of proinflammatorysignals are associated with increased ethanol drinking and preference(Blednov et al., 2012) and that peripheral inflammation promotes in-creases in voluntary ethanol intakewhereas anti-inflammatory adminis-tration reduces its consumption (Agrawal et al., 2011; Blednov et al.,2011). However, remarkably little is known about the effects of alcoholon microglia, the primary mediators of the innate immune system inthe brain.
240 S.A. Marshall et al. / Neurobiology of Disease 54 (2013) 239–251
Microglial activation, the process in which microglia alter theirmorphology and functionally differentiate in response to changes intheir environment, was traditionally described as proinflammatoryand cytotoxic (Kreutzberg, 1996). In normal, non-pathologic condi-tions microglia are generally in a quiescent state often referred to as“resting.” Quiescent microglia, however, are not truly resting; theirhighly ramified morphology reflects their constant surveying of thesurrounding environment (Fishman and Savitt, 1989; Nimmerjahnet al., 2005). For many neurodegenerative disorders, activatedmicroglia are a hallmark of neuroinflammation (Banati et al., 1993;Block and Hong, 2005; Colton and Gilbert, 1987; Woodroofe et al.,1991). However, more recent work demonstrates that it is not justwhether microglia are activated, but more importantly their pheno-type during activation (Carson et al., 2007; Colton and Wilcock,2010; Kreutzberg, 1996; Raivich et al., 1999a). Various terms havebeen used to describe a perceived dichotomy in microglial phenotypeincluding M1 versus M2, classical versus alternative and classicalversus partial activation. However, all classify microglia into one oftwo categories when it is a spectrum of phenotypes or behaviors thatexist. For example, microglia phenotype varies with the type of insult,the extent of damage, and the time of recovery post injury, whichmakes it necessary to thoroughly examine phenotypic hallmarkswithina disease before inferring their role in neuroinflammation (Hartinget al., 2008; Lai and Todd, 2008; Saijo and Glass, 2012). Application ofthe idea of graded levels of activation allows for investigation of apotential spectrum of phenotypes. As such, Raivich defines 5 levels ofmicroglial activation or phenotypes (Table 1): resting (stage 0), alert(stage 1), homing (stage 2), phagocytic (stage 3a) and bystander activa-tion (stage 3b), which can be differentiated by both morphology andcytokine and/or growth factor upregulation (Raivich et al., 1999a). Forexample, amoeboid morphology and expression of proinflammatoryfactors such as TNF-α, IL-1β, prostaglandins, superoxides and nitricoxide, characterize the highest level of activation whereas microglia inlower grades of activation release neuroprotective factors such asIL-10, TGF-β, and neurotrophins and have a more ramified morphology(Block and Hong, 2005; Raivich et al., 1999b). Furthermore, althoughfully activated microglia are one component of classical inflammation,observation of “activated” microglia alone is not equivalent to norvery informative about the inflammation state (Graeber et al., 2011).Therefore, determining the phenotype of microglia in injury is neces-sary to understand their role as cytotoxic or neuroprotective andwhether they are truly neuroinflammatory (Colton and Wilcock,2010; Kreutzberg, 1996; Raivich et al., 1999a; Vilhardt, 2005).
A role for cytotoxic microglia in alcohol-induced brain damagehas been suggested since the 1990s, however direct evidence ofalcohol-induced full or classical microglia activation has yet to bedescribed. The lack of classical signs of activation led some to suggestthat the damage in alcoholism is “too chronic” (Streit, 1994) or too
Table 1Microglial activation can be differentiated based on morphology, marker expression,and cytokine secretions (derived from Raivich et al., 1999a). Immune response canoccur independent of activation and may be observed in Stages 1–3 as evidenced byincreased MHCII (OX-6).
Ways to differentiate stages
Grade Characteristics Morphology and Markers Cytokines
Stage 0 Normal-ramified Morphology: long ramifiedprocesses
Stage 1 Alert: thicker processes Less ramified, thickerprocesses; ⇑OX-42
low level to affect microglia (Kalehua et al., 1992); however, thereis evidence of some level of activation in both animal models andhuman postmortem alcoholic brain. For example, early work showedan upregulation in the microglial marker, [3H]-PK-11195, bindingmonths after alcohol exposure in a four-day binge model of alcoholicneurodegeneration (Obernier et al., 2002b). Later, an unexpecteddiscovery of microglial proliferation was found in this same model(Nixon et al., 2008). More recently, upregulation of various microglialmarkers have been described in animal models (McClain et al., 2011),and even led some to conclude that excessive alcohol exposure pro-duces “neuroinflammation” (Qin et al., 2008;Ward et al., 2009). Impor-tantly, although evidence of microglial activation has been observed inhuman alcoholic brain samples, the phenotype of these alcohol-activated microglia has yet to be described (Crews et al., 2006, 2011;He and Crews, 2008). Unfortunately, the pervasive theme of these andother papers is that the observation of any marker of activation isequivalent to neuroinflammation. The assessment of single markers ofactivation is not sufficient to characterize the activation phenotype ofmicroglia and as discussed above, not indicative of inflammation(Colton and Wilcock, 2010).
The current experiments examine how ethanol exposure, in awell-established model of an AUD that includes significant alcohol-induced neurodegeneration, affects microglia within the context ofclassical definitions of inflammation. Specifically, inflammation isdefined as a “multicellular process characterized by changes in thevasculature and infiltration of mobile cells.” (p. 3800; Graeber et al.,2011). This study uses an extensive assessment of immunohistochemi-cal, morphological, and functional indices of microglial activation inorder to determine their phenotype in the hippocampus and entorhinalcortex, regions consistently damaged in this binge paradigm (Collinset al., 1996; Obernier et al., 2002a). Alcohol's effects on blood brainbarrier (BBB) integrity were also examined, asmacrophage and/or lym-phocyte infiltration is a defining phenomenon in inflammation (Hickey,2001).
Materials and methods
Alcohol administration model
Rats were subjected to a four-day binge model of alcohol exposuremodified from Majchrowicz (1975) that was chosen for its well-documented neurodegeneration profile (Crews, 1999; Kelso et al.,2011). This model is designed to mimic the high blood alcohol levelsof pattern binge drinkers (Hunt, 1993; Tomsovic, 1974). All proceduresperformed were approved by the University of Kentucky InstitutionalAnimal Care and Use Committee and aligned with the Guidelines forthe Care and Use of Laboratory Animals (NRC, 1996). A total of 214adult male Sprague–Dawley rats (Table 2; Charles River Laboratories,Raleigh, NC) were used across all experiments. Animals were 275–300 g upon arrival and single-housed in a University of KentuckyAALAC accredited vivarium with a 12 h light:dark cycle and ad libitumfood andwater access unless otherwise noted. Rats were allowed to ac-climate to the vivarium for two days andwere subsequently handled forthree days before the binge began.
Rats were divided into two groups of comparable weights andreceived either ethanol (25% w/v) or control diet (isocaloric amountsof dextrose) in Vanilla Ensure Plus®. Diet was given every 8 h for4 days via intragastric gavage. Initially, each rat received a 5 g/kgdose of ethanol with subsequent doses titrated based on intoxicationbehavior according to a 6-point scale modified from Majchrowicz(1975) but identical to previously published methods (Morris et al.,2010b; Nixon and Crews, 2004). During the four days of diet admin-istration, chow was removed and returned 8 h after the last dose.Ninety minutes after the sixth session of ethanol dosing, tail bloodsamples were collected, centrifuged for 5 min at 1800 g, and storedat −20 °C. Blood ethanol concentrations (BECs) were determined
Table 2Measures of various Intoxication parameters of the Majchrowicz model are statisticallysimilar between time points.
Group Intoxication behavior (0–5 scale) Dose (g/kg/day) BEC (mg/dl)
241S.A. Marshall et al. / Neurobiology of Disease 54 (2013) 239–251
from serum using an AM1 Alcohol Analyser (Analox, London, UK) cal-ibrated against a 300 mg/dl external standard. Ten hours followingthe last dose of ethanol, withdrawal was observed for 30 min everyhour for 16 intervals. Behaviors were scored based on a scalemodified from Majchrowicz (Majchrowicz, 1975; Penland et al., 2001)but identical to that reported previously (Morris et al., 2010b). Becausemicroglia respond quickly to changes in homeostasis (Davalos et al.,2005; Nimmerjahn et al., 2005) but also have the capacity for persistingmemory (Bilbo and Schwarz, 2009; Bland et al., 2010;Williamson et al.,2011) this study examines microglial changes immediately followingethanol exposure through 28 days of abstinence. Therefore, rats wereeuthanized at various times with different methods following bingetreatment: T0 (e.g. 0 days after the last dose, specifically withinhours), T1, T2, T4, T7, and T28 (Table 2).
Autoradiography
Autoradiography was conducted as described in previous reports(Kelso et al., 2006; Sparks and Pauly, 1999). Briefly, rats were rapidlydecapitated and extracted brainswere immediately frozen in isopentaneand sliced at 16 μm with a cryostat. Two controls were euthanized ateach time point and pooled into a single control group for comparisonwith ethanol treated groups (Readnower et al., 2010). Sections weremounted in a 1 in 8 series on glass slides so that every eighth sectionwas used and stored at −80 °C until processing. Slides were thawedand incubated in 50 mM Tris HCl (pH=7.4) buffer with 1nM [3H]-PK-11195 (PerkinElmer, Boston, MA) for 2 h followed by a series of washesin 50 mMTris HCl. [3H]-PK11195 specifically binds to themitochondrialtranslocator protein 18 kDa (TSPO), a protein that is highly upregulatedin activated microglia (Kelso et al., 2009; Stephenson et al., 1995; Veigaet al., 2007). Similar to other studies of microglial activation after braininsult, autoradiographic localization of TSPO was used in this studybecause of its high sensitivity to detect activated microglia (Benavideset al., 2001; Readnower et al., 2010). After drying, the slides wereexposed to BioMax film (Kodak, Rochester, NY) for 6 weeks. The filmwas developed with GBX developer (Kodak) and analyzed using ScionImaging (Frederick, Maryland). Sections approximately between Bregma−2.50 mm and −4.00 mm, which included both the hippocampus andentorhinal cortex, were quantified (Paxinos andWatson, 2009).
Immunohistochemistry
Rats were overdosed with anesthetic (Nembutal® 100 mg/kg;i.p.) and transcardially perfused with 0.1 M phosphate buffered saline
(PBS, pH=7.4) followed by 4% paraformaldehyde in PBS. Brains wereextracted, postfixed in paraformaldehyde for 24 h (ED-1, OX-6, Iba-1,and IgG) or 1 h (OX-42), and sectioned coronally at 40 μm using avibrating microtome (Leica VT1000S; Wetzlar, Germany). Sectionswere collected in a 1:12 series and stored in cryoprotectant at −20 °Cuntil processing so that every twelfth section was stained for all anti-bodies. Free floating tissue was washed in tris buffered saline (TBS,pH=7.5) and endogenous peroxidases quenched with 0.6% H2O2 inTBS. Following additional washes, sectionswere blocked for nonspecificbinding (TBS, 0.1% triton X-100, and 3% horse or goat serum), and thenincubated overnight in primary antibody at 4 °C as follows: mouseanti-OX-6 (1:500, Serotec, Raleigh, NC), mouse anti-ED-1 (1:500;Serotec), rabbit anti-Iba-1 (1:1000, Wako, Richmond, VA), or mouseanti-OX-42 (1:1000; Serotec; two nights).
Primary antibodies were chosen for their specificity for microglia(Table 1). The Iba-1 antibody recognizes a 17 kDa EF hand proteinthat is similar in structure to other calcium binding proteins such ascalmodulin (Heizmann and Hunziker, 1991; Imai et al., 1996; Ito etal., 1998). Iba-1 is used to mark all microglia, but it is upregulatedduring activation as it is associated with the release of cytokines, ad-hesion, and proliferation (Donato, 1999, 2003; Hwang et al., 2006).The OX-42 antibody is also constitutively expressed in all microgliaand recognizes complement receptor 3 (CR3 or CD11b; Robinson etal., 1986). Upregulation of this receptor is one of the first indices of ac-tivation as microglia prepare to adhere to damaged cells (Hynes,1992; Morioka et al., 1992). Unlike Iba-1 and OX-42, ED-1 and OX-6are not expressed in all microglia. The ED-1 antibody, also known asanti-CD68, recognizes a glycoprotein on the lysosomal membrane ofmacrophages and microglia that is indicative of phagocytic activity(Bauer et al., 1994; Damoiseaux et al., 1994). ED-1 is typically used todetermine the presence of classically or fully activated phagocytic mi-croglia (Graeber and Streit, 2009; O'Keefe et al., 2002; Raivich et al.,1999a). The OX-6 antibody recognizes major histocompatibility com-plex class II molecules (MHC-II) associated with induction of T-helpercells (O'Keefe et al., 2002; Raivich et al., 1999a). Although OX-6 is alsoassociated with the recruitment of phagocytes and is considered a hall-mark of an immune response (Kaur and Ling, 1992; McGeer etal., 1993), recent work suggests that it may also be expressed inalternatively activated microglia (Colton and Wilcock, 2010).Microglia exhibit weak antigen presenting capabilities, but manyneuroinflammatory reactions involve the upregulation of microglialMHC-II (Zhang et al., 2011).
Methods for the application of secondary antibody (biotinylatedhorse anti-mouse, rat adsorbed, or biotinylated goat anti-rabbit, VectorLaboratories, Burlingame, CA), avidin-biotin-peroxidase complex (ABCElite Kit, Vector Laboratories) and chromagen, nickel-enhanced 3,3′-diaminobenzidine tetrahydrochloride (DAB; Polysciences, Warrington,PA), were identical for all primary antibodies and followed previouslypublished methods (McClain et al., 2011).
To determine if infiltration of macrophages and lymphocytescould occur in this model, BBB impairment was examined. Tissuewas incubated in biotinylated rabbit anti-rat IgG for 2 h followed bydetection with ABC and the chromagen DAB (Rabchevsky et al.,1999). The IgG antibody is a marker of immunoglobulin G. With an in-tact BBB, immunoglobulins would remain in the peripheral systemdue to a lack of transport mechanisms (Triguero et al., 1989); thus,the presence of IgG in the brain parenchyma indicates BBB disruption.Following the final wash, all stained sections were mounted onto glassslides and dried before being coverslipped with Cytoseal® (StephensScientific, Wayne, NJ).
Quantification
All sections were coded to ensure the experimenter was blindedto treatment conditions during quantification. All analyses wereconducted on an Olympus BX-51 microscope (Olympus, Center Valley,
242 S.A. Marshall et al. / Neurobiology of Disease 54 (2013) 239–251
PA), with motorized stage (Prior, Rockland, MA), microcator and DP70digital camera (Olympus). OX-42 immunoreactivity was analyzedusing Visiomorph image analysis program (Visiomorph, Hørsholm, Den-mark). Using a 10×objective lens, regions of interestwere drawnaroundthe hippocampal subregions and the entorhinal cortex approximatelybetween Bregma−2.50 mm and−4.00 mm as determined by Paxinos(Paxinos andWatson, 2009), and percent area of staining was obtained.Immunoreactivity was calculated and expressed as percent control.Sections in the same stereotaxic regions were assessed qualitatively forED-1, OX-6 and IgG using a 10× objective.
Iba-1+ cells were quantified in the entorhinal cortex by an imageanalysis system. Multi-panel images containing the entire entorhinalcortex were collected using Visiopharm image capturing softwareapproximately between Bregma −2.30 mm and −4.50 mm (Paxinosand Watson, 2009). For each image, the number of Iba-1+ cells wasdetermined by Image Pro Plus software. The number of cells was aver-aged and expressed as Iba-1+ cells/section.
Hippocampal Iba-1+cells were estimated by unbiased stereologicalmethods, the optical fractionator, using the newCAST StereologySystem (Visiopharm,Hoersholm,Denmark) installed on aDell Precision380 workstation coupled to the microscope. Following parameterssimilar to Long et al. (1998), the dentate gyrus (DG), CA2/3, and CA1regions of the dorsal hippocampus approximately between Bregma−2.30 mm and −4.50 mm as determined by Paxinos (Paxinos andWatson, 2009) were separately traced at 100× magnification. Sectionthickness was assessed at 600× using a 60× oil immersion lens andwas averaged from three measurements taken at different locationswithin each region. The DG and CA2/3 were randomly sampled usinga 70 μm×70 μm counting frame with a 250 μm x,y step length. TheCA1 was randomly sampled using the same size counting frame and a400 μm x,y step length. After tissue processing, section thickness wasapproximately 24 μm, therefore, a dissector height of 20 μm with2 μmguard zoneswas used. Total Iba-1+microglia in each region of in-terest was calculated using the following equation (West et al., 1991):
N ¼ ∑Q � 1asf
� 1tsf
� 1ssf
where Q is the number of cells counted, asf is the area sampling fraction(the counting frame: x,y step length ratio), tsf is the thickness samplingfraction (dissector height: section thickness ratio), and ssf is the sectionsampling fraction (the fraction of sections examined). For all stereolog-ical quantifications, coefficient of error ranged from 0.008 to 0.039 andaveraged 0.021±0.001 (Gundersen et al., 1999).
Enzyme linked immunosorbent assay (ELISA)
Rats were rapidly decapitated and the brain immediately extracted.The hippocampus and entorhinal cortex were dissected on ice, snapfrozen on dry ice, and stored at −80 °C until assayed. Thawed tissuewas manually homogenized in an ice-cold lysis buffer (1 mL of buffer/50 mg of tissue; pH=7.4). All reagents used in the lysis buffer werepurchased from Sigma (St. Louis, MO) unless otherwise noted. Itconsisted of 25 mM HEPES, 0.1% 3-[(3-cholamidopropyl) dimethyl-ammonio]1-propanesulfonate, 1.3 mM EDTA, 1 mM EGTA, 10 μg/mlaprotinin, 10 μg/ml leupeptin, 5 mM MgCl2 (Fisher, Fairlawn, NewJersey), 10 μg/ml pepstatin (Fluka, Milwaukee, WI), and 1 mM PMSF(Fluka; Rabuffetti et al., 2000). Homogenates were centrifuged at20,000 ×g for 15 min at 4 °C and the supernatant stored at −80 °C.Total protein content was determined using a Pierce BCA ProteinAssay Kit (Thermo Scientific, Rockford, IL). Cytokine protein contentwas determined with an ELISA kit according to the manufacturer′sinstructions for rat tumor necrosis factor alpha (TNF-α; Invitrogenproduct #KRC3011C, Camarillo, CA), interleukin-10 (IL-10; Invitrogenproduct #KRC0101), interleukin-6 (IL-6; R&D Systems product#R6000B, Minneapolis, MN), or transforming growth factor beta
(TGF-β; Invitrogen product #KAC1688). All samples, standards, andpositive controls were run in duplicate so that all tissue for one timepoint fit on one plate to reduce potential variability. The cytokine pro-tein concentration was divided by the total protein concentrationobtained in the BCA assay to correct for differences in tissue volume.Protein concentration is reported as pg of cytokine/mg of protein.
Statistical analyses
Data were analyzed and graphed using Prism (GraphPad Software,Inc. La Jolla, CA). All data are reported as the mean±standard error ofthe mean and analyses considered significantly different if pb0.05.Behavioral scores were analyzed with a Kruskal–Wallis test and BECs,autoradiography, OX-42, cytokine expression, and cell counts wereanalyzed by ANOVA with posthoc tests as appropriate. Each region isconsidered independent and therefore was analyzed separately.
Results
Animal model data
Intoxication parameters across all experiments were similar asshown in Table 2. The overall mean intoxication score for all ethanolanimals was 1.9±0.1 on the 6-point Majchrowicz scale, which indi-cates that all animals were, on average, “ataxic” immediately beforedosing. This level of intoxication resulted in an overall mean dose of9.2±0.3 g/kg/day of ethanol and a BEC of 354.0±7.5 mg/dL for allanimals used. These parameters are similar to those reported in paststudies with this model (Morris et al., 2010a; Nixon and Crews,2004) and similar to that observed in voluntary consumption (Bellet al., 2009). Neither the Kruskal–Wallis (intoxication behavior) norone-way ANOVAs (dose, BEC) showed differences in any intoxicationparameter between ethanol groups at different time points.
[3H]-PK-11195 autoradiography reveals early activation of microglia
Binding of the TSPO ligand, [3H]-PK-11195, was measured byoptical density at T0, T2, T4, and T7. Control levels of binding at eachtime point were not statistically different and therefore were pooledinto a single control group (Readnower et al., 2010). As shown in repre-sentative images, ethanol treated animals have increased bindingthroughout the brain compared with controls (Fig. 1). Specifically, oneway ANOVAs showed a significant main effect of diet in each regionof the hippocampus: CA1 [F(4,27)=14.93, pb0.0001], CA2/3 [F(4,27)=14.93, pb0.0001], and DG [F(4,27)=12.88, pb0.0001], as well as in theentorhinal cortex [F(4,27)=9.08, pb0.0001]. Post-hocDunnett's tests con-firmed a significant increase (pb0.05) in the density of [3H]-PK-11195binding in each ethanol treated time point compared to controls in allregions examined (Fig. 1).
Immunohistochemical markers of microglia indicate partial activationphenotype
In order to see the earliest signs of activation, we examined OX-42expression immediately after the last dose of alcohol (T0; rats are stillintoxicated) and in a separate group after four weeks of abstinence(T28). OX-42 positive cells were apparent in both ethanol and controltissue which is consistent with its constitutive expression (Akiyamaand McGeer, 1990). However, there was a visibly distinct increasein immunoreactivity at T0, reflecting a reduction in the ramificationbut a thickening of the processes in the ethanol animals comparedwith the controls (Fig. 2). Two-way ANOVAs indicated a significantinteraction between treatment and time point in the CA1 [F(1,25)=5.81, p=0.0236], CA2/3 [F(1,26)=5.71, p=0.0244], and DG [F(1,25)=5.90, p=0.0227] fields, as well as in the entorhinal cortex [F(1,25)=4.65, p=0.0409]. Planned posthoc t-tests indicated a significant
Fig. 1. [3H]-PK-11195 upregulation following 4-day binge exposure. Representative false color autoradiographs depicting [3H]-PK-11195 binding are shown for (A) controls (n=8;black bars) as well as (B) ethanol (grey bars) at T0 (n=6), (C) T2 (n=6), and (D) T7 (n=6). Quantitative analysis of the extent of binding are graphed for the (E) CA1, (F) CA2/3,(G) DG, and (H) entorhinal cortex. *pb0.05.
243S.A. Marshall et al. / Neurobiology of Disease 54 (2013) 239–251
increase after ethanol exposure in all regions at T0: CA1 [t(12)=2.39,p=0.0345], CA2/3 [t(12)=2.23, p=0.0453], DG [t(12)=2.35, p=0.0367] and entorhinal cortex [t(12)=2.21, p=0.0472]. Although thecontrast between ethanol and controls was not as distinct at T28, etha-nol animalsmaintained a significant increase comparedwith controls inall regions except the DG: CA1 [t(13)=2.45, p=0.0288], CA2/3 [t(13)=2.25, p=0.0427], and entorhinal cortex [t(13)=4.80, pb0.0003].
The ED-1 antibody was used to recognize phagocytic microglia(Graeber and Streit, 2009), whereas the OX-6 antibody was used tovisualize the upregulation of MHC II. Neither ethanol nor control ani-mals had ED-1 nor OX-6 positive cells within the parenchyma of thehippocampus or entorhinal cortex at T0, T2, T4, T7, or T28 (Fig. 3).However, ED-1 and OX-6 positive cells were visible in blood vesselsand along the meninges in both control and ethanol treated animals(Fig. 3), similar to that previously reported in this model (McClain etal., 2011; Nixon et al., 2008). Thus, four-day ethanol treatment failedto induce phagocytic-stage microglia or increased MHC II in the brainparenchyma at any time point.
Microglia proliferation increases the number of microglia
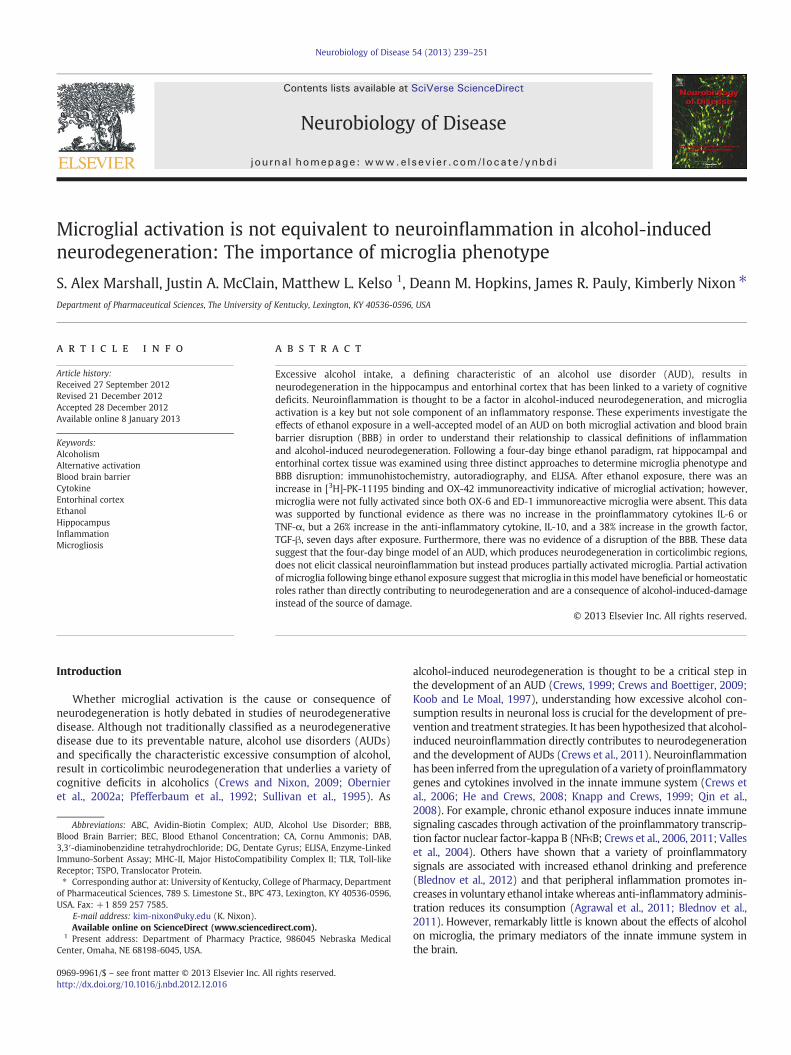
We have previously shown that microglia proliferate two daysafter a four-day alcohol binge (McClain et al., 2011; Nixon et al.,2008); therefore stereological estimates of Iba-1-positive microgliawere conducted at seven (T7) and twenty eight (T28) days followingthe last ethanol dose in the hippocampus. The total number of mi-croglia was increased in the hippocampus of ethanol treated animalscompared with controls seven days after ethanol exposure (T7;Fig. 4). Two-way ANOVAs indicated a significant main effect of diet{CA1 [F(1,23)=14.39 p=0.0009], CA2/3 [F(1,23)=12.14 p=0.0020],DG [F(1,23)=12.16 p=0.0020]}, time point {DG [F(1,23)=10.88 p=0.0031]}, and a significant interaction between diet and time point inthe CA1 [F(1,23)=4.37 p=0.0477] and DG [F(1,23)=13.32 p=0.0013].Planned post-hoc t-tests indicated a significant increase after ethanolexposure in all regions of the hippocampus at T7: CA1 [t(10)=3.22,p=0.0092], CA2/3 [t(10)=2.28, p=0.0457], and DG [t(10)=5.038,
p=0.0005] However, by T28, the number of hippocampal microgliareturns to control levels in all regions except the CA2/3 [t(13)=2.66,p=0.0195]. In the entorhinal cortex, microglial cell number was esti-mated by an automated cell count, where no change was seen in thenumber of microglia between ethanol (586.5±55.4 microglia/section,n=7) and control animals (623.3±26.7 microglia/section, n=7) atT7, therefore no further time point was examined.
Cytokine expression also suggests low grade activation phenotype
In order to assess the functional state of microglia, cytokine levelswere assayed via ELISA. Increases in the proinflammatory cytokinesIL-6 and TNF-α, are associated with classically activated microglia,but not partially activated microglia, and can be used to differentiatethe two phenotypes of microglia (Table 1). IL-6 is a proinflammatorycytokine secreted by activated microglia in response to brain injurybut can also act in an autocrine function to stimulate surroundingmicroglia into a phagocytic state (Chiang et al., 1994; Woodroofe etal., 1991). Two-way ANOVA showed a main effect of time in the hippo-campus [F(4,59)=8.18, pb0.0001], but Bonferroni corrected post-hoct-tests showed no statistical difference between ethanol and controlanimals in the region. However in the entorhinal cortex, two-wayANOVA indicated a significant main effect of diet [F(1,54)=7.13 p=0.01], time [F(4,54)=2.88 p=0.03], and a significant interaction be-tween diet and time point [F(4,54)=4.72 p=.002] (Fig. 5). Bonferronicorrected post-hoc t-tests show a significant 36% decrease [t(11)=3.97, p=0.011] in IL-6 in ethanol animals compared to controls in theentorhinal cortex at T2. Taken together, these results indicate that inhi-bition of basal IL-6 expression occurs after ethanol withdrawal in a tem-porally and regionally specific manner. In addition to IL-6, TNF-α is aproinflammatory cytokine expressed by fully activated microglia andincreased after many forms of injury (Vitarbo et al., 2004). Two-wayANOVA of the hippocampus data showed a main effect of time point[F(4,63)=20.77, pb0.0001], but there were no statistical differencesbetween ethanol and control animals after Bonferroni correctedpost-hoc t-tests. Despite significant main effects of both diet [F(1,54)=
Fig. 2. CD11b (OX-42) upregulation following 4-day binge exposure. CD11b is upregulated in both the hippocampus and entorhinal cortex at T0 as shown in representativephotomicrographs for (A, E) controls (T0: n=7; T28: n=7; black bars) and rats exposed to binge (C, F) ethanol (T0: n=8; T28: n=8; grey bars). Higher magnification of microgliaseen in the hippocampus is shown for both (H) control and (I) ethanol. Quantifications of OX-42 immunoreactivity for the subregions of the hippocampus were significantlydifferent and are shown: (B) CA1, (D), CA2/3, and (G) DG as well as the (J) entorhinal cortex. Scale bar in C=500 μm; F=300 μm; J=10 μm. *pb0.05.
244 S.A. Marshall et al. / Neurobiology of Disease 54 (2013) 239–251
4.77 p=0.03] and time point [F(4,59)=8.86 pb .0001] in the entorhinalcortex, Bonferroni corrected post-hoc t-tests indicated no difference be-tween ethanol and control animals at any time point. This lack of TNF-αupregulation in brain is consistentwith previous reports in rats (Ehrlichet al., 2012; McClain et al., 2011; Zahr et al., 2010), but not mice (Qin etal., 2008).
Basal expression of TNF-α and IL-6 were not increased followingfour-day ethanol exposure, suggesting the lack of a proinflammatoryresponse. Therefore, we examined the effects of ethanol on TGF-β, agrowth factor, and IL-10, an anti-inflammatory cytokine (Fiorentinoet al., 1991; Polazzi et al., 2009). A significant interaction betweendiet and time point was shown in the hippocampus using a two-
Fig. 3. Lack of fully activated microglia following 4-day binge exposure. ED-1 is not visible in the (A–D) hippocampus or (E–H) entorhinal cortex as seen in representativephotomicrographs for (A, E) controls (T2: n=7; T7: n=8) or (B, F) ethanol (T2: n=6;T7: n=7) rats at (B, F) T2 or (C, G) T7. No OX-6 positive cells were visualized in the(I-L) hippocampus or (M-P) entorhinal cortex as seen in representative photomicrographs for (I, M) controls or ethanol rats at (J, N) T2 or (K, O) T7. Phagocytic and immuneresponsive macrophages were visible in the blood vessels as seen in insets (C) of ED-1 and (J) OX-6, respectively. ED-1 and immunopositive cells were visible in the (D, H, L, P)positive control tissue from a rat treated with kainic acid. RF = rhinal fissure. Scale bar=150 μm.
245S.A. Marshall et al. / Neurobiology of Disease 54 (2013) 239–251
way ANOVA of TGF-β [F(4,53)=4.20, p=0.005]. Bonferroni correctedpost-hoc t-tests revealed a significant 26% increase [t(11)=2.673, p=0.0434] in TGF-β in ethanol animals compared to controls at T7 (Fig. 6).Despite a significant main effect of time point in the entorhinal cortex[F(4,47)=18.65, pb0.0001], no difference in TGF-β was observed be-tween ethanol and control treated animals. In the hippocampus, atwo-way ANOVA of IL-10 concentrations indicated a main effect oftime point [F(4,59)=6.71 p=0.0002] plus a significant interaction
between treatment and time point [F(4,64)=3.24, p=0.01]. Bonferronicorrected post-hoc t-tests revealed a significant 26% increase [t(11)=3.97, p=0.011] in IL-10 in ethanol animals compared to controls in thehippocampus at T7 (Fig. 6). A two-way ANOVA showed no statisticallysignificant main effects or interaction between diet and time point inthe entorhinal cortex indicating no significant difference in the meanprotein concentration between ethanol treated animals and controls(Fig. 6).
Fig. 4. Increase in microglia number following 4-day binge exposure. Stereological estimates indicate an increase in the number of microglia in ethanol treated animals (n=7; greybars) compared with control (n=8; black bars) at T7 in the (A) CA1 (B) CA2/CA3, and (C) DG. This increase persists twenty-eight days later in the (B) CA2/3 in ethanols (n=7)compared with controls (n=7). There was no difference in cell counts determined by image analysis between ethanols and controls at T7 in the (D) entorhinal cortex. *pb0.05.
246 S.A. Marshall et al. / Neurobiology of Disease 54 (2013) 239–251
Blood brain barrier remains intact following four-day binge ethanolexposure
In order to assess whether the BBB is possibly breached by four-day binge ethanol exposure, we examined the penetration of IgGmolecules during intoxication and at T2. Penetration of IgG into theparenchyma was observed in the ventral hypothalamus around the3rd ventricle, a region known to lack an intact BBB under physiologi-cal conditions (Schmidt and Grady, 1993). However, qualitativeanalysis of IgG immunoreactivity between Bregma −2.30 mm and−4.50 mm (Paxinos and Watson, 2009) showed that both ethanoland control animals had few, if any IgG positive cells or diffusion inthe parenchyma of either the hippocampus or entorhinal cortex atT0 or T2 (Fig. 7). Therefore, the BBB does not appear to be breachedin this model.
Discussion
Microglia take on a variety of phenotypes, which can be used topredict the cell's role in brain insult or neurodegenerative disease.The major finding of this work is that both morphological and func-tional evidence from these experiments support the conclusion thatbinge ethanol exposure does not classically activate microglia and isconsistent with definitions of partial activation. The lack of classicallyactivated microglia after binge ethanol exposure therefore does notmeet the criteria for classical definitions of inflammation. Of Raivich'sfive levels of microglial activation (Raivich et al., 1999a), these datasupport that four-day binge ethanol exposure only appears to activatecells up to stage 2. A step-wise progression is noted beginning whilethe animals are intoxicated (T0) where stage 1 (Table 1) or low
level “alert” activation begins to occur and persists for at least twentyeight days according to [3H]-PK-11195 autoradiography for the TSPOreceptor and OX-42 (CR3) immunoreactivity. Both markers areupregulated during and after four-day binge alcohol exposure. In ad-dition, the morphology of OX-42 positive cells in ethanol-exposedbrains supports that microglia are “alert” and “homing” as they ap-pear less ramified with thicker, bushier processes (Fig. 2). A stage 2level of activation, or “proliferation and homing,” was suggested pre-viously with the observation of proliferating microglia (Nixon et al.,2008). That microglia proliferate and home to sites of damage is fur-ther supported by the increased numbers of Iba-1+ microglia ob-served at T7 in all regions of the hippocampus, which persists in theCA2/3 at T28 (Fig. 4). Importantly, the highest indices of activation,proliferation and increased number, are observed well after the peakof alcohol-induced cell death (T0; Crews et al., 2000; Kelso et al.,2011), which suggests that alcohol-induced microglial activation is aconsequence of alcohol-induced cell death.
However, neither TSPO nor CR3 upregulation indicates the level ofactivation. Therefore, in order to determine microglia phenotype,more classical markers of full activation were evaluated. Neither OX-6nor ED-1 were detected in the brain parenchyma, which indicates thatfew, if any, microglia have been activated to either a phagocytic orbystander activation state (Kato et al., 1995). Indeed, with the additionof these data, ED-1 has been exhaustively examined following four-daybinge ethanol exposure, the most acutely damaging model of an AUD,and at no time point examined have ED-1-positive cells ever beenfound inside the brain parenchyma (McClain et al., 2011; Nixon et al.,2008). Therefore, morphology, number and marker data converge tosupport that microglia are only partially activated to a stage 2, prolifer-ation and homing state.
Fig. 5. No pro-inflammatory cytokine expression in the 4-day binge. Concentrations of (A, B) IL-6, (C, D) TNF-α were determined by ELISA in both the hippocampus (A, C) and en-torhinal cortex (B, D). A 36% decrease of IL-6 was measured in the (B) entorhinal cortex at T2 in ethanol animals (n=7; black bars) [175 pg/mg±8.9] compared to controls (n=7;grey bars) [272 pg/mg±21.2]; however, no change in TNF-α was seen in either the (E) hippocampus or the (F) entorhinal cortex. *pb0.05.
247S.A. Marshall et al. / Neurobiology of Disease 54 (2013) 239–251
Activated microglia not only change morphologically but alsofunctionally as they secrete cytokines and growth factors that mayimpact the surrounding environment. Similarly, these cytokines canhave either damaging or protective/reparative effects depending onthe phenotype or level of microglial activation (Raivich et al., 1999a;Suzumura et al., 2006). Therefore, we examined key cytokines atcritical time points of previously reported cellular events followingfour-day binge exposure. Cytokine expression following binge etha-nol exposure also indicated that microglia are only partially activated.Proinflammatory TNF-α was not changed at any time point, IL-6 wasselectively decreased at T2 in entorhinal cortex, the time of microglialproliferation, whereas anti-inflammatory cytokines, IL-10 and TGF-β,which can be secreted by alert/homing microglia, were selectivelyincreased at T7 in the hippocampus. Alternatively activated microgliasecrete both TGF-β and IL-10, and are known to suppress microgliaactivation and subsequent neuronal damage (Ledeboer et al., 2000;Sharma et al., 2011; Spittau et al., 2012). The increase IL-10 and
TGF-β seven days after ethanol exposure (T7) in the hippocampuscomes after significant neuronal damage in this region and, intriguingly,coincides with reactive neurogenesis (Kelso et al., 2011; Nixon andCrews, 2004; Obernier et al., 2002a). However, TNF-α and IL-6, releasedin the highest levels of activation, were not increased at any time pointin either the hippocampus or entorhinal cortex (Bethea et al., 1999;Stoll et al., 2000). The lack of effect on TNF-α is consistent with recentreports from multiple laboratories that TNF-α is not increased in ratsfollowing excessive alcohol exposure (Ehrlich et al., 2012; McClain etal., 2011; Zahr et al., 2010), though conflicts with reports in mice(Alfonso-Loeches et al., 2010; Qin and Crews, 2012; Qin et al., 2008).It is important to note that the source of these cytokines was not deter-mined in the present study or the cited reports as reactive astrocytesalso secrete many of the same cytokines (Lau and Yu, 2001). Astrocytesare activated in the four-day binge model used and other alcoholmodels, though in a more delayed time course than that observed formicroglia (Kelso et al., 2011). Because of the overlap in microglia and
Fig. 6. Increase in anti—inflammatory cytokine expression after 7 days of abstinence. Concentrations of (A, B) TGF-β (C, D) IL-10 were determined by ELISA in both the hippocampus(A, C) and entorhinal cortex (B, D). An increase in both (A) TGF-β (38%) (C) IL-10 (26%) was seen in ethanol animals (n=6,7 respectively; grey bars) compared with controls (n=7; black bars) in the hippocampus at T7. *pb0.05.
248 S.A. Marshall et al. / Neurobiology of Disease 54 (2013) 239–251
astroglia activation at T7 in this model, it is impossible to definitivelylink microglia activation with the secretion of particular cytokines. Animportant future discovery will be to show the cellular source of thesecytokines in vivo. In summary, cytokine expression patterns followingfour-day binge alcohol exposure are consistent with that observed inimmunohistochemical and morphological analyses—microglia pheno-type is not one of classical activation, but merely partial activation.
The activation state of microglia is critical to understanding theirrole in alcoholic neuropathology. Microglia progress stepwise throughthese various phenotypes, each of which is predictive of the cell's rolein homeostasis/neuroprotection versus neurodegeneration (Raivich etal., 1999a; Schwartz et al., 2006; Vilhardt, 2005). Although the conceptof a graded state of activation (phenotype) has resolved the debate asto whether microglia are “good” or “bad,” each insult still results in adistinct response (Harting et al., 2008; Lai and Todd, 2008; Saijo andGlass, 2012). Even various patterns of alcohol intake produce a distinctresponse. As shown here, four-day binge ethanol exposure, which isan acutely damaging event compared to more chronic models, only
produces partially activated microglia. Partially activated or low levelphenotypes are more closely associated with roles in homeostasis andneuroprotection and therefore alcohol-activated microglia may beplaying a role in neuroprotection, repair, or in the hippocampal DG, re-generation (Battista et al., 2006; Engelsberg et al., 2004). Although itmay seem surprising that a brain insult as severe as high blood alcoholconcentrations and alcohol-induced neurodegeneration, does not resultin an overt, phagocytic level of reactive microgliosis, not all types ofbrain injury result in a full phagocytic, i.e. classical, microglial response(Graeber et al., 1988). Indeed, a recent report details phagocytosisindependent of fully activated microglia (Sierra et al., 2010) and multi-ple reports show that partially activated microglia are necessary inneuroprotection and axonal regeneration (Shokouhi et al., 2010;Wainwright et al., 2009).
Intriguingly, intermittent exposure to ethanol results in evidenceof more classically activated microglia such as TLR4 upregulation(Alfonso-Loeches et al., 2010; Fernandez-Lizarbe et al., 2009). Greaterlevels of activation with intermittent exposure models lead us to
Fig. 7. No disruption in the blood brain barrier (BBB). There is no disruption in the BBB following ethanol as there is little to no IgG staining in either the (B, C, F, G) ethanol (T0: n=8; T2: n=6) or (A,E) control (T0 n=6; T2 n=7) compared with a (D,H) kainate positive control. Scale bar=400 μm.
249S.A. Marshall et al. / Neurobiology of Disease 54 (2013) 239–251
speculate that the initial exposure may serve as a priming stimulus tomicroglia such that subsequent exposures result in over-response asseen in other neurodegenerative disease models (Bilbo and Schwarz,2009; Perry et al., 2003). The concept of microglia priming wouldexplain why more classic-like activation is observed with multipleexposures or multiple intoxication/withdrawal cycles as that used byQin (Qin et al., 2008), as opposed to our single cycle of prolonged intox-ication then withdrawal and why the pattern of drinking is more asso-ciatedwith gliosis than the level of consumption (Riikonen et al., 2002).Unfortunately, these and other data support that microglia remain“primed” or partially activated for long periods of time after exposure.For example, [3H]-PK-11195 remains upregulated months after alcoholexposure (Obernier et al., 2002b; Syapin and Alkana, 1988) and thenumber of microglia remains increased at least a month after the bingein some regions (Fig. 4). The long-term persistence of some level of acti-vation supports the theory that cells could be “primed” by the initialdamaging binge exposure. Furthermore, repeated cycling could alsochange the microglia response to secondary neuroimmodulators suchas systemic inflammation (Qin et al., 2008; Zahr et al., 2010) whichcould be crucial when considering that a large number alcoholics havesystemic inflammation associated with liver disease (Polednak, 2012;Seth et al., 2011; Wang et al., 2012). This observation is importantclinically as human binges tend to occur in an episodic nature andbinge-pattern drinkers have a greater likelihood of neurodegeneration(Hunt, 1993). Thus, our data is consistent with the idea that an initial“hit” of binge-induced damage appears to partially activate microglia asa consequence of damage, but if this partial activation primes microglia,secondary “hits” or binge exposure could “polarize” or result in amore classical activation phenotype and/or inflammation. Althoughthis study did not address polarization of microglia, nor the specificdefinitions associated with alternative or M2 activation, this could be alogical next step of the current work.
A defining hallmark of classical inflammation is a compromisedblood brain barrier, which, based on an examination of IgG expres-sion, is not evident in the four-day binge model, the most severe ofAUDmodels. Indeed, these data agree with evidence from less acutelydamaging but longer term, chronic models of exposure such as
12 month 20% ethanol in the drinking water (Ehrlich et al., 2012).Other alcohol models, that have enhanced proinflammatory cytokineexpression, do show BBB disruption, further supporting the theorythat BBB disruption is necessary for a true neuroinflammatory event(Abdul Muneer et al., 2012). Importantly, the lack of evidence for aBBB compromise in this model strongly supports that classical inflam-mation does not occur with four-day binge exposure. Although this isonly one model of an AUD, the well-defined cell death and degenera-tion profile coupled with data reported here does not indicate thatclassical inflammation drives alcohol-induced brain damage or thatinflammation, according to classical definitions, occurs at all in thismodel.
The timecourse of expression of these various microglial markersand cytokine effects coupled with published timecourses of alcohol-induced cell death in this model (Crews et al., 2000; Kelso et al.,2011) support that alcohol-induced microglia activation is a conse-quence, not a cause of alcohol neurotoxicity. Alcohol-induced partialactivation suggests a beneficial role of microglia in this model of anAUD, especially as no reports to date have observed fully activated,phagocytic microglia in brains from alcoholics. Indeed, if you removemicroglia in many forms of neurodegeneration, worsened outcomesoccur (Wainwright et al., 2009). Microglia have diverse roles inhomeostasis, including newly defined roles in synaptic plasticityand neurotransmission (Tremblay and Majewska, 2011) and it isnot known, nor revealed by these data, how partial activation mightaffect their homeostatic actions in synaptic plasticity. Intriguingly,the lack of phagocytic microglia could have implications for synapticpruning and remodeling, especially in ongoing neurogenesis in theDG (Tremblay and Majewska, 2011). Thus, the inflammation hypoth-esis of AUD and targeting microglia in the treatment of AUDs must beconsidered with caution. Neuroinflammatory responses alone do notlead to AUDs and many of the reported microglial activation markersare expressed in the beneficial alternatively activated or acquireddeactivated microglia that help to resolve and repair damage(Colton and Wilcock, 2010). Thus, it is not just that these microgliaare activated by excessive alcohol exposure; the critical informationis their phenotype. Therefore, these data do not rule out a role for
250 S.A. Marshall et al. / Neurobiology of Disease 54 (2013) 239–251
microglia in AUDs, but do not support a direct relationship betweenalcohol, microglial activation and inflammation driven neurotoxicity.Careful consideration of these various current and previous studies,however, suggest that this partial activation phenotype could be consis-tentwith a “primed” state such that repeated bouts of damaging, exces-sive alcohol intake, which is consistent with binge-benders in AUDs,may eventually result in highly or classically activated microglia and aproinflammatory state. The immediacy of microglial activation duringalcohol intoxication,whichwas observed here, suggests that controllingthe activation state of microglia during ethanol exposure may be apotential therapeutic target for AUDs. If microglia can be limited toonly partial activation, perhaps they may be beneficial to endogenousrepair systems after alcohol-induced neurodegeneration.
Acknowledgments
The authors thank M. Ayumi Deeny and David Eaves for their tech-nical assistance. This research was supported by NIAAA R01AA016959and NIDA T32DA016176.
References
Abdul Muneer, P.M., Alikunju, S., Szlachetka, A.M., Haorah, J., 2012. The mechanisms ofcerebral vascular dysfunction and neuroinflammation by MMP-mediated degrada-tion of VEGFR-2 in alcohol ingestion. Arterioscler. Thromb. Vasc. Biol. 32, 1167–1177.
Alfonso-Loeches, S., Pascual-Lucas, M., Blanco, A.M., Sanchez-Vera, I., Guerri, C., 2010.Pivotal role of TLR4 receptors in alcohol-induced neuroinflammation and braindamage. J. Neurosci. 30, 8285–8295.
Bauer, J., Sminia, T., Wouterlood, F.G., Dijkstra, C.D., 1994. Phagocytic activity ofmacrophages and microglial cells during the course of acute and chronic relapsingexperimental autoimmune encephalomyelitis. J. Neurosci. Res. 38, 365–375.
Benavides, J., Dubois, A., Scatton, B., 2001. Peripheral type benzodiazepine binding sitesas a tool for the detection and quantification of CNS injury. Curr. Protoc. Neurosci.16 (Chapter 7:Unit7).
Bethea, J.R., Nagashima, H., Acosta, M.C., Briceno, C., Gomez, F., Marcillo, A.E., Loor, K.,Green, J., Dietrich, W.D., 1999. Systemically administered interleukin-10 reducestumor necrosis factor-alpha production and significantly improves functional recov-ery following traumatic spinal cord injury in rats. J. Neurotrauma 16, 851–863.
Bilbo, S.D., Schwarz, J.M., 2009. Early-life programming of later-life brain and behavior:a critical role for the immune system. Front. Behav. Neurosci. 3, 14.
Bland, S.T., Beckley, J.T., Young, S., Tsang, V., Watkins, L.R., Maier, S.F., Bilbo, S.D., 2010.Enduring consequences of early-life infection on glial and neural cell genesis withincognitive regions of the brain. Brain Behav. Immun. 24, 329–338.
Blednov, Y.A., Ponomarev, I., Geil, C., Bergeson, S., Koob, G.F., Harris, R.A., 2012.Neuroimmune regulation of alcohol consumption: behavioral validation of genesobtained from genomic studies. Addict. Biol. 17, 108–120.
Block, M.L., Hong, J.S., 2005. Microglia and inflammation-mediated neurodegeneration:multiple triggers with a common mechanism. Prog. Neurobiol. 76, 77–98.
Carson, M.J., Bilousova, T.V., Puntambekar, S.S., Melchior, B., Doose, J.M., Ethell, I.M.,2007. A rose by any other name? The potential consequences of microglial hetero-geneity during CNS health and disease. Neurotherapeutics 4, 571–579.
Chiang, C.S., Stalder, A., Samimi, A., Campbell, I.L., 1994. Reactive gliosis as a conse-quence of interleukin-6 expression in the brain: studies in transgenic mice. Dev.Neurosci. 16, 212–221.
Collins, M.A., Corse, T.D., Neafsey, E.J., 1996. Neuronal degeneration in rat cerebrocorticaland olfactory regions during subchronic “binge” intoxication with ethanol: possibleexplanation for olfactory deficits in alcoholics. Alcohol. Clin. Exp. Res. 20, 284–292.
Colton, C.A., Gilbert, D.L., 1987. Production of superoxide anions by a CNS macrophage,the microglia. FEBS Lett. 223, 284–288.
Colton, C.A., Wilcock, D.M., 2010. Assessing activation states in microglia. CNS Neurol.Disord. Drug Targets 9, 174–191.
Crews, F.T., 1999. Alcohol and neurodegeneration. CNS Drug Rev. 5, 379–394.
Crews, F.T., Boettiger, C.A., 2009. Impulsivity, frontal lobes and risk for addiction.Pharmacol. Biochem. Behav. 93, 237–247.
Crews, F.T., Nixon, K., 2009. Mechanisms of neurodegeneration and regeneration inalcoholism. Alcohol 44, 115–127.
Crews, F., Nixon, K., Kim, D., Joseph, J., Shukitt-Hale, B., Qin, L., Zou, J., 2006. BHT blocksNF-kappaB activation and ethanol-induced brain damage. Alcohol. Clin. Exp. Res.30, 1938–1949.
Crews, F.T., Zou, J., Qin, L., 2011. Induction of innate immune genes in brain create theneurobiology of addiction. Brain Behav. Immun. 25, S4–S12.
Damoiseaux, J.G., Dopp, E.A., Calame, W., Chao, D., MacPherson, G.G., Dijkstra, C.D.,1994. Rat macrophage lysosomal membrane antigen recognized by monoclonalantibody ED1. Immunology 83, 140–147.
Davalos, D., Grutzendler, J., Yang, G., Kim, J.V., Zuo, Y., Jung, S., Littman, D.R., Dustin,M.L., Gan, W.B., 2005. ATP mediates rapid microglial response to local brain injuryin vivo. Nat. Neurosci. 8, 752–758.
Donato, R., 1999. Functional roles of S100 proteins, calcium-binding proteins of theEF-hand type. Biochim. Biophys. Acta 1450, 191–231.
Donato, R., 2003. Intracellular and extracellular roles of S100 proteins. Microsc. Res.Tech. 60, 540–551.
Ehrlich, D., Pirchl, M., Humpel, C., 2012. Effects of long-term moderate ethanol andcholesterol on cognition, cholinergic neurons, inflammation, and vascular impairmentin rats. Neuroscience 205, 154–166.
Engelsberg, K., Ehinger, B., Wasselius, J., Johansson, K., 2004. Apoptotic cell death andmicroglial cell responses in cultured rat retina. Graefes Arch. Clin. Exp. Ophthalmol.242, 229–239.
Fernandez-Lizarbe, S., Pascual, M., Guerri, C., 2009. Critical role of TLR4 response in theactivation of microglia induced by ethanol. J. Immunol. 183, 4733–4744.
Fiorentino, D.F., Zlotnik, A., Mosmann, T.R., Howard, M., O'Garra, A., 1991. IL-10 inhibitscytokine production by activated macrophages. J. Immunol. 147, 3815–3822.
Fishman, P.S., Savitt, J.M., 1989. Selective localization by neuroglia of immunoglobulinG in normal mice. J. Neuropathol. Exp. Neurol. 48, 212–220.
He, J., Crews, F.T., 2008. Increased MCP-1 and microglia in various regions of the humanalcoholic brain. Exp. Neurol. 210, 349–358.
Heizmann, C.W., Hunziker, W., 1991. Intracellular calcium-binding proteins: more sitesthan insights. Trends Biochem. Sci. 16, 98–103.
Hickey, W.F., 2001. Basic principles of immunological surveillance of the normal centralnervous system. Glia 36, 118–124.
Hunt, W.A., 1993. Are binge drinkers more at risk of developing brain damage? Alcohol10, 559–561.
Hwang, I.K., Yoo, K.Y., Kim, D.W., Choi, S.Y., Kang, T.C., Kim, Y.S., Won, M.H., 2006. Ionizedcalcium-binding adaptermolecule 1 immunoreactive cells change in the gerbil hippo-campal CA1 region after ischemia/reperfusion. Neurochem. Res. 31, 957–965.
Hynes, R.O., 1992. Integrins: versatility, modulation, and signaling in cell adhesion. Cell69, 11–25.
Imai, Y., Ibata, I., Ito, D., Ohsawa, K., Kohsaka, S., 1996. A novel gene iba1 in the majorhistocompatibility complex class III region encoding an EF hand protein expressedin a monocytic lineage. Biochem. Biophys. Res. Commun. 224, 855–862.
Ito, D., Imai, Y., Ohsawa, K., Nakajima, K., Fukuuchi, Y., Kohsaka, S., 1998. Microglia-specificlocalisation of a novel calcium binding protein, Iba1. Brain Res.Mol. Brain Res. 57, 1–9.
Kalehua, A.N., Streit, W.J., Walker, D.W., Hunter, B.E., 1992. Chronic ethanol treatmentpromotes aberrant microglial morphology in area CA1 of the rat hippocampus.Alcohol. Clin. Exp. Res. 16, 401.
Kato, H., Kogure, K., Araki, T., Itoyama, Y., 1995. Graded expression of immunomoleculeson activated microglia in the hippocampus following ischemia in a rat model ofischemic tolerance. Brain Res. 694, 85–93.
Kaur, C., Ling, E.A., 1992. Activation and re-expression of surface antigen in microglia fol-lowing an epidural application of kainic acid in the rat brain. J. Anat. 180, 333–342.
Kelso, M.L., Scheff, S.W., Pauly, J.R., Loftin, C.D., 2009. Effects of genetic deficiency ofcyclooxygenase-1 or cyclooxygenase-2 on functional and histological outcomesfollowing traumatic brain injury in mice. BMC Neurosci. 10, 108.
Kelso, M.L., Liput, D.J., Eaves, D.W., Nixon, K., 2011. Upregulated vimentin suggests newareas of neurodegeneration in a model of an alcohol use disorder. Neuroscience197, 381–393.
Knapp, D.J., Crews, F.T., 1999. Induction of cyclooxygenase-2 in brain during acute andchronic ethanol treatment and ethanol withdrawal. Alcohol. Clin. Exp. Res. 23,633–643.
Koob, G.F., Le Moal, M., 1997. Drug abuse: hedonic homeostatic dysregulation. Science278, 52–58.
251S.A. Marshall et al. / Neurobiology of Disease 54 (2013) 239–251
Kreutzberg, G.W., 1996. Microglia: a sensor for pathological events in the CNS. TrendsNeurosci. 19, 312–318.
Lai, A.Y., Todd, K.G., 2008. Differential regulation of trophic and proinflammatorymicroglial effectors is dependent on severity of neuronal injury. Glia 56, 259–270.
Lau, L.T., Yu, A.C., 2001. Astrocytes produce and release interleukin-1, interleukin-6, tumornecrosis factor alpha and interferon-gamma following traumatic and metabolicinjury. J. Neurotrauma 18, 351–359.
Ledeboer, A., Breve, J.J., Poole, S., Tilders, F.J., VanDam,A.M., 2000. Interleukin-10, interleukin-4, and transforming growth factor-beta differentially regulate lipopolysaccharide-induced production of pro-inflammatory cytokines and nitric oxide in co-cultures ofrat astroglial and microglial cells. Glia 30, 134–142.
Long, J.M., Kalehua, A.N., Muth, N.J., Hengemihle, J.M., Jucker, M., Calhoun, M.E., Ingram,D.K., Mouton, P.R., 1998. Stereological estimation of total microglia number inmouse hippocampus. J. Neurosci. Methods 84, 101–108.
Majchrowicz, E., 1975. Induction of physical dependence upon ethanol and the associ-ated behavioral changes in rats. Psychopharmacologia 43, 245–254.
McGeer, P.L., Kawamata, T., Walker, D.G., Akiyama, H., Tooyama, I., McGeer, E.G., 1993.Microglia in degenerative neurological disease. Glia 7, 84–92.
Morioka, T., Kalehua, A.N., Streit, W.J., 1992. Progressive expression of immunomoleculeson microglial cells in rat dorsal hippocampus following transient forebrain ischemia.Acta Neuropathol. 83, 149–157.
Morris, S.A., Eaves, D.W., Smith, A.R., Nixon, K., 2010a. Alcohol inhibition of neurogenesis:a mechanism of hippocampal neurodegeneration in an adolescent alcohol abusemodel. Hippocampus 20, 596–607.
Morris, S.A., Kelso, M.L., Liput, D.J., Marshall, S.A., Nixon, K., 2010b. Similar withdrawalseverity in adolescents and adults in a rat model of alcohol dependence. Alcohol44, 89–98.
Nimmerjahn, A., Kirchhoff, F., Helmchen, F., 2005. Resting microglial cells are highlydynamic surveillants of brain parenchyma in vivo. Science 308, 1314–1318.
Nixon, K., Crews, F.T., 2004. Temporally specific burst in cell proliferation increaseshippocampal neurogenesis in protracted abstinence from alcohol. J. Neurosci. 24,9714–9722.
Nixon, K., Kim, D.H., Potts, E.N., He, J., Crews, F.T., 2008. Distinct cell proliferation eventsduring abstinence after alcohol dependence: microglia proliferation precedesneurogenesis. Neurobiol. Dis. 31, 218–229.
NRC, 1996. Guide for the Care and Use of Laboratory Animals. The National AcademiesPress, Washington, D.C.
Obernier, J.A., White, A.M., Swartzwelder, H.S., Crews, F.T., 2002b. Cognitive deficits andCNS damage after a 4-day binge ethanol exposure in rats. Pharmacol. Biochem.Behav. 72, 521–532.
O'Keefe, G.M., Nguyen, V.T., Benveniste, E.N., 2002. Regulation and function of class IImajor histocompatibility complex, CD40, and B7 expression in macrophages andmicroglia: implications in neurological diseases. J. Neurovirol. 8, 496–512.
Paxinos, G., Watson, C., 2009. The Rat Brain in Stereotaxic Coordinate. Elsevier Academic,New York.
Penland, S., Hoplight, B., Obernier, J., Crews, F.T., 2001. Effects of nicotine on ethanoldependence and brain damage. Alcohol 24, 45–54.
Perry, V.H., Newman, T.A., Cunningham, C., 2003. The impact of systemic infection onthe progression of neurodegenerative disease. Nat. Rev. Neurosci. 4, 103–112.
Pfefferbaum, A., Lim, K.O., Zipursky, R.B., Mathalon, D.H., Rosenbloom,M.J., Lane, B., Ha, C.N.,Sullivan, E.V., 1992. Brain gray and white matter volume loss accelerates with aging inchronic alcoholics: a quantitative MRI study. Alcohol. Clin. Exp. Res. 16, 1078–1089.
Polazzi, E., Altamira, L.E., Eleuteri, S., Barbaro, R., Casadio, C., Contestabile, A., Monti, B.,2009. Neuroprotection of microglial condition medium on 6-hydroxydopamine-induced neuronal death: role of transforming growth factor beta-2. J. Neurochem.2, 545–556.
Polednak, A.P., 2012. U.S. mortality from liver cirrhosis and alcoholic liver disease in1999–2004: regional and state variation in relation to per capita alcohol consumption.Subst. Use Misuse 47, 202–213.
Qin, L., Crews, F.T., 2012. Chronic ethanol increases systemic TLR3 agonist-inducedneuroinflammation and neurodegeneration. J. Neuroinflammation 9, 130.
Qin, L., He, J., Hanes, R.N., Pluzarev, O., Hong, J.S., Crews, F.T., 2008. Increased systemicand brain cytokine production and neuroinflammation by endotoxin followingethanol treatment. J. Neuroinflammation 5, 10.
Rabchevsky, A.G., Degos, J.D., Dreyfus, P.A., 1999. Peripheral injections of Freund'sadjuvant in mice provoke leakage of serum proteins through the blood–brain barrierwithout inducing reactive gliosis. Brain Res. 832, 84–96.
Rabuffetti, M., Sciorati, C., Tarozzo, G., Clementi, E., Manfredi, A.A., Beltramo, M., 2000.Inhibition of caspase-1-like activity by Ac-Tyr-Val-Ala-Asp-chloromethyl ketoneinduces long-lasting neuroprotection in cerebral ischemia through apoptosisreduction and decrease of proinflammatory cytokines. J. Neurosci. 20, 4398–4404.
Raivich, G., Bohatschek, M., Kloss, C.U., Werner, A., Jones, L.L., Kreutzberg, G.W., 1999a.Neuroglial activation repertoire in the injured brain: graded response, molecularmechanisms and cues to physiological function. Brain Res. Brain Res. Rev. 30, 77–105.
Raivich, G., Jones, L.L., Werner, A., Bluthmann, H., Doetschmann, T., Kreutzberg, G.W.,1999b. Molecular signals for glial activation: pro- and anti-inflammatory cytokinesin the injured brain. Acta Neurochir. 21–30.
Readnower, R.D., Chavko, M., Adeeb, S., Conroy, M.D., Pauly, J.R., McCarron, R.M.,Sullivan, P.G., 2010. Increase in blood–brain barrier permeability, oxidative stress,and activated microglia in a rat model of blast-induced traumatic brain injury.J. Neurosci. Res. 88, 3530–3539.
Riikonen, J., Jaatinen, P., Rintala, J., Porsti, I., Karjala, K., Hervonen, A., 2002. Intermittentethanol exposure increases the number of cerebellar microglia. Alcohol 37,421–426.
Robinson, A.P., White, T.M., Mason, D.W., 1986. Macrophage heterogeneity in the rat asdelineated by two monoclonal antibodies MRC OX-41 and MRC OX-42, the latterrecognizing complement receptor type 3. Immunology 57, 239–247.
Saijo, K., Glass, C.K., 2012. Microglial cell origin and phenotypes in health and disease.Nat. Rev. Immunol. 11, 775–787.
Schmidt, R.H., Grady, M.S., 1993. Regional patterns of blood–brain barrier breakdownfollowing central and lateral fluid percussion injury in rodents. J. Neurotrauma10, 415–430.
Schwartz, M., Butovsky, O., Bruck, W., Hanisch, U.K., 2006. Microglial phenotype: is thecommitment reversible? Trends Neurosci. 29, 68–74.
Seth, D., Haber, P.S., Syn, W.K., Diehl, A.M., Day, C.P., 2011. Pathogenesis of alcohol-induced liver disease: classical concepts and recent advances. J. Gastroenterol.Hepatol. 26, 1089–1105.
Sierra, A., Encinas, J.M., Deudero, J.J., Chancey, J.H., Enikolopov, G., Overstreet-Wadiche,L.S., Tsirka, S.E., Maletic-Savatic, M., 2010. Microglia shape adult hippocampalneurogenesis through apoptosis-coupled phagocytosis. Cell Stem Cell 7, 483–495.
Sparks, J.A., Pauly, J.R., 1999. Effects of continuous oral nicotine administration on brainnicotinic receptors and responsiveness to nicotine in C57Bl/6 mice. Psychophar-macology (Berl) 141, 145–153.
Spittau, B., Wullkopf, L., Zhou, X., Rilka, J., Pfeifer, D., Krieglstein, K., 2012. Endogenoustransforming growth factor-beta promotes quiescence of primary microgli in vitro.Glia 12.
Stephenson, D.T., Schober,D.A., Smalstig, E.B.,Mincy, R.E., Gehlert, D.R., Clemens, J.A., 1995.Peripheral benzodiazepine receptors are colocalized with activated microglia follow-ing transient global forebrain ischemia in the rat. J. Neurosci. 15, 5263–5274.
Stoll, G., Jander, S., Schroeter, M., 2000. Cytokines in CNS disorders: neurotoxicityversus neuroprotection. J. Neural Transm. 81–89.
Streit, W.J., 1994. Microglia in the pathological brain. Nat. Inst. Alcohol Abuse Alcohol.55–68 (Report nr 94–3742).
Suzumura, A., Takeuchi, H., Zhang, G., Kuno, R., Mizuno, T., 2006. Roles of glia-derived cyto-kines on neuronal degeneration and regeneration. Ann. N. Y. Acad. Sci. 1088, 219–229.
Syapin, P.J., Alkana, R.L., 1988. Chronic ethanol exposure increases peripheral-typebenzodiazepine receptors in brain. Eur. J. Pharmacol. 147, 101–109.
Tomsovic, M., 1974. “Binge” and continuous drinkers. Characteristics and treatmentfollow-up. Q. J. Stud. Alcohol 35, 558–564.
Tremblay, M.E., Majewska, A.K., 2011. A role for microglia in synaptic plasticity?Commun. Integr. Biol. 4, 220–222.
Triguero, D., Buciak, J.B., Yang, J., Pardridge, W.M., 1989. Blood–brain barrier transportof cationized immunoglobulin G: enhanced delivery compared to native protein.Proc. Natl. Acad. Sci. U. S. A. 86, 4761–4765.
Valles, S.L., Blanco, A.M., Pascual, M., Guerri, C., 2004. Chronic ethanol treatmentenhances inflammatory mediators and cell death in the brain and in astrocytes.Brain Pathol. 14, 365–371.
Veiga, S., Carrero, P., Pernia, O., Azcoitia, I., Garcia-Segura, L.M., 2007. Translocator pro-tein 18 kDa is involved in the regulation of reactive gliosis. Glia 55, 1426–1436.
Vilhardt, F., 2005. Microglia: phagocyte and glia cell. Int. J. Biochem. Cell Biol. 37, 17–21.Vitarbo, E.A., Chatzipanteli, K., Kinoshita, K., Truettner, J.S., Alonso, O.F., Dietrich, W.D.,
2004. Tumor necrosis factor alpha expression and protein levels after fluid percussioninjury in rats: the effect of injury severity and brain temperature. Neurosurgery 55,416–424.
Wainwright, D.A., Xin, J., Mesnard, N.A., Beahrs, T.R., Politis, C.M., Sanders, V.M., Jones,K.J., 2009. Exacerbation of facial motoneuron loss after facial nerve axotomy inCCR3-deficient mice. ASN Neuro 1, e00024.
Wang, H.J., Gao, B., Zakhari, S., Nagy, L.E., 2012. Inflammation in alcoholic liver disease.Annu. Rev. Nutr. 21, 343–368.
Ward, R.J., Colivicchi, M.A., Allen, R., Schol, F., Lallemand, F., de Witte, P., Ballini, C.,Corte, L.D., Dexter, D., 2009. Neuro-inflammation induced in the hippocampus of‘binge drinking’ rats may be mediated by elevated extracellular glutamate content.J. Neurochem. 111, 1119–1128.
West, M.J., Slomianka, L., Gundersen, H.J.G., 1991. Unbiased stereological estimation ofthe total number of neurons in the subdivisions of the rat hippocampus using theoptical fractionator. Anat. Rec. 231, 482–497.
Woodroofe, M.N., Sarna, G.S., Wadhwa, M., Hayes, G.M., Loughlin, A.J., Tinker, A.,Cuzner, M.L., 1991. Detection of interleukin-1 and interleukin-6 in adult ratbrain, following mechanical injury, by in vivo microdialysis: evidence of a rolefor microglia in cytokine production. J. Neuroimmunol. 33, 227–236.
Zahr, N.M., Luong, R., Sullivan, E.V., Pfefferbaum, A., 2010. Measurement of serum, liver, andbrain cytokine induction, thiamine levels, and hepatopathology in rats exposed to a4-day alcohol binge protocol. Alcohol. Clin. Exp. Res. 34, 1858–1870.
Zhang, S., Wang, X.J., Tian, L.P., Pan, J., Lu, G.Q., Zhang, Y.J., Ding, J.Q., Chen, S.D., 2011.CD200-CD200R dysfunction exacerbates microglial activation and dopaminergicneurodegeneration in a ratmodel of Parkinson's disease. J. Neuroinflammation 8, 154.