49
Leon Keer Symposium, Symi 2010 Micromechanics Analysis of Fretting Fatigue T.N. Farris School of Engineering Rutgers University July 19, 2010

Leon Keer Symposium, Symi 2010
Micromechanics Analysis of Fretting Fatigue
T.N. FarrisSchool of Engineering
Rutgers University
July 19, 2010

Leon Keer Symposium, Symi 2010
HKS ABAQUS Brief
Fretting Fatigue of Aerospace Structures
q(x)
p(x)
local modelof contact
P
Q
Q
P
in-serviceissues
well-characterizedexperiments
life prediction
1.0E+03
1.0E+04
1.0E+05
1.0E+06
1.0E+07
1.0E+04 1.0E+05 1.0E+06 1.0E+07Experiment (cycles)
Pred
icte
d (c
ycle
s)
Remote R = 0.0, NiRemote R = 0.0, NfRemote R = 0.5, NiRemote R = 0.5, Nf
ai = 0.001ci = 0.005
Leon: “focus on real problems”

Leon Keer Symposium, Symi 2010
Fretting Fatigue Experiment
INSTRON 8501
INSTRON
Fo
Q Q
F
P
Qq(x)
p(x)

Leon Keer Symposium, Symi 2010
P Q fretting
cracks
R
o
Q
F
Fo
2Q = Fo - FFo = o A
(A is the Area of cross section)
•
Oscillating o
creates an oscillatory tangential force, Q (fretting contact).•
Specimen is cycled to failure.•
Nominally flat pads are used to simulate blade/disk fretting contact•
The test is designed so that conditions of partial slip exist at
the contact interface.•
is measured by increasing 0
until gross sliding occurs at the contact interface
Szolwinski & Farris (1998), Wear

Leon Keer Symposium, Symi 2010
Mechanics of Fretting

Leon Keer Symposium, Symi 2010

Leon Keer Symposium, Symi 2010
Coupled Thermoelasticity
•
Helmholtz free energy
–
strain and temperature are independent variables–
For isotropic body, constitutive relation becomes
–
where
and are isothermal Lamé
constants
•
Heat conduction in terms of strain
Tijkkijij )23(2
iillkkv TTKTTCTk
.2
.3
.2
),(),(),( TTsTuTf ijijij

Leon Keer Symposium, Symi 2010
Infrared Thermography
•
Modular forward looking infrared (FLIR) sensor
•
Offers full-field real-time temperature measurement with resolution down to 10 m
•
Relies on an InSb focal plane array to convert thermal radiation to intensity values
•
Sensitivity of 0.025 K•
Calibration performed between intensity and temperature
•
Uniaxial tension tests used for verification

Leon Keer Symposium, Symi 2010
Fully-Coupled Thermoelasticity
kkp
oo C
TT
theoretical temperature =
Uniaxialtension

Leon Keer Symposium, Symi 2010
Temperature Measurement
Imaging region
specimen strain gagesload cell washer
beam strain gages

Leon Keer Symposium, Symi 2010
Szolwinski, et al, ASMEJOT (1999)

Leon Keer Symposium, Symi 2010
Partial Slip (Ti-6Al-4V)P = 1200N/mm(Q/P)max = 0.35 (Q/P)min = -0.19 o = 283 MPa R-ratio = 0.51radius = 127 mm
Harish, et al, ASTM 1367(2000)

Leon Keer Symposium, Symi 2010
Aluminum TemperatureP = 504 N/mm(Q/P) = 0.34 o
= 100 MPa R-ratio = -1radius = 178 mm
0 0.5 1 1.5x/a, normalized distance from interface on pad
-0.1
0
0.1
0.2
ΔT(K
)
FEM (partial slip)FEM (gross sliding)Experiment (partial slip)Experiment (gross sliding)
•Harish, et al, ASTM,2000
Leon Keer Symposium, Symi 2010
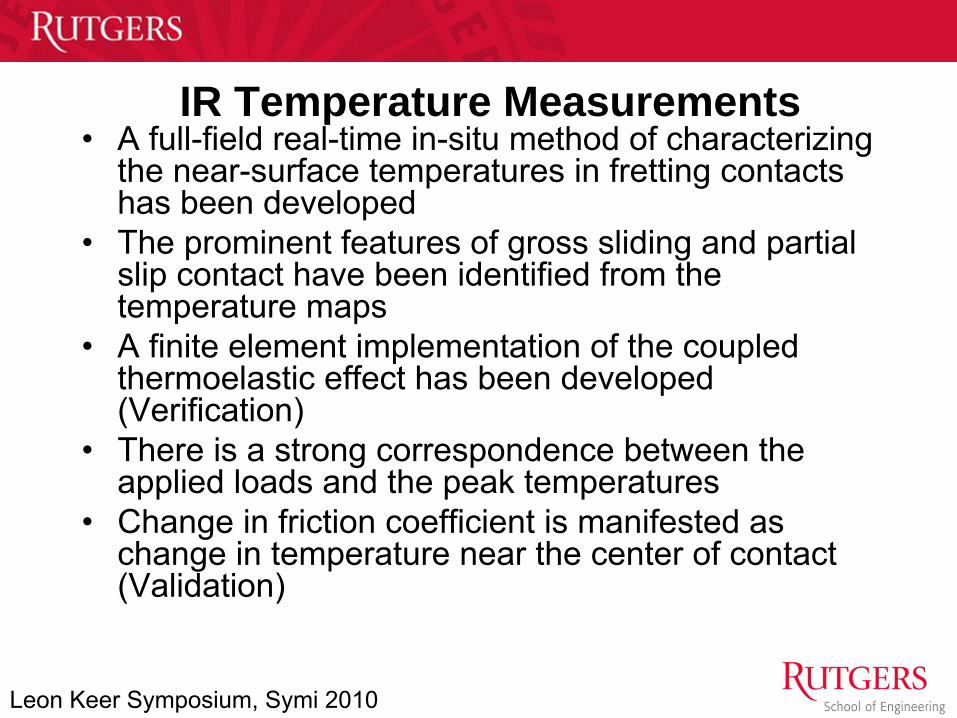
IR Temperature Measurements•
A full-field real-time in-situ method of characterizing the near-surface temperatures in fretting contacts has been developed
•
The prominent features of gross sliding and partial slip contact have been identified from the temperature maps
•
A finite element implementation of the coupled thermoelastic effect has been developed (Verification)
•
There is a strong correspondence between the applied loads and the peak temperatures
•
Change in friction coefficient is manifested as change in temperature near the center of contact (Validation)

Leon Keer Symposium, Symi 2010Q
P
rotating disk(bulk inertial
stress)
bladeroot
contactsurface
high-frequencyaeroelastic drivers
and system vibrations
M
P
Qx
y
g (x)
1
2
o
Blade/Disk Contact Model
dovetail joint
Contact Surface Geometry
equivalent contact problem
x
y
g (x)
1
2 o
1 2 1( ) ( ) ( ,0) ( ,0)o y y og x g x u x u x C C x

Leon Keer Symposium, Symi 2010
QP
MVariation of Q and P in Blade-Disk Dovetail
•
Blade slides outward (along COF line) into dovetail during disk speed acceleration
•
At maximum speed, bulk sliding stops and the ends of the contact
are in partial slip
–
At lower speeds and during mission cycling, the shear load can experience both large ranges and changes in direction
•
When the speed decreases to the point the the shear load to normal load exceeds the COF, the blade will slide inward toward the disk bore (Gean and Farris, JAM, In-Press)
-2000
0
2000
4000
0 2000 4000 6000
Normal Force (lb)Ta
ngen
tial F
orce
(lb) Purdue
GEAECOF
Max speed point
Unlock point
Region of m
ission
cycli
ng

Leon Keer Symposium, Symi 2010
Modeling Pressure Distribution
Step 2: obtain series representation of contact geometry through discrete Fourier sine transform
Step 3: relate series representation of geometry to pressure distribution
ngdxdg
nn
o sin1
11
sin/sinsinn
nn
n npng
Step 1: governing equation
a
a
o
sxdsspC
dxdg )(
4)1(2
1
Step 5: obtain pressure distribution (FFT)
1
sin/sin)(n
no nppp
Step 4: use force and moment balance to obtain po and p1
212;
aPdp
aPpo
a is contact halfwidth, P is the applied force, d is the moment arm
Murthy, Harish, and Farris, JOT (2004), Leon and collaborators have made much progress in application of FFT to contact, including thermal effects

Leon Keer Symposium, Symi 2010
Flat with Rounded Edges2b = flat length2a = contact length
R
2b2a
McVeigh etal,IJF, 1999

Leon Keer Symposium, Symi 2010
Nominally Flat Contacts
Pressure Only
-200000
-150000
-100000
-50000
0
50000
100000
-0.03 -0.02 -0.01 0 0.01 0.02 0.03
X [inch]
Stre
ss [p
si]
SIG_X
SIG_Y
SIG_Z
SIG_XY
Pressure +Sliding
-200000
-150000
-100000
-50000
0
50000
100000
-0.03 -0.02 -0.01 0 0.01 0.02 0.03
X [inch]
Stre
ss [p
si]
SIG_X
SIG_Y
SIG_Z
SIG_XY
Frictional force, Q
Local Tension at trailing edge
Local Compression
at leading edge
Weight of block, P
Weight of block, P
x
y
•
Addition of shear load (Q) results in highly localized stress at leading and trailing edges
•
When the direction of shear load reverses, the leading edge becomes the trailing edge resulting in a very large fatigue cycle

Leon Keer Symposium, Symi 2010
2Q
= h (0
-)h = 0.60 in
Analysis of Fretting Experiments
Q
t
y
xH(x)
PQ
1
2
zPQ
R
o
QP
h
x
yz
•
Fretting contact is modeled as 2D, i.e., ux
, uy
, uz
only depend on x and y.•
For anisotropic materials uz
(x,y) is not necessarily zero out of plane relative slip out of plane shear traction.
•
The specimen is modeled as a half-space subject to remote stress.
M

Leon Keer Symposium, Symi 2010
P, M, Q applied simultaneously
No Slip AnywhereP,M applied followed by Q
Partial Slip
Example Load History Effects
•The final loads are the same for each of these examples•Integral equations can be used for “Representative” missions can be •For dissiimilar materials, slip zones may be too small to resolve,
Rajeev and Farris, JSA (2002)
−0.05 0 0.05 0.1 0.15 0.2−2
−1.5
−1
−0.5
0
0.5
1
1.5
2x 10⁴
inches
psi
Pressure and Shear Tractions
mu * pshear
−0.05 0 0.05 0.1 0.15 0.2−2
−1.5
−1
−0.5
0
0.5
1
1.5
2x 10⁴
inches
psi
Pressure and Shear tractions
mu * pshear
Goryacheva, Murthy and Farris, IJF, (2002), Sundaram and Farris, IJSS, (2009)

Leon Keer Symposium, Symi 2010
Surface Observations
Fracture surface
Fatigue crack growth Fast fracture
Fretting debris
Fretting debris
TrailingEdges
TrailingEdges
Right pad
Left pad
Left pad
Right pad
Failure Test
Run-out Test

Leon Keer Symposium, Symi 2010
Ti-6Al-4V on Ti-6Al-4V Experiments
Inputs Measured Calculated
Exp. P (lbs/in) max (ksi) R Qmax
(lbs/in) Qmin
(lbs/in) Nf eq (ksi) Ni Nprop
PR02 9176 39.7 -0.07 3916 -3337 54,744 67.1 4847 40,957 PR03 9080 32.0 -0.06 3129 -2580 160,628 63.6 6268 197,952 PR04 9104 35.2 -0.02 3220 -2636 144,242 67.1 4847 146,177 PR05 9451 42.7 -0.01 3868 -3204 39,947 68.2 4504 41,327 PR06 9525 40.5 -0.03 3739 -3283 69,279 68.6 4388 54,778 PR07 9099 38.1 -0.05 3479 -3260 93,930 66.1 5197 85,586 PR09 9995 48.1 -0.01 4607 -3775 26,391 71.1 3762 19,146 PR10 9432 48.4 -0.02 3309 -1893 386,049 65.0 5630 232,404 PR11 6669 41.9 0.49 2337 -1425 337,578 56.4 12,427 157,986 PR12 6709 49.8 0.50 2389 -2029 161,986 59.2 9229 68,385 PR16 6677 50.1 0.49 3080 -1461 168,637 58.2 10,208 37,282 PR22 6763 42.1 0.50 2293 -1464 1,285,642 57.4 11,112 135,940 PR23 6787 46.0 0.50 2719 -1369 245,311 57.6 10,875 65,229 PR13 6792 34.8 0.49 1978 -1122 1,728,051 54.8 15,086 471,084 PR14 6768 39.0 0.49 1978 -1524 1,000,038 58.7 9700 595,004 PR17 6717 41.9 0.49 2304 -1472 1,000,863 54.6 15,479 129,113 PR20 6755 39.0 0.49 2436 -1079 1,502,266 57.7 10,749 210,079

Leon Keer Symposium, Symi 2010
Life Prediction
•
Alternating Walker equivalent stress, equiv
was calculated at each point. The maximum stresses, max
was capped at 110ksi as a first approximation to account for plasticity
)1(max )()(5.0 ww
psuequiv w = walker equivalent stress component
(w = 0.433 was used for calculations)
•
More weightage
is given to max. tensile stress•
The stress invariants at a given location are defined as
)(6)()()(2
1 2zx
2yz
2xy
2xxzz
2zzyy
2yyxxpsu
)(6)()()(22
222222zxyzxyxxzzzzyyyyxxmean
meanpsumax
Murthy et al (2001) Jap. Soc. Mat. Sci
Leon Keer Symposium, Symi 2010
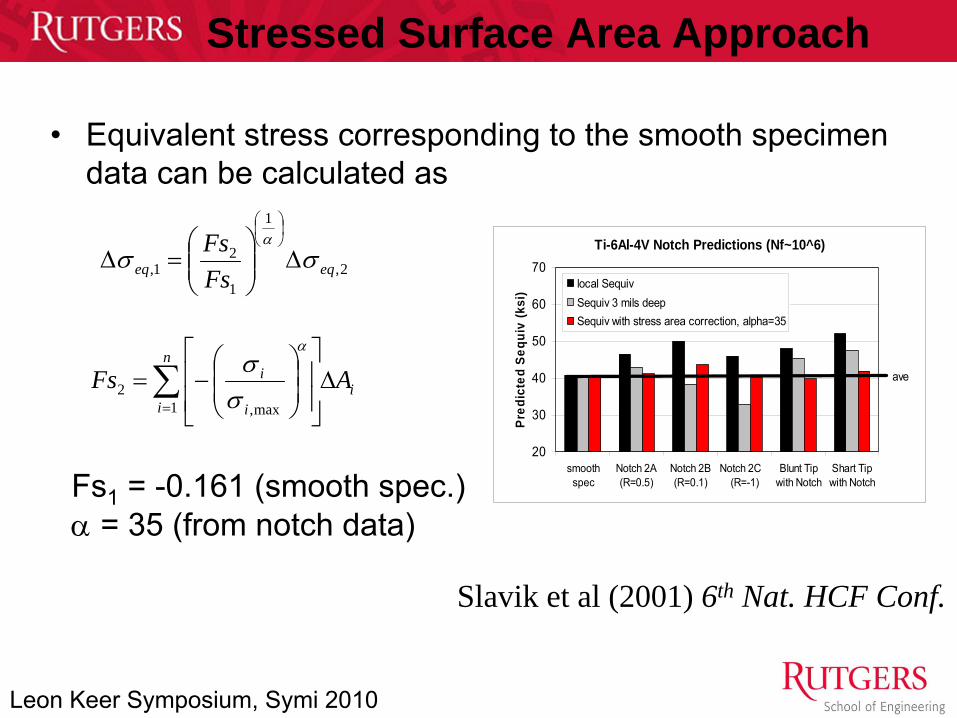
Stressed Surface Area Approach
•
Equivalent stress corresponding to the smooth specimen data can be calculated as
2,
1
1
21, eqeq Fs
Fs
i
n
i i
i AFs
1 max,2
Fs1
= -0.161 (smooth spec.)
= 35 (from notch data)
Slavik et al (2001) 6th Nat. HCF Conf.
Ti-6Al-4V Notch Predictions (Nf~10^6)
20
30
40
50
60
70
smoothspec
Notch 2A(R=0.5)
Notch 2B(R=0.1)
Notch 2C (R=-1)
Blunt Tipwith Notch
Shart Tipwith Notch
Pred
icte
d Se
quiv
(ksi
) local SequivSequiv 3 mils deepSequiv with stress area correction, alpha=35
ave

Leon Keer Symposium, Symi 2010
Fretting Pad Fractography•
Heat tinting is useful for identifying cracks
•
Featureless fracture surface and transition region•
Fretting fatigue cracks nucleate throughout the edge of contact with similar shapes and sizes
•
Transgranular
growth perpendicular to surface•
Severe wear and debris obscure fretting fatigue cracks on specimens
Fretting Crack
Fretting Crack Transition Stage
Fatigue Propagation

Leon Keer Symposium, Symi 2010
Fretting Crack Growth•
Transgranular Crack Growth
•
Crack Growth perpendicular to surface
•
Example at a Polished depth of 0.0365 inches
Multiple Cracks
Transgranular Growth
Interface Direction Change Position
0.375”
Depth
Contact Face

Leon Keer Symposium, Symi 2010
Life Prediction Comparison•
Golden and Grandt, Eng Frac Mech, 2004
•
Ti-6-4 on Ti-6-4–
Two groups•
P = 9300 lb/in, R = 0•
P = 6700 lb/in, R = 0.5
•
Life predictions–
Nf
= Ni
+ Nprop–
Ni
from eq
•
Total life prediction–
1-2 orders of magnitude above Ni
–
Good comparison with experiment using conventional life prediction tools
1.0E+03
1.0E+04
1.0E+05
1.0E+06
1.0E+07
1.0E+04 1.0E+05 1.0E+06 1.0E+07Experiment (cycles)
Pred
icte
d (c
ycle
s)
Remote R = 0.0, NiRemote R = 0.0, NfRemote R = 0.5, NiRemote R = 0.5, Nf
ai = 0.001ci = 0.005
Leon and others applied fracture mechanics tocontact fatigue in the 80sApplied to various surface treatments, Murthy,Msies, and Farris, Trib Int (2009)

Leon Keer Symposium, Symi 2010
High Temperature Experiments
•
Load transfer based on a principle similar to that of room temperature fretting rig•
Igniters used for heating the specimen and the pads, locally, to high temperature•
Temperature controller unit designed using the output of thermocouple as input signal•
Ceramic shields to prevent loss of heat•
Water used to cool the chassis and the wedges that grip the specimen

Leon Keer Symposium, Symi 2010
Coefficient of Friction Results
•
Similar evolution in μ
for peened and unpeened Rene’
88
•
More rapid evolution and saturation of μ
for Rene’
95–
Higher initial μ
for Rene’
95–
Similar μ
for Rene’
95 after 500-2000 cycles
•
Only able to determine μ
after 2,000 cycles because of hardware limitations–
Continued increase in μ
after 2,000 minimal
–
Near saturation in μ
evolution between 1,000 and 2,000 cycles

Leon Keer Symposium, Symi 2010
Baseline Results•
8 baseline experiments–
Rene’
95 specimen–
Rene’
80DS, pads
•
Normal load constant at 15,000 lbs/in
•
Bulk stress ratio constant at 0.05
•
Variable maximum bulk stress
•
Determine maximum bulk stress to produce 100,000 cycle life

Leon Keer Symposium, Symi 2010
Effect of Material and Surface Treatment•
2x increase in life between peened/unpeened Rene’
95–
Elevated temperature (600 ˚F) in Ti-17 shows similar improvement in life, Gean, et al. (2006)
•
10% increase in life between peened/unpeened Rene’
88•
Peened Rene’
95 longer life than peened Rene’
88•
Unpeened
Rene’
95 shorter life than unpeened Rene’
88
Material Shot Peen Material Shot PeenRene' 88 No Rene' N5 No 3 68,144 7,264Rene' 88 7A Rene' N5 7A 3 82,185 15,001Rene' 95 No Rene' 80 No 3 49,774 6,885Rene' 95 7A Rene' 80 7A 3 109,707 28,156
Specimen Average N Standard Deviation N# ExpsPads

Leon Keer Symposium, Symi 2010
Block Loading
0 10 20 300
100
200
300
400
500
600
Cycle Number
σ max
, MP
a
•
Left plot demonstrates simple block loading–
1 Major cycles with σmax
~550 MPa•
Rσ
~0–
30 Minor cycles with σmax
~550 MPa•
Rσ
~.5•
Right plot demonstrates block loading plus overpeak–
Similar to simple block loading with 10% overload
0 10 20 300
100
200
300
400
500
600
Cycle Number
σ max
, MP
a
Leon Keer Symposium, Symi 2010
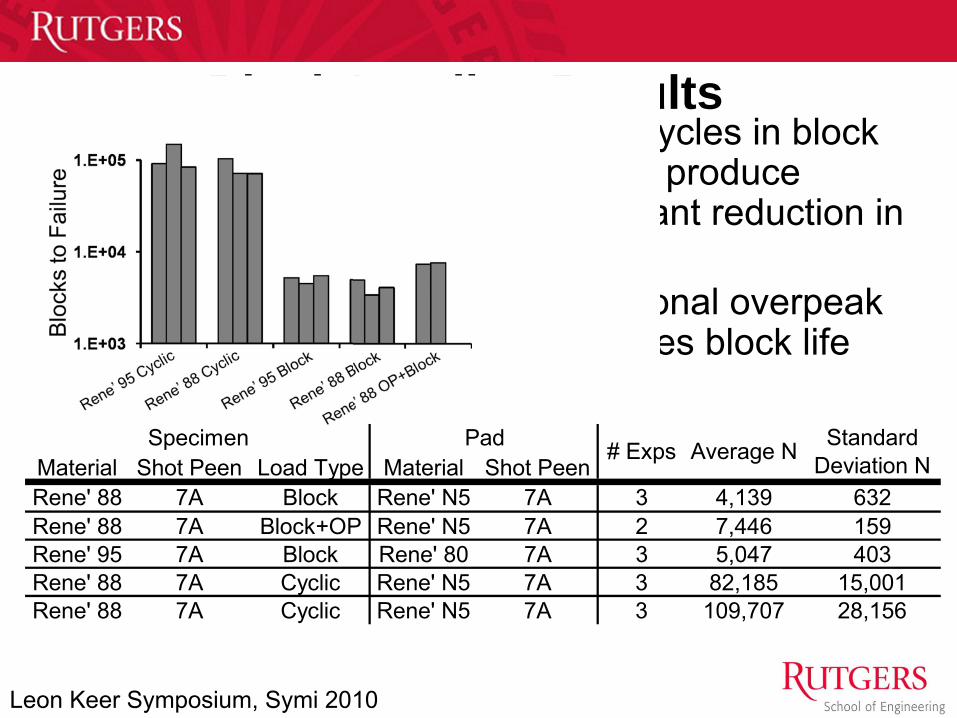
Block Loading Results•
Minor cycles in block loading produce significant reduction in life
•
Occasional overpeak increases block life
Material Shot Peen Load Type Material Shot PeenRene' 88 7A Block Rene' N5 7A 3 4,139 632Rene' 88 7A Block+OP Rene' N5 7A 2 7,446 159Rene' 95 7A Block Rene' 80 7A 3 5,047 403Rene' 88 7A Cyclic Rene' N5 7A 3 82,185 15,001Rene' 88 7A Cyclic Rene' N5 7A 3 109,707 28,156
Average N Standard Deviation N
Specimen Pad # Exps
Leon Keer Symposium, Symi 2010
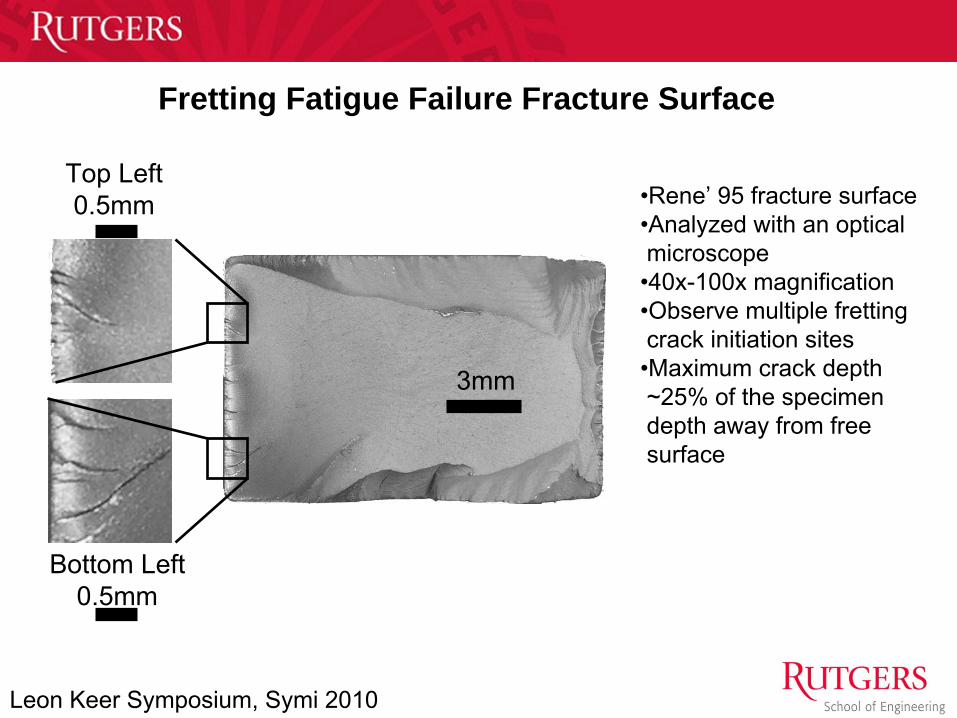
Fretting Fatigue Failure Fracture Surface
3mm
Top Left0.5mm
Bottom Left0.5mm
•Rene’
95 fracture surface•Analyzed with an opticalmicroscope•40x-100x magnification•Observe multiple frettingcrack initiation sites•Maximum crack depth ~25% of the specimendepth away from freesurface

Leon Keer Symposium, Symi 2010
5,000 Cycle Interrupted Test5,000 Cycle Interrupted Test (Unpeened)Left Edge of Contact Fracture Surface 1mm
0.2mm
Separate Cracks
Right Crack Edge
LargestCrack
•Multiple cracks•‘Almost’
edge crack•Shallow depth
Gean, Tate, and Farris, SDM 2009

Leon Keer Symposium, Symi 2010
Conclusions•
Attachment fatigue can be reproduced under controlled laboratory conditions
•
Characterization of the contact mechanics through a combination of experiments and analysis allows use of conventional life prediction tools
•
Analysis tools have been adopted by OEMs•
Robust characterization of load history effects (Minor cycles are very damaging)
•
Many fretting fatigue crack initiation sites–
Cracks semi-elliptical–
Link together to form edge crack early in experiment•
Shot peening
produces slight life improvement, 2x
Rene’
95, 10% Rene’
88

Leon Keer Symposium, Symi 2010
QP
M
Vision of EoC Implementation by OEMs
Prediction of local stress fields using history dependent integral
equations (reduction in analysis time vs. FEM)
depth
0
0.2
0.4
0.6
0.8
1
0.00 0.02 0.04 0.06 0.08 0.10Depth [inch]
Nor
mal
ized
Str
ess
EoC stress
Mission 1B
0
4000
8000
12000
16000
0 10 20 30 40 50 60 70
M ission Point
Spee
d (r
pm)
rpmM ax speedIdle speedUnlock speed
Prediction of contact loads
(P,Q,M) through mission history
(reduction in FEM analysis)
“Spring” Model
Integral EquationsIncluding different material combinations
0 2 4 6 8 10 12−4
−2
0
2
4
6
8
P (kips/in)
Q (
kips
/in)
Q vs. P for the Individual Tangs
Bottom TangTop Tang

Leon Keer Symposium, Symi 2010
•
M.P. Szolwinski, Ph.D., 1997, Section Mgr, GE, ASME Marshall Peterson Tribology Research Award
•
P.A. McVeigh, Ph.D., 1998, Boeing, Mgr ISS Structural Integrity•
G. Harish, Ph.D., 1999, IQCAIS, SDM Best Paper Award•
C.R. Tieche, MS, 1999, Product Specialist, W.L. Gore & Associates•
P.T. Rajeev, Ph.D., 2001, Director, BULK Eng, Soraa, PE Publishing Award•
E. Perez-Ruberte, MS, 2001, Honeywell•
H. Murthy, PhD, 2004, IIT Madras, Associate Professor•
J.F. Matlik, PhD, 2004, Rolls-Royce Corporation, Best Student Paper, SDM•
B. Bartha, PhD, 2005, USA, Best Student Paper ASTM•
G. Gao, PhD, 2005, Cooper Tire and Rubber•
G. Msies, MS, 2006, Livermore•
S. Kumari, PhD 2007, Pratt & Whitney•
M. Gean, PhD 2008, nanoPrecision
Products, Inc.•
N.J. Tate, MS 2009, RAAF•
N. Sundaram, PhD 2009, Purdue PostDoc•
Luke Robinson, MS 2010, Air Vehicles, Wright Patterson
•
A.F. Grandt, D.B. Garcia PhD, 2005 SAIC, and P.J. Golden PhD, 2001, AFRL•
M. Okane, TNCT, T. Sakagami, Kobe University•
I. Goryacheva, Russian Academy of Sciences•
Bob VanStone and others at GEAE
Collaborators
Some of Leon’s Academic Grandchildren

Leon Keer Symposium, Symi 2010
Experimental Flowchart
postexperiment
Representation of contact
pre-experiment Material
properties
Friction Coefficientfrom friction tests
Pad profile
Experiment
specimenand pads
Analysis of fracturesurface and wear
Integral Equationsolution suite
Experimentalloads
•
Profile change due to wear•
Characteristics of contact and fracture surface
Life prediction(multiaxialparameter)
Stresses/strains foractual pad profile
•
Life prediction•
Estimation of propagation life •
Comparison with experimental lives

Leon Keer Symposium, Symi 2010
Metrology of Pads
•
Surface profiles of the pads were measured before and after the experiment using Talysurf
•
The small deviations from the prescribed profile result in significant deviations in contact tractions
•
Contact analysis of fretting experiments was carried out using smoothed “real”
profiles of the pads

Leon Keer Symposium, Symi 2010
Fretting Contact Stresses
Prescribed After, smoothed
Expt. Fret.02
P = 8160 lb/in
Qmax
= 3463 lb/in
Qmin
= -2369 lb/in
max
= 35.6 ksi

Leon Keer Symposium, Symi 2010
Load Selection•
Dovetail loading coupled normal and shear load
•
Fretting Fatigue Experiment–
Constant normal load
–
Alternating shear loadGean, M. and Farris T.,SDM
(2005)
0 0.5 1
−0.2
0
0.2
0.4
P, P/Pmax
Q, Q
/Qm
ax
Engine Startup
Engine Operation
EnginePurdue Test
P=normal loadQ=shear load

Leon Keer Symposium, Symi 2010
Objective and Approach•
Characterize the high temperature fretting fatigue behavior nickel based alloys typically used in gas turbine engines
•
Conduct fretting fatigue experiments of high temperature nickel based alloys–
Rene’
88 and Rene’
95, turbine disk materials, specimen–
Rene’
N5 and Rene’
80DS, turbine blade materials, pads
•
Tests conducted at 1200 ˚F to simulate the temperatures experienced in engine hardware–
Constant experimental conditions to determine the influence of surface treatments on life
–
Block loading experiments to determine effect of loading on fretting fatigue life
•
Observations of fretting fatigue crack morphology

Leon Keer Symposium, Symi 2010
2D Fretting Contact Model for SCN
•
Incorporating stick/slip behavior in the out-of-plane direction would mean solving three coupled SIEs
to obtain p(x), qx
(x), qz
(x).•
Problem can be simplified by assuming that the frictional traction acts only to resist motion in the x-direction, i.e., x
=
& z
=0.•
Since qz
(x)
0, the number of coupled SIEs
is reduced to two.•
Effect of the remote stress on the relative slip function and hence the contact tractions can be included as,
xE
xsxsx
xzzxc 0
)1()()( where sc (x) is the relative slip due to the contact
tractions alone and 0
is the applied remote stress.
Contact pressure and shear traction are related to the slip and gap functions by means of a pair of coupled singular integral equations (SIEs) as,
xtdt
tptq
xpxq
xHxs
x
a
a
x
2
1)()(
)()(
)()(
2221
1211
2221
1211
Relative slip at a given loading stage cannot be known beforehand. Hence, Contact problem has to be solved incrementally
P.T. Rajeev and T. N. Farris, Journal of Strain Analysis (2002)

Leon Keer Symposium, Symi 2010
0.120 in
R = 0.120 in
= 0.2z = 45o, x = 0o
Nominal pave = 100 ksi
P
Analytic RigidSurface
InfiniteElements
Q
Verification of CAFDEM (Dissimilar Anisotropic Materials)
•
2D FEM analysis to validate the SIE model when one of the material principal axes is parallel to the z-axis.
•
16400 elements with 300 elements in contact
•
Rigid indentor
used to save analysis time
•
Infinite elements to simulate elastic half space

Leon Keer Symposium, Symi 2010
3-D contact tractions
Slip zone in the vicinity of the edge
z=0 corresponds to the edge.

Leon Keer Symposium, Symi 2010
Thermal Imaging of Contact Surface
Cam
eraSchematic ofsurface imaging
Specimen
Pad
Sapphirepad onaluminumspecimen

Leon Keer Symposium, Symi 2010
High P and Overpeak Cyclic Results•
OP cyclic stress level reduces life by a factor of 2
•
10% increase in normal load reduces life by about 10%
Material Shot Peen Load Type Material Shot PeenRene' 88 7A OP Cyclic Rene' N5 7A 2 47,057 778Rene' 88 7A High P Rene' N5 7A 3 73,294 1,626Rene' 88 7A Cyclic Rene' N5 7A 3 82,185 15,001
Average N Standard Deviation N
Specimen Pad # Exps


