TROPICS Vol. 6 (Llz):105-115 Issued Oct., L996 Micrometeorological Research of Peat Swamp Forests in Narathiwat, Thailand Toshihide NacAl{o Tomoyasu IsHloa Yoshiaki Klrnva Pisoot VUanxSoRN Satoru Suzurr NODAI Research Institute, Tokyo University of Agriculture,Setagaya.ku, Tokyo 156, JAPAN Faculty of Agriculture, Utsunomiya University , Utsunomiya 321, JAPAN Faculty of Horticulture, Chiba University, Matsu do 271, JAPAN Department of I-and Development, Ministry of Agriculture and Cooperative, Bangkok 10900, THAILAND Faculty of Agriculture, Utsunomiya University , Utsunomiya 321, JAPAN ABSTRACT Deforestation in tropical forest is continuing, and may be a cause of global environmental problems. Yet how the deforestation effects the environment is somewhat obscured. As a first step, an investigation of the differences of environmental characteristics between a natural tropical forest and deforested canopies has been conducted. Some measurements in a tropical swamp forest, a secondary forest, and a reclaimed paddy field in Narathiwat province, Thailand have been carried out. The measurements are made to clarify energy and mass exchange rates between the canopies and the atmosphere using micrometeorological methods. In the forest, those measurements are being conducted from a 38 meter-high observation tower constructed in June, 1992. Results obtained show that the deforestation of the tropical swamp forest undoubtedly changes the micrometeorology, In particular, the changes clearly appear in heat, water vapor, and carbon dioxide which are transported especially during the dry season. It was proved that a newly developed system to estimate ghs flux by using the eddy accumulation theory shows excellent performances to promise reliable gases fluxes measurements in natural environment. Key Words: tropical swamp forest / deforestation / micrometeorology / heat transfer / mass transfer / eddy accumulation method Global environmental problems namely desertification, acid-rain, greenhouse effect, and so on have been a grgat concern recently. Deforestation, especially in tropical forests, is recognized to have one of the main effects on the global environmental problems. In Thailand, decreasing of tropical forests are being accelerated, and the annual decreasing rate is estimated to be around 2 to 4 Vo (The Environment Agency of Japan, 1990.). Few data are, however, available to estimate the effects of deforestation to the problems. Thus, how the deforestation influences on the environmental changes is necessary to understand. To make it clear, the micrometeorological characteristics of forests would be the most important basic information. Thus, at first effects of the deforestation upon changes of the energy and mass exchange rates between the canopies and the atmosphere are required to investigate. These exchange rates include heat, water vapor, carbon dioxide, and methane fluxes. In order to get these basic information, the research has been conducted in a tropical swamp forest and its deforested surroundings like a secondary forest and a reclaimed paddy field, in Narathiwat province the southernmost of Thailand. The measurements are mainly energy and mass exchange rates between the canopies and the atmosphere using micrometeorological methods. In this report, the characteristics of the exchange rates of gas and energy in each canopy, and a newly developed system to estimate gas flux by using the eddy accumulation theory are discussed.
Transcript
TROPICS Vol. 6 (Llz):105-115 Issued Oct., L996
Micrometeorological Research of Peat SwampForests in Narathiwat, Thailand
NODAI Research Institute, Tokyo University of Agriculture,Setagaya.ku, Tokyo 156, JAPAN
Faculty of Agriculture, Utsunomiya University , Utsunomiya 321, JAPAN
Faculty of Horticulture, Chiba University, Matsu do 271, JAPAN
Department of I-and Development, Ministry of Agriculture and Cooperative, Bangkok 10900,
THAILAND
Faculty of Agriculture, Utsunomiya University , Utsunomiya 321, JAPAN
ABSTRACT Deforestation in tropical forest is continuing, and may be a cause of global environmentalproblems. Yet how the deforestation effects the environment is somewhat obscured. As a first step, an
investigation of the differences of environmental characteristics between a natural tropical forest and
deforested canopies has been conducted.Some measurements in a tropical swamp forest, a secondary forest, and a reclaimed paddy field in
Narathiwat province, Thailand have been carried out.
The measurements are made to clarify energy and mass exchange rates between the canopies and the
atmosphere using micrometeorological methods. In the forest, those measurements are being conductedfrom a 38 meter-high observation tower constructed in June, 1992.
Results obtained show that the deforestation of the tropical swamp forest undoubtedly changes the
micrometeorology, In particular, the changes clearly appear in heat, water vapor, and carbon dioxidewhich are transported especially during the dry season. It was proved that a newly developed system toestimate ghs flux by using the eddy accumulation theory shows excellent performances to promise
reliable gases fluxes measurements in natural environment.
Key Words: tropical swamp forest / deforestation / micrometeorology / heat transfer / mass transfer /eddy accumulation method
Global environmental problems namely desertification, acid-rain, greenhouse effect, and so on have
been a grgat concern recently. Deforestation, especially in tropical forests, is recognized to have one
of the main effects on the global environmental problems. In Thailand, decreasing of tropical forests
are being accelerated, and the annual decreasing rate is estimated to be around 2 to 4 Vo (The
Environment Agency of Japan, 1990.). Few data are, however, available to estimate the effects of
deforestation to the problems. Thus, how the deforestation influences on the environmental changes is
necessary to understand.
To make it clear, the micrometeorological characteristics of forests would be the most important
basic information. Thus, at first effects of the deforestation upon changes of the energy and mass
exchange rates between the canopies and the atmosphere are required to investigate. These exchange
rates include heat, water vapor, carbon dioxide, and methane fluxes.
In order to get these basic information, the research has been conducted in a tropical swamp forest
and its deforested surroundings like a secondary forest and a reclaimed paddy field, in Narathiwat
province the southernmost of Thailand. The measurements are mainly energy and mass exchange
rates between the canopies and the atmosphere using micrometeorological methods.
In this report, the characteristics of the exchange rates of gas and energy in each canopy, and a
newly developed system to estimate gas flux by using the eddy accumulation theory are discussed.
106 T. NecANo, T. IsrnoA, Y. Knava, P. VtJeMSoN & S. Suzurt
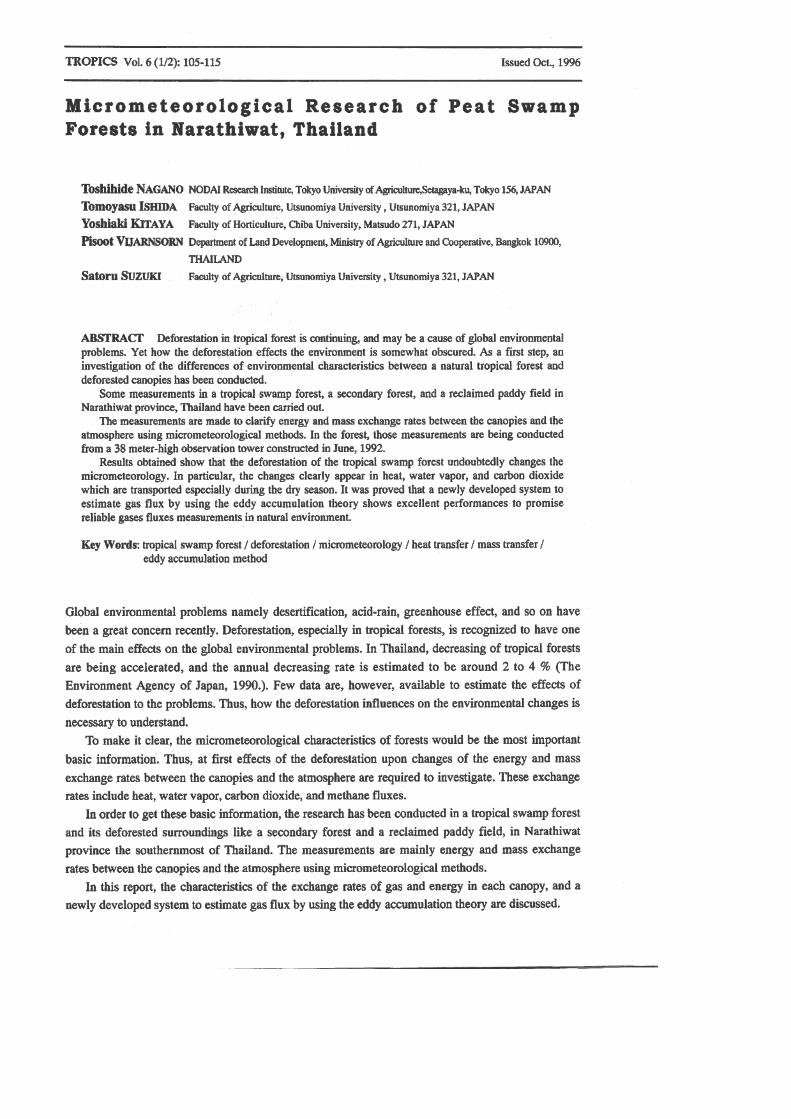
Fig. 1. Research site and precipitation at the site. Monthly average amount of precipitationmeasured at Narathiwat Meteorological Station (1973 - f991).
NAIURE OF TIIE TROPICAL SWAMP FOREST IN NARATHIWAT
In Thailand, there exists 45,264 hectares of peat swamp area in the southwest coast and in the Malay
Peninsula; especially 6O Vo of them concentrates in Narathiwat province (Vijarnsom 1992). In the
province, only 8,0fl) hectares out of the swiunp xlex lspnins as primary swamp forests (Niyomdham
L989); while the rest of it has been developed for agricultural uses or converted to wastelands andor
secondary forests. The experiments have been carried out at three sites of different vegetation covers
namely (1) To Daeng (6"4'30" N., 10L'58'20" E.) for a tropical swamp forest area, (2) Bacho (6"30'22'
N., t}l"44'42" E.) for a secondary forest area, and (3) Pikul Thong for a paddy field (6'23'17" N.,
L01'52'18" E.).
The province has 447,500 hectares in area, 2,560 mm in annual precipitation, ard 27,6 "C in
annual average temperature. Fig. 1 shows that climate of Narathiwat province is divided to a dry
season from January to September and to a rainy season from October to December.
The swamp forest is waterlogged through a year and the water depth is around 0.3 m to 0.8 m
.The swamp forest has a peat layer 0.5 to 3 m in depth (Vijarnsorn 1992) . Two hundred and ninety
eight flowering plants have been observed there, including 70 species of commercial timber trees
(Niyomdham 1989). The dominant species around the study site are Eugenia tumida Dtth., Ganua
motlqana Pierre ex Dubard, Campnosperma coriaceum (Jack) Hall. f. ex Steen. and Macaranga
pruinosa (Miq.) Muell. Arg. (Hara, et al.1995). The canopy height of the forest was about 23 m. As
for secondary forest area, the secondary forest appears to be extensively drained. However, the water
table still lies close to soil surface for most of the year. During the peak of the rainy season, the
secondary forest is commonly flooded, but for the driest month, the water table may occur at the deph
between 50 - 80 cm below the soil surface. Melaleuca cajuputi (melaleuca) and Melastoma
malabathricum (melastoma) are dominant species in Bacho secondary forest. The canopy height was
about 90 cm. The paddy field has no inigation system and rice is cultivated only in rainy season,
while in dry season the surface is dry out and weeds grow.
Micrometeorological research of peat swamp forests in Narathiwat, Thailand r07
€tro =
ooSaOOEA f
BlstooaooooE
ooE
le30m tr
A9
2om OoaArum :I
Net radiation
Rain gauge
Solar radiation
Reflection of solar radiation
Dry bulb temp.
Wet bulb temp.
CO, sampling
Horizontal wind sPeed
Vertical wind speed
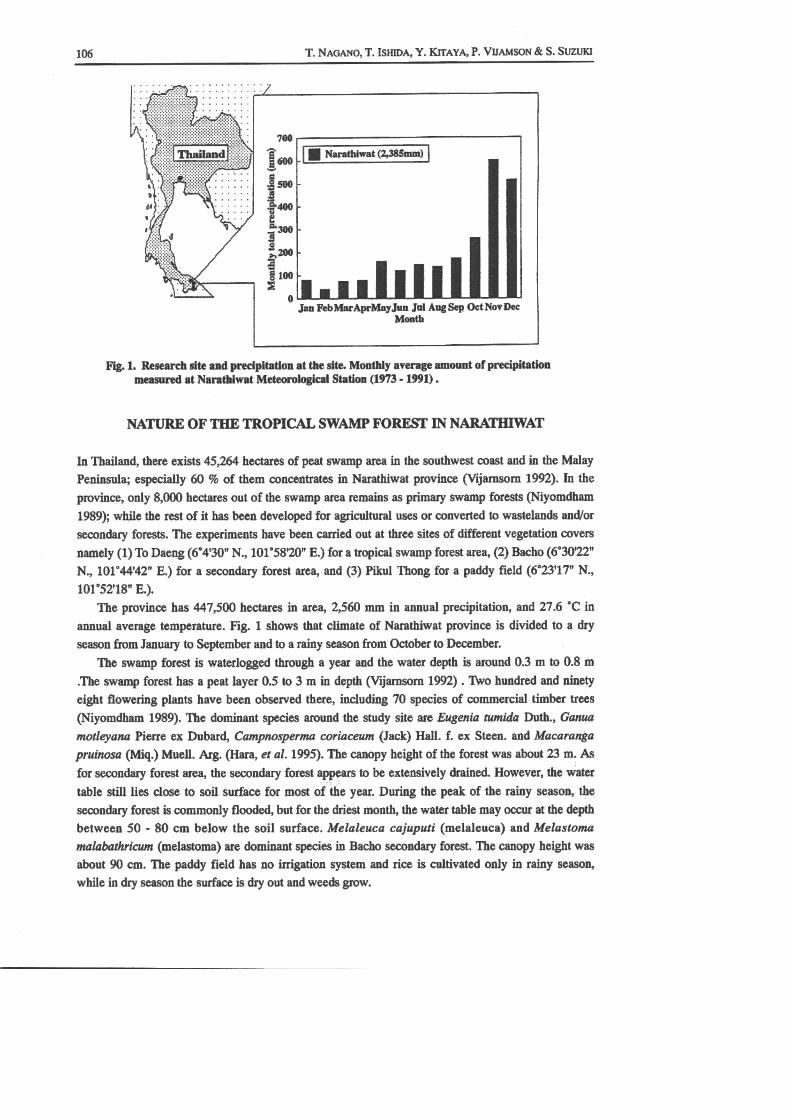
Fig. 2. Arrangement of instruments for environmental monitoring the To Daeng swamp foresl
MICROMETEOROLIOGICAL CHARACTERISTICS IN THE NATURALSWAMP FOREST AI\D DEFORESTED FOREST
In order to clarify the effects of the deforestation on the Micrometeorological sfuangoS, the heat and
mass exchange rates between the canopies and the atmosphere in the tropical swamp forest and its
deforested surroundings have been measured. The measures are fluxes of heat, water vapor, carbon
dioxide, and methane.
Method
A observation tower 38 m high was constructed in June t992 at To Daeng swamp forest with aid from
Obayashi Corporation. Using this tower, numbers of the measurements are conducted for a natural
tropical swamp forest. In Bacho, a secondary forest, and Pikul Thong, a reclaimed paddy field, the
measurements are made using observation poles about 3 m in height.
Arrangement of instruments for monitoring tropical forest is shown in the Fig' 2'
The net radiation, solar radiation and its reflection are measured with a net radiometer (Q-6
Campbell Scientific, Inc.) and photo-cell type radiometers (LI-200S2, LI-COR, Inc.), respectively.
The profiles of air temperature and the water vapor pressure above and within canopies are measured
with air flow type wet- and dry-bulb thermocouple thermometers. The temperature in soil, tree stems,
and/or pounding water are also measured with thermocouple tlennometers. Heat flux into ground is
measured with a heat flux plate (the Schmidt belt type, Eiko Co., Ltd.). The vertical profile of carbon
dioxide concentration above and within canopies is determined by an absolute type infrared carbon
dioxide analyzer (ADC Co., Ltd.) and a handmade changeover air inlet valves. The difference of
carbon dioxide concentration between two heights above the canopies is measured with a differential
type infrared carbon dioxide analyzer (Fuji Electric Co., Ltd.). Sample air for carbon dioxide
concentration measurements is inhaled continuously with polyethylene tubes. Three cups type
anemometers (03101-5 Campbell Scientific, Inc.) are used to measure horizontal wind speed profile
above canopies. Also, vertical wind speed variation together with accompanied air temperature
variation at a height above canopies is measured in 10 Hz sampling interval with ultrasonic
108 T. Nacaxo, T. lsrtroA, Y. Ifreva" P. VtrausoN & S. Suzurq
.80.8
€ o.u
k7 0.4xE o.2t6go
tst
4.2
fl -II
BIx€I6a)Itir
-EI
F.L
xa-Er,6a,x
I
i
E
BJ
x-A€-!l|rFIT
Tlmcof day (hour)LrtcntlscDdbla = 5.63
Tlme of dey (hour)LstcrUscnslbr.=2.O2
Tlmc of day (hour)LarcnUScnslbh = 5.60
Tlmcof day (hour)LsfcnUscndbh = 3.64
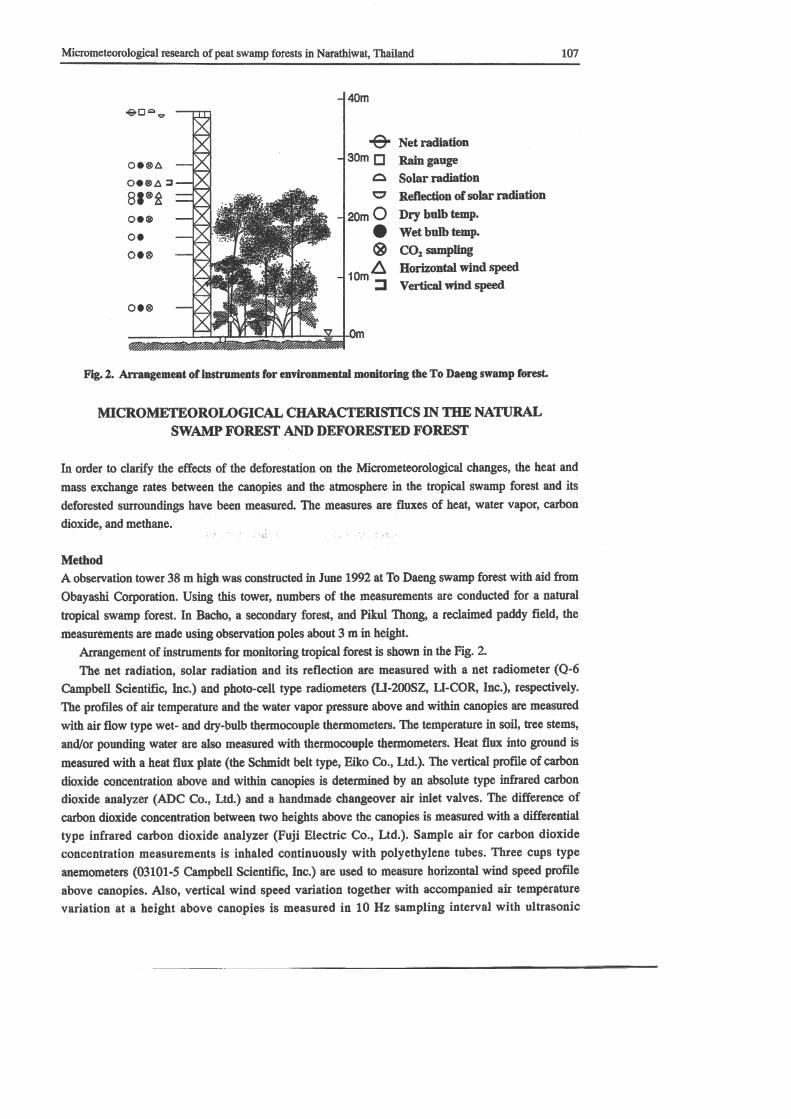
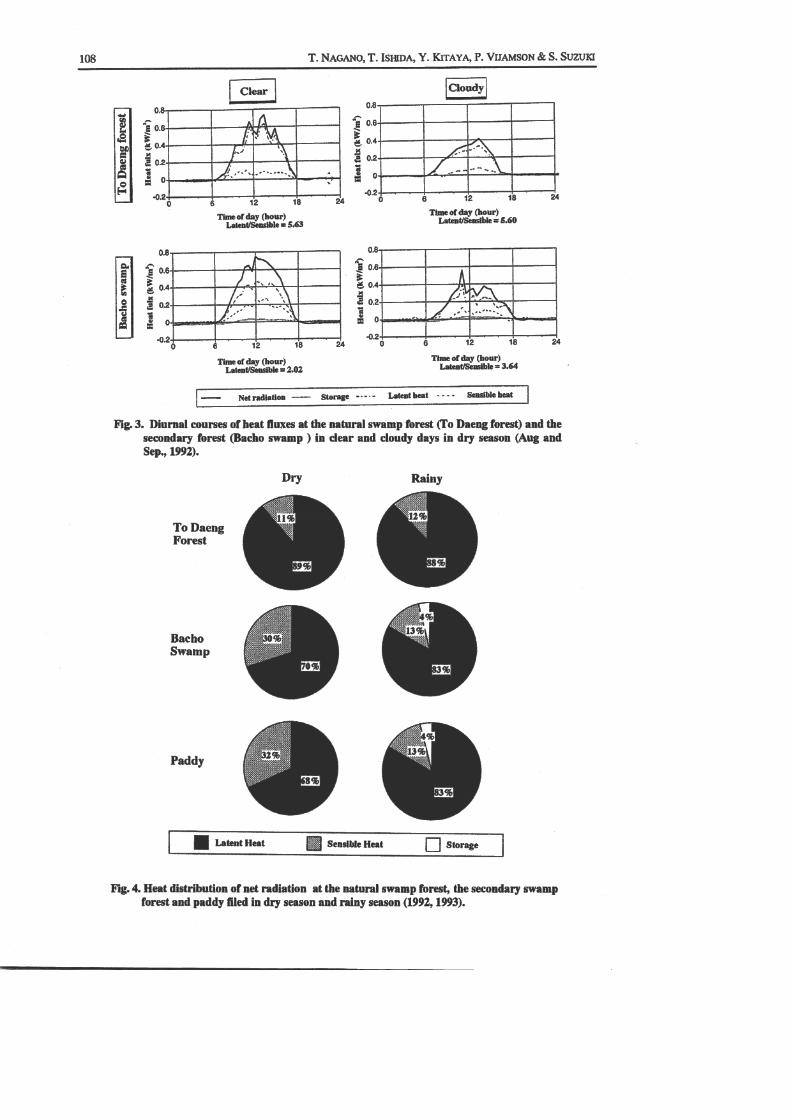
Fig 3. Diumal oourses of heat luxes at the netural swrmp lorest (lo Daeng lorest) and thesecondary forest (Bacho svomp ) in clear and cloudy days in dry seoson (Aug andSep., 1992).
Dry
To DaengForest
BachoSwamp
Paddy
I Letent Heet ffi Senslble Heet I Storage
Fig. 4. Ileat distribution of net redietion et the natuml swrmp forest, the secondary swampforest rnd paddy fited in dry season and niny seasoa (1992,1993).
Rainy
Micrometeorological research of peat swamp forests in Narathiwat, Thailand 109
PrirnaryForest
SecondaryForest
Paddy Field
33.544.555.Evapotranspiration (m m/daY)
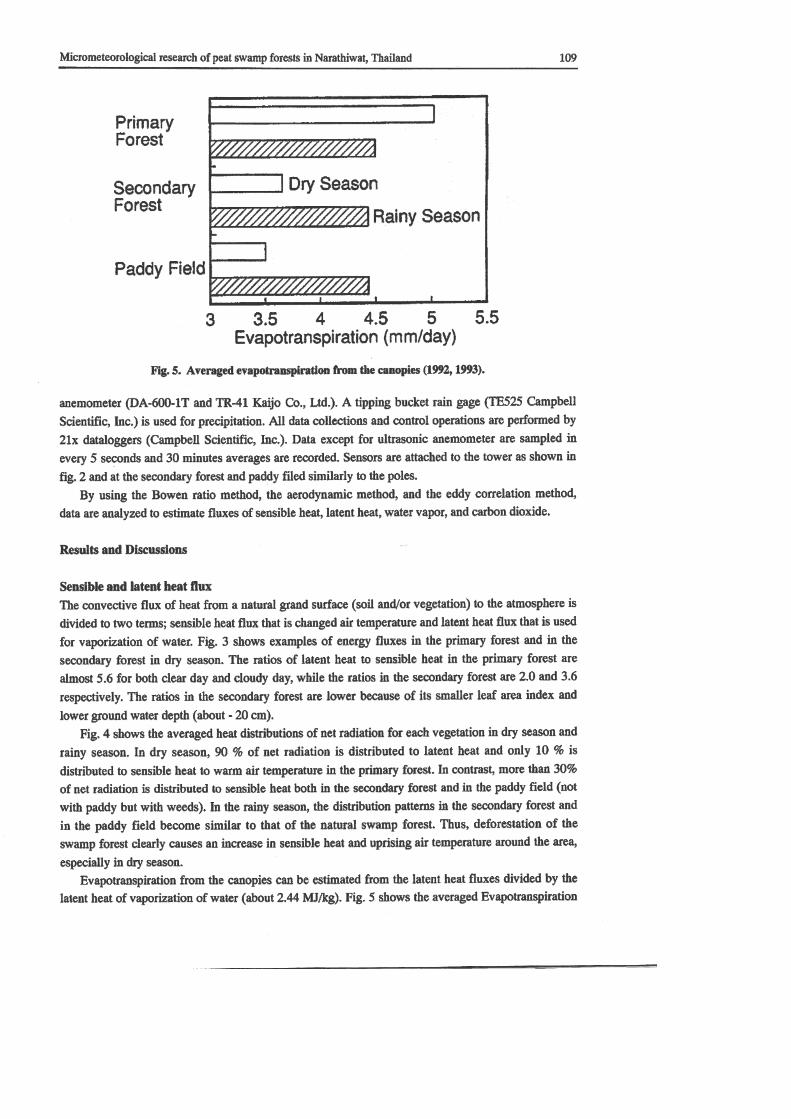
Fig.5. Averaged evapotranspiration from the canopies (1W2,1993).
anemometer (DA-600-1T and TR-41 Kaijo Co., Ltd.). A tipping bucket rain gage CIE525 Campbell
Scientific, Inc.) is used for precipitation. All data collections and control operations are performed by
21x dataloggers (Campbell Scientific, Inc.). Data except for ultrasonic anemometer are sampled in
every 5 seconds and 30 minutes averages are recorded. Sensors are attached to the tower as shown in
fig. 2 and at the secondary forest and paddy filed similarly to the poles.
By using the Bowen ratio method, the aerodynamic method, and the eddy conelation method,
data are analyzed to estimate fluxes of sensible heat, latent heat, water vapor, and carbon dioxide.
Results and Discussions
Sensible and latent heat fluxThe convective flux of heat from a natural grand surface (soil andor vegetatiou) to the atmosphere is
divided to two terms; sensible heat flux that is changed air temperature and latent heat flux that is used
for vaporization of water. Fig. 3 shows examples of energy fluxes in the primary forest and in the
secondary forest in dry season. The ratios of latent heat to sensible heat in the primary forest are
almost 5.6 for both clear day and cloudy day, while the ratios in the secondary forest are 2.0 and 3'6
respectively. The ratios in the secondary forest are lower because of its smaller leaf area index and
lower ground water depth (about - 20 cm).
Fig. 4 shows the averaged heat distributions of net radiation for each vegetation in dry season and
rainy season. In dry season, gO Vo of net radiation is distributed to latent heat and only 10 7o is
distributed to sensible heat to warm air temperature in the primary forest. In contrast, more than 307o
ofnet radiation is distributed to sensible heat both in the secondary forest and in the paddy field (not
with paddy but with weeds). In the rainy season, the distribution patterns in the secondary forest and
in the paddy field become similar to that of the natural swamp forest. Thus, deforestation of the
swamp forest clearly causes an increase in sensible heat and uprising air temperature around the area,
especially in dry season.
Evapotranspiration from the canopies can be estimated from tle latent heat fluxes divided by the
latent heat of vaporization of water (abott 2.44 Mtkg). Fig. 5 shows the averaged Evapotranspiration
Dry Season
Rainy Season
110 T. NeceNo, T. IsrilnA, Y. KlraYA, P. VueusoN & S. Suzurt
Canopy top
12Time of day (hour)
300 320 340 360 380 400 420440 460 480 500
CO, concentration (ppm)
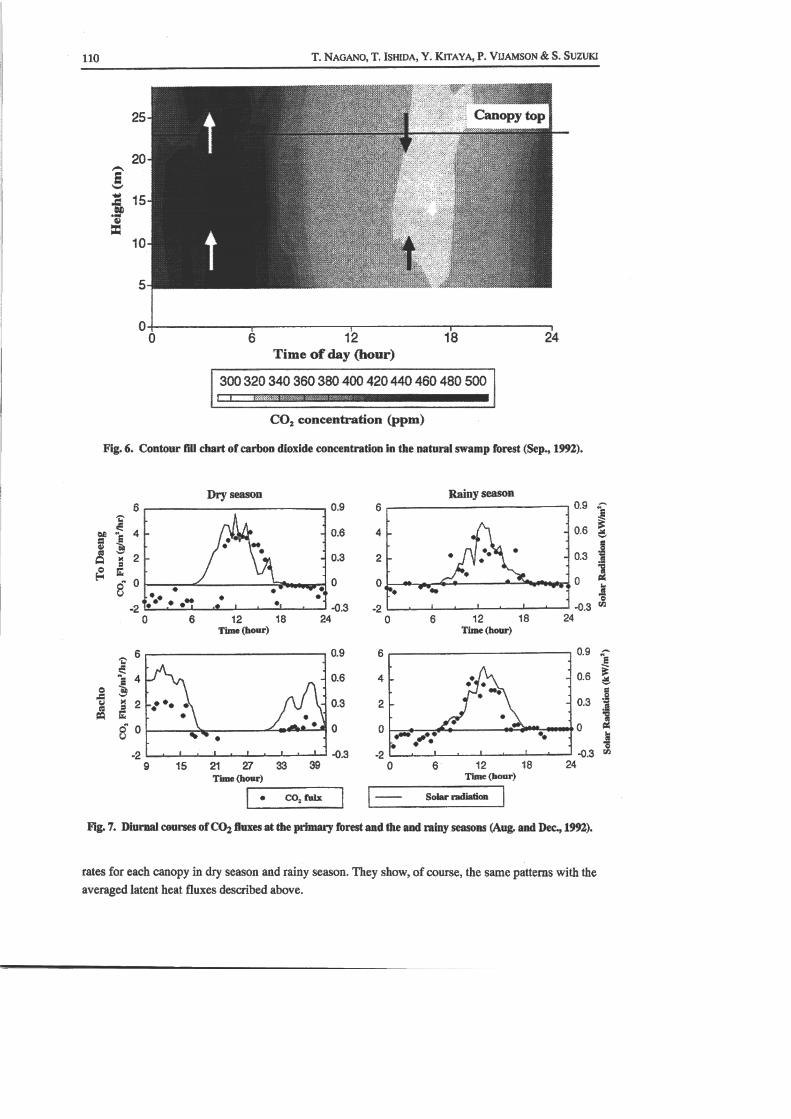
Fig.6. Contour fill chort ofcarbon dioxide concentration in the natural swamp forest (Sep., 1992).
sFIv
i15a0
.rl{)|'r
EI
,--\.o0a6Sc' \./a!A
t-( ioU
tr/-\.cl/s
ofn-\Jr-leJXe=EE
"aot)
6
4
2
0
-2
6
4
2
0
-2
12 18Time (hour)
21n33Time (hour)
0.9
0.6
0.3
0
-0.3
0.9
0.6
0.3
0
-0.3
6
4
2
0
-2
6
4
2
0
-2
Solar radiation
Rainy season
j.1 0
12 18Time (hour)
24
oa a
o--
o
a-r-^ro o- ooo
12 18Time (hour)
0.9
0.6
0.3
0
-0.3
0.9
0.6
0.3
0
-0.3
stssk-
,l(
a-oat!f.aGI
.I€6t&L6tso
CN
G'F
B&/I
o.!tF6
.I€6l&,C!so
U)
2415
. CO, fulx
Ftg.7. Diumal courses of CO2 luxes at the primary fortst and the and rainy seasons (Aug and Dec, 1992).
rates for each canopy in dry season and rainy season. They show, of course, the same pattems with the
averaged latent heat fluxes described above.
Dry season
o.t^ ao o ^ '
Micrometeorological research of peat swamp forests in Narathiwat, Thailand
Carbon dioxide fluxThere is much concerned recently over how the deforestatlsa gfuanges the net absorption of carbon
dioxide by the canopy. The contour fill chart of Fig. 6 shows the diurnal change of vertical carbon
dioxide concentration profiles in the primary forest in dry season. The concentration in the forest
decreases by increasing height from the ground to above the canopy in the nighttime, which resulted
from the respiration of plants and soil, and shows the upward flux of the gas toward the out of the
canopy. In contrast, in the daytime the lower concentration appears below the canopy top, which
shows the gas flux from both the atmosphere and the lower layer within the canopy.
Fig. 7 shows the typical carbon dioxide fluxes into the canopies from the atmosphere in almost
clear days in both dry and rainy season. The maximum fluxes in the primary forest are around 4
gm2lhr for both seasons. In the secondary forest, the maximum flux in the rainy season is around
4glmzlhr, while the flux decrease to almost the half in the dry season. The roughly averaged daily
amount of the flux into tle canopies in dry season arc22 g/m2 /day and t0 g/mz /day in the primary
forest and in the secondary forest respectively. In the rainy season, the values are 18 gh#lday, 18
glm2lday and 17 g/m2 lday in the primary forest, in the secondary forest, and in the paddy field
respectively.
The results may be useful to estimate the effect of deforestation. Further, long-term
measurements, however, should be required to ensure the best results.
DEVELOPMENT OF TIIE GAS FLUX MEASURING SYSTEMUSING EDDY ACCUMULATION METHOD
The fluxes of carbon dioxide and/or methane are considered to have influences upon global
environmental change. The chamber methods are generally used to measure the biosphere/atmosphere
fluxes of the gases, especially of methane. The measured values, however, widely varies spatially. The
site spatial variability makes it difficult to estimate gases fluxes from a field or ecosystem. The
micrometeorological methods integrate large surface area thereby reducing the spatial variability
problem. The eddy conelation method is the most reliable one to estimate the gases fluxes. However,
the method requires fast measurements of the gas concentration considered for flux shorter than 5 Hz
(every 0.2 seconds), which are almost impossible for most gases using the sensors presently existing.
Recently, the eddy accumulation method was theoretically proposed to measure scalar fluxes
using conditional gas sampling (Hicks and McMillen 1984, Businger and Oncley,1990,). The eddy
accumulation method bypasses the need for fast measurements of the gas concontration. We have
developed a new system based on this theory, checked its reliability, and measured methane flux in the
paddy field.
Method
Using the eddy accumulation method with conditional gas sampling, the gas flux, F, is obtained by:
F = b.ow (c* - c-)
where b is a coefficient to be determined by experiment, o* is a standard deviation of vertical
wind velocity during the statistically meaningful sampling period, c+ is the average concentration of
the gas transporting by the upward wind during the period, and c- is the concentration by the
downward wind.
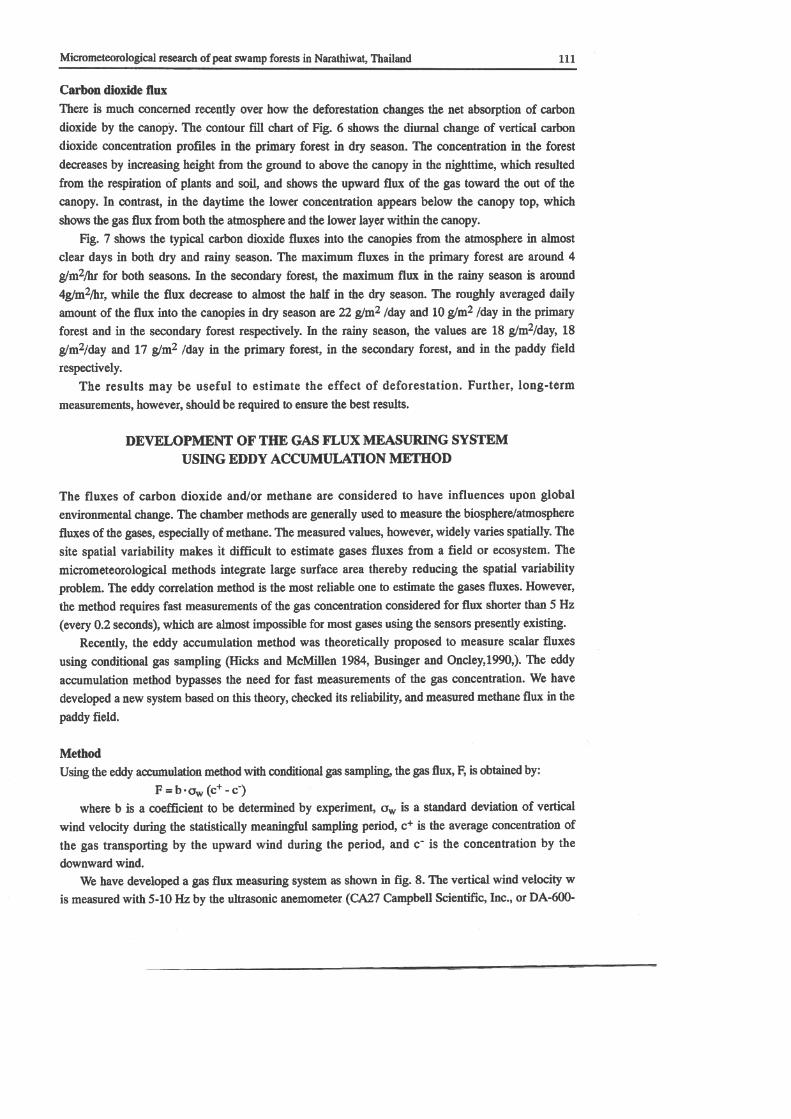
We have developed a gas flux measuring system as shown in fig. 8. The vertical wind velocity w
is measured with 5-10 Hz by the ultrasonic anemometer (CA27 Campbell Scientific, Inc., or DA-600-
111
1L2 T. NAGaro, T. IstilDA, Y. I(rtAYA, P. VuausoN & S. Suzuxl
Sonic SolenoidAnemometer Valve
RotaryFluid Swltch
Change Directionsldependlng on O)
Change Channelsin every 60min.
ffg; & Schcn dc dfurrn of gas srmp[ry systcm hr thc cddy eccrmulrdon method (khHr a al,l}!N).
Micrometeorological research of peat swamp forests in Narathiwat, Thailand LL3
o
o
CO,
0 0.5 1 1.5 2 2.5
Eddy accumulation method (gl#,/hr)
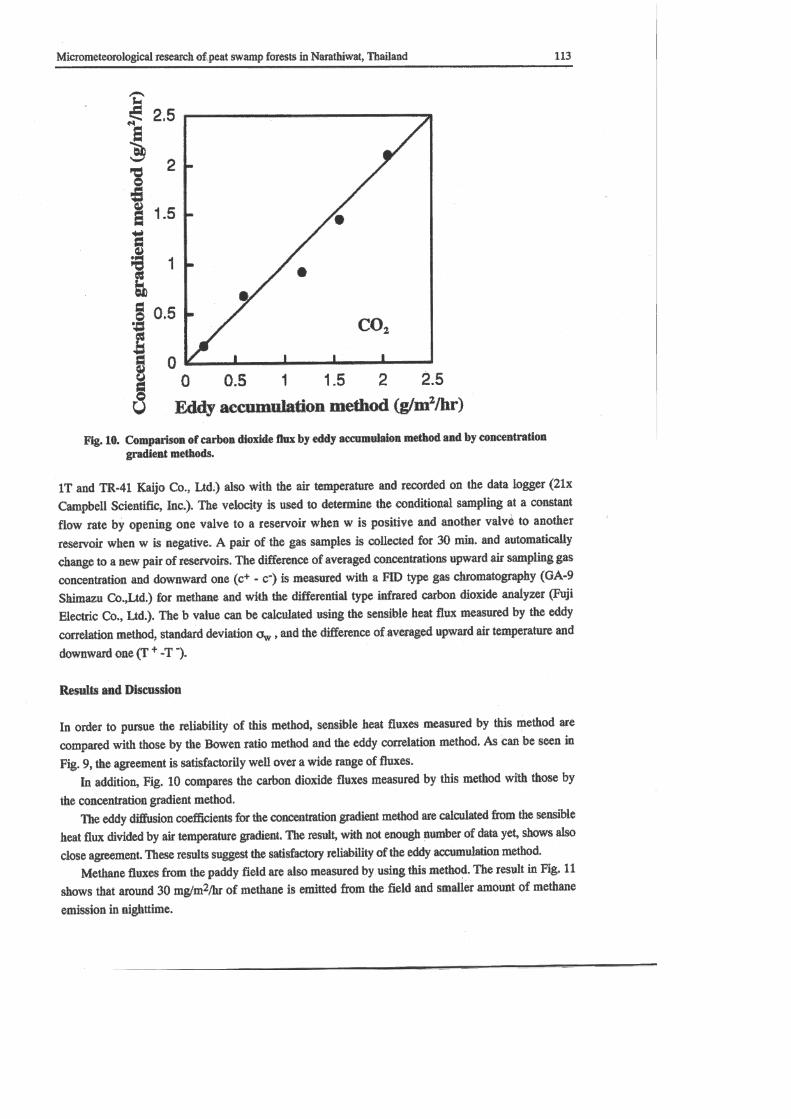
Fig. 10. Comparison ofcarbon dioxide flux by eddy accumulaion nethod and by concentration
gradient methods.
1T and TR-41 Kaijo Co., Ltd.) also with the air temperature and recorded on the data logger (21x
Campbell Scientific, Inc.). The velocity is used to determine the conditional sampling at a constant
flow rate by opening one valve to a reservoir when w is positive and another valve to another
reservoir when w is negative. A pair of the gas samples is collected for 30 min. and automatically
change to a new pair of reservoirs. The difference of averaged concenrations upward air sampling gas
concentration and downward one (c+ - c-) is measured with a FID type gas chromatography (GA-9
Shimazu Co.,Ltd.) for methane and with the differential type infrared carbon dioxide analyzer (Fuji
Electric Co., Ltd.). The b value can be calculated using the sensible heat flux measured by the eddy
correlation method, standard deviation e' and the difference of averaged upward air temperature and
downward one (T + -T -).
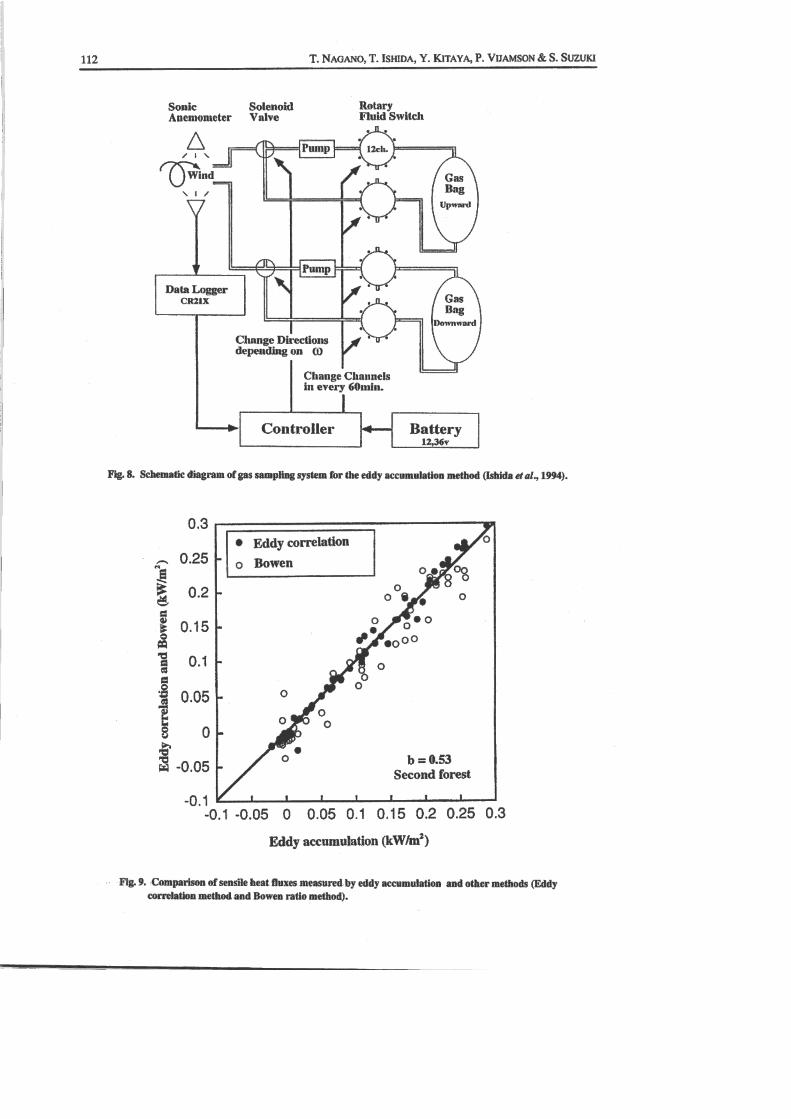
Results and Discussion
In order to pursue the reliability of this method, sensible heat fluxes measured by this method are
compared with those by the Bowen ratio method and the eddy correlation method. As can be seen in
Fig. 9, the agroement is satisfactorily well over a wide range of fluxes'
In addition, Fig. 10 compares the carbon dioxide fluxes measured by this method with those by
the concentration gradient method.
The eddy diffgsion coefEcients for the concentation gradient method are calculated from the sensible
heat flux divided by air temperature gradient. The result, with not enough number of data yet, shows also
close agreement. These results suggest the satisfactory reliability of the eddy accumulation method'
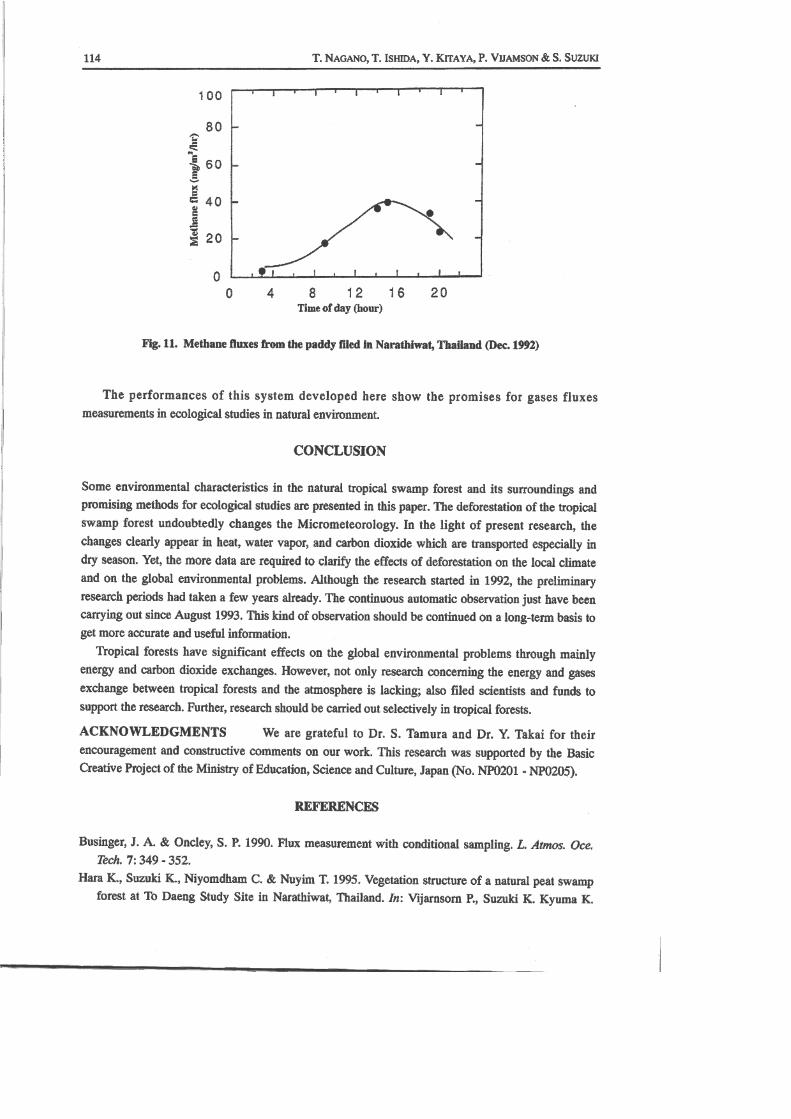
Methane fluxes from the paddy field are also measured by using this method. The result in Fig. 11
shows that around 3O mglm2lhr of methane is emitted from the field and smaller amount of methane
emission in nighttime.
.A,s-l-r
GIAFI-bvEotH€€)AFItsl*ftFIc)olEc!La0IFIo
15CE
TaFI0)I-HoU
2.5
2
1.5
1
0.5
rt4 T. NecANo, T. IsruoA, Y. Kneve, P. VURMSoN & S. Suzuxl
100
80a-F
GIF
€ 6o7!
xFI
:44s-s
TJgzo
8 12 16Time of day (hour)
20
Fig. 11. Methane fluxes from the paddy filed in Narathiwaf Thailand (Dec. 1992)
The performances of this system developed here show the promises for gases fluxesmeasurements in ecological studies in natural environment.
CONCLUSION
Some environmental characteristics in the natural tropical swamp forest and its surroundings andpromising methods for ecological studies are presented in this paper. The deforestation of the tropicals\ilamp forest undoubtedly changes the Micrometeorology. In the light of present research, thechanges clearly appear in heat, water vapor, and carbon dioxide which are transported especially indry season. Yet, the more data are required to clarify the effects of deforestation on the local climateand on the global environmental problems. Although the research started in 1992, the preliminaryresearch periods had taken a few years already. The continuous automatic observationjust have been
carrying out since August 1993. This kind of observation should be continued on a long-term basis toget more a@urate and useful information.
Tropical forests have significant effects on the global environmental problems though mainlyenergy and carbon dioxide exchanges. However, not only research concerning the energy and gases
exchange between tropical forests and the atmosphere is lacking; also filed scientists and funds tosupport the research. Further, research should be carried out selectively in tropical forests.
ACKNOWLEDGMENTS We are grateful to Dr. S. Tamura and Dr. Y. Takai for theirencouragement and constructive comments on our work. This research was supported by the BasicCreative Project of the Ministry of Education, Science and Culture, Japan (No. NP0201 - M0205).
REFERENCES
Businger, J. A' & Oncley, S. P. 1990. Flux measurement with conditional sampling. L. Atmos. Oce.Tech.7:349 -352.
Hara K., Suzuki K., Niyomdham C. & Nuyim T. 1995. Vegetation structure of a natural peat swampforest at To Daeng Study Site in Narathiwat, Thailand. 1n: Vijarnsom P., Suzuki K. Kyuma K.
Micrometeorological research of peat swamp forests in Narathiwat, Thailand 115
Wada E., Nagano T. & Takai Y., eds., A Tiopical Swamp Forest Ecosystetn and its Greenhouse
G as Emis sion, 25 -3 4. Tokyo.
Hicks, B. B. & McMillen, R. T. 1984. A simulation of the eddy accumulation method for measuring
pollutant fluxes. J. Clim. Appl. Meteorol. 23:637 - 643.
Ishida, T., Nagano T., Kitaya, Y. & Suzuki, S. 1995. Gas flux measuremsnt using Eddy accumulation
method with conditional sarryhng. Environmental Control in Biology 33 (1): 79 - 82. (In Japanese)
Niyomdham, C. 1989. Some important characters and a special note on the floras of peat swamp
forest in Thailand. hoceedings of Regional Seminar on Methods of Biological Inventory and
Cartography for Ecosystem Management, 196-201. Tokyo
The Environment Agency of Japan, 1990. Dictionary for Global Environmant, 62 - 73. Chuouhouki,
Tokyo.
Vijamsorn, P. 1992. Coastal swamp land in southern Thailand and Malaysia. In: Kyuma K, et al-,
eds., 3-L6. Tokyo University of Agriculture.Received JulY L5, 1995
AccePted August L6, L996
FSffF, EEEEffi, 1b+=ffi, PisootvrtARsoRN' ffi^Ht -( Et 7 7 2 A*#fc&;Erbffi t: ti t 1 6 Hra#E
*;6, 4n*&* Affi t" k atusHHo#{LnrtEreftardE r/e: "ct,I 6. t4 El }3*it' \( 6' +rd 2
- 4%Afllare#f,fnfrtrrtEtuTt,\6e0)+firLrs66 (FAoIUNEP, 1981)" t frt /eit6, an6#ffdfttrnrtrt*HffilzEa&ftffi#AItl*Lrl,)6Oi)lc?t/\Taffifrlt'bts'L\. t:T:t16#ffnq*rrHq]t"}.:Itt V+$ 13 ? L \ T o Sffi i - 9 &1* 6 tce> t",, 4 Bf t, v a#ffi ffitrff ' *i e ut& tuffi a ffi# l: & : (iErl 3 trlczj< H, * lcffi #til4 tetts, *Wl'EftffEt E it"c v I a ftffiW e^ffi) lc*j r' \('effi &ffi fi lc s5 lt 6 Hffi ffi {+ lc ? t, \ T 0) ill#df fi&ft c fc. z affi R, RHffi trffi oA[E l3 & 6 #g li'++l3ffiHlcffiE l*frn, -xf $&Lr E (+tHTltHtr) Tlt+ttrlc*jr,)rffi*7 ) v, z-hr€htt''*.tc=&1tfr#0)EDi airffi,rt6.Lrt\w6irlc/r:lc. *lc6f)tfi"cffi#L/ctrtsRfHElJ:/'r>+aME/J 77 ) v' 7\ruft\" *3t/ \ (, tFH lcEfllriltlEtrET t> 6 . Lhrw 6 i\ 13 /r ? r;.