Micrometer-Sized Water Droplet Impingement Dynamics and
Evaporation on a Flat Dry Surface
Alejandro M. Briones and Jamie S. Ervin
University of Dayton Research Institute
Shawn A. Putnam
Universal Technology Corporation
Larry W. Byrd and Lois Gschwender
Air Force Research Laboratory, Wright-Patterson Air Force Base
Received April 19, 2010. Revised Manuscript Received June 30, 2010
A comprehensive numerical and experimental investigation on micrometer-sized water droplet impact dynamics andevaporation on an unheated, flat, dry surface is conducted from the standpoint of spray-cooling technology. Theaxisymmetric time-dependent governing equations of continuity, momentum, energy, and species are solved. Surfacetension, wall adhesion effect, gravitational body force, contact line dynamics, and evaporation are accounted for in thegoverning equations. The explicit volume of fluid (VOF) model with dynamic meshing and variable-time stepping inserial and parallel processors is used to capture the time-dependent liquid-gas interface motion throughout thecomputational domain. The numerical model includes temperature- and species-dependent thermodynamic andtransport properties. The contact line dynamics and the evaporation rate are predicted using Blake’s and Schrage’smolecular kinetic models, respectively. An extensive grid independence study was conducted. Droplet impingement andevaporation data are acquired with a standard dispensing/imaging system and high-speed photography. The numericalresults are compared with measurements reported in the literature for millimeter-size droplets and with currentmicrodroplet experiments in terms of instantaneous droplet shape and temporal spread (R/D0 or R/RE), flatness ratio(H/D0), and height (H/HE) profiles, as well as temporal volume (") profile. The Weber numbers (We) for impingingdroplets vary from 1.4 to 35.2 at nearly constant Ohnesorge number (Oh) of ∼0.025-0.029. Both numerical andexperimental results show that there is air bubble entrapment due to impingement. Numerical results indicate thatBlake’s formulation provides better results than the static (SCA) and dynamic contact angle (DCA) approach in termsof temporal evolution of R/D0 and H/D0 (especially at the initial stages of spreading) and equilibrium flatness ratio(HE/D0). Blake’s contact line dynamics is dependent on the wetting parameter (KW). Both numerical and experimentalresults suggest that at 4.5<We<11.0 the short-time dynamics ofmicrodroplet impingement corresponds to a transitionregime between two different spreading regimes (i.e., forWee 4.5, impingement is followed by spreading, then contact linepinning and then inertial oscillations, and for We g 11.0, impingement is followed by spreading, then recoiling, thencontact line pinning and then inertial oscillations). Droplet evaporation can be satisfactorily modeled using the Schragemodel, since it predicts both well-defined transient and quasi-steady evaporation stages. The model compares well withmeasurements in terms of flatness ratio (H/HE) before depinning occurs. Toroidal vortices are formed on the dropletsurface in the gaseous phase due to buoyancy-induced Rayleigh-Taylor instability that enhances convection.
1. Introduction
Cooling processes are widely found in many industrial applica-tions such as microelectronics,1-3 transportation,4,5 metal produc-tion andprocessing,6-8 and surgical laser equipment.9Liquid-based
cooling technologies such as spray cooling, heat pipes, thermo-syphons, flowboiling, and jet impingement cooling have attractedconsiderable interest in these industries. Each technology has itsown advantages and disadvantages. Water spray cooling, how-ever, is arguably the most attractive due to its ability to (1)uniformly remove large heat fluxes, (2) use small fluid volumes,(3) take advantage of large heat of vaporization, (4) use lowdroplet impact velocity, and (5) provide optimal control andregulation of system temperatures.10
Spray cooling formicroelectronic applications generally occurswhen liquid flow through small orifices shatters into a dispersionof fine droplets which impact a heated surface. Then, the dropletsspread on the surface and evaporate or form a thin liquid film,removing energy at low temperatures. Because of the many inter-related parameters involved in this technology, it has beenextensively investigated since the late 1980s. Mudawar and
(1) Cader, T.; Westra, L. J.; Eden, R. C. IEEE Trans. Device Mater. Reliability2005, 4, 605–613.(2) Bash, C. E.; Patel, C. D.; Sharma, R. K. International Electronic Packaging
Technical Conference& Exhibition, July 6-11, 2003,Maui, HI; IPACK2003-35058.(3) Kim, J. H.; You, S. M.; Choi, S. U. S. Int. J. Heat Mass Transfer 2004, 47,
3307–3315.(4) Abramzon, B.; Sazhin, A. Int. J. Heat Mass Transfer 2005, 48, 1868–1873.(5) Hiroyasu, H.; Kadota, T.; Senda, T. Bull. JSME 1974, 17.(6) Wendelstorf, J.; Spitzer, K.-H.; Wendelstorf, R. Int. J. Heat Mass Transfer
2008, 51, 4902–4910.(7) Hayes, D. J., Wallace, B. D., Boldman, M. T. Proceedings of the 1992
International Symposium on Microelectronics, October 19-21, 1992, San Francisco,CA; pp 312-321.(8) Waldvogel, J.M.; Diversiev, G.; Poulikakos, D.; Megaridis, C.M.; Attinger,
D.; Xiong, B.; Wallace, D. B. J. Heat Transfer 1998, 120, 539.(9) Aguilar, G.; Majaron, B.; Popoe, K.; Svaaasand, L. O.; Lavernia, E. J.;
Nelson, J. S. Lasers Surg. Med. 2001, 28, 113–120. (10) Kim, J. Int. J. Heat Fluid Flow 2007, 28, 753–767.
Estes11 studied the effect of nozzle to surface distance and showedthat the optimal configuration was when the impact area of thespray is just inscribed within the heated area. Horacek et al.12 andSodtke and Stephan13 experimentally studied FC-72 and waterspray cooling, respectively, on a flat surface and showed that theincrease in the heat flux is directly related to the increase in thethree-phase contact line length. Navedo14 found that dropletvelocity has the greatest impact on the critical heat flux (CHF,the maximum energy transfer rate from the substrate to the liquidat which nucleate boiling ceases to exist) but negligible influenceon the heat transfer coefficient (h), whereas increasing the numberof droplets increases both CHF and h. An increase in h wasassociated with a decrease in the Sauter mean diameter (averageparticle size defined as thediameter of a spherewhichhas the samevolume to surface area ratio as the particles of interest), while theCHF remained unaffected. Moreover, Chen et al.15 found thatCHF varied with droplet velocity and mean droplet flux, and wasindependent of Sauter mean diameter. More importantly, theyfound that, in order to increase cooling efficiency with little liquidvolume, the droplet diameters need to be small with high impactvelocity. Although spray cooling has been extensively investi-gated, there still remain many questions to be answered: forexample, the conditions that lead to maximum droplet spreadwithout rebound, the mechanisms correlating heat transfer withcontact line dynamics,10 the partitioning of energy betweensingle- and two-phase, and the mechanism by which CHF istriggered.
Insight into the fundamental mechanisms responsible forwetting and two-phase mass and heat transfer during spraycooling can be obtained from single droplet studies. There aremany studies on droplet impingement and evaporation in theliterature. Bhardwaj and Attinger16 validated a numerical modelto study wetting during the impact of millimeter-sized drops on aflat surface. They found that heated drops spread more exten-sively than cold drops because of a reduction of viscous forces,and not because of an increase in wetting. Lunkad et al.17
numerically investigated the millimeter-sized drop impact andspreading on horizontal and inclined surfaces using the volume offluid (VOF) method with both static (SCA) and dynamic contactangles (DCA). Their results were validated against experimentaldata available in the literature. They found that the SCA can beused to predict the drop impact and spreading behavior inquantitative agreement with measurements for SCA > 90�. Forwettable surfaces (SCA < 90�), the DCA observed at initialcontact times were∼100� greater than SCA values, and therefore,the DCA is needed for accurate prediction of the spreadingbehavior. Bernardin et al.18 experimentally mapped the impactand heat transfer regimes of millimeter-sized water drops imping-ing on a flat surface. They found that an increasing Webernumber (We) decreases the spreading time and increases theinstabilities responsible for droplet breakup. Rebound occurredat the film boiling regime at lowWe. Even though there have beenmany studies on single droplet impingement and evaporation,
nearly all of these studies focus on millimeter-sized droplets. Infact, we are only aware of three investigations19-21 that reportmicrometer-sized droplets impacting on a flat, unheated surface,which are of the same order of magnitude as spray coolingdroplets (i.e., 10-80 μm)22,23). Moreover, there is no availablework in the literature that considers the evaporation of this rangeof spray-cooling micrometer-sized droplets including both nu-merical and experimental techniques. However, it is worthmentioning that Bhardwaj et al.24 conducted both a numericaland experimental investigation of the evaporation of dropletswith diameters that were an order of magnitude greater indiameter (i.e., 462-874 μm) than those required in spray coolingapplications. Furthermore, Golovko et al.25 recently reported theevaporation measurements of 10-100 μm water droplets.
Micrometer-sized droplet impingement and evaporation beha-vior exhibits differences from that of millimeter-sized dropletsfrom both the practical and fundamental point of views. From apractical standpoint, small average droplet diameter increasesspray cooling efficiency.15 For instance, an average dropletdiameter of ∼60 μm provides a spray cooling efficiency of∼35%,whereas an average droplet diameter of∼200 μmprovidesa cooling efficiency of ∼2%.15 By increasing We, the spraycooling efficiency decreases.26 Similarly, spray cooling nozzlesthat produce small droplets with high impact velocity alsoincrease the cooling efficiency.15 Therefore, micrometer-sizeddroplets with high impact velocity would yield low We neededfor optimization of spray cooling technology. Now, from afundamental standpoint, millimeter-sized droplets which aremore likely to be characterized by large Bond numbers (Bo)exhibit droplet apex flattening and larger equilibrium spreadratio.27 In contrast, the final shape of a micrometer-sized dropleton the substrate has to be a truncated sphere because of the strongsurface tension force relative to the gravitational force (Bo , 1).Consequently, the deformation history, especially in the finalstages, of these droplets impinging on surface is different fromthat of millimeter-sized droplets. This has implications on spraycooling technology, because the cooling efficiency is affected byboth the spreading history and the maximum spread ratio.Moreover, in the few investigations reporting micrometer-sizeddroplet impingement in the diameter range of interest (∼10-80 μm) the maximum We is ∼100. Because this range of micro-meter-sized droplets inherently exhibits relatively lowWe, impactphenomena occurring in millimeter-sized droplets such as partialrebound, complete rebound, fingers, prompt splash, coronasplash, and crown formation have not been observed. Further-more, Golovko et al.25 have shown that hydrophilic pinnedmicrodroplets do not follow the evaporation rate laws establishedfor millimeter-sized droplets at the last stages of evaporation.
Therefore, the purpose of this investigation is to better under-stand the characteristics of micrometer-sized (refers to dropletdiameter of tens of micrometers and not hundreds of micro-meters) droplet impingement and evaporation on a flat, drysurface using both numerical and experimental techniques. It isprojected that the results of this research will be useful for
(11) Mudawar, I.; Estes, K. A. J. Heat Transfer 1996, 118, 672–679.(12) Horacek, B.; Kiger, K. T.; Kim, J. Int. J. Heat Mass Transfer 2005, 48,
1425–1438.(13) Sodtke, C.; Stephan, P. Int. J. Heat Mass Transfer 2007, 50, 4089–4097.(14) Navedo, J. Parametric Effects of Spray Characteristics on Spray Cooling
Heat Transfer; Ph.D. Dissertation, University of Central Florida, Florida, 2000.(15) Chen, R.-H.; Chow, L. C.; Navedo, J. E. Int. J. Heat Mass Transfer 2004,
47, 5095–5099.(16) Bhardwaj, R.; Attinger, D. Int. J. Heat Fluid Flow 2008, 29, 1422–1435.(17) Lunkad, S. F.; Buwa, V. V.; Nigam, K. D. P. Chem. Eng. Sci. 2007, 62,
7214–7224.(18) Bernardin, J. D.; Stebbins, C. J.; Mudawar, I. Int. J. Heat Mass Transfer
1997, 40, 247–267.
(19) van Dam, D. B.; Le Clerc, C. Phys. Fluids 2004, 16, 3403–3414.(20) Zhen-Hai, S.; Rui-Jing, H. Chin. Phys. B 2008, 17, 1674–1056.(21) Son, Y.; Kim, C.; Yang, D. H.; Ahn, D. J. Langmuir 2008, 24, 2900–2907.(22) Yang, J.; Pais, M. R.; Chow, L. C. J. Exp. Heat Transfer 1993, 6, 55–67.(23) Cryer, M. A. An experimental study of high heat flux removal using micro-
droplet spray cooling, M.S. Thesis, Naval Postgraduate School, Monterey, CA, 2003.(24) Bhardwaj, R.; Fang, X.; Attinger, D. New J. Phys. 2009, 11, 075020.(25) Golovko, D. S.; Butt, H.-J.; Bonaccurso, E. Langmuir 2009, 25, 75–78.(26) Estes, K. A.; Mudawar, I. Int. J. Heat Mass Transfer 1995, 38, 2985–2996.(27) Bartashevich, M. V.; Kuznetsov, V. V.; Kabov, O. A. Micrograv. Sci.
improving single droplet impact dynamics and evaporationmodels for later enhancement of spray cooling models. Dropletimpingement on a heated surface is, however, a very complexphenomenon involving a multitude of physical-chemical eventssuch as deposition, spreading, receding, rebound, jetting, splash,bubble entrapment, pinning, depinning, and evaporation. There-fore, in this study we will only focus on the droplet spreading andreceding characteristics upon impingement as well as evaporationfrom an unheated surface. The explicit VOF model is used formodeling and simulation of the droplet dynamics upon impinge-ment and evaporation. This model is particularly important,because in contrastwith othermodels,16,28 it allows determinationof the gaseous-phase flow field and thermal convection relevant tospray cooling applications. Both the contact line velocity29 andevaporation30 models are incorporated in the model. These twomodels are discussed in detail in subsequent sections. This is theonly investigation reporting both molecular-kinetics-based mod-els included within the VOF formulation; therefore, it is asignificant contribution to our research.
Although hydrodynamic-theory-based contact line motion24
and evaporation31 have been incorporated in interface-trackingnumerical formulations,24 investigations that include the molec-ular-kinetics-based contact line velocity29 and evaporation30
models together in a VOF formulation are unavailable. Forinstance, Zhen-Hai and Rui-Jing20 included Blake’s contact linevelocity29 in their VOF model (note: the formulation used byZhen-Hai and Rui-Jing, however, does not include the effect ofviscosity on the motion of the contact line), whereas Nikolopou-los et al.32 incorporated the Schrage evaporation30 model. More-over, the VOFmodel with contact line dynamics and evaporationis superior to interface-tracking methods,16,28 because the latterneglect the effect of the gas around droplets implicitly assumingthat the droplet is traveling in a vacuum. This assumption leavesthe interface-tracking methods unable to resolve the completephysics such bubble entrapment and external convection occur-ring during droplet impingement and during droplet evaporation,respectively. Bubble encapsulation is particularly important forheat removal, because when droplets impinge on a surface, airbubbles act as vapor nuclei and initiate nucleate boiling at muchlower superheats than theory predicts.33 In addition, our numer-ical results are also compared with measurements reported in theliterature and with our experiments as well.
The major objective of this investigation is to develop anumerical model capable of capturing the relevant physicsof droplet impact and evaporation under ambient conditions.
Specific objectives are as follows: (1) to validate the numericalmodel for a single micrometer-sized droplet impinging on anunheated flat surface, (2) to characterize the droplet dynamics interms of dimensionless groups (We, Oh, and Re), (3) to comparethe SCA andDCAmodeling approaches with experiments, (4) todetermine whether Blake’s contact line velocity model29 can beused to emulatemicrometer-sized droplet impingement, and (5) toevaluate the Schrage evaporation30 model to capture the dropletlifetime as well as the evaporation dynamics.
2. Experimental Setup
Micrometer-sized droplet impingement and evaporation datawere acquired with a standard dispensing/imaging system shownin Figure 1. The microdroplets were generated with an inkjetdispensing head from Microdrop Technologies GmbH(Norderstedt, Germany), where the inkjet head consists of acylindrical piezo element surrounding a glass capillary with a 50μm inner nozzle diameter. Deionized (DI) water purified andfiltered with a Barnstead Nanopure Water Purification Systemwas used. Video recordings were captured with a high-speedcamera from Vision Research Inc. (Wayne, New Jersey, USA).The camera is equippedwith an internal 8Gbit buffer, 1280� 800megapixel CMOS sensor, and programmable electronic shutterwith a minimum exposure time of 300 ns. The micrometer-sizeddroplet videos acquired in this study used frame rates up to∼120 000 frames-per-second (fps) using 256 � 128 pixels of themegapixel sensor. Most short-term microdroplet impingementdata were acquired at 66000 fps (15.14 μs/frame) with 256 � 256pixels and ∼5 μs exposure intervals. Microdroplet evaporationdata were acquired at 58 000 fps (17.24 μs/frame) with ∼10 μsexposure intervals, even though a much slower frame rate isadequate. The sample surfaces in all experiments were Al thinfilms (∼70 nm thick). The Al thin films were deposited bymagnetron sputtering on flat (1/10 λ) fused silica optics windowspurchased from Edmund Optics. An external TTL trigger from acomputer controlled pulse generator was used to coordinatedroplet dispensing and video recordings. We note that, in manycases, footprints of previously evaporated microdroplets wereobserved on the Al substrate surface, which, in turn, couldinfluence the short-term impingement dynamics of subsequentdroplets. To obtain reproducible data, the samples were simplytranslated and/or rotated after each droplet impingement toensure that the sample surface was clean prior to each individualimpact (as shown in the figures corresponding to section 4.4).
3. Physical-Numerical Procedure
3.1. Liquid-Gas-Phase Numerical Model. The explicitVOF model in FLUENT is used to track the time-dependentvolume fractions of liquid (Rl) and gas (Rg) throughout thecomputational domain.34 The fields for all variables and proper-ties are shared by the phases and represent volume-averagedvalues. The liquid phase is composed only of water, whereas thegaseous phase is composed of water vapor (H2O) and air. Theaxisymmetric governing equations of continuity, momentum,energy, and species are solved using the segregated pressure-basedsolver.35 The governing equations in differential notation are asfollows.
VOF Equation.
DðRlFÞDt
þ DðRlFuÞDr
þRlFur
þ DðRlFvÞDz
¼ - :mlg ð1Þ
Rg ¼ 1-Rl
Figure 1. Schematic of experimental setup.
(28) Ruiz, O. E.; Black, W. Z. J. Heat Transfer 2002, 124, 854–863.(29) Blake, T. D.; De Coninck, J. Adv. Colloid Interface Sci. 2002, 66, 21.(30) Schrage, R. W. A theoretical study of interphase mass transfer; Columbia
University Press: New York, 1953.(31) Hu, H.; Larson, R. G. Langmuir 2005, 21, 3972–3980.(32) Nikolopoulos, N.; Theodorakakos, A.; Bergeles, G. Int. J. Heat Mass
Transfer 2007, 50, 303–319.(33) Sigler, J.; Mesler, R. J. Colloid Interface Sci. 1990, 134, 459.
(34) Hirt, C. W.; Nichols, B. D. J. Comput. Phys. 1981, 39, 201–225.(35) ANSYS FLUENT 12.0, Theory Guide, 2009.
The VOF equation is only solved for the liquid phase and thatof the gas phase volume fraction is obtained from the fact that thesum of volume fractions must equal unity. The momentumequation is dependent on the volume fractions (R) by means ofthe density (F= RlFl þ RgFg) and dynamic viscosity (μ= Rlμl þRgμg). The momentum equation also includes the gravitationalbody force (FgB) as well as the surface tension force (2σFκlrRl/(Fl þ Fg)). The latter is based on the continuum surface force(CSF) model,36 where n̂ = n/|n|, n = rRl, and κl = r 3 n̂. Thesurface tension varies linearly with temperature: σ = 116.174 -0.1477T. The energy conservation equation treats E as a mass-averagedquantity. The temperature (T) is obtained byknowing cpand E in each numerical cell. The species continuity equation isonly solved for the water vapor (H2O) in the gaseous phase, sincethere is only one species component in the liquid phase (i.e.,Yl =1.0). The diffusion flux is modeled using Fick’s law. The massfraction of air is obtained by knowing that the sum of species inthe gaseous phase needs to be equal to unity (see eq 4).
The unsteady terms are first-order accurate in time. Themomentum equations are discretized using theQUICK scheme,37
whereas the species and energy equations are discretized using asecond-order upwind scheme.38 The VOF equation is discretizedusing the Geo-Reconstruct scheme.39 The gradients and deriva-tives of the governing equations are computed using the Green-Gauss Node-Based method40,41 which is second-order spatiallyaccurate. The pressure values are obtained at the cell faces byusing the PRESTO! discretization scheme.42 The pressure-velocity coupling is achieved by using the PISO algorithm.43
3.2. Thermodynamic andTransport Properties.Theprop-erties of liquidwater are cp=4182 J/kg-K,k=0.6W/m-K, andμ= 0.001 kg/m-s corresponding to 300 K. The thermodynamicand transport properties appearing in the governing equations forthe gaseous phase species (i.e., H2O and air) are temperature- andspecies-dependent. The gaseousmixture density is computedusingthe ideal gas equation. The species individual specific heat capa-cities are computed using piecewise polynomials.44 The gaseousmixture specific heat capacity is computed using the species mass-weighted heat capacity (i.e., Σi =1
2 Yi 3 cp,i). The thermal conduc-tivity and viscosity of each species are obtained using Chapman-Enskog collision theory, whereas the gaseous mixture thermalconductivity and viscosity are obtained using a mass weightedmixing law (i.e.,Σi=1
2 Yi 3 ki and Σ i=12 Yi 3 μi). Thewater vapor
binary diffusivity coefficient with air is calculated using Chapman-Enskog collision theory and Lennard-Jones potentials.3.3. Contact Line Dynamics. Three strategies are used to
simulate the contact line dynamics. These are the static (SCA) anddynamic contact angle (DCA) approaches and Blake’s contact linevelocity equation.29 The SCAandDCAare implemented through thewall adhesion effects using n̂ = n̂W cos θWþ t̂W sin θW, where θW isthe wall-liquid contact angle.When the SCA is used, the equilibriumcontact angle (θE) needs to be obtained from the experiments, so thatθW = θE for the entire wall surface at all times. On the other hand,when the DCA is used the dynamic contact angle (θD) needs to beobtained from experimental data before the simulation. Thus, θW =θD, and consequently, θW is time-dependent. DCA is implementedthroughaCprogramming language subroutine.Blake’s formulation is
uCL ¼ 2KWλ
μsinh
σ
2nkBTðcos θE - cos θÞ
� �ð5Þ
where the variables n, λ, and Kw represent the number of absorp-tion sites per unit area, displacement length, and wetting para-meter, respectively. A typical value of λ is 2 � 10-10 m and n =λ-2.16 In eq 5, θ is equal to θD, but unlike the DCA, θ is computedfrom the contact line velocity (uCL). In this regard, θ = θD isobtained by solving eq 5, where uCL is estimated as the nearestcalculated velocity within the interface cell adjacent to the wall.This value of θ= θD is then used to calculate the surface tensionforce in eq2.A similar procedurewas implemented in ref 45. In the
(36) Brackbill, J. U.; Kothe, D. B.; Zemach, C. J. Comput. Physics 1992, 100,335–354.(37) Leonard, B. P.; Mokhtari, S. ULTRA-SHARPNonoscillatory Convection
Schemes for High-Speed Steady Multidimensional Flow; NASA TM 1-2568(ICOMP-90-12); NASA Lewis Research Center, 1990.
(38) Barth, T. J.; Jespersen, D. AIAA 27th Aerospace Sciences Meeting;Reno,NV,1989; AIAA-89-0366.
(39) Youngs, D. L. In Numerical Methods for Fluid Dynamics; Morton, K. W.,Baines, M. J., Eds.; Academic Press: London, 1982.
(40) Holmes, D. G.; Connell, S. D. AIAA 9th Computational Fluid DynamicsConference; 1989, AIAA-1989-1932; pp 25-39.
(41) Rauch, R. D.; Batina, J. T.; Yang, H. T., 32nd AIAA/ASME/ASCE/AHS/ASC Structures, Structural Dynamics, andMaterials Conference, Washington D.C.,1991; AIAA-91-1106.
(42) Patankar, S. V. Numerical Heat Transfer and Fluid Flow; Hemisphere:Washington, DC, 1980.
(43) Issa, R. I. J. Comput. Physics 1985, 62, 40–65.(44) ANSYS FLUENT 12.0, User’s Guide, 2009.(45) Keshavarz-Motamed, Z; Kadem, L; Dolatabadi, A. Microfluid Nanofluid
current investigation, this methodology is also implemented inFLUENT through a C programming language subroutine.
Blake’s contact line velocity model describes wetting as adynamic absorption/desorption process of liquid molecules tothe wall surface. At equilibrium, the contact line would appear tobe stationary, but at the molecular level, there is an exchange ofmolecules from one phase to another at a rate associated with anequilibriummolecular displacement frequency ( fW,E).Workmustbe done by the unbalancedYoung-Laplace force (i.e., σ(cosθE-cos θ)/n) at each absorption site to overcome the energy barriersdue to molecular displacement (i.e., ΔGW
‡/NA) in order for thecontact line to move. For droplet spreading to occur, thefrequency of molecules in the forward direction ( fW
þ) mustexceed those in the backward direction ( fW
-). This occurs whenthe unbalanced Young-Laplace force lowers the energy barriersfor displacement in the forward direction and raises them in thebackward direction. The converse is true for droplet recoiling. Inthe context of molecular displacement frequencies, the wettingparameter is equal to KW = fS,E � hP/vL,
29 where fS,E is theequilibrium frequencyofmolecular displacements associatedwithdroplet surface contributions, hP isPlanck’s constant, and vL is themolecular volume of the liquid phase. Large solid-liquid inter-actions suggest that the KW should be small and, consequently,θ = θD should then be strongly dependent on uCL In contrast,small solid-liquid interactions suggest the converse.29 If viscouscontributions to molecular displacements are not taken intoaccount (as done by Zhen-Hai and Rui-Jing20), then fW,E =fS,E and KW = fW,E � μ. We have chosen to use Blake’s contactline velocity formulation, such that both the solid-liquid surfaceinteractions and viscous contributions to molecular displace-ments are taken into account.3.4. Mass Transfer Rate. The volumetric mass transfer rate
that we use to model evaporation is given by
_mlg ¼ jrRgj 2ε
ð2- εÞ� �
1
2πR 3MWg,H2O
!1=2pl
T1=2l
-pg
T1=2g
!
ð6Þwhich is the product of the droplet interfacial surface area density(|rRg|) and Schrage’s mass flux.30 The Schrage equation wasderived from kinetic theory for flat surfaces and, consequently,does not include curvature effects.30 In eq 6, ε is the evaporationefficiency or accommodation coefficient. To date, this quantity isstill not well established for a given fluid. For example,Marek andStrub46 noted the considerable scatter (up to 3 orders ofmagnitude) in the theoretically and experimentally obtained ε.Equation 6 was adapted to FLUENT through a C programminglanguage subroutine.47 It is assumed that Tg = Tl = T (i.e.,temperature of the cell). Pl is the saturation pressure at T (i.e.,Psat(T )), whereas Pg is the absolute vapor partial pressure at thecell. If the saturation pressure at T (i.e., Psat (T)) is greater thanXH2O 3Pcell(T), then the liquid evaporates and _m1g is positive.Condensation occurs when the converse is true; hence, _m1g isnegative.
In the absence of Marangoni flow and in the presence ofdiffusion-controlled evaporation, the evaporation flux increases
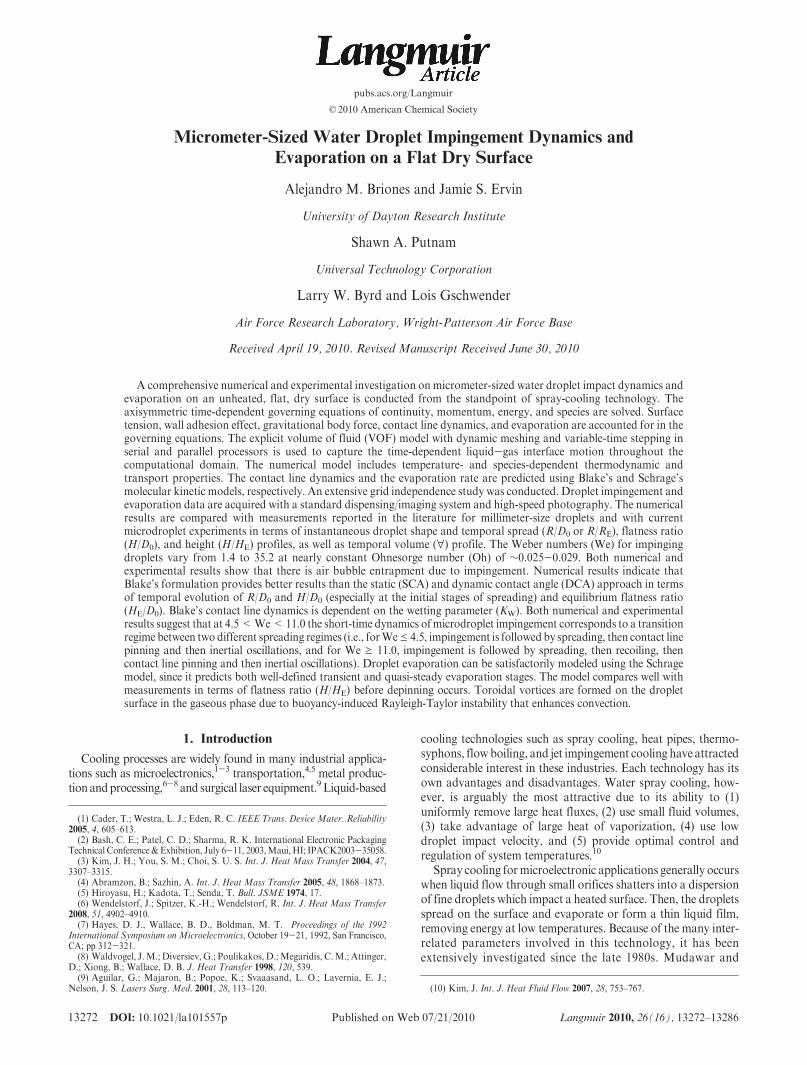
tremendously near the contact line.48-52 Equation 6 predicts anearly uniform instantaneous evaporation mass flux along theliquid-gas interface for the evaporating droplets studied here(not shown). This profile is characteristic of kinetically controlledevaporation.53 Nevertheless, the evaporating droplets studiedhere exhibit evaporation flux values comparable with the expres-sion given by ref 49 for diffusion-controlled evaporation withsuppressedMarangoni flow.Moreover, the analytical solution ofPetsi and Burganos53 also predicts fluid flows from the droplet’sapex toward the contact line along the substrate for kineticallycontrolled evaporation of pinned droplets on hydrophilic sub-strates, the difference being that diffusion-controlled evaporationexhibits faster flow near the contact line that leads to higherevaporation flux in the vicinity of the contact line53 and “coffee-ring” deposition.48 In the context of droplet lifetime, kineticallycontrolled evaporation models predict slightly, but non-negligi-ble, longer droplet lifetimes in comparison to the diffusion-controlled evaporation models54 perhaps due to uniform eva-poration flux.3.5. Geometry andMesh.A schematic of the computational
domain with boundary conditions is presented in Figure 2. Theentire geometry ismeshedwith square elements, where the highestmesh refinement is used at the droplet interface. An extensive gridindependence study has been conducted to show that the grid sizeandmeshing scheme shown in Figure 2 resolves the flow field (seesection 4.3).3.6. Dynamic Mesh and Variable Time-Stepping. A dy-
namicmesh is used for the simulations involving droplet impinge-ment and evaporation.Themesh is refined and coarsened near the
Figure 2. Schematic of computational domain, mesh, boundaryconditions, and initial conditions for the (a) impinging and (b)evaporating droplet simulations.
(46) Marek, R.; Straub, J. Int. J. Heat Mass Transfer 2001, 44, 39–53.(47) Troshko, A. Report on evaporation model, Internal Report, ANSYS, Inc.(48) Hu, H.; Larson, R. G. Langmuir 2005, 21, 3963–3971.(49) Deegan, R.D.; Bakajin, O.; Dupont, T. F.; Huber, G.; Nagel, S. R.;Witten,
T. A. Nature 1997, 389, 827–829.(50) Petsi, A. J.; Burganos, V. N. Phys. Rev. E 2005, 72, 047301.(51) Petsi, A. J.; Burganos, V. N. Phys. Rev. E 2006, 73, 041201.
(52) Hu, H.; Larson, R. G. J. Phys. Chem. B 2006, 110, 7090–7094.(53) Petsi, A. J.; Burganos, V. N. Phys. Rev. E 2008, 78, 036324.(54) Kryukov, A. P.; Levashov, V. Y.; Sazhin, S. S. Int. J. Heat Mass Transfer
liquid-gas interface after each individual time step for impingingdroplets, whereas the mesh is dynamically modified once everytwenty time steps for evaporating droplets. Dynamic meshing isused in conjunction with noniterative time advancement(NITA)43 and variable time-stepping. The time step is on theorder of O(10-2) and O(10-1) μs for the impinging and evaporat-ing microdroplets, respectively.3.7. Boundary Conditions. Figure 2 also presents the com-
putational domain, which contains the surface, center line, andsurroundings. The surface, center line, and surroundings aremodeled as wall, axis of symmetry, and pressure-outlet boundaryconditions, respectively. For the simulations studied, the initialtemperature in the domain is 300 K.
Wall Boundary Condition.
DRl
Dz¼ 0, u ¼ 0, v ¼ 0,
DYH2O
Dz¼ 0, and T ¼ 300 K
Axisymmetric Boundary Condition.
DRl
Dr¼ 0, u ¼ 0,
DvDr
¼ 0,DYH2O
Dr¼ 0, and
DTDr
¼ 0
Pressure-Outlet Boundary Condition.
P ¼ 0 ðgaugeÞ; if backflow; then Rl ¼ 0,YH2O ¼ 0, and
T ¼ 300 K
For positioning the pressure-outlet boundary condition, weconducted an extensive study on the effect of domain size on thenumerical simulations by tracking the maximumwater vapor as afunction of time (not shown). The results showed that when thepressure-outlet boundary conditions are located at a distancecorresponding to ten droplet radii away from the wall andaxisymmetric boundary conditions, the boundary-induced dis-turbances are negligible (see Figure 2).3.8. Parallel Computations. Numerical simulation for the
millimeter-sized droplet evaporation required the use of parallelcomputing. Scalability studies showed that three compute nodes isthe optimumnumber ofnodes to achieve high-speed computation.
For these simulations, we used a SGIAltix 4700 parallel computerwith 1.6 GHz Itanium 2 processor. The time per iteration was∼1.5 s leading to a total computational time of ∼24 days.3.9. Limitations of the NumericalModel. In the context of
the axisymmetric configuration, our numerical model is limited toperfect thermal contact between the droplet and the isothermalsubstrate. In addition, it cannot simulate depinning duringevaporation.
4. Results and Discussion
In the remainder of this paper, we present and discuss (1) thevalidation of our numerical model with millimeter-sized dropletsreported in the literature, (2) the operating conditions of cases weinvestigated for micrometer-sized droplet impingement and eva-poration, (3) our grid independence study, and (4) the character-istics of our experimentally and numerically obtainedmicrometer-sized droplet impact dynamics and evaporation.4.1. Validation of Numerical Model with Millimeter-
Sized Droplets. As mentioned in the introduction, dropletimpingement and evaporation are very complex processes sincecontact line motion and evaporation occur at the molecular leveland continuum models are needed for modeling and simulation.Therefore, our numerical model is first compared with widelyavailable measurements on millimeter-sized water droplets re-garding impact droplet dynamics and evaporation.
4.1.1. Impact Droplet Dynamics. Figure 3 presents thetemporal evolution of the wetted maximum radius (or contactline position) (R) on an isothermal dry surface at Ts = 180� withcharacteristic We of 220, 60, and 20. The numerical results arecompared with the experiments from Bernardin et al.18 Thesesimulations lasted no more than 24 h. The SCA approach wasused to model the contact line dynamics with θE = 60� and ε =0.04. These values are typical for water droplet impinging andevaporating from an aluminum substrate.46,55 Experiments andsimulations indicate that as We decreases the spreading ratedecreases. Therefore, there is good correlation between measuredand predicted R on the flat surface as a function of time. Thisagreement serves to validate the VOF solution technique andevaporative flux expression that is used. Nikolopoulos et al.32 hasalso compared the case whenWe=220 using the VOF techniquewith similar conditions as in the present investigation. The main
Figure 3. Temporal evolution of the maximum wetting radius (orcontact line position) (R) on an isothermal dry surface at Ts =180 �CwithcharacteristicWeber numbersofWe=220, 60, and20.The initial droplet radius isR0= 1.5 mm, and theWeber numberscorrespond to impact velocities of V0 = 2.34, 1.21, and 0.7 m/s,respectively. The experimental results (filled-symbol data) are fromBernardin et al.18 and the lines are our numerical predictions. Theaccommodation coefficient used in the Schrage model is ε=0.03.
Figure 4. Temporal evolution of droplet volume (") for a milli-meter-sizedwater droplet evaporatingonan isothermal flat surfaceatTs=180 �C.The initial droplet diameter isD0=1.0mmand theaccommodation coefficient is ε = 0.09. The experimental results(filled-square data) are from Crafton.56
(55) Bernardin, J. D.;Mudawar, I.;Walsh, C. B.; Franses, E. I. Int. J. HeatMassTransfer 1997, 40, 1017–1033.
difference between their simulation and the present is thatNikolopoulos et al.32 used ε = 0.5. Their result showed goodagreement with the measurements as well. Nonetheless, theypredicted a larger spreading rate at the end of the spreadingprocess (t=5ms) when compared to our result (i.e.,R=6.8mmvs 5.8 mm). This suggests that the evaporation mass rate has aneffect on droplet spreading on heated surfaces.
4.1.2. Droplet Evaporation. To further validate our numer-ical results, we compare our simulations with the experiment ofCrafton.56 Figure 4 shows the predicted and measured dropletvolume temporal evolution during evaporation. In the experi-ments,D0 is in fact 1.05mm, the temperature of thewall surface isTs = 95 �C, the ambient temperature is T¥ = 21 �C, the relativehumidity is RH = 30%, and the SCA is 112�. Crafton56 gentlydeposited this water droplet on an aluminum substrate and theresults presented here begin with the termination of the spreadingprocess (i.e., once the droplet is pinned and inertial oscillations aredamped out). The measurements clearly show that the dropletvolume varies linearly with time, and its lifetime is ∼14 s. In thenumerical simulations,Ts= 100 �C,T¥=25 �C,RH=0%, andthe droplet is pinned during the simulation. The initial contactangle (θ0) was set to 90�. These numerical conditions are veryclose to those of Ruiz and Black28 who used a front-trackingtechnique with a hydrodynamic evaporation expression. Theirresults closely matched the measurements until ∼11 s. Theirsimulation could not be used for later than ∼11 s due toconvergence deterioration when θ approached the receding angleof 10�. Moreover, Ruiz and Black28 also suggested that discre-pancies between measurements and simulations might be due tothree-dimensional effects taking over during the late stages ofevaporation (as also observed in the experiments in ref 57).
In our simulations, we attempted to match the measurementswith accommodation coefficient of ε = 0.09. The predictedvolume at this condition varies nearly linearly until ∼10 s. Lateron, the droplet starts to evaporate slower and its volume does notdecrease as rapidly as before. Our model clearly underpredictsand overpredicts the volumetric evaporation rate and the dropletlifetime, respectively. No further simulations were tried here,
because this simulation is computationally expensive. For in-stance, the variable time step is in the order of 10-5 s leading to∼1.4 million steps with iteration time ∼1.5 s that translates toabout three weeks of computation. Nevertheless, the presentresults are satisfactory, because we qualitatively observed thelinear volume change during evaporation. To accurately predictthe volumetric evaporation rate and droplet lifetime, knowledgeof ε is required. Recall, as mentioned in section 3.4, that Marekand Straub46 noted a significant scatter (up to 3 orders ofmagnitude) in the theoretically and experimentally obtained ε.As mentioned above, three-dimensional effects might need to beconsidered as well.
Furthermore, it is worth mentioning that we initially used theCICSAM discretization scheme58 for the VOF equation insteadof Geo-Reconstruct.39 The droplet lifetime obtained withCICSAM58 was 2 orders of magnitude smaller. Therefore, Geo-Reconstruct is required formodeling droplet evaporation becauseCICSAM58 cannot adequately capture the liquid-gas interface.Resolving the interface is crucial for calculating the interfacialarea density needed for computing the mass transfer rate.4.2. OperatingConditions forMicrometer-SizedDroplets.
Table 1 presents the conditions for the numerically and experi-mentally investigated impinging droplets. The impact velocity(V0), the initial diameter (D0), the analytically obtained inertialoscillation frequency (ωana), the measured inertial oscillationfrequency (ωexp), the Weber (We), Reynolds (Re), Capillary(Ca), Ohnesorge (Oh), and Bond (Bo) numbers, as well as theequilibrium contact angle (θE), are presented. Note that V0 andD0 cannot be controlled independently. V0 and D0 are used tocompute the dimensionless numbers and ωana. The analyticalfrequencies are obtained by an order of magnitude analysisbetween the unsteady inertial term and the surface tension forcein the radial momentum equation (see eq 2) and by assuming thatωana ≈ V0/D0.
59 The very simple order of magnitude very closelymatches the measurements. Bothωana and ωexp clearly show thatthe frequency of oscillations of these microdroplets is in the rangeof tens of kHz, whereas for typical millimeter-sized droplets, it isabout 3 orders of magnitude smaller for similar conditions. Forinstance, for a 3.2 mmwater droplet (We= 7.1) impinging underambient conditionsωexp=50Hz,16whereas for dropletD (We=8.2),ωexp=61.3 kHz.Moreover, for all droplets in Table 1,We isgreater than unity and generally increases from droplet A todroplet I. Similarly, Ca andRe increase fromdroplet A to dropletI. Therefore, based on Ca the parasitic currents (nonphysicalcurrents generated in the fluid adjacent to the liquid-gas interfaceby local variations in the CSF) inherent to VOF model mightbecome more important in descending order from droplet I to
Table 1. Operating Conditions for Impinging Microdropletsa
droplet D0(μm) V0 (m/s) ωana (kHz) ωexp (kHz) We Ca � 103 Re Oh � 103 Bo � 106 θE (�)
(56) Crafton, E. F. Measurements of the evaporation rates of heated liquiddroplets, M.S. Thesis, Georgia Institute of Technology, Atlanta, GA.(57) Rymkiewicz, J.; Zbigniew, Z. Int. Comm. Heat Mass Transfer 1993, 20,
687–697.
(58) Ubbink, O.Numerical prediction of two fluid systemswith sharp interfaces,PhD Thesis; Imperial College of Science, Technology and Medicine, London,England, 1997.
(59) Schiaffino, S.; Sonin, A. A. Phys. Fluids 1997, 9, 3172–3187.
droplet A. These currents may become so large as to affect thepredicted flow field velocity and to even break up the interface inextreme situations.60 In addition, the very small Bo indicates thatthe gravitational force is not significant in comparison withsurface tension force. Interestingly, droplets A through I exhibitscattered θE values varying from nearly 90� to 50�. A plausibleexplanation is the following: Upon impact, some droplets spreadslowly and the instantaneouswetting diameter (DD) never exceedsthe equilibrium wetting diameter (DE). Therefore, the final
equilibrium contact angle (θE) is that of the advancing contactangle (θA). Some other droplets spread beyond DE and thenrecede to it, and the final θE is that of the receding contact angle(θR). Consequently, θE plainly shows a dependence on the contactlinemotion (i.e., hysteresis). Furthermore, themeasuredθE at lowWe and room temperature is θE ≈ 90� for both millimeter- andmicrometer-sized water droplets on aluminum as reported byBernardin et al.55 and by the present investigation (see Table 1),respectively.
The conditions for the numerical and experimental dropletevaporation study are listed in Table 2. It is not expected that thesmall difference in θE between experimental and numerical values
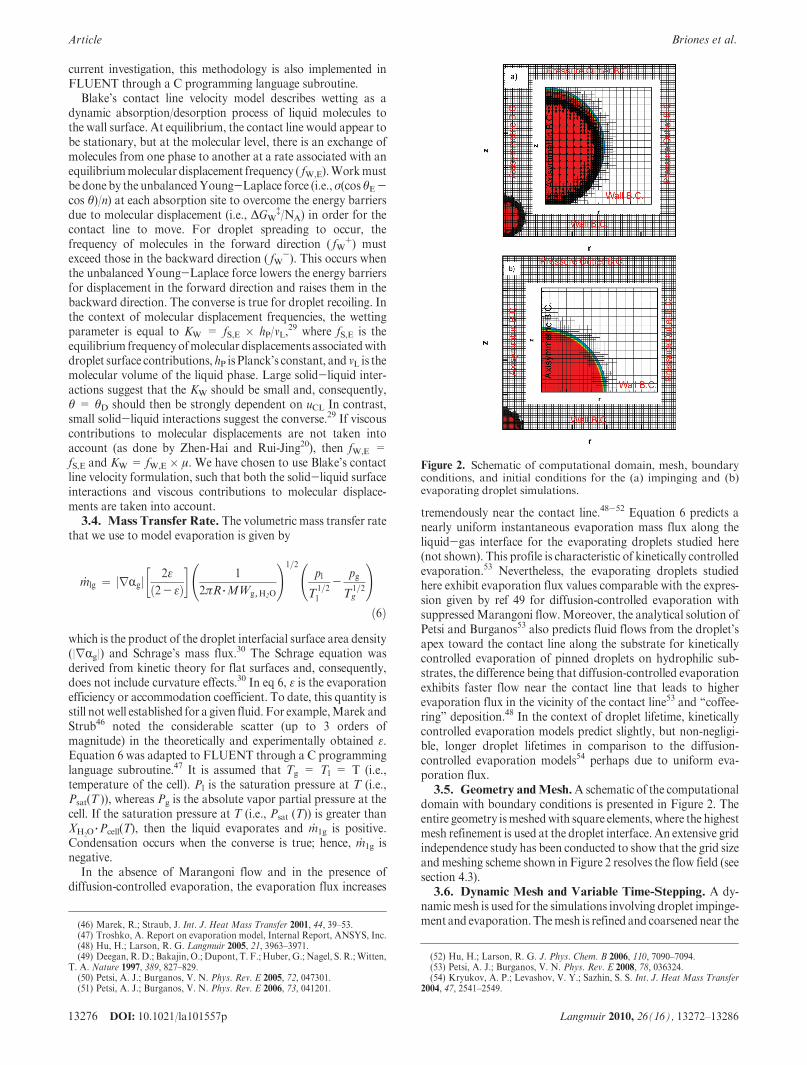
Figure 5. Instantaneous liquid volume fraction (Rl) and mesh∼16 μs after microdroplet impact for five simulations corresponding to (a) 0,(b) 1, (c) 2, (d) 3, and (e) 4 levels of refinements. Red indicates liquid, blue indicates gas, and colors in between indicate the interface. All fivesimulations correspond to droplet C (see Table 1).
(60) Harvie, D. J. E.; Davidson, M. R.; Rudman, M. Appl. Math. Model. 2006,30, 1056–1066.
would have a significant influence on the numerical results. Thetotal evaporation time (τ) is 1.299 s. As will be further discussed insection 4.5, the numerical model can satisfactorily predict thetransient and quasi-steady evaporation stages and predict lineartemporal evolution of the droplet height (H/HE) before depinningoccurs.However, because our numericalmodel does not contain adepinning mechanism it does not predict τ accurately.4.3. Grid Independence. Figure 5 illustrates the instanta-
neous VOF for droplet C of ∼16 μs after impingement for fivelevels of refinements (0 to 4) of the numerical cells near theliquid-vapor interface. Figure 6 shows their correspondingtemporal evolutions of the wetting radius (R) and height (H )for each level of refinement. Refinement level 0 indicates thatthere is no refinement. Whereas level 1 indicates that an originalcell is partitioned into four sections, a refinement level of 2 meansthat an original cell is partitioned in sixteen, and so on. Therefore,the separation distance between nodes is halved for each level ofrefinement. As shown in Figure 5a, the original grid spacing ofeach quadrilateral element is 3.33 μm. After the first refinement,the minimum grid spacing is 1.67 μm, after the second, 0.83 μm,after the third, 0.416 μm, and after the fourth, 0.208 μm. Figure 5clearly shows that with increasing the level of refinement thethickness of the interface decreases. In addition, not until after arefinement level of 3 do we numerically observe air bubbleentrapment near the center line. This indicates that the grid needsto be small enough to capture the air bubble in the droplet.Moreover, all the results show that after impingement the dropletspreads radially veryquickly until it reaches amaximumR (Rmax),which corresponds to a minimum (Hmin) at t ≈ 20 μs (seeFigure 6). Then, inertial oscillations follow as illustrated by theresults obtained with refinement levels from 1 to 4. With no cellrefinements (i.e., level of refinement = 0), inertial oscillations arenot well captured. Surprisingly, the equilibrium wetting radius(RE) and the equilibrium height (HE) are nearly independent ofthe level of refinement. However,Hmin andRmax at the end of thespreading process decreases and increases, respectively, with levelof refinement. The differences inHmin and Rmax between levels ofrefinement 3 and 4 are negligible. Therefore, level of refinement 3is used for the numerical simulations.4.4. Impact Droplet Dynamics. Now, the results on micro-
meter-sized droplets with Blake’s contact line velocity formula-tion are discussed. The results presented in this section are alsouseful for validating Blake’s contact line velocity model. Figure 7shows the frame by frame comparison of experimental andnumerical images corresponding to droplet C. Whereas thenumerical results show the liquid volume fraction (Rl), theexperimental results show the high-speed image. Blake’s contactline dynamics formulation29 is usedhere for the simulationswith awetting parameter,Kw=2.0MPa.The experimental results showthat, after the droplet has impinged on the substrate, it starts tospread very rapidly. Its contact angle abruptly decreases from180� at the moment of contact (not shown) to∼80� after∼5.3 μsfollowing impingement. The spreading process ends and thedroplet pins on the substrate at ∼20.5 μs. Then, inertial oscilla-tions follow and are characterized bymotion of the droplet’s apexheight. The amplitude of these oscillations decreases with timedue to viscous dissipation and becomes negligible at∼150 μs afterimpingement. The numerical result qualitatively matches theexperimental result. Interestingly, the numerical model also pre-dicts air bubble entrapment. In the model, the air bubble isattached to the wall (or substrate) at the center line of the droplet.This bubble is observed during the spreading process as indicatedin the VOF image at t ≈ 5.4 μs. The bubble remains insidethe droplet throughout the simulation. For our experiments,
however, the air bubble is not always located at the center lineas is shown in a subsequent section. Nevertheless, both ourexperiments and numerical results are in agreement with previous
Figure 6. Temporal evolutions of microdroplet (a) wetting radius(R) and (b) apex height (H ) for five levels of refinements rangingfrom 0 to 4 for droplet C (see Table 1).
Figure 7. Frame by frame comparison of experimental and nu-merical images corresponding to droplet C. The experimentalresults show the high-speed photograph, whereas the numericalresults show the liquid volume fraction (Rl). Red indicates liquid,blue indicates gas, and colors in between indicate the interface.
investigations.19,20,61 For instance, Mehdi-Nejad et al.61 showedthat, for millimeter-sized water droplets, the air bubble remainsattached to the substrate as observed in our simulations. How-ever, for n-heptane droplets, the bubble moved away from thesurface, breaking in multiple bubbles and escaping through theinterface.60 van Dam and Le Clerc19 and Zhen-Hai and Rui-Jing20 also reported bubble encapsulation in micrometer-sizedwater droplet impingement with characteristic We varying from1.1 to 165. This suggests that the bubble entrapment observed inthe numerical simulations actually occurs.
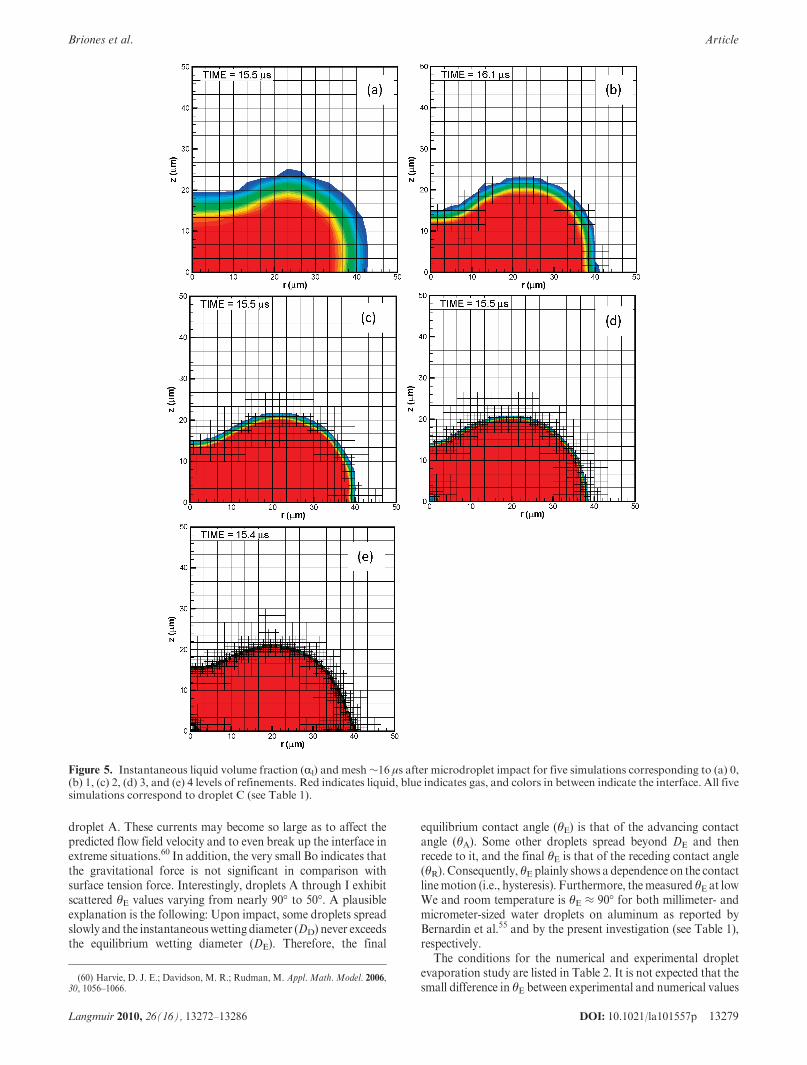
To further examine the results presented in Figure 7, Figure 8presents the predicted and measured temporal evolutions ofdimensionless wetting radius (R/D0) and droplet apex height (orflatness ratio) (H/D0). The numerical results were obtained usingSCA, DCA, and Blake’s molecular kinetic model with two testvalues, viz., KW = 2.0 and 20.0 MPa, since KW is not known apriori. These are the samevalues usedbyBhardwaj andAttinger16
in a similar work. Qualitatively, the results of SCA, DCA, andBlake’s molecular kinetic model with Kw = 20.0 MPa providesimilar results. These three simulations indicate impact dynamicscharacterized by spreading followed by a pronounced recoilingand inertial oscillations. The experimental results evidently show
there is no recoiling. Blake’s model with KW= 2.0MPa providesa better approximation to our measurements. Moreover, SCAoverpredictsRD bymore than a factor of 2.4 during the spreadingprocess. Consistent with Lunkad et al.,17 DCA improves the SCAnumerical results by allowing RD to be overpredicted by no morethan a factor of 2.2. Despite these differences between theexperimental and numerical results, both SCA and DCA provideaccurate results in terms ofRE.WithBlake’smodel, the results arehighly dependent on the spreading parameter (KW). Figure 8indicates that both values give reasonable results within thespreading process (i.e., t� V0/D0 < 0.91 or t< 20.5 μs). Duringthe inertial oscillation process (i.e., t � V0/D0 g 0.91), theaccuracy of Blake’s model decreases in terms of the temporalevolution of R/D0. Blake’s model underpredicts RE. However,withKW=2.0MPaBlake’smodel providesmore accurate resultsthan with KW = 20.0 MPa during the inertial oscillation stage.Some of the reasons for these discrepancies are the following: (1)the value of KW is not known a priori; (2) there are parasiticcurrents inherent to the VOFmodel that do not allow full dropletpinning. Moreover, Figure 8 clearly shows that Blake’s modelwith KW = 2.0 MPa provides the best prediction of H/D0 as afunction of t � V0/D0 relative to the other three simulations (i.e.,SCA, DCA, and Kw = 20.0 MPa). From the results presented inFigure 7 and Figure 8, Kw was selected to be 2.0 MPa for alldroplet impingement simulations.
Figure 8. Temporal evolutions of (a) dimensionless microdropletwetting radius (R/D0) and (b) dimensionless microdroplet apexheight (or flatness ratio) (H/D0) for droplet C. The experimentalresults for a single experiment are shown with comparison to ournumerical predictions using SCA, DCA, and Blake’s molecularkinetic model with Kw = 2.0 MPa and Kw = 20.0 MPa.
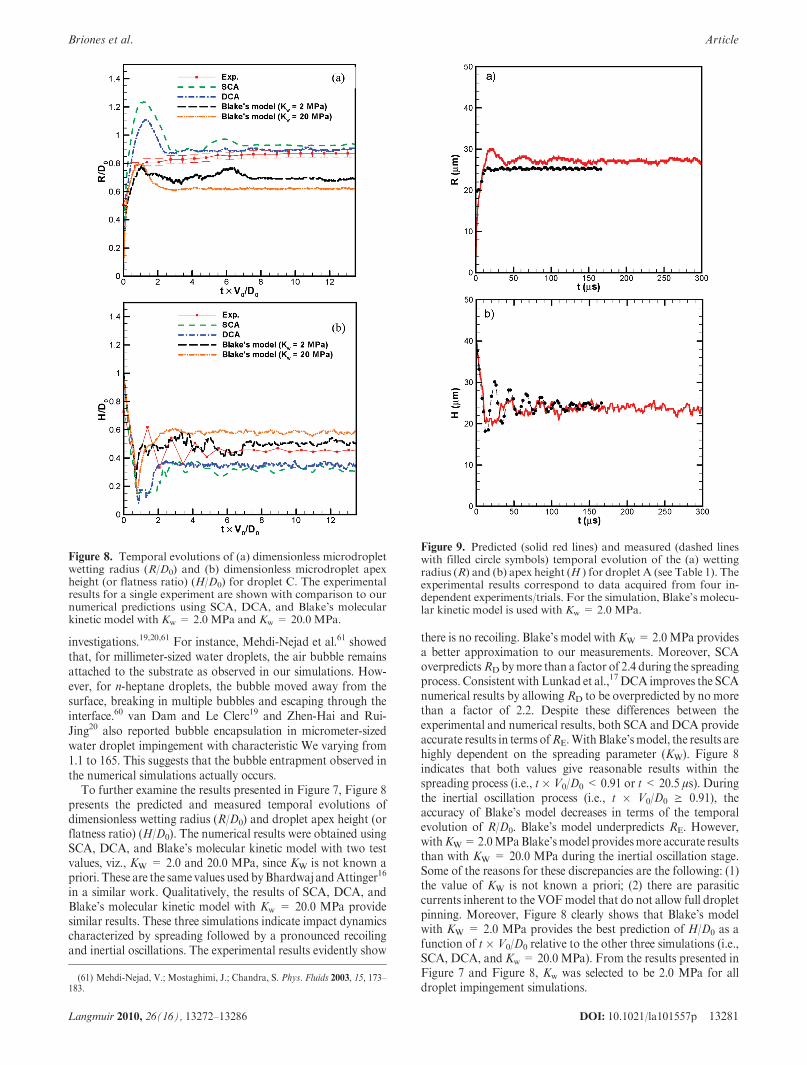
Figure 9. Predicted (solid red lines) and measured (dashed lineswith filled circle symbols) temporal evolution of the (a) wettingradius (R) and (b) apex height (H ) for droplet A (see Table 1). Theexperimental results correspond to data acquired from four in-dependent experiments/trials. For the simulation, Blake’s molecu-lar kinetic model is used with Kw = 2.0 MPa.
Now, we analyze the quantitative and qualitative accuracy ofourmodel for other droplets listed in Table 1. So far, we have seenthat the spreading process is followed by inertial oscillations (i.e.,RDeRE at all times), but as will be shown, depending onWe thespreading process could be followed by recoiling and inertialoscillations (i.e., RD > RE at end of spreading and beginning ofreceding process). For ease of discussion, the former condition isnamedRegime I and the latterRegime II. Figure 9, Figure 10, andFigure 11 present the temporal evolution ofR andH for dropletsA, D, and I, respectively. Our numerical simulations presentremarkably good quantitative and qualitative results for dropletA. This is because at We = 1.4 and Oh = 0.026 the contact linedynamics play a more critical role in droplet spreading than thedynamic pressure gradient.59 Hence, the accuracy of Blake’smodel improves relative to droplet C (see Figure 8). Withincreasing We while Oh remains nearly constant, the dynamicpressure gradient due to impact becomes more significant fordroplet spreading relative to the contact line dynamics.59 Theresults of this simulation for droplet D show that there is goodqualitative and quantitative comparison between measurementsand simulations during the spreading stage. This comparison,however, is no longer so great during the inertial oscillation stage.For instance, Blake’s model overpredicts RD and RE and under-predicts HD and HE. Thus, the numerical model appears to beoverdamped as suggested by the lack of temporal changes on
droplet height (H ) after the spreading process. With furtherincrease in We, the droplet spread is impact-driven and inertiaresisted. The results of droplet I show that both the spreading andthe oscillation stage are qualitatively and quantitatively wellpredicted. Both experiment and simulation indicate that RD
exceeds RE at ∼10 μs, which is then followed by recoiling untilit reaches RE. Numerical simulations overpredict RE and under-predict RD. Nevertheless, the numerical model provides satisfac-tory results at the extremeWe studied here (i.e., 1.4 and 35.2), andits accuracy decayswith droplets C andD corresponding to 4.5<We < 11.0. This suggests that these two cases might be in atransitional region between Regime I and Regime II.
Figure 12 and Figure 13 present the predicted and measuredtemporal evolutions of wetting radius (R/D0) and droplet height(H/D0), respectively. Surprisingly, the numerical results indicatethat the equilibrium RE/D0 and HE/D0 for all droplets exceptdroplet D collapsed at RE/D0 ≈ 0.7 and HE/D0 ≈ 0.6. Theexperimental results clearly show this trend in Figure 12 exceptthat it is droplet C instead of droplet Dwhich does not collapse. Itis evident fromboth numerical and experimental results that thereappears to be a transition regime between Regimes I and II,discussed above. This transition regime occurs at We = 4.5 andWe =11.0 for our experimental and numerical results, respec-tively. Furthermore, the time for completion of the spreadingand the combined spreading and receding process for droplets
Figure 10. Predicted (solid red lines) and measured (dashed lineswith filled circle symbols) temporal evolution of the (a) wettingradius (R) and (b) apex height (H ) for droplet D (see Table 1). Theexperimental results correspond to data acquired from threeindependent experiments/trials. For the simulation, Blake’s mo-lecular kinetics model is used with Kw = 2.0 MPa.
Figure 11. Predicted (solid red lines) and measured (dashed lineswith filled circle symbols) temporal evolution of the (a) wettingradius (R) and (b) apex height (H ) for droplet I (see Table 1). Theexperimental results correspond to data acquired from four in-dependent experiments/trials. For the simulation, Blake’s molecu-lar kinetic model is used with Kw = 2.0 MPa.
in Regimes I and II, respectively, decreases with decreasingWe.4.5. Droplet Evaporation. The results for micrometer-sized
droplet evaporationwill nowbe described. In the experiments, thedroplet was gently deposited on the surface to avoid the hysteresisdiscussed in section 4.2. Droplet evaporation is modeled sepa-rately from droplet impingement due to 4 orders of magnitudedifference in their characteristic time scales. The droplet initialconditions for the simulations were also discussed in section 4.2.Recall that the droplet static pressure is initially at ambientconditions at the beginning of the simulation. This is not realistic,but the static pressure inside the droplet, however, increases dueto surface tension forces to a value close to that predicted by theYoung-Laplace equation in a few time steps within a fewmicroseconds. This has no implication on the results, sinceevaporation lifetime is on the order of seconds. Figure 14illustrates the predicted instantaneous velocity vectors, isobars,and droplet shape in terms of Rl = 0.5. In the initial transientstage, the Courant-Friedrichs-Lewy condition |cΔt/Δx| is set to0.05 in order to handle the abrupt changes in velocity vector andpressure fields. This transient stage lasted∼8.5 ms and is depictedby comparing the instantaneous flow field at 3.627 and 8.532 msin the frames of this figure. The transient stage (i.e., plot at 3.627ms)is clearly characterized by droplet evaporation at nearly constantapex heightwith small toroidal vortex formation in both the droplet
and in the gaseous phase adjacent to the liquid-vapor interface.The vortex structures in the gaseous phase are apparently caused bybuoyancy-induced Rayleigh-Taylor instability, since the vapor isless dense than air. Therefore, air is drawn from the surroundingscreating shear layer roll-ups on the droplet surface. The distortedsurface leads to surface tension force gradients that assist in theformation of small toroidal vortices within the droplet during thisephemeral transient stage.
After ∼8.5 ms, a second stage characterized by quasi-steadyvelocity vector flow field and pressure flow field is observed inplots at 8.532 ms and at 0.7416 s. Now, the droplet’s apex heightshrinks, whereas the contact line remains pinned. Because thedroplet remains pinned, water flows down from the droplet’s apexand then turns toward the contact line in order to replenish thevolume that evaporates there. This result is consistent with theextensive analytical51,53,62,63 and numerical48,64 studies on pinneddroplet assuming inviscid flow51,62 and Stokes flow.48,53,63,64
Then, the variance in curvature along the liquid-gas interfaceinduces Marangoni flow characterized by fluid flow from thecontact line toward the droplet’s apex. Similarly, Hu andLarson31 showed that when the Marangoni number (Ma) is
Figure 12. (a) Predicted and (b) measured wetting radius (R/D0)as a function of dimensionless time (t � V0/D0) for all watermicrodroplets studied in the context of Table 1. The experimentaldata correspond to a single impingement experiment for eachdroplet (A-I). Blake’s molecular kinetic model is used withKw = 2.0 MPa.
Figure 13. (a) Predicted and (b) measured droplet height (H/D0)as a function of dimensionless time (t � V0/D0) for all watermicrodroplets studied in the context of Table 1. The experimentaldata for each droplet (A-I) corresponds to an individual impinge-ment experiments. Blake’s molecular kinetic model is used withKw = 2.0 MPa.
(62) Tarasevich, Y. Y. Phys. Rev. E 2005, 71, 027301.(63) Masoud, H.; Felske, J. D. Phys. Fluids 2009, 21, 042102.(64) Petsi, A. J.; Kalarakis, A. N.; Burganos, V. N. Chem. Eng. Sci. 2010, 65,
non-negligible the fluid flows toward the contact line along thesubstrate and then flows toward the droplet’s apex along theliquid-gas interface. Therefore, a toroidal vortex of the size ofthe droplet is depicted in the snapshots at 8.532 ms and 0.7416 s(cf. Figure 14). Ruiz and Black28 also reported that dropletevaporation is characterized by a transient and a quasi-steadystage. As mentioned before, the model in ref 28 is interface-tracking and implicitly assumes that the droplet is in a vacuum.Our results show that the velocity flow field in the gaseous phase istime-dependent as illustrated by changes in direction and magni-tude of the velocity vector in Figure 14. The gaseous phase exhibitsflow oscillations induced by buoyant acceleration. The buoyantacceleration of water vapor causes shear layer rollup, leading tothe formation of a toroidal vortex at the droplet’s peripherythat interacts with the incoming vapor from the droplet surface.The toroidal vortex squeezes the flow toward the center line(e.g., snapshot at 0.7416 s) and also decelerates it (e.g., snapshotat 8.532 ms). The overall effect of this phenomenon might be toenhance external convection for a droplet on a heated surface.
Finally, measured temporal evolution of droplet spread ratio(R/RE) and height (H/HE) are presented in Figure 15. Two
snapshots of droplet evaporation are shown at t = 0 and 0.7 s.In addition, the predicted H/HE is plotted. In the experiments,when this droplet was deposited two small air bubbles weretrapped as shown in Figure 15a. In contrast to the numericalsimulations shown in Figure 5 and Figure 7, the air bubbles arenot at the center of the droplet. This again suggests the need to useVOF model for droplet evaporation since air bubbles can initiatenucleate boiling at much lower superheats than theory predicts.33
However, we do not expect our numerical simulation to besignificantly affected by the air bubbles, since there is negligibleheat transfer from thewall to the droplet. ThemeasuredR/RE as afunction of time remains nearly constant until ∼0.42 s whendepinning occurs. Then, R/RE varies linearly with time until fullevaporation. In contrast, the measuredH/HE varies linearly withtime until 1 s. Then, H/HE varies more rapidly until completeevaporation. Our numerical simulations show that H/HE varieslinearly with time. Therefore, there is good qualitative andquantitative agreement between measurements and predictions.The numerical results beyond 0.42 s do not include depinning, butit is seen that the slope is similar to the experimental data up to∼1s. This suggests that depinningmay not be as important toH/HE.As mentioned in section 4.1.2, three-dimensional effects andaccurate knowledge of ε are also needed for improved dropletevaporation modeling and simulation.
5. Conclusions
A comprehensive numerical and experimental investigation onmicrometer-sized water droplet impact dynamics and evapora-tion on an unheated flat dry surface was conducted from thestandpoint of spray cooling technology. The explicit VOF withaxisymmetric time-dependent governing equations of continuity,momentum, energy, and species are solved. Surface tension, walladhesion effect, gravitational body force, contact line dynamics,and evaporation were also considered. This is the only investiga-tion reporting both Blake’s and Schrage’s molecular kineticmodels for contact linemotion and evaporation rate, respectively,within the VOF formulation, and thereby, it is a significantcontribution of our research. The numerical model also includestemperature- and species-dependent thermodynamic and transport
Figure 14. Predicted instantaneous velocity vectors, isobars (bluesolid lines), and droplet shape (black solid line) obtained from theliquid volume fraction (Rl) of 0.5. The velocity vector reference isalso shown on the upper right corner with units of m/s. The labelsfor the isobars 1, 2, 3, 4, and 5 correspond to 1, 10, 100, 1000, and10 000 Pa, respectively.
Figure 15. Measured temporal evolution of droplet spread ratio(R/RE) and flatness ratio (H/HE) for a water microdroplet evapor-ating on an Al at room temperature (see Table 2). The red circlescircumvent the location of the observable air bubbles within thedroplet.
properties. An extensive grid independence analysis was con-ducted. Microdroplet impingement and evaporation data areacquired with a standard dispensing/imaging system with ahigh-speed camera. Important conclusions are as follows.
The numericalmodel was validatedwithmillimeter-sizedwaterdroplet impingement and evaporation experiments reported inthe literature. For the impinging droplet, we found good correla-tion between measured and predicted maximum wetting radius(or contact line position) (R) as a function of time. Moreover,experiments and simulations indicate that as We decreases thespreading rate decreases. For the evaporating droplet from anisothermal wall, measurements indicate that the droplet’s volumevaries linearly with time until full evaporation occurs at ∼14 s.The predicted volume varies nearly linearly and quantitativelyand qualitatively matches the measurement until ∼10 s. Toaccurately predict the volumetric evaporation rate and dropletlifetime, knowledge of the accommodation coefficient (ε) andthree-dimensional effect may need to be taken into account.
Both numerical and experimental results indicate that, after themicrometer-sized droplet has impinged on the substrate, it startsto spread very rapidly. Its contact angle abruptly decreases andthe spreading rate increases. The spreading process ends and thedroplet pins on the substrate. Then, inertial oscillations followand are characterized by vertical motion of the droplet’s apexheight. The amplitude of these oscillations decreases with timedue to viscous dissipation and becomes negligible.
The VOFmodel is capable of capturing air bubble entrapmentfor micrometer-sized droplet impingement. This air bubble isattached to the wall (or substrate) at the center line of the droplet.This bubble is observed during the spreading process. The bubbleremains inside the droplet throughout the simulation. For ourexperiments, however, the location of the air bubble is not alwayslocated at the center line.
Numerical results indicate that Blake’s formulation providesbetter results than the static (SCA) and dynamic contact angle(DCA) approach in terms of temporal evolution of R/D0 andH/D0, especially at the initial stages of spreading.However, SCAandDCA predict equilibriumwetting radius (RE/D0) more accuratelythan Blake’s formulation. The latter provides reasonable resultsregarding the equilibrium flatness ratio (HE/D0). Blake’s contactline dynamics is dependent on the wetting parameter (KW).
The accuracy of our numerical model is good atWe away from∼4.5 < We < 11.0, since it appears that at this condition theshort-term droplet impingement transitions between two differentregimes. ForWe<4.5, spreading is followed by pinning and theninertial oscillations, whereas forWe> 11.0, spreading is followedby recoiling, pinning, and then inertial oscillations. Moreover, thecharacteristic dimensionless time (t�V0/D0) for completion of thespreading process for We < 4.5 and the combined spreading andreceding process for We > 11.0 decreases with decreasing We.
The micrometer-sized droplet evaporation measurements in-dicate that the droplet remains pinned for about one-third of thedroplet’s lifetime. Depinning occurs, the contact line recedes, andthe droplet radius (R/RE) varies linearly with time until fullevaporation.Most of the evaporation occurs in a depinned modethan in pinned mode. The measurements also show that thedroplet’s apex height (H/HE) decreases linearly with time duringmost of the droplet’s lifetime and then it decreases more rapidlynear the end of the droplet’s lifetime until complete evaporation.Our numerical simulations also show that H/HE varies linearlywith time. Therefore, there is good qualitative and quantitativeagreement betweenmeasurements and predictions. Since a depin-ningmodel has not beenused inour simulations, this suggests thatdepinning may not be as important to H/HE.
Droplet evaporation was satisfactorily modeled usingSchrage’s model since the model predicts both well-definedtransient and quasi-steady evaporation stages. Vortex layer roll-up and toroidal vortices are formed on the droplet surface in thegaseous phase due to buoyancy-induced Rayleigh-Taylor in-stability. These vortices interact with the incoming vapor fromthe droplet’s surface, enhancing convection.
Acknowledgment. This material is based on research spon-sored by U.S. Air Force Office of Scientific Research under grantno. 2303BR5P. The authors are thankful to Steven Patton andChad Hunter for their help with frequent technical consultationsduring the preparation of this paper. The authors are also gratefulto HPCMPO for the computing resources at the AFRL/DSRC. The views and conclusions contained herein are thoseof the authors and should not be interpreted as necessarilyrepresenting the official policies or endorsements, either expressedor implied, of U.S. Air Force Office of Scientific Research or theU.S. Government.
Nomenclature
Bo Bond number = g(Fl)D02/σ
Ca Capillary number = μV0/σCHF critical heat flux [W/m2]cp specific heat capacity at constant pressure [J/kg-K]D droplet diameter [ μm]DCA dynamic contact angle [�]DH2O-airbinary diffusivity of water vapor to air [m2/s]E total energy per volume [W/m3]H droplet height at center line [ μm]h heat transfer coefficient [W/m2-K]hP Planck’s constant [6.626 � 10-34 m2 kg s-1]gB gravitational acceleration vector [m/s2]Kw wetting parameter [Pa]k thermal conductivity [W/m-K]kB Boltzmann constant [1.3806503� 10-23 m2 kg/s2-K]NA Avogadro’s constant [6.0221415� 1023 mol-1]MW molecular weight [kg/kmol]_m mass transfer rate per unit volume [kg/m3-s]n surface normal vector or number of absorption sites
per unit area [m-2]n̂ unit surface normal vectorOh Ohnesorge number =
√We/Re
p gauge pressure (Pa)SCA static contact angle [�]R wetting radius [ μm] and universal gas constant [8.314
kJ/kmol-K]Re Reynolds number = FV0D0/μT temperature [K]t time [ μs, s]t̂ tangential unit vectoru radial velocity [m/s]V0 initial axial velocity [m/s]v axial velocity [m/s]VOF volume of fluidvL volume of molecule in liquid phase [m3]We Weber number = FV0


![Femoroacetabular%20 impingement[1]](https://static.documents.pub/doc/80x56/54559a24af7959d8748b6a78/femoroacetabular20-impingement1.jpg)


