WP 15.3 16 October 2013 UNITED NATIONS STATISTICAL COMMISSION and ECONOMIC COMMISSION FOR EUROPE STATISTICAL OFFICE OF THE EUROPEAN UNION (EUROSTAT) Joint Eurostat/UNECE Work Session on Demographic Projections organised in cooperation with Istat (29-31 October 2013, Rome, Italy) Item 15 – Beyond population projections by age and sex: Inclusion of additional population characteristics Microsimulation of language characteristics and language choice in multilingual regions with high immigration Patrick Sabourin, Institut national de la recherche scientifique (INRS) Alain Bélanger, Institut national de la recherche scientifique (INRS)
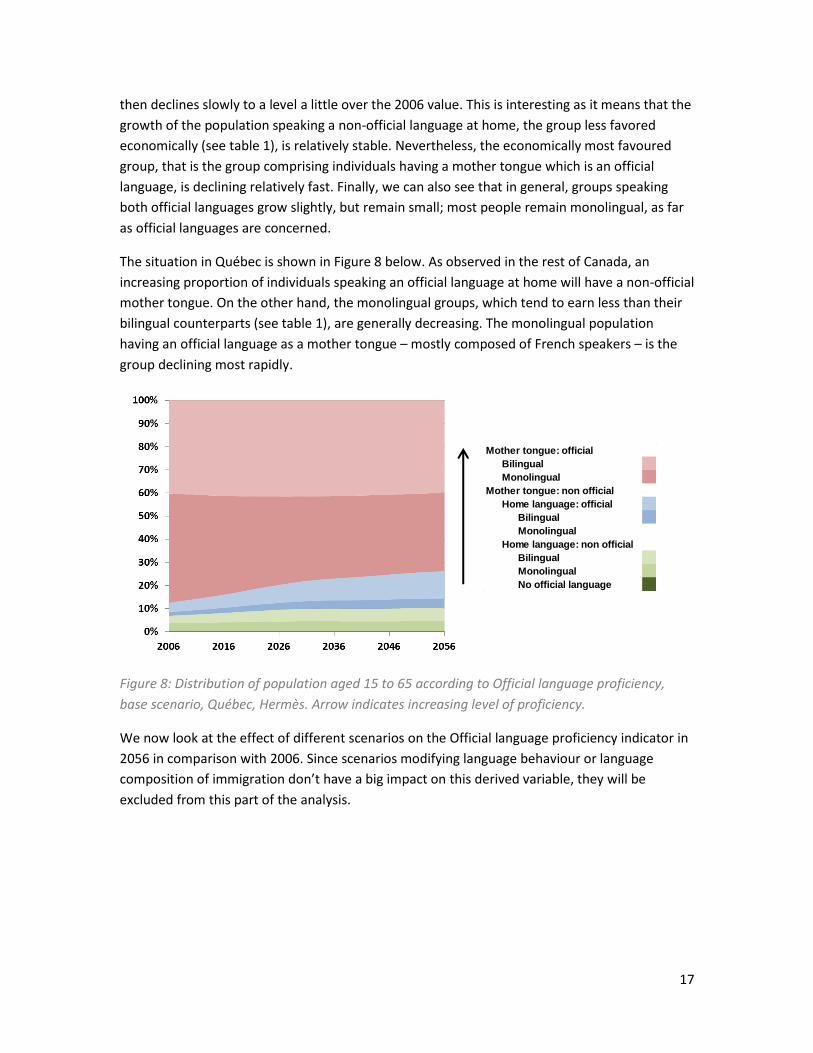
Transcript
WP 15.3
16 October 2013
UNITED NATIONS STATISTICAL COMMISSION
and ECONOMIC COMMISSION FOR EUROPE
STATISTICAL OFFICE OF THE
EUROPEAN UNION (EUROSTAT)
Joint Eurostat/UNECE Work Session on Demographic Projections
organised in cooperation with Istat
(29-31 October 2013, Rome, Italy)
Item 15 – Beyond population projections by age and sex: Inclusion of additional population
characteristics
Microsimulation of language characteristics and language choice in
multilingual regions with high immigration
Patrick Sabourin, Institut national de la recherche scientifique (INRS)
Alain Bélanger, Institut national de la recherche scientifique (INRS)
1
Joint Eurostat/UNECE Work Session on Demographic Projections
29 - 31 October 2013
Rome, Italy
Microsimulation of language characteristics and language choice in multilingual regions with high immigration
Working paper
Patrick Sabourin
Institut national de la recherche scientifique – Centre Urbanisation Culture Société
Introduction Language is a ubiquitous element of our everyday life. It is not only essential to human
communication, it is a vector of culture and identity. The first language learnt at home in
childhood generally constitutes a major piece of the self, a mean to define one’s identity and to
construct one’s own world views. To some, language even influences how people think and
process information (Crystal 2000; Deutscher 2010).
Although most of the people around the world make use of their mother tongue in their daily
activities, many, such as national minorities and immigrants, have to use a second or a third
language to get by in their private and public life, notably to interact with collegues at work, to
get government services or to buy day-to-day goods and services. To them, knowledge of a
society’s dominant language is a fundamental prerequisite to economic and cultural integration.
In time, simple integration usually turns into assimilation as immigrants or their children
abandon their mother tongue to use the host society’s dominant language at home. Such
assimilation of immigrant languages usually occurs within less than three generations (Rumbaut,
Massey, and Bean 2006; Bélanger, Lachapelle, and Sabourin 2011), but some exceptions do
exist1.
In countries having high immigration intakes, the rate at which newcomers learn and adopt the
language of the host society may be an important political and economic issue. The failure of
immigrants to learn the language of the host country may lead them to fall in some form of
ghettoization or poverty trap. Over time, this may induce negative perceptions,
misunderstandings, intolerance, xenophobia or outright racism.
Linguistic integration of immigrants may also have unsuspected political consequences. In
regions of the world where many languages coexist, language choice can be a strong marker of
integration into a specific community, and in turn this integration may influence political
preferences. In Québec and in Catalonia, support for independence is highly correlated with self-
identification to a specific cultural group and to the use of a language at home (both of which
are also correlated)2. Language dynamics contributes to shape the political landscape.
Language also plays a significant role in the economic sphere. Language proficiency has been
shown to be important in order for immigrants to achieve successful integration in the labour
market. Language proficiency and literacy in general is strongly related to higher employment
rates and higher income (Chiswick and Miller 2002; Chiswick and Miller 1999). Conversely, lack
of literacy has been shown to be an important factor in the overqualification of immigrants with
1 Secluded religious minorities, or communities with a strong preference for endogamous unions are cases
where language may be transmitted over a longer period. 2 In Québec, French speakers are mostly divided on the issue of independence, whereas more than 90% of
speakers of other languages would vote for the status quo. Situation is similar in Catalonia. Poll data for Québec: http://www.leger360.com/admin/upload/publi_pdf/FRCA20130209.pdf. Survey data for Catalonia: http://www.cis.es/cis/opencm/EN/1_encuestas/estudios/ver.jsp?&cuestionario=16158&estudio=13564
Canada outside Qc QuébecOfficial language proficiency
4
Canada is well settled in a low-fertility, rapid-ageing and high-immigration demographic regime.
The annual influx of immigrants continuously modifies the country’s demographic and linguistic
landscape. In the past, the high fertility of the French Canadians somewhat compensated for the
higher proportion of English speakers among the immigrants. Nowadays fertility is low among
both English and French Canadians, and about two thirds of the Canadian population growth is
due to an increasingly diverse immigration. Between 2001 and 2006, Canada's foreign-born
population increased by 14% – four times faster than the growth rate of the Canadian-born
population during the same period – and most immigrants have a mother tongue that is neither
English nor French. Consequently the share of the Allophone population – those having a non-
official language as a mother tongue – is growing rapidly: from 18% in 2001 to 20% in 2006.
Canada is in itself a natural experiment in language dynamics. The country is officially bilingual
at the federal level (French and English), but mainly monolingual at the provincial level with only
one province (New-Brunswick) being officially bilingual4. Demographically, French is the majority
language solely in Québec. This configuration gives an English majority and French minority in
Canada outside of Québec, and a French majority and English minority in Québec. Conditions
faced by minorities as well as their relationship to majorities vary widely from province to
province.
In this paper, we will present the results of a microsimulation model projecting simultaneously
three language variables: mother tongue, language spoken most often at home and knowledge
of official languages. In the past, only one of these language dimensions had been projected in a
single model. Termote’s multistate model (Termote, Thibault, and Payeur 2011; Termote and
Thibault 2008) included language spoken at home whereas Statistics Canada’s Demosim only
projected mother tongue (Caron Malenfant, Lebel, and Martel 2010). Including all three
variables in the model allows us to get a more complete picture and to project derived variables,
whose relevance has been shown earlier in relation to income.
Methods The results were obtained from Hermès, a cased-based, open, dynamic, continuous-time
projection model implemented using Modgen, a microsimulation programming language
developed at Statistics Canada. The geographical template used in the model takes into account
the location of immigrants as well as the concentration of official language minorities (i.e.
English in Québec and French in the rest of Canada). Although the model includes 19 regions to
account for regional dynamics, only the results for the province of Québec, the Montréal Island,
and the rest of Canada will be discussed in this paper. The base population used in the model is
taken from the 2006 census confidential microdata.
4 Although the province of Québec is officially monolingual French, overriding federal legislation and an
institutional configuration favoring English makes it in reality the most bilingual province of the country.
5
Life course events were implemented in various demographic and linguistic modules, whose
input parameters are briefly described below.
Demographic characteristics
Relative age-specific fertility rates according to the place of residence and language spoken at
home (see below) were estimated from census data using the own-children method
(Desplanques 1993; Cho, Retherford, and Choe 1986). The fertility rates were then calibrated
using the 2011 vital statistics, so that the number of births in the model matched the number of
births registered in 2011. Total fertility rates in 2011 were 1.61 for Canada (including Québec)
and 1.69 in Québec.
Age-specific death rates (ASDR) were taken from provincial vital statistics. ASDR were not
allowed to vary according to language characteristics as the data is generally unreliable or
simply not available. It has previously been shown that life expectancy is shorter for French
speakers (Auger et al. 2012) and longer for non-official language speakers, who may benefit
from the “healthy immigrant effect” (Ali, McDermott, and Gravel 2004), but those differences
would have little impact on the projection results.
Characteristics of arriving cohorts of immigrants in the model are taken from the characteristics
of recent immigrants in the 2006 census (arrived between 2000 and 2006). Table 2 shows that
immigration is mostly concentrated in three provinces (Ontario, British-Columbia, and Québec)
and in large cities (70% of immigrants in Québec are settled on the Montréal Island5).
Table 2: Geographical distribution of immigrants arrived between 2000 and 2006 in Canada
(Source: 2006 census).
The model allows for the geographical and linguistic (mother tongue, see below) distribution of
immigrants to be modified from the original distribution in order to create different scenarios
related to the distribution and composition of immigration. In the model, the proportion of
immigrants settling in Québec was set to 20% instead of 16.7% (see table 2) to reflect the fact
that upon arrival, close to 20% of immigrants choose to establish themselves in Québec, and
also to reflect recent trends showing an increasing proportion of immigrants settling in Québec.
Net international outmigration rates were estimated by Statistics Canada and sum up to a global
annual rate of approximately 1 per thousand. In the model, relative risks are also inserted so
5 The Montréal Island includes the city of Montréal as well as other municipalities.
Region % of total immigration
Maritimes 1.2%
Ontario 53.7%
Prairies 12.7%
British-Columbia 15.8%
Québec 16.7%
Montréal Island 69.9%
Rest of Québec 30.1%
6
that recent immigrants make up for about 80% of international out-migrants, to reflect the fact
that net international migration rates are small for natives.
Annual probability of internal migration (i.e. getting out of a region) was estimated using census
data and a logit model controlling for age, sex, language spoken at home, region of residence,
and immigrant status. Once a migration event occurs in the model, the destination region is
determined through an origin-destination matrix, which varies according to language spoken at
home.
Language characteristics
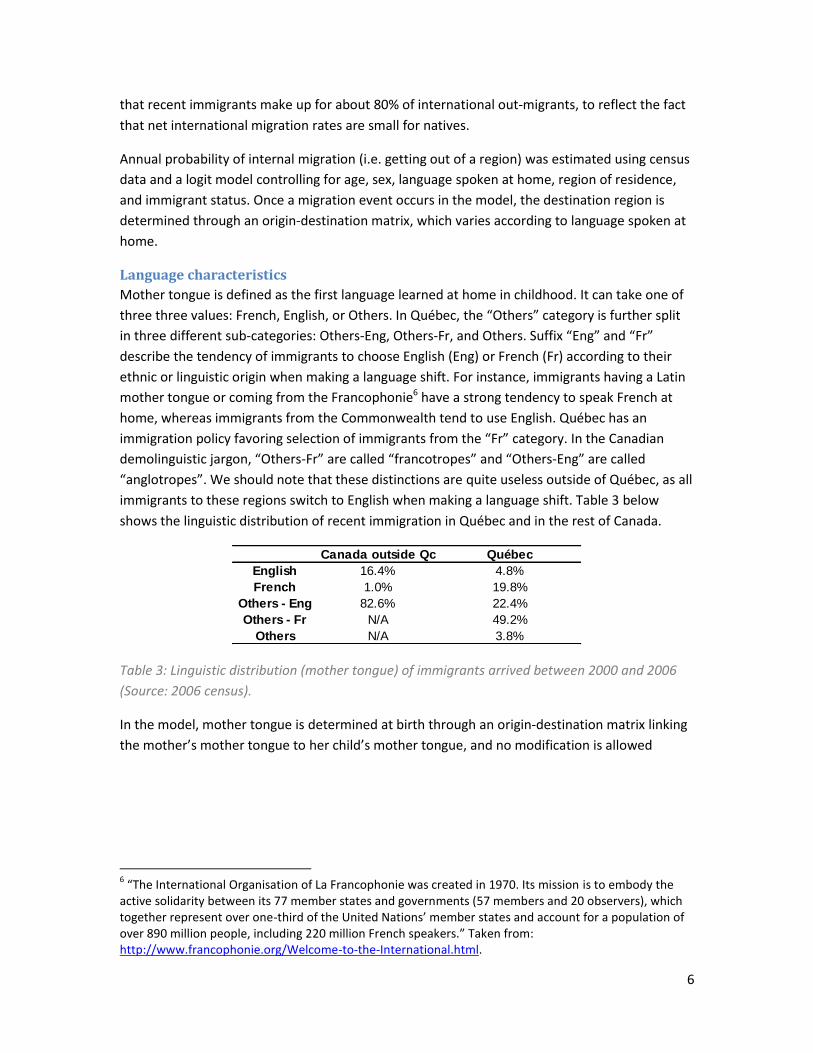
Mother tongue is defined as the first language learned at home in childhood. It can take one of
three three values: French, English, or Others. In Québec, the “Others” category is further split
in three different sub-categories: Others-Eng, Others-Fr, and Others. Suffix “Eng” and “Fr”
describe the tendency of immigrants to choose English (Eng) or French (Fr) according to their
ethnic or linguistic origin when making a language shift. For instance, immigrants having a Latin
mother tongue or coming from the Francophonie6 have a strong tendency to speak French at
home, whereas immigrants from the Commonwealth tend to use English. Québec has an
immigration policy favoring selection of immigrants from the “Fr” category. In the Canadian
demolinguistic jargon, “Others-Fr” are called “francotropes” and “Others-Eng” are called
“anglotropes”. We should note that these distinctions are quite useless outside of Québec, as all
immigrants to these regions switch to English when making a language shift. Table 3 below
shows the linguistic distribution of recent immigration in Québec and in the rest of Canada.
Table 3: Linguistic distribution (mother tongue) of immigrants arrived between 2000 and 2006
(Source: 2006 census).
In the model, mother tongue is determined at birth through an origin-destination matrix linking
the mother’s mother tongue to her child’s mother tongue, and no modification is allowed
6 “The International Organisation of La Francophonie was created in 1970. Its mission is to embody the
active solidarity between its 77 member states and governments (57 members and 20 observers), which together represent over one-third of the United Nations’ member states and account for a population of over 890 million people, including 220 million French speakers.” Taken from: http://www.francophonie.org/Welcome-to-the-International.html.
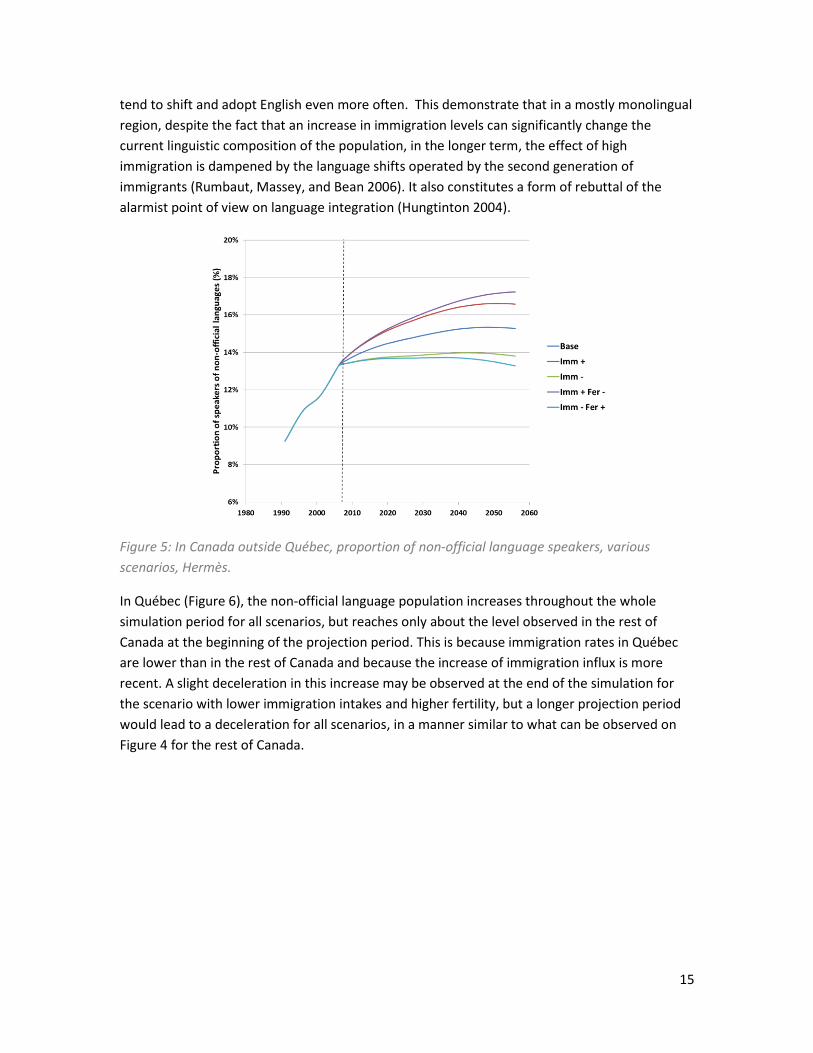
French minority is more important can benefit from it. Further analysis might shed light on this
important issue.
In Québec, most scenarios show a decline in French relative to English as well as in absolute
terms. The population is also getting more and more bilingual, as knowledge of English increases
fast, especially in regions outside of Montréal. The English minority sees its proportion of the
population increase, regardless of the language variable used to define them. Their right for
services in their language doesn’t appear to be in jeopardy in Québec, even outside of Montréal
where they are less concentrated.
Projection results for a derived variable, the “official language proficiency”, shows that the
proportion of individuals relatively less favoured economically – in part because of increased
difficulties to fully integrate the labor market due to lower language skills – will be growing in
the next decades, although important nuances need to be made regarding these findings. First,
the weight of the least favored groups, speakers of a non-official language having a non-official
mother tongue, is stabilized in the projection period and doesn’t increase much overall (a little
more in Québec than in the rest of Canada). Second, the proportion of bilingual speakers, which
tend to have higher incomes, is increasing fast in Québec and a little bit in the rest of Canada. In
any case, this increase in the proportion of people having a non-official mother tongue calls for
increasing investment in language training in order to maximize their contribution to the
country’s future prosperity.
The model has been thoroughly tested but still needs some fine-tuning: small discrepancies with
respect to recent trends need to be investigated. The proportion of bilingual individuals in
Canada outside Québec is increasing slowly in the model, but the 2011 census data showed an
actual decline in bilingualism. This may be due to an overoptimistic hypothesis as to the rate of
French learning by native non-French speakers. It is also possible that the data from the 2006
and 2011 censuses are not comparable, as questionnaires and sample sizes were different
(Corbeil and Houle 2013)9. The model also shows a decline in the proportion of individuals
unable to sustain a conversation in French or English. Although this might appear like good
news, it seems unlikely that this will hold true in a high-immigration regime.
More scenarios must be run in order to produce projections comparable to the Demosim
results. Annual immigration in Hermès is fixed to a certain number whereas it is a proportion of
the population in Demosim.
Additional scenarios could also modify rates of language learning and language shifts (current
scenarios only affect language choice parameters). It might be possible that the increasing
concentration of non-official language speakers decreases the rate of language shifts, as
individuals could remain relatively functional without having to speak an official language.
9 Three questions related to language were transferred from the long-form questionnaire to the short-
form questionnaire, after the long-form census was abolished in 2010.
20
REFERENCES Ali, J. S., S. McDermott, and R. G. Gravel. 2004. “Recent research on immigrant health from
statistics Canada’s population surveys.” Canadian journal of public health. Revue canadienne de santé publique 95 (3).
Auger, N., S. Harper, A. D. Barry, N. Trempe, and M. Daniel. 2012. “Life expectancy gap between the Francophone majority and Anglophone minority of a Canadian population.” European journal of epidemiology 27: 27–38.
Bélanger, A., R. Lachapelle, and P. Sabourin. 2011. Persistance et orientation linguistiques de divers groupes d’allophones. Office québécois de la langue française.
Bonikowska, A., W. Craig Riddell, and D. A. Green. 2008. “Literacy and the labour market: Cognitive skills and immigrant earnings.” Statistics Canada.
Caron Malenfant, É., A. Lebel, and L. Martel. 2010. “Projection de la diversité de la population canadienne, 2006 à 2031.” Statistique Canada.
Chiswick, B. R., and P. W. Miller. 1999. “Language skills and earnings among legalized aliens.” Journal of Population Economics 12 (1): 63–89.
———. 2002. “Immigrant earnings: Language skills, linguistic concentrations and the business cycle.” Journal of Population Economics 15 (1): 31–57.
Cho, L. -J., R. D. Retherford, and M. K. Choe. 1986. The own-children method of fertility estimation. Population Institute.
Corbeil, J. -P., and R. Houle. 2013. “Methodology Document on the 2011 Census Language Data.” Statistics Canada.
Crystal, D. 2000. Language Death. Cambridge University Press.
Desplanques, G. 1993. “Mesurer les disparités de fécondité à l’aide du seul recensement.” Population (French Edition): 2011–2024.
Deutscher, G. 2010. Through the Language Glass: Why the World Looks Different in Other Languages. Metropolitan Books.
Ferrer, Ana, David A Green, and W Craig Riddell. 2006. “The effect of literacy on immigrant earnings.” Journal of Human Resources 41 (2): 380–410.
Green, David A, and W Craig Riddell. 2003. “Literacy and earnings: an investigation of the interaction of cognitive and unobserved skills in earnings generation.” Labour Economics 10 (2): 165–184.
21
Hungtinton, Samuel P. 2004. Who are we? The challenges to America’s national identity. Simon & Schuster.
Lepage, J. F. 2011. “L’oubli de la langue maternelle: les données du recensement sous-estiment-elles les transferts linguistiques?” Cahiers québécois de démographie 40 (1).
Rumbaut, R. G., D. S. Massey, and F. D. Bean. 2006. “Linguistic life expectancies: Immigrant language retention in Southern California.” Population and Development Review 32 (3): 447–460.
Sabourin, P., and A. Bélanger. 2011. “Microsimulation of language use at home in a multilingual region with high immigration.” 3rd General Conference of the International Microsimulation Association.
Termote, M., and N. Thibault. 2008. Nouvelles perspectives démolinguistiques du Québec et de la région de Montréal (2001-2051). Office québécois de la langue française.
Termote, M., N. Thibault, and F. Payeur. 2011. Perspectives démolinguistiques du Québec et de la région de Montréal (2006-2056). Office québécois de la langue française.
Wald, Steven, and Tony Fang. 2008. “Overeducated immigrants in the Canadian labour market: Evidence from the workplace and employee survey.” Canadian Public Policy 34 (4): 457–479.