Microsoft ReportBuilder 2014: Advanced reporting tool for iLearnOregon To access ReportBuilder: http://wpdhscls16a.dhs.sdc.pvt/Reports_REPRTI2/Pages/Folder.aspx Browser requirement: Use in Internet Explorer 8/22/2017
Transcript
Microsoft ReportBuilder 2014: Advanced reporting tool for iLearnOregon
Section 1: Getting Started 6 Before You Start ..................................................................................................................................... 7
About Data ............................................................................................................................................ 8
Where is data coming from? ............................................................................................................. 8 Why are the numbers different in ReportBuilder and iLearn? ............................................................ 8
iLearn Built-in Reports vs. ReportBuilder ................................................................................................ 9
iLearn: Fields in Built-in Reports ........................................................................................................... 10
ReportBuilder: Elements in the Four Datasets ...................................................................................... 11
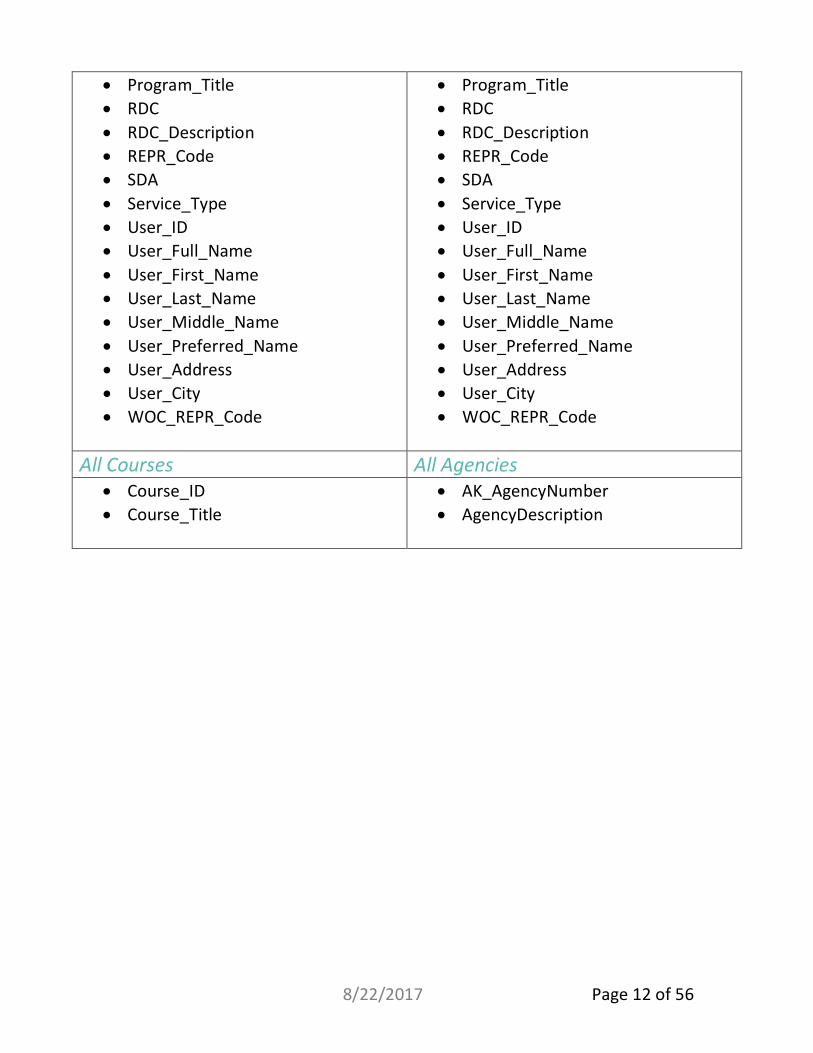
All Progress...................................................................................................................................... 11 Attendance ...................................................................................................................................... 11 All Courses ....................................................................................................................................... 12 All Agencies ..................................................................................................................................... 12
Section 2: Data Dictionary 13 REPR (Report) Codes and Definitions ................................................................................................... 14
Data Elements and Meanings ............................................................................................................... 14
How to create a report for a specific location .................................................................................. 19 How to create a report for an employee classification ..................................................................... 19
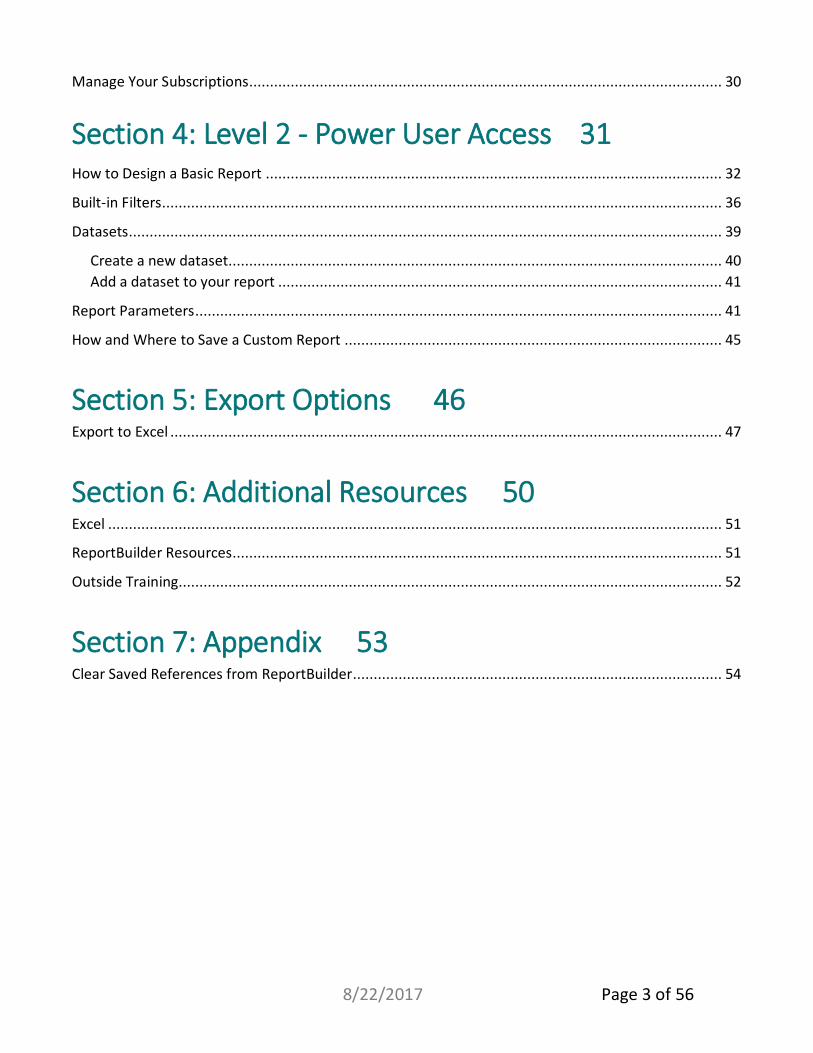
Create a new dataset ....................................................................................................................... 40 Add a dataset to your report ........................................................................................................... 41
How and Where to Save a Custom Report ........................................................................................... 45
Section 5: Export Options 46
Export to Excel ..................................................................................................................................... 47
Clear Saved References from ReportBuilder ......................................................................................... 54
8/22/2017 Page 3 of 56
Introduction
Microsoft ReportBuilder is a web-based application used in Internet Explorer to obtain data from two sources: iLearnOregon and the PPDB (Personnel and Payroll DataBase) from Human Resources.
The ReportBuilder database is refreshed every 24 hours. When you’re pulling reports, the data is from the prior day.
ReportBuilder is similar to other reporting tools that you may be familiar with, such as BusinessObjects or Crystal Reports. You can pull as much or as little data as you need and filter it accordingly. You can export data into a variety of formats; usually it’s exported to Excel, where it can be further manipulated with filtering and pivot tables. ReportBuilder also allows you to schedule a report via email to yourself and others. This is a convenient feature for data you frequently need.
NOTE: iLearnOregon has several built-in reports that may fit your needs. See the sections iLearn Built-in Reports vs. ReportBuilder and iLearn: Fields in Built-in Reports. For information on how to use iLearn’s built-in reports, see the iLearn Course Administrator’s Manual.
8/22/2017 Page 4 of 56
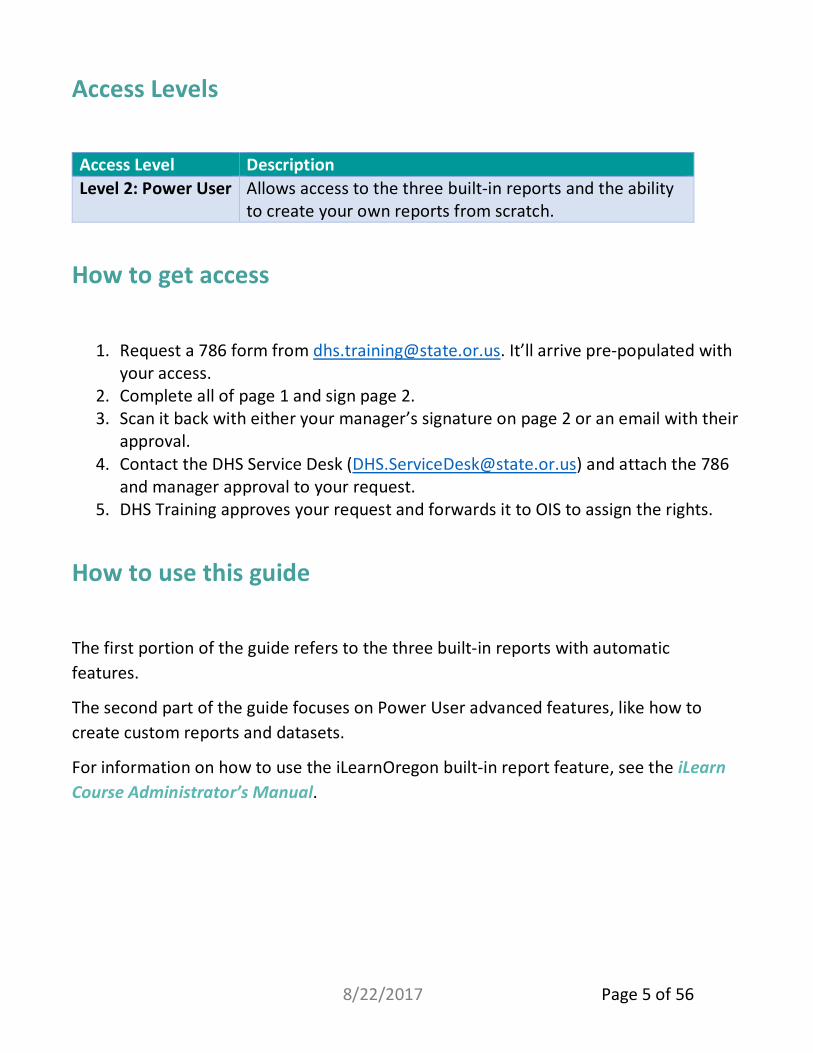
Access Levels
Access Level Description Level 2: Power User Allows access to the three built-in reports and the ability
to create your own reports from scratch.
How to get access
1. Request a 786 form from [email protected]. It’ll arrive pre-populated with your access.
2. Complete all of page 1 and sign page 2. 3. Scan it back with either your manager’s signature on page 2 or an email with their
approval. 4. Contact the DHS Service Desk ([email protected]) and attach the 786
and manager approval to your request. 5. DHS Training approves your request and forwards it to OIS to assign the rights.
How to use this guide
The first portion of the guide refers to the three built-in reports with automatic features.
The second part of the guide focuses on Power User advanced features, like how to create custom reports and datasets.
For information on how to use the iLearnOregon built-in report feature, see the iLearn Course Administrator’s Manual.
o Why are the numbers different in ReportBuilder and
iLearn?
• iLearn Built-in Reports vs. ReportBuilder
• iLearn: Fields in Built-in Reports
• ReportBuilder: Elements in the Four Datasets
This Section includes
Before You Start
• You need to be on the DHS|OHA network (or via Citrix) and using Internet Explorer.
• Access is only available to DHS and OHA employees.
Course IDs
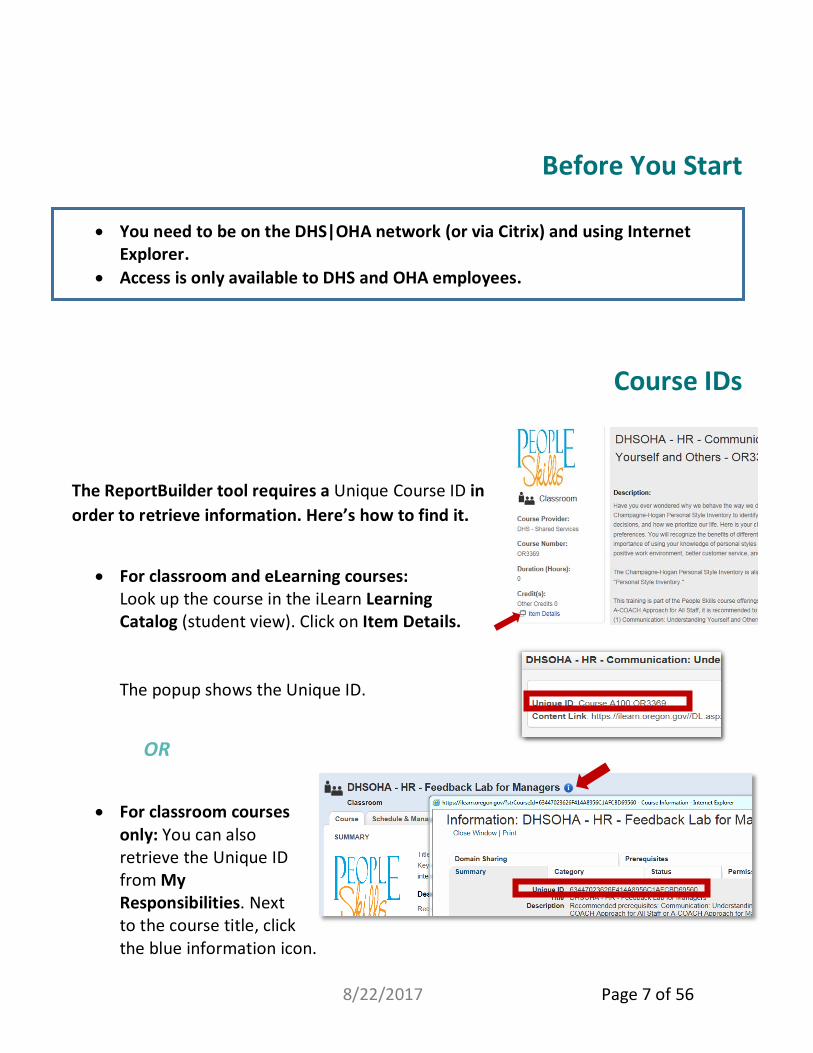
The ReportBuilder tool requires a Unique Course ID in order to retrieve information. Here’s how to find it.
• For classroom and eLearning courses: Look up the course in the iLearn Learning Catalog (student view). Click on Item Details. The popup shows the Unique ID.
OR
• For classroom courses only: You can also retrieve the Unique ID from My Responsibilities. Next to the course title, click the blue information icon.
8/22/2017 Page 7 of 56
Note: Courses created in iLearnOregon have a long ID consisting of letters and numbers, as shown.
In contrast, courses created in the Learning Center have a shorter Unique ID that ends with the original Learning Center course number.
About Data Where is data coming from? Some of the data comes from the iLearn database. Other information, such as managers and email addresses, comes from HR’s PPDB (Personnel and Payroll Database). See the Section in the Data Dictionary to learn more about specific data.
Why are the numbers different in ReportBuilder and iLearn? ReportBuilder and iLearn get data from different sources, so the reported numbers of students will be different.
iLearn ReportBuilder Data can be pulled from all 80+ iLearn domains including Other Non State Employees
Includes data from DHS and OHA domains and their partner sub-domains only. Does not include Other Non State Employees
Completion Status is accurate up until the moment the report is pulled. The data is live.
Completion Status is accurate as of 2:00 a.m. that day.
PPDB is copied to iLearn the previous evening.
PPDB data is copied the night prior. Data is accurate as of 2:00 a.m. that day.
Outlook addressbook is copied to iLearn the previous evening.
Email address fields are not currently available in ReportBuilder.
8/22/2017 Page 8 of 56
iLearn Built-in Reports vs. ReportBuilder
NOTE: See the above section, About Data.
Data Fields:
iLearn Reports have limited fields to report on. Each built-in report has its own unique data. ReportBuilder has a long list of data fields that can be customized for each report.
Exporting Options:
Both iLearn and ReportBuilder allow you to export to Excel or PDF. ReportBuilder lets you export to a wider variety of formats.
Filtering:
iLearn has some basic filtering tools built-in. However, each time you make a change the entire report needs to refresh which can be time consuming. We recommend adding the fields you need and exporting it to Excel to filter instead. It’ll save you time.
Auto-emailing/ scheduling reports:
[TO BE ADDED LATER]
8/22/2017 Page 9 of 56
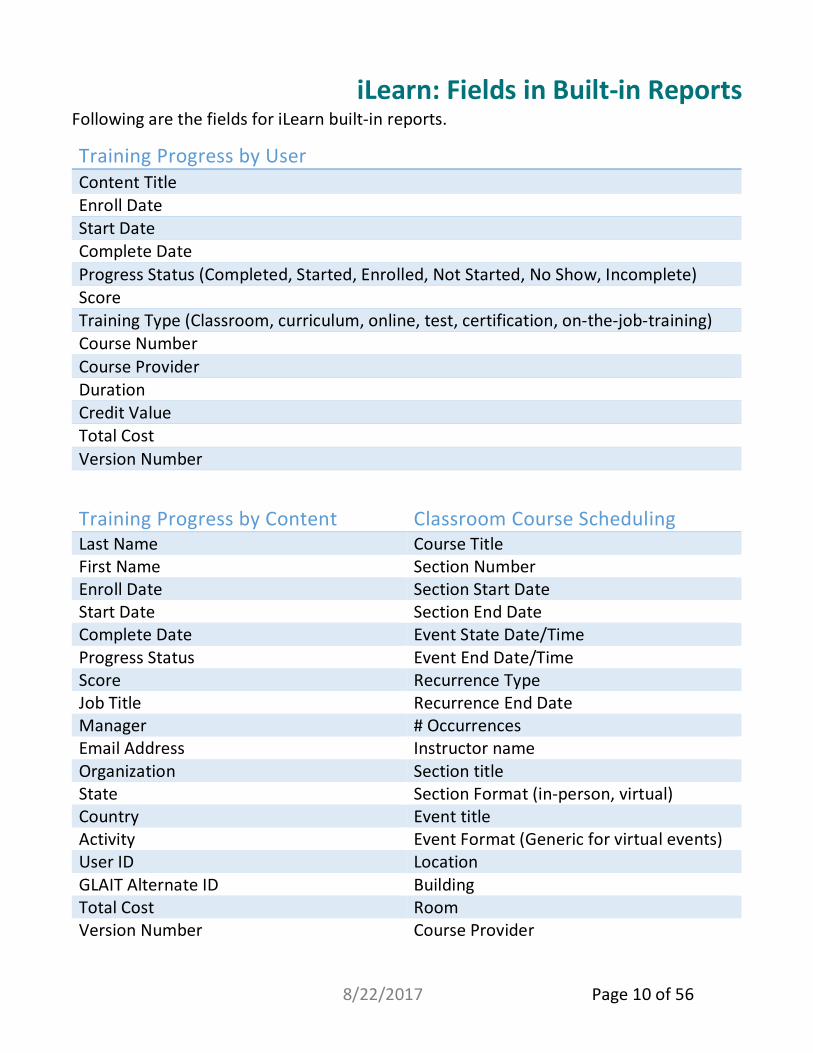
iLearn: Fields in Built-in Reports Following are the fields for iLearn built-in reports.
Training Progress by User Content Title Enroll Date Start Date Complete Date Progress Status (Completed, Started, Enrolled, Not Started, No Show, Incomplete) Score Training Type (Classroom, curriculum, online, test, certification, on-the-job-training) Course Number Course Provider Duration Credit Value Total Cost Version Number
Training Progress by Content Classroom Course Scheduling Last Name Course Title First Name Section Number Enroll Date Section Start Date Start Date Section End Date Complete Date Event State Date/Time Progress Status Event End Date/Time Score Recurrence Type Job Title Recurrence End Date Manager # Occurrences Email Address Instructor name Organization Section title State Section Format (in-person, virtual) Country Event title Activity Event Format (Generic for virtual events) User ID Location GLAIT Alternate ID Building Total Cost Room Version Number Course Provider
Why are the Hire Date, Agency Date and Appointment Date different?
TENURED EMPLOYEE EXAMPLE Hire Date: Sue was hired by the State of Oregon at the Dept of Education in August 2009.
Agency Date: Then Sue transferred agencies to DHS in April 2014 as a TD1.
Appointment Date: Sue promoted to a TD2 in April 2015.
Each of three dates are different because of actions taken.
8/22/2017 Page 14 of 56
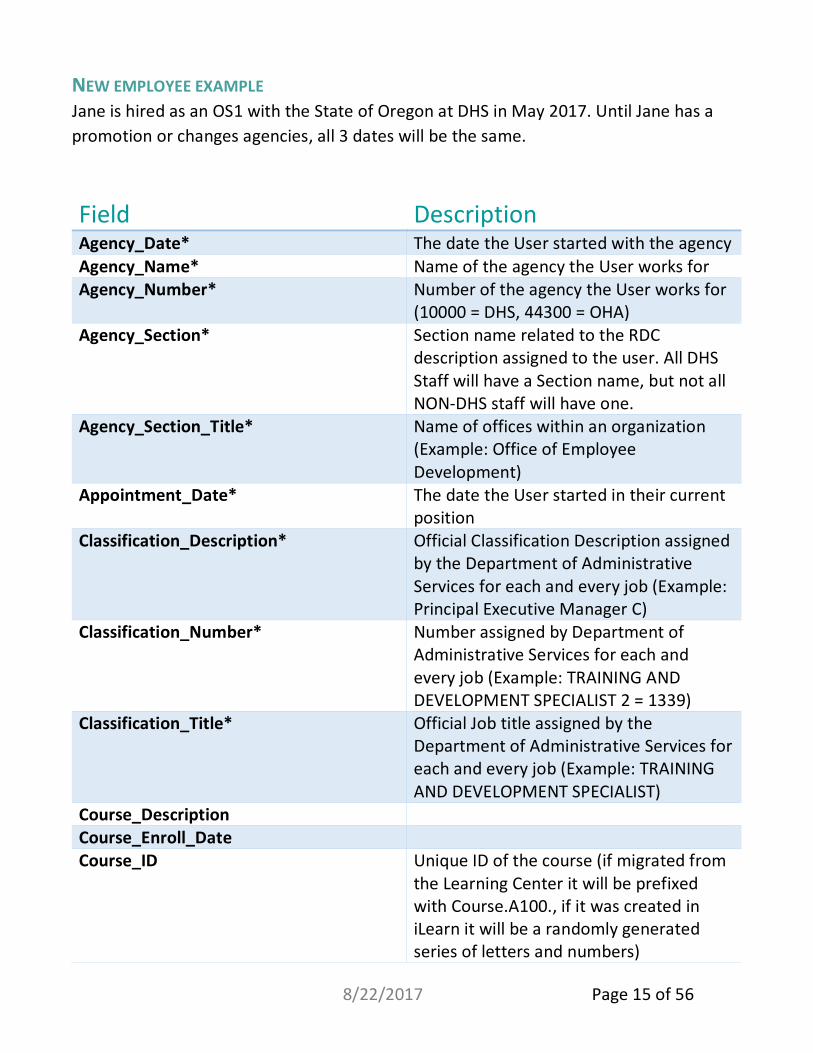
NEW EMPLOYEE EXAMPLE Jane is hired as an OS1 with the State of Oregon at DHS in May 2017. Until Jane has a promotion or changes agencies, all 3 dates will be the same.
Field Description Agency_Date* The date the User started with the agency Agency_Name* Name of the agency the User works for Agency_Number* Number of the agency the User works for
(10000 = DHS, 44300 = OHA) Agency_Section* Section name related to the RDC
description assigned to the user. All DHS Staff will have a Section name, but not all NON-DHS staff will have one.
Agency_Section_Title* Name of offices within an organization (Example: Office of Employee Development)
Appointment_Date* The date the User started in their current position
Classification_Description* Official Classification Description assigned by the Department of Administrative Services for each and every job (Example: Principal Executive Manager C)
Classification_Number* Number assigned by Department of Administrative Services for each and every job (Example: TRAINING AND DEVELOPMENT SPECIALIST 2 = 1339)
Classification_Title* Official Job title assigned by the Department of Administrative Services for each and every job (Example: TRAINING AND DEVELOPMENT SPECIALIST)
Course_Description Course_Enroll_Date Course_ID Unique ID of the course (if migrated from
the Learning Center it will be prefixed with Course.A100., if it was created in iLearn it will be a randomly generated series of letters and numbers)
8/22/2017 Page 15 of 56
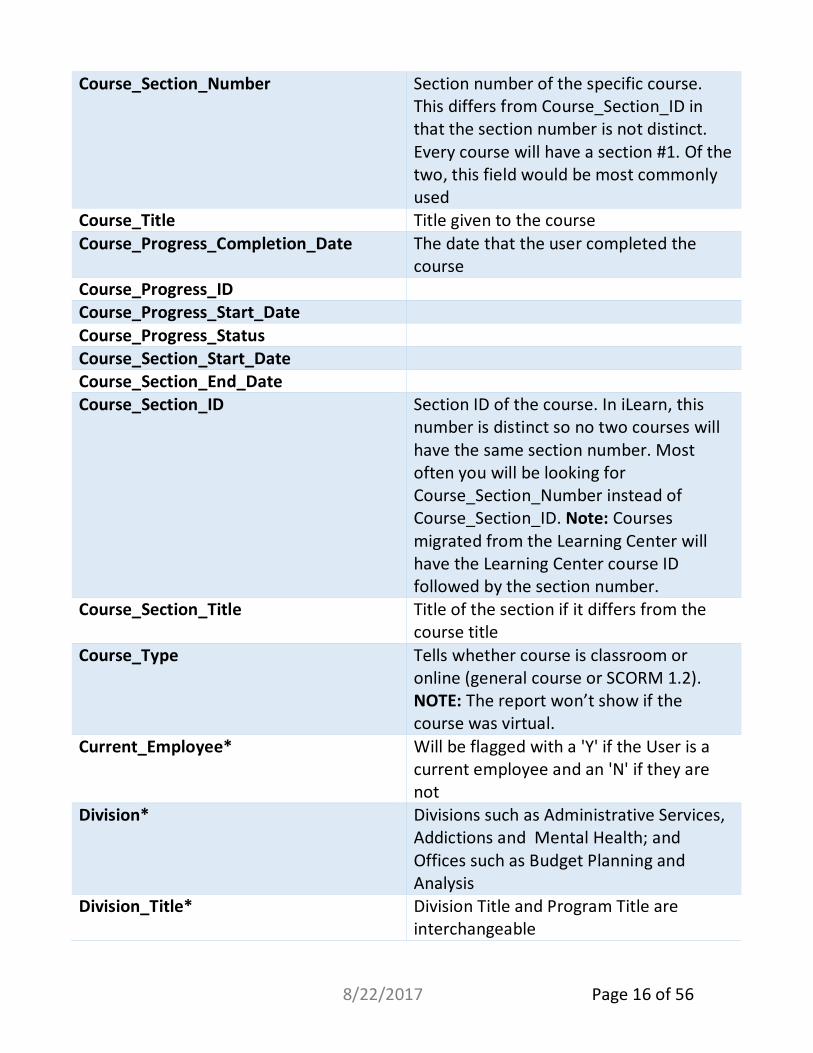
Course_Section_Number Section number of the specific course. This differs from Course_Section_ID in that the section number is not distinct. Every course will have a section #1. Of the two, this field would be most commonly used
Course_Title Title given to the course Course_Progress_Completion_Date The date that the user completed the
course Course_Progress_ID Course_Progress_Start_Date Course_Progress_Status Course_Section_Start_Date Course_Section_End_Date Course_Section_ID Section ID of the course. In iLearn, this
number is distinct so no two courses will have the same section number. Most often you will be looking for Course_Section_Number instead of Course_Section_ID. Note: Courses migrated from the Learning Center will have the Learning Center course ID followed by the section number.
Course_Section_Title Title of the section if it differs from the course title
Course_Type Tells whether course is classroom or online (general course or SCORM 1.2). NOTE: The report won’t show if the course was virtual.
Current_Employee* Will be flagged with a 'Y' if the User is a current employee and an 'N' if they are not
Division* Divisions such as Administrative Services, Addictions and Mental Health; and Offices such as Budget Planning and Analysis
Division_Title* Division Title and Program Title are interchangeable
8/22/2017 Page 16 of 56
Hire_Date* The date the User was hired on with the state. This will be different than Agency_Date if the User worked for a different agency prior to working for DHS|OHA
Online_Course Will be flagged with a 'Y' if the course is online and an 'N' if it is not
Partner_Org Partner organizations are different than the staff organizations. You will get the name of the partner organization as it appears in iLearn in the Partner_Org field if the User is a partner and not a staff member
Partner_Org_Description Partner organizations are different than the staff organizations. You will get the description of the partner organization as it appears in iLearn in the Partner_Org field if the User is a partner and not a staff member
Partner_Org_ID Partner organizations are different than the staff organizations. You will get the ID of the partner organization as it appears in iLearn in the Partner_Org field if the User is a partner and not a staff member (not useful to the average person, will look something like ORG-10000.XXX.XXX)
PDC* Payroll Distribution Code. Position_ID* Number assigned by HR for each and
every postion in an organization Program* Specific Program within an organization
(Example: PHD is a title within OHA) Program_Title* Program Title within an Organization
(Example: Public Health Division is a Program Title within OHA)
RDC* Report Distribution Code - A three digit code that signifies where individual works in the organization. Example: "HR DHS Training & Development = 056"
8/22/2017 Page 17 of 56
RDC_Description* Name of office correlating to RDC Number. Example "056 = HR DHS Training & Development"
REPR_Code* Report Distribution Code, assigned by HR. This code shows employee representation (union or management service). See the section REPR Codes and Definitions.
SDA* Service district area: District Number. Within DHS, there are 16 districts that are assigned based on geography.
Service_Type* DAS describes the various service codes as follows. REPRESENTABLE:
C= CLASSIFIED E= EXEMPT U= UNCLASSIFIED
EXCLUDABLE: X= MANAGEMENT SERVICE
Y= EXEMPT (Usually Board or Commission member)
Z= UNCLASSIFIED User_ID Unique user ID number (OR# for staff or
CT# for partners). Partners/providers need to create iLearn accounts. Accounts for new staff members are created automatically.
User_Full_Name Users first name, middle name (if available) and last name
User_First_Name First name of user User_Last_Name Last name of user User_Middle_Name Middle name of user User_Preferred_Name User’s preferred name User_Address* Work address for User User_City* Work city for User WOC_REPR_Code*
Work Out of Class REPR code - for Users who are working out of class as a manager
* indicates data is from PPDB
8/22/2017 Page 18 of 56
How to create a report for a specific location Get report information for a specific location in DHS or OHA using the following general hierarchy:
Agency > Division > Section > RDC*
* See above table for information about RDC.
Program and SDA (Service Delivery Area, usually just the district number) are two other fields used by HR that don’t directly fit in the hierarchy above.
EXAMPLES: Here’s an example of dataset field names you’d use to create a report for specific DHS Child Welfare and OHA OSH offices.
Dataset Field Name Example Value for DHS Example Value for OHA Agency Name Department of Human
Services Oregon Health Authority
Agency Number 10000 44300 Division CW OSH Division Title Office of Child Welfare Oregon State Hospital Agency Section D10 OSH Agency Section Title District 10 Oregon State Hospital RDC 453 73B RDC Description Redmond (CW) Nursing - Education Program CW OSH Program Title CHILD WELFARE Oregon State Hospital SDA 10
How to create a report for an employee classification Tip: When looking up an employee classification, it’s easier to search for a Classification_Number than a Classification_Title. The title comes from PPDB and may be in shorthand (for example, PEM instead of Principal Executive Manager).
8/22/2017 Page 19 of 56
Explanation: 1/1/1900 date. In the LC instructors used to manually mark courses complete but didn’t add the completion date. So it may show 1/1/1900 here.
Online courses don’t have course sections- so the 1/1/1900 date shows up here.
If a student wasn’t enrolled in a Learning Center course, they will show up in the All Progrss Report with the following information.
• Course Progress Status: Not Enrolled • Course Section Number: No Section • Course Section Start Date: 1/1/1900 12:00:00 AM
8/22/2017 Page 20 of 56
8/22/2017 Page 21 of 56
Section 3:
Built-in Reports
• Access ReportBuilder
• Navigation Orientation
• ReportBuilder built-in reports
o All Attendance Report o All Progress Report o Upcoming Sections Report
• Export to Excel
• Create a subscription (email the report automatically)
This Section includes
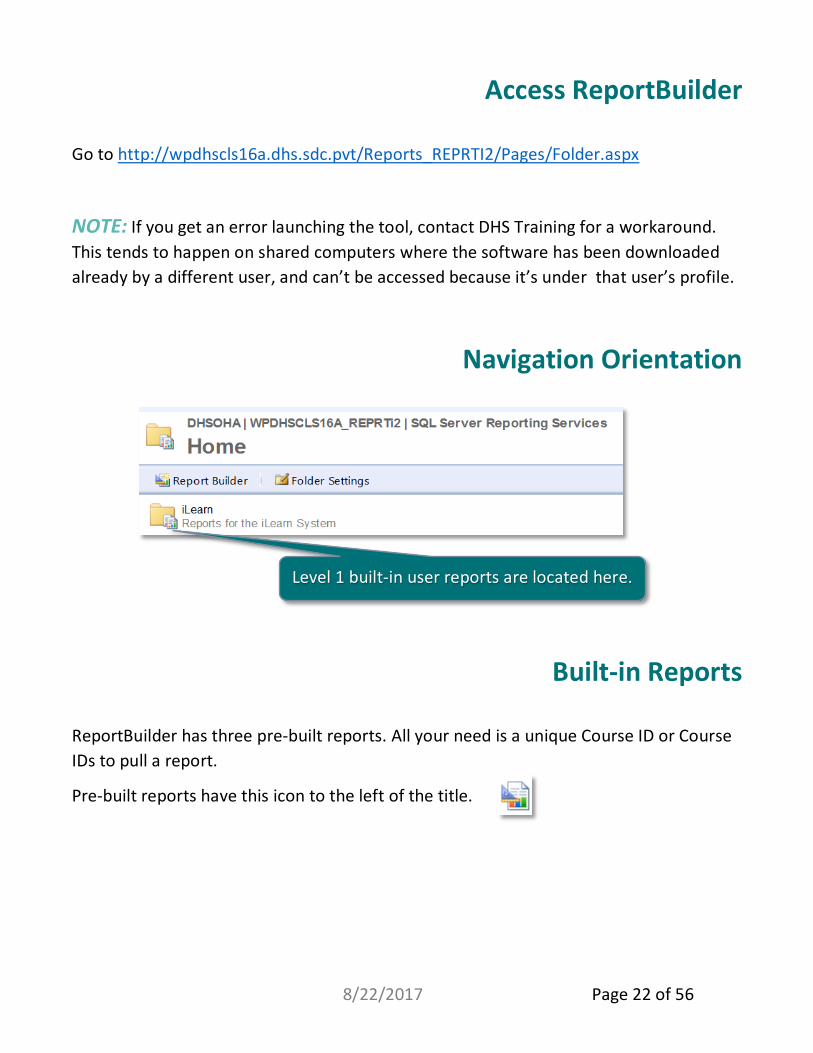
Access ReportBuilder
Go to http://wpdhscls16a.dhs.sdc.pvt/Reports_REPRTI2/Pages/Folder.aspx
NOTE: If you get an error launching the tool, contact DHS Training for a workaround. This tends to happen on shared computers where the software has been downloaded already by a different user, and can’t be accessed because it’s under that user’s profile.
Navigation Orientation
Built-in Reports
ReportBuilder has three pre-built reports. All your need is a unique Course ID or Course IDs to pull a report.
Pre-built reports have this icon to the left of the title.
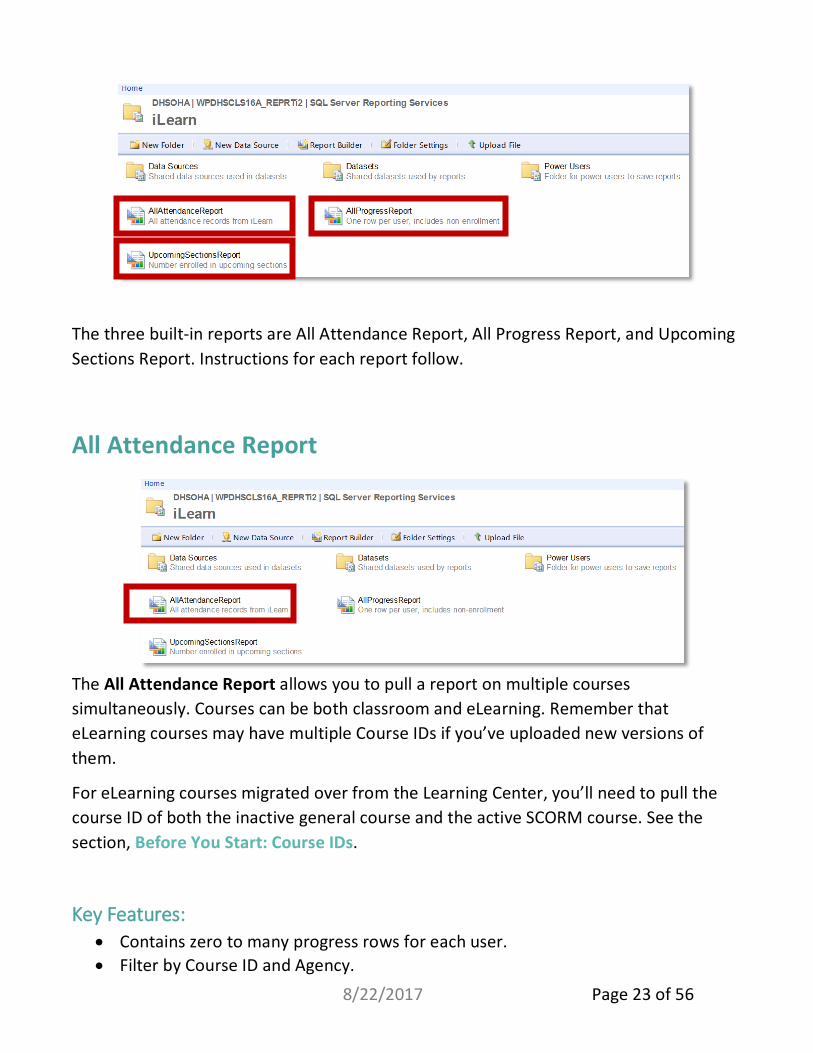
The three built-in reports are All Attendance Report, All Progress Report, and Upcoming Sections Report. Instructions for each report follow.
All Attendance Report
The All Attendance Report allows you to pull a report on multiple courses simultaneously. Courses can be both classroom and eLearning. Remember that eLearning courses may have multiple Course IDs if you’ve uploaded new versions of them.
For eLearning courses migrated over from the Learning Center, you’ll need to pull the course ID of both the inactive general course and the active SCORM course. See the section, Before You Start: Course IDs.
Key Features: • Contains zero to many progress rows for each user. • Filter by Course ID and Agency.
8/22/2017 Page 23 of 56
• Can report multiple courses at a time (enter one course ID per row in the dropdown).
• Can report multiple agencies at a time (use dropdown). • Shared Datasets: AllAgencies and Attendance.
1. Click on AllAttendanceReport.
2. The following screen appears.
3. Go to the dropdown menu next to Course IDs. Click the down arrow to the right of the box. This will open an empty dropdown menu box.
4. Click in the box and enter the whole unique Course ID. TIP: Notice where the typing is located. You must enter the unique ID in the dropdown box or you’ll receive an error message.
NOTE: You can enter multiple course IDs in this box if you want to pull the report based on more than one course. Press the Enter key on your keyboard in between each course number.
5. Select the agency or agencies using the Agency menu.
8/22/2017 Page 24 of 56
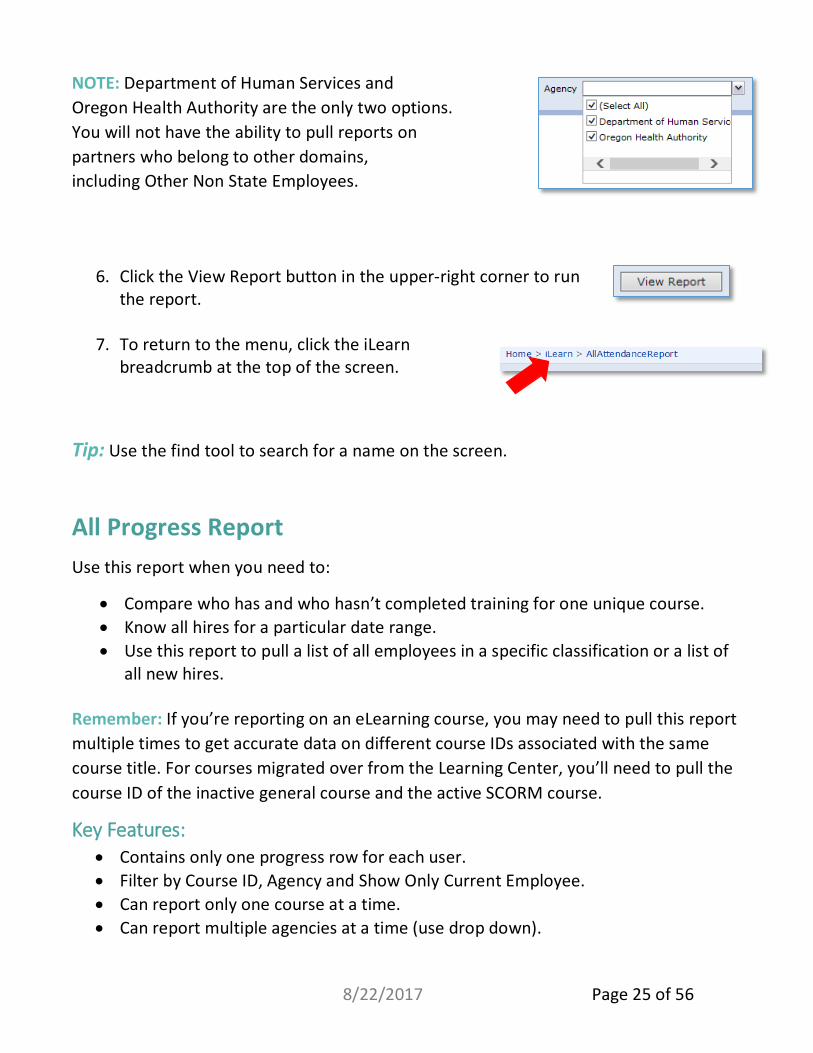
NOTE: Department of Human Services and Oregon Health Authority are the only two options. You will not have the ability to pull reports on partners who belong to other domains, including Other Non State Employees.
6. Click the View Report button in the upper-right corner to run the report.
7. To return to the menu, click the iLearn breadcrumb at the top of the screen.
Tip: Use the find tool to search for a name on the screen.
All Progress Report Use this report when you need to:
• Compare who has and who hasn’t completed training for one unique course. • Know all hires for a particular date range. • Use this report to pull a list of all employees in a specific classification or a list of
all new hires.
Remember: If you’re reporting on an eLearning course, you may need to pull this report multiple times to get accurate data on different course IDs associated with the same course title. For courses migrated over from the Learning Center, you’ll need to pull the course ID of the inactive general course and the active SCORM course.
Key Features: • Contains only one progress row for each user. • Filter by Course ID, Agency and Show Only Current Employee. • Can report only one course at a time. • Can report multiple agencies at a time (use drop down).
8/22/2017 Page 25 of 56
• Can report just current employees, or all iLearn users for our agencies (use drop down).
• Reports on highest progress (most recent, if there is a tie for highest). • Reports progress as “Not Enrolled” for those users who don’t have any attempts.
NOTE: Students who are “Not Enrolled” appear first in the report. • Shared Datasets: AllAgencies and Attendance.
1. Click on AllProgressReport.
2. Add the Course ID. For instructions on how to find it, see the section, Before You Start: Course IDs.
3. Select the Agency from the dropdown menu.
4. Select Show Only Current Employees from the dropdown menu. NOTE: The
dropdown only includes people with OR numbers who are in PPDB as employees.
5. Click the View Report button.
FAQ: What’s the difference between Not Enrolled and Not Started in the Course Progress Status field?
• Not Enrolled means they’ve never enrolled in the class. • Not Started means the person was enrolled in the course in the Learning Center.
However, the instructor never marked attendance or closed out the roster. When these courses were migrated, the students enrolled in them were assigned the “Not Started” status as a default.
*Not Started is an available progress status in iLearn; however it’s rarely used in iLearn.
8/22/2017 Page 26 of 56
FAQ: Why are all these people who don’t work for my agency showing up on the report?
The All Progress Report includes two types of users:
1. Users in the 43000 (OHA) or 10000 (DHS) iLearn domains, including partners or people who put their account in the wrong domain; and
2. New employees in PPDB whose iLearn account haven’t been created yet.
Since iLearn and PPDB are integrated, employees who leave state service are automatically moved to the Other, Non State Employee domain. If they left state service between 2008-2011, they will remain in the 43000 or 10000 domain until they’re moved manually. Until they’re moved, former employees still in the domain may appear on your report.
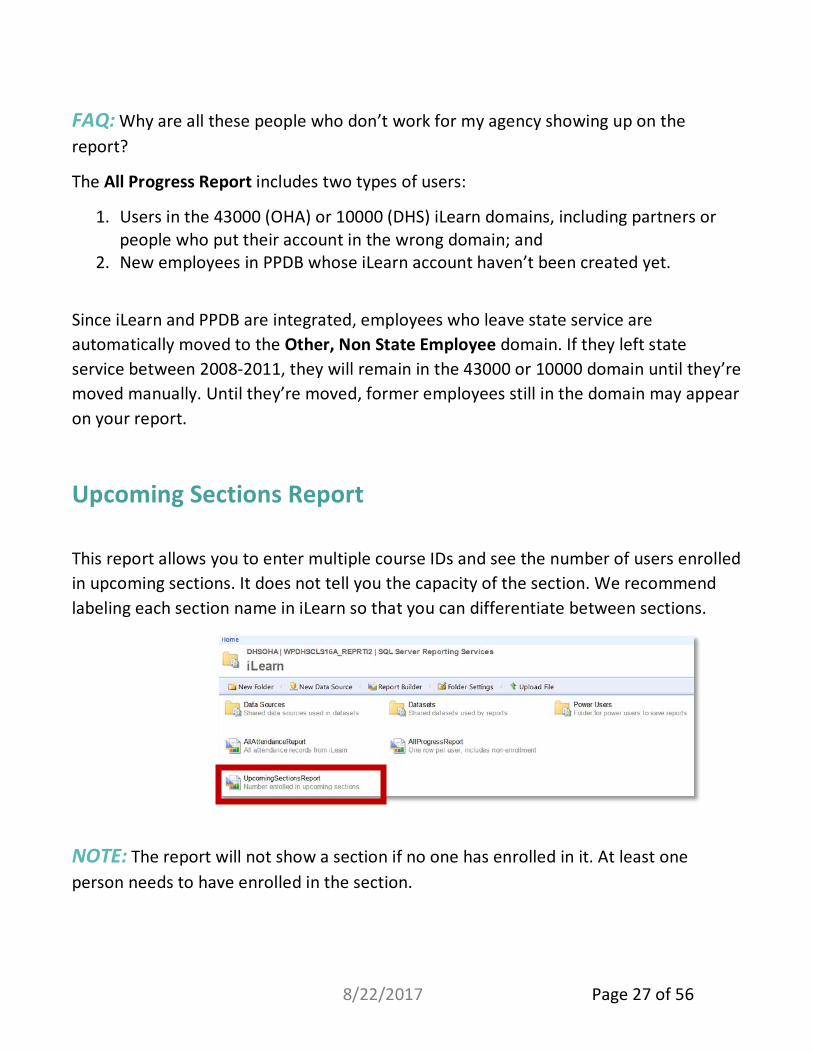
Upcoming Sections Report This report allows you to enter multiple course IDs and see the number of users enrolled in upcoming sections. It does not tell you the capacity of the section. We recommend labeling each section name in iLearn so that you can differentiate between sections.
NOTE: The report will not show a section if no one has enrolled in it. At least one person needs to have enrolled in the section.
8/22/2017 Page 27 of 56
1. Click on UpcomingSectionsReport.
2. Click in the box and enter the whole Unique Course ID into the dropdown menu.
TIP: Notice where the typing is located.
NOTE: You can enter multiple course IDs in this box if you want to pull the report based on more than one course. Press the Enter key on your keyboard in between each course number.
3. Click the View Report button in the upper-right corner to run the report.
4. The report is sorted by the Section Number column. Sections are listed by the order in which they were created, not by the date.
5. The Count of Users column is sorted by anyone enrolled without a completion
status (Not Started).
8/22/2017 Page 28 of 56
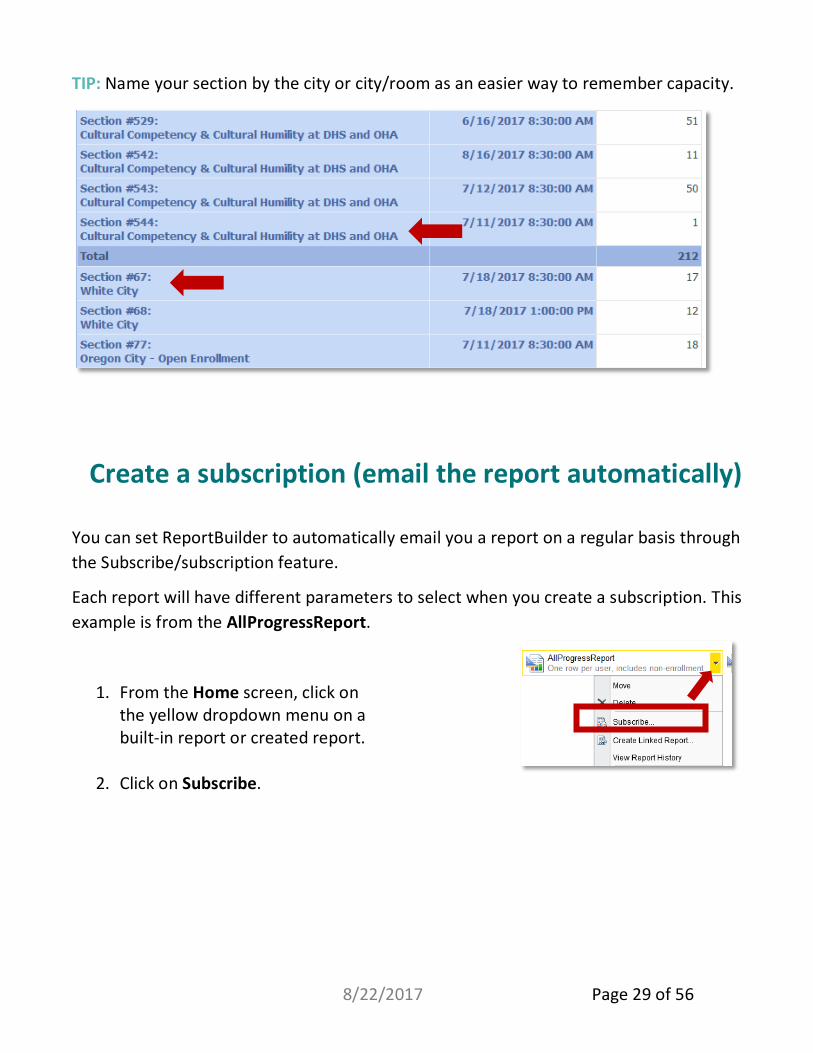
TIP: Name your section by the city or city/room as an easier way to remember capacity.
Create a subscription (email the report automatically)
You can set ReportBuilder to automatically email you a report on a regular basis through the Subscribe/subscription feature.
Each report will have different parameters to select when you create a subscription. This example is from the AllProgressReport.
1. From the Home screen, click on the yellow dropdown menu on a built-in report or created report.
2. Click on Subscribe.
8/22/2017 Page 29 of 56
3. Specify options for report delivery:
To: List multiple email addresses here. Separate by semicolon.
Render Format: Options include Excel, PDF, CSV, TIF, Word and XML.
Run the subscription: There are many ways to customize your subscription.
Parameter Values: Different on each report. The most important detail is to include a Course ID.
Manage Your Subscriptions
1. Change subscription information under My Subscriptions.
2. You can edit or delete your subscriptions from this screen. 8/22/2017 Page 30 of 56
8/22/2017 Page 31 of 56
Section 4:
Level 2 - Power User Access
• How to Design a Basic Report
o Create a new report o Built-in filters o Built-in filter operators
• Datasets
o Create a new dataset o Add a dataset to your report o Create a new parameter based on your dataset o Add the parameter to your report dataset
• How and Where to Save a Custom Report
This Section includes
How to Design a Basic Report
To create a new report
1. The first time you click the ReportBuilder link, it will download the ReportBuilder software. You will not need administrative permissions to run the installer; however, if you have issues, contact DHS Training. You will only need to install this software the first time you use the ReportBuilder.
2. Select New Report on the left.
3. Click on Table or Matrix Wizard.
Level 2 Power User tools to create your own custom reports
Consider basing your new report on an existing report. To do this, you must do a “Save As” on the existing report. DO NOT change any existing reports!
8/22/2017 Page 32 of 56
4. Select Choose an existing dataset.
5. Any datasets that you have used in the past will already be
selectable in the box. If the Attendance dataset is not available, click the Browse button at the bottom left.
6. Drill down to the Attendance dataset by double clicking the iLearn folder, then Datasets, then Attendance.
For a list of elements in each of the four datasets, see the Appendix.
7. Click the Next button.
8. Drag Agency_Name, Division_Title and Agency_Section_Title from the list on the left into the Row Groups field.
9. Drag Course_Progress_Status into the Column Groups field.
10. Drag User_ID into the Values field.
8/22/2017 Page 33 of 56
11. Click dropdown arrow next to UserID and select Count Distinct. This will give you one record per user and show the highest score of each attempt. If you want to see every time each user took the course (including No Shows), select Count.
12. Click Next.
13. Leave defaults on Choose the layout.
14. Click Next.
15. Choose a Style (fonts and color schemes).
16. Click Finish.
17. Enlarge the whitespace to the right to allow more room for the columns. To do this, click the right border of the whitespace, hold and drag.
Click this border
Hold & drag right
8/22/2017 Page 34 of 56
18. Then enlarge the table. Select it and drag the border to the right to fill the whitespace. Otherwise, the text will wrap.
19. Click the Run button in the upper-left corner.
20. Enter a unique Course ID number (i.e. Course.A100.C00333) in the Course IDs field.
21. Click the View Report button in the upper-right corner.
22. When you get the results from the report, you can export them in multiple formats. The most common format is Excel, but there are other options, too. Click the Export button for these options. After you select a format, you’ll be prompted to save the report. For information on exporting to Excel, see the section, Export to Excel.
23. If this is a report you want to re-use, you can save it into the Power Users folder.
a. In the upper-left corner, click on the circle icon.
b. Click on Save As.
c. Double click the iLearn folder.
d. Double click the Power Users folder.
e. Give your report a name and click the Save button.
Click table border & drag right
8/22/2017 Page 35 of 56
Built-in Filters
Filters in SQL Server Reporting Services (SSRS) work much the same as they did in Business Objects. For example, you can create a filter to pull only records that
• Fall within a certain date range. • Belong to a specific Program Area.
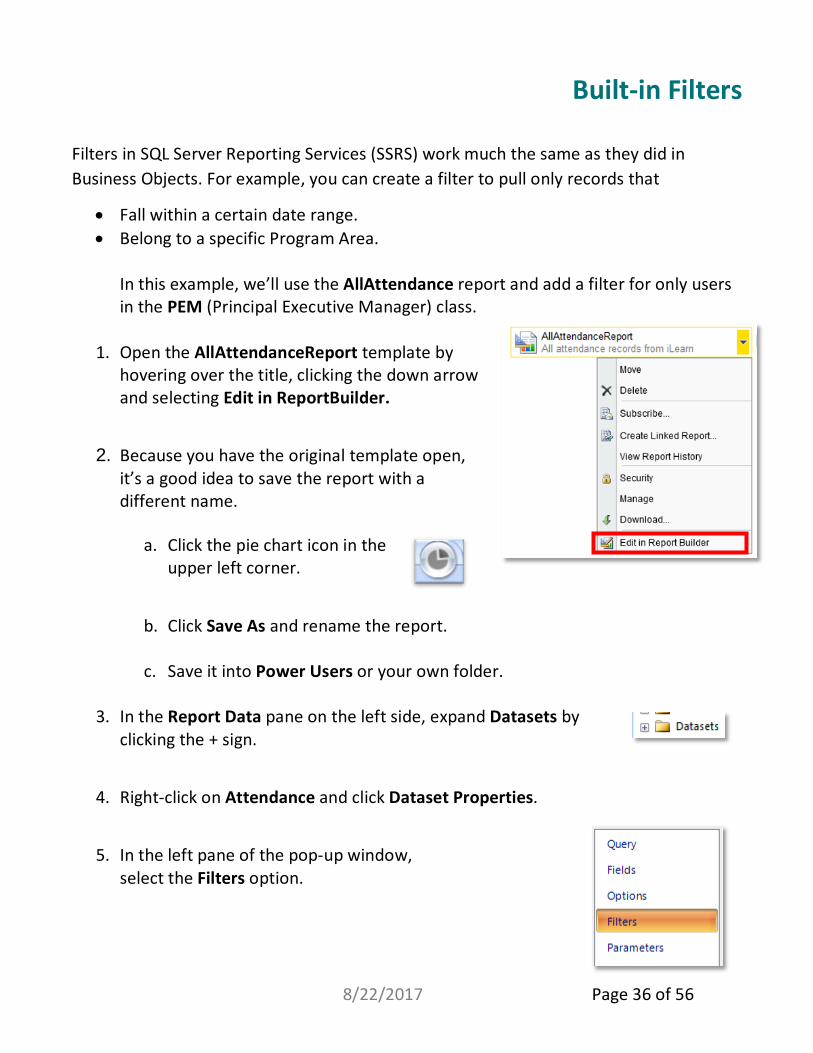
In this example, we’ll use the AllAttendance report and add a filter for only users in the PEM (Principal Executive Manager) class.
1. Open the AllAttendanceReport template by hovering over the title, clicking the down arrow and selecting Edit in ReportBuilder.
2. Because you have the original template open, it’s a good idea to save the report with a different name.
a. Click the pie chart icon in the upper left corner.
b. Click Save As and rename the report.
c. Save it into Power Users or your own folder.
3. In the Report Data pane on the left side, expand Datasets by clicking the + sign.
4. Right-click on Attendance and click Dataset Properties.
5. In the left pane of the pop-up window, select the Filters option.
8/22/2017 Page 36 of 56
6. To add a new filter, click on the Add button towards the top of the pop-up window.
7. This will open a new filter template. a. From the Expression dropdown, select the data field that you want to filter
on. b. In the Operator dropdown, select how you want to filter: =, <> (not equal
to), >, <, etc. See the following section, Built-in filter operators, for a complete list of available operators and what they do.
c. In the Value field, enter the item that you want to filter on. Here is a complete example of a filter:
8. Click the OK button. 9. Run the report and verify that your filter is working correctly.
Built-in filter operators The following is a list of available operators when creating a filter in a SQL Server Reporting Services (SSRS) report.
Filter Filter Description = Use the equal sign when you want to return an exact match to the
value you are filtering on. For instance, if you wanted to return everything that happened on June 15, 2017, you would select the = operator and put 6/15/2017 in the value field
< > This symbol means “does not equal”. You would use this if you wanted to filter out something specific. If you wanted to return everything EXCEPT what happened on June 15, 2017, you would select the < > operator and put 6/15/2017 in the value field
8/22/2017 Page 37 of 56
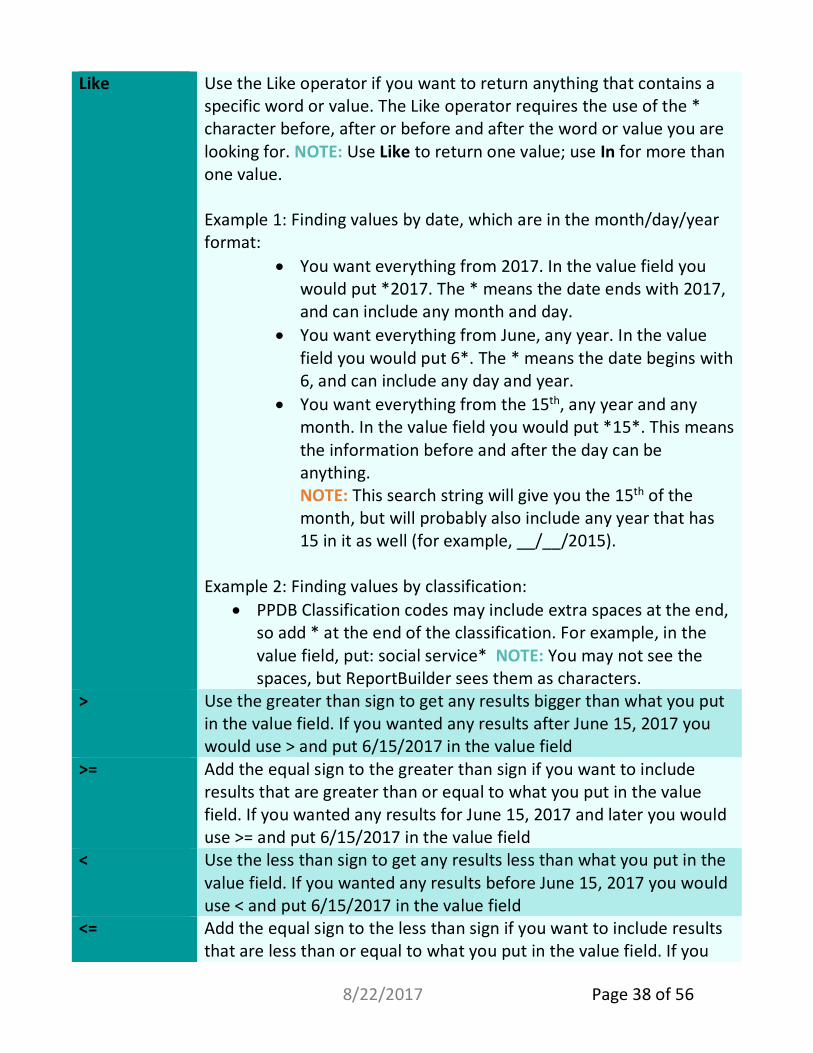
Like Use the Like operator if you want to return anything that contains a specific word or value. The Like operator requires the use of the * character before, after or before and after the word or value you are looking for. NOTE: Use Like to return one value; use In for more than one value. Example 1: Finding values by date, which are in the month/day/year format:
• You want everything from 2017. In the value field you would put *2017. The * means the date ends with 2017, and can include any month and day.
• You want everything from June, any year. In the value field you would put 6*. The * means the date begins with 6, and can include any day and year.
• You want everything from the 15th, any year and any month. In the value field you would put *15*. This means the information before and after the day can be anything. NOTE: This search string will give you the 15th of the month, but will probably also include any year that has 15 in it as well (for example, __/__/2015).
Example 2: Finding values by classification:
• PPDB Classification codes may include extra spaces at the end, so add * at the end of the classification. For example, in the value field, put: social service* NOTE: You may not see the spaces, but ReportBuilder sees them as characters.
> Use the greater than sign to get any results bigger than what you put in the value field. If you wanted any results after June 15, 2017 you would use > and put 6/15/2017 in the value field
>= Add the equal sign to the greater than sign if you want to include results that are greater than or equal to what you put in the value field. If you wanted any results for June 15, 2017 and later you would use >= and put 6/15/2017 in the value field
< Use the less than sign to get any results less than what you put in the value field. If you wanted any results before June 15, 2017 you would use < and put 6/15/2017 in the value field
<= Add the equal sign to the less than sign if you want to include results that are less than or equal to what you put in the value field. If you
8/22/2017 Page 38 of 56
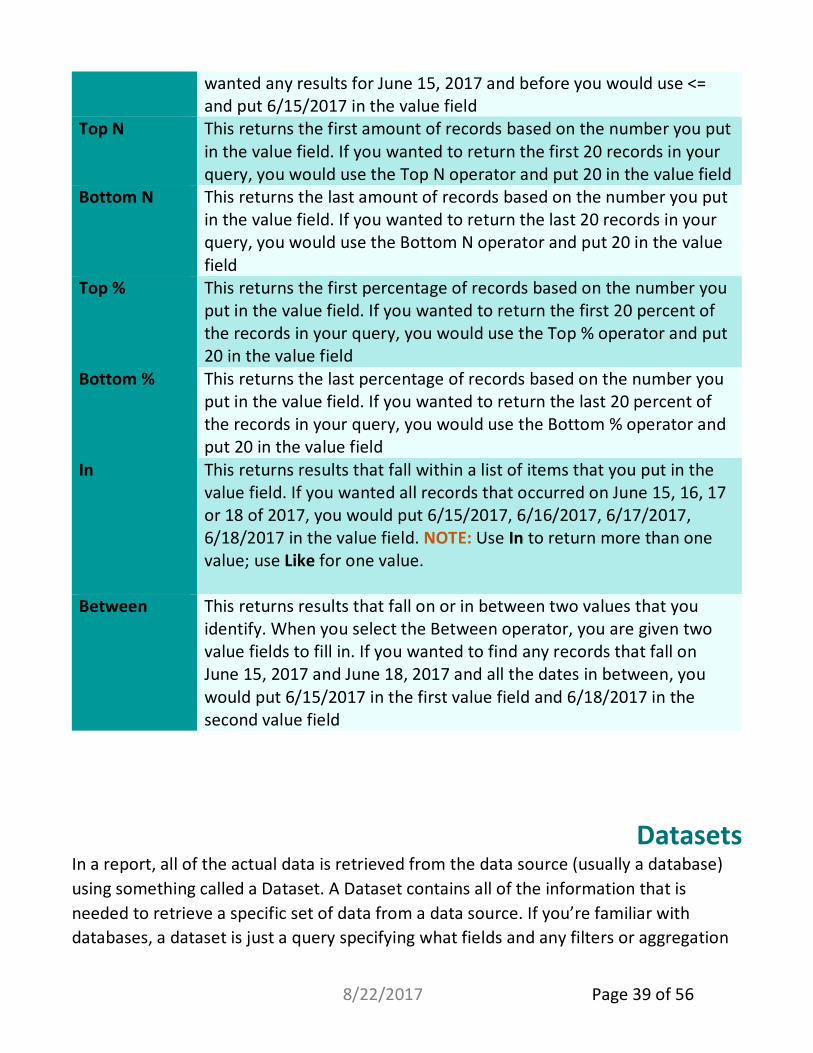
wanted any results for June 15, 2017 and before you would use <= and put 6/15/2017 in the value field
Top N This returns the first amount of records based on the number you put in the value field. If you wanted to return the first 20 records in your query, you would use the Top N operator and put 20 in the value field
Bottom N This returns the last amount of records based on the number you put in the value field. If you wanted to return the last 20 records in your query, you would use the Bottom N operator and put 20 in the value field
Top % This returns the first percentage of records based on the number you put in the value field. If you wanted to return the first 20 percent of the records in your query, you would use the Top % operator and put 20 in the value field
Bottom % This returns the last percentage of records based on the number you put in the value field. If you wanted to return the last 20 percent of the records in your query, you would use the Bottom % operator and put 20 in the value field
In This returns results that fall within a list of items that you put in the value field. If you wanted all records that occurred on June 15, 16, 17 or 18 of 2017, you would put 6/15/2017, 6/16/2017, 6/17/2017, 6/18/2017 in the value field. NOTE: Use In to return more than one value; use Like for one value.
Between This returns results that fall on or in between two values that you identify. When you select the Between operator, you are given two value fields to fill in. If you wanted to find any records that fall on June 15, 2017 and June 18, 2017 and all the dates in between, you would put 6/15/2017 in the first value field and 6/18/2017 in the second value field
Datasets In a report, all of the actual data is retrieved from the data source (usually a database) using something called a Dataset. A Dataset contains all of the information that is needed to retrieve a specific set of data from a data source. If you’re familiar with databases, a dataset is just a query specifying what fields and any filters or aggregation
8/22/2017 Page 39 of 56
to run on the selected data source. In order to show any non-“hardcoded” information in a report, you will need to create or select an existing dataset.
Create a new dataset 1. Open ReportBuilder and click on the pie chart icon in the upper-left
corner.
2. Click New.
3. In the pop-up window, select New Dataset.
4. If there are no data sources listed in the window to the right, click on the Browse other data sources link.
5. Go to iLearn > Data Sources and select LMS DataMart.
6. Click the Create button in the bottom-right corner.
7. When you get the Enter Data Source Credentials pop-up, click on the Use the current Windows user button and click OK.
8. Expand Tables.
9. Expand the table that you want to get field(s) from.
8/22/2017 Page 40 of 56
Add a dataset to your report To create a parameter based on a dataset, you need to first add the dataset to your report.
1. In the Report Data pane on the left side, right click Datasets. 2. Click Add Dataset. 3. The Dataset Properties window will pop up.
a. Give your dataset a name in the Name field. b. With Use a shared dataset selected, click Browse. c. Drill down through iLearn to the location where you saved your dataset (for
example, the Power Users folder). d. In the left pane, click Fields. e. Ensure that the fields you want to bring in are listed. f. Leave Options, Filters, and Parameters as their defaults. g. Click OK.
Report Parameters If you want to create a report that is flexible and able to run on the similar sets of data with different filters (without having to “hardcode” filters and save multiple copies of the same report), you need to use report parameters.
A report parameter allows you to take in values from the user when the report is run, and pass those values on to your Datasets to filter and customize the data returned from the datasource. On a report you can also customize a report parameter to have default values, or only allow selection from a specific list of available values in the form of a dropdown or multiple checkboxes. If you’re familiar with BusinessObjects, report parameters are similar to prompts.
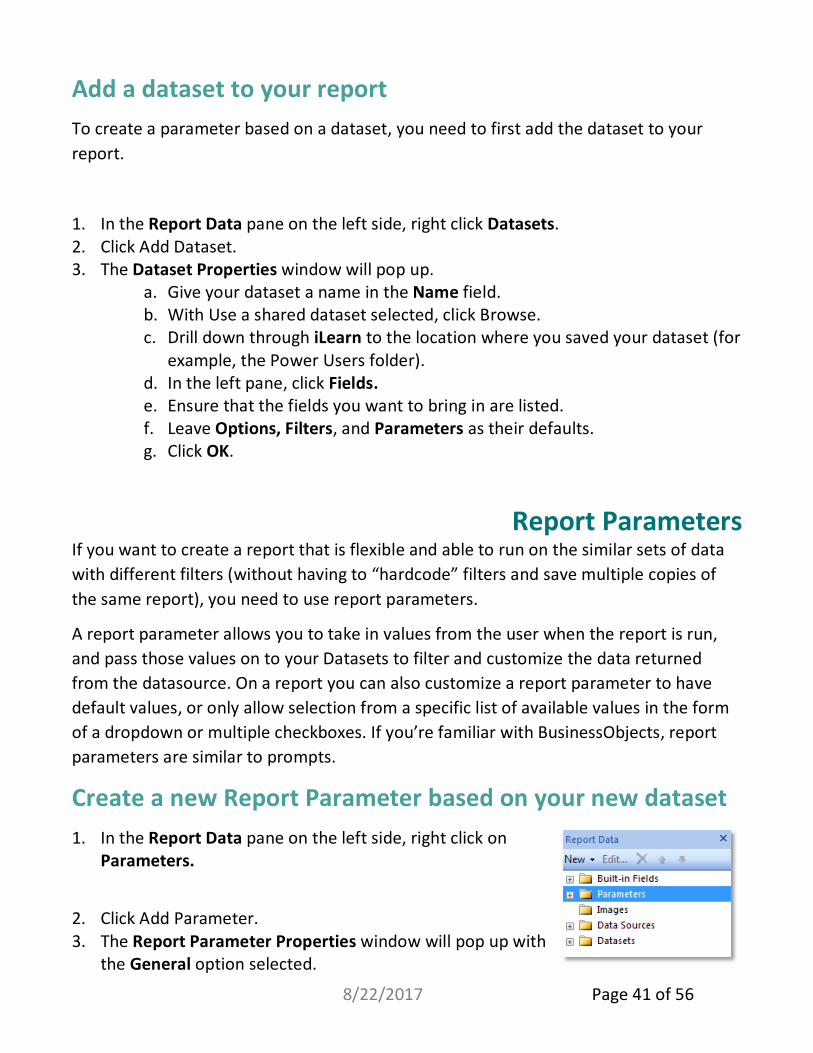
Create a new Report Parameter based on your new dataset 1. In the Report Data pane on the left side, right click on
Parameters.
2. Click Add Parameter. 3. The Report Parameter Properties window will pop up with
the General option selected.
8/22/2017 Page 41 of 56
a. Give your new Parameter a name in the Name field (no spaces allowed). b. Give the Parameter a “friendly” name in the Prompt field. (This is what the
user will see when they launch the report. It can have spaces.) c. Check the Allow blank value box. d. If you want the users to be able to select more than one item from the
dropdown list, check the Allow multiple values box. e. For this example, keep Select parameter visibility set to Visible.
f. On the left side, click Available Values. g. Select Get values from a query. Note: Don’t use All Progress or All
Attendance datasets for this option! It will make your report run too slowly. Instead, choose a dataset with a small number of fields. See the section, Elements in the four datasets.
h. In the Dataset dropdown, select your new dataset. i. In the Value field dropdown, select the value you want the parameter to
filter on. j. In the Label field dropdown, select what you want users to see in the
dropdown menu.
8/22/2017 Page 42 of 56
4. Click OK.
Connect the Report Parameter to a dataset filter on your report 1. Right-click on your main report dataset (in this case, it is Attendance). 2. Click on Dataset Properties. 3. The Dataset Properties window will pop up with the Query option selected in the
left pane. 4. In the left pane, click Filters. 5. To add a new filter, click on the Add button near the top of the popup window. 6. From the Expression dropdown, select the data field that you want to filter on. 7. In the Operator dropdown, select how you want to filter: =, <> (not equal to), >, <,
etc. See the section above, Built-in filter operators, for a complete list of available operators and what they do.
8/22/2017 Page 43 of 56
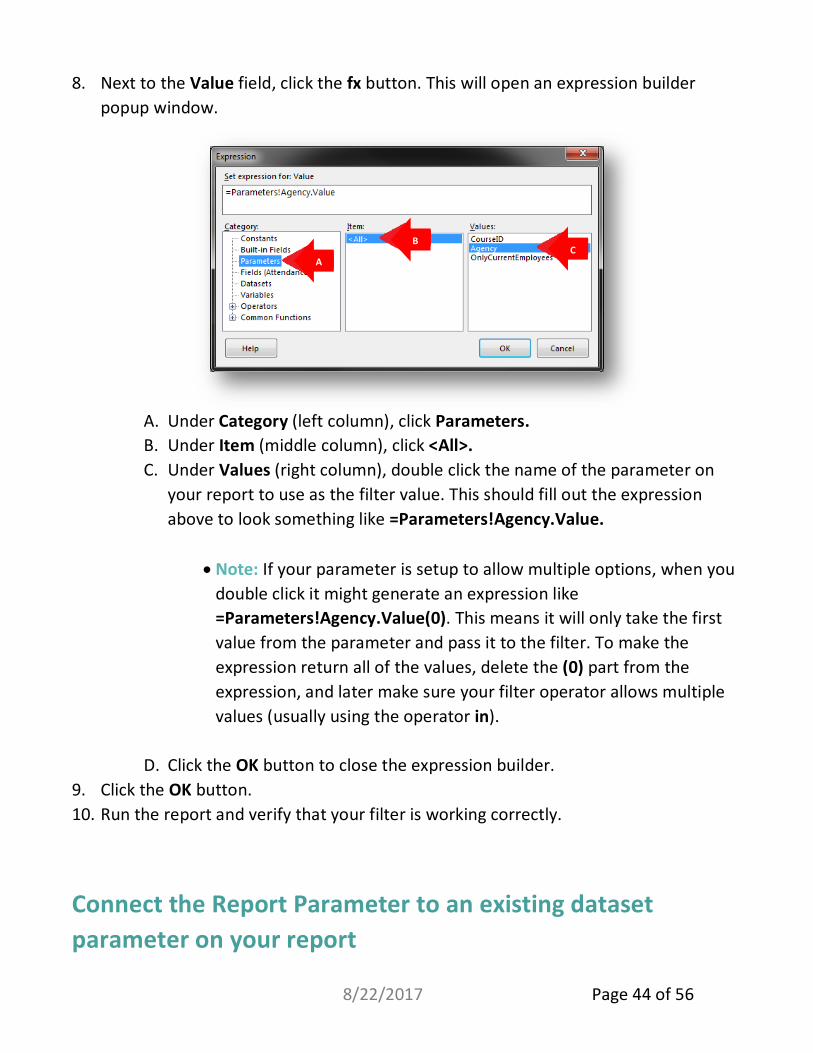
8. Next to the Value field, click the fx button. This will open an expression builder popup window.
A. Under Category (left column), click Parameters. B. Under Item (middle column), click <All>. C. Under Values (right column), double click the name of the parameter on
your report to use as the filter value. This should fill out the expression above to look something like =Parameters!Agency.Value.
• Note: If your parameter is setup to allow multiple options, when you double click it might generate an expression like =Parameters!Agency.Value(0). This means it will only take the first value from the parameter and pass it to the filter. To make the expression return all of the values, delete the (0) part from the expression, and later make sure your filter operator allows multiple values (usually using the operator in).
D. Click the OK button to close the expression builder. 9. Click the OK button. 10. Run the report and verify that your filter is working correctly.
Connect the Report Parameter to an existing dataset parameter on your report
A
B C
8/22/2017 Page 44 of 56
11. Right-click on your main report dataset (in this case, it is Attendance). 12. Click on Dataset Properties. 13. The Dataset Properties window will pop up with the Query option selected in the
left pane. 14. In the left pane, click Parameters.
15. In the Parameter Value dropdown, select a report parameter from your options.
16. Click OK.
17. Click Run in the upper-left corner.
18. You should see your new parameter in the upper-left corner of your report. In the dropdown menu, your options should be available to select.
How and Where to Save a Custom Report [TO BE ADDED LATER]
8/22/2017 Page 45 of 56
8/22/2017 Page 46 of 56
Section 5:
Export Options
• Export to Excel
This Section includes
Export to Excel You have a variety of options for exporting reports.
TIP: If you’re pulling a large report such as AllProgressReport for both organizations, you may find that the file is too large to save as an Excel file. Under the Save icon, try saving as CSV instead.
Or choose the orange icon to export the report as a data feed. (NOTE: This only
exports the data values as a flat table; no formatting is included.)
To use the data feed in Excel, do the following.
1. Open a new Excel workbook, or a blank sheet in a workbook where you want the data to appear.
8/22/2017 Page 47 of 56
2. Click the Data tab in the top ribbon menu.
3. On the Data menu, click Get External Data, then From Other Sources, and finally From OData Data Feed.
4. Click Browse… to select the data feed file you exported from the report, then click Next.
5. Click the checkmark next to the tables that contain the data you want to pull in to Excel. (NOTE: There will be more than one if you have multiple different tables in a report.) Click the Finish button.
8/22/2017 Page 48 of 56
6. Choose how you want to view the data in your workbook, select a location to place it, and click OK.
Note: Emails are sent from a DoNotReply email address that is not monitored.
8/22/2017 Page 49 of 56
8/22/2017 Page 50 of 56
Section 6:
Additional Resources
• Excel
• ReportBuilder Resources
• Outside Training
This Section includes
Excel Microsoft Excel 2013 courses are in iLearn. Intermediate and Advanced courses focus on pivot tables and manipulating data.
Also see these YouTube tutorials:
• Introduction to Pivot Tables, Charts, and Dashboards in Excel, Part 1 (Time: 14:47) https://www.youtube.com/watch?v=9NUjHBNWe9M
• Introduction to Pivot Tables, Charts, and Dashboards, Part 2 (Time: 14:47) https://www.youtube.com/watch?v=g530cnFfk8Y
• How to Make an Excel Pie Chart (Time: 4:48) https://www.youtube.com/watch?v=fnE-Yq771nM
ReportBuilder Resources When you are ready to edit or add new reports, these links should help get you started.
To download the ReportBuilder software – go to the following link, and click on “ReportBuilder” in the top ribbon. You will need the ReportBuilder software to edit or add reports. http://wpdhscls16a.dhs.sdc.pvt/Reports_REPRTI2
Create a basic table report with ReportBuilder https://msdn.microsoft.com/en-us/library/dd255273(v=sql.120).aspx
Create a matrix report with ReportBuilder https://msdn.microsoft.com/en-us/library/ff519557(v=sql.120).aspx
Format text in ReportBuilder: https://msdn.microsoft.com/en-us/library/ff519550(v=sql.120).aspx
Add column chart to your report: https://msdn.microsoft.com/en-us/library/dd255219(v=sql.120).aspx
Add a pie chart to your report: https://msdn.microsoft.com/en-us/library/dd255283(v=sql.120).aspx
Add a bar chart to your report: https://msdn.microsoft.com/en-us/library/dd255225(v=sql.120).aspx
Add a sparkline to your report: https://msdn.microsoft.com/en-us/library/ff519545(v=sql.120).aspx
Additional overview of how to build basic report without the step by step wizard: https://www.simple-talk.com/sql/reporting-services/report-builder-3-0-creating-a-basic-report/
Outside Training Paid Classroom Training available at New Horizons in Portland: http://www.nhoregon.com/search/keyword/ssrs 55123 Writing Reports with ReportBuilder and SSRS Level 1 55128 Microsoft SQL Server ReportBuilder 3.0 Level 2
Paid Online (some free on Tuesdays) Training available at Pragmatic Works: http://pragmaticworks.com/Training/Courses#subject=SSRS
• Clear Saved References from ReportBuilder • Where are Data Elements in iLearn?
This Section includes
Clear Saved References from ReportBuilder
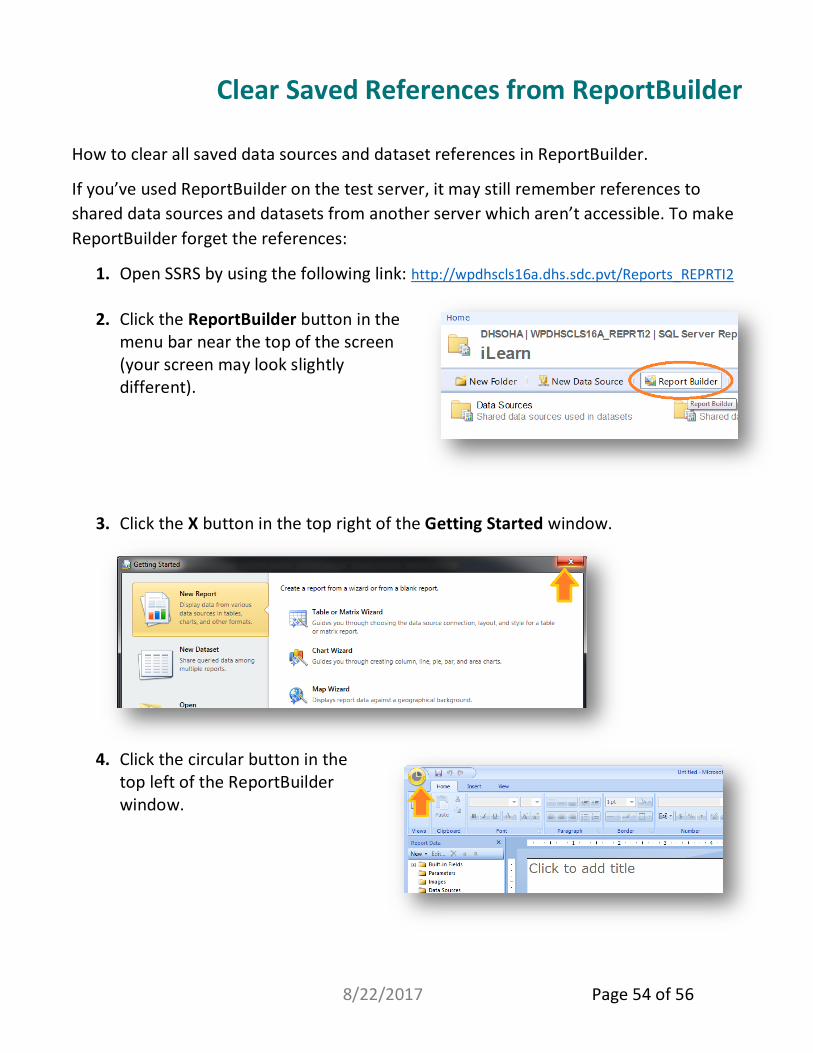
How to clear all saved data sources and dataset references in ReportBuilder.
If you’ve used ReportBuilder on the test server, it may still remember references to shared data sources and datasets from another server which aren’t accessible. To make ReportBuilder forget the references:
1. Open SSRS by using the following link: http://wpdhscls16a.dhs.sdc.pvt/Reports_REPRTI2
2. Click the ReportBuilder button in the menu bar near the top of the screen (your screen may look slightly different).
3. Click the X button in the top right of the Getting Started window.
4. Click the circular button in the top left of the ReportBuilder window.
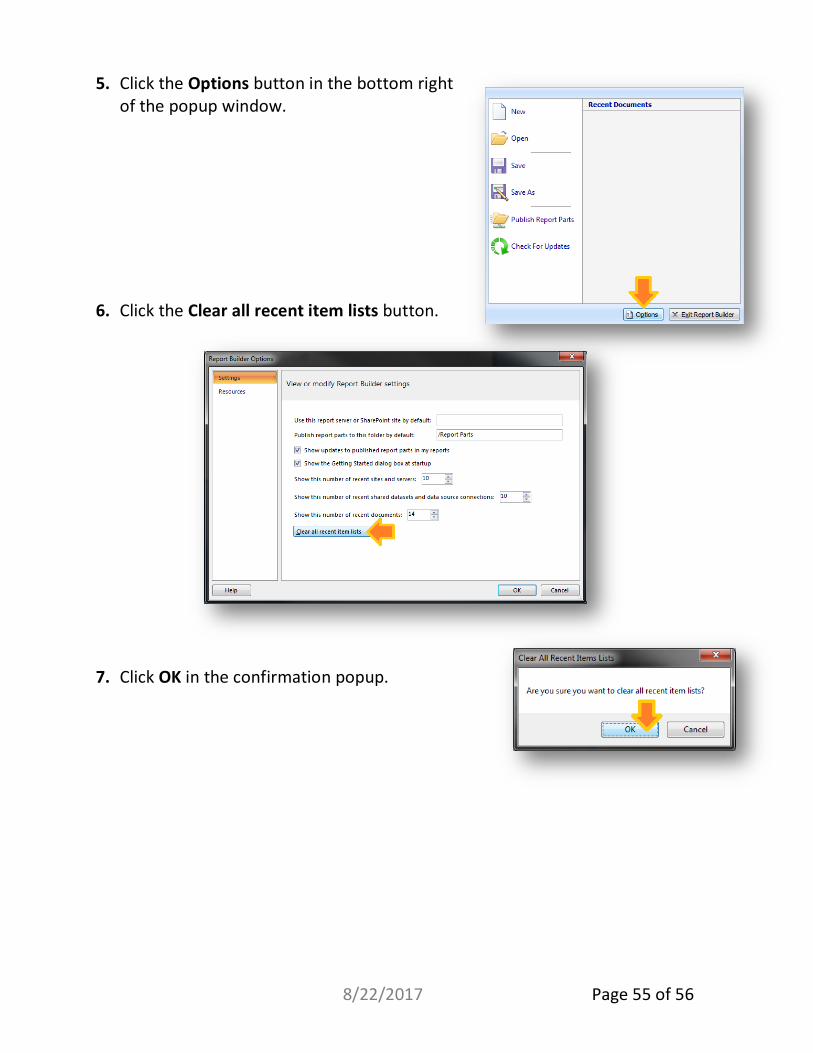
5. Click the Options button in the bottom right of the popup window.
6. Click the Clear all recent item lists button.
7. Click OK in the confirmation popup.
8/22/2017 Page 55 of 56
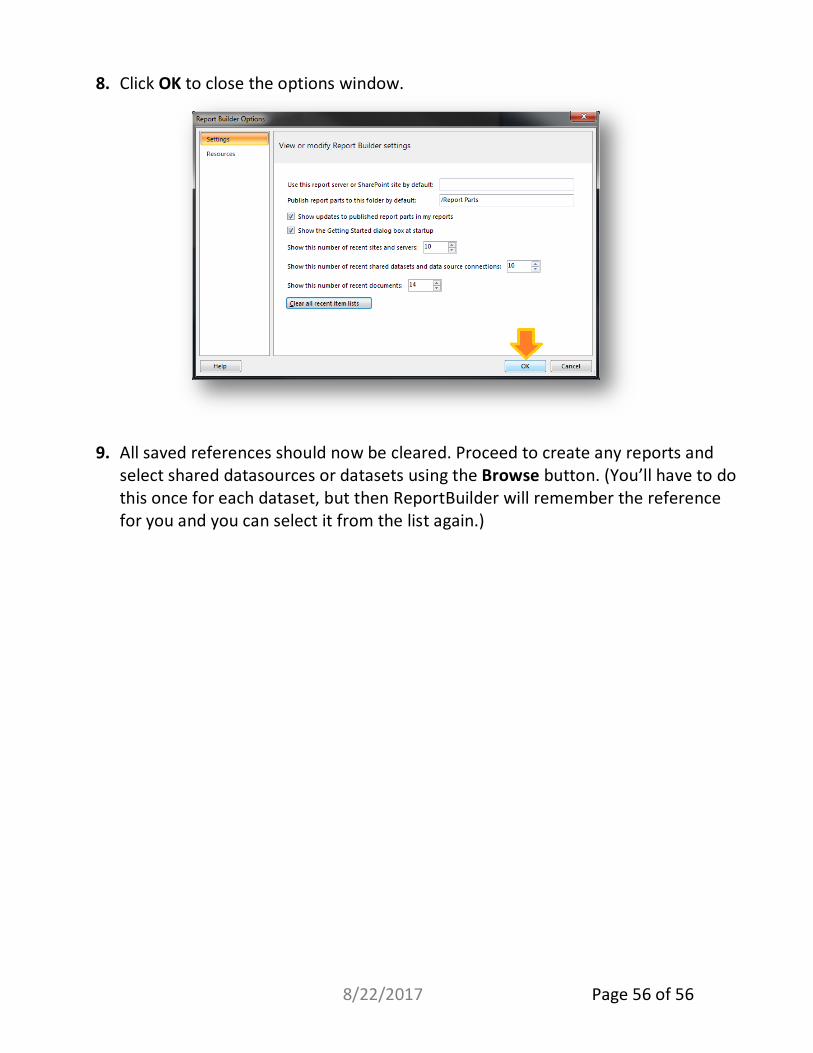
8. Click OK to close the options window.
9. All saved references should now be cleared. Proceed to create any reports and
select shared datasources or datasets using the Browse button. (You’ll have to do this once for each dataset, but then ReportBuilder will remember the reference for you and you can select it from the list again.)