24 H. L. KORNBERG, J. F. COLLINS, D. BIGLEY a3 H. J. VOGEL, in W. D. MCELROY AND B. GLASS, The Chemical Basis of Heredity, The Johns Hopkins Press, Baltimore, 1957, P. 276- H. J. VOGEL, Proc. Natl. Aead. Sei. U.S., 43 (1957) 491. R. A. YATES AND A. B. PARDEE, J. Biol. Chem., 221 (1956) 757- R. A. YATES AND A. B. PARDEE, J. Biol. Chem., 227 (1957) 677. 87 H. E. UMBARGER AI~D B. BROWN, Science, 123 (1956) 848. 3s H. E. UMBARGER AND B. BROWN, J. Biol. Chem., 233 (1958) 415 . 39 M. S. BROOKE, D. USHIBA AND B. MAGASANIK, J. Bacteriol., 58 (1954) 534. 40 B. MAGASANIK, A. K. 1V[AGASANIK AND F. C. NEIDHARDT, in Regulation o/ Cell Metabolism. Ciba Foundation Symposium, J. & A. Churchill, London, 1959, p. 334. 41 L. GORINI AND W. K. MAAS, Biochim. Biophys. Aeta, 25 (1957) 208. 42 L. GORINI AND W. K. MAAS, in W. D. MCELROY AND B. GLASS, A Symposium on the Chemical Basis o/Development, Johns Hopkins Press, Baltimore, 1958, p. 469. 48 L. GORINI, in M~morial CLAUDE FROMAGEOT, Soc. Chim. Biol., Masson et Cie, Paris, 1959, p. 257- 44 B. MAGASANIK, Ann. Rev. Microbiol., II (1957) 221. 4s A. B. PARDEE, in Regulation of Cell Metabolism. Ciba Foundation Symposium, J. & A. Churchill, London, 1959, P. 295. 46 A. B. PARDEE, in P. D. BOYER, H. A. LARDY AND A. K. MYRBACK, The Enzymes, Academic Press, New York, 1959, p. 681. 47 K. G. GOLLAKOTA AND H. O. HALVORSON, Bacteriol. Proc., (1959) 39, Biochim. Biophys..dcta, 39 (196o) 9-24 MICROSPECTROPHOTOMETRIC MEASUREMENTS OF THE CYTOCHROMES IN A MITOCHONDRIAL AGGREGATE IN VIVO ROBERT PERRY*, BO THORELL**, LENNART ~KERMAN** ANn BRITTON CHANCE Johnson Research Foundation, University o/ Pennsylvania, Phila~lelphia, Pa. (U.S.A.), Department of Pathology, Karolinska Instituter, Stockholm (Sweden) (Received June ISth, 1959) SUMMARY Recent improvements in microspeetrophotometry have allowed a quantitative in vivo assay of the respiratory enzymes in a single mitochondrial aggregate, the "neben- kern", of the grasshopper spermatid with a detectability equivalent to 6,000 molecules of cytochrome b. It has been possible to demonstrate Soret spectra of both oxidized and reduced cytochromes, depending on whether the cell is in an aerobic or an anaerobic state. The total concentration of cytochromes a3, a, b, c, and c 1 in the "nebenkern" is calculated to be about 7" IO~ molecules//~3 and is at least 50 times that in any other comparable part of the cell. INTRODUCTION Microspectrophotometry of single living cells has been used extensively for the evaluation of nucleic acids, proteins, and other compounds existing in substrate Abbreviations used are: PNH (reduced pyridine nucleotide), IAA (iodoacetic acid). * Present address: Laboratory of Animal Morphology, Free University of Brussels, Belgium. ** Permanent address: Department of Pathology, Karolinska Instituter, Stockholm, Sweden. Biochim, Biophys. Acta, 39 (196o) 24-32
Transcript
24 H. L. KORNBERG, J. F. COLLINS, D. BIGLEY
a3 H. J. VOGEL, in W. D. MCELROY AND B. GLASS, The Chemical Basis of Heredity, The Johns Hopkins Press, Baltimore, 1957, P. 276- H. J. VOGEL, Proc. Natl. Aead. Sei. U.S., 43 (1957) 491. R. A. YATES AND A. B. PARDEE, J. Biol. Chem., 221 (1956) 757- R. A. YATES AND A. B. PARDEE, J. Biol. Chem., 227 (1957) 677.
87 H. E. UMBARGER AI~D B. BROWN, Science, 123 (1956) 848. 3s H. E. UMBARGER AND B. BROWN, J. Biol. Chem., 233 (1958) 415 . 39 M. S. BROOKE, D. USHIBA AND B. MAGASANIK, J. Bacteriol., 58 (1954) 534. 40 B. MAGASANIK, A. K. 1V[AGASANIK AND F. C. NEIDHARDT, in Regulation o/ Cell Metabolism.
Ciba Foundation Symposium, J. & A. Churchill, London, 1959, p. 334. 41 L. GORINI AND W. K. MAAS, Biochim. Biophys. Aeta, 25 (1957) 208. 42 L. GORINI AND W. K. MAAS, in W. D. MCELROY AND B. GLASS, A Symposium on the Chemical
Basis o/Development, Johns Hopkins Press, Baltimore, 1958, p. 469. 48 L. GORINI, in M~morial CLAUDE FROMAGEOT, Soc. Chim. Biol., Masson et Cie, Paris, 1959, p. 257- 44 B. MAGASANIK, Ann. Rev. Microbiol., I I (1957) 221. 4s A. B. PARDEE, in Regulation of Cell Metabolism. Ciba Foundation Symposium, J. & A. Churchill,
London, 1959, P. 295. 46 A. B. PARDEE, in P. D. BOYER, H. A. LARDY AND A. K. MYRBACK, The Enzymes, Academic Press,
New York, 1959, p. 681. 47 K. G. GOLLAKOTA AND H. O. HALVORSON, Bacteriol. Proc., (1959) 39,
Biochim. Biophys..dcta, 39 (196o) 9-24
M I C R O S P E C T R O P H O T O M E T R I C M E A S U R E M E N T S OF
T H E C Y T O C H R O M E S I N A M I T O C H O N D R I A L A G G R E G A T E I N VIVO
R O B E R T P E R R Y * , BO THORELL** , L E N N A R T ~ K E R M A N * * ANn B R I T T O N CHANCE
Johnson Research Foundation, University o/ Pennsylvania, Phila~lelphia, Pa. (U.S.A.), Department of Pathology, Karolinska Instituter, Stockholm (Sweden)
(Received June ISth, 1959)
SUMMARY
Recent improvements in microspeetrophotometry have allowed a quanti tat ive in vivo assay of the respiratory enzymes in a single mitochondrial aggregate, the "neben- kern", of the grasshopper spermatid with a detectability equivalent to 6,000 molecules of cytochrome b. I t has been possible to demonstrate Soret spectra of both oxidized and reduced cytochromes, depending on whether the cell is in an aerobic or an anaerobic state. The total concentration of cytochromes a3, a, b, c, and c 1 in the "nebenkern" is calculated to be about 7" IO~ molecules//~3 and is at least 50 times that in any other comparable part of the cell.
INTRODUCTION
Microspectrophotometry of single living cells has been used extensively for the evaluation of nucleic acids, proteins, and other compounds existing in substrate
Abbreviat ions used are: P N H (reduced pyridine nucleotide), IAA (iodoacetic acid). * Present address: Labora tory of Animal Morphology, Free Univers i ty of Brussels, Belgium.
** Pe rmanen t address: Depar tmen t of Pathology, Karol inska Inst i tu ter , Stockholm, Sweden.
Biochim, Biophys. Acta, 39 (196o) 24-32
In vivo MICROSPECTROPHOTOMETRY OF CYTOCHROMES 25
concentrations 1-s. However, measurements on a single cell of the light absorption of compounds which are in enzyme concentrations have heretofore had only limited application a because the instruments used did not have sufficient sensitivity or stability for accurately recording the absorbancies of o.I to I.o % which are en- countered. On the other hand, instruments capable of measuring these small absorb- ancies to a high degree of accuracy in suspensions of whole cells and cell fractions have been developed 4. With such techniques a detectability of lO -11 moles of respir- atory pigment in a I-cm cuvette has been realized 5.
The obvious advantages of microspectrophotometry in localizing the measure- ments to specific parts of cells and in making it possible to select the cells on the basis of morphological or temporal criteria made it desirable to extend such highly sensitive measurements to the micro scale. The combination of sensitive recording circuits and the microscopic technique has now allowed the quantitative study of respiratory enzyme distributions in single living cells e, ~.
Whether or not the measurements can be localized to distinct structures within the cell such as mitochondria depends on the size and distribution of these structures. In some cases, favorable conditions can be attained by high speed centrifugation 8, although the resulting damage to the cell curtails the use of this technique for many types of problems. In other instances, there is a natural tendency for the mitochondria to concentrate themselves into a highly compact volume. Such an event occurs during spermatogenesis in certain insects when the "nebenkern" is formed.
In the grasshopper, the morphogenesis of the "nebenkern" has been elucidated by classical cytological methods, and more recently has been studied in detail by electron 9,10 and interference 11 microscopy. I t appears to be formed in the spermatid by a coalescence of smaller mitochondria or mitochondrial filaments and later gives rise to the mitochondrial sheath of the sperm tail. Its solid concentration is not very different from that of the filaments, which suggests that there has been no gross modification of chemical organization during its formation 11.
This paper reports some spectrophotometric measurements made on the "neben- kern" in which a clearly defined Soret spectrum of the cytochromes is demonstrated.
METHODS AND MATERIALS
Apparatus
Since a detailed account of the instrument appears elsewhere ~, only a brief description will be given here.
A 6 V, 18 A, tungsten ribbon filament operated at 30 % over-voltage illuminates the entrance slit of a grating monochromator (Bausch & Lomb, 25o-mm focus) which in turn illuminates the condenser of a microscope (Bausch & Lomb) by means of a quartz-fluoride lens arranged for Kohler illumination. Both the condenser and the objective are 1.6-mm Grey-Polaroid reflecting, water immersion components (N.A. i.o). The effective slit width corresponds to a spectral interval of 3 m~. A 3.5 X quartz ocular projects the beam alternately on each of two parallel non-coplanar mirrors vibrating at 60 cyc./sec. A suitable aperture is placed at the image plane and a IP-28 photomultiplier is placed immediately beyond the aperture. The mirrors and aperture are so arranged that the light originating from two spots in the object plane, 1. 5 t~ in diameter and 12 ~ apart, are put alternately on the same area of the photo-
Biochim. Biophys. Acta, 39 (196o) 24-32
20 R. PERRY, B. THORELL, L. AKERMAN, B. CHANCE
multiplier. One of these beams is designated the measuring beam, the other the reference beam. The parts of the cell corresponding to the two spots are determined by means of an auxiliary telescope which can be interchanged with the photo- multiplier.
The output of the photomultiplier contains coded information in the following format: dark, reference, dark, measure, each one of these corresponding to a certain potential output from the photomultiplier. It is the function of the electronic circuit to provide high amplification for the difference between the dark and the reference pulses in order to maintain this difference at exactly I V, in spite of variations of the emissivity of the light source and the sensitivity of the photocell. The electronic circuit also measures with a high degree of accuracy the difference between the amplitudes of the reference and measure pulse. The recorder is actuated by this difference. The specific advantages of the electronic circuits employed are that they provide a satisfactory method for the amplification of these small differences without amplifier overload due to the magnitude of the pulses themselves or to the large amount of noise which is inevitably carried along with the signal information. The amplification factor in the measurement of the dark-reference signal is ~-~ Io-fold. That in the reference-measure circuit is sufficient that lO -4 in O.D. is readily de- tectable on the recorder (see Fig. 2). Considerable advantage is obtained from con- trolling the dynode voltage of the photocell from the difference between the reference and the dark signal since this is independent of the dark current of the photomultiplier and grid current of the amplifier tube.
In order to achieve rapid equilibration of the instrument and to facilitate the recording of spectra at these high sensitivities, auxiliary RC networks giving time constants (IO-9O %) of either 5 or io sec were inserted across the output. The effect of these time constants on the cytochrome spectra was determined by recording the spectrum of the hemoglobin in an erythrocyte 13, which could be done at a much lower sensitivity without the auxiliary RC network (Fig. 6), and then inserting the particular RC and noting the displacement of the principal peak. The shifts were 5 and 7 mt~ for the two above mentioned networks, and hence the wave lengths of all equivalent cytochrome Soret peaks were corrected by these amounts. No attempt was made to correct the peak height which, judging from the hemoglobin curves, was lowered by not more than 5 %.
Preparations
The biological preparations were made from mature grasshoppers according to the method described by BELAR 14. A typical preparation consisted of the contents of one or two follicles suspended in about 3 t ~1 of BELAR'S buffer. The cells were confined between a normal slide and coverslip and the preparation sealed with paraffin. Both the "nebenkerne" which appear as single bodies (in early stage spermatids) and those which are double (in later stages) were measured.
Preparations made with normal BELAR'S buffer, which contains glucose, go anaerobic in a few minutes, whereas if glucose is omitted they remain aerobic for about 1.5 h. The aerobic or anaerobic state of the preparation can be checked by mixing in a few red blood cells and then taking the hemoglobin spectrum of one of them 18.
For a comparison with the spectra of the individual "nebenkern", a bulk prepa-
Biochim. Biophys. Acta, 39 (196o) 24-32
In vivo MICROSPECTROPHOTOMETRY OF CYTOCHROMES 27
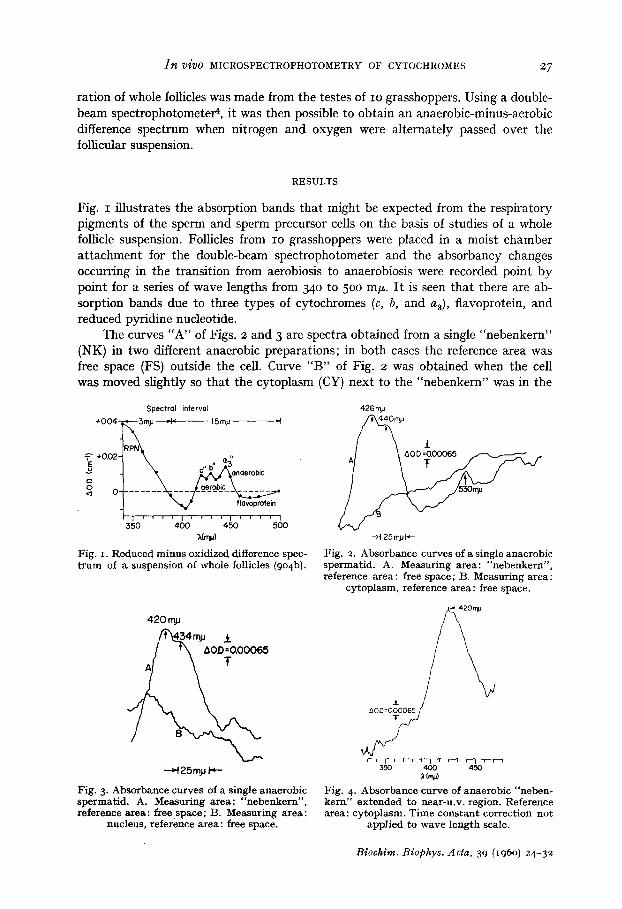
ration of whole follicles was made from the testes of IO grasshoppers. Using a double- beam spectrophotomete#, it was then possible to obtain an anaerobic-minus-aerobic difference spectrum when nitrogen and oxygen were alternately passed over the follicular suspension.
RESULTS
Fig. i illustrates the absorption bands that might be expected from the respiratory pigments of the sperm and sperm precursor cells on the basis of studies of a whole follicle suspension. Follicles from IO grasshoppers were placed in a moist chamber at tachment for the double-beam spectrophotometer and the absorbancy changes occurring in the transition from aerobiosis to anaerobiosis were recorded point by point for a series of wave lengths from 340 to 500 mF. I t is seen that there are ab- sorption bands due to three types of cytochromes (c, b, and a3), flavoprotein, and reduced pyridine nucleotide.
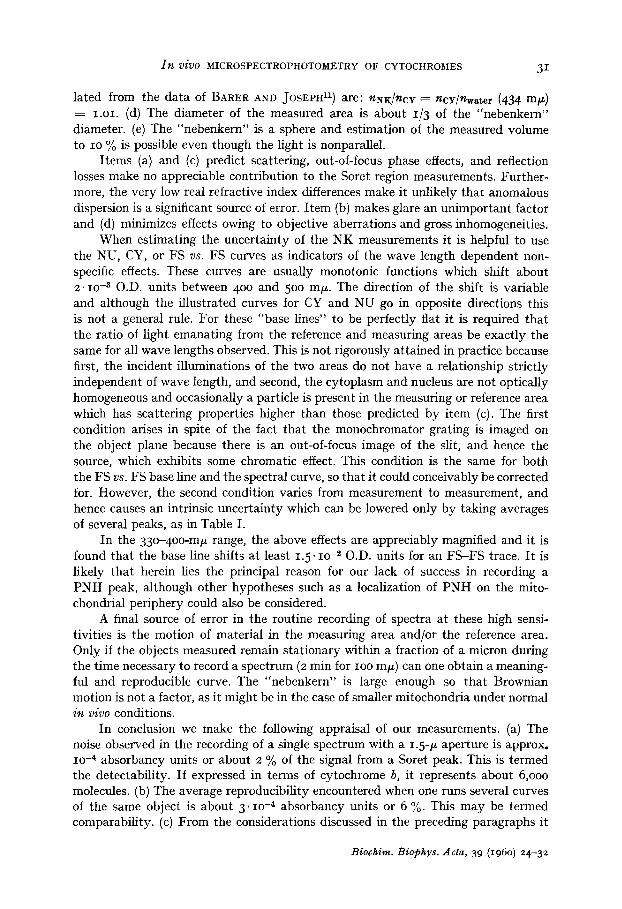
The curves "A" of Figs. 2 and 3 are spectra obtained from a single "nebenkern" (NK) in two different anaerobic preparations; in both cases the reference area was free space (FS) outside the cell. Curve "B" of Fig. 2 was obtained when the cell was moved slightly so that the cytoplasm (CY) next to the "nebenkern" was in the
Spectral intervo~ +0.04" .~-'- 3mp --h 1.5mp ~1
~'- +0.02- :~PN'~ a "
o° ~ 0 . . . . . . . . . . . . . . . . .
" ~ flovoprofein l i l l J I i i r ~ I I i , l i
350 400 450 500 ~(m~u)
Fig. I. Reduced m i n u s oxidized difference spec- t-rum of a suspens ion of whole follicles (9o4b).
420 rn~u
. / q ~ 4 r@a ±
5..= ,
--~425mp I~--
F ig. 3. Absorbance curves o f a s ingle anaerob ic spermat id . A. Measur ing area: " n e b e n k e r n " , reference area: f r e e space; B. Measur ing area:
nucleus, reference area: free space.
4 2 6 r n . u
~ t 2 5 r n p N -
Fig. 2. Absorbance curves o f a single anaerob ic spe rma t id . A. Measur ing area: "nebenkern", reference a rea : free space; /3. Measur ing area:
cy top la sm, reference a rea : free space.
J i I i i , i I I i i i I i i t 3 5 0 4 0 0 4 5 0
Fig. 4- Absorbance curve of anaerobic "neben- ke rn" e x t e n d e d to near -u .v , region. Reference area: cy top l a sm. T i m e c o n s t a n t correct ion no t
appl ied to wave l eng th scale.
Biochim. Biophys. Acta, 39 (196o) 24-32
28 R. PERRY, B. THORELL, L. AKERMAN, B. CHANCE
measuring area while free space remained in the reference area. Curve "B" of Fig. 3 represents a similar case where the nucleus (NU) was moved into the measuring area. In the NK v s FS curves (A) of Figs. 2 and 3 there is a distinct peak at 420-426 m/~ and a shoulder at 434-44 ° m/~, whereas the NU or CY v s FS curves (B) show no evidence of a peak. Clearly reproducible peaks in the region beyond 500 m~ have not yet been obtainable although the peak at 530 mF seen in curve "A" of Fig. 2 has been observed many times.
413rap
± ooT . , = .
-~ 25mpt~
Fig. 5. Absorbance curve of "nebenkern" about 75 min after sealing the preparat ion. Reference area: nucleus. Prepara t ion in buffer wi thout
glucose.
AQD)=O.043
' ' ' 4 ~ ' ' ' ,500 6~)0
'N.tu)
Fig. 6. Hemoglobin spectra of an erythrocyte present in a spermat id prepara t ion which was made wi thout glucose. A. Oxidized curve record- ed less t han 90 rain after prepara t ion was made. Reference area: free space. ]3. Reduced curve recorded lO 5 rain after prepara t ion was made
Reference area: free space.
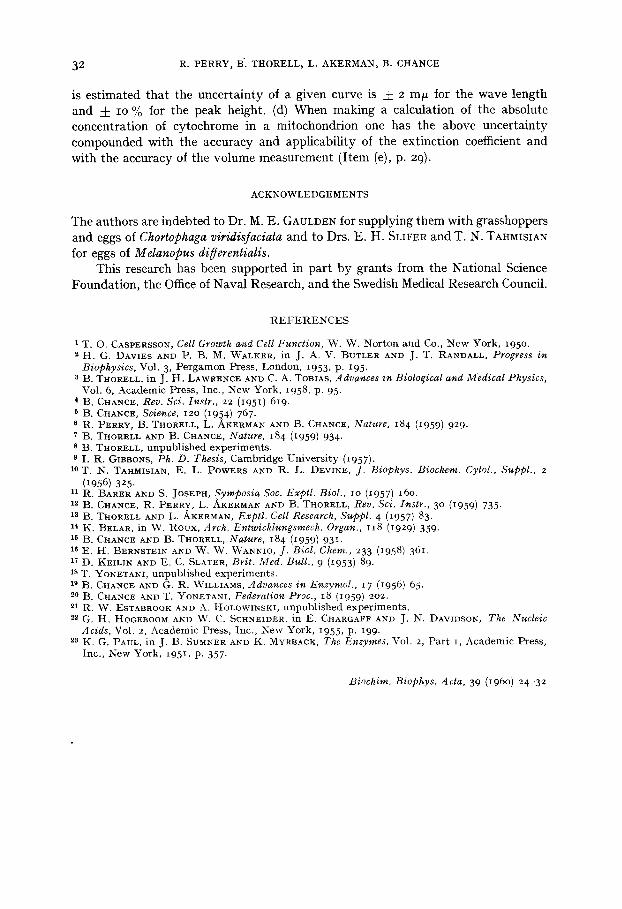
Several a t tempts were made to detect a P N H peak at 34 ° m~ in the anaerobic "nebenkern" but none could be found. When preparations were made on quartz and an appropriate filter inserted in the optical system to reduce stray light effects, curves similar to that shown in Fig. 4 were obtained. That the "nebenkern" contained P N H under these conditions was clearly demonstrated by fluorescence measurements 15. Possible reasons for this discrepancy are discussed in the APPENDIX (p. 30).
When preparations were made in buffer without glucose and the measurements made within 75 min, the spectrum, illustrated in Fig. 5, was obtained. This curve has a single peak at approx. 413 m/,. If, however, measurements were taken about 9 ° min after the preparation was made, then the spectra resembled those of Figs. 2 and 3. That the preparation correspondingly went from an aerobic to an anaerobic state during this transition may be seen from the change in the hemoglobin spectrum (Fig. 6) which was recorded using a human red blood cell present in the preparation.
Another method for keeping a preparation aerobic is to add an inhibitor of
415 r n ~ ' - * - 422 mp / / ~\ AOD=0,00065 I ~ m~T
~,-- 50 mp ---~.1
T A B L E I
Anaerobic
Peak Should~ Aerobic
N um ber of records 14 9 8 ]Ytean value 423 m # 437 m/z 416 m F Standard deviat ion 2. 5 m # 4 mff i .5 mff
Fig. 7. Absorbance curves of "nebenkern" recorded about 3 ° rain after prepara t ion was made. A. Glucose-containing buffer plus 4 m M IAA. Reference area: nucleus. B. Glucose-con-
taining buffer. Reference area: flee space.
Biochira. Biophys. Acta, 39 (I96O) 24-32
I n viuo MICROSPECTROPHOTOMETRY OF CYTOCHROMES 29
respiration to the glucose-containing buffer. Preliminary experiments with the bulk suspension of follicles and an oxygen electrode showed tha t 4 m M IAA gave an appreciable inhibition of the respiration rate. Two preparations from the same testis were made in BELAR'S buffer with glucose and 4 m M IAA was added to one. The curves, shown in Fig. 7, illustrate, within experimental variability, the same shift as tha t of Fig. 5.
A summary of the data on the "nebenkern" is given in Table I.
DISCUSSION
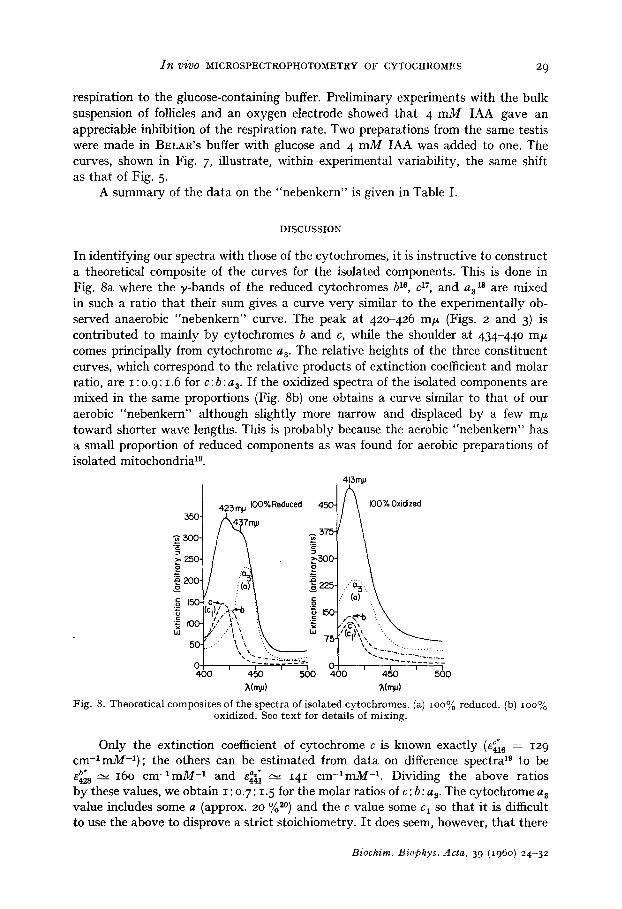
In identifying our spectra with those of the cytochromes, it is instructive to construct a theoretical composite of the curves for the isolated components. This is done in Fig. 8a where the y-bands of the reduced cytochromes b le, c 17, and a 318 are mixed in such a ratio tha t their sum gives a curve very similar to the experimentally ob- served anaerobic "nebenkern" curve. The peak at 420-426 m#z (Figs. 2 and 3) is contr ibuted to mainly by cytochromes b and c, while the shoulder at 434-440 mF comes principally from cytochrome a 3. The relative heights of the three consti tuent curves, which correspond to the relative products of extinction coefficient and molar ratio, are I : 0. 9:1.6 for c: b: as. I f the oxidized spectra of the isolated components are mixed in the same proportions (Fig. 8b) one obtains a curve similar to tha t of our aerobic "nebenkern" al though slightly more narrow and displaced by a few m F toward shorter wave lengths. This is probably because the aerobic "nebenkern" has a small proport ion of reduced components as was found for aerobic preparations of isolated mitochondria 19.
413rn.u ;350J ~oo% Oxidized 300
~ 250- .~ 200- ......~3....
.,.--~b :~ \ "~ I00- ,'/c', ,. ".. , . ,
50. ", ,. "-
0 i t 400 4~)0 5()0 400 450 560
Mmju) ~(n~u)
Fig. 8. Theoretical composites of the spectra of isolated cytochromes. (a) lOO% reduced. (b) lOO% oxidized. See text for details of mixing.
Only the extinction coefficient of cytochrome c is known exactly (e~ 6 = 129 c m - l m M - 1 ) ; the others can be est imated from da ta on difference spectra ~g to be
H
e~28 , - , 16o c m - ~ m M -1 and e441"," __~-~ 141 c m - l m M -1. Dividing the above ratios by these values, we obtain I : 0. 7: 1.5 for the molar ratios of c: b: a s. The cytochrome a s value includes some a (approx. 20 %a0) and the c value some c 1 so tha t it is difficult to use the above to disprove a strict stoichiometry. I t does seem, however, tha t there
423m# 100%Reduced 450.
A437 rn.u /,- k
I - ) ~3oo : 3 23
225
/ :'% : c
. ' 1 I ~ i , i
I i 0
Biochim. Biophys. Acta, 39 (196o) 24 -32
3 ° R. PERRY, B. THORELL, L. AKERMAN, B. CHANCE
is an excess of terminal oxidase. Using an experimental value of o.oo48 O.D. units for the "nebenkern" at 423 m/~, we can estimate the concentration of cytochrome in the mitochondrion. Assuming 4 ° % contribution of cytochrome b to the peak and a 5 t ~ path length, we obtain 24 ~M in cytochrome b. If the five principal cytochromes were present in equimolar amounts, the total concentration would be 12o/~M or about 7" 104 molecules//A
The relation between the ~M concentration and the amount of cytochrome in ~g/mg protein is
(I~i°) /zg cyt°chr°me #M = cd'p mg protein
where c, is the per cent solid concentration, fp is the per cent of the dry weight which is protein, and M is the molecular weight. From interference microscope data on the "nebenkern" 11, cs---~ 25. For a mitochondrion, f~ is about 65, and M for cytochrome c is 12,9oo. Hence, a 24/~M concentration of cytochrome c is equivalent to 2.0 ~g/mg protein. This agrees very well with a value of 2.6 obtained from spectro- photometric measurements on a suspension of intact isolated mitochondria from rat liver 21, and is four times greater than a reported value for disrupted mitochondria isolated from rat liver 22. Here is another indication that, in a chemical sense, the "nebenkern" may be considered a representative mitochondrion. From the partial specific volume and molecular weight of cytochrome c ~3, one can calculate its mole- cular volume to be lO -8 ~3. If we assume that the other cytochromes occupy ap- proximately the same volume per molecule, we have 7" lO-4/~/~3; that is, the cyto- chrome fraction of the respiratory chain occupies less than o.I % of the mitochondrial volume.
The demonstration of the cytochrome absorption in the in vivo "nebenkeru" and the absence of any measurable absorption in the cytoplasm or nucleus leads to the conclusion that the "nebenkern" contains at least 50 times more cytochromes per unit volume than any other comparable part of the cell. This cytochrome is obviously active metabolically since it reacts in a predictable way to changes in oxygen tension. Thus our experiments lend further support to the idea that the bulk of the respiratory activity is associated with the mitochondria.
These experiments have illustrated that it is possible to use microspectro- photometry for the study of certain highly active enzymic components in situ in much the same way as it has been previously used for studying nucleic acids and proteins. I t is hoped that such an approach will prove of value both to cytologists who wish to characterize metabolic states within a unique type of cell and to biochemists who wish to evaluate the extrapolation of their data to living and less heterogeneous systems.
APPENDIX
Errors
In estimating the errors related to the "nebenkern" structure and the micro- spectrograph optical system, the following factors are pertinent. (a) The Soret peaks are clearly defined with steep troughs on both sides. (b) The absorbancies being measured are very low ( ~ 5" lO-3) • (c) The average refractive index quotients (calcu-
Biochim. Biophys. Acta, 39 (196o) 24-32
I n vivo MICROSPECTROPHOTOMETRY OF CYTOCHROMES 31
lated from the data of BARER AND JOSEPH 11) are: nI~K/ncy ~- ncy/nwater (434 m/~) = 1.0I. (d) The diameter of the measured area is about 1/3 of the "nebenkern" diameter. (e) The "nebenkern" is a sphere and estimation of the measured volume to IO % is possible even though the light is nonparallel.
I tems (a) and (c) predict scattering, out-of-focus phase effects, and reflection losses make no appreciable contribution to the Soret region measurements. Further- more, the very low real refractive index differences make it unlikely that anomalous dispersion is a significant source of error. I t em (b) makes glare an unimportant factor and (d) minimizes effects owing to objective aberrations and gross inhomogeneities.
When estimating the uncertainty of the NK measurements it is helpful to use the NU, CY, or FS vs. FS curves as indicators of the wave length dependent non- specific effects. These curves are usually monotonic functions which shift about 2. IO -a O.D. units between 400 and 500 m/~. The direction of the shift is variable and although the illustrated curves for CY and NU go in opposite directions this is not a general rule. For these "base lines" to be perfectly flat it is required that the ratio of light emanating from the reference and measuring areas be exactly the same for all wave lengths observed. This is not rigorously attained in practice because first, the incident illuminations of the two areas do not have a relationship strictly independent of wave length, and second, the cytoplasm and nucleus are not optically homogeneous and occasionally a particle is present in the measuring or reference area which has scattering properties higher than those predicted by item (c). The first condition arises in spite of the fact that the monochromator grating is imaged on the object plane because there is an out-of-focus image of the slit, and hence the source, which exhibits some chromatic effect. This condition is the same for both the FS vs. FS baseline and the spectral curve, so that it could conceivably be corrected for. However, the second condition varies from measurement to measurement, and hence causes an intrinsic uncertainty which can be lowered only by taking averages of several peaks, as in Table I.
In the 33o-4oo-m/z range, the above effects are appreciably magnified and it is found that the base line shifts at least 1. 5 • lO -20 .D . units for an FS-FS trace. I t is likely that herein lies the principal reason for our lack of success in recording a PNH peak, although other hypotheses such as a localization of P N H on the mito- chondrial periphery could also be considered.
A final source of error in the routine recording of spectra at these high sensi- tivities is the motion of material in the measuring area and/or the reference area. Only if the objects measured remain stationary within a fraction of a micron during the time necessary to record a spectrum (2 rain for IOO m/~) can one obtain a meaning- ful and reproducible curve. The "nebenkern" is large enough so that Brownian motion is not a factor, as it might be in the case of smaller mitochondria under normal in vivo conditions.
In conclusion we make the following appraisal of our measurements. (a) The noise observed in the recording of a single spectrum with a 1.5-/~ aperture is approx° lO -4 absorbancy units or about 2 % of the signal from a Sorer peak. This is termed the detectability. If expressed in terms of cytochrome b, it represents about 6,000 molecules. (b) The average reproducibility encountered when one runs several curves of the same object is about 3" lO-4 absorbancy units or 6 %. This may be termed comparability. (c) From the considerations discussed in the preceding paragraphs it
Biochim. Biophys. Acta, 39 (196o) 24-32
32 R. PERRY, B'. THORELL, L. AKERMAN, B. CHANCE
is estimated that the uncertainty of a given curve is + 2 m~ for the wave length and -4- IO % for the peak height. (d) When making a calculation of the absolute concentration of cytochrome in a mitochondrion one has the above uncertainty compounded with the accuracy and applicability of the extinction coefficient and with the accuracy of the volume measurement (Item (e), p. 29).
ACKNOWLEDGEMENTS
The authors are indebted to Dr. M. E. GAULDEN for supplying them with grasshoppers and eggs of Chortophaga viridisfaciata and to Drs. E. H. SLIFER and T. N. TAHMISIAN for eggs of Melanopus diBerentialis.
This research has been supported in part by grants from the National Science Foundation, the Office of Naval Research, and the Swedish Medical Research Council.
R E F E R E N C E S
1 T. O. CASPERSSON, Cell Growth and Cell Function, W. W. Nor ton and Co., New York, 195o. 2 H. G. DAVlES AND P. 13. M. WALKER, in J. A. V. BUTLER AND J. T. RANDALL, Progress in
Biophysics, Vol. 3, Pergamon Press, London, 1953, p. I95. 2 B. THORELL, in J. H. LAWRENCE AND C. A. TOBIAS, Advances in Biological and Medical Physics,
Vol. 6, Academic Press, Inc., New York, 1958, p. 95- 4 B. CHANCE, Rev. Sci. Instr., 22 (1951) 619. 5 B. CHANCE, Science, 12o (1954) 767. 6 R. PERRY, B. THORELL, L. ~KERMAN AND ]~. CHANCE, Nature, 184 (1959) 929. 7 B. THORELL AND ]3. CHANCE, Nature, 184 (1959) 934. 8 B. THORELL, unpublished experiments. 9 I. R. GIBBONS, P h . D . Thesis, Cambridge Universi ty (1957).
10 T. N, TAHMISlAN, E. L. POWERS AND R. L. DEVINE, J. Biophys. Biochem. Cytol., Suppl., 2 (1956) 325 •
11 R. ]AARER AND S. JOSEPH, Symposia Soc. Exptl. Biol., IO (I957) 16o. 12 B. CHANCE, R. PERRY, L. ~kKERMAN AND ]3. THORELL, Rev. Sci. Instr., 3 ° (1959) 735. 13 B. THORELL AND L. ~IKERMAN, Exptl. Cell Research, Suppl. 4 (1957) 83. 14 K. BELAR, in W. Roux , Arch. Entwicklungsmech. Organ., 118 (1929) 359. 15 B. CHANCE AND n. THORELL, Nature, 184 (1959) 931. 16 E. t-I. ]AERNSTEIN AND W. W. WANNIO, J . Biol. Chem., 233 (1958) 361. 17 D. KEILIN AND E. C. SLATER, Brit. Med. Bull., 9 (19.53) 89. 18 T. YONETANI, unpublished experiments. 19 B. CHANCE AND G. R. WILLIAMS, Advances in Enzymol., 17 (1956) 65. 20 B. CHANCE AND T. YONETANI, Federation Proc., 18 (1959) 202. 21 R. W. ESTABROOK AND A. HOLOWINSKI, unpubl ished experiments . 2, G. H. HOGEBOOM AND W. C. SCHNEIDER, in E. CHARGAFF AND J. N. DAVlDSON, The Nucleic
Acids, Vol. 2, Academic Press, Inc., New York, 1955, p. 199. 22 K. G. PAUL, in J. ]3. SUMNER AND K. MYRBACK, The Enzymes, Vol. 2, Par t i, Academic Press,