510
Project Design Guide Version: 9.0.2 Document Number: 09330902

Project Design Guide
Version: 9.0.2 Document Number: 09330902

Ninth Edition, October 2010, version 9.0.2To ensure that you are using the documentation that corresponds to the software you are licensed to use, compare this version number with the software version shown in “About MicroStrategy...” in the Help menu of your software.
Document number: 09330902
Copyright © 2010 by MicroStrategy Incorporated. All rights reserved.
If you have not executed a written or electronic agreement with MicroStrategy or any authorized MicroStrategy distributor, the following terms apply:This software and documentation are the proprietary and confidential information of MicroStrategy Incorporated and may not be provided to any other person. Copyright © 2001-2010 by MicroStrategy Incorporated. All rights reserved.THIS SOFTWARE AND DOCUMENTATION ARE PROVIDED “AS IS” AND WITHOUT EXPRESS OR LIMITED WARRANTY OF ANY KIND BY EITHER MICROSTRATEGY INCORPORATED OR ANYONE WHO HAS BEEN INVOLVED IN THE CREATION, PRODUCTION, OR DISTRIBUTION OF THE SOFTWARE OR DOCUMENTATION, INCLUDING, BUT NOT LIMITED TO, THE IMPLIED WARRANTIES OF MERCHANTABILITY AND FITNESS FOR A PARTICULAR PURPOSE, GOOD TITLE AND NONINFRINGMENT, QUALITY OR ACCURACY. THE ENTIRE RISK AS TO THE QUALITY AND PERFORMANCE OF THE SOFTWARE AND DOCUMENTATION IS WITH YOU. SHOULD THE SOFTWARE OR DOCUMENTATION PROVE DEFECTIVE, YOU (AND NOT MICROSTRATEGY, INC. OR ANYONE ELSE WHO HAS BEEN INVOLVED WITH THE CREATION, PRODUCTION, OR DISTRIBUTION OF THE SOFTWARE OR DOCUMENTATION) ASSUME THE ENTIRE COST OF ALL NECESSARY SERVICING, REPAIR, OR CORRECTION. SOME STATES DO NOT ALLOW THE EXCLUSION OF IMPLIED WARRANTIES, SO THE ABOVE EXCLUSION MAY NOT APPLY TO YOU.In no event will MicroStrategy, Inc. or any other person involved with the creation, production, or distribution of the Software be liable to you on account of any claim for damage, including any lost profits, lost savings, or other special, incidental, consequential, or exemplary damages, including but not limited to any damages assessed against or paid by you to any third party, arising from the use, inability to use, quality, or performance of such Software and Documentation, even if MicroStrategy, Inc. or any such other person or entity has been advised of the possibility of such damages, or for the claim by any other party. In addition, MicroStrategy, Inc. or any other person involved in the creation, production, or distribution of the Software shall not be liable for any claim by you or any other party for damages arising from the use, inability to use, quality, or performance of such Software and Documentation, based upon principles of contract warranty, negligence, strict liability for the negligence of indemnity or contribution, the failure of any remedy to achieve its essential purpose, or otherwise. The entire liability of MicroStrategy, Inc. and your exclusive remedy shall not exceed, at the option of MicroStrategy, Inc., either a full refund of the price paid, or replacement of the Software. No oral or written information given out expands the liability of MicroStrategy, Inc. beyond that specified in the above limitation of liability. Some states do not allow the limitation or exclusion of liability for incidental or consequential damages, so the above limitation may not apply to you.The information contained in this manual (the Documentation) and the Software are copyrighted and all rights are reserved by MicroStrategy, Inc. MicroStrategy, Inc. reserves the right to make periodic modifications to the Software or the Documentation without obligation to notify any person or entity of such revision. Copying, duplicating, selling, or otherwise distributing any part of the Software or Documentation without prior written consent of an authorized representative of MicroStrategy, Inc. are prohibited. U.S. Government Restricted Rights. It is acknowledged that the Software and Documentation were developed at private expense, that no part is public domain, and that the Software and Documentation are Commercial Computer Software provided with RESTRICTED RIGHTS under Federal Acquisition Regulations and agency supplements to them. Use, duplication, or disclosure by the U.S. Government is subject to restrictions as set forth in subparagraph (c)(1)(ii) of the Rights in Technical Data and Computer Software clause at DFAR 252.227-7013 et. seq. or subparagraphs (c)(1) and (2) of the Commercial Computer Software—Restricted Rights at FAR 52.227-19, as applicable. Contractor is MicroStrategy, Inc., 1850 Towers Crescent Plaza, Vienna, VA 22182. Rights are reserved under copyright laws of the United States with respect to unpublished portions of the Software.The following are either trademarks or registered trademarks of MicroStrategy Incorporated in the United States and certain other countries:
MicroStrategy, MicroStrategy 6, MicroStrategy 7, MicroStrategy 7i, MicroStrategy 7i Evaluation Edition, MicroStrategy 7i Olap Services, MicroStrategy 8, MicroStrategy 9, MicroStrategy Distribution Services, MicroStrategy MultiSource Option, MicroStrategy Command Manager, MicroStrategy Enterprise Manager, MicroStrategy Object Manager, MicroStrategy Reporting Suite, MicroStrategy Power User, MicroStrategy Analyst, MicroStrategy Consumer, MicroStrategy Email Delivery, MicroStrategy BI Author, MicroStrategy BI Modeler, MicroStrategy Evaluation Edition, MicroStrategy Administrator, MicroStrategy Agent, MicroStrategy Architect, MicroStrategy BI Developer Kit, MicroStrategy Broadcast Server, MicroStrategy Broadcaster, MicroStrategy Broadcaster Server, MicroStrategy Business Intelligence Platform, MicroStrategy Consulting, MicroStrategy CRM Applications, MicroStrategy Customer Analyzer, MicroStrategy Desktop, MicroStrategy Desktop Analyst, MicroStrategy Desktop Designer, MicroStrategy eCRM 7, MicroStrategy Education, MicroStrategy eTrainer, MicroStrategy Executive, MicroStrategy Infocenter, MicroStrategy Intelligence Server, MicroStrategy Intelligence Server Universal Edition, MicroStrategy MDX Adapter, MicroStrategy Narrowcast Server, MicroStrategy Objects, MicroStrategy OLAP Provider, MicroStrategy SDK, MicroStrategy Support, MicroStrategy Telecaster, MicroStrategy Transactor, MicroStrategy Web, MicroStrategy Web Business Analyzer, MicroStrategy World, Application Development and Sophisticated Analysis, Best In Business Intelligence, Centralized Application Management, Information Like Water, Insight Is Everything, Intelligence Through Every Phone, Intelligence To Every Decision Maker, Intelligent E-Business, Personalized Intelligence Portal, Query Tone, Rapid Application Development, Strategy.com, MicroStrategy Intelligent Cubes, The Foundation For Intelligent E-Business, The Integrated Business Intelligence Platform Built For The Enterprise, The Intelligence Company, The Platform For Intelligent E-Business, The Scalable Business Intelligence Platform Built For The Internet, Industrial-Strength Business Intelligence, Office Intelligence, MicroStrategy Office, MicroStrategy Report Services, MicroStrategy Web MMT, MicroStrategy Web Services, Pixel Perfect, MicroStrategy Mobile, MicroStrategy Integrity Manager and MicroStrategy Data Mining Services are all registered trademarks or trademarks of MicroStrategy Incorporated.
All other products are trademarks of their respective holders. Specifications subject to change without notice. MicroStrategy is not responsible for errors or omissions. MicroStrategy makes no warranties or commitments concerning the availability of future products or versions that may be planned or under development.
Patent InformationThis product is patented. One or more of the following patents may apply to the product sold herein: U.S. Patent Nos. 6,154,766, 6,173,310, 6,260,050, 6,263,051, 6,269,393, 6,279,033, 6,501,832, 6,567,796, 6,587,547, 6,606,596, 6,658,093, 6,658,432, 6,662,195, 6,671,715, 6,691,100, 6,694,316, 6,697,808, 6,704,723, 6,707,889, 6,741,980, 6,765,997, 6,768,788, 6,772,137, 6,788,768, 6,792,086, 6,798,867, 6,801,910, 6,820,073, 6,829,334, 6,836,537, 6,850,603, 6,859,798, 6,873,693, 6,885,734, 6,888,929, 6,895,084, 6,940,953, 6,964,012, 6,977,992, 6,996,568, 6,996,569, 7,003,512, 7,010,518, 7,016,480, 7,020,251, 7,039,165, 7,082,422, 7,113,993, 7,181,417, 7,127,403, 7,174,349, 7,194,457, 7,197,461, 7,228,303, 7,260,577, 7,266,181, 7,272,212, 7,302,639, 7,324,942, 7,330,847, 7,340,040, 7,356,758, 7,356,840, 7,415,438, 7,428,302, 7,430,562, 7,440,898, 7,457,397, 7,486,780, 7,509,671, 7,516,181, 7,559,048, 7,574,376, 7,617,201, 7,725,811, and 7,801,967. Other patent applications are pending.

Various MicroStrategy products contain the copyrighted technology of third parties. This product may contain one or more of the following copyrighted technologies:Graph Generation Engine Copyright © 1998-2010. Three D Graphics, Inc. All rights reserved.Actuate® Formula One. Copyright © 1993-2010 Actuate Corporation. All rights reserved.XML parser Copyright © 2003-2010 Microsoft Corporation. All rights reserved.Xalan XSLT processor. Copyright © 1999-2010. The Apache Software Foundation. All rights reserved.Xerces XML parser. Copyright © 1999-2010. The Apache Software Foundation. All rights reserved.FOP XSL formatting objects. Copyright © 2004-2010. The Apache Software Foundation. All rights reserved.Portions of Intelligence Server memory management Copyright © 1991-2010 Compuware Corporation. All rights reserved.This product includes software developed by the OpenSSL Project for use in the OpenSSL Toolkit. (http://www.openssl.org/)International Components for UnicodeCopyright © 1999-2010 Compaq Computer CorporationCopyright © 1999-2010 Hewlett-Packard CompanyCopyright © 1999-2010 IBM CorporationCopyright © 1999-2010 Hummingbird Communications Ltd.Copyright © 1999-2010 Silicon Graphics, Inc.Copyright © 1999-2010 Sun Microsystems, Inc.Copyright © 1999-2010 The Open GroupAll rights reserved.Real Player and RealJukebox are included under license from Real Networks, Inc. Copyright © 1999-2010. All rights reserved.

© 2010 MicroStrategy, Inc. v
CONTENTS
Description of guide ................................................................. xiiiAbout this book ............................................................................xiv
How to find business scenarios and examples .......................xvWhat’s new in this guide .........................................................xvPrerequisites ......................................................................... xviiWho should use this guide.................................................... xvii
Resources.................................................................................. xviiiDocumentation..................................................................... xviiiEducation..............................................................................xxvConsulting.............................................................................xxvInternational support .............................................................xxvTechnical Support ................................................................ xxvi
Feedback ................................................................................... xxxi
1. BI Architecture and the MicroStrategy Platform
Introduction.................................................................................. 1Business intelligence architecture ................................................. 2
Source systems for data collection .......................................... 2Extraction, transformation, and loading process...................... 4Data warehouse for data storage and relational design .......... 4
The MicroStrategy platform ........................................................... 7MicroStrategy metadata........................................................... 8MicroStrategy Intelligence Server .......................................... 10MicroStrategy Desktop........................................................... 11MicroStrategy Web and Web Universal ................................. 12MicroStrategy project ............................................................. 13MicroStrategy Architect.......................................................... 14

Contents Project Design Guide
vi © 2010 MicroStrategy, Inc.
The project design process.......................................................... 14
2. The Logical Data ModelConceptualizing your business model and the data on which to report
Introduction................................................................................ 17Overview of a logical data model................................................. 17
Facts: Business data and measurements.................................... 20
Attributes: Context for your levels of data.................................... 21Attribute elements: Data level values..................................... 22Attribute relationships ............................................................ 23
Hierarchies: Data relationship organization ................................. 23
Sample data model...................................................................... 24
Building a logical data model ....................................................... 25User requirements ................................................................. 25Existing source systems ........................................................ 26Converting source data to analytical data.............................. 26
Logical data modeling conventions.............................................. 30Unique identifiers ................................................................... 31Cardinalities and ratios .......................................................... 32Attribute forms ....................................................................... 33
3. Warehouse Structure for Your Logical Data ModelPhysical Warehouse Schema Introduction................................................................................ 35
Columns: Data identifiers and values .......................................... 36
Tables: Physical groupings of related data.................................. 37Uniquely identifying data in tables with key structures........... 37Lookup tables: Attribute storage ............................................ 38Relate tables: A unique case for relating attributes ............... 40Fact tables: Fact data and levels of aggregation ................... 41Homogeneous versus heterogeneous column naming.......... 45
Schema types: Data retrieval performance versus redundant storage......................................................................................... 47
Highly normalized schema: Minimal storage space............... 48Moderately normalized schema: Balanced storage space and query performance.......................................................... 51Highly denormalized schema: Enhanced query performance........................................................................... 52
Design trade-offs ......................................................................... 55

Project Design Guide Contents
© 2010 MicroStrategy, Inc. vii
Schema type comparisons .......................................................... 56
Supporting data internationalization ............................................ 57Internationalization through tables and columns or databases .............................................................................. 58Supporting various character sets within databases.............. 63
Supporting the Map widget and Geo Location for MicroStrategy Mobile ................................................................... 64
4. Creating and Configuring a Project
Introduction................................................................................ 67Overview of project creation ........................................................ 68
Strategies to include supplemental data in a project ............. 70
Project connectivity components ................................................. 73MicroStrategy metadata......................................................... 73Metadata shell ....................................................................... 73Project source........................................................................ 73Database instance ................................................................. 75Project.................................................................................... 75Summary of project connectivity ............................................ 76
Creating the metadata repository ................................................ 76
Connecting to the metadata repository and data source ............. 77Connecting to the metadata repository .................................. 77Connecting to a data source.................................................. 78
Creating a project ........................................................................ 78Creating a production project................................................. 79Creating a test or prototype project using Project Builder...... 95
Creating facts and attributes........................................................ 96
Configuring additional schema-level settings .............................. 96
Deploying your project and creating reports ................................ 97
5. Creating a Project Using Architect
Introduction................................................................................ 99Creating and modifying projects ................................................ 100
Defining project creation and display options ...................... 100Creating projects using Architect ......................................... 113Modifying projects using Architect ....................................... 116Using the Architect toolbar................................................... 118
Adding, removing, and administering tables.............................. 119Displaying data sources in Architect .................................... 120Adding tables ....................................................................... 121Removing tables .................................................................. 122

Contents Project Design Guide
viii © 2010 MicroStrategy, Inc.
Updating, modifying, and administering tables .................... 124Organizing project tables: Layers ........................................ 130
Creating and modifying facts ..................................................... 131Creating facts....................................................................... 132Creating and modifying multiple facts .................................. 135
Creating and modifying attributes .............................................. 144Creating attributes ............................................................... 144Creating and modifying multiple attributes........................... 148
Defining attribute relationships .................................................. 166Automatically defining attribute relationships....................... 171
Creating and modifying user hierarchies ................................... 173Creating user hierarchies..................................................... 173
6. The Building Blocks of Business Data: Facts
Introduction.............................................................................. 177Creating facts............................................................................. 179
Simultaneously creating multiple, simple facts .................... 180Creating and modifying simple and advanced facts ............ 182
The structure of facts ................................................................. 188
How facts are defined ............................................................... 189Mapping physical columns to facts: Fact expressions ......... 190
Fact column names and data types: Column aliases ................ 196
Modifying the levels at which facts are reported: Level extensions.................................................................................. 198
Defining a join on fact tables using table relations............... 200Defining a join on fact tables using fact relations................. 204Forcing facts to relate to attributes: Using cross product joins ..................................................................................... 206Lowering the level of fact data: Fact degradations .............. 207Disallowing the reporting of a fact at a certain level............. 211
7. The Context of Your Business Data: Attributes
Introduction.............................................................................. 215Overview of attributes ................................................................ 216
Creating attributes ..................................................................... 218Simultaneously creating multiple attributes.......................... 219Adding and modifying attributes .......................................... 224
Unique sets of attribute information: Attribute elements ............ 230Supporting data internationalization for attribute elements .............................................................................. 233
Column data descriptions and identifiers: Attribute forms ......... 236

Project Design Guide Contents
© 2010 MicroStrategy, Inc. ix
Displaying forms: Attribute form properties.......................... 238Attribute form expressions ................................................... 240Modifying attribute data types: Column aliases ................... 248Attribute forms versus separate attributes ........................... 251
Attribute relationships ................................................................ 252Viewing and editing the parents and children of attributes .............................................................................. 254Supporting many-to-many and joint child relationships ....... 256
Attributes that use the same lookup table: Attribute roles ......... 266Specifying attribute roles ..................................................... 268
Attributes with multiple ID columns: Compound attributes ........ 274Example: Creating compound attributes.............................. 275
Using attributes to browse and report on data........................... 277Defining how attribute forms are displayed by default ......... 278
8. Creating Hierarchies to Organize and Browse Attributes
Introduction.............................................................................. 281Creating user hierarchies........................................................... 282
Creating user hierarchies using Architect ............................ 284
Types of hierarchies .................................................................. 285System hierarchy: Project schema definition ....................... 285User hierarchies: Logical business relationships ................. 286
Hierarchy organization............................................................... 286Hierarchy structure............................................................... 287Viewing hierarchies: Hierarchy Viewer ................................ 288
Configuring hierarchy display options........................................ 288Controlling the display of attribute elements ........................ 289Filtering attributes in a hierarchy.......................................... 293Entry point............................................................................ 295Hierarchy browsing .............................................................. 296
Using the Hierarchy Viewer and Table Viewer .......................... 301Using the Hierarchy Viewer ................................................. 302Using the Table Viewer........................................................ 303
9. Optimizing and Maintaining Your Project
Introduction.............................................................................. 305Updating your MicroStrategy project schema............................ 306
Data warehouse and project interaction: Warehouse Catalog ...................................................................................... 308
Before you begin using the Warehouse Catalog ................. 309Accessing the Warehouse Catalog...................................... 309

Contents Project Design Guide
x © 2010 MicroStrategy, Inc.
Adding and removing tables for a project ............................ 310Managing warehouse and project tables ............................. 311Modifying data warehouse connection and operation defaults ................................................................................ 316Customizing catalog SQL statements.................................. 323Troubleshooting table and column messages ..................... 328
Accessing multiple data sources in a project............................. 330Connecting data sources to a project .................................. 331Adding data into a project .................................................... 332
Improving database insert performance: parameterized queries ....................................................................................... 341
Using summary tables to store data: Aggregate tables ............. 343When to use aggregate tables............................................. 343Determining the frequency of queries at a specific level...... 346Considering any related parent-child relationships .............. 347Compression ratio................................................................ 348Creating aggregate tables ................................................... 349The size of tables in a project: Logical table size................. 349
Dividing tables to increase performance: Partition mapping...... 350Server versus application partitioning.................................. 350Metadata partition mapping ................................................. 351Warehouse partition mapping.............................................. 353Metadata versus warehouse partition mapping ................... 354
10. Creating Transformations to Define Time-Based and Other Comparisons
Introduction.............................................................................. 357Creating transformations ........................................................... 358
Expression-based versus table-based transformations ....... 359Building a table-based transformation ................................. 360Building an expression-based transformation...................... 361
Transformation components ...................................................... 362
Transformation metrics and joint child attributes ....................... 364
A. MicroStrategy Tutorial Introduction.............................................................................. 367What is the MicroStrategy Tutorial?........................................... 367
MicroStrategy Tutorial data model............................................. 371Data modeling notations ...................................................... 372Geography hierarchy ........................................................... 372Products hierarchy............................................................... 374Customers hierarchy............................................................ 375Time hierarchy ..................................................................... 378
Project Design Guide Contents
© 2010 MicroStrategy, Inc. xi
Viewing the MicroStrategy Tutorial data model ................... 379
MicroStrategy Tutorial schema .................................................. 380Exploring the MicroStrategy Tutorial schema ...................... 381
B. Logical Tables Introduction.............................................................................. 385Logical tables............................................................................. 385
Creating logical tables ............................................................... 388Defining logical table sizes................................................... 388Defining the primary key for a table ..................................... 391
Creating logical views ................................................................ 392
Logical view examples............................................................... 394Business case 1: Distinct attribute lookup table................... 394Business case 2: Attribute form expression across multiple tables...................................................................... 396Business case 3: Slowly changing dimensions.................... 397Business case 4: One-to-many transformation tables ......... 407Business case 5: Outer joins between attribute lookup tables ................................................................................... 408
C. Data Types Introduction.............................................................................. 413Mapping of external data types to MicroStrategy data types..... 413
MicroStrategy data types ........................................................... 432
Format types.............................................................................. 433
Data type and format type compatibility..................................... 434Supporting the BLOB format type........................................ 435
Big Decimal................................................................................ 436Using the Big Decimal data type.......................................... 436
MicroStrategy support for binary data types .............................. 437
Supporting barcode data with VarChar...................................... 438
Glossary ................................................................................... 441
Index ......................................................................................... 467

Contents Project Design Guide
xii © 2010 MicroStrategy, Inc.

© 2010 MicroStrategy, Inc. xiii
PREFACE
Description of guide
The MicroStrategy Project Design Guide provides comprehensive information on planning, creating, and modifying a project in MicroStrategy and covers a wide range of project-related topics, including the following:
• Chapter 1, BI Architecture and the MicroStrategy Platform, provides a brief introduction to business intelligence architecture and some of the main components within the MicroStrategy platform.
• Chapter 2, The Logical Data Model, explores logical data modeling and how it can help you identify the different elements within your business data and plan your project.
• Chapter 3, Warehouse Structure for Your Logical Data Model, describes components of the physical warehouse schema such as columns and tables and explores how you can map components from the logical data model to components in the database to form the physical warehouse schema.
• Chapter 4, Creating and Configuring a Project, describes the major components involved in project creation and guides you through the process of creating a project in MicroStrategy.
• Chapter 5, Creating a Project Using Architect, guides you through the process of creating a project in MicroStrategy using Architect.
• Chapter 6, The Building Blocks of Business Data: Facts, describes the structure of facts and explores different types of facts and how they relate to your business data. This chapter also covers all the steps necessary to create facts for your project.

Preface Project Design Guide
xiv About this book © 2010 MicroStrategy, Inc.
• Chapter 7, The Context of Your Business Data: Attributes, provides a conceptual look at the structure of attributes and explores different types of attributes and how they relate to your business data. This chapter also covers all the steps necessary to create attributes for your project.
• Chapter 8, Creating Hierarchies to Organize and Browse Attributes, discusses the different types of hierarchies in MicroStrategy, and explains how you can create user hierarchies to help organize and enhance your project.
• Chapter 9, Optimizing and Maintaining Your Project, describes methods you can implement to better optimize and maintain your project for both the short and long term.
• Chapter 10, Creating Transformations to Define Time-Based and Other Comparisons, discusses the different types of transformations in MicroStrategy and describes how you can create transformations in your project.
The appendixes contain the following additional reference information, which you may or may not require depending on your specific needs:
• Appendix A, MicroStrategy Tutorial, provides information on the MicroStrategy Tutorial project, which includes a metadata and warehouse, and a set of demonstration applications designed to illustrate the features of the MicroStrategy platform.
• Appendix B, Logical Tables, discusses logical tables, the different types of logical tables, and how to create logical tables and views in MicroStrategy.
• Appendix C, Data Types, provides information about the different data types in MicroStrategy.
Information on integrating MicroStrategy with your MDX Cube sources such as SAP BW, Microsoft Analysis Services, and Hyperion Essbase is provided in the MicroStrategy MDX Cube Reporting Guide.
About this bookThis book is divided into chapters that begin with a brief overview of the chapter’s content.

Project Design Guide Preface
© 2010 MicroStrategy, Inc. About this book xv
The following sections provide the location of additional examples, list prerequisites for using this book, and describe the user roles the information in this book was designed for.
Dates in the MicroStrategy Tutorial project are updated to reflect the current year. The sample documents and images in this guide, as well as the procedures, were created with dates that may no longer be available in the Tutorial project. Replace them with the first year of data in your Tutorial project.
How to find business scenarios and examples
Within this guide, many of the concepts discussed are accompanied by business scenarios or other descriptive examples. For examples of reporting functionality, see the MicroStrategy Tutorial, which is MicroStrategy’s sample warehouse, metadata, and project. Information about the MicroStrategy Tutorial can be found in the MicroStrategy Basic Reporting Guide.
Detailed examples of advanced reporting functionality can be found in the MicroStrategy Advanced Reporting Guide.
Other examples in this book use the Analytics Modules, which include a set of sample reports, each from a different business area. Sample reports present data for analysis in such business areas as financial reporting, human resources, and customer analysis.
What’s new in this guide
MicroStrategy 9.0.2
• Steps on how to switch the primary database instance for a table in a project (see Importing tables as part of the project’s primary database instance, page 339).
• Documentation has been updated to reflect the changes to the Architect interface. These changes include a new ribbon-style toolbar, as well as other enhancements (see Chapter 5, Creating a Project Using Architect).

Preface Project Design Guide
xvi About this book © 2010 MicroStrategy, Inc.
• Information on how to use the new read only mode for schema editors, which lets you view schema objects without locking the project schema (see Using read only or edit mode for schema editors, page 93).
• Information on how to use the Import Data feature to include personalized data into a project or create proof-of-concept environments:
Storing and analyzing data with alternative data sources, page 6.
Strategies to include supplemental data in a project, page 70.
MicroStrategy 9.0.1m
• Documentation on supporting the Map widget and Geo location for MicroStrategy Mobile (see Supporting the Map widget and Geo Location for MicroStrategy Mobile, page 64).
• Documentation on supporting barcode data for use with MicroStrategy Mobile (see Supporting barcode data with VarChar, page 438).
MicroStrategy 9.0.1
• New options available in MicroStrategy Architect to create and modify a project:
Creating metrics based on the facts of a project, page 109
Automatically defining attribute relationships, page 111
• Documentation on MicroStrategy’s support for parameterized queries, which can improve performance in scenarios, such as MultiSource Option, that require the insert of information into a database (see Improving database insert performance: parameterized queries, page 341).
• A new option lets to remove tables, that have been removed from their data source, from the tables included in a MicroStrategy project. This new option is described in the following sections:
To remove these tables using MicroStrategy Architect, see Removing tables from a project that have been removed from a data source, page 123.
To remove these tables using the Warehouse Catalog, see Removing tables from the Warehouse Catalog that have been removed from their data source, page 314.

Project Design Guide Preface
© 2010 MicroStrategy, Inc. About this book xvii
MicroStrategy 9.0
• Create a project using the new, intuitive design tool called Architect. Architect lets you perform project design and object creation tasks in one interface (see Creating a Project Using Architect, page 99.)
• Internationalize your projects to support your language-specific user communities (see Supporting data internationalization, page 57.)
• Define how attribute forms are displayed by taking advantage of new attribute form properties (see Displaying forms: Attribute form properties, page 238.)
• Connect a project to multiple relational data sources using MultiSource Option (see Accessing multiple data sources in a project, page 330.)
Prerequisites
Before working with this document, you should be familiar with:
• The information provided in the MicroStrategy Installation and Configuration Guide
• The nature and structure of the data you want to use for your business intelligence application
Who should use this guide
This document is designed for all users who require an understanding of how to design, create, and modify a MicroStrategy project using the MicroStrategy platform.
In short, the following business intelligence application users should read this guide:
• Project Designers
• Database Administrators

Preface Project Design Guide
xviii Resources © 2010 MicroStrategy, Inc.
Resources
Documentation
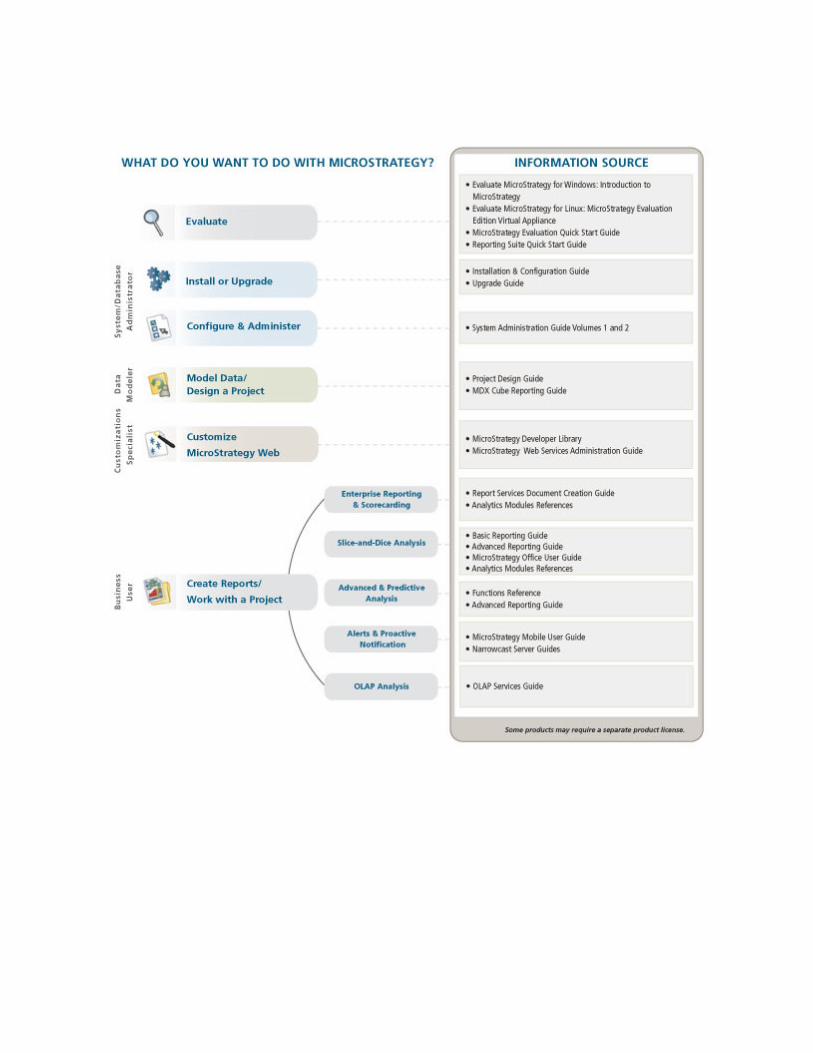
MicroStrategy provides both manuals and online help; these two information sources provide different types of information, as described below.
Manuals: In general, MicroStrategy manuals provide:
• Introductory information and concepts
• Examples
• Checklists and high-level procedures to get started
Help: In general, MicroStrategy help provides:
• Detailed steps to perform procedures
• Descriptions of each option on every software screen
Manuals
The following manuals are available from your MicroStrategy disk or the machine where MicroStrategy was installed. The steps to access them are below.
Adobe Acrobat Reader is required to view these manuals. If you do not have Acrobat Reader installed on your computer, you can download it from www.adobe.com/products/acrobat/readstep2_allversions.html.
The best place for all users to begin is with the MicroStrategy Basic Reporting Guide.
MicroStrategy Overview
• Introduction to MicroStrategy: Evaluation Guide
Instructions for installing, configuring, and using the MicroStrategy Evaluation Edition of the software. This guide also includes a detailed, step-by-step evaluation process of MicroStrategy features, where you

Project Design Guide Preface
© 2010 MicroStrategy, Inc. Resources xix
perform reporting with the MicroStrategy Tutorial project and its sample business data.
• MicroStrategy Quick Start Guide
Overview of the installation and evaluation process, and additional resources.
• Evaluate MicroStrategy for Linux Guide
Evaluate MicroStrategy for Linux, in a Microsoft Windows or Linux environment, with the MicroStrategy Evaluation Edition Virtual Appliance. This guide provides all details to download, activate, and evaluate MicroStrategy software running in a Linux environment.
• MicroStrategy Reporting Suite Quick Start Guide
Evaluate MicroStrategy as a departmental solution. Provides detailed information to download, install, configure, and use the MicroStrategy Reporting Suite.
• MicroStrategy Jump-Start Project Guide
Create a starter Business Intelligence project with pre-built reports and dashboards available with the Jump-Start project. This project can also be used to create proof-of-concept projects using your own data.
Manuals for Query, Reporting, and Analysis
• MicroStrategy Installation and Configuration Guide
Information to install and configure MicroStrategy products on Windows, UNIX, Linux, and HP platforms, as well as basic maintenance guidelines.
• MicroStrategy Upgrade Guide
Instructions to upgrade existing MicroStrategy products.
• MicroStrategy Project Design Guide
Information to create and modify MicroStrategy projects, and understand facts, attributes, hierarchies, transformations, advanced schemas, and project optimization.

Preface Project Design Guide
xx Resources © 2010 MicroStrategy, Inc.
• MicroStrategy Basic Reporting Guide
Instructions to get started with MicroStrategy Desktop and MicroStrategy Web, and how to analyze data in a report. Includes the basics for creating reports, metrics, filters, and prompts.
• MicroStrategy Advanced Reporting Guide
Instructions for advanced topics in the MicroStrategy system, building on information in the Basic Reporting Guide. Topics include reports, Freeform SQL reports, Query Builder reports, filters, metrics, Data Mining Services, custom groups, consolidations, and prompts.
• MicroStrategy Report Services Document Creation Guide
Instructions to design and create Report Services documents, building on information in the Basic Reporting Guide and Advanced Reporting Guide.
• MicroStrategy OLAP Services Guide
Information on MicroStrategy OLAP Services, which is an extension of MicroStrategy Intelligence Server. OLAP Services features include Intelligent Cubes, derived metrics, derived elements, dynamic aggregation, view filters, and dynamic sourcing.
• MicroStrategy Office User Guide
Instructions for using MicroStrategy Office to work with MicroStrategy reports and documents in Microsoft® Excel, PowerPoint, Word, and Outlook, to analyze, format, and distribute business data.
• MicroStrategy Mobile User Guide
Instructions for using MicroStrategy Mobile to view and analyze data, and perform other business tasks with MicroStrategy reports and documents on a mobile device. Covers installation and configuration of MicroStrategy Mobile and how a designer working in MicroStrategy Desktop or MicroStrategy Web can create effective reports and documents for use with MicroStrategy Mobile.
• MicroStrategy System Administration Guide Volume 1
Concepts and high-level steps to implement, deploy, maintain, tune, and troubleshoot a MicroStrategy business intelligence system.
• MicroStrategy System Administration Guide Volume 2
Concepts and high-level steps for using various administrative tools such as MicroStrategy Command Manager, MicroStrategy Enterprise

Project Design Guide Preface
© 2010 MicroStrategy, Inc. Resources xxi
Manager, MicroStrategy Integrity Manager, and MicroStrategy Health Center.
• MicroStrategy Functions Reference
Function syntax and formula components; instructions to use functions in metrics, filters, attribute forms; examples of functions in business scenarios.
• MicroStrategy MDX Cube Reporting Guide
Information to integrate MicroStrategy with MDX cube sources. You can integrate data from MDX cube sources such as SAP BW, Microsoft Analysis Services, and Hyperion Essbase into your MicroStrategy projects and applications.
• MicroStrategy Web Services Administration Guide
Concepts and tasks to install, configure, tune, and troubleshoot MicroStrategy Web Services.
Manuals for Analytics Modules
• Analytics Modules Installation and Porting Guide
• Customer Analysis Module Reference
• Sales Force Analysis Module Reference
• Financial Reporting Analysis Module Reference
• Sales and Distribution Analysis Module Reference
• Human Resources Analysis Module Reference
Manuals for Information Delivery and Alerting Products
• MicroStrategy Narrowcast Server Getting Started Guide
Instructions to work with the tutorial to learn Narrowcast Server interfaces and features.
• MicroStrategy Narrowcast Server Installation and Configuration Guide
Information to install and configure Narrowcast Server.
• MicroStrategy Narrowcast Server Application Designer Guide
Fundamentals of designing Narrowcast Server applications.

Preface Project Design Guide
xxii Resources © 2010 MicroStrategy, Inc.
• MicroStrategy Narrowcast Server System Administrator Guide
Concepts and high-level steps to implement, maintain, tune, and troubleshoot Narrowcast Server.
• MicroStrategy Narrowcast Server Upgrade Guide
Instructions to upgrade an existing Narrowcast Server.
Software Development Kits
• MicroStrategy Developer Library (MSDL)
Information to understand the MicroStrategy SDK, including details about architecture, object models, customization scenarios, code samples, and so on.
• MicroStrategy Web SDK
The Web SDK is available in the MicroStrategy Developer Library, which is sold as part of the MicroStrategy SDK.
• Narrowcast Server SDK Guide
Instructions to customize Narrowcast Server functionality, integrate Narrowcast Server with other systems, and embed Narrowcast Server functionality within other applications. Documents the Narrowcast Server Delivery Engine and Subscription Portal APIs, and the Narrowcast Server SPI.
To access the installed manuals and other documentation sources, see the following procedures:
• To access installed manuals on Windows, page xxii
• To access installed manuals on UNIX and Linux, page xxiii
To access installed manuals on Windows
1 From the Windows Start menu, choose Programs (or All Programs), MicroStrategy, then Product Manuals. A page opens in your browser showing a list of available manuals in PDF format and other documentation sources.
2 Click the link for the desired manual or other documentation source.
Project Design Guide Preface
© 2010 MicroStrategy, Inc. Resources xxiii
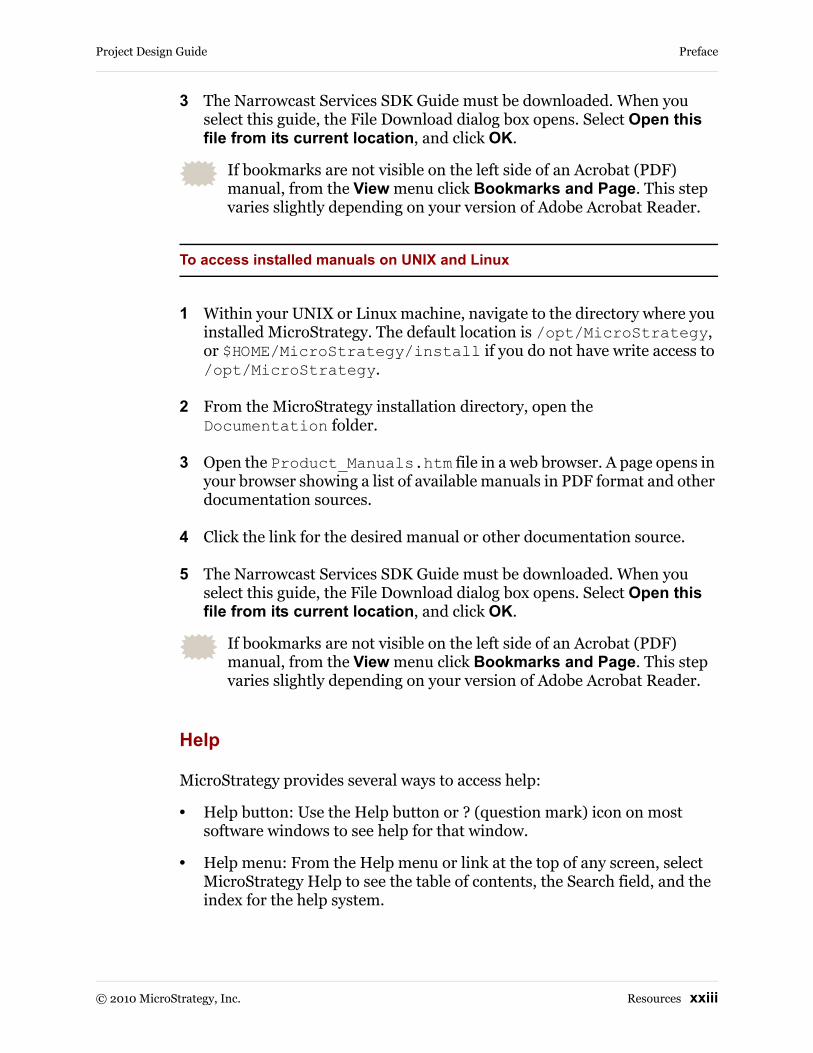
3 The Narrowcast Services SDK Guide must be downloaded. When you select this guide, the File Download dialog box opens. Select Open this file from its current location, and click OK.
If bookmarks are not visible on the left side of an Acrobat (PDF) manual, from the View menu click Bookmarks and Page. This step varies slightly depending on your version of Adobe Acrobat Reader.
To access installed manuals on UNIX and Linux
1 Within your UNIX or Linux machine, navigate to the directory where you installed MicroStrategy. The default location is /opt/MicroStrategy, or $HOME/MicroStrategy/install if you do not have write access to /opt/MicroStrategy.
2 From the MicroStrategy installation directory, open the Documentation folder.
3 Open the Product_Manuals.htm file in a web browser. A page opens in your browser showing a list of available manuals in PDF format and other documentation sources.
4 Click the link for the desired manual or other documentation source.
5 The Narrowcast Services SDK Guide must be downloaded. When you select this guide, the File Download dialog box opens. Select Open this file from its current location, and click OK.
If bookmarks are not visible on the left side of an Acrobat (PDF) manual, from the View menu click Bookmarks and Page. This step varies slightly depending on your version of Adobe Acrobat Reader.
Help
MicroStrategy provides several ways to access help:
• Help button: Use the Help button or ? (question mark) icon on most software windows to see help for that window.
• Help menu: From the Help menu or link at the top of any screen, select MicroStrategy Help to see the table of contents, the Search field, and the index for the help system.

Preface Project Design Guide
xxiv Resources © 2010 MicroStrategy, Inc.
• F1 key: Press F1 to see context-sensitive help that describes each option in the software window you are currently viewing.
Documentation standards
MicroStrategy online help and PDF manuals (available both online and in printed format) use standards to help you identify certain types of content. The following table lists these standards.
These standards may differ depending on the language of this manual; some languages have rules that supersede the table below.
Type Indicates
bold • Button names, check boxes, options, lists, and menus that are the focus of actions or part of a list of such GUI elements and their definitions
• Text to be entered by the userExample: Click Select Warehouse.Example: Type cmdmgr -f scriptfile.scp and press ENTER.
italic • New terms defined within the text and in the glossary• Names of other product manuals• When part of a command syntax, indicates variable information to be replaced by the
userExample: The aggregation level is the level of calculation for the metric.Example: Type copy c:\filename d:\foldername\filename
Courier font
• Calculations• Code samples• Registry keys• Path and file names• URLs• Messages displayed in the screen
Example: Sum(revenue)/number of months.
+ A keyboard command that calls for the use of more than one key (for example, SHIFT+F1)
A note icon indicates helpful information for specific situations.
A warning icon alerts you to important information such as potential security risks; these should be read before continuing.

Project Design Guide Preface
© 2010 MicroStrategy, Inc. Resources xxv
Education
MicroStrategy Education Services provides a comprehensive curriculum and highly skilled education consultants. Many customers and partners from over 800 different organizations have benefited from MicroStrategy instruction.
Courses that can help you prepare for using this manual or that address some of the information in this manual include:
• MicroStrategy Architect: Project Design Essentials
For the most up-to-date and detailed description of education offerings and course curricula, visit www.microstrategy.com/Education.
Consulting
MicroStrategy Consulting Services provides proven methods for delivering leading-edge technology solutions. Offerings include complex security architecture designs, performance and tuning, project and testing strategies and recommendations, strategic planning, and more. For a detailed description of consulting offerings, visit www.microstrategy.com/Consulting.
International support
MicroStrategy supports several locales. Support for a locale typically includes native database and operating system support, support for date formats, numeric formats, currency symbols, and more. It also includes the availability of translated interfaces and documentation. The level of support is defined in terms of the components of a MicroStrategy business intelligence environment. A MicroStrategy business intelligence environment consists of the following components, collectively known as a configuration:
• Warehouse, metadata, and statistics databases
• MicroStrategy Intelligence Server
• MicroStrategy Web server

Preface Project Design Guide
xxvi Resources © 2010 MicroStrategy, Inc.
• MicroStrategy Desktop client
• Web browser
MicroStrategy is certified in homogeneous configurations (where all the components lie in the same locale) in the following languages: English (US), French, German, Italian, Japanese, Korean, Portuguese (Brazilian), Spanish, Chinese (Simplified), Chinese (Traditional), Danish, and Swedish.
MicroStrategy also provides limited support for heterogeneous configurations (where some of the components may lie in different locales). Please contact MicroStrategy Technical Support for more details.
A translated user interface is available in each of the above languages. In addition, translated versions of the online help files and product documentation are available in several of the above languages.
Technical Support
If you have questions about a specific MicroStrategy product, you should:
1 Consult the product guides, Help, and readme files. Locations to access each are described above.
2 Consult the MicroStrategy Knowledge Base online at https://resource.microstrategy.com/support.
A technical administrator in your organization may be able to help you resolve your issues immediately.
3 If the resources listed in the steps above do not provide a solution, contact MicroStrategy Technical Support directly. To ensure the most productive relationship with MicroStrategy Technical Support, review the Policies and Procedures document in your language, posted at http://www.microstrategy.com/Support/ Policies. Refer to the terms of your purchase agreement to determine the type of support available to you.
MicroStrategy Technical Support can be contacted by your company’s Support Liaison. A Support Liaison is a person whom your company has designated as a point-of-contact with MicroStrategy’s support personnel. All customer inquiries and case communications must come through these

Project Design Guide Preface
© 2010 MicroStrategy, Inc. Resources xxvii
named individuals. Your company may designate two employees to serve as their Support Liaisons, and can request to change their Support Liaisons two times per year with prior written notice to MicroStrategy Technical Support.
It is recommended that you designate Support Liaisons who have MicroStrategy Administrator privileges. This can eliminate security conflicts and improve case resolution time. When troubleshooting and researching issues, MicroStrategy Technical Support personnel may make recommendations that require administrative privileges within MicroStrategy, or that assume that the designated Support Liaison has a security level that permits them to fully manipulate the MicroStrategy projects and has access to potentially sensitive project data such as security filter definitions.
Ensure issues are resolved quickly
Before logging a case with MicroStrategy Technical Support, the Support Liaison may follow the steps below to ensure that issues are resolved quickly:
1 Verify that the issue is with MicroStrategy software and not a third party software.
2 Verify that the system is using a currently supported version of MicroStrategy software by checking the Product Support Expiration Schedule at http://www.microstrategy.com/Support/ Expiration.asp.
3 Attempt to reproduce the issue and determine whether it occurs consistently.
4 Minimize the complexity of the system or project object definition to isolate the cause.
5 Determine whether the issue occurs on a local machine or on multiple machines in the customer environment.
6 Discuss the issue with other users by posting a question about the issue on the MicroStrategy Customer Forum at https://resource.microstrategy.com/forum/.
The following table shows where, when, and how to contact MicroStrategy Technical Support. If your Support Liaison is unable to reach MicroStrategy Technical Support by phone during the hours of operation, they can leave a voicemail message, send email or fax, or log a case using the Online Support

Preface Project Design Guide
xxviii Resources © 2010 MicroStrategy, Inc.
Interface. The individual Technical Support Centers are closed on certain public holidays.
North America Email: [email protected] Web: https://resource.microstrategy.com/support Fax: (703) 842–8709 Phone: (703) 848–8700 Hours: 9:00 A.M.–7:00 P.M. Eastern Time, Monday–Friday except holidays
EMEA:EuropeThe Middle EastAfrica
Email: [email protected] Web: https://resource.microstrategy.com/support Fax: +44 (0) 208 711 2525 The European Technical Support Centre is closed on national public holidays in each country.Phone:
• Belgium: + 32 2792 0436• France: +33 17 099 4737• Germany: +49 22 16501 0609• Ireland: +353 1436 0916• Italy: +39 023626 9668• Poland: +48 22 321 8680• Scandinavia & Finland: +46 8505 20421• Spain: +34 91788 9852• The Netherlands: +31 20 794 8425• UK: +44 (0) 208 080 2182• International distributors: +44 (0) 208 080 2183
Hours:• United Kingdom: 9:00 A.M.–6:00 P.M. GMT, Monday-Friday except holidays• EMEA (except UK): 9:00 A.M.–6:00 P.M. CET, Monday-Friday except holidays
Asia Pacific Email: [email protected] Web: https://resource.microstrategy.com/support Phone:
• Australia: +61 2 9333 6499• Korea: +82 2 560 6565 Fax: +82 2 560 6555• Japan: +81 3 3511 6720 Fax: +81 3 3511 6740• Singapore: +65 6303 8969 Fax: +65 6303 8999• Asia Pacific (except Australia, Japan, Korea, and Singapore): +86 571 8526 8067 Fax: +86
571 8848 0977Hours:
• Japan and Korea: 9:00 A.M.–6:00 P.M. JST (Tokyo), Monday-Friday except holidays• Asia Pacific (except Japan and Korea): 7 A.M.-6 P.M. (Singapore) Monday-Friday except
holidays
Latin America Email: [email protected] Web: https://resource.microstrategy.com/support Phone:
• LATAM (except Brazil and Argentina): +54 11 5222 9360 Fax: +54 11 5222 9355• Argentina: 0 800 444 MSTR Fax: +54 11 5222 9355• Brazil: +55 11 3054 1010 Fax: +55 11 3044 4088
Hours: • Latin America (except Brazil): 9:00 A.M.–7:00 P.M. (Buenos Aires), Monday-Friday except
holidays • Brazil: 9 A.M. - 6 P.M. (São Paulo), Monday–Friday except holidays

Project Design Guide Preface
© 2010 MicroStrategy, Inc. Resources xxix
Support Liaisons should contact the Technical Support Center from which they obtained their MicroStrategy software licenses or the Technical Support Center to which they have been designated.
Required information when calling
When contacting MicroStrategy Technical Support, please provide the following information:
• Personal information:
Name (first and last)
Company and customer site (if different from company)
Contact information (phone and fax numbers, e-mail addresses)
• Case details:
Configuration information, including MicroStrategy software product(s) and versions
Full description of the case including symptoms, error messages(s), and steps taken to troubleshoot the case thus far
• Business/system impact
If this is the Support Liaison’s first call, they should also be prepared to provide the following:
• Street address
• Phone number
• Fax number
• Email address
To help the Technical Support representative resolve the problem promptly and effectively, be prepared to provide the following additional information:
• Case number: Please keep a record of the number assigned to each case logged with MicroStrategy Technical Support, and be ready to provide it when inquiring about an existing case
• Software version and product registration numbers of the MicroStrategy software products you are using

Preface Project Design Guide
xxx Resources © 2010 MicroStrategy, Inc.
• Case description:
What causes the condition to occur?
Does the condition occur sporadically or each time a certain action is performed?
Does the condition occur on all machines or just on one?
When did the condition first occur?
What events took place immediately prior to the first occurrence of the condition (for example, a major database load, a database move, or a software upgrade)?
If there was an error message, what was its exact wording?
What steps have you taken to isolate and resolve the issue? What were the results?
• System configuration (the information needed depends on the nature of the problem; not all items listed below may be necessary):
Computer hardware specifications (processor speed, RAM, disk space, and so on)
Network protocol used
ODBC driver manufacturer and version
Database gateway software version
(For MicroStrategy Web-related problems) browser manufacturer and version
(For MicroStrategy Web-related problems) Web server manufacturer and version
If the issue requires additional investigation or testing, the Support Liaison and the MicroStrategy Technical Support representative should agree on certain action items to be performed. The Support Liaison should perform any agreed-upon actions before contacting MicroStrategy Technical Support again regarding the issue. If the Technical Support representative is responsible for an action item, the Support Liaison may call MicroStrategy Technical Support at any time to inquire about the status of the issue.

Project Design Guide Preface
© 2010 MicroStrategy, Inc. Feedback xxxi
FeedbackPlease send any comments or suggestions about user documentation for MicroStrategy products to:
Send suggestions for product enhancements to:
When you provide feedback to us, please include the name and version of the products you are currently using. Your feedback is important to us as we prepare for future releases.

Preface Project Design Guide
xxxii Feedback © 2010 MicroStrategy, Inc.

© 2010 MicroStrategy, Inc. 1
11.BI ARCHITECTURE AND THE MICROSTRATEGY PLATFORM
Introduction
Before planning and creating a project in MicroStrategy, it is important to understand how business intelligence systems work and, specifically, how the MicroStrategy platform interacts with your business data to provide a wide range of functionality.
Business intelligence (BI) systems facilitate the analysis of volumes of complex data by providing the ability to view data from multiple perspectives. An optimum business intelligence application:
• Gives users access to data at various levels of detail
• Allows users to request information and have it delivered to them accurately and quickly
• Provides a foundation for the proactive delivery of information to system subscribers
This chapter introduces you to the basic architecture of BI systems, as well as some of the components within the MicroStrategy platform that allow you to create and analyze your business intelligence.

BI Architecture and the MicroStrategy Platform Project Design Guide1
2 Business intelligence architecture © 2010 MicroStrategy, Inc.
Business intelligence architectureA BI architecture has the following components:
• A source system—typically an online transaction processing (OLTP) system, but other systems or files that capture or hold data of interest are also possible
• An extraction, transformation, and loading (ETL) process
• A data warehouse—typically an online analytical processing (OLAP) system
• A business intelligence platform such as MicroStrategy
The diagram above illustrates the common setup for standardizing data from source systems and transferring that data into MicroStrategy. MicroStrategy can also access data from text files, Excel files, SAP BI, Hyperion Essbase, Microsoft Analysis Services, and other data sources. For more information on how MicroStrategy can access your data sources, see Data warehouse for data storage and relational design, page 4.
Source systems for data collection
Source systems refer to any system or file that captures or holds data of interest. A bank is an example of a business with many source systems. An average bank offers several services such as account activity updates and loan disbursement, and therefore has many source systems to support these services. For example, suppose one source system—a database file on the bank’s server—keeps track of deposits and withdrawals as they occur.

Project Design Guide BI Architecture and the MicroStrategy Platform 1
© 2010 MicroStrategy, Inc. Business intelligence architecture 3
Meanwhile, a different source system—another file on the server—keeps track of each customer’s contact information.
A source system is usually the most significant site of online transaction processing (OLTP). Transactional processing involves the simple recording of transactions and other business data such as sales, inventory, e-commerce, deposits, web site usage, and order processing. This processing is relied upon daily by nearly every industry, including health care, telecommunications, manufacturing, and many others.
OLTP systems are databases or mainframes that store real-time processing data and have the following characteristics:
• Data access is optimized for frequent reading and writing, as the system records huge volumes of data every day. An example of data that benefits from this type of optimization is the number of credit card transactions that an OLTP system might record in a single day. This is in contrast to data warehouses which are often designed for reading data for analysis with a minimum number of updates, insertions, or deletions. For more information on data warehouse design, see Data warehouse for data storage and relational design, page 4.
• Data is aligned by application, that is, by business activities and workflow.
• Data formats are not necessarily uniform across systems.
• Data history is limited to recent or current data.
Recall the example of a bank that relies on several source systems to store data related to the many services the bank offers. Each of these business services has a different and specific workflow.
At an automated teller machine (ATM), you can withdraw or deposit money as well as check on balances. However, to get a money order, you must enter the bank and perform the transaction with a bank teller. This is because the operational systems supporting these two services are designed to perform specific tasks, and these two services require different operational systems.
If a bank wants to see a unified view of a particular customer, such as a customer's ATM activity, loan status, account balances, and money market account information, the customer information stored in each of these different systems must be consolidated. This consolidation is achieved using the extraction, transformation, and loading (ETL) process.

BI Architecture and the MicroStrategy Platform Project Design Guide1
4 Business intelligence architecture © 2010 MicroStrategy, Inc.
The ETL process consolidates data so it can be stored in a data warehouse.
Extraction, transformation, and loading process
The extraction, transformation, and loading (ETL) process represents all the steps necessary to move data from different source systems to an integrated data warehouse.
The ETL process involves the following steps:
1 Data is gathered from various source systems.
2 The data is transformed and prepared to be loaded into the data warehouse. Transformation procedures can include converting data types and names, eliminating unwanted data, correcting typographical errors, filling in incomplete data, and similar processes to standardize the format and structure of data.
3 The data is loaded into the data warehouse.
This process can be explained with the example of a bank that wants to consolidate a variety of information about a particular customer, including the customer's ATM activity, loan status, and account balances. Each of these different sets of data is likely gathered by different source systems. Since each source system can have its own naming conventions, the data that comes from one system may be inconsistent with the data that comes from another system.
In this case, the ETL process extracts the data from the different banking source systems, transforms it until it is standardized and consistent, and then loads the data into the data warehouse.
Data warehouse for data storage and relational design
A well-designed and robust data warehouse is the source of data for the decision support system or business intelligence system. It enables its users to leverage the competitive advantage that the business intelligence provides. Data warehouses are usually based on relational databases or some form of relational database management system (RDBMS) platform. These relational databases can be queried directly with Structured Query Language (SQL), a language developed specifically to interact with RDBMS software. However, MicroStrategy does not require that data be stored in a

Project Design Guide BI Architecture and the MicroStrategy Platform 1
© 2010 MicroStrategy, Inc. Business intelligence architecture 5
relational database. You can integrate different types of data sources with MicroStrategy such as text files, Excel files, and MDX Cubes. For more information on accessing data stored in alternative data sources, see Storing and analyzing data with alternative data sources, page 6.
The source systems described above, such as OLTP systems, are generally designed and optimized for transactional processing, whereas data warehouses are usually designed and optimized for analytical processing. In combination with MicroStrategy tools and products, the data warehouse also provides the foundation for a robust online analytical processing (OLAP) system. Analytical processing involves activities such as choosing to see sales data by month and selecting the applicable metric to calculate sales trends, growth patterns, percent-to-total contributions, trend reporting, and profit analysis.
Most data warehouses have the following characteristics:
• Data access is typically read-only. The most common action is the selection of data for analysis. Data is rarely inserted, updated, or deleted. This is in contrast to most OLTP source systems which must be able to handle frequent updates as data is gathered. For more information on source systems, see Source systems for data collection, page 2.
• Data is aligned by business subjects.
• Data formats are uniformly integrated using an ETL process (see Extraction, transformation, and loading process, page 4).
• Data history extends long-term, usually two to five years.
• A data warehouse is populated with data from the existing operational systems using an ETL process, as explained in Extraction, transformation, and loading process, page 4.
The structure of data in a data warehouse and how it relates to your MicroStrategy environment can be defined and understood through a logical data model and physical warehouse schema. Defining a project’s logical data model and physical warehouse schema are important steps in preparing your data for a MicroStrategy project. For more information on the steps of the project design process, see Chapter 2, The Logical Data Model and Chapter 3, Warehouse Structure for Your Logical Data Model.

BI Architecture and the MicroStrategy Platform Project Design Guide1
6 Business intelligence architecture © 2010 MicroStrategy, Inc.
Storing and analyzing data with alternative data sources
Along with integrating with relational databases, which are a common type of data warehouse, MicroStrategy can also integrate with a number of alternative data sources. A data source is any file, system, or storage location which stores data that is to be used in MicroStrategy for query, reporting, and analysis. A data warehouse can be thought of as one type of data source, and refers specifically to using a database as your data source.
The following are different data source alternatives which MicroStrategy can integrate with:
• MDX Cube sources: In MicroStrategy you can integrate with sets of data from SAP BW, Microsoft Analysis Services, Hyperion Essbase, and IBM Cognos TM1, which are referred to as MDX Cube sources. MicroStrategy can integrate with these data sources while simultaneously accessing a relational database effectively. For more information on connecting to and integrating MDX Cube sources in MicroStrategy, see the MicroStrategy MDX Cube Reporting Guide.
• Text files and Excel files: With MicroStrategy’s Freeform SQL and Query Builder features, you can query, analyze, and report on data stored in text files and Excel files. As with MDX Cube sources described above, MicroStrategy can report against these alternative data sources while concurrently accessing a relational database to integrate all of your data into one cohesive project. For more information on using text files and Excel files with the Freeform SQL and Query Builder features, see the MicroStrategy Advanced Reporting Guide.
Additionally, the Import Data feature lets you use MicroStrategy Web to import data from different data sources, such as an Excel file, a table in a database, or the results of a SQL query, with minimum project design requirements. For more information on how Import Data can be used to integrate data from various data sources into your project, see Strategies to include supplemental data in a project, page 70.
For more information on how to use the Import Data feature, refer to the MicroStrategy Web online help.

Project Design Guide BI Architecture and the MicroStrategy Platform 1
© 2010 MicroStrategy, Inc. The MicroStrategy platform 7
The MicroStrategy platformA business intelligence platform offers a complete set of tools for the creation, deployment, support, and maintenance of business intelligence applications. Some of the main components of the MicroStrategy platform include:
• MicroStrategy metadata, page 8—a repository that stores MicroStrategy object definitions and information about the data warehouse
• MicroStrategy Intelligence Server, page 10—an analytical server optimized for enterprise querying, reporting, and OLAP analysis
• MicroStrategy Desktop, page 11—an advanced, Windows-based environment providing a complete range of analytical functions designed to facilitate the deployment of reports
• MicroStrategy Web and Web Universal, page 12—a highly interactive user environment and a low-maintenance interface for reporting and analysis
• MicroStrategy project, page 13—where you build and store all schema objects and information you need to create application objects such as reports in the MicroStrategy environment, which together provide a flexible reporting environment
• MicroStrategy Architect, page 14—a project design tool, which allows you to define all the required components of your project from a centralized interface.

BI Architecture and the MicroStrategy Platform Project Design Guide1
8 The MicroStrategy platform © 2010 MicroStrategy, Inc.
The MicroStrategy platform components work together to provide an analysis and reporting environment to your user community, as shown in the following diagram.
The sections that follow provide a brief overview of each of these components. For more detailed information about these and the other components that make up the MicroStrategy platform, refer to the MicroStrategy Installation and Configuration Guide. To learn how to administer and tune the MicroStrategy platform, see the MicroStrategy System Administration Guide.
MicroStrategy metadata
MicroStrategy metadata is a repository that stores MicroStrategy object definitions and information about your data warehouse. The information is stored in a proprietary format within a relational database. The metadata maps MicroStrategy objects—which are used to build reports and analyze data—to your data warehouse structures and data. The metadata also stores the definitions of all objects created with MicroStrategy Desktop and Web such as templates, reports, metrics, facts, and so on.

Project Design Guide BI Architecture and the MicroStrategy Platform 1
© 2010 MicroStrategy, Inc. The MicroStrategy platform 9
In general, report creation in MicroStrategy is achieved through using various types of objects which represent your data as report building blocks. You can build and manipulate several fundamentally different kinds of objects in MicroStrategy; these objects, which are described below, are all created and stored in the metadata repository.
• Configuration objects—Objects that provide important information or governing parameters for connectivity, user privileges, and project administration. Examples include database instances, users, groups, and so on. These objects are not used directly for reporting, but are created by a project architect or administrator to configure and govern the platform. As a general rule, configuration objects are created and maintained with the managers in MicroStrategy Desktop within the Administration icon. For more information about creating and administering configuration objects, see the MicroStrategy System Administration Guide.
• Schema objects—Objects that are created in the application to correspond to database objects, such as tables, views, and columns. Schema objects include facts, attributes, hierarchies, and other objects which are stored in the Schema Objects folder in MicroStrategy Desktop’s folder list. Facts, attributes, and hierarchies are three essential pieces to any business intelligence application. These schema objects are often created and managed by a MicroStrategy architect:
Facts relate numeric data values from the data warehouse to the MicroStrategy reporting environment. Facts are used to create metrics, which are analytical calculations that are displayed on a report. The number of units sold is one example of a fact. Facts are discussed in more detail in Chapter 6, The Building Blocks of Business Data: Facts.
Attributes represent the business context in which fact data is relevant. In the example of regional sales in the Southeast, Southeast represents the attribute or context of the sales data. Attributes are used to define the level at which you want to view the numeric data on a report. Attributes are discussed in more detail in Chapter 7, The Context of Your Business Data: Attributes.
Hierarchies are groupings of attributes so that they can be displayed to reflect their relationships to other attributes. These groupings can help users make logical connections between attributes when reporting and analyzing data. One of the most common examples of a hierarchy is a time hierarchy which includes attributes such as Year, Month, Quarter, and so on. Hierarchies are discussed in more detail in Chapter 8, Creating Hierarchies to Organize and Browse Attributes.

BI Architecture and the MicroStrategy Platform Project Design Guide1
10 The MicroStrategy platform © 2010 MicroStrategy, Inc.
• Application objects—Objects used to provide analysis of and insight into relevant data. Application objects include reports, documents, filters, templates, custom groups, metrics, and prompts. Application objects are created using schema objects as building blocks. All application objects can be created and maintained in MicroStrategy Desktop. Reports and documents can also be created and managed in MicroStrategy Web. Information on creating application objects is in the MicroStrategy Basic Reporting Guide and MicroStrategy Advanced Reporting Guide.
For more information about MicroStrategy Web, see MicroStrategy Web and Web Universal, page 12.
The metadata enables the sharing of objects across MicroStrategy applications by providing a central repository for all object definitions. MicroStrategy Intelligence Server evaluates the most efficient data retrieval scenario to provide excellent query performance.
MicroStrategy metadata also facilitates the retrieval of data from the data warehouse when using MicroStrategy applications. It converts user requests into SQL queries and translates the results of those SQL queries back into MicroStrategy objects such as reports and documents which can be easily analyzed and understood.
MicroStrategy Intelligence Server
MicroStrategy Intelligence Server is an analytical server optimized for enterprise querying, reporting, and OLAP analysis. The important functions of MicroStrategy Intelligence Server are:
• Sharing objects
• Sharing data
• Managing the sharing of data and objects in a controlled and secure environment
• Protecting the information in the metadata
MicroStrategy Intelligence Server also provides a library of over 150 different sophisticated mathematical and statistical functions. You can also add and define your own functions. See the MicroStrategy Functions Reference for details about these functions.

Project Design Guide BI Architecture and the MicroStrategy Platform 1
© 2010 MicroStrategy, Inc. The MicroStrategy platform 11
For information on how to install and configure MicroStrategy Intelligence Server, refer to the MicroStrategy Installation and Configuration Guide. For a detailed description of MicroStrategy Intelligence Server functionality and tuning recommendations, refer to the MicroStrategy System Administration Guide.
MicroStrategy Desktop
MicroStrategy Desktop is an advanced, Windows-based environment providing a complete range of analytical functionality designed to facilitate the deployment of reports. MicroStrategy Desktop provides the project designer functionality essential to creating both schema and application objects necessary to serve the user communities of both MicroStrategy Desktop and Web.
Desktop enables you to model applications using an intuitive, graphical interface. It provides a unified environment for creating and maintaining business intelligence projects. If you need to change how to view your business information or how the data is modeled, Desktop provides the ability to modify one aspect of the application without affecting the others.
Desktop is where you can manage application objects such as reports, filters, and metrics. However, before application objects are created, schema objects must first exist. Schema objects allow application objects to interact with the data warehouse to access the data for analysis. Facts, attributes, hierarchies, and other schema objects are the building blocks for application objects such as reports and documents. For example, facts are used to create metrics, which are in turn used to design reports. Application objects such as reports are used to analyze and provide insight into the relevant data.
One of the other functions of MicroStrategy Desktop is to create projects. Projects are discussed in Chapter 4, Creating and Configuring a Project.
The following examples highlight some ways in which Desktop allows you to model your business intelligence applications:
• Every report or query can automatically benefit from the tables you include in an application. Tables in MicroStrategy are references to tables in your data warehouse, thus providing access to your data.
BI Architecture and the MicroStrategy Platform Project Design Guide1
12 The MicroStrategy platform © 2010 MicroStrategy, Inc.
• You can change the structure of a business hierarchy by re-ordering it. This modification is necessary if you have new requirements that require you to add or remove new levels of data in a hierarchy. The change automatically takes effect in the application, without making any alterations to the database.
After reports have been created, report designers and analysts can deploy them through different interfaces, including MicroStrategy Desktop, MicroStrategy Web, and MicroStrategy Office.
For information about the various components that comprise MicroStrategy Desktop, refer to the MicroStrategy Installation and Configuration Guide.
For more information about creating application objects such as reports in MicroStrategy Desktop, refer to the MicroStrategy Basic Reporting Guide. For information on advanced Desktop functionality, see the MicroStrategy Advanced Reporting Guide.
MicroStrategy Web and Web Universal
MicroStrategy Web provides users with a highly interactive environment and a low-maintenance interface for reporting and analysis. Using the Web interface, users can access, analyze, and share data through any web browser on many operating systems. MicroStrategy Web provides ad-hoc querying, industry-leading analysis, quick deployment, and rapid customization potential, making it easy for users to make informed business decisions.
MicroStrategy Web Universal is a version of MicroStrategy Web that provides the added benefits of also working with:
• Operating systems such as Sun Solaris™, IBM AIX®, Red Hat® Linux®, and HP-UX
• Application servers such as BEA WebLogic™, IBM WebSphere®, Sun ONE®, Oracle®, and Apache Tomcat
• All web servers and browsers supported by MicroStrategy Web
MicroStrategy Intelligence Server must be running for users to retrieve information from your data warehouse using MicroStrategy Web products. For more information about deploying MicroStrategy Web, see the MicroStrategy Installation and Configuration Guide.

Project Design Guide BI Architecture and the MicroStrategy Platform 1
© 2010 MicroStrategy, Inc. The MicroStrategy platform 13
Additional MicroStrategy definitions, including many project-related terms, are discussed in Project connectivity components, page 73.
MicroStrategy project
A project is where you build and store all schema objects and information you need to create application objects such as reports in the MicroStrategy environment, which together provide a flexible reporting environment. A project also represents the intersection of a data source, metadata repository, and user community. In MicroStrategy Desktop, projects appear one level below project sources in the Folder List.
A project:
• Determines the set of data warehouse tables to be used, and therefore the set of data available to be analyzed.
• Contains all schema objects used to interpret the data in those tables. Schema objects include facts, attributes, hierarchies, and so on. Schema objects are discussed in later chapters in this guide.
• Contains all reporting objects used to create reports and analyze the data. Reporting objects include metrics, filters, reports, and so on. Report objects are covered in the MicroStrategy Basic Reporting Guide and the MicroStrategy Advanced Reporting Guide.
• Defines the security scheme for the user community that accesses these objects. Security objects include security filters, security roles, privileges, access control, and so on. Security and other project-level administrative features are discussed in the MicroStrategy System Administration Guide.
A project can contain any number of reports in addition to a number of other objects that support simple and advanced reporting requirements. Conceptually, a project the environment in which all related reporting is done. A project can contain many types of objects, including application objects such as filters, prompts, metrics, and reports that you can create using schema objects such as attributes and facts.
Projects are often used to separate data from a data warehouse into smaller sections of related data that fit user requirements. For example, you may have a project source separated into four different projects with analysis areas such as human resources, sales distribution, inventory, and customer

BI Architecture and the MicroStrategy Platform Project Design Guide1
14 The project design process © 2010 MicroStrategy, Inc.
satisfaction. This allows all of your users in the human resources department to use the human resources project and they do not have to look through inventory data that they are not interested in.
Some key concepts to understand before you begin creating a project are as follows:
• A project is created within a specified metadata repository, determined by the project source through which you create the project.
• The project’s warehouse location is specified by associating it with the appropriate database instance.
The procedures associated with these concepts are explained in Creating a project, page 78.
MicroStrategy Architect
MicroStrategy 9.0 introduces a new project design tool known as Architect. Architect allows you to define all the required components of your project from a centralized interface. Architect also provides a visual representation of your project as you create it, which helps to provide an intuitive workflow. Creating and modifying a project using Architect is covered in Chapter 4, Creating and Configuring a Project and Chapter 5, Creating a Project Using Architect.
The project design processWhen you create a project in MicroStrategy Desktop, one of the connections you create is between the project and your data warehouse. In the project, you can then create schema objects based on the columns and tables in the warehouse. The diagram below shows this high-level view of data modeling,

Project Design Guide BI Architecture and the MicroStrategy Platform 1
© 2010 MicroStrategy, Inc. The project design process 15
schema design and implementation, and project creation, which are each covered in the following chapters:
Notice that the project design process includes a feedback loop. Designing a project is very rarely a single, linear process. As projects are deployed and tested, new user requirements and project enhancements require modification to the initial project design. It is important to keep this in mind as you design your project and plan for the next phase of development.

BI Architecture and the MicroStrategy Platform Project Design Guide1
16 The project design process © 2010 MicroStrategy, Inc.

© 2010 MicroStrategy, Inc. Overview of a logical data model 17
22.THE LOGICAL DATA MODELConceptualizing your business model and the data on which to report
Introduction
Devising a model of your business data can help you analyze the structure of the data, how its various parts interact, and can also help you decide what you intend to learn from the data.
This chapter describes one of the major components of data modeling: the logical data model. A logical data model is a logical arrangement of data as experienced by the general user or business analyst. This is different from the physical data model or warehouse schema, which arranges data for efficient database use. The logical data model graphically depicts the flow and structure of data in a business environment, providing a way of organizing data so it can be analyzed from different business perspectives.
Overview of a logical data modelA logical data model is similar in concept to using a map and an itinerary when going on a trip. You need to know where you are going and how to get there. You also need a plan that is visible and laid out correctly. For example, a simple logical data model for a retail company can organize all necessary

The Logical Data Model Project Design Guide2
18 Overview of a logical data model © 2010 MicroStrategy, Inc.
facts by store, product, and time, which are three common business perspectives typically associated with a retail business.
Logical data models are independent of a physical data storage device. This is the key concept of the logical data model. The reason that a logical data model must be independent of technology is because technology is changing so rapidly. What occurs under the logical data model can change with need or with technology, but the blueprint remains the same, and you do not need to start over completely.
If you are familiar with multidimensional data modeling, logical data modeling is similar to multidimensional data modeling. As the MicroStrategy platform does not require you to define dimensions explicitly, the word logical is a more accurate term than multidimensional. While a multidimensional data model must have at least one dimension, a logical data model may or may not have any explicitly defined dimensions.
The scope and complexity of a logical data model depends on the requirements of the reporting needs of the user community and the availability of source data. The more sophisticated and complex the reporting requirements and source data, the more complex the logical data model becomes.
The logical data modeling process produces a diagram similar to the one shown in the following diagram:

Project Design Guide The Logical Data Model 2
© 2010 MicroStrategy, Inc. Overview of a logical data model 19
A logical data model represents the definition, characteristics, and relationships of data in a technical, conceptual, or business environment. This process can help you think about the various elements that compose your company’s business data and how those elements relate to one another.
Devising a logical data model for your business intelligence environment allows you to then consider various ways to physically store the business data in the data warehouse. This is usually one of the first steps in designing a project, as shown in the following diagram:
This chapter provides conceptual information about logical data models, the elements that exist within them, and also general instructions and guidelines for creating these models.
A logical data model is a graphic representation of the following concepts:
• Facts: Business data and measurements, page 20
• Attributes: Context for your levels of data, page 21
• Hierarchies: Data relationship organization, page 23

The Logical Data Model Project Design Guide2
20 Facts: Business data and measurements © 2010 MicroStrategy, Inc.
Facts: Business data and measurementsOne of the first things you do when you create a logical data model is to determine the facts. Conceptually, you can think of facts as business measurements, data, or variables that are typically numeric and suitable for aggregation. Sales, Inventory, and Account Balance are some examples of facts you can use as business measurements.
Facts allow you to access data stored in a data warehouse and they form the basis for the majority of users’ analysis and report requirements. In MicroStrategy, facts are schema objects that relate data values (typically numeric data) from the data warehouse to the MicroStrategy reporting environment.
Facts are the building blocks used to create business measurements or metrics from which to derive insight into your data. The rest of data modeling consists mostly of providing context for the data that facts provide access to.
In a data warehouse, facts exist as columns within the fact tables. They can come from different source systems and they can have different levels of detail. For example, you can capture sales data in one system and track it daily, while you capture stock and inventory data in another system and track it weekly.
To those familiar with SQL, facts generally represent the numeric columns in database tables on which you perform SQL aggregations, such as SUM and AVG.
For example, in the following SQL statement, the ORDER_AMT column in the warehouse may correspond to the Order Amount fact in the MicroStrategy environment:
SELECT sum(a21.ORDER_AMT) EMP_NAMEFROM ORDER_FACT a21JOIN LU_EMPLOYEE a22ON (a21.EMP_ID = a22.EMP_ID)WHERE a22.CALL_CTR_ID in (5, 9, 12)
In addition, while ORDER_AMT is the fact, sum(a21.ORDER_AMT) represents a metric, which are business calculations often built using facts. Metrics are discussed in detail in the MicroStrategy Basic Reporting Guide.
For a more complete discussion about facts, refer to Chapter 6, The Building Blocks of Business Data: Facts.

Project Design Guide The Logical Data Model 2
© 2010 MicroStrategy, Inc. Attributes: Context for your levels of data 21
Attributes: Context for your levels of dataAfter the facts are determined, the attributes must be identified. Attributes allow you to answer questions about a fact and provide a context for reporting and analyzing those facts.
For example, consider the sales figures of your company. If you were informed that your company had sales of $10,000, you can gather little useful information. To make the sales figure meaningful, you would need to know more about the source of that sales figure such as:
• A time frame for the sales
• Who and how many people contributed to the sales total
• What products were sold from which departments
• The scope of the sale, such as national, regional, local, or a single store
Attributes provide context and levels for convenient summarization and qualification of your data to help answer the type of questions listed above. They are used to answer business questions about facts at varying levels of detail. For example, if your sales data is stored at the day level, a Month attribute allows you to see the same sales data summarized at the month level.
To those familiar with SQL, attributes generally represent the non-numeric and non-aggregatable columns in database tables. These columns are used to qualify and group fact data.
For example, in the following SQL statement, the MONTH_ID column in the warehouse maps to the Month attribute in the MicroStrategy environment:
SELECT a11.MONTH_ID MONTH_ID, max(a12.MONTH_DESC) MONTH_DESC, sum(a11.TOT_DOLLAR_SALES) DLRSALES
FROM MNTH_CATEGORY_SLS a11join LU_MONTH a12 on (a11.MONTH_ID = a12.MONTH_ID)WHERE a11.MONTH_ID in
(200201,200202,200203)GROUP BY al1.MONTH_ID
Attribute forms contain additional descriptive information about a given attribute and are discussed in terms of the logical data model in Attribute forms, page 33.
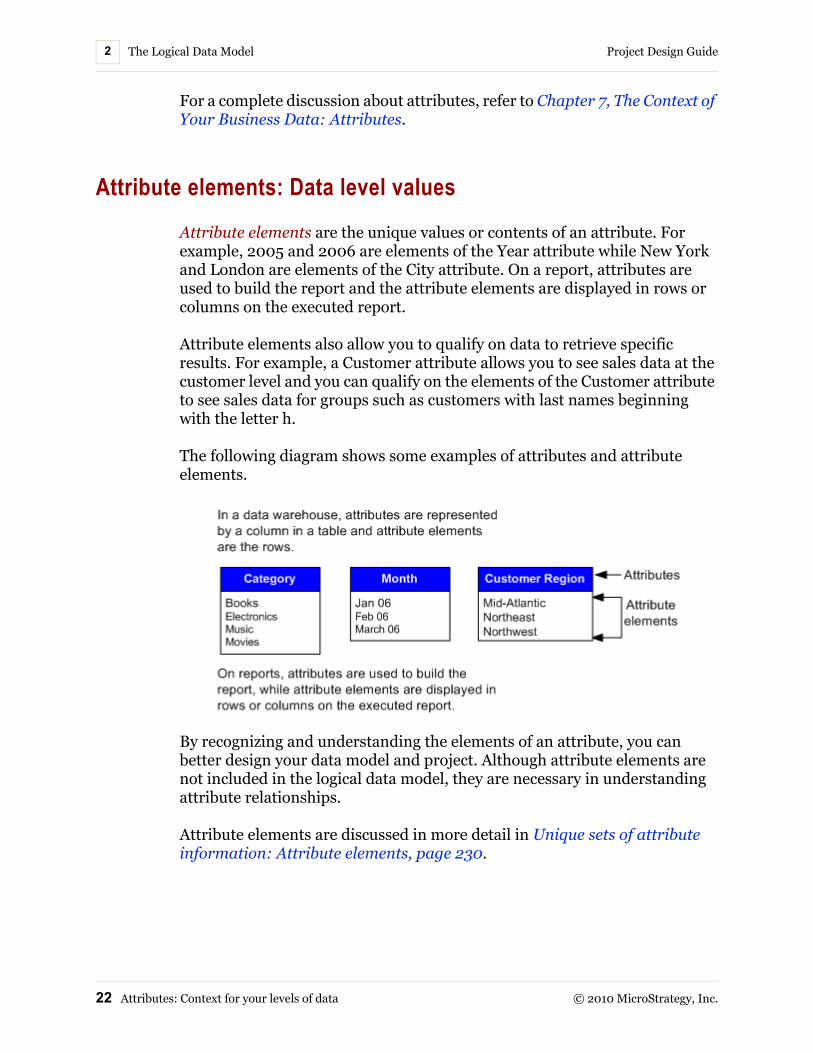
The Logical Data Model Project Design Guide2
22 Attributes: Context for your levels of data © 2010 MicroStrategy, Inc.
For a complete discussion about attributes, refer to Chapter 7, The Context of Your Business Data: Attributes.
Attribute elements: Data level values
Attribute elements are the unique values or contents of an attribute. For example, 2005 and 2006 are elements of the Year attribute while New York and London are elements of the City attribute. On a report, attributes are used to build the report and the attribute elements are displayed in rows or columns on the executed report.
Attribute elements also allow you to qualify on data to retrieve specific results. For example, a Customer attribute allows you to see sales data at the customer level and you can qualify on the elements of the Customer attribute to see sales data for groups such as customers with last names beginning with the letter h.
The following diagram shows some examples of attributes and attribute elements.
By recognizing and understanding the elements of an attribute, you can better design your data model and project. Although attribute elements are not included in the logical data model, they are necessary in understanding attribute relationships.
Attribute elements are discussed in more detail in Unique sets of attribute information: Attribute elements, page 230.

Project Design Guide The Logical Data Model 2
© 2010 MicroStrategy, Inc. Hierarchies: Data relationship organization 23
Attribute relationships
Building an effective project in MicroStrategy requires you, as the project designer, to have a solid understanding of all the attributes in the project, as well as how each of them relates to the other attributes.
Attribute relationships, which are associations between attributes that specify how attributes are connected, are essential to the logical data model. Without relationships, there is no interaction between data, and therefore no logical structure. The relationships give meaning to the data by providing logical associations of attributes based on business rules.
Every direct relationship between attributes has two parts—a parent and a child. A child must always have a parent and a parent can have multiple children. The parent attribute is at a higher logical level than the child is. For example, in a relationship between Year and Quarter, Year is the parent attribute and Quarter is the child.
Attributes are either related or unrelated to each other. Examples of related and unrelated attributes, along with more detailed information about attribute relationships, are discussed in Attribute relationships, page 252.
Hierarchies: Data relationship organizationHierarchies in a logical data model are ordered groupings of attributes arranged to reflect their relationship with other attributes. Usually the best design for a hierarchy is to organize or group attributes into logical business areas. For example, you can group the attributes Year, Month, and Day to form the Time hierarchy.
In a logical data model, hierarchies contain attributes that are directly related to each other. Attributes in one hierarchy are not directly related to attributes in another hierarchy.
For example, Year and Quarter are attributes that are usually directly related to each other. One year has many quarters and both attributes are in the Time hierarchy.
Year and Customer are attributes that are usually not in the same hierarchy and are not directly related to each other. However, if you want to create a report that shows information about customer purchases in a particular year, there must be some way to determine how these two attributes are related.

The Logical Data Model Project Design Guide2
24 Sample data model © 2010 MicroStrategy, Inc.
Year and Customer are related through a fact. It is the existence of a fact that ties the Time hierarchy to the Customer hierarchy. In this case, the fact is a customer purchase.
Therefore, facts exist at the intersection of hierarchies. They are identified by multiple attributes, which represent the level at which a fact is stored. A graphical example of how facts, attributes, and hierarchies are related and form a complete logical data model is shown in the section Sample data model, page 24 below.
For a complete discussion about hierarchies, refer to Chapter 8, Creating Hierarchies to Organize and Browse Attributes.
Sample data modelWhen all of the components are placed in a single diagram—facts, attributes, relationships, and hierarchies—a logical data model begins to take shape.
The following diagram is an example of a logical data model:

Project Design Guide The Logical Data Model 2
© 2010 MicroStrategy, Inc. Building a logical data model 25
Building a logical data modelThe first thing you must do before creating a logical data model is study the factors that influence your design. Some of the things to consider when creating a logical data model are
• User requirements
• Existing source systems
• Converting source data to analytical data
User requirements
The primary goal of logical data modeling is to meet the needs of your users’ reporting requirements. Developing such a model involves the following:
• Identification of user requirements
• Design of solutions
• Evaluation of those solutions
Logical data modeling is a reiterative process, where additional questions and concerns arise with each draft of the logical data model.
Your user community can consist of people with vastly different requirements. For example, company executives are typically interested in overall trends and may want reports showing data aggregated across the company and over a long period of time. Lower-level managers are typically more interested in data about their particular areas of responsibility. These managers may want reports about their specific region or store over short-and long-terms.
When creating the logical data model, you must consider all the potential users and how to accommodate their varied requirements. In some cases, lack of data in the source systems can limit user requirements. Sometimes, to satisfy user requirements, you can derive additional data not found in the source systems, as explained in Existing source systems, page 26.
User requirements are an important part of the initial project design process. However, additional user requirements can be encountered after deploying a project as users encounter areas for enhancement. In some cases, new user requirements may require you to modify the logical data model to better support the type of analysis and the retrieval of data that users demand.
The Logical Data Model Project Design Guide2
26 Building a logical data model © 2010 MicroStrategy, Inc.
Existing source systems
Understanding what data is available is an important step in creating a logical data model. Existing data is usually abundant, consisting of a large number of facts and attributes. You must determine what facts and attributes in the existing data are necessary for supporting the decision support requirements of your user community.
While a review of your data is initially helpful in identifying components of your logical data model, you may not find all the facts and attributes to meet your needs within the data itself. The existing data should suggest a number of facts, attributes, and relationships, but a substantial portion of the work in creating a suitable logical data model involves determining what additional components are required to satisfy the needs of the user community.
For example, an insurance company’s transactional system records data by customer and city, but the business analysts want to see data for different states or regions. State and region do not appear in the existing source data and so you need to extract them from another source. Additionally, although data is stored at a daily level in the source system, users also want to see data at the monthly or yearly level. In this case, you can plan additional attributes to provide the levels at which you intend to analyze the facts in your data model.
Although some data may not exist in a source system, this does not mean that it should not be included in the logical data model. Conversely, everything you find in the source data does not necessarily need to be included in the logical data model. User requirements should drive the decision on what to include and what to exclude.
Converting source data to analytical data
If there are no existing systems and you are just beginning your data warehousing initiative, you can build the logical data model based heavily on current user requirements. However, most logical models begin with an examination of the source data once existing systems are developed and implemented. The source data usually has some sort of documented physical structure. For example, most OLTP systems have an entity relationship diagram (ERD). An ERD provides a graphical representation of the physical structure of the data in the source system, which lets you easily recognize tables and columns and the data stored in those columns.
A logical data model is similar in concept to an ERD. However, in this guide the logical data model also takes into account how your data can

Project Design Guide The Logical Data Model 2
© 2010 MicroStrategy, Inc. Building a logical data model 27
be integrated into MicroStrategy to develop a business intelligence solution.
Whether you start from nothing or have an existing source system to use, the steps to create a logical data model are as follows:
• Step 1: Identify the facts, page 27
• Step 2: Identify the attributes, page 28
• Step 3: Determine attribute relationships, page 29
• Step 4: Define hierarchies, page 30
The details in these steps are related to using an existing source system.
Step 1: Identify the facts
Using your existing data, make a list of all data that can be represented as facts in MicroStrategy. Remember that facts can be calculated and are usually numeric and aggregatable, for example, sales and profit figures. After you have all the facts listed, determine the business level at which each fact is recorded. For example, in retail models, sales facts are often stored at the store, item, or day level, meaning that a sale takes place in a particular store, for a particular item, on a particular day. A product inventory fact, however, can be stored at the region, item, or week level. These business levels become the attributes in your logical data model (see Step 2: Identify the attributes, page 28).

The Logical Data Model Project Design Guide2
28 Building a logical data model © 2010 MicroStrategy, Inc.
Step 2: Identify the attributes
Uncover attributes by considering the levels at which you would like to view the facts on your reports. Start by looking at the levels at which each fact is recorded and build from there.
For example, in the existing data there may be fact data recorded only at the day level. However, your users are interested in analyzing data at more than just at the day level. They also want to view their data at the year, month, and week levels. This information may only be apparent to you after you deploy your project and you determine that a high percentage of your users are viewing sales data at the yearly level. This analysis requires MicroStrategy to aggregate the sales data from the day level to the year level. To improve performance and meet the requirements of the majority of your users, you can include an aggregate table that stores sales data at the year level (see Using summary tables to store data: Aggregate tables, page 343). You can then design a Year attribute for your project. This practice is sometimes a reaction to user requirements established after project deployment, but such considerations should be taken into account during your initial project design initiative.
Be careful not to include more facts and attributes than necessary. It is usually unnecessary to bring all data from the source system into the analytical environment. Only include facts and attributes that can serve your user community. Logical data modeling is an iterative process; if necessary, you can always add more attributes and facts later.

Project Design Guide The Logical Data Model 2
© 2010 MicroStrategy, Inc. Building a logical data model 29
Step 3: Determine attribute relationships
Once you have identified your data to be defined as attributes in MicroStrategy, you must then determine which attributes are related to each other. For example, in the Sales Force Analysis Module, opportunity information is stored with an Opportunity attribute which is directly related to the attributes Opportunity Close Date, Opportunity Open Date, Primary Competitor, and so on. These attributes are all related to the Opportunity attribute because they all answer questions about opportunity information.
Additionally, you should determine the type of relationship. For example, in the diagram below, Year has a one-to-many relationship to Month, and Month has a one-to-many relationship to Day. This one-to-many relationship specifies that, for every year, several months exist, and for every month, several dates exist. From the reverse perspective the same relationship specifies that, for a number of dates (in a form such as 12/01/2005), only one month exists (in a form such as Dec 2005), and for a number of months, only one year exists.
This example may not accurately define how you store time information. Consider the Year to Month attribute relationship type of one-to-many. If you define the attribute Month as simply the month name (Dec, Jan, and so on) and not directly connected to a year (Dec 2005, Jan 2006, and so on) then the relationship would become many-to-many.
If you have documentation for the existing data, such as an ERD, it is likely that the documentation provides some additional details about the nature of the data and any inherent relationships.

The Logical Data Model Project Design Guide2
30 Logical data modeling conventions © 2010 MicroStrategy, Inc.
Attribute relationships are discussed in detail in Attribute relationships, page 23.
Step 4: Define hierarchies
Hierarchies provide a structure for your data and can help your users easily and intuitively browse for related attributes and include them in a report. In the context of a logical data model, think of hierarchies as logical arrangements of attributes into business areas. For example, you can organize all time-related attributes into the Time hierarchy. You can have a Customer hierarchy containing all attributes related to your customers and a Supplier hierarchy for all attributes related to supplier data.
Depending on the complexity of your data and the nature of your business, you may have very few hierarchies or you may have many. It is possible that all the data is directly related, in which case you may have one big hierarchy. Again, the requirements of your user community should help you determine what hierarchies are necessary.
Logical data modeling conventionsThere are numerous logical data modeling conventions you can use to enhance your logical data model. These include:
• Unique identifiers
Project Design Guide The Logical Data Model 2
© 2010 MicroStrategy, Inc. Logical data modeling conventions 31
• Cardinalities and ratios
• Attribute forms
These logical modeling conventions can provide cues for system optimization opportunities, help with system maintenance, and make for a more robust logical data model. Although the user community is the ultimate beneficiary of a well-optimized and maintained system, these conventions are primarily intended for project designers, administrators, and advanced report designers.
Each convention adds more information about the data to the logical data model. This additional information can be particularly useful to a person learning about the system.
Unique identifiers
An additional modeling convention is to add unique identifiers for each attribute and fact. Unique identifiers denote the key that maps an attribute to its source data in the source system, when applicable. This information can help define primary keys in the physical warehouse schema (see Uniquely identifying data in tables with key structures, page 37).
Remember that facts are usually identified by multiple attributes and therefore will have multiple unique identifiers. The following diagram shows a logical data model with unique identifiers added. Some attributes rely on
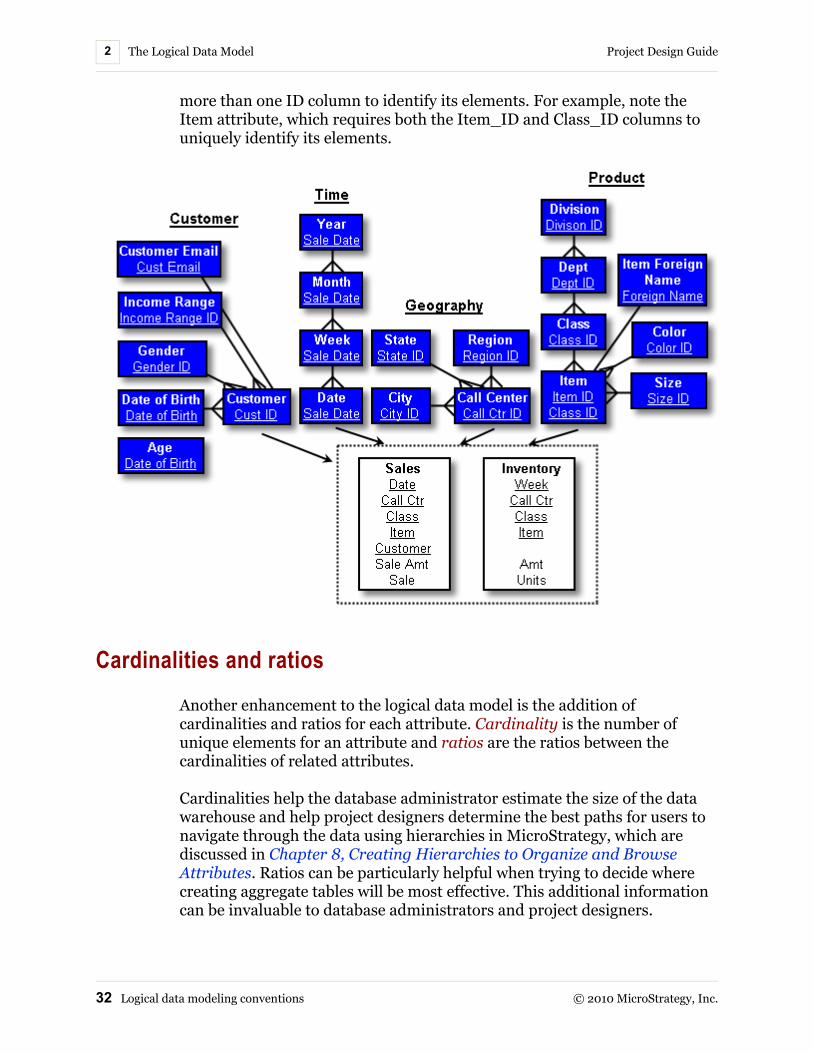
The Logical Data Model Project Design Guide2
32 Logical data modeling conventions © 2010 MicroStrategy, Inc.
more than one ID column to identify its elements. For example, note the Item attribute, which requires both the Item_ID and Class_ID columns to uniquely identify its elements.
Cardinalities and ratios
Another enhancement to the logical data model is the addition of cardinalities and ratios for each attribute. Cardinality is the number of unique elements for an attribute and ratios are the ratios between the cardinalities of related attributes.
Cardinalities help the database administrator estimate the size of the data warehouse and help project designers determine the best paths for users to navigate through the data using hierarchies in MicroStrategy, which are discussed in Chapter 8, Creating Hierarchies to Organize and Browse Attributes. Ratios can be particularly helpful when trying to decide where creating aggregate tables will be most effective. This additional information can be invaluable to database administrators and project designers.

Project Design Guide The Logical Data Model 2
© 2010 MicroStrategy, Inc. Logical data modeling conventions 33
The following diagram shows a logical data model which includes cardinalities and ratios. Note the cardinalities in the upper right corner of each attribute rectangle and the ratios next to some of the relationships between attributes. Also note that the cardinality of some attributes such as Date of Birth are unknown; this is because this information varies and is unpredictable. For example, it is impossible to determine how many customers have different dates of birth in the warehouse.
Attribute forms
Including attribute forms in your logical data model can help you get a more complete view of all of the information that is made available in your project.
Attribute forms contain additional descriptive information about a given attribute. For example, you create an attribute called Customer to represent customers in your system, and it is part of the Customer hierarchy. Each element of the Customer attribute represents a different customer, and in the data, you store the following information about your customers:

The Logical Data Model Project Design Guide2
34 Logical data modeling conventions © 2010 MicroStrategy, Inc.
• Customer number (some numeric code used to uniquely identify customers)
• First name
• Last name
• Address
• Email address
In your logical data model, you could have included each of these pieces of information as separate attributes, each with a one-to-one relationship to the Customer attribute. In reality, though, these attributes simply provide additional information about the Customer attribute; they do not represent different levels within the Customer hierarchy. When a one-to-one relationship exists between an attribute and one of its descriptions, you can model these additional pieces of descriptive information as attribute forms. The following diagram shows how you add attribute forms to a logical data model:
Attribute forms are discussed in terms of their role in MicroStrategy in Column data descriptions and identifiers: Attribute forms, page 236.

© 2010 MicroStrategy, Inc. 35
33.WAREHOUSE STRUCTURE FOR YOUR LOGICAL DATA MODELPhysical Warehouse Schema
Introduction
As discussed in the previous chapter, the logical data model can help you think about the logical structure of your business data and the many relationships that exist within that information.
The physical warehouse schema is based on the logical data model. It is a detailed graphic representation of your business data as it is stored in the data warehouse. The physical warehouse schema organizes the logical data model in a method that makes sense from a database perspective.
In contrast, the logical data model is a logical arrangement of data from the perspective of the general user or business analyst. For more information on what a logical data model is and how to create one, see Chapter 2, The Logical Data Model.
The logical data model is only concerned with logical objects of the business model, such as Day, Item, Store, or Account. Several physical warehouse schemas can be derived from the same logical data model. The structure of the schema depends on how the data representing those logical objects are to be stored in the warehouse. For example you can store logical objects in the same table, in separate tables, duplicated across several tables, or in some other arrangement.

Warehouse Structure for Your Logical Data Model Project Design Guide3
36 Columns: Data identifiers and values © 2010 MicroStrategy, Inc.
While the logical data model tells you what facts and attributes to create, the physical warehouse schema tells you where the underlying data for those objects is stored. The physical warehouse schema describes how your data is stored in the data warehouse and how it can be retrieved for analysis.
Creating a physical warehouse schema is the next step in organizing your business data before you create a project, as shown below:
The key components that make up the physical warehouse schema are columns and tables.
Columns and tables in the physical warehouse schema represent facts and attributes from the logical data model. The rows in a table represent attribute elements and fact data.
Columns: Data identifiers and valuesColumns are fields in the warehouse that contain attribute and fact data. The types of columns are:
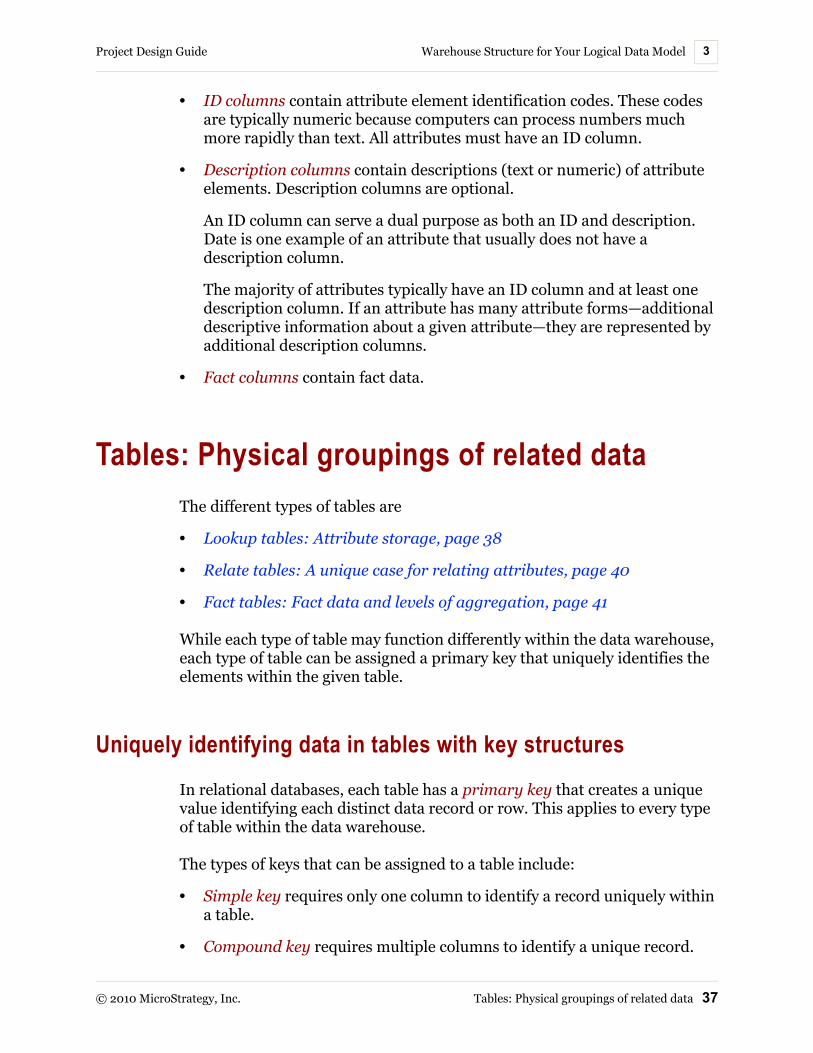
Project Design Guide Warehouse Structure for Your Logical Data Model 3
© 2010 MicroStrategy, Inc. Tables: Physical groupings of related data 37
• ID columns contain attribute element identification codes. These codes are typically numeric because computers can process numbers much more rapidly than text. All attributes must have an ID column.
• Description columns contain descriptions (text or numeric) of attribute elements. Description columns are optional.
An ID column can serve a dual purpose as both an ID and description. Date is one example of an attribute that usually does not have a description column.
The majority of attributes typically have an ID column and at least one description column. If an attribute has many attribute forms—additional descriptive information about a given attribute—they are represented by additional description columns.
• Fact columns contain fact data.
Tables: Physical groupings of related dataThe different types of tables are
• Lookup tables: Attribute storage, page 38
• Relate tables: A unique case for relating attributes, page 40
• Fact tables: Fact data and levels of aggregation, page 41
While each type of table may function differently within the data warehouse, each type of table can be assigned a primary key that uniquely identifies the elements within the given table.
Uniquely identifying data in tables with key structures
In relational databases, each table has a primary key that creates a unique value identifying each distinct data record or row. This applies to every type of table within the data warehouse.
The types of keys that can be assigned to a table include:
• Simple key requires only one column to identify a record uniquely within a table.
• Compound key requires multiple columns to identify a unique record.

Warehouse Structure for Your Logical Data Model Project Design Guide3
38 Tables: Physical groupings of related data © 2010 MicroStrategy, Inc.
Which key structure you use to identify a unique attribute in a table depends on the nature of your data and business requirements. The following diagram shows how the different key structures can be used to identify a calling center.
The simple key shows how you can identify a calling center with only its Call_Ctr_id. This means that every calling center has its own unique ID.
In the compound key, calling centers are identified by both Call_Ctr_id and Region_id. This means that two calling centers from different regions can share the same Call_Ctr_id. For example, there can be a calling center with ID 1 in region A, and another calling center with ID 1 in region B. In this case, you cannot identify a unique calling center without knowing both the Call_Ctr_id and the Region_id.
Simple keys are generally easier to handle in the data warehouse than are compound keys because they require less storage space and they allow for simpler SQL. Compound keys tend to increase SQL query complexity, query time, and required storage space. However, compound keys have a more efficient ETL process.
Which key structure you use for a particular attribute depends entirely on the nature of the data and your system. Consider what key structures work best when creating lookup tables in the physical warehouse schema.
For information on defining the primary key for tables included in a MicroStrategy project, see Defining the primary key for a table, page 391.
Lookup tables: Attribute storage
Lookup tables are the physical representation of attributes. They provide the ability to aggregate data at different levels. Lookup tables store the information for an attribute in ID and description columns (see Columns: Data identifiers and values, page 36).
Depending on how you choose to organize the physical schema, a lookup table can store information for one or more related attributes. If a table only

Project Design Guide Warehouse Structure for Your Logical Data Model 3
© 2010 MicroStrategy, Inc. Tables: Physical groupings of related data 39
stores data about one attribute, it is said to be a normalized table. If a table holds data about multiple attributes, it is said to be a denormalized table.
The following diagram shows the different ways in which you can organize the same attribute information. Notice that the denormalized table holds the exact same data as the normalized tables. While the denormalized table consolidates information about attributes within one table, the normalized tables each contain only a subset of all of the information about the attributes.
You can use either structure for any table in the physical warehouse schema, though each structure has its advantages and disadvantages, as explained in the following sections and outlined in the table in Schema type comparisons, page 56.
Attribute relationships and lookup table structure
Attribute relationships are a major factor in determining the structure of lookup tables in a physical warehouse schema. In general, the following guidelines apply:
• One-to-one relationships usually denote the existence of an attribute form. The description column of an attribute form should simply be included as an additional column in the attribute’s lookup table.

Warehouse Structure for Your Logical Data Model Project Design Guide3
40 Tables: Physical groupings of related data © 2010 MicroStrategy, Inc.
• Many-to-many relationships usually require the use of a relate table distinct from either attribute lookup table. A relate table should include the ID columns of the two attributes in question. For more information on how to use relate tables, see Relate tables: A unique case for relating attributes, page 40.
Relate tables: A unique case for relating attributes
While lookup tables store information about attributes, relate tables store information about the relationship between two attributes. Relate tables contain the ID columns of two or more attributes, thus defining associations between them. Relate tables are often used to create relationships between attributes that have a many-to-many relationship to each other.
With attributes whose direct relationship is one-to-many—in which every element of a parent attribute can relate to multiple elements of a child attribute—you define parent-child relationships by placing the ID column of the parent attribute in the lookup table of the child attribute. The parent ID column in the child table is called a foreign key. This technique allows you to define relationships between attributes in the attributes’ lookup tables, creating tables that function as both lookup tables and relate tables as shown in the following diagram:

Project Design Guide Warehouse Structure for Your Logical Data Model 3
© 2010 MicroStrategy, Inc. Tables: Physical groupings of related data 41
In the case of a many-to-many relationship—in which multiple elements of a parent attribute can relate to multiple elements of a child attribute—you must create a separate relate table as shown in the following diagram:
Fact tables: Fact data and levels of aggregation
Fact tables are used to store fact data. Since attributes provide context for fact values, both fact columns and attribute ID columns are included in fact tables. Facts help to link indirectly related attributes. The attribute ID columns included in a fact table represent the level at which the facts in that table are stored.

Warehouse Structure for Your Logical Data Model Project Design Guide3
42 Tables: Physical groupings of related data © 2010 MicroStrategy, Inc.
For example, fact tables containing sales and inventory data look like the tables shown in the following diagram:
For more details on the level of aggregation of your fact data, see Fact table levels: The context of your data, page 44.
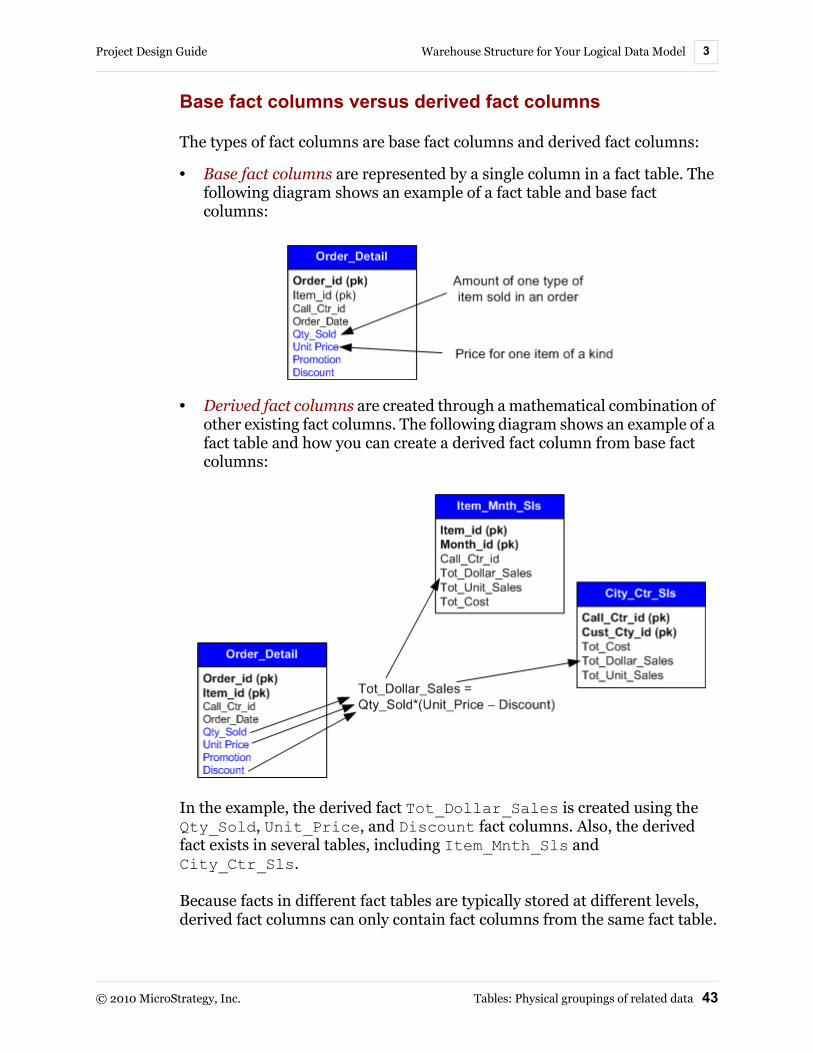
Project Design Guide Warehouse Structure for Your Logical Data Model 3
© 2010 MicroStrategy, Inc. Tables: Physical groupings of related data 43
Base fact columns versus derived fact columns
The types of fact columns are base fact columns and derived fact columns:
• Base fact columns are represented by a single column in a fact table. The following diagram shows an example of a fact table and base fact columns:
• Derived fact columns are created through a mathematical combination of other existing fact columns. The following diagram shows an example of a fact table and how you can create a derived fact column from base fact columns:
In the example, the derived fact Tot_Dollar_Sales is created using the Qty_Sold, Unit_Price, and Discount fact columns. Also, the derived fact exists in several tables, including Item_Mnth_Sls and City_Ctr_Sls.
Because facts in different fact tables are typically stored at different levels, derived fact columns can only contain fact columns from the same fact table.

Warehouse Structure for Your Logical Data Model Project Design Guide3
44 Tables: Physical groupings of related data © 2010 MicroStrategy, Inc.
There are advantages and disadvantages to consider when deciding if you should create a derived fact column. The advantage of storing derived fact columns in the warehouse is that the calculation of data is previously performed and stored separately, which translates into simpler SQL and a speedier query at report run time. The disadvantage is that derived fact columns require more storage space and more time during the ETL process.
You can create the same type of data analysis in MicroStrategy with the use of metrics. Metrics allow you to perform calculations and aggregations on fact data from one or more fact columns. For more information on what metrics are and how to create them, see the MicroStrategy Advanced Reporting Guide.
For more information on the different types of facts in MicroStrategy and how they are defined, see How facts are defined, page 189.
Fact table levels: The context of your data
Facts and fact tables have an associated level based on the attribute ID columns included in the fact table. For example, the following image shows two facts with an Item/Day/Call Center level.
The Item_id, Day_id, and Call_Ctr_id columns in the table above represent practical levels at which sales and inventory data can be analyzed on a report. The Sales and Inventory facts can be analyzed at the item, day, and call center levels because those levels exist as ID columns in the fact table.
You do not need to include more lookup column IDs than are necessary for a given fact table. For example, notice that the table above does not include the Customer_id column; this is because analyzing inventory data at the customer level does not result in a practical business calculation. Fact tables should only include attribute ID columns that represent levels at which you intend to analyze the specific fact data.

Project Design Guide Warehouse Structure for Your Logical Data Model 3
© 2010 MicroStrategy, Inc. Tables: Physical groupings of related data 45
The levels at which facts are stored become especially important when you begin to have complex queries with multiple facts in multiple tables that are stored at levels different from one another, and when a reporting request involves still a different level. You must be able to support fact reporting at the business levels which users require.
Homogeneous versus heterogeneous column naming
Suppose the data warehouse has information from two source systems, and in one source system regions are identified by column name Region_id and in the other the column name is Reg_id, as shown in the diagram below. These naming inconsistencies occur because source systems use different naming conventions to name the data they collect.
Though the Region_id and Reg_id columns have different names, they store the same data: information about regions. This is called heterogeneous column naming.
The data for the Lookup_Region table came from a different source system than the data for the Lookup_Call_Ctr and the source systems have different naming conventions. This explains why the same information about regions is represented by two columns with different names.
When you define facts and attributes in MicroStrategy Desktop, consider the heterogeneous column names that may exist in your source systems. In order for reports to retrieve accurate and complete results, heterogeneous columns must be mapped to their corresponding facts and attributes.
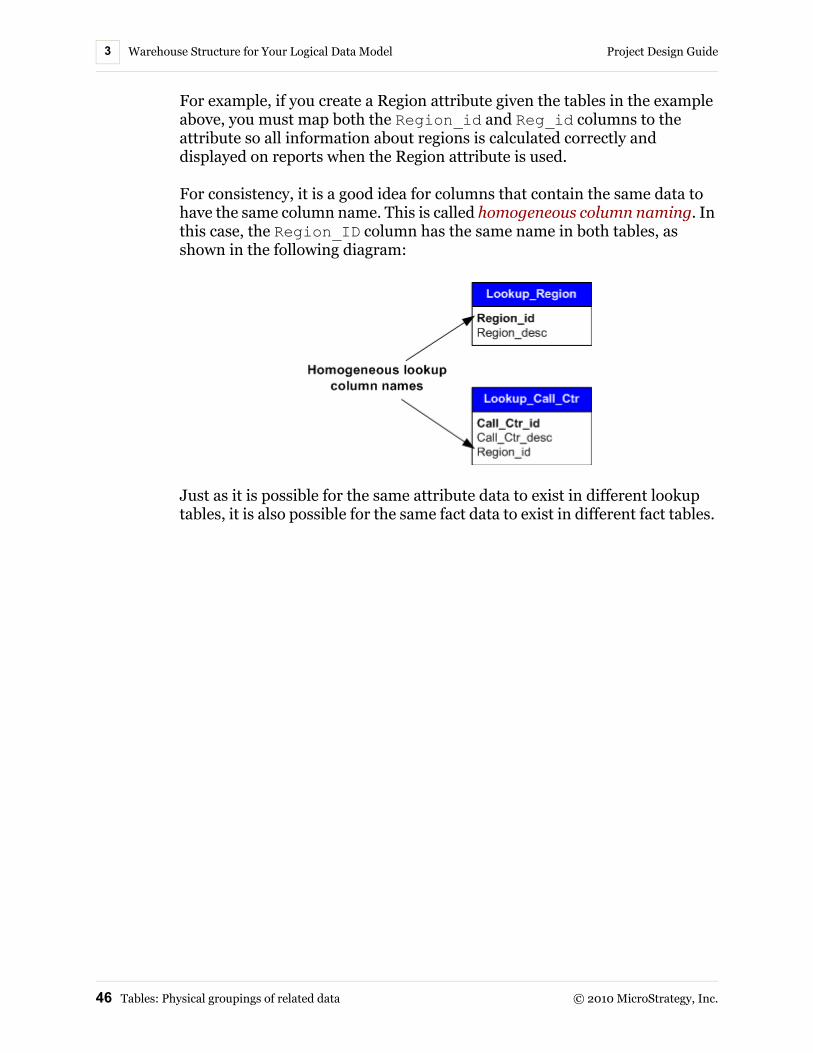
Warehouse Structure for Your Logical Data Model Project Design Guide3
46 Tables: Physical groupings of related data © 2010 MicroStrategy, Inc.
For example, if you create a Region attribute given the tables in the example above, you must map both the Region_id and Reg_id columns to the attribute so all information about regions is calculated correctly and displayed on reports when the Region attribute is used.
For consistency, it is a good idea for columns that contain the same data to have the same column name. This is called homogeneous column naming. In this case, the Region_ID column has the same name in both tables, as shown in the following diagram:
Just as it is possible for the same attribute data to exist in different lookup tables, it is also possible for the same fact data to exist in different fact tables.

Project Design Guide Warehouse Structure for Your Logical Data Model 3
© 2010 MicroStrategy, Inc. Schema types: Data retrieval performance versus redundant storage 47
A fact column may or may not have the same name in different tables, as shown below:
Schema types: Data retrieval performance versus redundant storage
There are many ways to structure your data warehouse and no method is inherently right or wrong. How you choose to structure the warehouse depends on the nature of your data, the available storage space, and the requirements of your user community. Typically, one of the schema types, or a combination of them, is used to organize the physical schema to enhance query performance while maintaining and acceptable amount of data storage space. These schema types are:
• Highly normalized schema: Minimal storage space
• Moderately normalized schema: Balanced storage space and query performance
• Highly denormalized schema: Enhanced query performance
In each of these schemas a base fact table and any number of aggregate fact tables are used (For more information on aggregate fact tables, see Using summary tables to store data: Aggregate tables, page 343). Fact table keys consist of attribute keys relevant to the level of data stored in the table. The schema examples that follow show data at the Item/Call Center/Date level.

Warehouse Structure for Your Logical Data Model Project Design Guide3
48 Schema types: Data retrieval performance versus redundant storage © 2010 MicroStrategy, Inc.
When comparing the different schema types, you should keep in mind the following concepts:
• Redundant data can cause a couple of drawbacks. The most obvious drawback is that redundant data requires more storage space to hold the same amount of data as a system with no redundancy.
Data redundancy also makes updating data a more intensive and difficult process because data resides in multiple places. With no data redundancy, data only has to be updated in a single place.
• Joins are SQL operations that are required to combine two tables together in order to retrieve data. These operations are necessary, but as with any operation performed on your data warehouse, the number of joins required to build your queries affects the performance of those queries.
• The sections below are not meant to be an exhaustive list of all possible schema types. However, the sections below are meant to give a description of the most common or general schema types that are used to develop a physical warehouse schema.
Highly normalized schema: Minimal storage space
The following diagram is an example of a highly normalized schema. In highly normalized schemas, lookup tables contain unique developer-designed attribute keys, such as Call_Ctr_id, Dist_Ctr_id, and Region_id, as shown in the figure below. They also contain attribute description columns, such as Call_Ctr_desc, Dist_Ctr_desc, and Region_desc. Also, the lookup table for an attribute contains the ID column

Project Design Guide Warehouse Structure for Your Logical Data Model 3
© 2010 MicroStrategy, Inc. Schema types: Data retrieval performance versus redundant storage 49
of the parent attribute, such as Dist_Ctr_id in the Lookup_Call_Ctr table.

Warehouse Structure for Your Logical Data Model Project Design Guide3
50 Schema types: Data retrieval performance versus redundant storage © 2010 MicroStrategy, Inc.
The following diagram shows what physical lookup tables look like in the warehouse:
One benefit of using a highly normalized schema is that it requires minimal storage space in the warehouse because of it uses smaller lookup tables than the other schema types.
However, there is a drawback to using only small tables in the data warehouse. When accessing higher-level lookup tables such as Lookup_Region in the example above, numerous joins are required to retrieve information about the higher-level tables. This is because each table contains only a small amount of information about a given attribute; therefore, multiple tables must be joined until the required column is found.

Project Design Guide Warehouse Structure for Your Logical Data Model 3
© 2010 MicroStrategy, Inc. Schema types: Data retrieval performance versus redundant storage 51
Moderately normalized schema: Balanced storage space and query performance
The following diagram shows an example of a moderately normalized schema. This schema type has the same basic structure as the highly normalized schema. The difference here is the higher-level attribute ID columns are present within all tables of related attributes. For example, Region_id is included in the Lookup_Call_Ctr table.

Warehouse Structure for Your Logical Data Model Project Design Guide3
52 Schema types: Data retrieval performance versus redundant storage © 2010 MicroStrategy, Inc.
The fact table structure within a moderately normalized schema is identical to that of the highly normalized schema. The following diagram shows what the physical lookup tables look like in the warehouse.
Using a moderately normalized schema provides a balance between the pros and cons of normalized and denormalized schema types. Because the ID columns of both the parents and grandparents of an attribute exist in multiple tables, fewer joins are required when retrieving information about an attribute.
However, since some tables contain the same ID columns (as shown above with the Region_ID column), the tables within this type of schema take up some redundant storage space in the warehouse.
Highly denormalized schema: Enhanced query performance
The following diagram is an example of a highly denormalized schema. A highly denormalized schema has the same basic structure as the other two schema types. With this type, not only are higher-level attribute ID columns present within all related tables, but the description columns are present as

Project Design Guide Warehouse Structure for Your Logical Data Model 3
© 2010 MicroStrategy, Inc. Schema types: Data retrieval performance versus redundant storage 53
well. For example, Region_desc is included in the Lookup_Call_Ctr table.
Using a highly denormalized schema further reduces the joins necessary to retrieve attribute descriptions. For example, you can include the descriptions of Call Center, Distribution Center, and Region along with Sales Dollars in the same report while only having to join the Lookup_Call_CTR and Fact_Sales tables. This is possible because Lookup_Call_CTR contains all information (including description data) for Call Center as well as for Distribution Center and Region.
However, this schema type requires the largest amount of storage space within the warehouse because of its large lookup tables. High denormalized schemas also cause the highest level of data redundancy.
Star schema: Consolidating lookup tables
When using the highly denormalized schema, it is possible to eliminate most of the lookup tables and leave just a few, as shown below. Arranging the warehouse schema this way produces a star schema. In this type of schema,

Warehouse Structure for Your Logical Data Model Project Design Guide3
54 Schema types: Data retrieval performance versus redundant storage © 2010 MicroStrategy, Inc.
the lookup tables are consolidated so that every attribute ID and description column for a given hierarchy exists in one table.
Recall that in a highly denormalized schema, each hierarchy (for example, geography) consists of several lookup tables. In a star schema, however, only one lookup table is used to contain all of the attribute IDs and description columns for a given hierarchy, as shown below:
As with any schema type model there are advantages and disadvantages to using a star schema. As with a highly denormalized schema type, the amount of join operations are reduced by using a star schema. A star schema can also reduce the amount of storage space necessary in a highly denormalized schema. However, star schemas can often require large lookup tables that can take a more time to search than the smaller tables that are used in the other schema types.
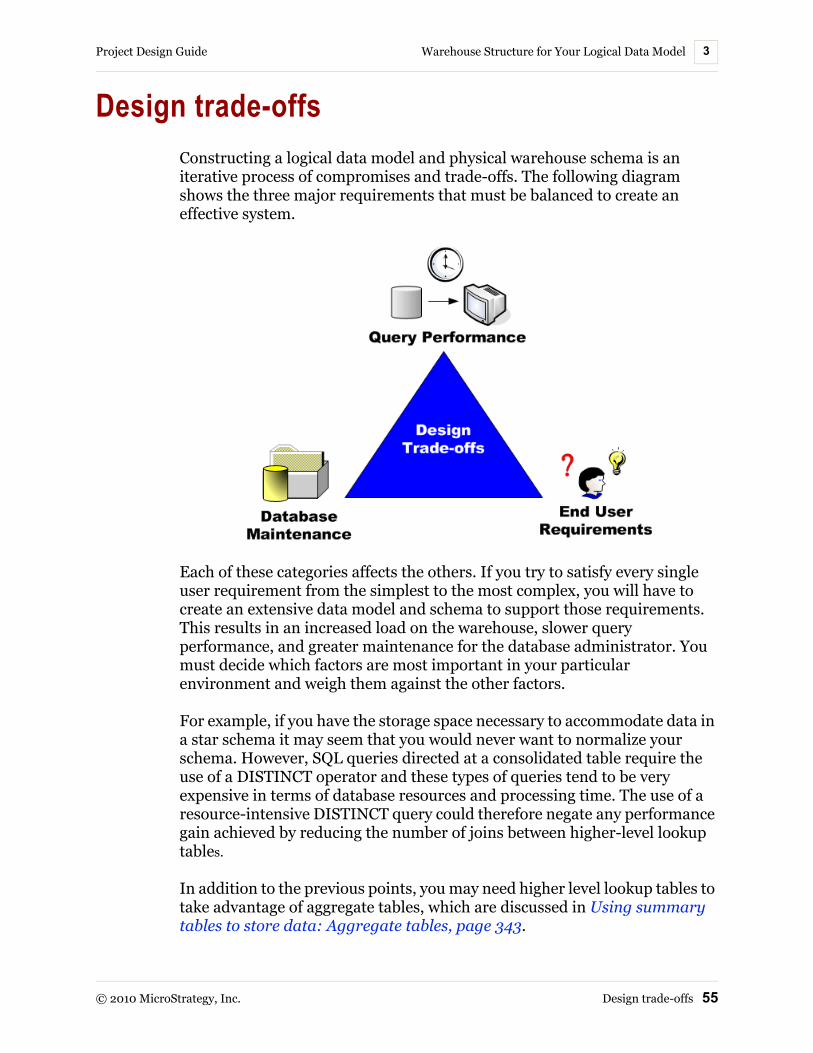
Project Design Guide Warehouse Structure for Your Logical Data Model 3
© 2010 MicroStrategy, Inc. Design trade-offs 55
Design trade-offsConstructing a logical data model and physical warehouse schema is an iterative process of compromises and trade-offs. The following diagram shows the three major requirements that must be balanced to create an effective system.
Each of these categories affects the others. If you try to satisfy every single user requirement from the simplest to the most complex, you will have to create an extensive data model and schema to support those requirements. This results in an increased load on the warehouse, slower query performance, and greater maintenance for the database administrator. You must decide which factors are most important in your particular environment and weigh them against the other factors.
For example, if you have the storage space necessary to accommodate data in a star schema it may seem that you would never want to normalize your schema. However, SQL queries directed at a consolidated table require the use of a DISTINCT operator and these types of queries tend to be very expensive in terms of database resources and processing time. The use of a resource-intensive DISTINCT query could therefore negate any performance gain achieved by reducing the number of joins between higher-level lookup tables.
In addition to the previous points, you may need higher level lookup tables to take advantage of aggregate tables, which are discussed in Using summary tables to store data: Aggregate tables, page 343.

Warehouse Structure for Your Logical Data Model Project Design Guide3
56 Schema type comparisons © 2010 MicroStrategy, Inc.
For more comparisons between the different schema types described in this chapter, see the following section Schema type comparisons, page 56.
Schema type comparisonsOne way to achieve a balance of the various trade-offs in your schema design is to use a variety of schema types in your physical warehouse schema. One hierarchy can be highly normalized while another can be highly denormalized. You can even use different schema types within the same hierarchy. The table below compares the different schema types.
Schema Type Lookup Table Structure Advantages Disadvantages
Highly normalized schema
• Attribute ID • Attribute
description column
• ID column of parent
Minimal storage space and minimal data redundancy which makes updating data less intensive than for the other schema types
Requires numerous joins to retrieve information from higher-level lookup tables
Moderately normalized schema
• Attribute ID • Attribute
description column
• ID column of parent
• ID column of grandparents
Greatly reduces the number of joins necessary to relate an attribute to its grandparents as compared to a highly normalized schema
Requires some redundant storage

Project Design Guide Warehouse Structure for Your Logical Data Model 3
© 2010 MicroStrategy, Inc. Supporting data internationalization 57
Now that you have gained an understanding of data modeling and the roles of facts and attributes, you can learn about these same schema objects in terms of how they exist in the MicroStrategy environment. As facts and attributes are the cornerstones of the reports you intend to create using MicroStrategy, it is essential to understand the structure of each of these schema objects before creating a project.
Supporting data internationalizationMicroStrategy supports the internationalization of your data into the languages required for your users. This allows data to be displayed in various languages that can reflect the user’s language preferences.
To provide data in various languages you must include the translated data in your database. The strategy you use to include translated data in your database depends on many factors. Some guidelines are provided below to
Highly denormalized schema
• Attribute ID • Attribute
description column
• ID column of parent
• description column of parent
• ID column of grandparents
• description column of grandparents
Further reduces joins necessary to retrieve attribute descriptions as compared to a moderately normalized schema
Requires the most storage space and redundant data requires a more intensive process to update
Star schema • Consolidates an entire hierarchy into a single lookup table
• Further reduces joins necessary to retrieve attribute descriptions as compared to a moderately normalized schema
• Requires less storage space and data redundancy than a highly denormalized schema and thus data is easier to update
Large lookup tables can negatively affect query performance when searching tables and requiring DISTINCT operations to be performed
Schema Type Lookup Table Structure Advantages Disadvantages

Warehouse Structure for Your Logical Data Model Project Design Guide3
58 Supporting data internationalization © 2010 MicroStrategy, Inc.
help define your strategy so that internationalization can be supported and integrated easily into your MicroStrategy projects:
• Internationalization through tables and columns or databases, page 58
• Supporting various character sets within databases, page 63
For a complete overview of internationalization in MicroStrategy, see the System Administration Guide.
Internationalization through tables and columns or databases
MicroStrategy supports data internationalization through two different techniques. You can either provide translated data through the use of extra tables and columns, or you can provide separate databases to store your translated data. These techniques are described below:
• Using tables and columns for internationalization, page 58
• Using separate databases for internationalization, page 62
Using tables and columns for internationalization
You can support data internationalization in your database by using separate tables and columns to store your translated data. You can use various combinations of tables and columns to support and identify the translated data in your database.
For example, the MicroStrategy Tutorial project includes a Month of Year attribute which retrieves its primary information in English from the LU_MONTH_OF_YEAR table shown below:

Project Design Guide Warehouse Structure for Your Logical Data Model 3
© 2010 MicroStrategy, Inc. Supporting data internationalization 59
To support displaying the name of each month in multiple languages, you can include the translated names in a separate column, one for each required language, within the same table. Each column can use a suffix to identify that the column contains translated data for a certain language. The same LU_MONTH_OF_YEAR table with translated data for the Spanish and German languages is shown below:
The data for Spanish is included in a MONTH_OF_YEAR_NAME column with the suffix _ES, and the data for German is included in a MONTH_OF_YEAR_NAME column with the suffix _DE.
As an alternative to supplying translations by using separate columns in the same table, you can create separate tables for your translations. Each table can share the same column name for the same data in different languages. In

Warehouse Structure for Your Logical Data Model Project Design Guide3
60 Supporting data internationalization © 2010 MicroStrategy, Inc.
the tables below, the Spanish and German data is provided in separate Spanish and German tables:
The data for Spanish is included in a LU_MONTH_OF_YEAR table with the suffix _ES, but the MONTH_OF_YEAR column shares the same column name as in the English LU_MONTH_OF_YEAR table. The data for German uses the same technique and is stored in a LU_MONTH_OF_YEAR table with the suffix _DE.
You can also use both techniques (separate tables and extra columns in one table) to store and identify your translated data. This can be helpful to distinguish the language used for each table and column. It can also be helpful if you have a primary language stored in one table, and you store all internationalizations in an internationalization table. For example, you can

Project Design Guide Warehouse Structure for Your Logical Data Model 3
© 2010 MicroStrategy, Inc. Supporting data internationalization 61
store the Spanish and German data in the same internationalization table, as shown below:
In this scenario, the LU_MONTH_OF_YEAR_LANG table includes all translations in all languages other than the primary language, for the MONTH_OF_YEAR_NAME column. Each column is assigned a suffix to identify the language of the translated data.
Be aware of the following:
• In the examples above, suffixes on tables and columns are used to identify the language of the translated data. While it is not a requirement to use suffixes for these identification purposes, it is the easiest method to define and support in MicroStrategy. Using prefixes or other naming conventions requires you to use some functions to recognize the location of the translated data.
• If your project supports data internationalization, you cannot use logical views as lookup tables for attributes that use translated data. For information on logical views, see Appendix B, Logical Tables.
For information on defining your project to use tables and/or columns to enable data internationalization, see Enabling data internationalization through SQL queries, page 90.

Warehouse Structure for Your Logical Data Model Project Design Guide3
62 Supporting data internationalization © 2010 MicroStrategy, Inc.
Using separate databases for internationalization
You can support data internationalization in your database by using separate databases for each supported language. A user can then be granted access, through connection mappings, to the database that contains their preferred language.
For example, the MicroStrategy Tutorial project includes a Month of Year attribute which retrieves its primary information in English from the LU_MONTH_OF_YEAR table shown below:
For the purposes of this example, you can assume this data is stored in a database name Tutorial (English). You also provide your projects in Spanish and German, which means you must have a database for Spanish and a database for German. Each database contains the same table structure,

Project Design Guide Warehouse Structure for Your Logical Data Model 3
© 2010 MicroStrategy, Inc. Supporting data internationalization 63
column structure, and naming conventions, but includes translated data, as shown below:
This method of data internationalization requires that the same data is available in each internationalized database.
If your project supports data internationalization, you cannot use logical views as lookup tables for attributes that use translated data. For information on logical views, see Appendix B, Logical Tables.
For information on defining your project to use separate databases to enable data internationalization, see Enabling data internationalization through connection mappings, page 92.
Supporting various character sets within databases
Languages require a wide range of character sets to represent data. To support the languages you plan to use in your MicroStrategy projects, you

Warehouse Structure for Your Logical Data Model Project Design Guide3
64 Supporting the Map widget and Geo Location for MicroStrategy Mobile © 2010 MicroStrategy, Inc.
must use databases that support the required character sets and are configured accordingly. To determine whether your database supports the character sets required for the languages you want to support, refer to your third-party database documentation. For best practices information on supporting internationalization in MicroStrategy, see the System Administration Guide.
Supporting the Map widget and Geo Location for MicroStrategy Mobile
MicroStrategy Mobile for iPhone devices includes a Map widget that can return the location of a MicroStrategy Mobile user. This information can then be used to give the Mobile user their current location and perform additional analysis based on this information. For example, the current location can be used to return detailed information on the company’s five closest distribution centers.
To utilize the geographical location features of the Map Widget using MicroStrategy Mobile for iPhone, you must have location data stored in your data source. MicroStrategy requires latitude and longitude data to recognize a geographical location.
You can use various methods to develop a list of geographical locations. The procedure below uses a third-party free utility to determine valid latitude and longitude values.
The third-party product discussed in this document is manufactured by vendors independent of MicroStrategy. MicroStrategy makes no warranty, express, implied, or otherwise, regarding this product, including its performance or reliability.
To create location data to support the Map widget
To create location data
In the data source of your choosing, you must create the location data for the locations that can be recognized when using the Map widget. This location data must include both a latitude and longitude, along with any

Project Design Guide Warehouse Structure for Your Logical Data Model 3
© 2010 MicroStrategy, Inc. Supporting the Map widget and Geo Location for MicroStrategy Mobile
descriptive information required to be displayed for each location. This procedure uses a third-party free utility to determine valid latitude and longitude points for given addresses.
1 In a web browser, go to the following URL:
http://www.gpsvisualizer.com/geocoder/
The GPS Visualizer’s Address Locator opens.
2 In the Input field, type the address to determine the latitude and longitude for. For example, 1600 Pennsylvania Avenue Washington DC 20500.
You can return latitude and longitude for multiple addresses at the same time. This procedure provides the steps on how to return the latitude and longitude for a single address.
3 In the Source drop-down list, select Google.
4 Select the Include extra fields in output (precision, city, country, etc.) check box to include additional information about the location. This additional information is not required for the Map widget, but it can provide additional details that can be shown to the Mobile user as part of the location.
5 Click Start geocoding. The latitude and longitude, along with additional information, is returned for the address in the Results as text field. For example, the following information is returned for the example address provided above:
6 Include the first two values of the results in your data source as the latitude and longitude of the location, respectively. You must store this data as numerical values that can support the decimal precision of these values.

Warehouse Structure for Your Logical Data Model Project Design Guide3
66 Supporting the Map widget and Geo Location for MicroStrategy Mobile © 2010 MicroStrategy, Inc.
7 Include any additional information in your data source for each location that you store a latitude and longitude for. This can be information returned from the geographical location search as well as data pertinent to your needs. For example, if you are storing addresses for distribution centers, you can include the name of the distribution center as well as any other pertinent information.
8 Repeat the previous steps in this procedure for all locations that you want to support when using the Map widget.
If you do not have an entry for a given latitude and longitude point, no information can be returned for that geographical location.
To integrate location data with the Map widget
9 In MicroStrategy, create an attribute that can return all the location data for each entry. Separate attribute forms should be created for latitude and longitude, and should also support the numeric data of these values. The latitude and longitude attribute forms can serve as values to identify each attribute element. Attributes that use multiple attribute forms as their ID form are referred to as compound attributes. For additional details on creating an attribute, see Chapter 7, The Context of Your Business Data: Attributes. For information on using two attribute forms to identify each attribute element, see Attributes with multiple ID columns: Compound attributes, page 274.
10 If you have additional descriptive information that you want to make available for display to end users, create additional attribute forms for that descriptive information.
11 After creating this attribute, you can create a Map widget to display this location data. For information on creating a Map widget, see the MicroStrategy Web User online help.

© 2010 MicroStrategy, Inc. 67
44.CREATING AND CONFIGURING A PROJECT
Introduction
Once you create a logical model of your business data and arrange the data within the data warehouse, you are ready to create a project in MicroStrategy.
This chapter guides you through the first few major steps involved in creating a project in MicroStrategy. For definitions and descriptions of the components within the MicroStrategy platform that allow you to create and analyze your business intelligence applications, see Chapter 1, BI Architecture and the MicroStrategy Platform.
To see a sample project, access the MicroStrategy Tutorial provided with the MicroStrategy platform. The Tutorial is a sample data warehouse and demonstration project you can use to learn about the various features of the MicroStrategy platform. It is ready to be used and requires no additional configuration tasks. For more information about the Tutorial, refer to the MicroStrategy Basic Reporting Guide.

Creating and Configuring a Project Project Design Guide4
68 Overview of project creation © 2010 MicroStrategy, Inc.
To view the structure of the MicroStrategy Tutorial, see Appendix A, MicroStrategy Tutorial.
Overview of project creationThe following procedure describes the main steps to create a MicroStrategy project. These steps provide you with a high-level view of the project creation process. Bear this process in mind as you proceed through the rest of this guide.
The section Project connectivity components, page 73 defines some of the basic terminology used in project creation in MicroStrategy Desktop. It is intended to familiarize you with some of the terms discussed in this guide.
1 Creating the metadata repository
The metadata repository contains the objects and definitions associated with your project. It acts as the intermediary between your business data and your reporting environment. Therefore, the first step in the project creation process is to create a metadata repository. For detailed instructions, see Creating the metadata repository, page 76.

Project Design Guide Creating and Configuring a Project 4
© 2010 MicroStrategy, Inc. Overview of project creation 69
2 Connecting to the metadata repository and data source
Once the metadata repository is created and populated with initialization data, you must establish connections to both the metadata repository and data source. For detailed instructions, see Connecting to the metadata repository and data source, page 77.
3 Creating a project
Having created a metadata repository and established the necessary connections between the different parts of your MicroStrategy environment, you are ready to create the basic definition of your project. For detailed instructions, see Creating a project, page 78.
4 Creating facts and attributes
Schema objects such as facts and attributes are the basic components of the logical structure of a project. The business data your user community wants to report on is represented by schema objects in MicroStrategy. Therefore, it is necessary to setup schema objects before reports can be created. This step is covered in Creating facts and attributes, page 96 of this chapter.
You can use Query Builder or Freeform SQL to create schema objects as you design reports. For more information for these features, see the MicroStrategy Advanced Reporting Guide.
5 Configuring additional schema-level settings
Once you create the initial schema objects, you can configure additional schema-level settings that allow you to add complexity and depth to objects in your project and to the project as a whole. For example, you can create advanced facts and attributes to retrieve specific result sets. You can also use attributes to create time-series analysis schema objects called transformations and implement various tools to optimize and maintain your project over time. For information about:
• Advanced fact creation, see Creating and modifying simple and advanced facts, page 182.
• Advanced attribute creation, see Adding and modifying attributes, page 224.
• Hierarchies and hierarchy creation, see Chapter 8, Creating Hierarchies to Organize and Browse Attributes.
• Transformations and transformation creation, see Chapter 10, Creating Transformations to Define Time-Based and Other Comparisons.

Creating and Configuring a Project Project Design Guide4
70 Overview of project creation © 2010 MicroStrategy, Inc.
• Project optimization and maintenance, see Chapter 9, Optimizing and Maintaining Your Project.
Strategies to include supplemental data in a project
The steps listed in Overview of project creation above relate to the process of creating a project which connects to a database or other data source such as a text file or Excel file.
MicroStrategy also supports strategies to include supplemental data in a MicroStrategy project. These strategies include:
• Connecting to data stored in SAP BW, Microsoft Analysis Services, Hyperion Essbase, and IBM Cognos TM1 systems. When integrated with MicroStrategy, these systems are referred to as MDX cube sources. You can connect to any of these MDX cube sources to report and analyze the data concurrently within a project that also connects to a database, or you can create a standalone connection to your MDX cube source (see the MicroStrategy MDX Cube Reporting Guide).
• Using MicroStrategy Web to import data from different data sources, such as an Excel file, a table in a database, or the results of a SQL query, with minimum project design requirements. This capability, referred to as Import Data, is described in detail in Including personalized data and developing proofs-of-concept below.
Including personalized data and developing proofs-of-concept
The Import Data feature lets you supplement the primary data of your project in the following ways:
For information on creating the primary data for your project, follow the steps provided in Overview of project creation, page 68.
• Include personalized data from various data sources. Along with the primary data provided in the project, your personalized data can then be reported on using all the standard MicroStrategy reporting and analysis features. This personalized data can also be displayed with the primary data in your project using Report Services documents.
• Develop a reporting environment as part of a proof-of-concept. Import Data is a powerful proof-of-concept tool due to its ability to quickly integrate data into MicroStrategy, without requiring the full data
Project Design Guide Creating and Configuring a Project 4
© 2010 MicroStrategy, Inc. Overview of project creation 71
modeling requirements that are described in this guide as part of creating a project.
MicroStrategy automatically maps attributes, metrics, and other objects to the data included in a MicroStrategy project using Import Data. These objects are created as managed objects.
A managed object can be removed once it is no longer referenced by another object in the project. The removal of unused managed objects is usually performed by an administrator. For more information on removing a database instance and its related managed objects, see the the System Administration Guide.
While managed objects allow you to quickly integrate data using Import Data, the data is not directly related to the rest of your project schema. This means that only data integrated using a single Import Data process can be included together on a given report; no additional attributes, metrics, or other objects from the project can be included. However, Report Services documents let you include reports that analyze data from different data sources together inside a single document. This can be accomplished by including the reports as separate datasets of the document, and then each dataset can be displayed separately on the document as a report, graph report, widget, or other document analysis tool.
Documents provide a method to include both data from the rest of your project and personalized data imported using the Import Data feature, into a single analysis view. For example, the document below displays various

Creating and Configuring a Project Project Design Guide4
72 Overview of project creation © 2010 MicroStrategy, Inc.
information about a current customer’s telephone service plan and their potential to churn.
Some of the data on the document could come from the primary project, such as the churn prediction, revenue risk indicator, and peak and off-peak minute usage. Additional details such as the contract usage details and the customer demographics could come from separate data sources, each included into the project using Import Data. Because documents can present separate sets of data in a single view or location, your regular project data and personalized data can be displayed to analysts as if the data were integrated.
For important prerequisites and tuning information for the Import Data feature, refer to the System Administration Guide, Vol. 1. For more information on how to use the Import Data feature, refer to the MicroStrategy Web online help.

Project Design Guide Creating and Configuring a Project 4
© 2010 MicroStrategy, Inc. Project connectivity components 73
Project connectivity componentsThis section defines some of the basic terminology used in project creation in MicroStrategy Desktop. It is intended to familiarize you with some of the terms discussed in this guide.
MicroStrategy metadata
All schema objects, application objects, configuration objects, and project settings are stored in the MicroStrategy metadata. Metadata is stored in a relational database with a predefined structure. The RDBMS for the metadata and warehouse do not need to be the same.
You can find the list of supported RDBMS platforms in the readme file that is installed with MicroStrategy products. To view the readme from the Start menu select Programs, then MicroStrategy, and then select ReadMe.
Metadata shell
Before you can populate the metadata repository with data, the necessary tables to hold the data must be present. The metadata shell is the set of blank tables that are created when you initially implement a MicroStrategy business intelligence environment.
You create the metadata shell with the MicroStrategy Configuration Wizard, which creates the blank tables and populates some of the tables with basic initialization data.
This first step in the project creation process is outlined in Creating the metadata repository, page 76.
Project source
The project source is a configuration object which represents a connection to a metadata repository. In MicroStrategy Desktop, the project source appears in the Folder List with an icon that varies depending on the type of

Creating and Configuring a Project Project Design Guide4
74 Project connectivity components © 2010 MicroStrategy, Inc.
connection it represents. A connection to a metadata repository is achieved in one of two ways:
• Direct or two-tier mode ( ): Connects to the metadata by specifying a DSN, login, and password to a metadata repository.
It is highly recommended that you never use direct mode connection in a production environment. MicroStrategy strongly suggests you always connect to the metadata through Intelligence Server because of the security and scalability it provides. You should not connect directly to the metadata unless you are implementing a prototype environment.
• Server or three-tier mode( ): Connects to the metadata by pointing to an Intelligence Server definition, which in turn governs and validates the connection to the metadata. The project metadata is the first tier, MicroStrategy Desktop is the second tier, and Intelligence Server is the third tier. Intelligence Server manages all connections to databases, enforces security, and ensures metadata integrity. For these reasons, Intelligence Server is a necessary part of any production project.
A four-tier connection is a Server (three-tier) connection in conjunction with MicroStrategy Web deployed on a web server.
The following diagram illustrates Server connectivity between a MicroStrategy metadata repository, Intelligence Server, and MicroStrategy Desktop. This is the type of connection used to create a production-ready project in MicroStrategy.

Project Design Guide Creating and Configuring a Project 4
© 2010 MicroStrategy, Inc. Project connectivity components 75
After the connection to the metadata is established, every object definition you create within this project source is stored in this metadata. This includes application objects, schema objects, and configuration objects from any number of projects defined within this project source (see MicroStrategy metadata, page 8 for definitions of these object types).
A project source connects to a single metadata repository. However, the same metadata repository can be accessed by multiple project sources. A project source may contain any number of projects.
Database instance
The database instance is a configuration object that represents a connection to a data source. When you define a project, you specify the data source location by creating and selecting a database instance with the appropriate connection parameters.
For information on database instances, see the MicroStrategy Installation and Configuration Guide.
Connecting to a data source through a database instance is explained in detail in Connecting to a data source, page 78.
Project
A project is where you build and store all schema objects and information you need to create application objects such as reports in the MicroStrategy environment. A project also represents the intersection of a data source, metadata repository, and user community. For more information on what a project is in MicroStrategy, see MicroStrategy project, page 13.

Creating and Configuring a Project Project Design Guide4
76 Creating the metadata repository © 2010 MicroStrategy, Inc.
Summary of project connectivity
With a firm understanding of the MicroStrategy metadata, project sources, database instances, and projects, you can begin to build an understanding of how these various pieces work together to provide an integrated business intelligence environment as shown in the following diagram.
Creating the metadata repositoryYour first step in project creation is to create a metadata repository. This repository stores all the objects necessary to support your project.
You can create an empty metadata repository in the database location of your choice using the Metadata Tables option in the Configuration Wizard.
Before proceeding to the next section, make sure your metadata repository exists in a non-Microsoft Access database. An Access database is unsuitable for a production project.

Project Design Guide Creating and Configuring a Project 4
© 2010 MicroStrategy, Inc. Connecting to the metadata repository and data source 77
Create a metadata repository using the guidelines outlined in the Configuring and Connecting Intelligence Server chapter of the MicroStrategy Installation and Configuration Guide.
When you create the metadata repository, MicroStrategy creates a default configuration in the repository. The default configuration populates the tables with the basic data required for the metadata, such as the default project folder structure and basic connection information.
These tables are populated with your project information during the project creation step in the Project Creation Assistant, outlined in Creating a project, page 78.
For instructions on creating a metadata repository in a database, see the MicroStrategy Installation and Configuration Guide.
Connecting to the metadata repository and data source
Once you have created a metadata repository, your next step is to connect MicroStrategy Desktop to the metadata repository and to your data source.
Connecting to the metadata repository
You connect to the metadata repository in MicroStrategy Desktop or Web through a project source. Recall that a project source is a pointer to a metadata repository. It connects either through a DSN that points to the appropriate database location or by pointing to an instance of Intelligence Server which, in turn, points to the metadata repository location.
To configure Intelligence Server and establish a server connection between the metadata, Intelligence Server, and MicroStrategy Desktop, follow the steps in the MicroStrategy Installation and Configuration Guide.

Creating and Configuring a Project Project Design Guide4
78 Creating a project © 2010 MicroStrategy, Inc.
Connecting to a data source
A data source contains the business data from which you intend to gain analytical insight. Once you connect to the metadata repository through Intelligence Server, your next step is to create a connection to the data source to which your project can connect. You connect to the data source by creating a database instance in MicroStrategy Desktop.
Create a database instance using the procedures outlined in the Configuring and Connecting Intelligence Server chapter of the MicroStrategy Installation and Configuration Guide.
MicroStrategy 9.0 introduces a new extension to Intelligence Server referred to as MultiSource Option. With this feature, you can connect a project to multiple data sources. This allows you to integrate all your information from various databases and other relational data sources into a single MicroStrategy project for reporting and analysis purpose. For information on connecting a project to multiple data sources, see Accessing multiple data sources in a project, page 330.
Note the following:
• If you do not have a license for MultiSource Option, your projects can only connect to a single database instance.
• MicroStrategy also allows you to connect to your SAP BI, Microsoft Analysis Services, and Hyperion Essbase data sources. For information about connecting to these MDX cube sources, see the MicroStrategy MDX Cube Reporting Guide.
Creating a projectYou can now begin building the MicroStrategy project that connects to the metadata repository and data source. Project creation involves creating a basic project definition and creating your project’s first schema objects.
There are several methods for creating and editing a project, which include:
• Creating a production project
This section guides you through the creation of a production-ready MicroStrategy project with the Project Creation Assistant or Architect.
• Creating a test or prototype project using Project Builder
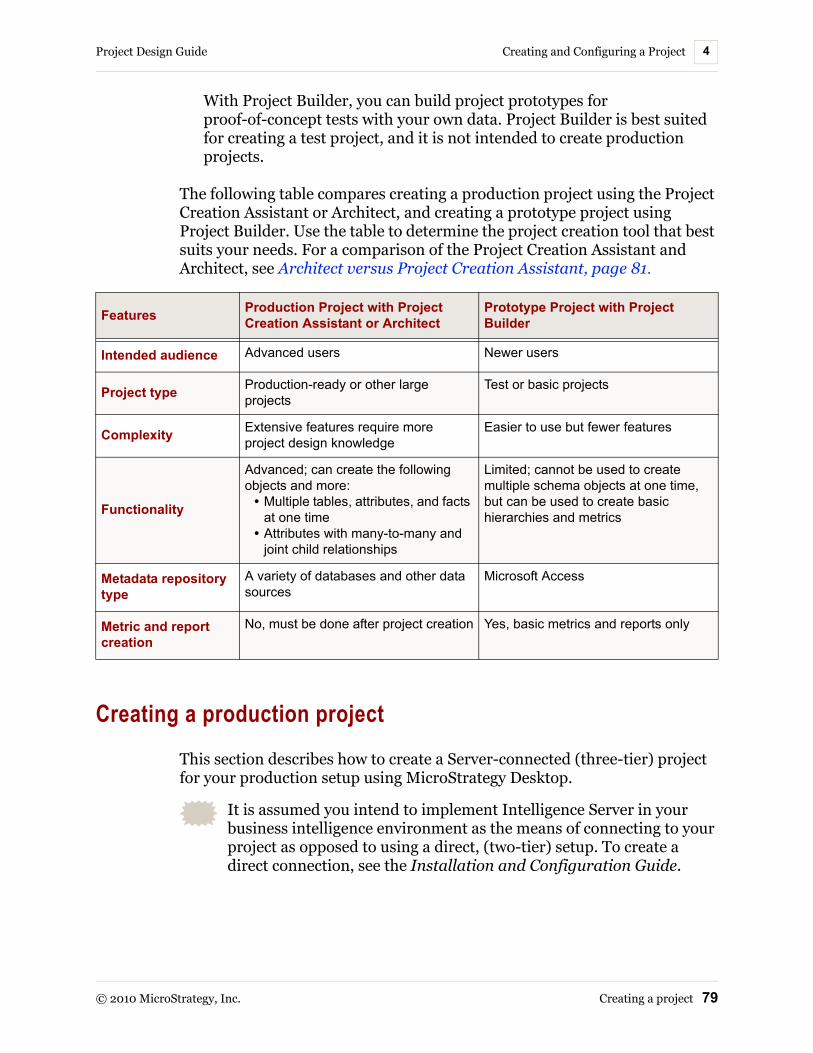
Project Design Guide Creating and Configuring a Project 4
© 2010 MicroStrategy, Inc. Creating a project 79
With Project Builder, you can build project prototypes for proof-of-concept tests with your own data. Project Builder is best suited for creating a test project, and it is not intended to create production projects.
The following table compares creating a production project using the Project Creation Assistant or Architect, and creating a prototype project using Project Builder. Use the table to determine the project creation tool that best suits your needs. For a comparison of the Project Creation Assistant and Architect, see Architect versus Project Creation Assistant, page 81.
Creating a production project
This section describes how to create a Server-connected (three-tier) project for your production setup using MicroStrategy Desktop.
It is assumed you intend to implement Intelligence Server in your business intelligence environment as the means of connecting to your project as opposed to using a direct, (two-tier) setup. To create a direct connection, see the Installation and Configuration Guide.
Features Production Project with Project Creation Assistant or Architect
Prototype Project with Project Builder
Intended audience Advanced users Newer users
Project type Production-ready or other large projects
Test or basic projects
Complexity Extensive features require more project design knowledge
Easier to use but fewer features
Functionality
Advanced; can create the following objects and more:
• Multiple tables, attributes, and facts at one time
• Attributes with many-to-many and joint child relationships
Limited; cannot be used to create multiple schema objects at one time, but can be used to create basic hierarchies and metrics
Metadata repository type
A variety of databases and other data sources
Microsoft Access
Metric and report creation
No, must be done after project creation Yes, basic metrics and reports only

Creating and Configuring a Project Project Design Guide4
80 Creating a project © 2010 MicroStrategy, Inc.
Creating a project using the Project Creation Assistant or Architect in MicroStrategy Desktop provides advanced functionalities and greater complexity to your project than Project Builder. It allows you to create a new project and add the following objects to it or to an existing project:
• Tables
• Facts
• Attributes
With the Project Creation Assistant or Architect, you create and configure a project and some of the essential schema objects that reside within it. The intended audience for these tools includes experienced project creators who have planned all their facts, attributes, and data relationships. This information is covered elsewhere in this guide. For a listing of information covered in specific chapters, see Planning your project below.
The main advantage of the Project Creation Assistant and Architect over Project Builder is its ability to create multiple schema objects at one time. Since you can efficiently add multiple tables and develop numerous attributes and facts, it is especially useful for large projects which contain many tables and schema objects. With the Project Creation Assistant or Architect, you can also create attributes with many-to-many relationships.
Planning your project
Before using the Project Creation Assistant or Architect, you should plan your project and consider the following:
• The logical data model you intend to use for this project; logical data models are covered in Chapter 2, The Logical Data Model.
• The tables to use in the project; physical warehouse schema models are covered in Chapter 3, Warehouse Structure for Your Logical Data Model.
• The facts to include in the project and the data types used to identify them; facts are covered in Chapter 6, The Building Blocks of Business Data: Facts.
• The attributes to create in the project and the data types used to identify them, including:
The description column name for each attribute.
Any other attribute forms for each attribute.

Project Design Guide Creating and Configuring a Project 4
© 2010 MicroStrategy, Inc. Creating a project 81
The child attributes for each attribute.
Attributes are covered in Chapter 7, The Context of Your Business Data: Attributes.
• Whether to use Project Creation Assistant or Graphical Architect. Both options for creating a project are compared in Architect versus Project Creation Assistant below.
Architect versus Project Creation Assistant
MicroStrategy has two tools that each provide unique ways to create a project: the Project Creation Assistant and Architect.
The Project Creation Assistant provides a linear, wizard-style workflow to create a project. This helps to guide you through the various steps required in project creation in a logical order. In general, the Project Creation Assistant provides separate steps to add and define the objects required for a project.
While you can add and define multiple tables, facts, and attributes for your project, each is provided as a separate step in the step-by-step creation of your project.
Also, Project Creation Assistant is intended to be used for the initial creation of your project, and thus cannot be used to modify an existing project. Once a project has been created, you must use Architect or the individual schema editors and wizards to modify the project.
Architect provides a centralized interface which allows you to define all the required components of your project and perform the various tasks to create a project.
When creating projects using Architect, including at least some tables in your project is a first step to include some information in your project. With Architect, once tables are added to your project you have much more flexibility in the order in which you create your project. While you are creating your project in Architect, you can easily switch between adding tables, creating facts, creating attributes, defining relationships between attributes, creating user hierarchies, and any other required project creation tasks. While performing these tasks, Architect provides a visual representation of your project, which helps to provide an intuitive workflow.
Both tools provide options to automatically create facts and attributes based on the columns and data available in your data source. Automatic fact and

Creating and Configuring a Project Project Design Guide4
82 Creating a project © 2010 MicroStrategy, Inc.
attribute creation can save a substantial amount of time in the creation of a project.
As summarized above, Project Creation Assistant and Architect provide two unique workflows to support the creation of a project. To help determine which tool you should use to create your project, the table below compares these two tools:
Creating a new project using the Project Creation Assistant
Once you have planned your project and completed the prerequisites, you can use the Project Creation Assistant to build the project and populate the metadata based on the data structures present in your data warehouse.
The steps of the Project Creation Assistant are:
1 Initialize/create the project.
Initializing the project means giving the project a name and selecting the metadata repository in which to create the project—that is, the project source. It also includes defining which languages are available in the project for the internationalization of metadata object information.
After you specify these settings, the shell of a project is created in the metadata. This configures the folder structure and default connectivity settings. Be aware that this process can take some time to complete.
Project Creation Task or Feature Project Creation Assistant Architect
The workflow of creating a project
Provides a linear, wizard-style workflow to add tables, attributes, and facts to a project
Provides a flexible workflow to add objects to a project in an order that suits your requirements from within a centralized interface
Can be used to modify a project
Can only be used for the initial creation of a project
Can be used to both create a project and make modifications at any time in a project’s life cycle
Can create user hierarchies
User hierarchies cannot be created User hierarchies can be created
Automatic creation of facts and attributes
Can automatically create facts and attributes based on rules
Can automatically create facts and attributes based on rules
Can create initial project object
The initial project object can be created
You must first create the initial project object using the Project Creation Assistant before using Architect

Project Design Guide Creating and Configuring a Project 4
© 2010 MicroStrategy, Inc. Creating a project 83
2 Select tables from the Warehouse Catalog.
In this step, you use the Warehouse Catalog to specify which data warehouse tables to include in your project.
3 Create facts.
4 Create attributes.
You should complete all the steps in the Project Creation Assistant at the same time. While you can save an incomplete project definition, you cannot finish creating it later with the Project Creation Assistant. Instead, you must complete it using the appropriate interface, such as the Warehouse Catalog, Fact Creation Assistant, or Attribute Creation Assistant.
To create a new project using the Project Creation Assistant
1 Log in to a project source in MicroStrategy Desktop.
To create a project source which connects to your data through Intelligence Server, see the Configuring and Connecting Intelligence Server chapter of the MicroStrategy Installation and Configuration Guide.

Creating and Configuring a Project Project Design Guide4
84 Creating a project © 2010 MicroStrategy, Inc.
2 From the Schema menu, select Create New Project. The Project Creation Assistant opens, as shown below:
3 Click Create project. The New Project page opens.
4 Define the project configurations listed below:
• Name: A name for the project. This name is used to identify a project within a project source.
• Description: An optional description for the project. This description can give a brief overview of the purpose of the project as compared to your other projects.
• Default document directory: The default document directory for a project is the directory location to store all HTML documents. For more details on how to setup HTML documents for a project, see the MicroStrategy Installation and Configuration Guide.
• Enable the guest user account for this project: Select this check box to allow users to log in to a project without any user credentials. Users can then to connect to Intelligence Server with a limited set of privileges and permissions (defined by the Public group).

Project Design Guide Creating and Configuring a Project 4
© 2010 MicroStrategy, Inc. Creating a project 85
• Enable Change Journal for this project: Select this check box to enable the Change Journal for the project. An entry is automatically included in this journal when any object in a project is modified, allowing you to keep track of any changes to your project. For information on the Change Journal, see the System Administration Guide.
• Languages: Click this button to define languages that are available for metadata objects in this project. The languages you select are also languages that are available for the internationalization of your metadata objects. If a language is available for a project, you can provide object names, descriptions, and other information in various languages. For example, in a project you can provide the names of attributes, metrics, folders, and other objects in multiple languages. For information on how to provide translated strings for metadata objects such as attributes, metrics, folders and so on, see the System Administration Guide.
MicroStrategy provides translated strings for common metadata objects in the default available languages listed. For example, translated strings are available for the name and description of the Public Objects folder as well as other common objects for each language listed as available by default. If you add other languages not listed, you must supply all translated strings for common metadata objects.
Be aware of the following:
– When you create a new project, a language check ensures that the language settings of the user profile of the local machine (the CURRENT_USER registry key), the language of the local machine (the LOCAL_MACHINE registry key), and the Project locale property match. When these properties do not match, it can lead to inconsistencies in the language display. The language check prevents these inconsistencies and ensures that the language display is consistent across the project.
– These language options are not related to supporting the integration of translated data from your data source into MicroStrategy. Information on defining your data source to support data internationalization is provided in Supporting data internationalization, page 57. If you plan to use translated data from your data source with attributes in a project, you must define how data
Creating and Configuring a Project Project Design Guide4
86 Creating a project © 2010 MicroStrategy, Inc.
internationalization is enabled before creating attributes. Enabling data internationalization is described in Enabling data internationalization for a project, page 89.
5 Click OK to create the project object.
6 Proceed to the next section below (Adding tables using the Warehouse Catalog) to determine the tables to be used in your project.
Adding tables using the Warehouse Catalog
The warehouse tables for a project determines the set of data available to be analyzed in the project. You use the Warehouse Catalog to add warehouse tables to your project. The Warehouse Catalog lists all the tables in the data source to which you are connected through your database instance and to which your database login has read privileges.
The Warehouse Catalog queries the data source and lists the tables and columns that exist in it. From this list, you select the lookup, fact, and relationship tables to use in your new project. You should also include all other tables needed to complete your project, including transformation tables, aggregate tables, and partition mapping tables.
MicroStrategy schema objects such as attributes, facts, and tables are abstractions built on top of the tables and columns in the data source. Once tables are selected from the data source and added to your project, they become schema objects known as logical tables in MicroStrategy. Logical tables are representations of the tables that are available in the data warehouse, and are discussed in detail in Appendix B, Logical Tables.
The database login you use must have read privileges so you are able to view the tables in the selected warehouse. Database instances and database logins are MicroStrategy objects that determine the warehouse to which a project connects. To learn more about these objects, refer to the MicroStrategy Installation and Configuration Guide.
To add and remove tables to the project using the Warehouse Catalog
1 In the Project Creation Assistant, select Select tables from the Warehouse Catalog. The Warehouse Database Instance dialog box opens.

Project Design Guide Creating and Configuring a Project 4
© 2010 MicroStrategy, Inc. Creating a project 87
2 Select a database instance from the drop-down list and click OK. The database instance selected in this dialog box determines which data source is accessed. The Warehouse Catalog opens.
If you have a license for the MultiSource Option, you can add tables from multiple data sources into your project. For information on adding tables from multiple data sources into your project with the Warehouse Catalog, see Accessing multiple data sources in a project, page 330.
You can edit your database instance by clicking Edit.
3 The left side of the Warehouse Catalog lists all available tables and the number of rows each table contains. The list on the right shows all the tables currently being used in the project, if any:
4 From the left side, select the tables you want to add to the Warehouse Catalog, and click > to add the selected tables. Click >> to add all the listed tables.
5 To remove tables from your project, select them from the right side and click < to remove them. Click << to remove all the tables from your project.
Warehouse Catalog options
6 Right-clicking any table provides you with additional Warehouse Catalog functionality.

Creating and Configuring a Project Project Design Guide4
88 Creating a project © 2010 MicroStrategy, Inc.
For example you can view rows in a table, specify a table prefix, copy a table, or specify a database instance for a table. For more information on these abilities and how to use them, see Managing warehouse and project tables, page 311.
7 To set advanced options you can click Options on the Warehouse Catalog toolbar.
For example, you can change the database instance, customize how tables and columns are read from the database system catalog, display extra table and row information, and decide whether schema objects are mapped automatically or manually. For more information on these abilities and how to use them, see Modifying data warehouse connection and operation defaults, page 316.
8 In the toolbar, click Save and Close to save your changes to the Warehouse Catalog. The table definitions are written to the metadata. This process can take some time to complete.
After exiting the Project Creation Assistant, you can still access the Warehouse Catalog to add additional tables. For steps to access the Warehouse Catalog to add tables to a project, see Adding and removing tables for a project, page 310.
The next step in the Project Creation Wizard involves creating schema objects: facts and attributes. Follow the instructions outlined in Creating facts and attributes, page 96 and Configuring additional schema-level settings, page 96 to learn how to create these schema objects and configure additional schema-level settings for those objects.
Creating a new project using Architect
As an alternative to using the Project Creation Assistant that provides a wizard-style process to create a project, you can use Architect to define all the required components of your project from a centralized interface. Architect also provides a visual representation of your project as you create it, which helps to provide an intuitive workflow. For information on using Architect to create a production project, see Creating projects using Architect, page 113.

Project Design Guide Creating and Configuring a Project 4
© 2010 MicroStrategy, Inc. Creating a project 89
Enabling data internationalization for a project
MicroStrategy supports the internationalization of your data into the languages required for your users. This allows translated data from your data source to be integrated into a MicroStrategy project. This data can then be displayed in the various languages that reflect a user’s language preferences.
More specifically, data internationalization allows attribute element data to be displayed in various languages. For example, the Month of Year attribute element data is supplied in both English and German, as shown in the reports below.
The attribute elements for the Month of Year attribute can be supplied in multiple languages through data internationalization. For example, the January, February, and March attribute elements are displayed as Januar, Februar, and März for users that are defined to view data in German.
Data internationalization is different than metadata internationalization. Metadata internationalization allows various MicroStrategy metadata object names, descriptions, and other strings to be supplied in various languages. For example, in a project you can provide the names of attributes, metrics, folders, and other objects in multiple languages. For information on how to provide translated strings for metadata objects such as attributes, metrics, folders and so on, see the System Administration Guide.
MicroStrategy supports data internationalization through two different techniques. You can either provide translated data through the use of extra tables and columns, or you can provide separate databases to store your translated data. For a description of these two methods, see Supporting data internationalization, page 57.

Creating and Configuring a Project Project Design Guide4
90 Creating a project © 2010 MicroStrategy, Inc.
If you plan to use internationalized data with your attributes, you should define how data internationalization is enabled before creating attributes. By defining how internationalized data is represented in your data source, Architect, the Attribute Creation Wizard, and the Fact Creation Wizard can recognize internationalized data when automatically creating attributes. This can save you the time that would be required to go back and modify attributes to recognize and use the internationalized data.
To support one of these data internationalization methods, follow one of the procedures described below:
• Enabling data internationalization through SQL queries, page 90
• Enabling data internationalization through connection mappings, page 92
Enabling data internationalization through SQL queries
If you have configured your data source to use tables and columns to identify your internationalized data, you can define your MicroStrategy project to create SQL queries to return data in the required languages. The SQL queries are automatically generated to return the information in a user’s selected language based on the tables and columns you identify as containing translated data.
For information on configuring your data source to use tables and columns to identify translated data, see Using tables and columns for internationalization, page 58.
To enable data internationalization through SQL queries, you must define the tables and columns used for your internationalized data, as described in the procedure below.
Prerequisites
• A project has been created.
To enable data internationalization through SQL queries
1 In MicroStrategy Desktop, log in to a project.
2 Right-click the project and select Project Configuration. The Project Configuration Editor opens.

Project Design Guide Creating and Configuring a Project 4
© 2010 MicroStrategy, Inc. Creating a project 91
3 In the Categories list, expand Languages, and then select Data.
4 Select the Enable data internationalization check box, and then select the SQL based DI option.
5 Select the check box next to a language to include it as a language enabled for translated data.
To add other languages to enable data internationalization, perform the steps below:
a Click Add. The Available Languages dialog box opens.
b Clear the Display metadata languages only check box.
c Select the check box for languages to enable for data internationalization and click OK to return to the Project Configuration Editor.
6 For each language, include suffixes for the columns and tables that contain your translated data.
Click ... in the Column Pattern for a language, to include suffixes for columns. Click ... in the Table Pattern for a language, to include suffixes for tables. For example, if your data source includes Spanish data in columns that end in _ES, type _ES in the Column Pattern.
The Column Pattern and Table Pattern options expect suffixes to identify your internationalized columns and tables. If you use prefixes or other naming conventions, you can use the functions listed below to identify the columns and tables that contain translated data:
• LStrCut(string s, integer x): Removes x characters from the beginning of the character string s, and returns the remaining character string. For example, LStrCut(“Apple”,2) would return ple.
• RStrCut(string s, integer x): Removes x characters from the end of the character string s, and returns the remaining character string. For example, RStrCut(“Apple”,2) would return App.
• Concat(string s1, string s2): Appends the character string s2 to the end of the character string s1, and returns the resulting character string. For example, Concat(“App”,”le”) would return Apple.

Creating and Configuring a Project Project Design Guide4
92 Creating a project © 2010 MicroStrategy, Inc.
The functions listed above can be used together to support various column and table naming conventions. You can use the parameter #0 to pass the column or table name into the function. To support a prefix rather than a suffix you can use the syntax listed below:
Concat(“Prefix”,#0)
For example, to use a prefix of ES_ to identify columns that contain Spanish data, you can use the syntax listed below:
Concat(“ES_”,#0)
7 Click OK to save your changes and close the Project Configuration Editor.
Enabling data internationalization through connection mappings
You can support data internationalization in your database by using separate databases for each translation. A user can then be granted access, through connection mappings, to the database that contains their preferred language.
For information on configuring your data source to use separate databases and connection mappings to identify internationalized data, see Using separate databases for internationalization, page 62.
To enable data internationalization through separate databases and connection mappings, you must define the databases used for each language, as described in the procedure below.
Prerequisites
• A project has been created.
To enable data internationalization through separate databases and connection mappings
1 In MicroStrategy Desktop, log in to a project.
2 Right-click the project and select Project Configuration. The Project Configuration Editor opens.
3 In the Categories list, expand Languages, and then select Data.
4 Select the Enable data internationalization check box, and then select the Connection mapping based DI option.

Project Design Guide Creating and Configuring a Project 4
© 2010 MicroStrategy, Inc. Creating a project 93
5 Select the check box next to a language to include it as a language enabled for translated data.
To add other languages to enable data internationalization, perform the steps below:
a Click Add. The Available Languages dialog box opens.
b Clear the Display metadata languages only check box.
c Select the check box for languages to enable for data internationalization and click OK to return to the Project Configuration Editor.
6 For each language, from the Database Connection drop-down list, select a database connection to use for the language. The database connection determines the data source that stores the translated data and the login information to connect to the data source. You can leave this drop-down list blank to use the database connection for the default database instance of the project.
7 Click OK to save your changes and close the Project Configuration Editor.
Using read only or edit mode for schema editors
When opening a schema editor such as Architect, the Attribute Editor, the Fact Editor, and so on, you can choose to open the editor in read only mode or edit mode. These two modes allow some users to view the definition of schema objects (read only mode), while one user can make changes to the schema objects (edit mode).
To create and modify a project, you must be able to edit the schema objects of a project. If another user is editing a schema object, this can lock the schema from being edited by other users. This maintains the integrity of the project schema.
However, if some users only want to use the various schema editors to view the definitions of project schema objects to learn more information about them, they can use read only mode. This allows another user to modify the schema, while other users can view the schema objects without making any modifications.
The mode can be chosen in the Read Only dialog box that opens when opening any schema editor, which has the following options:

Creating and Configuring a Project Project Design Guide4
94 Creating a project © 2010 MicroStrategy, Inc.
• Read Only: Read only mode allows you to view the schema objects without locking the schema from other users. However, you cannot make any changes to the schema object.
If you open a schema editor in read only mode, the entire project is enabled to use read only mode. This means that every schema editor automatically opens in read only mode. However, from the Schema menu in Desktop, you can clear the Read Only option to switch to edit mode. If you have a schema editor open, you must close and re-open the schema editor to switch to edit mode for that schema editor.
If you are working in read only mode, you cannot access schema editors that require the ability to make updates to the project, which includes the Attribute Creation Wizard, Fact Creation Wizard, Warehouse Catalog, MDX Cube Catalog, and the options to update the project schema.
• Edit: Edit mode provides the standard capabilities of modifying schema objects, and it locks the schema from being modified by all other users. Therefore, only one user can be using edit mode for a project at a given time.
If you open a schema editor in edit mode, the entire project is enabled to use edit mode. This means that every schema editor automatically opens in edit mode. However, from the Schema menu in Desktop, you can select the Read Only option to switch to read only mode. If you have a schema editor open, it is also switched to read only mode automatically and you cannot make any changes to schema objects.
You must use edit mode to access schema editors that require the ability to make updates to the project, which includes the Attribute Creation Wizard, Fact Creation Wizard, Warehouse Catalog, MDX Cube Catalog, and the options to update the project schema.
If someone has already locked the schema for a project, a message is displayed and you can only open the schema editor in read only mode.
• Remember my selection as a default preference for future sessions: When this option is selected, the mode you select is defined as the default mode to use when opening any schema editor, and you are not prompted again to choose the mode for any schema editors. If you clear this check box, the mode you select is used for all schema editors only until you end the user session and close Desktop.
If you select this check box, this becomes the default mode for all schema editors and you cannot change the default mode. However, you can switch between read only mode and edit mode in Desktop, from the Schema menu, by selecting or clearing the Read Only Mode option.

Project Design Guide Creating and Configuring a Project 4
© 2010 MicroStrategy, Inc. Creating a project 95
Creating a test or prototype project using Project Builder
Project Builder is a wizard that allows you to create simple MicroStrategy projects quickly and efficiently. Project Builder was created with speed in mind; thus it provides only a subset of the features and functionality of the Project Creation Assistant. It allows you to rapidly create user hierarchies and simple metrics and reports. With Project Builder, you can build project prototypes for proof-of-concept tests with your own data and simple yet functional projects.
To create a project for your production environment, it is highly recommended you follow the steps outlined in Creating a production project, page 79. The Project Creation Assistant and Architect can add greater functionality and capability to your project in your production environment.
To learn more about Project Builder, proceed through this section. You can also refer to the Introduction to MicroStrategy: Evaluation Guide and the Project Builder online help (press F1 from within Project Builder).
Using Project Builder
By default, Project Builder uses a Microsoft Access database for the metadata repository. A Microsoft Access database is suitable for creating the metadata repository for a prototype project, but not a production project. You should not use Microsoft Access for anything other than a proof-of-concept or demonstration type of application.
You can use Project Mover to move a demonstration project into a production-ready database (see the System Administration Guide.)
Project Builder contains the following options that assist you in creating a prototype project:
• My Database allows you to name the project and select the database that contains the business information you want to analyze with the project you create.
• My Business Model allows you to identify relationships that define the business information in your database. Project Builder uses this structure to help you analyze the data.
• My Reports allows you to use the attributes and metrics you defined using My Business Model, to create a variety of reports. These reports are

Creating and Configuring a Project Project Design Guide4
96 Creating facts and attributes © 2010 MicroStrategy, Inc.
based on pre-defined templates. You can also preview and run the reports.
You can learn about creating and designing reports in more detail in the MicroStrategy Basic Reporting Guide.
To access Project Builder from the Start menu, point to Programs, then point to MicroStrategy, then point to Desktop, and then select Project Builder.
Creating facts and attributesThis step in the project creation process involves using the Project Creation Assistant or Architect to create two kinds of schema objects: facts and attributes.
Before you create facts and attributes, however, it is important to understand what facts and attributes are and the defining characteristics of each. This information is covered in Chapter 6, The Building Blocks of Business Data: Facts and Chapter 7, The Context of Your Business Data: Attributes.
Configuring additional schema-level settingsThe final step in the project creation process involves configuring additional schema-level settings to add more analytical depth to your schema objects and optimize the project as a whole. These settings include:
• Fact definitions: The Fact Editor allows you to create, edit, and configure facts one at a time. This is covered in Creating and modifying simple and advanced facts, page 182.
Architect also allows you to create, edit, and configure any and all facts for your project. This is covered in Creating and modifying facts, page 131.
• Attribute definitions: The Attribute Editor allows you to create and edit attributes, attribute relationships, attribute forms, and attribute form expressions for attributes one at a time. This is covered in Adding and modifying attributes, page 224.

Project Design Guide Creating and Configuring a Project 4
© 2010 MicroStrategy, Inc. Deploying your project and creating reports 97
Architect also allows you to create and edit any and all attributes, attribute relationships, attribute forms, and attribute form expressions for your project. This is covered in Creating and modifying attributes, page 144 and Defining attribute relationships, page 166.
• User hierarchies: The Hierarchy Editor allows you to create user hierarchies, which facilitate access to attribute and element browsing and drilling. This is covered in Chapter 8, Creating Hierarchies to Organize and Browse Attributes.
Architect also allows you to create any and all user hierarchies for your project. This is covered in Creating and modifying user hierarchies, page 173.
• Advanced configurations: These objects include transformations, aggregate tables, and partitioning and partition mappings:
The Transformation Editor allows you to create transformations, which are schema objects used for time-series analysis. Transformations are covered in Chapter 10, Creating Transformations to Define Time-Based and Other Comparisons.
The tools used to create aggregate tables and partitions are the Warehouse Catalog, the Metadata Partition Mapping Editor, and the Warehouse Partition Mapping Editor. This information is covered in Chapter 9, Optimizing and Maintaining Your Project.
Now that you have completed most of the key steps in creating a new project, proceed to the chapters referenced above to complete the next steps in the project creation process.
Deploying your project and creating reportsAfter you create a project, you can deploy it to your user community using MicroStrategy Web. Keep in mind, however, that if you completed only the steps in this chapter, the project you deploy will contain only basic facts and attributes. Proceed to the chapters listed above to add analytical depth and more functionality to your project.
Facts and attributes provide the backbone of the reports and documents created by report designers. Facts are used to create metrics, and metrics and attributes are essential components of reports.
Creating and Configuring a Project Project Design Guide4
98 Deploying your project and creating reports © 2010 MicroStrategy, Inc.
Metrics, and other report objects such as filters, custom groups, and prompts, are beyond the scope of this guide. For a complete discussion of metrics, filters, reports, and other report objects, refer to the MicroStrategy Basic Reporting Guide and the MicroStrategy Advanced Reporting Guide.
To learn more about how to deploy your project using MicroStrategy Web, refer to the Deploying your Project with MicroStrategy Web chapter of the MicroStrategy Installation and Configuration Guide.
You can also begin creating reports in MicroStrategy Desktop and MicroStrategy Web. For information about creating reports in MicroStrategy Desktop, refer to the MicroStrategy Basic Reporting Guide; for creating reports in MicroStrategy Web, see the MicroStrategy Web online help.
Note the following:
• MicroStrategy allows you to connect to your SAP BI, Microsoft Analysis Services, and Hyperion Essbase data sources. For information about connecting to MDX Cube sources, see the MicroStrategy MDX Cube Reporting Guide.
• For information on how to use your own customized SQL statements to create reports, see the Creating Freeform SQL reports chapter in the MicroStrategy Advanced Reporting Guide.

© 2010 MicroStrategy, Inc. 99
55.CREATING A PROJECT USING ARCHITECT
Introduction
MicroStrategy includes a project design tool known as Architect. Architect allows you to define all the required components of your project from a centralized interface. Architect also provides a visual representation of your project as you create it, which helps to provide an intuitive workflow.
Architect is provided in addition to the Project Creation Assistant, which is a wizard-style tool that steps you through the process of creating a project. Rather than providing a step-by-step process to create a project, Architect allows you to see your project take shape as you create it. For a comparison of Architect and the Project Creation Assistant, see Architect versus Project Creation Assistant, page 81.
Architect provides a wide range of project creation and modification tasks, which are covered in the sections of this chapter listed below:
• Creating and modifying projects, page 100
• Adding, removing, and administering tables, page 119
• Creating and modifying facts, page 131
• Creating and modifying attributes, page 144

Creating a Project Using Architect Project Design Guide5
100 Creating and modifying projects © 2010 MicroStrategy, Inc.
• Defining attribute relationships, page 166
• Creating and modifying user hierarchies, page 173
Creating and modifying projectsArchitect allows you to complete all tasks related to initial project creation as well as modifications required over the full life cycle of a project, which includes:
• Defining project creation and display options, page 100
• Creating projects using Architect, page 113
• Modifying projects using Architect, page 116
• Using the Architect toolbar, page 118
Defining project creation and display options
Architect provides various options that determine how you can create and modify projects. Reviewing and defining these options before using Architect can save you time when creating and modifying projects.
The options you can define determine how Architect displays data, automatically creates and maps schema objects, loads the Warehouse Catalog, and updates the project’s schema. Some of these options are available in the MicroStrategy Architect Settings dialog box. For steps to access this dialog box, see Accessing the Architect options, page 101. The available options are described in the sections listed below:
• Controlling the view that is displayed when starting Architect, page 101
• Disabling the ability to add tables, page 109
• Automatically updating the project schema, page 109
• Creating metrics based on the facts of a project, page 109
You can also access various Architect options from the Architect toolbar, as described below:
• From the Home tab:

Project Design Guide Creating a Project Using Architect 5
© 2010 MicroStrategy, Inc. Creating and modifying projects 101
In the View area, click the arrow icon ( ) to access the following configurations:
– Displaying columns and attribute forms in tables, page 106
In the Auto Arrange area, click the arrow icon ( ) to access the following configurations:
– Defining the layout of the Architect working area, page 112
• From the Design tab:
In the Auto Recognize area, click the arrow icon ( ) to access the following configurations:
– Automating the creation of facts and attributes, page 102
– Automatically mapping columns to existing attribute forms and facts, page 105
– Automatically defining attribute relationships, page 111
Accessing the Architect options
You can access the MicroStrategy Architect Settings dialog box from Architect. In Architect, from the Architect Button, select Settings. The MicroStrategy Architect Settings dialog box opens.
Controlling the view that is displayed when starting Architect
Architect allows you to choose whether to display the Project Tables View or the Hierarchy View when starting Architect. You can configure this behavior using the Choose the default open view drop-down list. This drop-down list is available in the Configuration tab of the MicroStrategy Architect Settings dialog box. You can choose from the options listed below to determine what view is displayed when Architect opens:
• Last Used: Select this option to display the view that was used last during the most recent use of Architect.
• Project Tables View: Select this option to display the Project Tables View.
• Hierarchy View: Select this option to display the Hierarchy View.

Creating a Project Using Architect Project Design Guide5
102 Creating and modifying projects © 2010 MicroStrategy, Inc.
Automating the creation of facts and attributes
You can save time during the schema creation process of designing a project by allowing Architect to automatically create attributes and facts. Architect can create attributes and facts automatically when you add tables to your project. The attributes and facts are created based on data types, database column names, primary and foreign keys, and other schema creation heuristics.
You can define how attributes and facts are created when tables are added to your project by defining the automatic column recognition rules. To access the options listed below, from the Design tab, in the Auto Recognize area, click the arrow icon ( ):
• Do not auto recognize: Select this option to disable the automatic creation of attributes and facts when tables are added to your project using Architect.
This can be a good option to use if you are updating a project in which you have already defined the bulk of the project schema. In this scenario, it prevents Architect from automatically defining attributes and facts that might not be needed in the project. After adding extra tables to your project you can create any required attributes and facts in a way that fits your current project schema.
• Auto recognize: Select this option to enable the automatic creation of attributes and facts when tables are added to your project using Architect.
This option can save time during the schema creation process of designing a project by allowing Architect to automatically create attributes and facts.
When selecting this option, facts are created for database columns that use numeric data types and are not used for attribute forms. Attributes and attribute forms are created based on various schema creation heuristics and the rules that you define with the Advanced Options listed below:
Separator: Type the character used as a separator in your database column names. For example, a database column name such as USER_ID uses the underscore character (_) as a separator.
Attribute naming rule: Type database column name suffixes that identify that the column should be mapped to a new attribute as the identity form. For example, the suffix ID is commonly used for database columns that are mapped to attributes as an identity form.

Project Design Guide Creating a Project Using Architect 5
© 2010 MicroStrategy, Inc. Creating and modifying projects 103
Use a semicolon (;) to separate suffixes that are to be mapped to new attributes.
You can also define how the attribute name is created. Use the vertical bar (|) to define what the suffix is replaced with in the resulting attribute name. The text to the left of the | character is the suffix, and the text to the right of the | character is what replaces the suffix in the attribute name that is created.
For example, including ID|; creates new attributes for any database columns that use the suffix ID, and removes the ID suffix from the attribute name. When a table that uses a column such as USER_ID is imported into the project, a new attribute named User is created. Including DT|DATE; creates new attributes for any database columns that use the suffix DT, and replaces the DT suffix with DATE when creating an attribute name. When a table that uses a column such as YEAR_DT is imported into a project, a new attribute named Year Date is created.
Attribute form naming rule: Type database column name suffixes that identify that the column should be mapped to a new attribute form. For example, the suffix DESC is commonly used for database columns that are mapped to description attribute forms.
Use a semicolon (;) to separate suffixes that are to be mapped to new attribute forms.
You can also define how the attribute form name is created. Use the vertical bar (|) to define what the suffix is replaced with in the resulting attribute form name. The text to the left of the | character is the suffix, and the text to the right of the | character is what replaces the suffix in the attribute form name that is created.
For example, including DSC|DESC; creates new attribute forms for any database columns that use the suffix DSC, and replaces the DSC suffix with DESC when creating an attribute form name. When a table that uses a column such as PRODUCT_DSC is imported into a project, a new attribute form named Product Desc is created.
In addition to using these rules to define attributes and attribute forms, selecting the Auto recognize option also employs other schema creation heuristics:
– The automatic column mapping rules described in Automatically mapping columns to existing attribute forms and facts, page 105, are employed to map columns to existing attribute forms that use the columns in their definitions.

Creating a Project Using Architect Project Design Guide5
104 Creating and modifying projects © 2010 MicroStrategy, Inc.
– An attribute is created for any column defined as a primary or foreign key, and the column name for the primary key is used to define the attribute name. The column name for the primary key is used to define the attribute name even if the primary key column is not included in the project.
– Every column must be mapped to either a fact or an attribute. If none of the schema creation heuristics or the rules you define can determine whether to create a fact or attribute for the column, an attribute is created for the column.
Auto recognize form format: Select this check box to define when attribute form formats are applied to newly created attribute forms. Attribute form formats control how the form is displayed and how filters are defined. For example, specifying a format type of Big Decimal allows users to preserve precision when qualifying on a form with more than 15 digits. For more detailed information on each form format type, see Format types, page 433.
You can define rules on when to apply attribute form formats by using the Options listed below:
– Default form format: Select the form format to use for forms that do not fit any of the other form format rules. The default selection is Text. You cannot define the rules for when to use the default form format, as it is implicitly defined to be used when all other form format rules are not met.
– Form format: Select a form format, and define the rules for applying the form format to newly created attribute forms. The rules for when to apply a certain form format are defined by the options listed below. If you supply neither a column data type nor a column naming rule for a form format, the form format is never automatically applied to a newly created attribute form.
• Column data type: Select the column data types relevant to a form format. Only columns with one of the selected data types are considered to be defined as the associated form format. For example, the Number form format is defined to be used for columns with decimal, double, float, integer, numeric, and real data types by default. If you do not select relevant data types for a form format, only the column naming rules described below are used to determine when to apply the associated form format.
• Naming rules: Type the column names relevant to a form format, separated by a semicolon (;). Only columns with one of the provided column names are considered to be defined as the
Project Design Guide Creating a Project Using Architect 5
© 2010 MicroStrategy, Inc. Creating and modifying projects 105
associated form format. For example, the Picture form format is defined to be used for columns with Picture, Image, Icon, Drawing, Figure, Photo, and Print column names by default. If you do not type relevant column names for a form format, only the column data type rules described above are used to determine when to apply the associated form format.
An attribute form can only have one form format. The rules for each form format should be defined so that they are all mutually exclusive. If an attribute form meets the rule requirements of more than one form format, the first form format in the Form format list is applied to the form.
Automatically mapping columns to existing attribute forms and facts
You can save time during the schema creation process of designing a project by allowing Architect to automatically map columns to attribute forms and facts already defined in your project. Architect can map columns to existing attribute forms and facts automatically when you add tables to your project.
You can enable the automatic mapping of columns to attribute forms and facts in your project when tables are added to your project by selecting the Use automatic column mapping check box. To access this option, from the Design tab, in the Auto Recognize area, click the arrow icon ( ).
When this option is enabled and tables are added to your project, the column expressions included in the table are compared to the column expressions used in attribute forms and facts. If an attribute form or fact is found that matches the column expression, then the column is mapped to that attribute form or fact. For example, the MicroStrategy Tutorial project maps the Revenue fact to the column TOT_DOLLAR_SALES. If automatic column mapping is enabled and you use Architect to add a table that includes the TOT_DOLLAR_SALES column to the project, the TOT_DOLLAR_SALES column for the table is automatically mapped to the Revenue fact.
The Use automatic column mapping option is particularly helpful to automatically map columns in newly added tables to existing facts and attributes, without creating any new facts or attributes. To map columns in newly added tables to existing facts and attributes, as well as create new facts and attributes based on various rules, you should enable the Auto recognize option, as described in Automating the creation of facts and attributes, page 102.

Creating a Project Using Architect Project Design Guide5
106 Creating and modifying projects © 2010 MicroStrategy, Inc.
Displaying columns and attribute forms in tables
When you add tables to your project using Architect, you can view the various schema objects included in the table as well as the columns that are used to define the schema objects.
The display of data available in the tables included in your project can be defined using the options listed below.
To access the options listed below, from the Home tab, in the View area, click the arrow icon ( ).
• Physical Tables View area, page 106
• Visible Links area, page 108
Physical Tables View area
Prior to selecting options in the Project Tables view area, you must choose to display the data available in tables in either physical view or logical view. This can be defined using the following Architect toolbar options:
• Display table physical view: On the toolbar, select this option to display the columns that are available in the table. Columns are displayed in the form Column_Name : Column_Data_Type. For example, the YR_CATEGORY_SLS table from the MicroStrategy Tutorial project shown below is displayed in physical view:
If you display tables in physical view, the options in the Project Tables View area have no affect on the display of data within the tables in Architect.
• Display table logical view: On the toolbar, select this option to display the columns that are available in the table and how they relate to MicroStrategy schema objects. The LU_YEAR and LU_REGION tables

Project Design Guide Creating a Project Using Architect 5
© 2010 MicroStrategy, Inc. Creating and modifying projects 107
from the MicroStrategy Tutorial project shown below are used to illustrate the various logical view options available for displaying columns and attribute forms in tables.
If you display tables in logical view, the options in the Project Tables View area can be used to modify the display of data within tables in Architect. These options are described below:
Display available columns on logical tables: Select this logical view option to display columns that are available in the table but are not used in any schema objects in the project. Columns are displayed in the form Column_Name : Column_Data_Type.
In the LU_YEAR table shown above, selecting this option displays the PREV_YEAR_ID : INTEGER column which has not been mapped to a schema object.
You can also display this information for an individual table by right-clicking a table, pointing to Properties, then pointing to Logical View, and selecting Display Available Columns.
Selecting this option also allows you to select the option described below:
– Display columns used for data internationalization: Select this option to display columns that are available in the table that used for data internationalization. Columns are displayed in the form Column_Name : Column_Data_Type. In the LU_REGION table shown above, selecting this option displays the various REGION_NAME columns that are used to translate the name of a region into various languages.

Creating a Project Using Architect Project Design Guide5
108 Creating and modifying projects © 2010 MicroStrategy, Inc.
For information on supporting internationalized data in a data source, see Supporting data internationalization, page 57.
Display used columns on logical tables: Select this option to display the columns (and their data types) that are used in schema objects in the project. Columns are displayed in the form Column_Name : Column_Data_Type.
In the LU_YEAR table shown above, selecting this option displays the YEAR_ID : INTEGER column, which is used for the ID form of the attribute Year. Selecting this option for the LU_YEAR table also displays the YEAR_DATE : TimeStamp column mapped to the date form of the attribute Year, as well as the YEAR_DURATION : INTEGER column mapped to the fact Year Duration.
You can also display this information for an individual table by right-clicking a table, pointing to Properties, then pointing to Logical View, and selecting Display Used Columns.
Display attribute forms on logical tables: Select this option to display attribute forms that are mapped to columns of the table. Attribute forms are displayed in the form Attribute_Form_Name : Attribute_Form_Category (Column_Name).
In the LU_YEAR table shown above, selecting this option displays the ID form and the Date form for the attribute Year.
You can also display this information for an individual table by right-clicking a table, pointing to Properties, then pointing to Logical View, and selecting Display Attribute Forms.
Visible Links area
• Maximum number of visible links per row: Define the number of link lines that are displayed when you select a column, fact, attribute, or attribute form in a table. When selecting one of these objects in a table, a line is drawn to each occurrence of this object in other tables included in the project. For example, selecting the Year attribute in the LU_YEAR table displays a line that connects to every other occurrence of the Year attribute in other tables.

Project Design Guide Creating a Project Using Architect 5
© 2010 MicroStrategy, Inc. Creating and modifying projects 109
Disabling the ability to add tables
By default, Architect allows you the flexibility to browse the Warehouse Catalog to add new tables to your project. However, it can be beneficial to disable the ability to add tables to your project if your project includes all the required tables. This prevents any unnecessary tables from being added to the project, which can trigger the creation of unnecessary schema objects. It also provides better performance while using Architect since all the tables in the Warehouse Catalog do not have to be made available.
You can disable the ability to add new tables to your project using Architect by selecting the Disable loading warehouse catalog check box. This option is available in the Configuration tab of the MicroStrategy Architect Settings dialog box. Any tables not included in the project are hidden from view in Architect.
Automatically updating the project schema
Changes made in Architect affect the schema of your project. By default, the schema of your project is updated when you save your changes and exit Architect. This ensures that your project is updated to reflect your modifications.
Updating your project schema every time that you exit Architect can be disabled. The schema update process can require a substantial load on your Intelligence Server and require a considerable amount of time to complete. You may also have other project updates that you plan to perform after using Architect. In these scenarios, you can disable the project schema update process, and instead execute a schema update manually at the desired time. You can disable the project schema update process from occurring when closing Architect by clearing the Update schema after closing Architect check box. This option is available in the Configuration tab of the MicroStrategy Architect Settings dialog box.
Creating metrics based on the facts of a project
Architect allows you to create metrics based on the facts created for a project. This can reduce the time it takes to create the basic metrics for your project.
The options to create metrics based on the facts of your project are available in the Metric Creation tab of the MicroStrategy Architect Settings dialog box.

Creating a Project Using Architect Project Design Guide5
110 Creating and modifying projects © 2010 MicroStrategy, Inc.
On this tab, you can allow the automatic creation of metrics using the aggregation functions listed below:
• Avg: To create metrics that perform an average calculation on the fact expression.
• Sum: To create metrics that perform a summation calculation on the fact expression.
• Count: To create metrics that perform a count calculation on the fact expression.
• Min: To create metrics that perform a minimum calculation on the fact expression.
• Max: To create metrics that perform a maximum calculation on the fact expression.
• Var: To create metrics that perform a variance calculation on the fact expression.
• Advanced Options: Click Advanced Options to open the Advanced Options dialog box, which lets you define metric naming conventions. A metric naming convention can be defined for each aggregation function listed above. When a metric is created for an aggregation function, the metric naming convention for that aggregation function is used to define the name for the metric. You can use the characters %1 to insert the name of the fact into the metric name. For example, you can create the following metric naming convention for metrics created based on the Avg aggregation function.
Average %1
If you create a fact named Cost and select to create metrics with the Avg aggregation function, a metric with the name Average Cost is created by substituting the fact name for the %1 characters in the metric naming convention.
When a fact is created for a project, metrics are created for the fact using the selected aggregation functions. A separate metric is created to support each aggregation of a fact. The metrics are created in the Public Objects/ Metrics folder of a MicroStrategy project.

Project Design Guide Creating a Project Using Architect 5
© 2010 MicroStrategy, Inc. Creating and modifying projects 111
Automatically defining attribute relationships
Architect allows you to create attribute relationships based on the design of the data in your data source. This can help reduce the time required to create the relationships between the attributes within a project.
To access the options to automatically create attribute relationships between the attributes within a project option, from the Design tab, in the Auto Recognize area, click the arrow icon ( ). You can select from the following options to automatically create attribute relationships:
• Do not automatically create relations: Attribute relationships are not automatically created based on the design of the data in your data source. For information on manually defining attribute relationships with Architect, see Defining attribute relationships, page 166.
• Automatically create relations in System Hierarchy: Attribute relationships are automatically created based on the design of the data in your data source as you add tables to your project. To execute the action of automatically defining attribute relationships you can use the System Hierarchy dialog box, as described in Automatically defining attribute relationships, page 171.
Attribute relationships are created based on the rules that you select in the Advanced Options, as described below:
Based on Primary Keys/Foreign Keys: Creates attribute relationships based on the primary keys and foreign keys defined on your tables. Each attribute that acts as a foreign key of a table is defined as a parent attribute of each attribute that acts as a primary key of the same table. The attribute relationship is defined as a one-to-many relationship from the foreign key attribute (parent attribute) to the primary key attribute (child attribute).
Based on lookup tables: Creates attribute relationships based on lookup tables that do not include primary key or foreign key information. To define a table as a lookup table for an attribute, see Creating attributes, page 144. Each attribute that defines a table as its lookup table is defined as a child attribute of all other attributes in the same table, that do not define the table as its lookup table. Each attribute relationship is defined as a one-to-many relationship from the parent attribute to the child attribute.
Based on sample data from the table: Creates attribute relationships for attributes that share the same lookup table. To define a table as a lookup table for an attribute, see Creating attributes, page 144.
Creating a Project Using Architect Project Design Guide5
112 Creating and modifying projects © 2010 MicroStrategy, Inc.
Architect analyzes sample data for the table. The attributes with fewer distinct values are defined as parents of the attributes with more distinct values, using a one-to-many relationship from the parent attribute to the child attribute. For example, a lookup table includes four rows of data, which include data related to year and quarter. Each row includes the same year (for example, 2009), but the quarter changes for each row (Q1, Q2, Q3, Q4). In this case, the Year attribute is created as a parent of the Quarter attribute.
After all relationships are determined by the rules that you selected, Architect performs a final analysis on the attribute relationships that are to be created. Any attribute relationships that are found to be redundant are not created. This ensures that attribute relationships are created that properly reflect the design of the data in your data source. For information on modifying the attribute relationships that are created, see Defining attribute relationships, page 166.
Defining the layout of the Architect working area
Architect allows you to define the layout of the working area for the Project Tables View and the Hierarchy View in Architect using the auto arrange options on the Architect toolbar. You can also define the margins of this working area using the options listed below:
To access the options listed below, from the Home tab, in the Auto Arrange area, click the arrow icon ( ).
• Margin to the left: Type the number of pixels to use as a margin for the left side of the Architect working area. This provides white space at the left margin of the working area, which can provide visual separation between the working area and the other panes and options available on the Architect interface.
• Margin to the right: Type the number of pixels to use as a margin for the right side of the Architect working area. This provides white space at the right margin of the working area, which can provide visual separation between the working area and the other panes and options available on the Architect interface.

Project Design Guide Creating a Project Using Architect 5
© 2010 MicroStrategy, Inc. Creating and modifying projects 113
Creating projects using Architect
Rather than using the Project Creation Assistant that provides a step-by-step process to create a project, you can use Architect to visually perform the initial creation of a project. However, before you can begin using Architect, you must first create the project object with the Project Creation Assistant and define various Architect project creation options.
Prerequisites
• Before creating a project, you must connect to a metadata repository and to a data source, as described in the sections listed below:
Connecting to the metadata repository, page 77
Connecting to a data source, page 78
You should also review the information in Chapter 4, Creating and Configuring a Project before creating a project using Architect.
To create a new project using Architect
1 Log in to a project source in MicroStrategy Desktop.
To create a project source which connects to your data through Intelligence Server, see the Configuring and Connecting Intelligence Server chapter of the MicroStrategy Installation and Configuration Guide.

Creating a Project Using Architect Project Design Guide5
114 Creating and modifying projects © 2010 MicroStrategy, Inc.
2 From the Schema menu, select Create New Project. The Project Creation Assistant opens, as shown below:
3 Click Create project. The New Project page opens.
4 Define the project configuration settings listed below:
• Name: A name for the project. This name is used to identify a project within a project source.
• Description: An optional description for the project. This description can give a brief overview of the purpose of the project as compared to your other projects.
• Default document directory: The directory location to store all HTML documents. For more details on how to set up HTML documents for a project, see the Installation and Configuration Guide.
• Enable the guest user account for this project: Select this check box to allow users to log in to a project without any user credentials. Users can then to connect to Intelligence Server with a limited set of privileges and permissions (defined by the Public group).

Project Design Guide Creating a Project Using Architect 5
© 2010 MicroStrategy, Inc. Creating and modifying projects 115
• Enable Change Journal for this project: Select this check box to enable the Change Journal for the project. An entry is automatically included in this journal when any object in a project is modified, allowing you to keep track of any changes to your project. For information on the Change Journal, see the System Administration Guide.
• Languages: Click this button to define languages that are available for metadata objects in this project. The languages that you select are also languages that are available for the internationalization of your metadata objects. If a language is available for a project, you can provide object names, descriptions, and other information in various languages. For example, in a project you can provide the names of attributes, metrics, folders, and other objects in multiple languages. For information on how to provide internationalized data for metadata objects such as attributes, metrics, folders, and so on, see the System Administration Guide.
MicroStrategy provides internationalized data for common metadata objects in the available, default languages listed. For example, data is available for the name and description of the Public Objects folder as well as other common objects for each language listed as available by default. If you add other languages, you must supply all internationalized data for common metadata objects.
Be aware of the following:
– When you create a new project, a language check ensures that the language settings of the user profile of the local machine (the CURRENT_USER registry key), the language of the local machine (the LOCAL_MACHINE registry key), and the Project locale property match. If these properties do not match, it can lead to inconsistencies in the language display. The language check prevents these inconsistencies and ensures that the language display is consistent across the project.
– These language options are not related to supporting the integration of internationalized data from your data source into MicroStrategy. Information on defining your data source to support data internationalization is provided in Supporting data internationalization, page 57. If you plan to use internationalized data from your data source with attributes in a project, you must define how data internationalization is enabled before creating attributes. Enabling data internationalization is described in Enabling data internationalization for a project, page 89.
Creating a Project Using Architect Project Design Guide5
116 Creating and modifying projects © 2010 MicroStrategy, Inc.
5 Click OK to create the project object.
6 Click the arrow for Architect. The Warehouse Database Instance dialog box opens.
To continue creating the project with the Project Creation Assistant, see Creating a new project using the Project Creation Assistant, page 82.
7 Select a database instance from the drop-down list. The database instance selected in this dialog box determines which data source is accessed.
8 Click OK. MicroStrategy Architect opens.
9 From the Architect Button, select Settings. The MicroStrategy Architect Settings dialog box opens.
10 Define the various options for how Architect displays data, automatically creates and maps schema objects, loads the Warehouse Catalog, and updates the project’s schema.
Reviewing and defining these options before using Architect can save you a lot of time when creating and modifying projects. For information on all the options available, see Defining project creation and display options, page 100.
11 Click OK. You can now begin to add tables to your project, and create attributes, facts, user hierarchies, and so on. These tasks are listed below:
a Adding tables, page 121
b Creating facts, page 132
c Creating attributes, page 144
d Defining attribute relationships, page 166
e Creating user hierarchies, page 173
Modifying projects using Architect
After creating your project, modifications to schema objects can be completed in separate editors including the Fact Editor, Attribute Editor, Hierarchy Editor, and so on. These editors provide all of the simple and advanced schema object features, allowing you to create and modify schema objects one-by-one.

Project Design Guide Creating a Project Using Architect 5
© 2010 MicroStrategy, Inc. Creating and modifying projects 117
Architect provides a single integrated environment in which you can make project-wide changes as well as create or modify individual schema objects. Rather than creating or modifying schema objects one-by-one, you can create and modify multiple schema objects for your project. Architect also allows you to add tables to your project and create or modify attributes, facts, and user hierarchies all from the same interface.
Modifying your project using Architect also allows you to lock the schema of your project, preventing users from encountering reporting issues or returning outdated data during periods of scheduled project maintenance.
When opening a project with Architect, basic information is loaded for all the objects in a project. These objects include attributes, facts, tables, and so on. Once the project is open and accessible in Architect, additional information for the objects are loaded incrementally as well as on an as-needed basis. This allows Architect to load projects faster than if all information for a project was loaded when first opening the project in Architect.
The procedure below provides steps to modify a project using Architect.
Prerequisite
• A project has been created.
To modify a project using Architect
1 In MicroStrategy Desktop, log in to a project.
2 From the Schema menu, select Architect.
3 If a message is displayed asking if you want to open Architect in read only mode or edit mode, select Edit and click OK to open Architect in edit mode so that you can make changes to the project. MicroStrategy Architect opens.
Note the following:
– If you are only given the option of opening Architect in read only mode, this means another user is modifying the project’s schema. You cannot open Architect in edit mode until the other user is finished with their changes and the schema is unlocked.
– For information on how you can use read only mode and edit mode for various schema editors, see Using read only or edit mode for schema editors, page 93.

Creating a Project Using Architect Project Design Guide5
118 Creating and modifying projects © 2010 MicroStrategy, Inc.
4 From the Architect Button, select Settings. The MicroStrategy Architect Settings dialog box opens.
5 Define the various options for how Architect displays data, automatically creates and maps schema objects, loads the Warehouse Catalog, and updates the project’s schema.
Reviewing and defining these Architect options before using Architect can save you a lot of time when creating and modifying projects. For information on all the options available, see Defining project creation and display options, page 100.
6 Click OK to return to Architect. You can now begin to add or remove tables to your project and create and modify attributes, facts, user hierarchies, and so on:
• Adding, removing, and administering tables, page 119
• Creating and modifying facts, page 131
• Creating and modifying attributes, page 144
• Defining attribute relationships, page 166
• Creating and modifying user hierarchies, page 173
Using the Architect toolbar
Architect provides a set of toolbar icons, shown in the image below, to facilitate the tasks of creating and modifying a project.
The options that are available on the toolbar are determined by whether you are in Project Tables View or Hierarchy View determines. To review detailed information on each toolbar option, with Architect open, press F1 to open the Architect online help and search for the topic Architect: Toolbar options.

Project Design Guide Creating a Project Using Architect 5
© 2010 MicroStrategy, Inc. Adding, removing, and administering tables 119
Adding, removing, and administering tablesThe warehouse tables for a project determine the set of data available to be analyzed in the project. You can use Architect to add, remove, update, and manage tables for your project.
You can also use the Warehouse Catalog to add tables to and remove tables from your project, as described in Adding tables using the Warehouse Catalog, page 86.
Architect displays all of the available data sources for the project in the Warehouse Tables pane, as shown below.
If the Warehouse Tables pane is not displayed in Architect, from the Home tab, in the Panels area, click Show the Warehouse tables section. The Warehouse Tables pane is only available in the Project Tables View of Architect.
Within each data source is a list of all the tables in the data source to which you are connected through a database instance. From this list, you select the lookup, fact, and relationship tables to use in your new project. You should also include all other tables needed to complete your project, including transformation tables, aggregate tables, and partition mapping tables.
The database login you use must have read privileges so you are able to view the tables in the selected data source. Database instances and

Creating a Project Using Architect Project Design Guide5
120 Adding, removing, and administering tables © 2010 MicroStrategy, Inc.
database logins are MicroStrategy objects that determine the data sources to which a project connects. To learn more about these objects, refer to the MicroStrategy Installation and Configuration Guide.
Using Architect, you can perform the following tasks to add, remove, update, and manage tables for your project:
• Displaying data sources in Architect, page 120
• Adding tables, page 121
• Removing tables, page 122
• Updating, modifying, and administering tables, page 124
• Organizing project tables: Layers, page 130
Displaying data sources in Architect
You can define which data sources in your system are displayed in Architect. Once displayed, you can begin to add tables from the data source into your project.
Prerequisites
• A database instance has been created for the data source. For information on database instances and examples on how to create them, see the Installation and Configuration Guide.
• You are creating or modifying a project using Architect. For instructions, see Creating and modifying projects, page 100.
To display data sources in Architect
1 With a project open in Architect, from the Architect Button, select Select Database Instance. The Select Database Instance dialog box opens.
2 From the list of data sources, you can display or hide a data source:
• Select a check box for a data source to display it in Architect. Once displayed, you can begin to add tables from the data source into your project.

Project Design Guide Creating a Project Using Architect 5
© 2010 MicroStrategy, Inc. Adding, removing, and administering tables 121
• Clear a check box for a data source to hide it in Architect. You cannot hide a data source that is used in a project.
3 Click OK to save your changes and return to Architect.
Adding tables
Before you can begin creating attributes, facts, and hierarchies for your project, you must add tables to your project.
Along with making data available in your project, adding tables to your project can also trigger the creation of attributes and facts, and the mapping of columns to attributes and facts. For information on defining how attributes and facts are created and mapped when adding tables to your project, see Automating the creation of facts and attributes, page 102 and Automatically mapping columns to existing attribute forms and facts, page 105.
Once tables are selected from the data source and added to your project, they become schema objects known as logical tables in MicroStrategy. Logical tables are representations of the tables that are available in the data warehouse, and are discussed in detail in Appendix B, Logical Tables.
The procedure below provides steps to add tables to your project using Architect.
Prerequisites
• You are creating or modifying a project using Architect. For instructions, see Creating and modifying projects, page 100.
• The ability to add tables using Architect is enabled. For information on enabling and disabling the ability to add tables using Architect, see Disabling the ability to add tables, page 109.
To add tables to a project using Architect
1 With a project open in Architect, select the Project Tables View.
2 From the Warehouse Tables pane, expand a data source.

Creating a Project Using Architect Project Design Guide5
122 Adding, removing, and administering tables © 2010 MicroStrategy, Inc.
If you have a license for the MultiSource Option feature, you can add tables from multiple data sources into your project. For information on adding tables from multiple data sources into your project with the Warehouse Catalog or Architect, see Accessing multiple data sources in a project, page 330.
3 Right-click a table, and then select Add Table to Project. The table is added to the project and included in the Project Tables View of Architect.
To view a sample of the data within a table, right-click the table and select Show Sample Data.
4 If you have selected to automatically create attributes, attribute forms, and facts based on schema creation heuristics (see Automating the creation of facts and attributes, page 102 and Automatically mapping columns to existing attribute forms and facts, page 105), the Results Preview dialog box opens.
Attributes, attribute forms, and facts that can be created based on the columns of the table added to the project are displayed. Select the check box for each object to create in the table when the table is added to the project. If more than one attribute form is available for creation for an attribute, you must select the ID form. Any other attribute forms for that attribute are optional. Click OK to complete the processes of adding the table to the project and creating any selected attributes, attribute forms, and facts.
5 Once you have imported tables for your project, you can continue with other project design tasks, which include:
a Creating and modifying facts, page 131
b Creating and modifying attributes, page 144
c Defining attribute relationships, page 166
d Creating and modifying user hierarchies, page 173
Removing tables
You can remove tables from your project to keep your project from becoming cluttered with tables that are no longer required for your project. You can remove a table from a project using Architect by accessing Project Tables View, right-clicking a table, and selecting Remove.

Project Design Guide Creating a Project Using Architect 5
© 2010 MicroStrategy, Inc. Adding, removing, and administering tables 123
However, you cannot remove a table from a project if schema objects in the project are dependent on the table. For example, an attribute is dependent on the table that is set as the lookup table for the attribute.
When you attempt to remove a table that has dependent objects, you can view a list of dependent objects for the table. You must first delete all dependent objects from the project before you can delete the table.
Removing tables from a project that have been removed from a data source
When tables that are included in a project are removed from the data source that they were available in, you can use Architect to remove these tables from the project. This allows your project to display an accurate list of tables that are included in the project from the selected data source.
The steps below show you how to perform this task using Architect. To remove these tables using the Warehouse Catalog, see Removing tables from the Warehouse Catalog that have been removed from their data source, page 314.
If tables that were not included in a project are removed from the data source, these tables are automatically removed from the display of available tables in Architect.
To remove tables from a project that have been removed from a data source
1 In MicroStrategy Desktop, log in to a project.
2 From the Schema menu, select Architect.
3 If a message is displayed asking if you want to open Architect in read only mode or edit mode, select Edit and click OK to open Architect in edit mode so that you can make changes to the project. MicroStrategy Architect opens.
Note the following:
– If you are only given the option of opening Architect in read only mode, this means another user is modifying the project’s schema. You cannot open Architect in edit mode until the other user is finished with their changes and the schema is unlocked.

Creating a Project Using Architect Project Design Guide5
124 Adding, removing, and administering tables © 2010 MicroStrategy, Inc.
– For information on how you can use read only mode and edit mode for various schema editors, see Using read only or edit mode for schema editors, page 93.
4 If the Warehouse Tables pane is not displayed, from the Home tab, in the Panels area, click Show the Warehouse tables section.
5 In the Warehouse Tables pane, expand the database instance for the data source, which has had tables removed. The Warehouse Catalog dialog box opens. If this dialog box does not open, there are no tables that need to be removed from the project.
6 Select the check box for a table to remove it from the project.
7 After you have selected all the tables to delete, click OK to remove the tables that were selected to be deleted and return to Architect.
8 If a message is returned that a table cannot be removed because objects depend on it, you can click Yes to review a list of dependent objects. To remove the table from the project, all dependent objects must be deleted.
9 From the Home tab, in the Save area, click Save and Update Schema to save your changes.
Updating, modifying, and administering tables
With Architect, you can update and manage the tables in your project to ensure that the data in your project is up to date and accurate, as described in the sections listed below:
• Updating tables, page 124
• Modifying and viewing table definitions, page 125
• Modifying data warehouse connection and operation defaults, page 129
Updating tables
With Architect, you can update individual tables or all of the tables for a data source at once. This ensures that the data available in your project is up to date with any changes made to the tables in the data source. The procedure below describes how to update tables using Architect.

Project Design Guide Creating a Project Using Architect 5
© 2010 MicroStrategy, Inc. Adding, removing, and administering tables 125
Prerequisite
• You are creating or modifying a project using Architect. For instructions, see Creating and modifying projects, page 100.
To update tables using Architect
1 With a project open in Architect, select the Project Tables View.
2 From the Warehouse Tables pane, you can update all tables for a data source or update individual tables as described below:
• To update all tables for a data source, right-click a data source, and select Update. All the tables for the data source are updated to reflect their definitions in the data source.
• To update an individual table, expand a data source, right-click a table, and select Update Structure. The table is updated to reflect its definition in the data source.
Modifying and viewing table definitions
Once a table is added to a project, you can modify and view table definitions using the Properties pane in Architect. To view the various properties and contents of a table in Architect, from the Tables tab of the Properties pane, select the table from the drop-down list. The YR_CATEGORY_SLS table of the

Creating a Project Using Architect Project Design Guide5
126 Adding, removing, and administering tables © 2010 MicroStrategy, Inc.
MicroStrategy Tutorial project shown below is used as an example of how you can modify and view tables definitions using Architect.
When you select a table in Architect, the Properties pane allows you to modify and view table definitions as described below.
You can select a property in the Properties pane to view a description of the property. The description is displayed at the bottom of the Properties pane.
• Defining and viewing table definitions: Definition section, page 127
• Modifying attributes in a table: Mapped Attributes section, page 128
• Modifying facts in a table: Mapped Facts section, page 128
• Modifying column names and data types in a table: Member Columns section, page 129

Project Design Guide Creating a Project Using Architect 5
© 2010 MicroStrategy, Inc. Adding, removing, and administering tables 127
Defining and viewing table definitions: Definition section
When you select a table in Architect, the Definition section of the Properties pane displays the various properties for the table. These properties and how to use them are described below:
• ID: The identifier of the table. You cannot modify this value.
• Name: The name of the table in a MicroStrategy project. By default, the name is inherited from the table name in the data source.
• Description: The description of the table. A description can help explain the purpose of a table in a project.
• Hidden: Specifies whether the table is defined as hidden. From the drop-down list, select True to define a table as hidden.
Objects that are hidden are not displayed to a user unless the user has changed his or her Desktop Preferences and selected the Display hidden objects check box. Therefore, defining an object as hidden does not necessarily prevent users from viewing or accessing an object. The best way to prevent users from viewing or accessing an object is to restrict the user permissions for it.
• Location: The location of a table in a project.
• Database Name: The name of the table in the data source. If the name of a table has changed in the data source, you can type the new name for the table in this property. This allows a MicroStrategy project to locate a table after its name has changed in its data source.
• Row Count: The number of rows in the table. To calculate a table’s row count, right-click the table and select Calculate Row Count.
The Calculate Row Count option is displayed only if the data source for the table is expanded in the Warehouse Tables pane.
• Table Name Space: The table name space for a table in a data source. For information on table name spaces, see Ignoring table name spaces when migrating tables, page 322.
• Logical Size: The logical size of a table, which is based on an algorithm that takes into account the number of attribute columns in a table and the various levels at which they exist in their respective hierarchies. You can also type a logical size to manually change the logical size of a table. Logical table sizes are a significant part of how the MicroStrategy SQL Engine determines the tables to use in a query.

Creating a Project Using Architect Project Design Guide5
128 Adding, removing, and administering tables © 2010 MicroStrategy, Inc.
• Logical size locked: Specifies whether the logical size of a table can be modified. From the drop-down list, select True to lock a table’s logical table size.
• Primary DB Instance: The primary database instance of a table.
If your project supports mapping tables in a project to tables in multiple data sources, you can select Primary DB Instance and click the ... (browse) button to open the Available Database Instances dialog box. From this dialog box, you can view the table’s data sources. You can also change the database instance (which is associated with a data source) that is used as the primary database instance for the table. For information on adding tables from multiple data sources into your project with the Warehouse Catalog or Architect, see Accessing multiple data sources in a project, page 330.
Modifying attributes in a table: Mapped Attributes section
When you select a table in Architect, the Mapped Attributes section of the Properties pane displays the attributes that are mapped to columns in the table. From the Properties pane, you can select a column mapped to an attribute form and click the ... button to open the Modify Form Expression dialog box. From this dialog box, you can modify the attribute form expression.
For information on creating and modifying attribute forms in Architect, see Creating and modifying attributes, page 144. For information on attribute forms and how to create and modify them from the Attribute Editor, see Column data descriptions and identifiers: Attribute forms, page 236.
Modifying facts in a table: Mapped Facts section
When you select a table in Architect, the Mapped Facts section of the Properties pane displays the facts that are mapped to columns in the table. From the Properties pane, you can select a column mapped to a fact and click the ... button to open the Modify Fact Expression dialog box. From this dialog box, you can modify the fact expression.
For information on creating and modifying facts in Architect, see Creating and modifying facts, page 131. For information on facts and how to create and modify them from the Fact Editor, see Chapter 6, The Building Blocks of Business Data: Facts.

Project Design Guide Creating a Project Using Architect 5
© 2010 MicroStrategy, Inc. Adding, removing, and administering tables 129
Modifying column names and data types in a table: Member Columns section
When you select a table in Architect, the Member Columns section of the Properties pane displays the columns that are available in the table. From the Properties pane, you can select a column and click the ... button to open the Column Editor dialog box. From this dialog box, you can modify the column name and data type.
You can modify the column name and data type if this information has changed in the data source. This allows a MicroStrategy project to be able to locate a column after it has been renamed in the data source.
Modifying data warehouse connection and operation defaults
You can specify various settings for data warehouse connection and operation defaults using Architect. These settings are part of the Warehouse Catalog options described in Modifying data warehouse connection and operation defaults, page 316.
The procedure below describes how to access a subset of the Warehouse Catalog options from Architect.
Prerequisite
• You are creating or modifying a project using Architect. For instructions, see Creating and modifying projects, page 100.
To modify data warehouse connection and operation defaults
1 With a project open in Architect, select the Project Tables View.
2 From the Warehouse Tables pane, right-click a data source and select Warehouse Catalog Options. The Warehouse Catalog options dialog box opens.
3 When accessed from Architect, only a subset of these Warehouse Catalog settings are displayed, including:
• Warehouse Connection: These options allow you to modify the database instance and database login used to connect the data warehouse to a project. For information on these options, see Data warehouse connection and read operations, page 317.

Creating a Project Using Architect Project Design Guide5
130 Adding, removing, and administering tables © 2010 MicroStrategy, Inc.
• Read Settings: These options allow you to customize the SQL that reads the Warehouse Catalog for every platform except Microsoft Access. For information on these options, see Data warehouse connection and read operations, page 317.
• Table Prefixes: These options allow you to specify whether table prefixes are displayed in table names and how prefixes are automatically defined for tables that are added to the project. For information on these options, see Displaying table prefixes, row counts, and name spaces, page 320.
4 Once you are finished defining Warehouse Catalog options, click OK to save your changes and return to Architect.
Organizing project tables: Layers
You can improve the organization and clarity of your project in Architect by creating groups of tables that can be easily accessed and focused on. These groups of tables are referred to as layers, and they can help organize MicroStrategy projects that require a large number of tables.
In the Project Tables View of Architect, you can select one or more tables and define the group of tables as a layer. This layer can be accessed from the Layers drop-down list to focus on only the tables included in the layer. Any modifications performed while viewing a layer are applied to the project as a whole.
For example, you can select all of the fact tables in your project and create a new layer named Fact Tables. This allows you to quickly focus on only the fact tables included in your project.
The All Project Tables layer is a default layer that includes all tables included in a project. This layer cannot be deleted.
The procedure below describes how to create a layer in Architect.
To create a layer in Architect
1 In MicroStrategy Desktop, log in to a project.
2 From the Schema menu, select Architect.

Project Design Guide Creating a Project Using Architect 5
© 2010 MicroStrategy, Inc. Creating and modifying facts 131
3 If a message is displayed asking if you want to open Architect in read only mode or edit mode, select Edit and click OK to open Architect in edit mode so that you can make changes to the project. MicroStrategy Architect opens.
Note the following:
– If you are only given the option of opening Architect in read only mode, this means another user is modifying the project’s schema. You cannot open Architect in edit mode until the other user is finished with their changes and the schema is unlocked.
– For information on how you can use read only mode and edit mode for various schema editors, see Using read only or edit mode for schema editors, page 93.
4 From the Project Tables View, select all the tables to include in a layer.
To remove a table from a layer, right-click the table, and select Remove From Layer.
5 From the Home tab, in the Layer area click the Create New Layer option. A dialog box to name the layer opens.
6 In the Please enter the layer name field, type a name for the layer and click OK. You are returned to Architect and the new layer is displayed in the Project Tables View.
7 Use the Layers drop-down list to switch between layers.
Creating and modifying factsFacts are one of the essential elements within the business data model. They relate numeric data values from the data warehouse to the MicroStrategy reporting environment. Facts generally represent the answers to the business questions on which users want to report. For conceptual information on facts, see Chapter 6, The Building Blocks of Business Data: Facts.
This section describes how to use Architect to create and modify facts, which includes:
• Creating facts, page 132

Creating a Project Using Architect Project Design Guide5
132 Creating and modifying facts © 2010 MicroStrategy, Inc.
• Creating and modifying multiple facts, page 135
Before you create facts for your project, you can select the type of metrics that are created automatically when a fact is created for a project. This can reduce the time it takes to create the basic metrics for your project. For information on configuring Architect to automatically create these basic metrics, see Creating metrics based on the facts of a project, page 109.
Creating facts
With Architect you can create facts as part of your initial project design effort as well as throughout the entire life cycle of a project.
To save the time it takes to create all the facts required for your project, you can allow Architect to automatically create facts when tables are added to your project. When tables are added to the project using Architect, facts are created for columns in tables that use numeric data types and are not used for attribute forms. To enable this automatic fact creation, see Automating the creation of facts and attributes, page 102.
The procedure below describes how to create a fact using Architect.
Prerequisites
The procedure below assumes you have already created a project object and added tables to the project. For information on creating a project using Architect, see Creating projects using Architect, page 113.
To create a fact using Architect
1 In MicroStrategy Desktop, log in to a project.
2 From the Schema menu, select Architect.
3 If a message is displayed asking if you want to open Architect in read only mode or edit mode, select Edit and click OK to open Architect in edit

Project Design Guide Creating a Project Using Architect 5
© 2010 MicroStrategy, Inc. Creating and modifying facts 133
mode so that you can make changes to the project. MicroStrategy Architect opens.
Note the following:
– If you are only given the option of opening Architect in read only mode, this means another user is modifying the project’s schema. You cannot open Architect in edit mode until the other user is finished with their changes and the schema is unlocked.
– For information on how you can use read only mode and edit mode for various schema editors, see Using read only or edit mode for schema editors, page 93.
4 From the Project Tables View, locate and select the table that includes a column or columns to use in a fact definition.
5 Right-click the table and select Create Fact. A dialog box opens to name the fact.
Rather than creating facts by manually creating a fact expression, you can allow Architect to automatically create simple facts defined on one column. To do this:
a Right-click the table, point to Recognize, and then select Facts. The Results Preview dialog box opens.
b If facts are displayed, these facts can be created as described below:
– Facts can be created for columns in tables that use numeric data types and are not used for attribute forms, as described in Automating the creation of facts and attributes, page 102.
– Facts can be created by automatically mapping columns to facts already defined in your project, as described in Automatically mapping columns to existing attribute forms and facts, page 105.
Select the check box for a fact to create the fact.
c Click OK. The facts you selected for creation are created within the table. If you use this option to create simple facts, you can then skip to To define fact expressions and column aliases, page 135.
6 Type a name for the fact, and click OK. The Create New Form Expression dialog box opens to create a fact expression.
Creating a Project Using Architect Project Design Guide5
134 Creating and modifying facts © 2010 MicroStrategy, Inc.
7 From the Available columns pane, drag and drop a column into the Form expression pane.
You can include multiple columns as well as use numeric constants and mathematical operators and functions to create a fact expression. For information on creating various types of fact expressions, see Mapping physical columns to facts: Fact expressions, page 190.
8 In the Mapping area, select Automatic or Manual:
• Automatic mapping means that all of the tables in the project with the columns used in the fact expression are selected as possible source tables for the fact. You can then remove any tables mapped automatically and select other tables.
• Manual mapping means that all of the tables in the project with the columns used in the fact expression are located but are not selected as possible source tables for the fact. You can then select which of those tables are used as source tables for the fact. Other scenarios in which you should use the manual mapping method include:
– If you are creating a constant expression that is not based on a physical column in a project table, you must select the tables to apply the constant expression to.
– If the same column name does not contain the same data across different tables, manually select the appropriate source tables for each fact.
For example, suppose you have a column named Sales, which exists in both the Fact_Sales table and the Fact_Discount table. In the Fact_Sales table, the Sales column contains revenue data. However, in the Fact_Discount table, the Sales column contains discount data. In other words, although the column name is the same in both tables (Sales), the columns contain different fact data in each table. When creating the Revenue fact, you must select the Manual mapping method so you can select the Fact_Sales table as a source table for the Revenue fact. When creating the Discount fact, you must select the Manual mapping method so you can select the Fact_Discount table as a source table for the Discount fact. If you use the Automatic mapping method in both cases, the MicroStrategy SQL Engine may use the incorrect column for the facts.
9 Click OK to close the Create New Form Expression dialog box and create the fact. The fact is displayed in the table used to create the fact.

Project Design Guide Creating a Project Using Architect 5
© 2010 MicroStrategy, Inc. Creating and modifying facts 135
To define fact expressions and column aliases
10 You can continue to define the fact by right-clicking the fact and selecting Edit. The Fact Editor opens. Use the tabs of the Fact Editor to define fact expressions and create column aliases as described below:
• Definition: This tab allows you to define fact expressions. Fact definitions are discussed in How facts are defined, page 189.
• Column Alias: This tab allows you to create a column alias for the fact. Column aliases are discussed in Fact column names and data types: Column aliases, page 196.
Note the following:
– For detailed information about the options on each tab within the Fact Editor, refer to the MicroStrategy Desktop online help.
– You cannot create fact level extensions using Architect. For information on how to create fact level extensions, see Modifying the levels at which facts are reported: Level extensions, page 198.
11 When your changes are complete, click OK to return to Architect.
12 From the Home tab, in the Save area, click Save and Update Schema to save your changes.
Creating and modifying multiple facts
With Architect, you can create and modify multiple facts in your project quickly from an integrated interface. Architect allows you to create and modify facts in most of the same ways as the Fact Editor.
You cannot create fact level extensions using Architect. For information on how to create fact level extensions, see Modifying the levels at which facts are reported: Level extensions, page 198.
For conceptual information on facts as well as detailed examples, see Chapter 6, The Building Blocks of Business Data: Facts. Refer to the list below for steps to perform various fact definitions using Architect:
• Modifying facts with the Properties pane, page 136
• Creating fact expressions, page 138
• Creating and modifying fact column names and data types: Column aliases, page 142

Creating a Project Using Architect Project Design Guide5
136 Creating and modifying facts © 2010 MicroStrategy, Inc.
Modifying facts with the Properties pane
Once facts are created, you can modify and view fact definitions using the Properties pane in Architect. To view the various properties of a fact in Architect, from the Facts tab of the Properties pane, select the fact from the drop-down list. The Cost fact of the MicroStrategy Tutorial project shown below is used as an example of how you can modify and view facts using Architect.
When selecting a fact in Architect, the Properties pane allows you to modify and view facts as described below.
You can select a property in the Properties pane to view a description of the property. The description is displayed at the bottom of the Properties pane.
• Defining and viewing attribute definitions: Definition section, page 150
• Modifying attribute forms: Forms sections, page 151

Project Design Guide Creating a Project Using Architect 5
© 2010 MicroStrategy, Inc. Creating and modifying facts 137
Defining and viewing fact definitions: Definition section
When you select a fact in Architect, the Definition section of the Properties pane displays the various properties for the fact. These properties and how to use them are described below:
• ID: The identifier of the fact. You cannot modify this value.
• Name: The name of the fact in the MicroStrategy project.
• Description: The description of the fact. A description can help explain the purpose of a fact in a project.
• Hidden: Specifies whether the fact is defined as hidden. From the drop-down list, select True to define a fact as hidden.
Objects that are hidden are not displayed to a user unless the user has changed his or her Desktop Preferences and selected the Display hidden objects check box. Therefore, defining an object as hidden does not necessarily prevent users from viewing or accessing an object. The best way to prevent users from viewing or accessing an object is to restrict the user permissions for it.
• Location: The location of the fact in a project.
Modifying fact expressions: Fact Expressions section
When you select a fact in Architect, the Fact Expressions section of the Properties pane displays the tables that the fact is included in, as well as the fact expression used for the fact in that table.
In the Cost fact example shown in Modifying facts with the Properties pane, page 136, TOT_COST is displayed as the fact expression for most of the tables. However, the Cost fact uses a derived fact expression in the ORDER_DETAIL table (derived fact expressions are described in Creating derived facts and fact expressions, page 138). The Cost fact also uses a different column name in the ORDER_FACT table (heterogeneous column naming is described in Creating facts with varying column names: Heterogeneous column names, page 140).
From the Properties pane, you can select a column mapped to a fact and click the ... (browse) button to open the Modify Fact Expression dialog box. From this dialog box, you can modify the fact expression.

Creating a Project Using Architect Project Design Guide5
138 Creating and modifying facts © 2010 MicroStrategy, Inc.
Creating fact expressions
A fact expression represents a mapping to specific fact information in the data source. For conceptual information on fact expressions, see Mapping physical columns to facts: Fact expressions, page 190.
Fact expressions are commonly created by mapping a column to a fact, as described in Creating facts, page 132. With Architect, you can also create and define facts as listed below:
• Creating derived facts and fact expressions, page 138
• Creating facts with varying column names: Heterogeneous column names, page 140
Creating derived facts and fact expressions
A derived fact has its value determined by an expression that contains more than just a column in a table. Any operation on a column such as adding a constant, adding another column’s values, or setting the expression to be an absolute value creates a derived fact. In other words, you are creating a fact from information that is available in the data warehouse.
For more information on derived facts and derived fact expressions, see Derived facts and derived fact expressions, page 191. The procedure below describes how to create a derived fact using Architect, and follows the example scenario provided in Example: creating derived facts, page 192.
To create a derived fact using Architect
1 In MicroStrategy Desktop, log in to a project.
For the example scenario, log in to the MicroStrategy Tutorial project.
2 From the Schema menu, select Architect.
3 If a message is displayed asking if you want to open Architect in read only mode or edit mode, select Edit and click OK to open Architect in edit

Project Design Guide Creating a Project Using Architect 5
© 2010 MicroStrategy, Inc. Creating and modifying facts 139
mode so that you can make changes to the project. MicroStrategy Architect opens.
Note the following:
– If you are only given the option of opening Architect in read only mode, this means another user is modifying the project’s schema. You cannot open Architect in edit mode until the other user is finished with their changes and the schema is unlocked.
– For information on how you can use read only mode and edit mode for various schema editors, see Using read only or edit mode for schema editors, page 93.
4 From the Project Tables View, locate and select a table that includes a column or columns to use in a fact definition.
For the example scenario, select the ORDER_DETAIL table.
5 Right-click the table and select Create Fact. A dialog box opens to name the fact.
6 Type a name for the fact, and click OK. The Create New Form Expression dialog box opens.
7 From the Available columns pane, drag and drop a column into the Form expression pane.
For the example scenario, drag and drop the QTY_SOLD column to add it to the Form expression pane.
To complete the derived fact expression
A derived fact expression includes a combination of columns, numerical constants, and mathematical operators. The steps below continue the example scenario to provide a guideline of how to create derived fact expressions.
8 With the cursor in the Form expression pane, click * (the multiplication operator) to add it to the expression.
9 From the Available columns pane, double-click the UNIT_PRICE column to add it to the end of the fact expression.
10 Under Mapping method, select Automatic.

Creating a Project Using Architect Project Design Guide5
140 Creating and modifying facts © 2010 MicroStrategy, Inc.
11 Click Validate to check whether the syntax of the expression is correct. The expression should appear as shown below:
12 Click OK. You are returned to Architect and the derived fact appears in the ORDER_DETAIL table.
13 From the Home tab, in the Save area, click Save and Update Schema to save your changes.
Creating facts with varying column names: Heterogeneous column names
In your warehouse, the same fact can access columns with different column names. MicroStrategy allows you to identify heterogeneous fact column names for each fact. With heterogeneous column names, you can refer the same fact to multiple columns with different column names and from different tables that identify the same quantitative value.
For more information on heterogeneous column names, see Facts with varying column names: Heterogeneous column names, page 193. The procedure below describes how to use Architect to create a fact with heterogeneous column names, and follows the example scenario provided in Example: mapping heterogeneous fact columns, page 194.
To create a fact with heterogeneous column names using Architect
1 In MicroStrategy Desktop, log in to a project.
For the example scenario, log in to the MicroStrategy Tutorial project.
2 From the Schema menu, select Architect.
3 If a message is displayed asking if you want to open Architect in read only mode or edit mode, select Edit and click OK to open Architect in edit

Project Design Guide Creating a Project Using Architect 5
© 2010 MicroStrategy, Inc. Creating and modifying facts 141
mode so that you can make changes to the project. MicroStrategy Architect opens.
Note the following:
– If you are only given the option of opening Architect in read only mode, this means another user is modifying the project’s schema. You cannot open Architect in edit mode until the other user is finished with their changes and the schema is unlocked.
– For information on how you can use read only mode and edit mode for various schema editors, see Using read only or edit mode for schema editors, page 93.
4 From the Project Tables View, locate and select a table that includes a column or columns to use in a fact definition.
For the example scenario, select the ORDER_FACT table. This is one of the tables in which a heterogeneous fact column for the Units Sold fact exists.
5 Right-click the table and select Create Fact. A dialog box opens to name the fact.
6 Type a name for the fact, and click OK. The Create New Form Expression dialog box opens.
7 From the Available columns pane, drag and drop a column into the Form expression pane.
For the example scenario, drag and drop the QTY_SOLD column to add it to the Form expression pane.
8 In the Mapping method area, select Automatic.
9 Click OK. You are returned to Architect and the derived fact appears in the ORDER_FACT table.
10 Right-click the new fact and select Edit. The Fact Editor opens and the fact expression you just created appears in the Expressions pane.
To add additional columns for heterogeneous facts
Now you must add the other heterogeneous fact column as separate expression for the fact.
11 Click New. The Create New Fact Expression dialog box opens.

Creating a Project Using Architect Project Design Guide5
142 Creating and modifying facts © 2010 MicroStrategy, Inc.
12 From the Source table drop-down list, select the CITY_CTR_SALES table. This is the other table that contains a heterogeneous fact column for the Units Sold fact.
13 From the Available columns pane, double-click the TOT_UNIT_SALES column to add it to the Fact expression pane on the right.
14 In the Mapping method area, select Automatic.
15 Click OK. You are returned to the Fact Editor and the fact expression that you just created appears in the Expressions pane. Now the fact that you are creating maps correctly to its heterogeneous fact columns.
16 Click OK. You are returned to Architect.
17 From the Home tab, in the Save area, click Save and Update Schema to save your changes.
Creating and modifying fact column names and data types: Column aliases
A column alias specifies both the name of the column to be used in temporary tables and the data type to be used for the fact. By default, the data type for a fact is inherited from the data type of the column on which the fact is defined in the data warehouse.
For information on column aliases, see Fact column names and data types: Column aliases, page 196. The procedure below describes how to create a column alias using Architect.
Prerequisites
This procedure assumes you have already created a fact with a valid fact expression.
To create a column alias for a fact using Architect
1 In MicroStrategy Desktop, log in to the project source that contains the fact to create a new column alias for.
2 From the Schema menu, select Architect.

Project Design Guide Creating a Project Using Architect 5
© 2010 MicroStrategy, Inc. Creating and modifying facts 143
3 If a message is displayed asking if you want to open Architect in read only mode or edit mode, select Edit and click OK to open Architect in edit mode so that you can make changes to the project. MicroStrategy Architect opens.
Note the following:
– If you are only given the option of opening Architect in read only mode, this means another user is modifying the project’s schema. You cannot open Architect in edit mode until the other user is finished with their changes and the schema is unlocked.
– For information on how you can use read only mode and edit mode for various schema editors, see Using read only or edit mode for schema editors, page 93.
4 Right-click the fact and select Edit. The Fact Editor opens.
5 Select the Column Alias tab.
6 In the Column alias area, click Select. The Column Editor - Column Selection dialog box opens.
7 Select New to create a new column alias. The Column Editor - Definition dialog box opens.
8 You can modify the following properties for the column alias:
• Column name: The name for the column alias. This name is used in any SQL statements which include the fact column.
• Data type: The data type for the fact. For a description of the different data types supported by MicroStrategy, see Appendix C, Data Types.
• Depending on the data type selected, you can specify the byte length, bit length, precision, scale, or time scale for your column alias. For a detailed description on each of these properties, see the MicroStrategy Desktop online help.
9 Click OK to save your changes and return to the Column Editor - Column Selection dialog box.
10 Click OK. You are returned to the Fact Editor.
11 Click OK. You are returned to Architect.
12 From the Home tab, in the Save area, click Save and Update Schema to save your changes.

Creating a Project Using Architect Project Design Guide5
144 Creating and modifying attributes © 2010 MicroStrategy, Inc.
Creating and modifying attributesBusiness data represented by facts can offer little insight without the presence of business concepts and context, which take the form of attributes in MicroStrategy. Attributes provide the business model with a context in which to report on and analyze facts. While knowing your company’s total sales is useful, knowing where and when the sales took place provides the kind of analytical depth that users require on a daily basis. For conceptual information on attributes, see Chapter 7, The Context of Your Business Data: Attributes.
This section describes how to use Architect to create and modify attributes, which includes:
• Creating attributes, page 144
• Creating and modifying multiple attributes, page 148
These sections focus on creating attributes and attribute forms. To create and define attribute relationships with the Hierarchy View in Architect, see Defining attribute relationships, page 166.
Creating attributes
With Architect you can create attributes as part of your initial project design effort as well as throughout the entire life cycle of a project.
To save the time that it takes to create all the attributes required for your project, you can allow Architect to automatically create attributes when tables are added to your project. When tables are added to the project using Architect, attributes are created based on the automatic column recognition rules that you define in Architect. To enable and define this automatic attribute creation, see Automating the creation of facts and attributes, page 102.
The procedure below describes how to create an attribute using Architect.
Prerequisites
The procedure below assumes you have already created a project object and added tables to the project. For information on creating a project using Architect, see Creating projects using Architect, page 113.

Project Design Guide Creating a Project Using Architect 5
© 2010 MicroStrategy, Inc. Creating and modifying attributes 145
To create an attribute using Architect
1 In MicroStrategy Desktop, log in to a project.
2 From the Schema menu, select Architect.
3 If a message is displayed asking if you want to open Architect in read only mode or edit mode, select Edit and click OK to open Architect in edit mode so that you can make changes to the project. MicroStrategy Architect opens.
Note the following:
– If you are only given the option of opening Architect in read only mode, this means another user is modifying the project’s schema. You cannot open Architect in edit mode until the other user is finished with their changes and the schema is unlocked.
– For information on how you can use read only mode and edit mode for various schema editors, see Using read only or edit mode for schema editors, page 93.
4 From the Project Tables View, locate and select a table that includes a column or columns to use in an attribute definition.
5 Right-click the table and select Create Attribute. A dialog box opens to name the attribute.
Rather than creating attributes by manually creating an attribute expression, you can allow Architect to automatically create simple attributes defined on one column. To do this:
a Right-click the table, point to Recognize, and then select Attributes. The Results Preview dialog box opens.
b If attribute forms are displayed, these attribute forms can be created as described below:
– Attribute forms can be created based on these automatic column recognition rules that you define, as described in Automating the creation of facts and attributes, page 102.
– Attribute forms can be created by automatically mapping columns to attribute forms already defined in your project, as described in Automatically mapping columns to existing attribute forms and facts, page 105.

Creating a Project Using Architect Project Design Guide5
146 Creating and modifying attributes © 2010 MicroStrategy, Inc.
Select the check box for an attribute form to create the attribute form. If more than one attribute form is available for creation for an attribute, you must select the ID form. Any other attribute forms for that attribute are optional. For example, to create an attribute description form you must select the description form along with the ID form for the attribute.
c Click OK. The attribute forms you selected for creation are created within the table. If you use this option to create simple attributes, you can then skip to To define attribute lookup tables, form expressions, and column aliases, page 147.
6 Type a name for the attribute, and click OK. The Create New Form Expression dialog box opens.
7 Create a form expression for the ID form of the new attribute being created, as described below:
• To create a simple attribute form expression (Attribute form expressions, page 240), drag a column from the Available columns pane to the Form expression pane.
• To create a more advanced attribute form expression, use a combination of any of the following techniques:
– Enter constants in double quotes.
– To create a function using the Insert Function Wizard, click f(x) in the Form expression toolbar.
– To insert an operator into the expression, click any operator in the Form expression toolbar.
8 Click Validate to ensure that your expression is valid.
9 Under Mapping method, select Automatic or Manual:
• Automatic mapping means that all of the tables in the project with the columns used in the attribute form expression are selected as possible source tables for the attribute form. You can then clear any tables mapped automatically or select other tables.
• Manual mapping means that all of the tables in the project with the columns used in the attribute form expression are located but are not selected as possible source tables for the attribute form. You can then

Project Design Guide Creating a Project Using Architect 5
© 2010 MicroStrategy, Inc. Creating and modifying attributes 147
select which of those tables are used as source tables for the attribute form.
Note the following:
– The mapping method defaults to Automatic for the first attribute or attribute form expression you create. The system maps the expression to each of the source tables. For subsequent attributes, the default is Manual.
– An expression that uses only a constant value cannot use the automatic mapping method.
To use an attribute for meaningful analysis, you must verify that it includes a column from a fact table in its definition, or is related to an attribute that does. For example, to use the Month attribute for analysis, you must create a relationship to the Day attribute, which must include the DAY column from the fact table in its definition. To create relationships between attributes, see Defining attribute relationships, page 166.
10 Click OK to close the Create New Form Expression dialog box and create the attribute. The attribute is displayed in the table used to create the attribute.
To define attribute lookup tables, form expressions, and column aliases
11 You can continue to define the attribute by right-clicking the ID form for the attribute and selecting Edit. The Modify Attribute Form dialog box opens.
12 From the Source tables pane, select a table and click Set as Lookup to set it as the lookup table for the attribute. A lookup table acts as the main table which holds the information for an attribute. If you chose manual mapping, select the check boxes of the tables to map to the attribute form.
13 You can use the tabs of the Modify Attribute Form dialog box to define attribute form expressions and create column aliases as described below:
• Definition: This tab allows you to define attribute form expressions. Attribute forms are discussed in Column data descriptions and identifiers: Attribute forms, page 236.
Creating a Project Using Architect Project Design Guide5
148 Creating and modifying attributes © 2010 MicroStrategy, Inc.
• Column Alias: This tab allows you to create a column alias for the fact. Column aliases are discussed in Modifying attribute data types: Column aliases, page 248.
For detailed information about the options on each tab within the Modify Attribute Form dialog box, refer to the MicroStrategy Desktop online help.
14 When your changes are complete, click OK to return to Architect.
15 From the Home tab, in the Save area, click Save and Update Schema to save your changes.
Creating and modifying multiple attributes
With Architect, you can create and modify multiple attributes in your project quickly from an integrated interface. Architect allows you to create and modify attributes in most of the same ways as the Attribute Editor.
For conceptual information on attributes as well as detailed examples, see Chapter 7, The Context of Your Business Data: Attributes. Refer to the list below for steps to perform various attribute definitions using Architect:
• Modifying attributes with the Properties pane, page 148
• Creating attribute form expressions, page 153
• Creating and modifying attribute data types: Column aliases, page 157
• Creating attributes with multiple ID columns: Compound attributes, page 159
• Modifying how to use attributes to browse and report on data, page 161
• Specifying attribute roles: Attributes that use the same lookup, page 163
• Supporting data internationalization for attribute elements, page 165
Modifying attributes with the Properties pane
Once attributes are created, you can modify and view attribute definitions using the Properties pane in Architect. To view the various properties of an attribute in Architect, from the Attributes tab of the Properties pane, select the attribute from the drop-down list. The Category attribute of the

Project Design Guide Creating a Project Using Architect 5
© 2010 MicroStrategy, Inc. Creating and modifying attributes 149
MicroStrategy Tutorial project shown below is used as an example of how you can modify and view attributes using Architect.
When selecting an attribute in Architect, the Properties pane allows you to modify and view attributes as described below.
You can select a property in the Properties pane to view a description of the property. The description is displayed at the bottom of the Properties pane.
• Defining and viewing attribute definitions: Definition section, page 150
• Modifying attribute forms: Forms sections, page 151

Creating a Project Using Architect Project Design Guide5
150 Creating and modifying attributes © 2010 MicroStrategy, Inc.
Defining and viewing attribute definitions: Definition section
When you select an attribute in Architect, the Definition section of the Properties pane displays the various properties for the attribute. These properties and how to use them are described below:
• ID: The identifier of the attribute. You cannot modify this value.
• Name: The name of the attribute in a MicroStrategy project.
• Description: The description of the attribute. A description can help explain the purpose of an attribute in a project.
• Hidden: Specifies whether the attribute is defined as hidden. From the drop-down list, select True to define an attribute as hidden.
Objects that are hidden are not displayed to a user unless the user has changed his or her Desktop Preferences and selected the Display hidden objects check box. Therefore, defining an object as hidden does not necessarily prevent users from viewing or accessing an object. The best way to prevent users from viewing or accessing an object is to restrict the user permissions for it.
• Location: The location of the attribute in a project.
• Lock Type: Specifies how you can browse attribute elements within the System Hierarchy in the Data Explorer. You have the following options:
Locked: No elements of the attribute are shown within the System Hierarchy in the Data Explorer. For example, if the attribute Year is locked, no elements for Year display in the Data Explorer when Year is expanded from the System Hierarchy.
Unlocked: All elements of the attribute are shown within the System Hierarchy in the Data Explorer. For example, if the attribute Year is unlocked, all elements of Year (such as 2005, 2006, and 2007) display in the Data Explorer when Year is expanded from the System Hierarchy.
Limit: Incrementally retrieves the number of elements set for the attribute. For example, if the limit for the attribute Year is set to one, the years 2005, 2006, and 2007 are retrieved one-by-one as they are requested.
• Lock Limit: If you choose the Limit lock type above, you can define the number of elements to incrementally retrieve and display within the System Hierarchy in the Data Explorer.
Project Design Guide Creating a Project Using Architect 5
© 2010 MicroStrategy, Inc. Creating and modifying attributes 151
• Apply Security Filters: Enables and disables the use of security filters in element requests. This setting also applies to the use of security filters for creating an element cache.
This setting covers situations where only certain attributes need the security filters for element requests. For example, if you have an external-facing data warehouse for your suppliers, security filters can be used on attributes in the product dimension so one supplier cannot see another supplier's products. However, since security is not necessary on attributes in the Time dimension, security filters do not need to be applied and the element cache can be shared.
• Enable Element Caching: Enables and disables element caching at the attribute level. By caching the elements of an attribute, the elements are returned quickly from a cache when browsing the attribute elements. This is particularly helpful for attributes that rarely or never have a modification to the elements available for the attribute. The volatility of the elements within different attributes can fluctuate greatly. For example, the Order Number attribute may have elements that change once a day (depending on the warehouse load), while the Product Number attribute may only have elements that change once a week or once a month.
Modifying attribute forms: Forms sections
When you select an attribute in Architect, the Forms sections of the Properties pane display information about the attribute forms for the attribute. The properties for attribute forms and how to use them are described below:
• Attribute form: The first property for an attribute form reflects the category used for the attribute form. In the Category example shown above in Modifying attributes with the Properties pane, page 148, ID is displayed as the first property. You can select the attribute form property and click the ... button to modify the attribute form.
If the attribute form uses a form group to combine multiple attribute forms, you can modify the separate attribute forms that are included in the form group. For information on creating form groups in Architect, see Creating attributes with multiple ID columns: Compound attributes, page 159.
• Name: The name of the attribute form in a MicroStrategy project.

Creating a Project Using Architect Project Design Guide5
152 Creating and modifying attributes © 2010 MicroStrategy, Inc.
• Category: The category used for the attribute form, which can help group or identify attribute forms. From the drop-down list, select the category to use for the attribute form. For information on how the category helps group attribute forms, see Attribute form expressions, page 240.
• Format: The format of the attribute form, which controls how the form is displayed and how filters are defined. From the drop-down list, select the format to use for the attribute form. For information on the format of attribute forms, see Attribute form expressions, page 240.
• Report Sort: Defines the default sort order of the attribute form when it is included in a report. From the drop-down list, you can choose from Ascending, Descending, or None. For information on how attribute forms are sorted when multiple attribute forms of a single attribute define a default sort order, see Default sorting of multiple attribute forms on reports, page 239.
• Browse Sort: Defines the default sort order of the attribute form when it is viewed in the Data Explorer. From the drop-down list, you can choose from Ascending, Descending, or None. The Data Explorer is discussed in Enabling hierarchy browsing in reports: Data Explorer, page 299.
• Use as Browse Form: Defines whether the attribute form can be displayed in the Data Explorer. To allow an attribute form to be displayed in the Data Explorer, from the drop-down list, select True. The Data Explorer is discussed in Enabling hierarchy browsing in reports: Data Explorer, page 299.
• Use as Report Form: Defines whether the attribute form is displayed on reports by default. To define an attribute form to be displayed on reports by default, from the drop-down list, select True.
• Supports Multiple Languages: Defines whether the attribute form’s information can be displayed in multiple languages using data internationalization. To define an attribute form to allow data to be displayed in multiple languages, select True.
Enabling data internationalization for an attribute form is described in Supporting data internationalization for attribute elements, page 165.
The ID form of an attribute does not have this option as these forms are used strictly for identification purposes.
• Column Alias: The column alias of the attribute form, which allows you to define a new data type that you can use in place of the default data type for a given attribute form. You can select the Column Alias property and click the ... button to modify the attribute form’s column alias. For information on column aliases for attribute forms, see Modifying attribute data types: Column aliases, page 248.

Project Design Guide Creating a Project Using Architect 5
© 2010 MicroStrategy, Inc. Creating and modifying attributes 153
• Attribute Expressions: The expressions used for the attribute form. You can select an attribute expression and click the ... button to modify the attribute form expression.
Creating attribute form expressions
An attribute expression represents a mapping to specific attribute information in the data source. For conceptual information on attribute forms and attribute form expressions, see Column data descriptions and identifiers: Attribute forms, page 236 and Attribute form expressions, page 240.
Attribute form expressions are commonly created by mapping a column to an attribute form, as described in Creating attributes, page 144. With Architect, you can also create and define attributes as listed below:
• Creating derived attribute form expressions, page 153
• Joining dissimilar column names: Heterogeneous mappings, page 155
Creating derived attribute form expressions
Derived expressions are created using a combination of warehouse columns, mathematical operators, functions, and constants. While simple expressions have their value determined by just one column in a warehouse table, derived expressions are defined using one or more columns as well as other operators and values. Any operation on a column (such as adding a constant, adding another column, or setting the expression to be an absolute value) creates a derived expression.
For information on derived attribute form expressions, see Derived expressions, page 243. The procedure below describes how to create a derived attribute form expression using Architect, and follows the example scenario provided in Example: creating an attribute form with a derived expression, page 243.
To create an attribute form with a derived expression using Architect
1 In MicroStrategy Desktop, log in to a project.
For the example scenario, log in to the MicroStrategy Tutorial project.
2 From the Schema menu, select Architect.

Creating a Project Using Architect Project Design Guide5
154 Creating and modifying attributes © 2010 MicroStrategy, Inc.
3 If a message is displayed asking if you want to open Architect in read only mode or edit mode, select Edit and click OK to open Architect in edit mode so that you can make changes to the project. MicroStrategy Architect opens.
Note the following:
– If you are only given the option of opening Architect in read only mode, this means another user is modifying the project’s schema. You cannot open Architect in edit mode until the other user is finished with their changes and the schema is unlocked.
– For information on how you can use read only mode and edit mode for various schema editors, see Using read only or edit mode for schema editors, page 93.
4 From the Project Tables View, locate and select a table that includes a column or columns to use in an attribute definition.
For the example scenario, select the LU_CUSTOMER table.
5 Right-click the Customer attribute and select New Attribute form. The Create New Form Expression dialog box opens.
6 Double-click the CUST_LAST_NAME column to add it to the Form expression pane on the right.
7 In the Form expression pane, place the cursor to the right of [CUST_LAST_NAME] and type + “, “ +.
8 Double-click the CUST_FIRST_NAME column to add it to the Form expression pane on the right. Your expression should be defined as shown below.
9 Select Manual as the mapping method.
10 Click OK to return to Architect. The new attribute form is displayed as part of the Customer attribute in the LU_CUSTOMER table.

Project Design Guide Creating a Project Using Architect 5
© 2010 MicroStrategy, Inc. Creating and modifying attributes 155
11 In the Properties pane, locate the new attribute form.
12 In the Name field, type Last Name, First Name.
13 From the Category drop-down list, select None since Last Name, First Name is neither the ID form of Customer nor the primary description form.
14 Because this is only an example, you can close Architect without saving your changes.
Joining dissimilar column names: Heterogeneous mappings
Heterogeneous mapping allows Intelligence Server to perform joins on dissimilar column names. If you define more than one expression for a given form, heterogeneous mapping automatically occurs when tables and column names require it.
For information on heterogeneous mappings for attributes, see Joining dissimilar column names: Heterogeneous mappings, page 245. The procedure below describes how to create an attribute form with a heterogeneous column mapping using Architect, and follows the example scenario provided in Joining dissimilar column names: Heterogeneous mappings, page 245.
To create an attribute form with a heterogeneous column mapping using Architect
1 In MicroStrategy Desktop, log in to a project.
For the example scenario, log in to the MicroStrategy Tutorial project.
2 From the Schema menu, select Architect.
3 If a message is displayed asking if you want to open Architect in read only mode or edit mode, select Edit and click OK to open Architect in edit mode so that you can make changes to the project. MicroStrategy Architect opens.
Note the following:
– If you are only given the option of opening Architect in read only mode, this means another user is modifying the project’s

Creating a Project Using Architect Project Design Guide5
156 Creating and modifying attributes © 2010 MicroStrategy, Inc.
schema. You cannot open Architect in edit mode until the other user is finished with their changes and the schema is unlocked.
– For information on how you can use read only mode and edit mode for various schema editors, see Using read only or edit mode for schema editors, page 93.
4 From the Project Tables View, locate and select a table that includes a column or columns to use in an attribute definition.
For the example scenario, select the LU_DAY table.
5 Right-click the Customer attribute and select New Attribute form. The Create New Form Expression dialog box opens.
6 Double-click the DAY_DATE column to add it to the Form expression pane on the right.
7 Select Automatic as the mapping method.
8 Click OK to return to Architect. The new attribute form is displayed as part of the Day attribute in the LU_DAY table.
9 Right-click the new attribute form and select Edit. The Modify Attribute Form dialog box opens.
10 Click New. The Create New Form Expression dialog box opens.
11 From the Source table drop-down list, select the ORDER_DETAIL table.
12 Double-click the ORDER_DATE column to add it to the Form expression pane on the right.
13 Select Automatic as the mapping method.
14 Click OK. The Create New Attribute Form dialog box opens.
Notice that there are now two expressions for the attribute form definition, both of which use different tables as the source of their information. You can continue this process to add as many heterogeneous columns as part of one attribute form as necessary.
15 Click OK to return to Architect.
16 In the Properties pane, locate the new attribute form.
17 In the Name field, type Date Example.

Project Design Guide Creating a Project Using Architect 5
© 2010 MicroStrategy, Inc. Creating and modifying attributes 157
18 From the Category drop-down list, select None since this is an example scenario.
19 Because this is only an example, you can close Architect without saving your changes.
Creating and modifying attribute data types: Column aliases
A column alias is a new data type that you can specify in place of the default data type for a given attribute form. Column aliases allow you to specify a more appropriate data type that can help avoid errors in your SQL. They can also help you take more advantage of the data in your data warehouse.
For information on column aliases for attributes, see Modifying attribute data types: Column aliases, page 248. The procedure below describes how to create a column alias using Architect, and follows the example scenario provided in Modifying attribute data types: Column aliases, page 248.
Prerequisites
This procedure assumes you have already created an attribute with a valid attribute expression for which to create a new column alias.
To create a column alias for an attribute using Architect
1 In MicroStrategy Desktop, log in to a project.
For the example scenario, log in to the MicroStrategy Tutorial project.
2 From the Schema menu, select Architect.
3 If a message is displayed asking if you want to open Architect in read only mode or edit mode, select Edit and click OK to open Architect in edit mode so that you can make changes to the project. MicroStrategy Architect opens.
Note the following:
– If you are only given the option of opening Architect in read only mode, this means another user is modifying the project’s schema. You cannot open Architect in edit mode until the other user is finished with their changes and the schema is unlocked.

Creating a Project Using Architect Project Design Guide5
158 Creating and modifying attributes © 2010 MicroStrategy, Inc.
– For information on how you can use read only mode and edit mode for various schema editors, see Using read only or edit mode for schema editors, page 93.
4 From the Project Tables View, locate and select a table that includes an attribute to create a column alias for.
5 Right-click the attribute form to create a column alias for, and select Edit. The Modify Attribute Form dialog box opens.
6 Select the Column Alias tab.
7 In the Column alias area, click Select. The Column Editor - Column Selection dialog box opens.
8 Select New to create a new column alias. The Column Editor - Definition dialog box opens.
9 You can modify the following properties for the column alias:
• Column name: The name for the column alias. This name is used in any SQL statements which include the fact column.
• Data type: The data type for the fact. For a description of the different data types supported by MicroStrategy, see Appendix C, Data Types.
• Depending on the data type selected, you can specify the byte length, bit length, precision, scale, or time scale for your column alias. For a detailed description on each of these properties, see the MicroStrategy Desktop online help.
10 Click OK to save your changes and return to the Column Editor - Column Selection dialog box.
11 Click OK to save your changes and return to the Modify Attribute Form dialog box.
12 Click OK to return to Architect.
13 From the Home tab, in the Save area, click Save and Update Schema to save your changes.

Project Design Guide Creating a Project Using Architect 5
© 2010 MicroStrategy, Inc. Creating and modifying attributes 159
Creating attributes with multiple ID columns: Compound attributes
A compound attribute is an attribute with multiple columns specified as the ID column. This implies that more than one ID column is needed to uniquely identify the elements of that attribute. Generally, you build a compound attribute when your logical data model reflects that a compound key relationship is present. In the relational database, a compound key is a primary key that consists of more than one database column.
For information on compound attributes, see Attributes with multiple ID columns: Compound attributes, page 274. The procedure below describes how to create a compound attribute using Architect, and follows the example scenario provided in Example: Creating compound attributes, page 275.
To create a compound attribute using Architect
1 In MicroStrategy Desktop, log in to a project.
For the example scenario, log in to the MicroStrategy Tutorial project.
2 From the Schema menu, select Architect.
3 If a message is displayed asking if you want to open Architect in read only mode or edit mode, select Edit and click OK to open Architect in edit mode so that you can make changes to the project. MicroStrategy Architect opens.
Note the following:
– If you are only given the option of opening Architect in read only mode, this means another user is modifying the project’s schema. You cannot open Architect in edit mode until the other user is finished with their changes and the schema is unlocked.
– For information on how you can use read only mode and edit mode for various schema editors, see Using read only or edit mode for schema editors, page 93.
4 From the Project Tables View, locate and select a table that includes the columns to use for a compound attribute.
For the example scenario, select the LU_DIST_CTR table.

Creating a Project Using Architect Project Design Guide5
160 Creating and modifying attributes © 2010 MicroStrategy, Inc.
5 Right-click the table and select Create Attribute. A dialog box opens to name the attribute.
6 Type a name for the attribute, and click OK. The Create New Form Expression dialog box opens.
7 Double-click the COUNTRY_ID column to add it to the Form expression pane on the right.
8 Select Automatic mapping method.
9 Click OK to return to Architect. The new attribute is displayed in the LU_DIST_CTR table.
To rename the attribute, right-click the attribute and select Rename.
10 In the Properties pane, locate the new attribute form.
11 In the Name field, type ID 1.
12 Right-click the attribute and click New Attribute form to create the other attribute ID form. The Create New Form Expression dialog box opens.
13 Double-click the DIST_CTR_ID column to add it to the Form expression pane on the right.
14 Select Automatic mapping method.
15 Click OK to return to Architect. The new attribute form is displayed in the LU_DIST_CTR table.
16 In the Properties pane, locate the new attribute form.
17 In the Name field, type ID 2.
18 In the Category drop-down list, select ID. A message about creating a form group is displayed.
You can also create a form group by dragging and dropping one attribute form onto another attribute form for the same attribute.

Project Design Guide Creating a Project Using Architect 5
© 2010 MicroStrategy, Inc. Creating and modifying attributes 161
19 Click Yes to create a form group. The two attribute forms are included in a form group.
For more information on using form groups to create compound attributes, see Attributes with multiple ID columns: Compound attributes, page 274.
20 In the first Name field for the attribute form, type ID.
21 Because this is only an example, you can close Architect without saving your changes.
Modifying how to use attributes to browse and report on data
Once attributes are built, they are used in two primary ways—browsing and reporting. Users browse through attributes to locate an attribute to use on a report, and users place an attribute on a report to display details about the particular attribute and how it relates to fact data. Each attribute can be displayed in a variety of forms so you must specify the default display of each of the attributes in the project. You can do this on a report-by-report basis, but you still must specify the global, or project-wide, default for each attribute.
For information on modifying the attribute forms used for reporting and browsing, see Using attributes to browse and report on data, page 277. The procedure below describes how to define attribute form display using Architect. The steps below follow the example scenario provided in Defining how attribute forms are displayed by default, page 278.
To display an attribute form in reports and in the Data Explorer using Architect
1 In MicroStrategy Desktop, log in to a project.
For the example scenario, log in to the MicroStrategy Tutorial project.
2 From the Schema menu, select Architect.
3 If a message is displayed asking if you want to open Architect in read only mode or edit mode, select Edit and click OK to open Architect in edit

Creating a Project Using Architect Project Design Guide5
162 Creating and modifying attributes © 2010 MicroStrategy, Inc.
mode so that you can make changes to the project. MicroStrategy Architect opens.
Note the following:
– If you are only given the option of opening Architect in read only mode, this means another user is modifying the project’s schema. You cannot open Architect in edit mode until the other user is finished with their changes and the schema is unlocked.
– For information on how you can use read only mode and edit mode for various schema editors, see Using read only or edit mode for schema editors, page 93.
4 From the Project Tables View, locate and select a table that includes the attribute to define how its attribute forms are displayed by default.
For the example scenario, select the LU_DIST_CTR table, which includes the attribute Distribution Center.
5 Select an attribute.
For the example scenario, select the Distribution Center attribute.
6 In the Properties pane, locate the attribute form.
For the example scenario, locate the ID 2 attribute form.
7 You can define the following display options:
• Report Sort: Defines the default sort order of the attribute form when it is included in a report. From the drop-down list, you can choose from Ascending, Descending, or None. For information on how attribute forms are sorted when multiple attribute forms of a single attribute define a default sort order, see Default sorting of multiple attribute forms on reports, page 239.
• Browse Sort: Defines the default sort order of the attribute form when it is viewed in the Data Explorer. From the drop-down list, you can choose from Ascending, Descending, or None. The Data Explorer is discussed in Enabling hierarchy browsing in reports: Data Explorer, page 299.
• Use as Browse Form: Defines whether the attribute form can be displayed in the Data Explorer. To allow an attribute form to be displayed in the Data Explorer, from the drop-down list, select True. The Data Explorer is discussed in Enabling hierarchy browsing in reports: Data Explorer, page 299.
Project Design Guide Creating a Project Using Architect 5
© 2010 MicroStrategy, Inc. Creating and modifying attributes 163
• Use as Report Form: Defines whether the attribute form is displayed on reports by default. To define an attribute form to be displayed on reports by default, from the drop-down list, select True.
8 You can also define the default sort order for attributes on reports and the Data Explorer. For information on attribute form sorting options, see Displaying forms: Attribute form properties, page 238.
9 Because this is only an example, you can close Architect without saving your changes.
Specifying attribute roles: Attributes that use the same lookup
Attribute roles allow you to use the same data to define and support two separate attributes. If you identify that one of your attributes needs to play multiple roles, you must create an attribute in the logical model for each of the roles. This ensures that a report with attributes playing multiple roles returns correct data.
For information on attribute roles, see Attributes that use the same lookup table: Attribute roles, page 266. The procedure below describes how to specify attribute roles using explicit table aliasing. The steps below follow the example scenario provided in Explicitly aliasing tables to specify attribute roles, page 271.
You can also define attribute roles using automatic role recognition, which utilizes MicroStrategy VLDB properties and is described in Using automatic attribute role recognition, page 269.
To create attribute roles with explicit table aliasing using Architect
This procedure provides steps to re-create the example of explicit table aliasing described in this section. The LU_STATE table is not included in the MicroStrategy Tutorial project. However, you can use the same high-level procedure and concepts as guidelines to create attribute roles in your project setup.
1 In MicroStrategy Desktop, log in to the project to create attribute roles with explicit table aliasing.
2 From the Schema menu, select Architect.

Creating a Project Using Architect Project Design Guide5
164 Creating and modifying attributes © 2010 MicroStrategy, Inc.
3 If a message is displayed asking if you want to open Architect in read only mode or edit mode, select Edit and click OK to open Architect in edit mode so that you can make changes to the project. MicroStrategy Architect opens.
Note the following:
– If you are only given the option of opening Architect in read only mode, this means another user is modifying the project’s schema. You cannot open Architect in edit mode until the other user is finished with their changes and the schema is unlocked.
– For information on how you can use read only mode and edit mode for various schema editors, see Using read only or edit mode for schema editors, page 93.
4 From the Project Tables View, locate and select the LU_STATE table that includes the attribute to define attribute roles for.
5 Right-click the LU_STATE table and select Create Table Alias. An LU_STATE(1) table is created.
6 Right-click LU_STATE(1), select Rename, and type LU_STATE_STORE.
7 Right-click the LU_STATE table and select Create Table Alias. An LU_STATE(1) table is created.
8 Right-click LU_STATE(1), select Rename, and type LU_STATE_VENDOR.
Create the attributes
9 Right-click the LU_STATE_STORE table and select Create Attribute. The Create New Form Expression dialog box opens.
10 In the Available columns pane, double-click STATE_ID, which identifies the attribute role.
11 Select Manual mapping and click OK. You are returned to Architect and the new attribute is created in the LU_STATE_STORE table.
12 Right-click the new attribute, select Rename, and type State Store.
13 Right-click the State Store attribute table and select New Attribute form. The Create New Form Expression dialog box opens.

Project Design Guide Creating a Project Using Architect 5
© 2010 MicroStrategy, Inc. Creating and modifying attributes 165
14 Map any other columns to attribute forms for the State Store attribute. You must make sure to map any State Store attribute forms to columns from the LU_STATE_STORE table.
15 Click OK and save the State Store attribute.
16 Create a Vendor State attribute with the same sub-procedure (Create the attributes, page 164) used to create State Store above, except you must use the LU_STATE_VENDOR table instead of the LU_STATE_STORE table.
Supporting data internationalization for attribute elements
MicroStrategy supports the internationalization of your data into the languages required for your users. This allows attribute element data to be displayed in various languages that reflect the user’s language preferences.
For information on enabling data internationalization for attribute elements, see Supporting data internationalization for attribute elements, page 233. The procedure below describes how enable data internationalization for attribute elements using Architect.
Prerequisites
• The internationalized data must be stored in your data source, as described in Supporting data internationalization, page 57.
• The project must enable data internationalization, as described in Enabling data internationalization for a project, page 89.
• An attribute has been created.
To enable or disable data internationalization for attribute forms using Architect
1 In Desktop, log in to a project.
2 From the Schema menu, select Architect.
3 If a message is displayed asking if you want to open Architect in read only mode or edit mode, select Edit and click OK to open Architect in edit

Creating a Project Using Architect Project Design Guide5
166 Defining attribute relationships © 2010 MicroStrategy, Inc.
mode so that you can make changes to the project. MicroStrategy Architect opens.
Note the following:
– If you are only given the option of opening Architect in read only mode, this means another user is modifying the project’s schema. You cannot open Architect in edit mode until the other user is finished with their changes and the schema is unlocked.
– For information on how you can use read only mode and edit mode for various schema editors, see Using read only or edit mode for schema editors, page 93.
4 From the Project Tables View, locate an attribute.
5 From the Properties pane, locate an attribute form.
6 From the Support multiple languages drop-down list, select True to enable data internationalization for the attribute form. You can select False to disable internationalization for the attribute form.
The ID form of an attribute does not have this option as these forms are used strictly for identification purposes.
7 From the Home tab, in the Save area, click Save and Close to save your changes and close Architect.
Defining attribute relationshipsAfter you have created attributes for your project, you can define attribute relationships to determine how the engine generates SQL, how tables and columns are joined and used, and which tables are related to other tables.
You link directly related attributes to each other by defining parent-child relationships. Attribute elements, or the actual data values for an attribute, dictate the relationships that you define between attributes.
The parent-child relationships that you create determine the system hierarchy within the project.
Project Design Guide Creating a Project Using Architect 5
© 2010 MicroStrategy, Inc. Defining attribute relationships 167
The four types of direct relationships that can exist between attributes include one-to-one, one-to-many, many-to-one, and many-to-many. For information on these direct relationships and steps to define them with the Attribute Editor, see Attribute relationships, page 252.
You can also use Architect to define relationships between attributes. Architect can provide a more intuitive and helpful workflow that allows you to view and modify multiple attributes as you define attribute relationships.
For example, in the MicroStrategy Tutorial project, the Time hierarchy includes relationships between the attributes Year, Quarter, Month of Year, Month, and Day. With Architect, rather than defining parent and child relationships for one attribute at a time, you can define the relationships between these attributes at the same time in a visual environment.
The steps below show you how to manually define parent and child relationships between attributes, and also provides an example scenario of creating the relationships between the attributes Year, Quarter, Month of Year, Month, and Day in the MicroStrategy Tutorial project.
You can also allow Architect to automatically define attribute relationships based on the design of your data, as described in Automatically defining attribute relationships, page 171.
Prerequisites
• Attributes have been created for your project.
To define attribute relationships
1 In MicroStrategy Desktop, log in to a project.
For the example scenario, log in to the MicroStrategy Tutorial project.
2 From the Schema menu, select Architect.
3 If a message is displayed asking if you want to open Architect in read only mode or edit mode, select Edit and click OK to open Architect in edit mode so that you can make changes to the project. MicroStrategy Architect opens.
Note the following:
– If you are only given the option of opening Architect in read only mode, this means another user is modifying the project’s
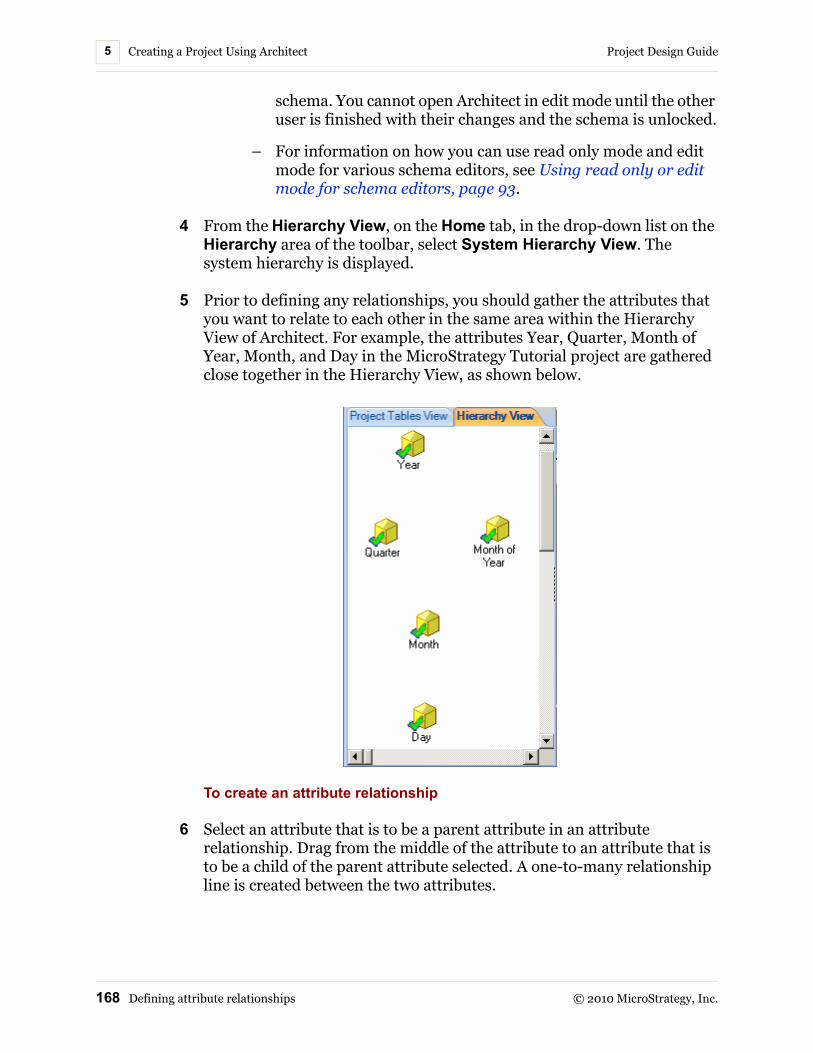
Creating a Project Using Architect Project Design Guide5
168 Defining attribute relationships © 2010 MicroStrategy, Inc.
schema. You cannot open Architect in edit mode until the other user is finished with their changes and the schema is unlocked.
– For information on how you can use read only mode and edit mode for various schema editors, see Using read only or edit mode for schema editors, page 93.
4 From the Hierarchy View, on the Home tab, in the drop-down list on the Hierarchy area of the toolbar, select System Hierarchy View. The system hierarchy is displayed.
5 Prior to defining any relationships, you should gather the attributes that you want to relate to each other in the same area within the Hierarchy View of Architect. For example, the attributes Year, Quarter, Month of Year, Month, and Day in the MicroStrategy Tutorial project are gathered close together in the Hierarchy View, as shown below.
To create an attribute relationship
6 Select an attribute that is to be a parent attribute in an attribute relationship. Drag from the middle of the attribute to an attribute that is to be a child of the parent attribute selected. A one-to-many relationship line is created between the two attributes.

Project Design Guide Creating a Project Using Architect 5
© 2010 MicroStrategy, Inc. Defining attribute relationships 169
For example, in the image below a relationship is created between the Year and Quarter attributes in which Year is a parent attribute of Quarter.
In the example above, the Year attribute is the parent attribute of Quarter.
7 Attribute relationships created in this way are created as one-to-many relationships by default. To modify the relationship type, right-click the relationship line and select from one of the relationship types listed below:
• One-to-one
• One-to-many
• Many-to-one
• Many-to-many
For information on these relationship types, see Attribute relationships, page 252.
8 A table in which both attributes exist is chosen as the table to support the attribute relationship. To modify the relationship table, right-click the relationship line, point to Relationship table, and select a table.
To define attribute relationships with other techniques
If you are finished defining attribute relationships, you can save your changes and close Architect. The rest of this procedure describes how to define attribute relationships with other techniques and completes the example scenario.
9 Right-click the Quarter attribute, and select Edit Children Relations. The Children Relations dialog box opens and lists attributes that can be related to the Quarter attribute.

Creating a Project Using Architect Project Design Guide5
170 Defining attribute relationships © 2010 MicroStrategy, Inc.
10 For the Month attribute, in the Relationship type drop-down list, select One-to-many. You can select any of the available relationship types from the Relationship type drop-down list to create the required relationship.
11 For the Month attribute, in the Relationship table drop-down list, keep the default of LU_MONTH.
12 Keep the Relationship type drop-down list at None for the other attributes listed. Quarter is not directly related to any of these attributes.
13 Click OK to close the Children Relations dialog box and create the attribute relationship between Quarter and Month.
14 Drag from the middle of the Month of Year attribute to the Month attribute. A one-to-many relationship line is drawn between the two attributes.
15 Drag from the middle of the Month attribute to the Day attribute. A one-to-many relationship line is drawn between the two attributes.
This completes the definition of the required attribute relationships, as shown below.

Project Design Guide Creating a Project Using Architect 5
© 2010 MicroStrategy, Inc. Defining attribute relationships 171
Automatically defining attribute relationships
In addition to manually defining attribute relationships (see Defining attribute relationships, page 166) you can also allow Architect to automatically define attribute relationships based on the design of your data in your data source.
The steps below show you how to automatically define attribute relationships based on the design of your data in your data source.
Prerequisites
• You have created attributes for your project (see Creating and modifying attributes, page 144).
To automatically define attribute relationships
1 In MicroStrategy Desktop, log in to a project.
2 From the Schema menu, select Architect.
3 If a message is displayed asking if you want to open Architect in read only mode or edit mode, select Edit and click OK to open Architect in edit mode so that you can make changes to the project. MicroStrategy Architect opens.
Note the following:
– If you are only given the option of opening Architect in read only mode, this means another user is modifying the project’s schema. You cannot open Architect in edit mode until the other user is finished with their changes and the schema is unlocked.
– For information on how you can use read only mode and edit mode for various schema editors, see Using read only or edit mode for schema editors, page 93.
4 From the Hierarchy View, on the Home tab, in the drop-down list on the Hierarchy area of the toolbar, select System Hierarchy View. The system hierarchy is displayed.
5 Right-click within the area that displays the attributes for your project, and select Recognize Relationships. The System Hierarchy dialog box opens.

Creating a Project Using Architect Project Design Guide5
172 Defining attribute relationships © 2010 MicroStrategy, Inc.
6 You can select from the following options to automatically define attribute relationships:
Based on Primary Keys/Foreign Keys: Creates attribute relationships based on the primary keys and foreign keys defined on your tables. Each attribute that acts as a foreign key of a table is defined as a parent attribute of each attribute that acts as a primary key of the same table. The attribute relationship is defined as a one-to-many relationship from the foreign key attribute (parent attribute) to the primary key attribute (child attribute).
Based on lookup tables: Creates attribute relationships based on lookup tables that do not include primary key or foreign key information. To define a table as a lookup table for an attribute, see Creating attributes, page 144. Each attribute that defines a table as its lookup table is defined as a child attribute of all other attributes in the same table, that do not define the table as its lookup table. Each attribute relationship is defined as a one-to-many relationship from the parent attribute to the child attribute.
Based on sample data from the table: Creates attribute relationships for attributes that share the same lookup table. To define a table as a lookup table for an attribute, see Creating attributes, page 144.
Architect analyzes sample data for the table. The attributes with fewer distinct values are defined as parents of the attributes with more distinct values, using a one-to-many relationship from the parent attribute to the child attribute. For example, a lookup table includes four rows of data, which include data related to year and quarter. Each row includes the same year (for example, 2009), but the quarter changes for each row (Q1, Q2, Q3, Q4). In this case, the Year attribute is created as a parent of the Quarter attribute.
7 Once you have selected the appropriate options, click OK to allow Architect to automatically define attribute relationships.
After all relationships are determined by the rules that you selected, Architect performs final analysis on the attribute relationships that are to be created. Any attribute relationships that are found to be redundant are not created. This ensures that attribute relationships are created that properly reflect the design of the data in your data source. For information on modifying the attribute relationships that are created, see Defining attribute relationships, page 166.

Project Design Guide Creating a Project Using Architect 5
© 2010 MicroStrategy, Inc. Creating and modifying user hierarchies 173
Creating and modifying user hierarchiesUser hierarchies provide flexibility in element browsing and report drilling. They are groups of attributes and their relationships to each other, arranged in ways that make sense to a business organization. As the structure of your business intelligence system evolves, you can modify the design of a user hierarchy to include additional attributes or to limit user access to certain attributes.
For conceptual information on user hierarchies, see Chapter 8, Creating Hierarchies to Organize and Browse Attributes.
This section describes how to use Architect to create and modify user hierarchies.
Creating user hierarchies
With Architect you can create hierarchies as part of your initial project design effort as well as throughout the entire life cycle of a project.
This section discusses creating user hierarchies to support browsing and drilling on an attribute. The system hierarchy is created according to the relationships defined between the attributes in your project. It is automatically created based on the attribute relationships you define, as described in Defining attribute relationships, page 166.
The procedure below describes how to create a user hierarchy using Architect.
Prerequisites
The procedure below assumes you have already created a project object and added tables to the project. For information on creating a project using Architect, see Creating projects using Architect, page 113.
To create a user hierarchy using Architect
1 In MicroStrategy Desktop, log in to a project.
2 From the Schema menu, select Architect.

Creating a Project Using Architect Project Design Guide5
174 Creating and modifying user hierarchies © 2010 MicroStrategy, Inc.
3 If a message is displayed asking if you want to open Architect in read only mode or edit mode, select Edit and click OK to open Architect in edit mode so that you can make changes to the project. MicroStrategy Architect opens.
Note the following:
– If you are only given the option of opening Architect in read only mode, this means another user is modifying the project’s schema. You cannot open Architect in edit mode until the other user is finished with their changes and the schema is unlocked.
– For information on how you can use read only mode and edit mode for various schema editors, see Using read only or edit mode for schema editors, page 93.
4 From the Hierarchy View, select an attribute to include in the hierarchy, and then click the New Hierarchy toolbar option. A dialog box to name the hierarchy opens.
5 In the Please enter the hierarchy name field, type a name for the hierarchy and click OK. You are returned to Hierarchy View with the attribute you selected included in the hierarchy.
6 To add additional attributes to the hierarchy, right-click within the Hierarchy View and select Add/Remove Attributes to Hierarchy. The Select Objects dialog box opens.
7 In the Available objects pane, select the attributes to use in the hierarchy and click the arrow to add them to the Selected objects pane.
8 Click OK to close the Select Attributes dialog box and return to Architect. The attributes you selected appear in Hierarchy View.
9 To create a browsing or drilling relationship, locate an attribute that is to be able to browse to and/or drill to another attribute. Drag from the middle of the attribute to another attribute. A browsing and/or drilling relationship is created between the two attributes.
10 To use the hierarchy as a drill hierarchy, right-click within the Hierarchy View and select Use As a drill hierarchy. If you clear this check box, the hierarchy is only used for browsing.
A drill hierarchy can be used for browsing as well as drilling. Drill hierarchies are discussed in Drilling using hierarchies, page 299.

Project Design Guide Creating a Project Using Architect 5
© 2010 MicroStrategy, Inc. Creating and modifying user hierarchies 175
11 Each attribute in a user hierarchy has properties that affect how that attribute is displayed and accessed in a hierarchy. You can right-click an attribute and configure the properties listed below:
• Define Browse Attributes: Defines the attributes to which users can browse to and/or drill to from the selected attribute. These relationships can also be defined by dragging and dropping from one attribute to another as is described earlier in this procedure.
• Define Attribute Filters: Specifies whether the data retrieved and displayed should be complete or filtered by any specific criteria. A filter on a hierarchy acts like a filter in a report. Only data satisfying the filter criteria is displayed (see Filtering attributes in a hierarchy, page 293).
• Set As Entry Point: Specifies whether the user can begin browsing in this hierarchy using this attribute (see Entry point, page 295).
• Element Display: Determines the elements a user can see. The element display may be Locked, Unlocked, or Limited (see Controlling the display of attribute elements, page 289).
12 From the Home tab, click Save and Close to save your changes and close Architect.
13 You can save user hierarchies in any folder. However, to make the user hierarchy available for element browsing in the Data Explorer, you must place it in the Data Explorer sub-folder within the Hierarchies folder. This is discussed in Enabling hierarchy browsing in reports: Data Explorer, page 299.
14 From the Schema menu, select Update Schema.

Creating a Project Using Architect Project Design Guide5
176 Creating and modifying user hierarchies © 2010 MicroStrategy, Inc.

© 2010 MicroStrategy, Inc. 177
66.THE BUILDING BLOCKS OF BUSINESS DATA: FACTS
Introduction
Facts are one of the essential elements within the business data model. They relate numeric data values from the data warehouse to the MicroStrategy reporting environment. Facts generally represent the answers to the business questions on which users want to report.
In the MicroStrategy environment, facts are schema objects created by and shared between MicroStrategy users. The facts you create in MicroStrategy allow users to access data stored in the data warehouse. Facts form the basis for metrics, which are used in the majority of analyses and reports that users can create with MicroStrategy.
Facts and attributes are necessary to define projects. In a MicroStrategy project, facts are numeric data and attributes are contextual data for the facts. For example, you want to analyze the amount of sales at a certain store during January. In this case, the amount of sales represents the fact, and the store and month represent attributes. As the project designer, you must

The Building Blocks of Business Data: Facts Project Design Guide6
178 © 2010 MicroStrategy, Inc.
create projects that contain facts and attributes. Users can then use these facts and attributes as building blocks for metrics and reports.
Facts are stored in the data warehouse in fact tables. These fact tables are composed of different columns. Each cell in the columns represents a specific piece of information. When fact information is requested for a report in MicroStrategy, that column is accessed to retrieve the necessary data. This data is used to create a metric (such as profit) which is a business measure.
Facts are based on physical columns within tables in the data warehouse, as shown below.

Project Design Guide The Building Blocks of Business Data: Facts 6
© 2010 MicroStrategy, Inc. Creating facts 179
Like other schema objects such as attributes, facts are logical MicroStrategy objects that correspond to physical columns and tables. Unlike attributes, facts do not describe data. Facts are the actual data values stored at a specific fact level. A fact entry level is the lowest set of attributes at which a fact is stored.
While creating facts is a major step in the initial creation of a project, it can often be necessary to modify and create facts throughout the life cycle of a project. The procedures to perform these tasks are discussed in the first section (Creating facts, page 179) of this chapter. The later sections discuss conceptual information on facts, as well as highlight some advanced fact design techniques and procedures.
Creating factsA fact has two common characteristics: it is numeric and it is aggregatable. Examples of facts include sales dollars, units sold, profit, and cost.
Data warehouses contain different types of facts depending on the purpose of the data. For example, facts such as Tenure and Compensation Cost could exist in a data warehouse that contains human resources data. Facts such as Quantity and Item Cost could exist in a warehouse containing sales and distribution data.
It is important to understand how to define facts because facts are the basis for almost all metrics. Facts also allow you to create advanced metrics containing data that is not stored in the warehouse but can be derived by extending facts.
This section provides steps to create facts at different phases of the project design process, using different techniques and MicroStrategy interfaces:
• Simultaneously creating multiple, simple facts, page 180 covers steps to create multiple, simple facts as part of the initial project design effort or later in a project’s life cycle with the Fact Creation Wizard.
You can also create multiple simple or advanced facts as part of the initial project design effort using Architect, as described in Creating and modifying simple and advanced facts using Architect, page 187.
• Creating and modifying simple and advanced facts, page 182 covers steps to add and modify both simple and advanced facts for an existing project.

The Building Blocks of Business Data: Facts Project Design Guide6
180 Creating facts © 2010 MicroStrategy, Inc.
Simultaneously creating multiple, simple facts
During your initial project design effort, you can create multiple simple facts using the Project Creation Assistant, the Fact Creation Wizard, and Architect. However, fact creation and modification can be done throughout the entire life cycle of a project. Facts can be created and modified using various techniques, utilizing the following MicroStrategy tools:
• The Fact Creation Wizard is a step-by-step interface that is typically used when you first create a project. It allows you to create multiple facts in a single creation process.
The Project Creation Assistant utilizes the Fact Creation Wizard to help you create the facts for your initial project creation effort. You can also access the Fact Creation Wizard in MicroStrategy Desktop from the Schema menu.
• The Fact Editor, which is discussed in Creating and modifying simple and advanced facts, page 182, is used to add advanced features to facts that already exist or to create new simple or advanced facts as your project evolves.
• Architect, which is discussed in Creating and modifying simple and advanced facts using Architect, page 187, is used to create and modify simple and advanced facts in a visually integrated environment.
To create facts with the Fact Creation Wizard
This procedure is part of an initial project creation effort using the Project Creation Assistant, which launches the Fact Creation Wizard to complete the fact creation tasks. For steps to access the Project Creation Wizard, see To

Project Design Guide The Building Blocks of Business Data: Facts 6
© 2010 MicroStrategy, Inc. Creating facts 181
create a new project using the Project Creation Assistant, page 83. You can also access the Fact Creation Wizard in MicroStrategy Desktop from the Schema menu.
1 In the Project Creation Assistant, select Create facts. The Fact Creation Wizard opens, as shown below:
2 Click Define Rules to set some basic fact creation rules. The Fact Creation Rules page opens.
Rules help automate and govern the fact creation process. If the naming conventions in your warehouse do not conform to the defaults in the Fact Creation Rules page, you may need to change these rules.
3 The Column data type area allows you to select the column data types that are available as possible fact ID columns. Select the check boxes for the data types to be included when the wizard searches the data warehouse for available fact columns.
For example, if you select Character and Numeric and leave the remaining check boxes cleared, only columns whose data types are numeric or character-based are displayed in the Fact Creation Wizard as possible columns to use for your facts.
Unlike most attributes which can access multiple columns of description information, a fact does not have description information. Therefore, you can only select data types for the ID columns of your facts.

The Building Blocks of Business Data: Facts Project Design Guide6
182 Creating facts © 2010 MicroStrategy, Inc.
4 The Fact name area allows you to determine how to create default fact names, that is, whether to replace underscores in the fact name with spaces and whether the first letter is capitalized. Select the appropriate check boxes to create the desired default fact names.
5 Click OK to accept your rule changes and return to the Fact Creation Wizard.
Fact column selection
6 Click Next. The Column Selection page opens, with columns that are not currently being used in the project listed in the Available columns pane.
7 From the Available columns pane, select the fact columns to use for your facts and click > to add them to your project. Click >> to add all the listed columns.
Note the following:
– You can rename any fact to make its name more user-friendly by right-clicking the fact and selecting Rename.
– The Fact Creation Wizard cannot handle columns that hold the same information but have different column names (that is, heterogeneous columns). For more information about mapping facts to heterogeneous columns, see Facts with varying column names: Heterogeneous column names, page 193.
8 To remove fact columns from your project, select them from the Facts pane and click < to move them to the left side. Click << to remove all the columns in your project.
9 Click Next. The Finish page opens.
10 Review the summary information in the Finish page and click Finish to create the facts.
The selected fact definitions are stored in the metadata. To continue creating a project with the Project Creation Assistant, see Simultaneously creating multiple attributes, page 219.
Creating and modifying simple and advanced facts
After you have created a project, you can use either the Fact Creation Wizard, the Fact Editor, or Architect to create and modify facts in your project:

Project Design Guide The Building Blocks of Business Data: Facts 6
© 2010 MicroStrategy, Inc. Creating facts 183
• With Architect you can:
Create simple facts
Create multiple facts quickly
Add a large number of facts during project creation
Create simple and advanced facts
Edit existing facts and configure additional schema-level settings
With Architect, you can support all of the simple and advanced fact features that are available in the Fact Editor. Rather than focusing on one fact at a time with the Fact Editor, you can use Architect to create and modify multiple facts for a project at one time. For information on how to use Architect, see Creating and modifying simple and advanced facts using Architect, page 187.
• With the Fact Creation Wizard you can:
Create simple facts
Create multiple facts quickly
Add a large number of facts during project creation
The Fact Creation Wizard can create multiple facts quickly and easily. However, it limits you to creating simple facts and does not allow you to edit existing facts. Typically, you only use the Fact Creation Wizard as part of the initial project creation, for creating most of the facts for the project. For steps to use the Fact Creation Wizard, see Creating one or more simple facts with the Fact Creation Wizard, page 184.
• With the Fact Editor you can:
Create simple and advanced facts
Edit existing facts and configure additional schema-level settings
You can use the Fact Editor to edit existing facts and create fact expressions, column aliases, level extensions; map multiple or heterogeneous columns; and configure other settings. The Fact Editor allows you to modify one fact at a time, which can be helpful when only a few facts in a project need to be modified. For steps to use the Fact Editor, see Creating simple and advanced facts with the Fact Editor, page 184 and Modifying simple and advanced facts with the Fact Editor, page 187.

The Building Blocks of Business Data: Facts Project Design Guide6
184 Creating facts © 2010 MicroStrategy, Inc.
Creating one or more simple facts with the Fact Creation Wizard
Although the Fact Creation Wizard is primarily used to create most of a project’s facts during initial project creation, you can use it at any time to create one or more simple facts at the same time.
To create facts with the Fact Creation Wizard
1 In MicroStrategy Desktop, log in to the project source that contains your project and expand your project.
You must use a login that has Architect privileges. For more information about privileges, see Permissions and Privileges of the MicroStrategy System Administration Guide.
2 From the Folder List in MicroStrategy Desktop, select the project to which to add additional facts.
3 From the Schema menu, select Fact Creation Wizard. The Fact Creation Wizard opens.
To use the Fact Creation Wizard to add facts, follow the procedures outlined in To create facts with the Fact Creation Wizard, page 180.
Creating simple and advanced facts with the Fact Editor
As your project evolves, you can create additional facts and modify existing facts with the Fact Editor. You can also use the Fact Editor to add extensions to those facts and configure additional settings within them to support various analytical requirements.
The following procedure describes how to use the Fact Editor to create a simple fact based on a single fact column in a table.
Project Design Guide The Building Blocks of Business Data: Facts 6
© 2010 MicroStrategy, Inc. Creating facts 185
To create a simple fact with the Fact Editor
1 In MicroStrategy Desktop, log in to the project source that contains your project and expand your project.
You must use a login that has Architect privileges. For more information about privileges, see Permissions and Privileges of the MicroStrategy System Administration Guide.
2 From the Folder List in MicroStrategy Desktop, select the project to which to add additional facts.
3 From the File menu, select New, and then Fact. The Fact Editor opens, with the Create New Fact Expression dialog box displayed on top of it.
4 From the Source table drop-down list, select the source table for the fact.
The source table is the table or logical view that contains the fact column on which you want to base a new fact.
5 From the Available columns pane, drag and drop a column into the Fact expression pane.
You can include multiple columns as well as use numeric constants and mathematical operators and functions to create a fact expression. For information on creating various types of fact expressions, see Mapping physical columns to facts: Fact expressions, page 190.
6 In the Mapping area, select Automatic or Manual:
• Automatic mapping means that all of the tables in the project with the columns used in the fact expression are selected as possible source tables for the fact. You can then remove any tables mapped automatically or select other tables.
• Manual mapping means that all of the tables in the project with the columns used in the fact expression are located but are not selected as possible source tables for the fact. You can then select which of those tables are used as source tables for the fact. Other scenarios in which you should use the manual mapping method include:
– If you are creating a constant expression that is not based on a physical column in a project table, you must select the tables for which you want your constant expression to apply.

The Building Blocks of Business Data: Facts Project Design Guide6
186 Creating facts © 2010 MicroStrategy, Inc.
– If the same column name does not contain the same data across different tables, manually select the appropriate source tables for each fact. For example, suppose you have a column named Sales, which exists in both the Fact_Sales table and the Fact_Discount table. In the Fact_Sales table, the Sales column contains revenue data. However, in the Fact_Discount table, the Sales column contains discount data. In other words, although the column name is the same in both tables (Sales), the columns contain different fact data in each table. When creating the Revenue fact, you must select the Manual mapping method so you can select the Fact_Sales table as a source table for the Revenue fact. When creating the Discount fact, you must select the Manual mapping method so you can select the Fact_Discount table as a source table for the Discount fact. If you use the Automatic mapping method in both cases, the MicroStrategy SQL Engine may use the incorrect column for the facts.
7 Click OK to close the Create New Fact Expression dialog box.
8 Use the tabs of the Fact Editor to define fact expressions, create column aliases, and create extensions, as described below.
For detailed information about the options on each tab within the Fact Editor, refer to the MicroStrategy Desktop online help.
• Definition: This tab allows you to define fact expressions. Fact definitions are discussed in How facts are defined, page 189.
• Column Alias: This tab allows you to create a column alias for the fact. Column aliases are discussed in Fact column names and data types: Column aliases, page 196.
• Extensions: This tab allows you to create fact level extensions. Fact extensions are discussed in Modifying the levels at which facts are reported: Level extensions, page 198.
9 When your changes are complete, click Save and Close.
10 In the Save As dialog box, navigate to the location in which to save the fact. Enter a name for the fact and click Save. The fact is saved and the Fact Editor closes.
11 From the Schema menu, select Update Schema to update the project schema.

Project Design Guide The Building Blocks of Business Data: Facts 6
© 2010 MicroStrategy, Inc. Creating facts 187
Modifying simple and advanced facts with the Fact Editor
To modify an existing fact with the Fact Editor
1 In MicroStrategy Desktop, open the folder that contains the fact to modify.
2 Double-click the fact to open the Fact Editor and edit the fact.
You can learn how to create more advanced facts in the various sections below.
Creating and modifying simple and advanced facts using Architect
Architect can be used to create and modify simple and advanced facts in a visually integrated environment. Architect allows you to view the tables, attributes, attribute relationships, facts, user hierarchies, and other project objects together as you design your project.
With Architect, you can support all of the simple and advanced fact features that are available in the Fact Editor. Rather than focusing on one fact at a time with the Fact Editor, you can use Architect to create and modify multiple facts for a project at one time. Review the chapters and sections listed below for information on Architect and steps to create and modify facts using Architect:
• Chapter 5, Creating a Project Using Architect
• Creating and modifying projects, page 100
• Creating and modifying facts, page 131

The Building Blocks of Business Data: Facts Project Design Guide6
188 The structure of facts © 2010 MicroStrategy, Inc.
The structure of factsAs shown in the diagram below, facts are made up of the following components:
• The fact definition is composed of one or more fact expressions. Every fact must have at least one expression. Fact definitions are discussed in detail in How facts are defined, page 189.
• The column alias stores the column name MicroStrategy uses to generate SQL statements when creating temporary tables related to the fact. Every fact must have a column alias. MicroStrategy selects a default column alias depending on the type of fact, unless you create a new column alias. Column aliases are discussed in detail in Fact column names and data types: Column aliases, page 196.
• Fact level extensions allow facts stored in the data warehouse at one level to be reported at an unrelated level. Extensions can also prevent a fact from being reported at a certain level, even though it is stored at that level. Level extensions are very effective for advanced data modeling scenarios. Level extensions are discussed in detail in Modifying the levels at which facts are reported: Level extensions, page 198.
You create facts in MicroStrategy Desktop using the Fact Creation Wizard and the Fact Editor. During project creation with the Fact Creation Wizard, when you select the numeric column used to represent the fact, both the fact definition and column alias are automatically defined. Level extensions are optional.

Project Design Guide The Building Blocks of Business Data: Facts 6
© 2010 MicroStrategy, Inc. How facts are defined 189
For a discussion of the tools used to created facts and procedures on how to use them, see Creating facts, page 179.
How facts are defined A fact definition contains properties that define a fact and its components. The fact definition is composed of at least one fact expression and basic information about the fact, including the fact name, expression, and the source tables it uses.
The following table provides an example of a fact definition, which includes the fact’s name, expression, and source tables.
In the example, the fact expression maps the fact to the All_Sales columns in the LU_ITEM and ORDER_DETAIL tables in the warehouse. The fact expression contained in the definition represents how the fact is calculated by MicroStrategy. In this case, the fact expression is simply the name of the column which holds the fact data. However, some facts use more advanced expressions to perform calculations on multiple columns of data to return a single fact.
Facts can be found in multiple tables in a warehouse schema, and often must be calculated differently from one table to the next. While the Unit Price fact only has one expression, multiple expressions can exist within a fact definition.
Note the following:
• Each fact expression relates to one or more related tables that contain the fact.
• For each of the tables, fact expressions define how the fact is calculated.
Fact Name Expression Source Tables
Unit Price All_Sales LU_ITEMORDER_DETAIL

The Building Blocks of Business Data: Facts Project Design Guide6
190 How facts are defined © 2010 MicroStrategy, Inc.
Mapping physical columns to facts: Fact expressions
A fact expression maps facts to physical columns in the warehouse. These expressions can be as simple as a fact column name from the warehouse or as sophisticated as a formula containing multiple fact column names and numeric constants. Regardless of how it is defined, a fact expression represents a mapping to specific fact information in the warehouse. A fact definition must have one or more fact expressions.
The following image illustrates a column in the fact table and the associated fact expressions:
Valid fact expressions are formulas constructed from fact columns with or without numeric constants or mathematical operators. The mathematical operators that can be used in a fact expression are:
• Addition (+)
• Subtraction (-)
• Multiplication (*)
• Division (/)
You can use the Fact Editor to create fact expressions. These steps are covered in Creating and modifying simple and advanced facts, page 182.
A fact can be defined using an ApplySimple function. Apply functions are discussed in the Pass-Through Expressions appendix in the MicroStrategy Advanced Reporting Guide.
Most facts represent physical columns in the data warehouse. However, some facts do not exist at all in the warehouse and are defined in other ways, as explained in the following sections.

Project Design Guide The Building Blocks of Business Data: Facts 6
© 2010 MicroStrategy, Inc. How facts are defined 191
Implicit facts and implicit fact expressions
Implicit facts are virtual or constant facts that do not physically exist in the database. An implicit fact indicates a fact table from which to retrieve data. The implicit fact can have its expression defined as a constant value, although nothing is saved in a table column.
For example, you can use implicit fact expressions to create “temporary columns” in the database with a value of “1” for every row. These temporary columns allow you to keep track of how many rows are returned for a certain attribute. You may also find it helpful to use implicit facts when building metrics, where you can sum the column holding the constant to create a COUNT. For example, if you want to build a metric defined as Sum(1), you can define a fact equal to the constant “1”. For detailed information about metrics, see the MicroStrategy Advanced Reporting Guide.
Derived facts and derived fact expressions
A derived fact has its value determined by an expression that contains more than just a column in a table. Any operation on a column such as adding a constant, adding another column’s values, or setting the expression to be an absolute value, creates a derived fact. In other words, you are creating a fact from information that is available in the data warehouse. For example, a table in your data warehouse contains the following elements:
You can create a new fact, Sales, by creating the following derived fact:
Sales = Quantity_Sold * Price
One advantage of creating a derived fact is that a derived fact allows one consistent fact to exist in the project in lieu of having to retrieve multiple intermediary facts from multiple tables. Using a single fact saves storage space and limits the number of SQL passes used in queries.
Rather than creating a derived fact, you can create such analysis in MicroStrategy with the use of metrics. Metrics allow you to perform
Fact Table 1
ItemQuarterQuantity_SoldPrice

The Building Blocks of Business Data: Facts Project Design Guide6
192 How facts are defined © 2010 MicroStrategy, Inc.
calculations and aggregations on your fact data. For more information on what metrics are and how to create them, see the MicroStrategy Advanced Reporting Guide.
Example: creating derived facts
The Cost fact in the MicroStrategy Tutorial contains the derived fact expression Qty_Sold * Unit_Cost. This expression implies that columns containing data about the quantity of items sold and the price of those units can be multiplied to produce a useful business calculation. In this case, the columns are used to answer the business question, “How much did it cost the company to create the items purchased by customers?”
The following procedure describes how to create a derived fact that uses the derived fact expression described above. You can also created derived facts that use derived fact expressions using Architect, which is described in Creating derived facts and fact expressions, page 138.
To create a derived fact
1 In MicroStrategy Desktop, log in to the MicroStrategy Tutorial project.
2 Navigate to the My Personal Objects folder, and open the My Objects folder.
3 From the File menu, point to New, and then select Fact. The Fact Editor opens, with the Create New Fact Expression dialog box displayed on top of it.
4 From the Source table drop-down list, select the ORDER_DETAIL table.
5 From the Available columns pane, double-click the QTY_SOLD column to add it to the Fact expression pane on the right.
To complete the derived fact expression
A derived fact expression includes a combination of columns, numerical constants, and mathematical operators. The steps below continue the example scenario to provide a guideline of how to create derived fact expressions.
6 With the cursor in the Fact expression pane, click * (multiplication operator) to add it to the expression.

Project Design Guide The Building Blocks of Business Data: Facts 6
© 2010 MicroStrategy, Inc. How facts are defined 193
7 From the Available columns pane, double-click the UNIT_PRICE column to add it to end of the fact expression.
8 Under Mapping method, select Automatic.
9 Click Validate to check whether the syntax of the expression is correct. The expression should appear as shown below:
10 Click OK. The derived fact expression appears in the Fact expression pane in the Fact Editor.
11 From the File menu, select Save As. The Save menu opens.
12 Enter a name for the derived fact and click Save.
13 When you create a fact for your project, at this point, you must update the project schema. However, since this is only an example, it is not necessary to update the schema.
Facts with varying column names: Heterogeneous column names
In your warehouse, the same fact can access columns with different column names. In the example below, two fact tables in a warehouse each contain columns for dollar sales. Table 1 contains a fact called Dollar_Sales. Table 2 includes a fact called Dollar_Sls. These two items represent the same information.
YearDollar_Sales
Table 1
MonthDollar_Sls
Table 2

The Building Blocks of Business Data: Facts Project Design Guide6
194 How facts are defined © 2010 MicroStrategy, Inc.
MicroStrategy allows you to identify heterogeneous fact column names for each fact. With heterogeneous column names, you can refer the same fact to multiple columns with different column names and from different tables that identify the same quantitative value.
In the example above, creating a heterogeneous fact column name for dollar sales informs the system that the Dollar_Sales and Dollar_Sls columns represent the same fact. When you call for the information in a report through the use of a metric, both fact columns are used in the SQL, resulting in an accurate representation of the fact in the report.
Example: mapping heterogeneous fact columns
The Units Sold fact in MicroStrategy Tutorial consists of two fact columns in the warehouse, Qty_Sold and Tot_Unit_Sales. Although these fact columns have different names and exist in different fact tables, they represent the same data and are therefore both mapped to the Unit Sold fact.
You must map heterogeneous fact columns to their corresponding facts to ensure that accurate and complete data is displayed on reports.
The following procedure describes how to create the Units Sold fact that already exists in MicroStrategy Tutorial. In the procedure, you create the Units Sold fact and map its corresponding heterogeneous fact columns to it. You can also use Architect to create a fact with heterogeneous column names, which is described in Creating facts with varying column names: Heterogeneous column names, page 140.
To create a fact with heterogeneous column names
1 In MicroStrategy Desktop, log in to the MicroStrategy Tutorial project.
2 Navigate to the My Personal Objects folder, and open the My Objects folder.
3 From the File menu, point to New, and then select Fact. The Fact Editor opens, with the Create New Fact Expression dialog box displayed on top of it.
4 From the Source table drop-down list, select the ORDER_FACT table. This is one of the tables in which a heterogeneous fact column for the Units Sold fact exists.

Project Design Guide The Building Blocks of Business Data: Facts 6
© 2010 MicroStrategy, Inc. How facts are defined 195
5 From the Available columns pane, double-click the QTY_SOLD column to add it to the Fact expression pane on the right.
6 In the Mapping method area, select Automatic.
7 Click OK. The Fact Editor opens and the fact expression you just created appears in the Fact expression pane.
Now you must add the other heterogeneous fact column as separate expression for the Units Sold fact.
8 Click New. The Create New Fact Expression dialog box opens.
9 From the Source table drop-down list, select the CITY_CTR_SALES table. This is the other table in which a heterogeneous fact column for the Units Sold fact exists.
10 From the Available columns pane, double-click the TOT_UNIT_SALES column to add it to the Fact expression pane on the right.
11 In the Mapping method area, select Automatic.
12 Click OK. The Fact Editor opens and the fact expression you just created appears in the Fact expression pane. Now the Units Sold fact you are creating maps correctly to its heterogeneous fact columns.
13 From the File menu, select Save As. The Save menu opens.
14 Enter a name for the new fact and click Save.
15 When you create a fact for your project, at this point, you must update the project schema. However, since this is only an example, it is not necessary to update the schema.
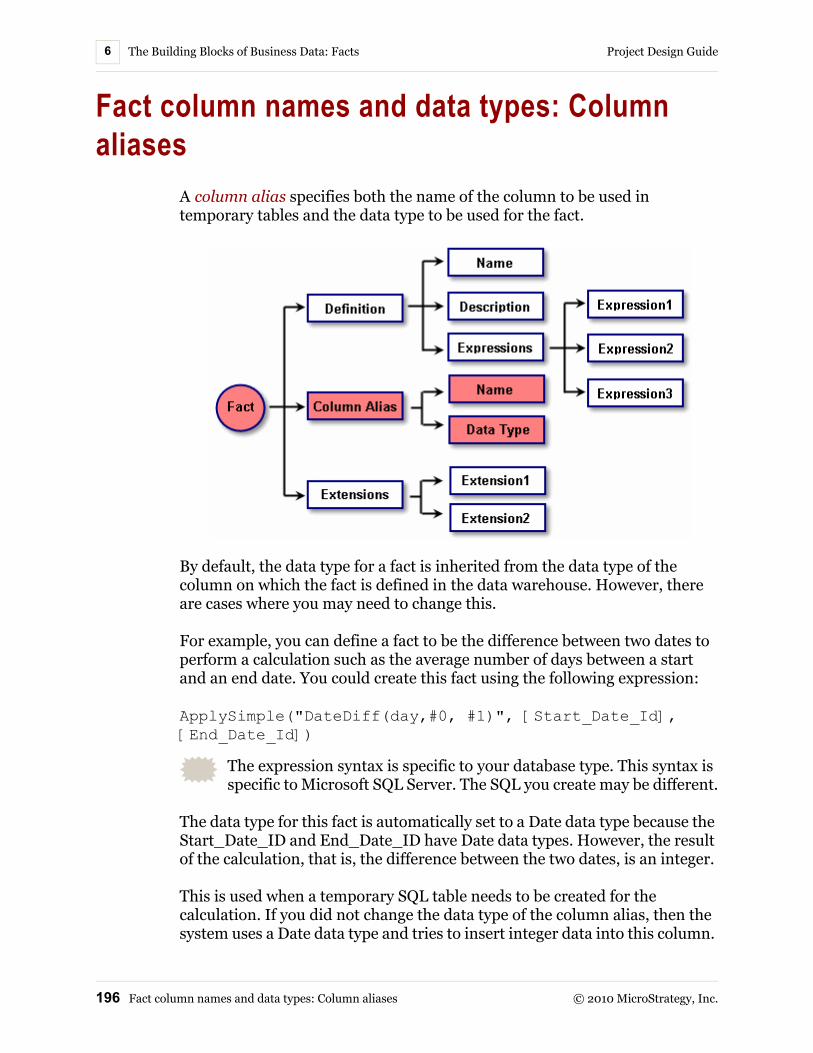
The Building Blocks of Business Data: Facts Project Design Guide6
196 Fact column names and data types: Column aliases © 2010 MicroStrategy, Inc.
Fact column names and data types: Column aliases
A column alias specifies both the name of the column to be used in temporary tables and the data type to be used for the fact.
By default, the data type for a fact is inherited from the data type of the column on which the fact is defined in the data warehouse. However, there are cases where you may need to change this.
For example, you can define a fact to be the difference between two dates to perform a calculation such as the average number of days between a start and an end date. You could create this fact using the following expression:
ApplySimple("DateDiff(day,#0, #1)", [Start_Date_Id], [End_Date_Id])
The expression syntax is specific to your database type. This syntax is specific to Microsoft SQL Server. The SQL you create may be different.
The data type for this fact is automatically set to a Date data type because the Start_Date_ID and End_Date_ID have Date data types. However, the result of the calculation, that is, the difference between the two dates, is an integer.
This is used when a temporary SQL table needs to be created for the calculation. If you did not change the data type of the column alias, then the system uses a Date data type and tries to insert integer data into this column.

Project Design Guide The Building Blocks of Business Data: Facts 6
© 2010 MicroStrategy, Inc. Fact column names and data types: Column aliases 197
This can cause an error for some database platforms. To avoid the possibility of an error due to conflicting data types, you should modify the column alias for the fact to change the default Date data type to an Integer data type.
The procedure below describes how to use the Fact Editor to create column aliases. You can create column aliases using Architect, which is described in Creating and modifying fact column names and data types: Column aliases, page 142.
Prerequisites
This procedure assumes you have already created a fact with a valid fact expression for which to create a new column alias.
To create a column alias for a fact
1 In MicroStrategy Desktop, log in to the project source that contains the fact to create a new column alias for.
2 Right-click the fact and select Edit. If a message is displayed asking if you want to use read only mode or edit mode, select Edit and click OK to open the Fact Editor in edit mode so that you can make changes to the fact. The Fact Editor opens.
Note the following:
– If you are only given the option of opening the Fact Editor in read only mode, this means another user is modifying the project’s schema. You cannot open the Fact Editor in edit mode until the other user is finished with their changes and the schema is unlocked.
– For information on how you can use read only mode and edit mode for various schema editors, see Using read only or edit mode for schema editors, page 93.
3 Select the Column Alias tab.
4 In the Column alias area, click Modify. The Column Editor - Column Selection dialog box opens.
5 Select New to create a new column alias. The Column Editor - Definition dialog box opens.

The Building Blocks of Business Data: Facts Project Design Guide6
198 Modifying the levels at which facts are reported: Level extensions © 2010 MicroStrategy, Inc.
6 You can modify the following properties for the column alias:
• Column name: The name for the column alias which is used in any SQL statements which include the fact column.
• Data type: The data type for the fact. For a description of the different data types supported by MicroStrategy, see Appendix C, Data Types.
• Depending on the data type selected, you can specify the byte length, bit length, precision, scale, or time scale for your column alias. For a detailed description on each of these properties, see the MicroStrategy Desktop online help.
7 Click OK to save your changes and return to the Column Editor - Column Selection dialog box.
8 Click OK to save your changes and return to the Fact Editor.
9 Select Save and Close to save your changes.
Modifying the levels at which facts are reported: Level extensions
Facts are stored at a particular business level in the warehouse. The level of a fact is defined by the attribute IDs present in the table. For example, the fact table shown below contains several attribute IDs, including Item and Quarter. These attribute IDs imply that the fact is reported at the item and quarter levels by default.
Level extensions are necessary when facts are stored in the data warehouse at one level and reported at different levels. Every fact is tied to a set of attributes that may or may not satisfy all users’ reporting requirements. A
Fact Table 1
ItemQuarterQuantity_SoldPrice

Project Design Guide The Building Blocks of Business Data: Facts 6
© 2010 MicroStrategy, Inc. Modifying the levels at which facts are reported: Level extensions 199
fact extension is needed when a fact does not relate directly or indirectly to an attribute included on a report.
If the entry level of a fact is at the lowest level of a hierarchy, all attributes at a higher logical level in the hierarchy are available for use as well, without the use of level extensions. For example if you have a cost fact at the level of a date attribute in a time hierarchy, MicroStrategy can aggregate the cost fact data to the level of the year attribute because it is in the same hierarchy as the date attribute and at a higher level. However, facts require level extensions to be related to any attributes that are at a lower logical level in the same hierarchy than the entry level for a fact (see Lowering the level of fact data: Fact degradations, page 207).
You can use level extensions to change a fact level and extend a fact level to a level in a completely different hierarchy. For example, you record a Discount fact at the Item/Date level. That is, discounts apply to particular items on particular days. To see if some call centers are selling significantly more items at a discount than other call centers, you have to extend the level of the Discount fact to the Call Center level, which is an attribute from a different hierarchy.
Level extensions define how facts can be extended, lowered, or disallowed to other attributes across the schema. By creating a level extension, you are allowing facts or attributes that have been captured at one level to be extended to other levels to meet reporting requirements.
Level extensions are not required like the fact definition and column alias, and they tend to be used only in specific cases.

The Building Blocks of Business Data: Facts Project Design Guide6
200 Modifying the levels at which facts are reported: Level extensions © 2010 MicroStrategy, Inc.
Before a metric containing a fact can be used with an attribute that is not in or related to the attribute’s entry level, a level extension must be defined for the fact. This is because if a fact is stored at a level unrelated to an attribute on a report, a level extension must exist to relate the fact data to the attribute. Otherwise, there is no way to make a connection between the fact data and the attribute.
You can create fact level extensions by using any of the following methods:
• Defining a join on fact tables using table relations, page 200
• Defining a join on fact tables using fact relations, page 204
• Forcing facts to relate to attributes: Using cross product joins, page 206
• Lowering the level of fact data: Fact degradations, page 207
• Disallowing the reporting of a fact at a certain level, page 211
You can find complete descriptions for each of these methods in the online help for the Level Extension Wizard in the Fact Editor.
You can use the Fact Editor to create level extensions.
Defining a join on fact tables using table relations
A table relation defines a join on tables. When you specify a table to join with a fact, you are creating a table relation to extend a fact. A fact extension can be used to relate a fact to an attribute using a fact table. The join is important as the table contains an attribute in the entry level and the attribute to which to extend.
For example, the MicroStrategy Tutorial project includes a Freight metric. This metric has a table relation fact extension to the Item attribute. Since the ORDER_FACT table that defines Freight does not include the identity column for the Item attribute, the Freight fact cannot be reported at the Item level. A fact extension is required to view freight values for each item included in an order. In this example, the ORDER_DETAIL table is used to create the Freight fact extension to Item because:
1 The ORDER_FACT and ORDER_DETAIL tables both contain the Order attribute’s identity column to join the tables, and ORDER_DETAIL contains the Item attribute’s identity column to extend the fact to Item.

Project Design Guide The Building Blocks of Business Data: Facts 6
© 2010 MicroStrategy, Inc. Modifying the levels at which facts are reported: Level extensions 201
2 The Freight fact cannot simply be joined with a table containing Item information to return a meaningful freight value for each item. An allocation expression is required to extend Freight to the Item level. Notice that the ORDER_FACT and ORDER_DETAIL tables include Order-level Units Sold and Item-level Units Sold columns respectively. These two columns are used to allocate the fact expression in the procedure below.
The following procedure steps through how to create the fact extension that has been created for the Freight fact of the Tutorial project. The procedure also describes general principles of creating fact extensions which you can use to create fact extensions for the facts in your project.
To define a fact extension with a table relation
1 In Desktop, log in to the MicroStrategy Tutorial project.
2 Browse to the Facts folder and double-click the Freight fact to edit it. If a message is displayed asking if you want to use read only mode or edit mode, select Edit and click OK to open the Fact Editor in edit mode so that you can make changes to the fact. The Fact Editor opens.
Note the following:
– If you are only given the option of opening the Fact Editor in read only mode, this means another user is modifying the project’s schema. You cannot open the Fact Editor in edit mode until the other user is finished with their changes and the schema is unlocked.
– For information on how you can use read only mode and edit mode for various schema editors, see Using read only or edit mode for schema editors, page 93.
3 Click the Extensions tab.
4 Select Extension to Item and click Modify. The Level Extension Wizard opens.
To create a new fact extension you would click New. However, this example steps through how the Freight fact extension Extension to Item was created.
5 Read the Welcome statement and click Next. The General Information page opens.

The Building Blocks of Business Data: Facts Project Design Guide6
202 Modifying the levels at which facts are reported: Level extensions © 2010 MicroStrategy, Inc.
To lower, extend, or disallow the fact entry level
6 Enter a name and a description for your fact extension (already provided). Then select whether you want to:
• Lower the fact entry level: define a fact degradation (see Lowering the level of fact data: Fact degradations, page 207)
• Extend the fact entry level: define a fact extension on a table relation, dynamic fact relation, or a cross product join
• Disallow partially or completely the fact entry level: define a fact extension that does not allow a fact to be reported at a certain level (see Disallowing the reporting of a fact at a certain level, page 211)
For this example you are creating a fact extension on a table relation, so select Extend the fact entry level, and click Next. The Extended Attributes page opens.
To select attributes to extend the fact to
7 Select the attributes you want to extend the fact to, allowing the fact to be reported at the new level. For this example Item is already selected. Click Next. The Extension Type page opens.
To extend the fact so that it can be reported at any level in a hierarchy, choose the lowest level attribute in that hierarchy.
To select the type of fact extension
8 Select how you want to extend the fact:
• Specify the relationship table used to extend the fact: select a relationship table and join attributes.
• Select the relationship table dynamically: select a fact and join attributes. This allows the MicroStrategy Engine to select the table that includes the fact and join attributes you choose to create the fact extension (see Defining a join on fact tables using fact relations, page 204).
• Perform the extension through a cross product: select to apply a cross product join (see Forcing facts to relate to attributes: Using cross product joins, page 206).
For this example select Specify the relationship table used to extend the fact, and click Next to continue defining your fact extension on a table relation. The Table Selection page opens.

Project Design Guide The Building Blocks of Business Data: Facts 6
© 2010 MicroStrategy, Inc. Modifying the levels at which facts are reported: Level extensions 203
To select the table, join attributes, and define the allocation expression
9 Select the table used to extend the fact to the new level. For this example, the ORDER_DETAIL table is already selected. Click Next. The Join Type page opens.
10 Select whether to allow Intelligence Server to dynamically select what attribute(s) to perform the join, or manually select the attribute(s). Since you know that you want to join the ORDER_FACT and ORDER_DETAIL tables using the Order attribute, select Order and click Next. The Join Attributes Direction page opens.
11 You can choose to join using the attribute, or join using the attribute and its children. In this case Order has no children, so you do not have to click the Join against arrow to change the default. Click Next. The Allocation page opens.
12 Enter an allocation expression that calculates the fact at the new level. For this example, the allocation expression is already provided, ((Freight * [Item-level Units Sold]) / [Order-level Units Sold]).
Take a moment to review the allocation expression. Notice that the expression returns an average freight amount per item of an order. Therefore, the extension of Freight provides an estimate of the freight for each item of an order, not an exact calculation. A more detailed description of why this occurs follows this procedure.
13 Click Finish to create the fact extension.
When the engine processes a report containing Order, Item, and Freight, it joins ORDER_FACT and ORDER_DETAIL and considers the resulting table as one logical fact table at the Item, Day, Order, Employee, Promotion level. The SQL generated for the report containing Order, Item, and Freight (metric mapped to the Freight fact) is:
select a11.[ORDER_ID] AS ORDER_ID,max(a11.[ORDER_DATE]) AS ORDER_DATE,a12.[ITEM_ID] AS ITEM_ID,max(a13.[ITEM_NAME]) AS ITEM_NAME,sum(((a11.[FREIGHT] * a12.[QTY_SOLD]) /a11.[QTY_SOLD])) AS WJXBFS1
from [ORDER_FACT] a11, [ORDER_DETAIL] a12,[LU_ITEM] a13
where a11.[ORDER_ID] = a12.[ORDER_ID] and a12.[ITEM_ID] = a13.[ITEM_ID]
group by a11.[ORDER_ID], a12.[ITEM_ID]

The Building Blocks of Business Data: Facts Project Design Guide6
204 Modifying the levels at which facts are reported: Level extensions © 2010 MicroStrategy, Inc.
The SQL statement above is for an Access database. The SQL for your reports may vary depending on the type of DBMS you use.
To view how the fact extension is an estimation of freight values for each item of an order, review the values of the first order with an extra metric that calculates the number of each item type in an order shown below.
Notice that the Freight metric averages the amount of freight per item in an order. The larger freight values occur because more than one of the item type was included in the order. This illustrates how fact extensions often provide an estimation of values at a different level rather than an exact calculation. If you want to provide exact values of data at a certain level, you most likely need to capture such data and store it in your data source.
Defining a join on fact tables using fact relations
Fact extensions can be defined by a fact relation instead of a table relation. With a fact relation, the table join is possible on any table that contains the fact. This allows more flexibility in defining the relations, since the MicroStrategy Engine is responsible for choosing the appropriate table to join, rather than you having to select tables manually.
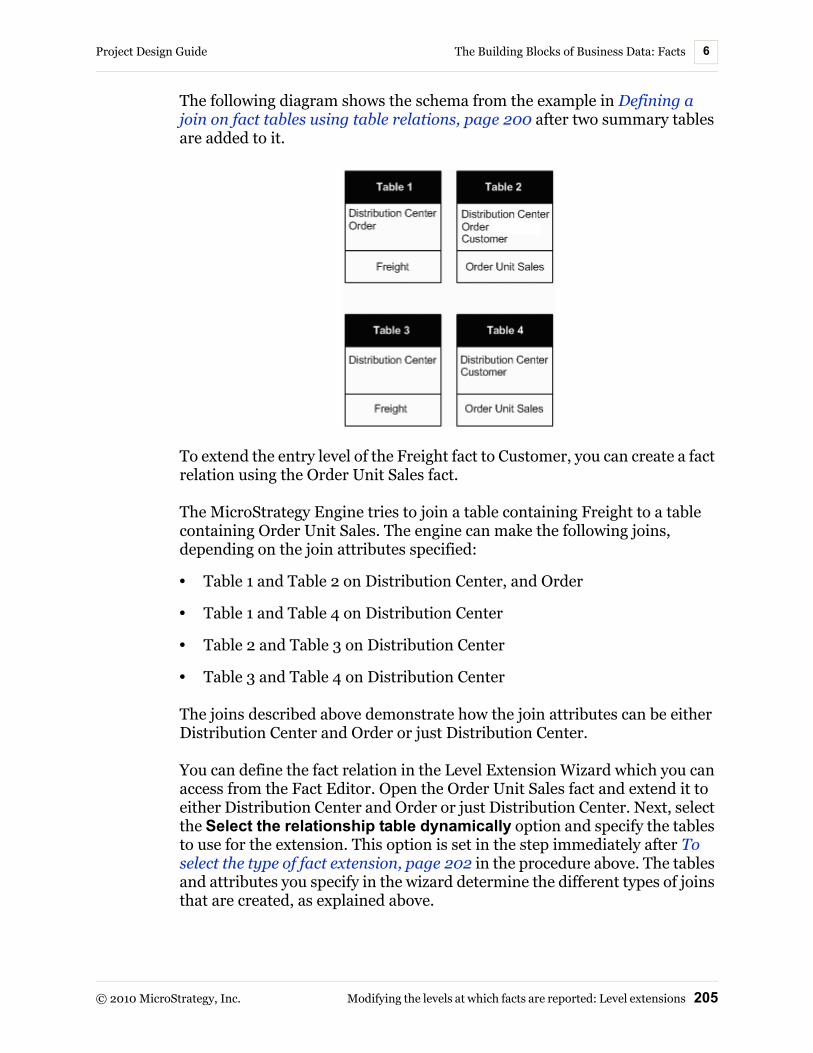
Project Design Guide The Building Blocks of Business Data: Facts 6
© 2010 MicroStrategy, Inc. Modifying the levels at which facts are reported: Level extensions 205
The following diagram shows the schema from the example in Defining a join on fact tables using table relations, page 200 after two summary tables are added to it.
To extend the entry level of the Freight fact to Customer, you can create a fact relation using the Order Unit Sales fact.
The MicroStrategy Engine tries to join a table containing Freight to a table containing Order Unit Sales. The engine can make the following joins, depending on the join attributes specified:
• Table 1 and Table 2 on Distribution Center, and Order
• Table 1 and Table 4 on Distribution Center
• Table 2 and Table 3 on Distribution Center
• Table 3 and Table 4 on Distribution Center
The joins described above demonstrate how the join attributes can be either Distribution Center and Order or just Distribution Center.
You can define the fact relation in the Level Extension Wizard which you can access from the Fact Editor. Open the Order Unit Sales fact and extend it to either Distribution Center and Order or just Distribution Center. Next, select the Select the relationship table dynamically option and specify the tables to use for the extension. This option is set in the step immediately after To select the type of fact extension, page 202 in the procedure above. The tables and attributes you specify in the wizard determine the different types of joins that are created, as explained above.

The Building Blocks of Business Data: Facts Project Design Guide6
206 Modifying the levels at which facts are reported: Level extensions © 2010 MicroStrategy, Inc.
The SQL generated for a report containing Distribution Center, Customer, and Freight is shown below, if the only join attribute is Distribution Center.
select a1.DIST_CENTER, a2.CUSTOMER,sum(a1.Freight)
from TABLE3 a1, TABLE4 a2where a1.DIST_CENTER = a2.DIST_CENTERgroup by a1.DIST_CENTER, a2.CUSTOMER
The SQL statement above is for an Access database. The SQL for your reports may vary depending on the type of DBMS you use.
As with table relations, you can specify the best fit as the join strategy so that the engine calculates the joins. In a best fit join, the set of join attributes must contain the entire key of the left-hand-side fact table (Table 3 in the example SQL above).
Forcing facts to relate to attributes: Using cross product joins
You can use a cross product join when a join does not exist and you need to force a fact to relate to an attribute by extending the fact. The cross product join is an extension that allows a single fact value to relate to all elements of an unrelated attribute. This method can produce incorrect data because data can be repeated and counted twice in some cases.
Cross products should only be used when no other way to extend the fact exists. When you specify a cross product join to relate a fact to an attribute, you are creating a Cartesian product of the lookup attribute. Since this method can be inefficient, MicroStrategy does not recommend using the cross product join.
For example, in the following schema, Distribution Center does not relate to Dollar Sales:
Distribution Center
Table 1
OrderCustomer
Table 2
Dollar Sales
Project Design Guide The Building Blocks of Business Data: Facts 6
© 2010 MicroStrategy, Inc. Modifying the levels at which facts are reported: Level extensions 207
To report Dollar Sales by Distribution Center, a cross product join must be used.
You can define this cross product join in the Level Extension Wizard in the Fact Editor. Open the Dollar Sales fact and extend it to the Distribution Center attribute. Next, select the Perform the extension through a cross product option. This option is set in the step immediately after To select the type of fact extension, page 202 of the procedure above. For this example, you do not need to specify an allocation expression.
Notice that no join attributes are specified. The MicroStrategy Engine always cross-joins the lookup tables of the attributes in the extension.
The SQL generated for a report containing Customer, Distribution Center, and Dollar Sales is:
select a1.DIST_CENTER, a2.CUSTOMER,sum(a2.DOLLAR_SALES)
from TABLE1 a1, TABLE2 a2group by a1.DIST_CENTER
The SQL statement above is for an Access database. The SQL for your reports may vary depending on the type of DBMS you use.
Lowering the level of fact data: Fact degradations
Degradation, which lowers a fact level, is the logical opposite of aggregation. To view fact data at a lower logical level than the fact is stored at, you must degrade the fact to a lower level. This scenario may occur because you stored a fact at a level that is used most commonly in reports. However, you must support those users who wish to view and analyze the same fact data at a lower logical level.
For example, the Human Resources Analysis Module includes a Planned Compensation fact that is stored at the Department level, and has a fact degradation to the Employee level (the attributes, facts, and metrics used in this example can all be found in this Analytics Module). The fact extension does not use an allocation expression to degrade Planned Compensation to

The Building Blocks of Business Data: Facts Project Design Guide6
208 Modifying the levels at which facts are reported: Level extensions © 2010 MicroStrategy, Inc.
the Employee level. This causes every employee to be listed with the same planned compensation value as the employee’s department, as shown below:
The analytical value of this fact degradation is not immediately recognizable. However, now that Planned Compensation is available at the Employee level, you can create more meaningful analysis with other fact data that is stored at the Employee level. For example, the Compensation Cost fact is stored at the Employee level. The metric Actual as % Planned Compensation has been created to calculate the actual compensation of an employee as a percentage of the planned compensation for the entire department of the employee. The metric definition is ([Compensation Cost]/[Planned Compensation]), which performs a division of metrics defined from the Compensation Cost and Planned Compensation facts, respectively. You can

Project Design Guide The Building Blocks of Business Data: Facts 6
© 2010 MicroStrategy, Inc. Modifying the levels at which facts are reported: Level extensions 209
now view what percentage of your planned compensation per department has been spent per employee, as shown below:
Without using a degradation of Planned Compensation to Employee, you could not include Department and Employee on a report with these metrics and return accurate values.
The following procedure steps through how to create the fact degradation that has been created for the Planned Compensation fact of the Human Resources Analysis Module. The procedure also describes general principles of creating fact degradations which you can use to create fact degradations for the facts in your project.
To define a fact degradation
1 In Desktop, log in to the Human Resources Analysis Module.
2 Browse to the Facts / Compensation / Planning folder and double-click the Planned Compensation fact to edit it. If a message is displayed asking if you want to use read only mode or edit mode, select Edit and click OK to open the Fact Editor in edit mode so that you can make changes to the fact. The Fact Editor opens.
Note the following:
– If you are only given the option of opening the Fact Editor in read only mode, this means another user is modifying the project’s schema. You cannot open the Fact Editor in edit mode until the other user is finished with their changes and the schema is unlocked.

The Building Blocks of Business Data: Facts Project Design Guide6
210 Modifying the levels at which facts are reported: Level extensions © 2010 MicroStrategy, Inc.
– For information on how you can use read only mode and edit mode for various schema editors, see Using read only or edit mode for schema editors, page 93.
3 Click the Extensions tab.
4 Select Degradation to Employee and click Modify. The Level Extension Wizard opens.
To create a new fact degradation you would click New. However, this example steps through how the Planned Compensation fact degradation Degradation to Employee was created.
5 Read the Welcome statement and click Next. The General Information page opens.
6 Enter a name and a description for your fact extension (already provided). Then select whether you want to:
• Lower the fact entry level: define a fact degradation
• Extend the fact entry level: define a fact extension on a table relation, dynamic fact relation, or a cross product join (see Defining a join on fact tables using table relations, page 200 and Defining a join on fact tables using fact relations, page 204)
• Disallow partially or completely the fact entry level: define a fact extension that does not allow a fact to be reported at a certain level (see Disallowing the reporting of a fact at a certain level, page 211)
For this example you are creating a fact degradation so select Lower the fact entry level, and click Next. The Extended Attributes page opens.
7 Select the attributes you want to degrade the fact to, allowing the fact to be reported at the new level. For this example Employee is already selected. Click Next. The Join Type page opens.
To extend the fact so that it can be reported at any level in a hierarchy, choose the lowest level attribute in that hierarchy.
8 Select what attribute(s) to perform the join. For this example, the Department attribute is already selected. Click Next. The Join Attributes Direction page opens.
9 You can choose to join using the attribute, or join using the attribute and its children. For this example, the join is performed on the Department attribute and its children. Click Next. The Allocation page opens.

Project Design Guide The Building Blocks of Business Data: Facts 6
© 2010 MicroStrategy, Inc. Modifying the levels at which facts are reported: Level extensions 211
10 Enter an allocation expression that calculates the fact at the new level. For this example, you do not need to include an allocation expression. See Fact degradations with allocation expressions, page 211 for an example of using an allocation expression for a fact degradation.
11 Click Finish to create the fact degradation.
Fact degradations with allocation expressions
Not all fact degradations can simply be lowered to a new level. Ordinarily, you must add an allocation expression, which allows the distribution of values according to a calculation you specify, to change the definition of the fact in a level extension.
This is similar in concept to choosing an aggregation function (Sum, Avg, and so on) when aggregating data to higher levels.
For example, if your fact is stored at the yearly level and you want to report the data at the monthly level, you can create a degradation on the fact to relate it to the monthly level. You select Month to be the attribute to which to degrade. You then specify that the allocation expression is fact/12.
By creating allocation expressions, you define how higher-level facts are degraded to lower-level attributes. Allocation expressions are defined by operations you set on attributes and facts in the Level Extension Wizard in the Fact Editor.
Fact degradations often produce data estimates rather than exact values for the fact data at lower logical levels. For example, consider the allocation expression fact/12 for a degradation from Year to Month. Using such an allocation expression would spread a year’s fact data evenly over the 12 months of that year. While it is possible that the fact data would be the same for every month of the year, this is often an unlikely scenario. Such fact degradations should be used only when fact data is not stored at a lower logical level and there is no way to directly relate the fact data to the lower logical level.
Disallowing the reporting of a fact at a certain level
The Disallow partially or completely the fact entry level setting within the Fact Editor is like a lock which prevents a fact from being reported at a specific level. The setting prevents unnecessary joins to lookup tables. The

The Building Blocks of Business Data: Facts Project Design Guide6
212 Modifying the levels at which facts are reported: Level extensions © 2010 MicroStrategy, Inc.
following examples describe instances in which disallowing a fact entry level can prove useful.
Disallowing a fact to be extended to a level lower than the fact’s entry level due to unnecessary complexity and the cost of analyzing fact data at such a level is a common use for this feature. If a fact is stored at a level that is counterproductive to a query, such as data that is stored at the Minute or Second level, you can disallow the lower levels. For example, if you have three years’ worth of data, querying at the Minute or Second level consumes too many resources and returns extensive data. With a disallow in place, if you create a report and attempt to include the fact at the Minute or Second level, an error is returned, indicating that the report cannot be run at that level.
Consider a schema containing three dimensions: Geography, Time, and Product. Suppose you create a fact called Sales at the Item level in the Product dimension and a metric called Sales as the sum of the Sales fact. When you create a report containing the Month attribute and the Sales metric, the Analytical Engine does a dynamic cross-join and evaluates the report. To explicitly disallow an extension of the Sales fact to the Time dimension, you would use the Disallow partially or completely the fact entry level setting and select the lowest attribute in the Time dimension such as Day. This option is set in the step immediately after To lower, extend, or disallow the fact entry level, page 202 of the procedure to create a fact extension above. After updating the schema and re-executing the report, the report fails because the disallow setting now prevents the cross-joins between the lookup tables and fact tables. This setting, however, does not affect normal joins.
In the previous example, for the Sales fact, assume you specify an extension to the Month attribute and also disallow extension to Year which is a parent of the extended attribute, Month. If you execute the report containing the Year attribute and Sales metric, the report runs successfully. In this case, the engine sorts the extension conditions specified in some order and calculates the report based on the sorted order of extensions. This is not an expected design condition, although the engine returns a valid SQL. It is advisable to avoid fact definitions that contain contradictory extension definitions.
The Disallow the fact entry level setting applies only to attributes that can be considered as extended attributes. For example, you create a report that contains the attributes Subcategory and Item and the Revenue metric, which is defined as sum of the Revenue fact. You now disallow an extension on the Revenue fact for the Item attribute and update the schema. If you re-execute the report, you can still see Revenue by Item. This implies that the fact extension has not been disallowed. This is because Revenue exists at the

Project Design Guide The Building Blocks of Business Data: Facts 6
© 2010 MicroStrategy, Inc. Modifying the levels at which facts are reported: Level extensions 213
same level as Item in the MicroStrategy Tutorial project. So you encounter only normal joins and no extensions. There must be a valid reason to disallow reporting a fact at a certain level. In this case, disallowing the Revenue fact at the level it is stored at in the data warehouse does not make logical sense.

The Building Blocks of Business Data: Facts Project Design Guide6
214 Modifying the levels at which facts are reported: Level extensions © 2010 MicroStrategy, Inc.

© 2010 MicroStrategy, Inc. 215
77.THE CONTEXT OF YOUR BUSINESS DATA: ATTRIBUTES
Introduction
Business data represented by facts can offer little insight without the presence of business concepts and context, which take the form of attributes in MicroStrategy. Attributes provide the business model with a context in which to report on and analyze facts. While knowing your company’s total sales is useful, knowing where and when the sales took place provides the kind of analytical depth users require on a daily basis.
For example, you have a report with the Month, Year, and Region attributes on the template, as well as a Revenue metric based on the Revenue fact. When executed, the report displays your company’s revenue at the region, month, and year levels. Because of the attributes on the report, a substantial amount of information is available, including which regions produced the least revenue and which years saw the highest growth in revenue. If you remove the attributes from the report, you can only find out how much revenue the company generated in total.

The Context of Your Business Data: Attributes Project Design Guide7
216 Overview of attributes © 2010 MicroStrategy, Inc.
Overview of attributesCreating attributes is an important step in the initial project design effort, which comes after creating facts when using the Project Creation Assistant. New user and application requirements make attribute creation and modification an important part of the entire project life cycle.
In the data warehouse, attributes are normally identified by a unique ID column in a lookup table. In MicroStrategy reports, attributes are identified by the column headers of the reports.
A report designer creates a report in part by determining these report column headers. Intelligence Server, using this report definition, instructs the engine how to build the SQL for that report. The expressions of attributes and facts in the report define the SELECT clause of the SQL command.
For example, consider the following:
Select Store_ID, Date, sum(Sales)From Store_FactGroup By Store_ID, Date

Project Design Guide The Context of Your Business Data: Attributes 7
© 2010 MicroStrategy, Inc. Overview of attributes 217
In the SQL above, sales information will be retrieved by store and date. The attributes and metrics in the report tell Intelligence Server where to look in the data warehouse for the information and how to create the SQL that will retrieve it. Because of this process, report analyzers do not have to know SQL to extract information from a data warehouse.
The lowest level attribute you include in a report, such as Day, is the lowest level of detail reported. A high-level report, such as a report at the Year level, includes the Year attribute but lacks the detail of a similar report which includes the lower level attributes Month and Week. It is important to understand the data is still the same, it is just not aggregated.
A discussion about metrics, filters, and reports is beyond the scope of this guide and is covered in the MicroStrategy Advanced Reporting Guide.
Attributes are defined by these properties:
• Attribute form: contains an identifier or descriptor of an attribute. Attributes can have multiple attribute forms. For example, for the Customer attribute, Customer Email, Customer First Name, and Customer Last Name are examples of attribute forms. See Column data descriptions and identifiers: Attribute forms, page 236.
• Attribute expression: maps a MicroStrategy attribute form to one or more columns in the warehouse. See Attribute form expressions, page 240.
• Attribute relationship: allows interaction of data at different conceptual levels and shows how data is related within a project. See Attribute relationships, page 252.

The Context of Your Business Data: Attributes Project Design Guide7
218 Creating attributes © 2010 MicroStrategy, Inc.
The following diagram illustrates how the attribute properties listed above are related:
While creating attributes is a major step in the initial creation of a project, it is often necessary to modify and create attributes throughout the life cycle of a project. The procedures to perform these tasks are discussed in the first section (Creating attributes, page 218) of this chapter. The later sections discuss conceptual information on attributes, as well as highlight some advanced attribute design techniques and procedures.
Creating attributesAn attribute is primarily used to group and aggregate fact data to add business context to the fact data. The ability to report on and analyze data requires data to have a business context; therefore, creating attributes is a major step in any project design effort.

Project Design Guide The Context of Your Business Data: Attributes 7
© 2010 MicroStrategy, Inc. Creating attributes 219
This section provides steps to create attributes at different phases of the project design process, using different techniques and MicroStrategy interfaces:
• Simultaneously creating multiple attributes, page 219: Provides steps to create multiple attributes as part of the initial project design effort or later in a project’s life cycle with the Attribute Creation Wizard.
• Adding and modifying attributes, page 224: Provides steps to add and modify attributes for an existing project. This includes adding advanced features such as attribute forms to attributes that already exist or adding new attributes as your project evolves.
You can also create and modify attributes at any phase of the project design process using Architect. For information on creating and modifying attributes using Architect, see Adding and modifying simple and advanced attributes using Architect, page 229.
Simultaneously creating multiple attributes
During your initial project design effort or later in a project’s life cycle, you can create multiple attributes using the Attribute Creation Wizard.
You can also create multiple attributes using Architect, which is described in Chapter 7, Adding and modifying simple and advanced attributes using Architect.
To create attributes using the Attribute Creation Wizard
This procedure is part of an initial project creation effort using the Project Creation Assistant, which launches the Attribute Creation Wizard to complete the attribute creation tasks. For steps to access the Project Creation Wizard, see To create a new project using the Project Creation Assistant,

The Context of Your Business Data: Attributes Project Design Guide7
220 Creating attributes © 2010 MicroStrategy, Inc.
page 83. You can also access the Attribute Creation Wizard at any time in the development of a project from the Schema menu in MicroStrategy Desktop.
1 In the Project Creation Assistant, click Create attributes. The Attribute Creation Wizard opens, as shown below.
2 Review the introduction page that is displayed.
Define attribute creation rules
These rules can make the process of choosing attribute columns and naming your attributes considerably easier, especially if you use consistent naming conventions and data types in your data warehouse. The Attribute Creation Wizard uses these rules below to help automate the attribute creation process. Change these rules if the naming or data type conventions in your warehouse do not conform to these defaults.
3 Click Define Rules to set some basic attribute creation rules. The Attribute Creation Rules page opens.
4 The Column data type area allows you to select the column data types to be available as possible attribute ID columns. Select the check boxes for the data types that should be included when the wizard searches the data warehouse for available attribute ID columns.
5 The Attribute name area allows you to determine how to create default attribute names. You can select the appropriate check boxes to set the following default behaviors for creating attribute names:
• Replace underscores in the attribute name with spaces
• Remove the word “ID” from the name

Project Design Guide The Context of Your Business Data: Attributes 7
© 2010 MicroStrategy, Inc. Creating attributes 221
• Capitalize the first letter
6 The Warehouse search area determines naming conventions to help locate your warehouse objects. The defaults are ID for identifier columns, DESC for description columns, and LOOKUP for lookup tables.
7 Click OK to accept your rule changes and return to the Attribute Creation Wizard.
ID column selection
An ID column is a column or group of columns that uniquely identifies each element of an attribute.
8 Click Next. The ID Column Selection page opens.
When choosing the ID column for an attribute, make sure that all values in the column are unique and that it does not contain NULL values. You should never use a column that has NULL or repeated values as the ID column for an attribute. Doing so results in unexpected behavior and errors.
Only those columns with data types that match those chosen in the rules you defined above appear on the ID Selection page. The columns that match the identifier naming convention that you set in the warehouse search rule above are automatically highlighted.
9 From the Available columns pane, select the columns to use for your attribute IDs and click > to add them to your project. Click >> to add all the listed columns.
Note the following:
– You can rename any attribute name to make it more user-friendly by right-clicking the attribute and selecting Rename.
– To remove attribute ID columns from your project, select the attribute IDs in the Attributes pane and click < to move them to the Available columns pane.
– The Attribute Creation Wizard cannot handle columns that hold the same information but have different column names (that is, heterogeneous columns). For more information about mapping attributes to heterogeneous columns, see Joining dissimilar column names: Heterogeneous mappings, page 245.

The Context of Your Business Data: Attributes Project Design Guide7
222 Creating attributes © 2010 MicroStrategy, Inc.
Create compound attributes
A compound attribute is defined as an attribute with more than one column specified as the ID column. This implies that more than one ID column is needed to uniquely identify the elements of that attribute (see Attributes with multiple ID columns: Compound attributes, page 274).
10 To create a compound attribute, complete the following steps:
• Click Compound Attributes and then click Add. The New Compound Attribute dialog box opens.
• Type a name for the attribute.
• Select the columns that are required to uniquely identify the compound attribute and click OK. You are returned to the Attribute Creation Wizard.
Description column selection
Description columns provide the data which gives context and meaning to your attributes.
11 After adding all your attribute ID columns, click Next. The Description Column Selection page opens.
12 Select whether to use the ID or a different column for the description of the attribute. The column that meets the description naming convention that you set in the warehouse search rule is automatically selected.
Note the following:
– In general, you should use the default description column for each attribute. In some cases, however, it may make sense to use the ID column as the description column, such as Year.
– Other attribute forms need to be created through the Attribute Editor after you complete steps in the Project Creation Assistant. Refer to Adding attributes with the Attribute Editor, page 226, for more information about attribute forms.
Lookup table selection
Lookup tables are the physical representation of attributes; they provide the information for an attribute through data stored in their ID and description columns.
13 Click Next when you are finished selecting description columns for attributes. The Lookup Table Selection page opens.

Project Design Guide The Context of Your Business Data: Attributes 7
© 2010 MicroStrategy, Inc. Creating attributes 223
14 Select the lookup table for each attribute.
The table that follows the lookup naming convention that you set in the warehouse search rule is automatically selected. In general, you should choose the default lookup table for each attribute.
15 Click Next:
• If you have created compound attributes, the Compound Attribute Definition page opens. Specify the lookup table and description column for the compound attributes and click Next. The Relationship Definition page opens.
• If you have not created a compound attribute, the Relationship Definition page opens.
Relationship definition
For each attribute, you specify the children and the type of relationship: one-to-one, one-to-many, or many-to-many. When you design a logical data model for your project (see Chapter 2, The Logical Data Model), the relationships between attributes should become apparent. Related attributes such as City, State, or Region are often grouped in a common hierarchy, like Location. In a logical data model, when attributes are in the same hierarchy they must be related to each other, whereas attributes in different hierarchies cannot be related.
16 For each attribute, define child attributes:
• In the Attributes pane, select an attribute and click Add. The Select Children Attributes dialog box opens.
• Select the child attributes from the list of available child attributes and click OK. You are returned to the Attribute Creation Wizard.
• In the Children of: attribute name pane, select the relationship type for the attribute to its child attribute. For more information on the different attribute relationship types, see Attribute relationships, page 252.
17 When you have defined children for all the attributes that need them, click Next. The Finish page opens.
18 Review the summary information in the Finish page and click Finish to create the attributes.

The Context of Your Business Data: Attributes Project Design Guide7
224 Creating attributes © 2010 MicroStrategy, Inc.
After you have completed the steps of the Attribute Creation Wizard, the attributes are created. This completes the initial creation of a project with the Project Creation Assistant.
Adding and modifying attributes
Just as you can add more facts to your project once you have created it, you can also create and add attributes as they become necessary. As a company evolves, so does its reporting requirements; these requirements can lead to changes to the data warehouse as well as to the schema within its MicroStrategy projects.
For example, a health care company, with offices only in the United States, decides to extend its operations into Europe and Asia. Before the shift overseas, the company does not include lookup tables with information about different countries in its data warehouse.
However, when the company opens its offices in Europe and Asia, it must add lookup tables that contain data about its new offices to its warehouse. It must then add these tables to its MicroStrategy project, and create the appropriate attributes so report users can analyze business data for their appropriate country.
You can create attributes with either the Attribute Creation Wizard, which you use to create the first attributes for your project, or the Attribute Editor, which allows you to define attributes, attribute forms, and attribute form expressions.
• The Attribute Creation Wizard allows you to:
Create simple attributes
Create multiple attributes quickly
Add a large number of attributes during project creation
The Attribute Creation Wizard works well for building a large number of attributes initially, but you cannot use it to modify existing attributes or to define more advanced attributes. In general, you only use the Attribute Creation Wizard as part of the initial project creation to create most of the attributes for the project. For steps to use the Attribute Creation Wizard, see Simultaneously creating multiple attributes, page 219 and Adding attributes with the Attribute Creation Wizard, page 225.
• The Attribute Editor allows you to:

Project Design Guide The Context of Your Business Data: Attributes 7
© 2010 MicroStrategy, Inc. Creating attributes 225
Create simple and advanced attributes
Edit existing attributes and configure additional schema-level settings
You can use the Attribute Editor to edit existing attributes and create additional attribute forms, map heterogeneous column names, define advanced expressions, configure additional settings, and so on. The Attribute Editor allows you to modify one attribute at a time, which can be helpful when only a few facts in a project need to be modified. For steps to use the Attribute Editor, see Adding attributes with the Attribute Editor, page 226 and Modifying attributes, page 228.
• Architect allows you to:
Create simple attributes
Create multiple attributes quickly
Add a large number of attributes during project creation
Create simple and advanced attributes
Edit existing attributes and configure additional schema-level settings
With Architect, you can support all of the simple and advanced attribute features that are available in the Attribute Editor. Rather than focusing on one attribute at a time with the Attribute Editor, you can use Architect to create and modify multiple attributes for a project at once. For information on how to use Architect, see Adding and modifying simple and advanced attributes using Architect, page 229.
Adding attributes with the Attribute Creation Wizard
Although the Attribute Creation Wizard is primarily used to create most of a project’s attributes during initial project creation, you may still find it useful if you need to create multiple attributes from remaining lookup columns in your warehouse.
Follow the steps below to use the Attribute Creation Wizard to create simple attributes in bulk.

The Context of Your Business Data: Attributes Project Design Guide7
226 Creating attributes © 2010 MicroStrategy, Inc.
To create simple attributes in bulk using the Attribute Creation Wizard
1 In MicroStrategy Desktop, log in to the project source that contains your project and expand your project.
You must use a login that has Architect privileges. See the Permissions and Privileges appendix of the MicroStrategy System Administration Guide for more information.
2 From the Folder List, select the project to which to add new attributes.
3 From the Schema menu, choose Attribute Creation Wizard. The Attribute Creation Wizard opens.
4 To create attributes with the Attribute Creation Wizard, follow the steps outlined in Simultaneously creating multiple attributes, page 219.
Adding attributes with the Attribute Editor
The Attribute Editor is used to add advanced features such as attribute forms to attributes that already exist. You can also use it to add new attributes to your project.
To create an attribute using the Attribute Editor
1 In MicroStrategy Desktop, log in to the project source that contains your project and expand your project.
2 From the File menu, select New, and then Attribute. The Attribute Editor opens, with the Create New Form Expression dialog box displayed on top of it.
3 From the Source table drop-down list, select a table which contains the columns of data for the attribute. Its columns are listed in the Available Columns pane.
4 Create a form expression for the ID form of the new attribute being created.
• To create a simple attribute form expression (Attribute form expressions, page 240), drag a column from the Available columns pane to the Form expression pane.

Project Design Guide The Context of Your Business Data: Attributes 7
© 2010 MicroStrategy, Inc. Creating attributes 227
• To create a more advanced attribute form expression, use a combination of any of the following techniques:
– Enter constants in double quotes.
– Click f(x) in the Form expression toolbar to create a function using the Insert Function Wizard.
– Click any operator in the Form expression toolbar to insert it into the expression.
5 Click Validate to ensure that your expression is valid.
6 Under Mapping method, select Automatic or Manual:
• Automatic mapping means that all of the tables in the project with the columns used in the attribute form expression are selected as possible source tables for the attribute form. You can then clear any tables mapped automatically or select other tables.
• Manual mapping means that all of the tables in the project with the columns used in the attribute form expression are located but are not selected as possible source tables for the attribute form. You can then select which of those tables are used as source tables for the attribute form.
Note the following:
– The mapping method defaults to Automatic for the first attribute or attribute form expression you create. The system maps the expression to each of the source tables. For subsequent attributes, the default is Manual.
– An expression that uses only a constant value cannot use the automatic mapping method.
To use an attribute for meaningful analysis, you must verify that it includes a column from a fact table in its definition, or is related to an attribute that does. For example, to use the Month attribute for analysis, you must create a relationship to the Day attribute, which must include the DAY column from the fact table in its definition. To create relationships between attributes, see Attribute relationships, page 252.
7 Click OK. The Create New Attribute Form dialog box opens, from which you can create attribute forms for the attribute (Column data descriptions and identifiers: Attribute forms, page 236).

The Context of Your Business Data: Attributes Project Design Guide7
228 Creating attributes © 2010 MicroStrategy, Inc.
8 From the Source tables pane, select a table and click Set as Lookup to set the lookup table for the attribute. A lookup table acts as the main table which holds the information for an attribute. If you chose manual mapping, select the check boxes of the tables to map to the attribute form.
9 In the Form general information area, type a name and description in the associated fields for the attribute form.
10 In the Category used drop-down list, do one of the following:
• Select a form category from the drop-down list. For a description of form categories, see Displaying forms: Attribute form properties, page 238.
• Click Modify to create a new form category.
Using a column with a non-numeric data type as an ID column of an attribute can result in SQL generation issues. Therefore, if you select a column with a non-numeric data type and set it as an ID column, a warning message appears by default when you click OK in the Create New Attribute Form dialog box.
11 In the Form format area, select a display type and a default sorting option from the associated drop-down lists.
Custom groups are sorted by the Default sort of the form that appears first in the Report display forms. For more information on custom groups, refer to the MicroStrategy Advanced Reporting Guide.
12 Click OK. The Attribute Editor opens.
13 From the File menu, select Save As. The Save dialog box opens.
14 Navigate to the folder in which to save the attribute. Enter a name for the derived fact. Click Save.
15 From the Schema menu, select Update Schema to update the project schema. This ensures that your project is updated to recognize the new attribute definition.
Modifying attributes
After creating an attribute, you can modify the attribute at any time using the Attribute Editor. You cannot use the Attribute Creation Wizard to modify attributes.

Project Design Guide The Context of Your Business Data: Attributes 7
© 2010 MicroStrategy, Inc. Creating attributes 229
To modify an existing attribute
1 In MicroStrategy Desktop, open the folder that contains the attribute to modify.
2 Double-click the attribute to edit. If a message is displayed asking if you want to use read only mode or edit mode, select Edit and click OK to open the Attribute Editor in edit mode so that you can make changes to the attribute. The Attribute Editor opens.
Note the following:
– If you are only given the option of opening the Attribute Editor in read only mode, this means another user is modifying the project’s schema. You cannot open the Attribute Editor in edit mode until the other user is finished with their changes and the schema is unlocked.
– For information on how you can use read only mode and edit mode for various schema editors, see Using read only or edit mode for schema editors, page 93.
You can then modify all the options available when creating and attribute in the Attribute Editor, which is described in the previous procedure To create an attribute using the Attribute Editor, page 226.
You can learn how to create more advanced attributes in the various sections in this chapter.
Adding and modifying simple and advanced attributes using Architect
Architect can be used to create and modify simple and advanced attributes in a visually integrated environment. Architect allows you to view the tables, attributes, attribute relationships, facts, user hierarchies, and other project objects together as you design your project.
With Architect, you can support all of the simple and advanced attribute features that are available in the Attribute Editor. Rather than focusing on one attribute at a time with the Attribute Editor, you can use Architect to create and modify multiple attributes for a project at one time. Review the

The Context of Your Business Data: Attributes Project Design Guide7
230 Unique sets of attribute information: Attribute elements © 2010 MicroStrategy, Inc.
chapters and sections listed below for information on Architect and steps to create and modify attributes using Architect:
• Chapter 5, Creating a Project Using Architect
• Creating and modifying projects, page 100
• Creating and modifying attributes, page 144
Unique sets of attribute information: Attribute elements
Attribute elements are the unique sets of information or values of an attribute. For example, in the following diagram, Customer is the attribute and New York NY, Baltimore BA, and Boston BN are elements of the attribute City:
The following example displays the physical warehouse table that stores elements and data for the Customer attribute. Each attribute element is a row in an attribute lookup table in your data warehouse, as shown below:
The Customer attribute is a good example to understand the components of an attribute and the concept of an attribute element. With the Customer

Project Design Guide The Context of Your Business Data: Attributes 7
© 2010 MicroStrategy, Inc. Unique sets of attribute information: Attribute elements 231
attribute, each attribute element is an individual customer. Each customer (attribute element) has its own set of information such as last name, first name, email address, and so on which are defined by the attribute forms (see Column data descriptions and identifiers: Attribute forms, page 236).
As shown above, an attribute element is a unique set of information defined by the attribute forms of an attribute. Attribute elements are identified by their browse forms, which should be forms that provide a general description of the attribute element. For example, in the image above, the First Name and Last Name forms are used to identify the attribute elements. Just as you would not refer to a customer by his or her street address, you would not want to use the Address form to identify the Customer attribute elements. For more information on selecting the attribute forms used to identify attribute elements, see Using attributes to browse and report on data, page 277.
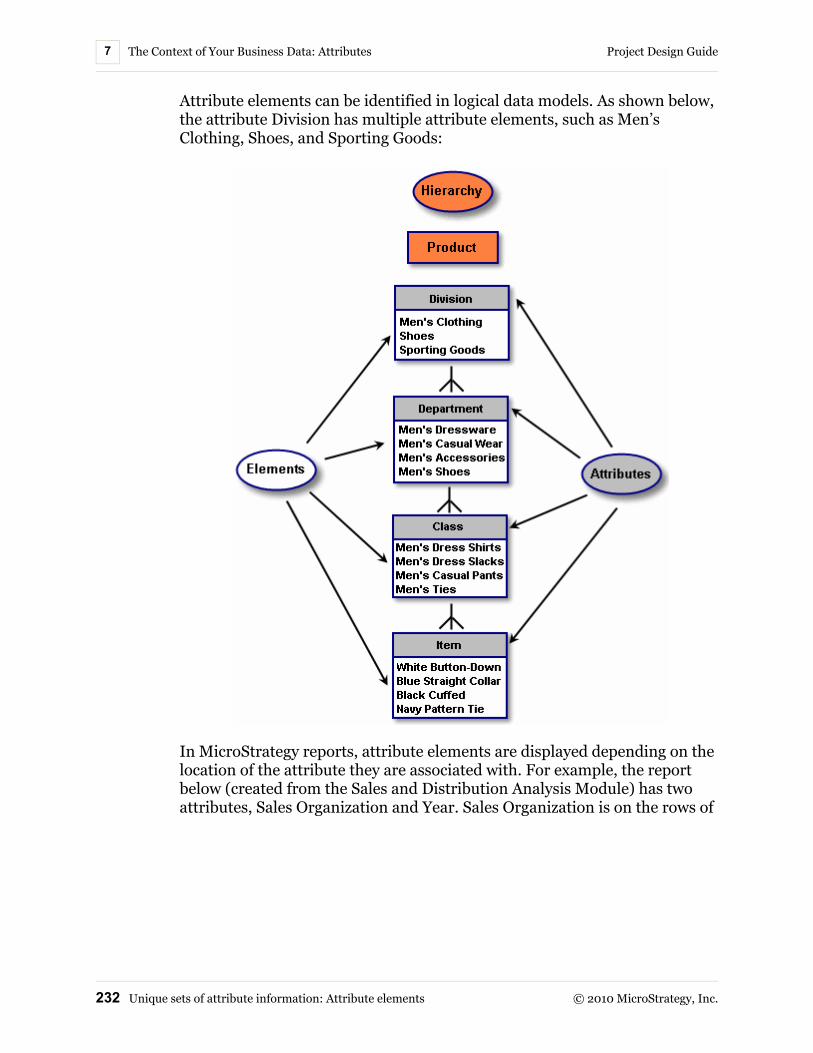
The Context of Your Business Data: Attributes Project Design Guide7
232 Unique sets of attribute information: Attribute elements © 2010 MicroStrategy, Inc.
Attribute elements can be identified in logical data models. As shown below, the attribute Division has multiple attribute elements, such as Men’s Clothing, Shoes, and Sporting Goods:
In MicroStrategy reports, attribute elements are displayed depending on the location of the attribute they are associated with. For example, the report below (created from the Sales and Distribution Analysis Module) has two attributes, Sales Organization and Year. Sales Organization is on the rows of

Project Design Guide The Context of Your Business Data: Attributes 7
© 2010 MicroStrategy, Inc. Unique sets of attribute information: Attribute elements 233
the report along with its attribute elements such as USA Central. Year is on the columns of the report along with its attribute elements such as 2005.
The display of attributes and their attribute elements is also affected by the location of the metrics on the report. The report above uses the common practice of putting the metrics (Sales Orders Quantity (Base Units) and Cost Sales Orders) on the columns of the report.
Supporting data internationalization for attribute elements
MicroStrategy supports the internationalization of your data into the languages required for your users. This allows attribute element data to be displayed in various languages that can reflect the user’s language preferences.
For example, consider the simple report below which displays profits for each month of the year.
This is the data that is shown to a user running the report with their regional settings defined as English. By supporting internationalized data, the same

The Context of Your Business Data: Attributes Project Design Guide7
234 Unique sets of attribute information: Attribute elements © 2010 MicroStrategy, Inc.
report can return the data shown below to a user with their regional settings defined as German.
The attribute element data is displayed in the German language. For example, the January, February, and March attribute elements are displayed as Januar, Februar, and März.
Data internationalization provides data from you data source translated in various languages for the attribute element data. To provide internationalized attribute names (such as Month of Year and Monat im Jahr in the reports above), descriptions, and other translated object information, you must use and configure metadata internationalization. For information on configuring metadata internationalization, see the System Administration Guide.
Each attribute form can enable or disable the internationalization of its attribute element data. The procedure described below provides the steps to enable or disable internationalization for attribute forms.
You can also use Architect to enable or disable the internationalization of attribute element data, as described in Supporting data internationalization for attribute elements, page 165.
Prerequisites
• The translated data has been stored in your data source, as described in Supporting data internationalization, page 57.
• The project has been enabled for data internationalization, as described in Enabling data internationalization for a project, page 89.
• An attribute has been created.

Project Design Guide The Context of Your Business Data: Attributes 7
© 2010 MicroStrategy, Inc. Unique sets of attribute information: Attribute elements 235
To enable or disable data internationalization for attribute forms
1 In Desktop, log in to a project.
2 Navigate to the Schema Objects folder, open the Attributes folder, and then open a folder that contains attributes to enable or disable data internationalization for.
3 Right-click an attribute and select Edit. If a message is displayed asking if you want to use read only mode or edit mode, select Edit and click OK to open the Attribute Editor in edit mode so that you can make changes to the attribute. The Attribute Editor opens.
Note the following:
– If you are only given the option of opening the Attribute Editor in read only mode, this means another user is modifying the project’s schema. You cannot open the Attribute Editor in edit mode until the other user is finished with their changes and the schema is unlocked.
– For information on how you can use read only mode and edit mode for various schema editors, see Using read only or edit mode for schema editors, page 93.
4 In the Attribute forms pane, select an attribute form and click Modify. The Modify Attribute Form dialog box opens.
5 Select the Support multiple languages check box to enable data internationalization for the attribute form. You can clear the check box to disable internationalization for the attribute form.
The ID form of an attribute does not have this option as these forms are used strictly for identification purposes.
6 Click OK to return to the Attribute Editor.
7 Click Save and Close to save your changes and return to Desktop.

The Context of Your Business Data: Attributes Project Design Guide7
236 Column data descriptions and identifiers: Attribute forms © 2010 MicroStrategy, Inc.
Column data descriptions and identifiers: Attribute forms
Attribute forms are identifiers or descriptors of an attribute, as explained in Logical data modeling conventions, page 30.
Every attribute must have at least one form, and most have at least two:
• The ID form (required)
• A description form
Every attribute must have an ID form (identity form). ID forms serve to uniquely identify each attribute element from other elements for the same attribute. For example, the Customer attribute’s ID form is Customer_ID, which is a column of unique numeric values to identify each customer. To differentiate between two customers such as John Smith and Fred Black, each customer must have a different value for their identity column. In this case John Smith can have a value of 1 in the Customer_ID column and Fred Black can have a value of 2 in the Customer_ID column.
Attributes also have description forms. The Customer attribute in the MicroStrategy Tutorial has various forms, including the Customer Name and the Address forms. These types of forms give context and information about the Customer attribute.

Project Design Guide The Context of Your Business Data: Attributes 7
© 2010 MicroStrategy, Inc. Column data descriptions and identifiers: Attribute forms 237
Some attributes can have additional descriptive forms that do not serve as the primary description form. For the Customer attribute, Email is included as an additional descriptive form, as shown in the following diagram:
In the data warehouse, a lookup table with three columns holds the following separate forms, described below:
• Customer_ID: a unique, identifying number for each customer (ID form)
• Customer_Full_Name: the full name of each customer (Description form)
• EMAIL: the email address for the specific customer (Additional description form)
In this example, the LU_CUSTOMER table records all of the attribute form data for the Customer attribute.
Attributes must contain at least one ID form, which uniquely identifies the attribute. The forms you create must have a reference to a lookup table and can include multiple expressions. Each table must have an ID form; the ID

The Context of Your Business Data: Attributes Project Design Guide7
238 Column data descriptions and identifiers: Attribute forms © 2010 MicroStrategy, Inc.
forms are used to join tables. When creating an attribute form, you can choose a lookup table in the Attribute Editor from a list of tables existing in the project. In the warehouse, two columns with different names can represent the same information about an attribute. In such cases, you must map the appropriate columns to the same attribute to retrieve accurate and complete results when using an attribute on a report. Heterogeneous column names are discussed in Joining dissimilar column names: Heterogeneous mappings, page 245.
For example, two tables exist, one with the forms Customer_ID, Name, and SSN. The second lookup table contains Customer _ID and Email. The attribute will have the Customer_ID, Name, SSN, and Email forms and the tables will join together through the ID columns because that is the column they have in common.
Displaying forms: Attribute form properties
Attribute form properties are settings that affect the display of the forms. You must select properties for each form when you create forms in the Attribute Editor or Architect in MicroStrategy Desktop. In the Attribute Editor, these properties are available when creating a new attribute form, or by modifying an attribute form. In Architect, these properties can be modified using the Properties pane, as described in Modifying attributes with the Properties pane.
Attribute form properties include the following:
• Categories help group the types of forms. The standard category options are ID, Desc, and None. You can create new form categories in the Attribute Editor.
When you have attributes that require multiple description forms, it is a good practice to map the most commonly used or most important description form to the Desc form of the attribute. Each attribute can have only one Desc form; the other description forms must be mapped to None forms. While there is no difference in how a Desc attribute form and None attribute form are used in MicroStrategy, mapping the most commonly used or most important description form can be helpful for project designers to quickly distinguish this attribute form from the other secondary forms.
• Format types control how the form is displayed and how filters are defined. For example, specifying a format type of Big Decimal allows users to preserve precision when qualifying on a form with more than 15 digits. Big Decimal is discussed in detail in Appendix C, Data Types.
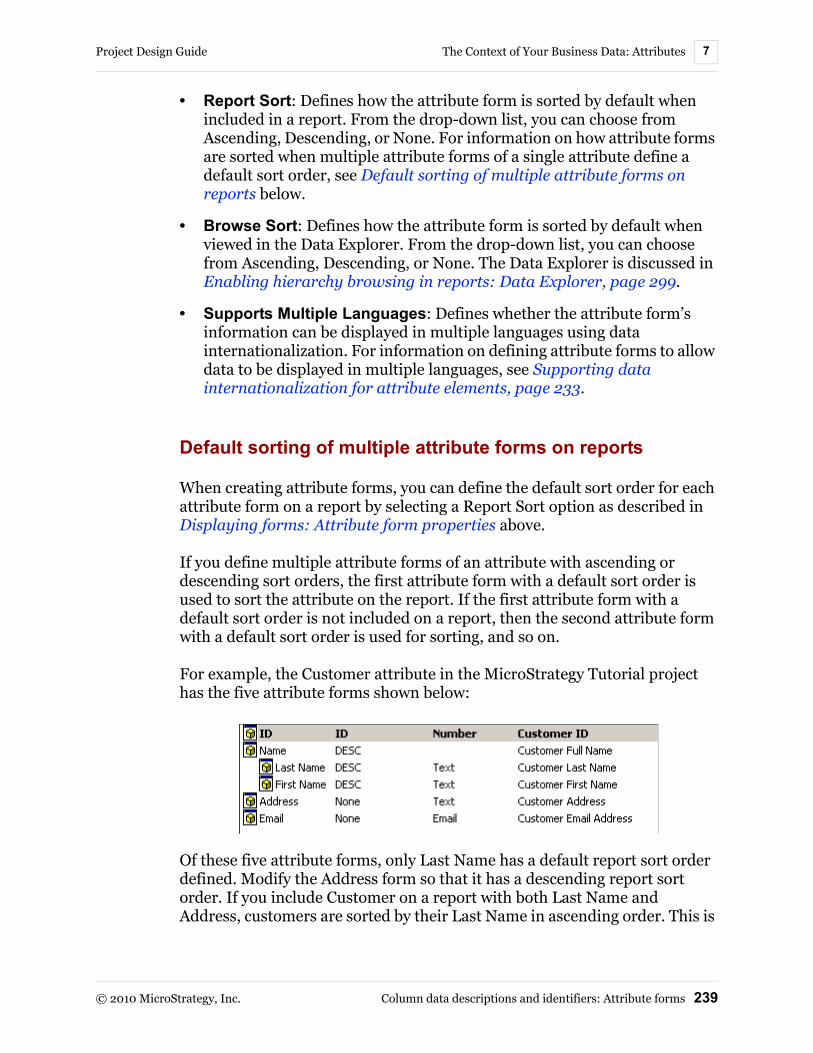
Project Design Guide The Context of Your Business Data: Attributes 7
© 2010 MicroStrategy, Inc. Column data descriptions and identifiers: Attribute forms 239
• Report Sort: Defines how the attribute form is sorted by default when included in a report. From the drop-down list, you can choose from Ascending, Descending, or None. For information on how attribute forms are sorted when multiple attribute forms of a single attribute define a default sort order, see Default sorting of multiple attribute forms on reports below.
• Browse Sort: Defines how the attribute form is sorted by default when viewed in the Data Explorer. From the drop-down list, you can choose from Ascending, Descending, or None. The Data Explorer is discussed in Enabling hierarchy browsing in reports: Data Explorer, page 299.
• Supports Multiple Languages: Defines whether the attribute form’s information can be displayed in multiple languages using data internationalization. For information on defining attribute forms to allow data to be displayed in multiple languages, see Supporting data internationalization for attribute elements, page 233.
Default sorting of multiple attribute forms on reports
When creating attribute forms, you can define the default sort order for each attribute form on a report by selecting a Report Sort option as described in Displaying forms: Attribute form properties above.
If you define multiple attribute forms of an attribute with ascending or descending sort orders, the first attribute form with a default sort order is used to sort the attribute on the report. If the first attribute form with a default sort order is not included on a report, then the second attribute form with a default sort order is used for sorting, and so on.
For example, the Customer attribute in the MicroStrategy Tutorial project has the five attribute forms shown below:
Of these five attribute forms, only Last Name has a default report sort order defined. Modify the Address form so that it has a descending report sort order. If you include Customer on a report with both Last Name and Address, customers are sorted by their Last Name in ascending order. This is
The Context of Your Business Data: Attributes Project Design Guide7
240 Column data descriptions and identifiers: Attribute forms © 2010 MicroStrategy, Inc.
because Last Name was created first and therefore is considered for sorting before the Address form. If you remove the Last Name form from the report, customers are sorted by their address in descending order.
This is the default functionality for how attributes are sorted by their attribute forms on reports. It is important to note that you can change how attribute forms are sorted from within a report. In a report you can use advanced sorting to define how attribute forms, metrics, and other report objects are sorted. Sorting defined for a report takes precedence over default sorting defined for attribute forms. For more information on advanced sorting, refer to the MicroStrategy Advanced Reporting Guide.
Attribute form expressions
Attributes act like holders of information and provide context for fact data. For example, the Customer attribute holds information about the customer such as Name and Address. These information units are called attribute forms. An attribute form expression defines what columns in the warehouse are used to represent the attribute form in SQL. Each attribute form must have at least one expression.
For example, the form expression for the Customer First Name attribute form is CUST_FIRST_NAME. The form expression for the Customer Last Name attribute form is CUST_LAST_NAME. In this instance, the CUST_FIRST_NAME and CUST_LAST_NAME columns in the warehouse provide information about first and last names respectively.
Although you can have multiple expressions in different tables, a form cannot have two different expressions in the same source table.
You can create expressions using attribute columns, constants, and/or mathematical operators, for example, +, -, /, *. Only implicit attributes do not include a column in the expression, since they only use the constants you declare.
You can also create a form expression using Apply functions. These functions are discussed in the Pass-through Expressions appendix in the MicroStrategy Advanced Reporting Guide.
The types of attribute form expressions are:
• Simple expressions, page 241: Simple form expressions access data through columns in the data warehouse.

Project Design Guide The Context of Your Business Data: Attributes 7
© 2010 MicroStrategy, Inc. Column data descriptions and identifiers: Attribute forms 241
• Derived expressions, page 243: Derived form expressions perform some type of mathematical calculation on columns in the data warehouse to create an attribute form.
• Joining dissimilar column names: Heterogeneous mappings, page 245: Heterogeneous mappings allow you to use columns with different names in the data warehouse as the same attribute form.
• Implicit expressions, page 248: Implicit form expressions do not relate directly to data stored in the data warehouse. These form expressions create virtual data by combining or using columns to generate the data.
Simple expressions
A simple expression is based on a single warehouse column. The definition of the simple expression includes the tables in which the column is found.
For example, Category is an attribute in the MicroStrategy Tutorial. It has two forms, ID and Description, both of which are defined by simple expressions. The expression for the ID form is the CATEGORY_ID column and the expression for the description form is the CATEGORY_DESC column. Both of these columns reside in the table LU_CATEGORY.
Example: creating an attribute form with a simple expression
A retailer begins a promotion that offers customers 25% off of their purchases if they fill out a feedback survey on the company website. The retailer intends to analyze the data gathered from the surveys to better market their products in the future.
The retailer’s customers provide a variety of information on the surveys, including their dates of birth. Once gathered, the date of birth data eventually becomes part of the retailer’s data warehouse and the appropriate lookup table is added to the retailer’s project in MicroStrategy.
At this point, the project designer must add the column containing the customer dates of birth as an additional attribute form of the Customer attribute. This will enable report designers to display each customer’s date of birth alongside each customer’s name on reports.
Follow the procedure below to create Customer Birth Date as an attribute form in the Customer attribute.
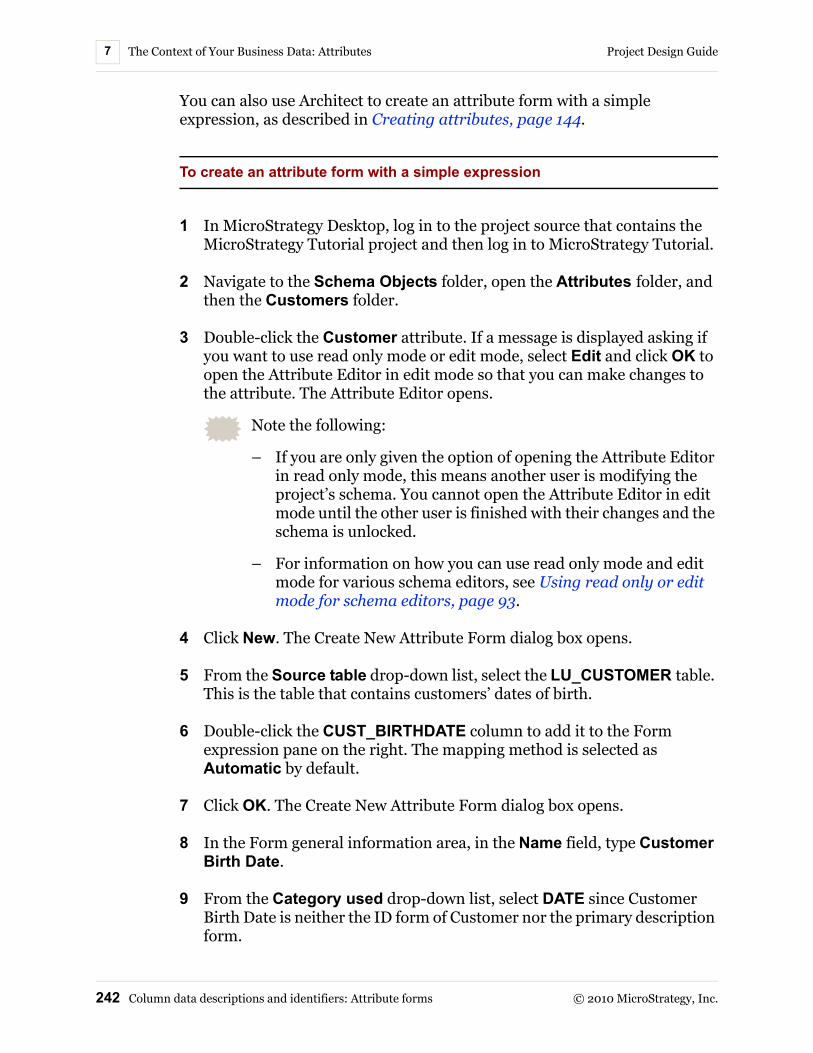
The Context of Your Business Data: Attributes Project Design Guide7
242 Column data descriptions and identifiers: Attribute forms © 2010 MicroStrategy, Inc.
You can also use Architect to create an attribute form with a simple expression, as described in Creating attributes, page 144.
To create an attribute form with a simple expression
1 In MicroStrategy Desktop, log in to the project source that contains the MicroStrategy Tutorial project and then log in to MicroStrategy Tutorial.
2 Navigate to the Schema Objects folder, open the Attributes folder, and then the Customers folder.
3 Double-click the Customer attribute. If a message is displayed asking if you want to use read only mode or edit mode, select Edit and click OK to open the Attribute Editor in edit mode so that you can make changes to the attribute. The Attribute Editor opens.
Note the following:
– If you are only given the option of opening the Attribute Editor in read only mode, this means another user is modifying the project’s schema. You cannot open the Attribute Editor in edit mode until the other user is finished with their changes and the schema is unlocked.
– For information on how you can use read only mode and edit mode for various schema editors, see Using read only or edit mode for schema editors, page 93.
4 Click New. The Create New Attribute Form dialog box opens.
5 From the Source table drop-down list, select the LU_CUSTOMER table. This is the table that contains customers’ dates of birth.
6 Double-click the CUST_BIRTHDATE column to add it to the Form expression pane on the right. The mapping method is selected as Automatic by default.
7 Click OK. The Create New Attribute Form dialog box opens.
8 In the Form general information area, in the Name field, type Customer Birth Date.
9 From the Category used drop-down list, select DATE since Customer Birth Date is neither the ID form of Customer nor the primary description form.

Project Design Guide The Context of Your Business Data: Attributes 7
© 2010 MicroStrategy, Inc. Column data descriptions and identifiers: Attribute forms 243
10 Click OK. The new Customer Birth Date attribute form is added to the Attribute form pane in the Attribute Editor.
11 Because this is only an example, close the Attribute Editor without saving your changes.
Derived expressions
Derived expressions are created using a combination of warehouse columns, mathematical operators, functions, and constants. While simple expressions have their value determined by just one column in a warehouse table, derived expressions are defined using one or more columns as well as other operators and values. Any operation on a column (such as adding a constant, adding another column, or setting the expression to be an absolute value) creates a derived expression.
For example, you can create a derived attribute to calculate age or anniversaries. By calculating the difference between the columns Date of Birth and Current Date, you can create an attribute to hold the age of a customer or an employee that has been derived from the two columns. By creating an attribute to calculate age in this manner, the attribute’s value is automatically updated as the age changes. If you created an attribute for age in which you included a constant number, the attribute would need to be updated every time a customer or an employee has a birthday.
Example: creating an attribute form with a derived expression
In your database, you store Customer names in two different columns, CUST_FIRST_NAME and CUST_LAST_NAME. However, you want reports to display a customer’s first name and last name together as a single entry on a report. You can achieve this using a derived form expression Name, which consists of the two strings. Using the Customer attribute, the syntax of the derived expression for Name reads:
CUST_FIRST_NAME + “ “ + CUST_LAST_NAME
On a report, this information is displayed as Mary Jones under the Name column. As another example, you could create a derived expression for Name in the format of Last Name, First Name using the following syntax:
CUST_LAST_NAME + “, “ + CUST_FIRST_NAME

The Context of Your Business Data: Attributes Project Design Guide7
244 Column data descriptions and identifiers: Attribute forms © 2010 MicroStrategy, Inc.
Using this expression, the information is displayed as Jones, Mary under the Name column.
Calculations and functions used in a derived expression can assist in deriving data from the database, but you must make sure you use expressions that meet the requirements of your database-specific SQL syntax. If you use syntax that is not supported by your database or other data source, the SQL query and resulting report can fail.
You can also use Architect to create an attribute form with a simple expression, as described in Creating derived attribute form expressions, page 153.
To create an attribute form with a derived expression
1 In MicroStrategy Desktop, log in to the project source that contains the MicroStrategy Tutorial project and then log in to MicroStrategy Tutorial.
2 Navigate to the Schema Objects folder, open the Attributes folder, and then the Customers folder.
3 Double-click the Customer attribute. If a message is displayed asking if you want to use read only mode or edit mode, select Edit and click OK to open the Attribute Editor in edit mode so that you can make changes to the attribute. The Attribute Editor opens.
Note the following:
– If you are only given the option of opening the Attribute Editor in read only mode, this means another user is modifying the project’s schema. You cannot open the Attribute Editor in edit mode until the other user is finished with their changes and the schema is unlocked.
– For information on how you can use read only mode and edit mode for various schema editors, see Using read only or edit mode for schema editors, page 93.
4 Click New. The Create New Attribute Form dialog box opens.
5 From the Source table drop-down list, select the LU_CUSTOMER table. This is the table that contains customers’ first and last names.
6 Double-click the CUST_LAST_NAME column to add it to the Form expression pane on the right.

Project Design Guide The Context of Your Business Data: Attributes 7
© 2010 MicroStrategy, Inc. Column data descriptions and identifiers: Attribute forms 245
7 In the Form expression pane, place the cursor to the right of [CUST_LAST_NAME] and type + “, “ +.
8 Double-click the CUST_FIRST_NAME column to add it to the Form expression pane on the right. Your expression should be defined as shown below.
9 Select Automatic as the mapping method.
10 Click OK. The Create New Attribute Form dialog box opens.
11 In the Form general information area, in the Name field, type Last Name, First Name.
12 From the Category used drop-down list, select None since Last Name, First Name is neither the ID form of Customer nor the primary description form.
13 Click OK. The new attribute form is added to the Attribute form pane in the Attribute Editor.
14 Because this is only an example, close the Attribute Editor without saving your changes.
Joining dissimilar column names: Heterogeneous mappings
Heterogeneous mapping allows Intelligence Server to perform joins on dissimilar column names. If you define more than one expression for a given form, heterogeneous mapping automatically occurs when tables and column names require it.
Because different source systems may store information in various contexts, your company may have multiple columns in different tables that all represent the same business concept. For example, in the MicroStrategy Tutorial, the ID form of the attribute Day contains two expressions. The Day_Date column occurs in the LU_DATE table and the Order_Date column occurs in the ORDER_DETAIL and ORDER_FACT tables.

The Context of Your Business Data: Attributes Project Design Guide7
246 Column data descriptions and identifiers: Attribute forms © 2010 MicroStrategy, Inc.
In the above example, you can use heterogeneous mapping to map the Day attribute to all of the columns in the data warehouse that represent the same concept of Day. You can map Order_Date and Day_Date to the Day attribute—this ensures that both columns are used when information about the Day attribute is displayed on a report.
Each expression is linked to a set of source tables that contain the columns used in the expression. Of all the tables in which the columns exist, you can select as many or as few as you want to be used as part of the attribute’s definition.
In the Attribute Editor, you can view the chosen tables in the source Tables area to the right of the Form Expressions area.
The data types of columns used in a heterogeneous mapping for a given attribute must be identical or similar enough for your particular RDBMS to join them properly. For example, most databases cannot join a data type of Text to a data type of Number. However, depending on your database platform, you might be able to join columns with data types of Number and Integer.
You can also use Architect to create an attribute form with a heterogeneous column mapping, as described in Joining dissimilar column names: Heterogeneous mappings, page 155.
To create an attribute form with a heterogeneous column mapping
1 In MicroStrategy Desktop, log in to the project source that contains the MicroStrategy Tutorial project and then log in to MicroStrategy Tutorial.
2 Navigate to the Schema Objects folder, open the Attributes folder, and then the Time folder.
3 Double-click the Day attribute. If a message is displayed asking if you want to use read only mode or edit mode, select Edit and click OK to open the Attribute Editor in edit mode so that you can make changes to the attribute. The Attribute Editor opens.
Note the following:
– If you are only given the option of opening the Attribute Editor in read only mode, this means another user is modifying the project’s schema. You cannot open the Attribute Editor in edit mode until the other user is finished with their changes and the schema is unlocked.

Project Design Guide The Context of Your Business Data: Attributes 7
© 2010 MicroStrategy, Inc. Column data descriptions and identifiers: Attribute forms 247
– For information on how you can use read only mode and edit mode for various schema editors, see Using read only or edit mode for schema editors, page 93.
4 Click New. The Create New Form Expression dialog box opens.
5 From the Source table drop-down list, select the LU_DAY table.
6 Double-click the DAY_DATE column to add it to the Form expression pane on the right. The mapping method is selected as Automatic by default.
7 Click OK. The Create New Attribute Form dialog box opens.
8 Click New. The Create New Form Expression dialog box opens.
9 From the Source table drop-down list, select the ORDER_DETAIL table.
10 Double-click the ORDER_DATE column to add it to the Form expression pane on the right. The mapping method is selected as Automatic by default.
11 Click OK. The Create New Attribute Form dialog box opens.
Notice that there are now two expressions for the attribute form definition, both of which use different tables as the source of their information. You could continue this process to add as many heterogeneous columns as part of one attribute form as necessary.
12 In the Form general information area, in the Name field, type Date Example.
13 From the Category used drop-down list, select None since this is simply an example scenario.
14 Click OK. The new Date Example attribute form is added to the Attribute form pane in the Attribute Editor.
15 Because this is only an example, close the Attribute Editor without saving your changes.

The Context of Your Business Data: Attributes Project Design Guide7
248 Column data descriptions and identifiers: Attribute forms © 2010 MicroStrategy, Inc.
Implicit expressions
While most attributes map directly to one or more physical columns in the warehouse, an implicit attribute is a virtual or constant attribute that does not physically exist in the warehouse. Such an attribute has an implicit expression, which is a constant value, although nothing is saved in an actual column. Implicit expressions are not defined by column names; they are defined by constants you specify. Any constant is acceptable, for example, RushOrder=‘Yes’. Some attribute definitions can be implied by the existence of a row in a certain table, rather than being defined in terms of columns. Implicit attributes are useful in analyzing and retrieving relevant information.
For example, the Rush Order attribute in MicroStrategy Tutorial is an example of an implicit attribute. Suppose you want a report to display which orders are rush orders so you can better keep track of your shipments. An implicit attribute such as Rush Order is useful for this purpose.
The Rush Order attribute is defined by two expressions: the Rush_Order column in the Order_Fact table and the implicit expression “Y”, which stands for “Yes.” This implicit expression is used to keep track of which orders are rush orders. On a report with the Order and Rush Order attributes on the template, for each order that is a rush order, a “Y” is displayed in the Rush Order column.
Implicit attributes are not commonly used, but are useful in special cases such as the scenario described above.
Modifying attribute data types: Column aliases
A column alias is a new data type that you can specify in place of the default data type for a given attribute form. Column aliases allow you to specify a more appropriate data type that can help avoid errors in your SQL.
They can also help you take more advantage of the data in your data warehouse. For attributes, a column alias performs the same function as it does for facts. By default, the data type for an attribute form is inherited from the data type of the column on which the form is defined. This inheritance is governed by MicroStrategy, which attempts to use a data type as similar as possible to the data type in your database or other data source (see Appendix C, Data Types for more information on how MicroStrategy selects a matching data type). However, there are cases where you may need to change the data type. The following are some examples of such cases.

Project Design Guide The Context of Your Business Data: Attributes 7
© 2010 MicroStrategy, Inc. Column data descriptions and identifiers: Attribute forms 249
In your data warehouse you have a lookup table for an Accounts attribute where the ID is Account Number and the ID is stored in the database as DECIMAL(18, 0). Because this column stores high-precision values, you must modify the column alias for the attribute form and map it to a special data type, Big Decimal. By doing so, the precision can be preserved when performing filtering, drilling, or page-by on the Account attribute.
Another example could be a case in which your warehouse does not have a lookup table for year information, but you would like to create a Year attribute. Many database platforms have functions that can extract parts of a date from a Date data type. For example, SQL Server has a Year function that extracts just the year from a date. In such a case, you can create a Year attribute using the following form expression:
ApplySimple("Year(#0)",[Date_Id])
The ApplySimple expression above is syntactically correct for SQL Server. However, depending on your database or data source type, you may need to use a different syntax.
The data type for this attribute is automatically set to a Date data type. This is because Date_ID is a Date data type. However, the result of the calculation is a year, such as 2002, and it is an integer.
When a temporary SQL table is created, if you do not change the data type of the column alias, the system uses a Date data type and tries to insert integer data into this column. While this does not create a problem in all database platforms, some databases will return an error. To avoid the possibility of an error due to conflicting data types, modify the column alias for the attribute form and change the default Date data type to an Integer data type.
In addition to specifying the data type to be used for an attribute form, the column alias also lets you specify the column alias name to be used in the SQL generated by MicroStrategy. When you create a form expression using a custom expression or multiple columns (as discussed in Attribute form expressions, page 240), the column alias for the attribute form defaults to CustCol (or CustCol_1, CustCol_2, and so on). The following piece of SQL shows, in bold, where the column alias name is used:
SELECT Year(a12.Date_Id) CustCol_1,sum(a11.Tot_Dollar_Sales) WJXBFS1
FROM YR_CATEGORY_SLS a11cross join TRANS_DATE_LW_LY a12
GROUP BY Year(a12.Date_Id)
While the column alias name does not affect the actual results or your report, you can change the column alias name to be more meaningful. The above

The Context of Your Business Data: Attributes Project Design Guide7
250 Column data descriptions and identifiers: Attribute forms © 2010 MicroStrategy, Inc.
example is a simple one, but this can be useful for troubleshooting the SQL for a particularly complex report.
You can use the Attribute Editor to create column aliases. You can also use Architect to create column aliases, as described in Creating and modifying attribute data types: Column aliases, page 157.
Prerequisites
• This procedure assumes you have already created an attribute with a valid attribute expression for which to create a new column alias.
To create a column alias for an attribute
1 In MicroStrategy Desktop, log in to the project source that contains the attribute to create a new column alias for.
2 Right-click the attribute and select Edit. If a message is displayed asking if you want to use read only mode or edit mode, select Edit and click OK to open the Attribute Editor in edit mode so that you can make changes to the attribute. The Attribute Editor opens.
Note the following:
– If you are only given the option of opening the Attribute Editor in read only mode, this means another user is modifying the project’s schema. You cannot open the Attribute Editor in edit mode until the other user is finished with their changes and the schema is unlocked.
– For information on how you can use read only mode and edit mode for various schema editors, see Using read only or edit mode for schema editors, page 93.
3 Select an attribute form and click Modify. The Modify Attribute Form dialog box opens.
4 Select the Column Alias tab.
5 In the Column alias area, click Modify. The Column Editor - Column Selection dialog box opens.
6 Select New to create a new column alias. The Column Editor - Definition dialog box opens.

Project Design Guide The Context of Your Business Data: Attributes 7
© 2010 MicroStrategy, Inc. Column data descriptions and identifiers: Attribute forms 251
7 You can modify the following properties for the column alias:
• Column name: The name for the column alias which is used in any SQL statements which include the fact column.
• Data type: The data type for the fact. For a description of the different data types supported by MicroStrategy, see Appendix C, Data Types.
• Depending on the data type selected, you can specify the byte length, bit length, precision, scale, or time scale for your column alias. For a detailed description on each of these properties, see the MicroStrategy Desktop online help.
8 Click OK to save your changes and return to the Column Editor - Column Selection dialog box.
9 Click OK to save your changes and return to the Attribute Editor.
10 Select Save and Close to save your changes.
Attribute forms versus separate attributes
Attribute forms can be considered as additional descriptions for an attribute, whereas attributes themselves can be considered as report elements or group-by elements that have a one-to-many or a many-to-many relationship with other attributes. The data that you map to attributes can be represented as separate attributes or as an attribute form of an attribute.
In general, you should map data to an attribute form rather than a separate attribute if:
• There is a one-to-one relationship between an attribute and the data.
• You do not group by the data.
The decision to model data as an attribute form for a given attribute or as a separate attribute is usually determined during the logical data modeling phase of project design. For more information on whether to model data as an attribute form or as a separate attribute, see Attribute forms, page 33.
The Context of Your Business Data: Attributes Project Design Guide7
252 Attribute relationships © 2010 MicroStrategy, Inc.
Attribute relationshipsAfter you have created attributes for your project, you can define attribute relationships to define how the engine generates SQL, how tables and columns are joined and used, and which tables are related to other tables.
You link directly related attributes to each other by defining parent-child relationships, as explained in Attribute relationships, page 23. Attribute elements, or the actual data values for an attribute, dictate the relationships that you define between attributes.
The parent-child relationships you create determine the system hierarchy within the project.
The implications of whether attributes are related become clear when you begin building reports. You can run a report with two attributes that are related—Country and City, for example—without any problems. A report with two unrelated attributes, however, must include a metric based on a fact that is on or below the level of the two attributes, or else a Cartesian join occurs, which is generally undesirable. A Cartesian join, or cross join, is very database intensive as every row in one table is joined to every row in the other table.
In MicroStrategy Desktop, you can define relationships for the attributes in your project. This step is covered in Simultaneously creating multiple attributes, page 219, as part of the initial project design effort and in Viewing and editing the parents and children of attributes, page 254, after a project has already been created.
Attributes can be either related or unrelated to one another:
• Related: A parent-child relationship is defined between two or more related attributes. The relationship is defined through the attribute’s lookup table or a relationship table.
Four types of direct relationships can exist between related attributes, and these relationships are defined by the attribute elements that exist in the related attributes. Each type is described below:
One-to-one: Each element in the parent attribute corresponds to one and only one element in the child attribute, and each child attribute corresponds to one and only one element in the parent attribute. A common example of a one-to-one relationship is citizen and taxpayer ID. A citizen can have only one taxpayer ID and a taxpayer ID can be assigned to only one citizen.

Project Design Guide The Context of Your Business Data: Attributes 7
© 2010 MicroStrategy, Inc. Attribute relationships 253
One-to-many: Each element in the parent attribute corresponds to one or more elements in the child attribute, and each child attribute corresponds to one and only one element in the parent attribute. These are the most common types of attribute relationships. Year has a one-to-many relationship to quarter. One year has many quarters, but a specific quarter can be in one year only. This assumes that quarters are defined with an accompanying year such as Q4 2006, Q1 2007, and so on.
Many-to-one: Each element in the parent attribute corresponds to one and only one element in the child attribute, and each child attribute corresponds to one or more elements in the parent attribute. Many-to-one relationships are the same type of relationship as a one-to-many, but it is defined from a different perspective. For example, year is described above as having a one-to-many relationship to quarter. This means that quarter has a many-to-one relationship to year.
Many-to-many: Each element in the parent attribute can have multiple children and each child element in the child attribute can have multiple parents. In banking, customers and accounts are an example of a many-to-many relationship. One customer may have many accounts, and each account may be associated with many customers, such as in the case of a joint checking account.
Attributes can also be related to other attributes through a chain of attribute relationships. Attributes of this type are often in the same hierarchy. For example, consider the Geography hierarchy of the Customer Analysis Module, which contains the attributes Customer Region, Customer State, and Customer City:
In this scenario, Customer Region and Customer State are directly related to each other and Customer State and Customer City also have a direct relationship. While Customer City is not directly related to Customer Region, these two attributes are related through Customer State. This allows you to include Customer Region and Customer City on a report and view the different customer cities for each customer region.
• Unrelated: No parent-child relationship has been defined and the attributes are not related through a chain of attribute relationships. No relationship is present in the lookup tables or relationship tables for these attributes. Unrelated attributes can exist together in fact tables, giving

The Context of Your Business Data: Attributes Project Design Guide7
254 Attribute relationships © 2010 MicroStrategy, Inc.
context to the fact. For example, the Customer and Day attributes have no relationship to one another. A particular customer and a particular day only make sense together if a fact is associated with that combination. For example, a certain customer, Don Addison, spent $2,500 on January 5, 2003 on behalf of the health care company in which he works. In this case, care must be taken when using unrelated attributes on a single report. In general, however, these attributes are relatively straightforward to deal with from a project design perspective.
Viewing and editing the parents and children of attributes
The relationships that exist between attributes rely on the parent-child specifications that you assign to attributes. How attributes relate to one another and the types of relationships they share define the system hierarchy which is used to generate SQL. This SQL, in turn, determines the output of a report.
Parent-child relationships were designated when attributes were selected for the new project. However, you can continue to make changes to the relationships between attributes even after creating your project.
For example, the Distribution Center attribute is the parent of the Call Center attribute. A one-to-one relationship exists between Distribution Center and Call Center. This means that only one call center exists in each distribution center. Country, in turn, is the parent of Distribution Center and multiple distribution centers exist in each country. So these two attributes have a one-to-many relationship.
Assigning parent-child relationships to attributes allows you to connect attributes to one another in user hierarchies, as discussed in Creating Hierarchies to Organize and Browse Attributes, page 281. Also, when a report generates inaccurate SQL and results, viewing and changing parent-child relationships may be a necessary troubleshooting method.
Follow the procedure below to view and edit the parents and children of the Distribution Center attribute.
You can also use Architect to define relationships between attributes. Architect can provide a more intuitive and helpful workflow that allows you to view and modify multiple attributes as you define attribute relationships, as described in Defining attribute relationships, page 166.

Project Design Guide The Context of Your Business Data: Attributes 7
© 2010 MicroStrategy, Inc. Attribute relationships 255
To view and edit the parents and children of an attribute
1 In MicroStrategy Desktop, log in to the project source that contains the MicroStrategy Tutorial project and then log in to MicroStrategy Tutorial.
2 Navigate to the Schema Objects folder, open the Attributes folder, and then the Geography folder.
3 Double-click the Distribution Center attribute. If a message is displayed asking if you want to use read only mode or edit mode, select Edit and click OK to open the Attribute Editor in edit mode so that you can make changes to the attribute. The Attribute Editor opens.
Note the following:
– If you are only given the option of opening the Attribute Editor in read only mode, this means another user is modifying the project’s schema. You cannot open the Attribute Editor in edit mode until the other user is finished with their changes and the schema is unlocked.
– For information on how you can use read only mode and edit mode for various schema editors, see Using read only or edit mode for schema editors, page 93.
4 Click the Children tab. The Call Center attribute is listed, along with the relationship type it shares with Distribution Center, and the relationship table in which the relationship exists.
Consider a scenario in which multiple call centers now exist in the same distribution center so they no longer have a one-to-one relationship; in this case, you must change the relationship type between Call Center and Distribution Center.
5 To change the relationship type, select One to Many from the Relationship type drop-down list.
6 You also want the relationship between the two attributes to be defined in the LU_Employee table instead of the LU_Call_Ctr table in which it is defined now. To change the relationship table, select the LU_Employee table from the Relationship table drop-down list.
7 Because this is only an example, close the Distribution Center attribute without saving your changes.
The Context of Your Business Data: Attributes Project Design Guide7
256 Attribute relationships © 2010 MicroStrategy, Inc.
Supporting many-to-many and joint child relationships
Two forms of attribute relationships, many-to-many relationships and joint child relationships, can introduce additional complexity to the schema and warehouse design process. The following sections discuss the considerations you must make to ensure an effective warehouse design in light of the unique nature of these relationships.
While the topics are largely related to logical model design, a working knowledge of physical schemas is helpful when dealing with the challenges involved with these topics.
Before reading this section, you should know what logical data models and physical warehouse schemas are, and how to read and interpret them. Logical data models and physical warehouse schemas are discussed in Chapter 2, The Logical Data Model and Chapter 3, Warehouse Structure for Your Logical Data Model respectively. These chapters discuss how to plan and create a conceptual framework for your business intelligence data.
Many-to-many relationships
The presence of many-to-many relationships introduces complexity during the warehouse design process. With the presence of many-to-many relationships, you must make additional considerations to effectively plan your design.
Below are some real-life examples of many-to-many relationships which must be carefully handled in the data model and schema:
• In a certain organization, each salesperson can work in more than one calling center. Likewise, each calling center has many salespeople.
• In a car manufacturing plant, many models of cars are produced, and each comes in several colors. That is, there are many colors for a single type of car, and many types of cars can be associated with the same color.
The following sections use the example of items and colors to demonstrate a many-to-many relationship and the options you have for dealing with them. One item can come in many colors—red hats, blue hats, green hats—and one color can be associated with many items—red dress, red hat, red shoes, red socks.
Potential problems with many-to-many relationships usually come in the following forms, both of which can be avoided by correctly modeling the relationship:

Project Design Guide The Context of Your Business Data: Attributes 7
© 2010 MicroStrategy, Inc. Attribute relationships 257
• Loss of analytical capability
• Multiple counting
Loss of analytical capability
With the color/item many-to-many relationship, there are usually two business questions for which users want answers:
1 In what colors are certain items available?
2 How much of a particular item/color combination was sold?
Answering the first question requires a table that contains a list of all possible item/color combinations. Recall that one-to-many relationships are usually in the child’s lookup table.
In many-to-many relationships this is not feasible. Rather, a distinct relationship table needs to be present in your warehouse. The following diagram shows the lookup and relationship tables for item and color:
The Rel_Color_Item table provides a row for every possible item/color combination.
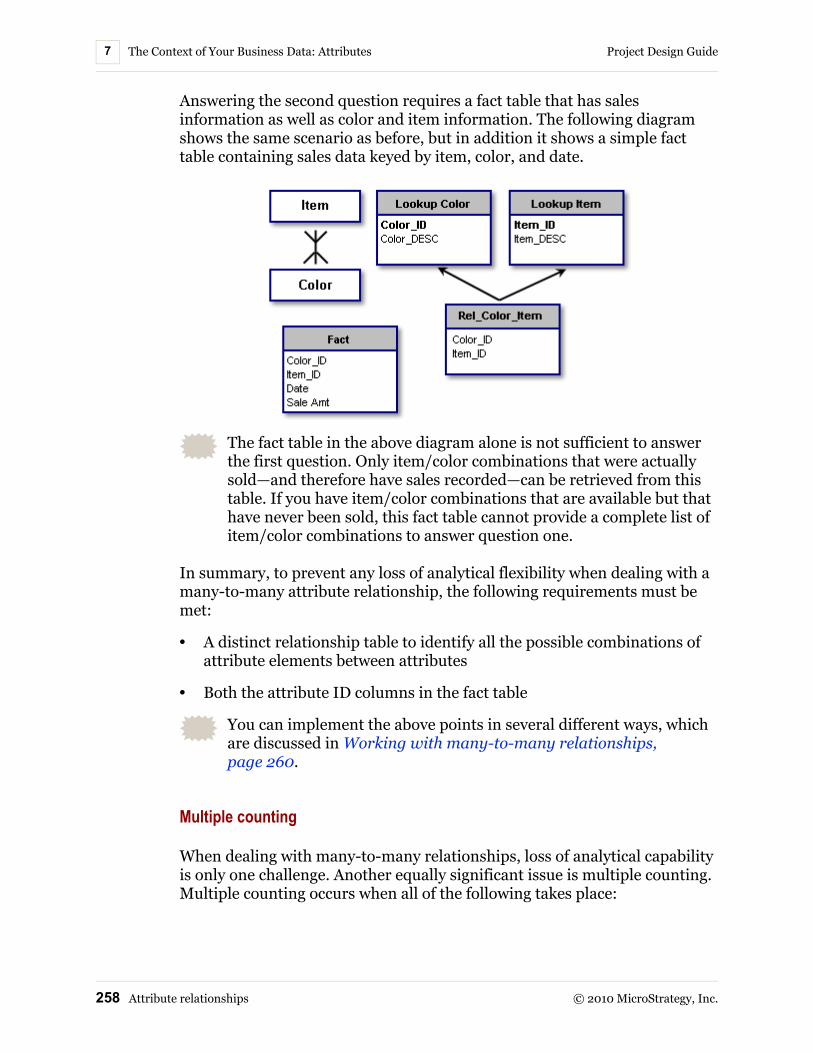
The Context of Your Business Data: Attributes Project Design Guide7
258 Attribute relationships © 2010 MicroStrategy, Inc.
Answering the second question requires a fact table that has sales information as well as color and item information. The following diagram shows the same scenario as before, but in addition it shows a simple fact table containing sales data keyed by item, color, and date.
The fact table in the above diagram alone is not sufficient to answer the first question. Only item/color combinations that were actually sold—and therefore have sales recorded—can be retrieved from this table. If you have item/color combinations that are available but that have never been sold, this fact table cannot provide a complete list of item/color combinations to answer question one.
In summary, to prevent any loss of analytical flexibility when dealing with a many-to-many attribute relationship, the following requirements must be met:
• A distinct relationship table to identify all the possible combinations of attribute elements between attributes
• Both the attribute ID columns in the fact table
You can implement the above points in several different ways, which are discussed in Working with many-to-many relationships, page 260.
Multiple counting
When dealing with many-to-many relationships, loss of analytical capability is only one challenge. Another equally significant issue is multiple counting. Multiple counting occurs when all of the following takes place:
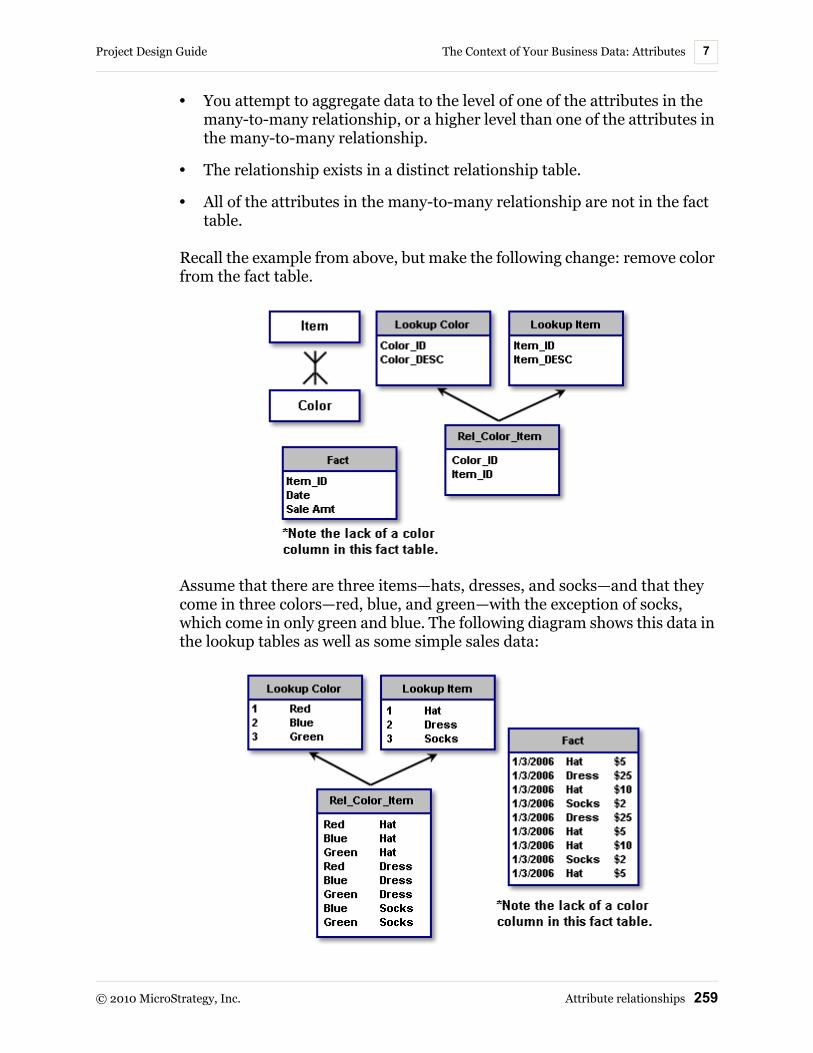
Project Design Guide The Context of Your Business Data: Attributes 7
© 2010 MicroStrategy, Inc. Attribute relationships 259
• You attempt to aggregate data to the level of one of the attributes in the many-to-many relationship, or a higher level than one of the attributes in the many-to-many relationship.
• The relationship exists in a distinct relationship table.
• All of the attributes in the many-to-many relationship are not in the fact table.
Recall the example from above, but make the following change: remove color from the fact table.
Assume that there are three items—hats, dresses, and socks—and that they come in three colors—red, blue, and green—with the exception of socks, which come in only green and blue. The following diagram shows this data in the lookup tables as well as some simple sales data:
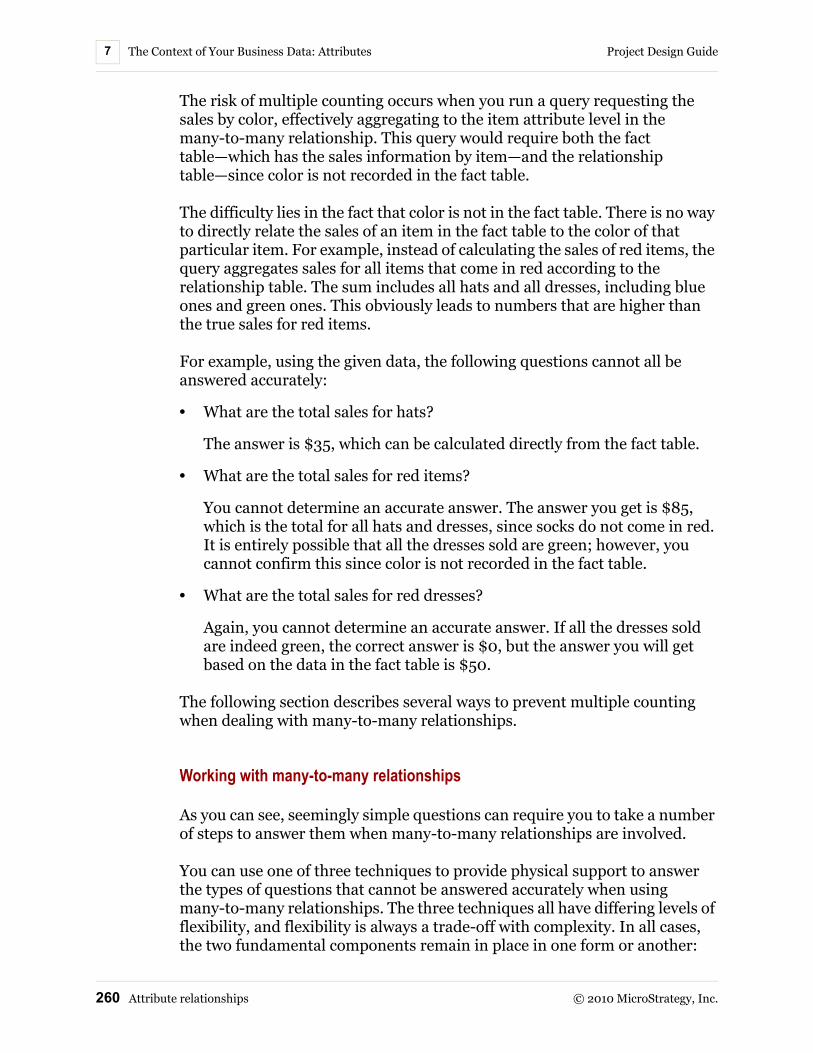
The Context of Your Business Data: Attributes Project Design Guide7
260 Attribute relationships © 2010 MicroStrategy, Inc.
The risk of multiple counting occurs when you run a query requesting the sales by color, effectively aggregating to the item attribute level in the many-to-many relationship. This query would require both the fact table—which has the sales information by item—and the relationship table—since color is not recorded in the fact table.
The difficulty lies in the fact that color is not in the fact table. There is no way to directly relate the sales of an item in the fact table to the color of that particular item. For example, instead of calculating the sales of red items, the query aggregates sales for all items that come in red according to the relationship table. The sum includes all hats and all dresses, including blue ones and green ones. This obviously leads to numbers that are higher than the true sales for red items.
For example, using the given data, the following questions cannot all be answered accurately:
• What are the total sales for hats?
The answer is $35, which can be calculated directly from the fact table.
• What are the total sales for red items?
You cannot determine an accurate answer. The answer you get is $85, which is the total for all hats and dresses, since socks do not come in red. It is entirely possible that all the dresses sold are green; however, you cannot confirm this since color is not recorded in the fact table.
• What are the total sales for red dresses?
Again, you cannot determine an accurate answer. If all the dresses sold are indeed green, the correct answer is $0, but the answer you will get based on the data in the fact table is $50.
The following section describes several ways to prevent multiple counting when dealing with many-to-many relationships.
Working with many-to-many relationships
As you can see, seemingly simple questions can require you to take a number of steps to answer them when many-to-many relationships are involved.
You can use one of three techniques to provide physical support to answer the types of questions that cannot be answered accurately when using many-to-many relationships. The three techniques all have differing levels of flexibility, and flexibility is always a trade-off with complexity. In all cases, the two fundamental components remain in place in one form or another:
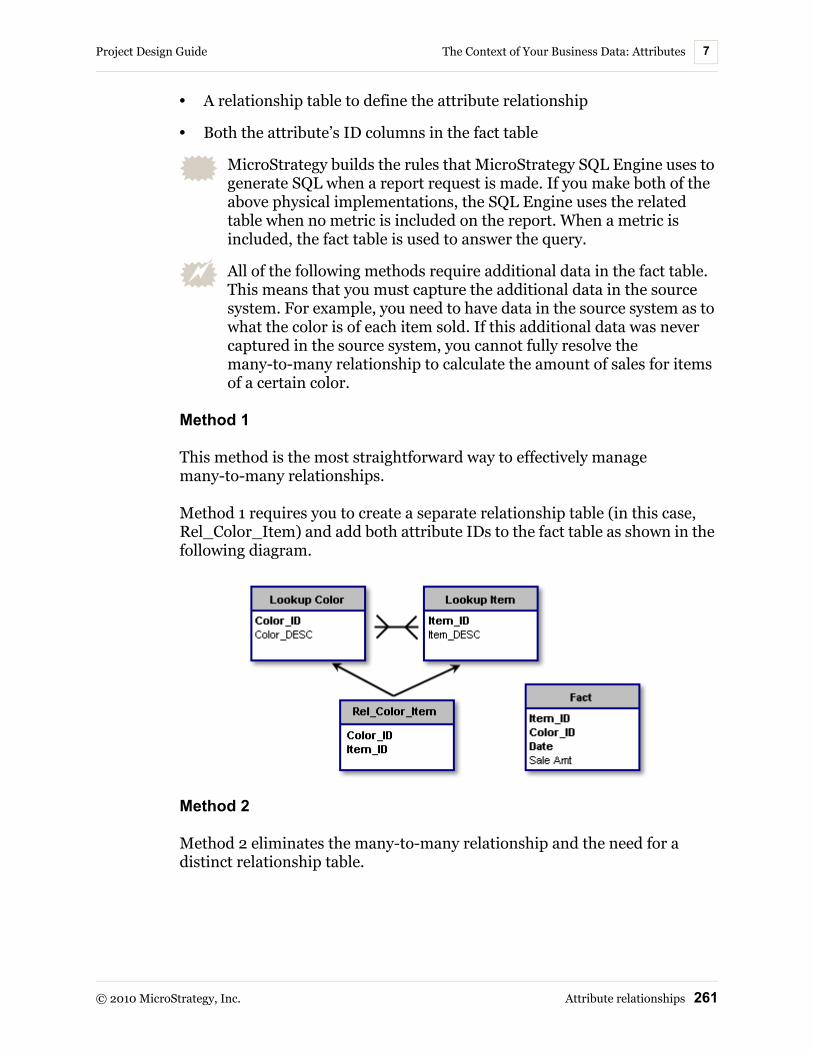
Project Design Guide The Context of Your Business Data: Attributes 7
© 2010 MicroStrategy, Inc. Attribute relationships 261
• A relationship table to define the attribute relationship
• Both the attribute’s ID columns in the fact table
MicroStrategy builds the rules that MicroStrategy SQL Engine uses to generate SQL when a report request is made. If you make both of the above physical implementations, the SQL Engine uses the related table when no metric is included on the report. When a metric is included, the fact table is used to answer the query.
All of the following methods require additional data in the fact table. This means that you must capture the additional data in the source system. For example, you need to have data in the source system as to what the color is of each item sold. If this additional data was never captured in the source system, you cannot fully resolve the many-to-many relationship to calculate the amount of sales for items of a certain color.
Method 1
This method is the most straightforward way to effectively manage many-to-many relationships.
Method 1 requires you to create a separate relationship table (in this case, Rel_Color_Item) and add both attribute IDs to the fact table as shown in the following diagram.
Method 2
Method 2 eliminates the many-to-many relationship and the need for a distinct relationship table.

The Context of Your Business Data: Attributes Project Design Guide7
262 Attribute relationships © 2010 MicroStrategy, Inc.
Here the many-to-many relationship is converted into a compound attribute relationship. You treat one attribute as a child of the other and have a compound key for the lower level attribute. Also, you add both attribute IDs, in this case Item_ID and Color_ID, to the fact table as shown in the following diagram.
While this method eliminates the need for a separate relationship table, you lose the ability to view items independent of color, or vice versa.
Method 3
Method 3 is the most versatile solution and has the following characteristics:
• Further simplifies the compound attribute relationship from Method 2 into a simple attribute relationship
• Provides the ability to view item and color together or independently
• Requires only one attribute column in the fact table for complete flexibility, rather than two
Here you must create a new attribute, lower in level than either Color or Item. This attribute is essentially a concatenation of Color and Item, which gives it a one-to-many relationship between itself and each of its parent attributes. This is the SKU attribute, particularly common in retail data models or situations.
Project Design Guide The Context of Your Business Data: Attributes 7
© 2010 MicroStrategy, Inc. Attribute relationships 263
Finally, rather than including Color and Item in the fact table, you only need to include this new child attribute SKU, as shown in the following diagram.
This method is actually quite similar to Method 1. The major difference is that the distinct relationship table from Method 1 has an additional column, SKU, which extends the relationship of each item/color combination into a single value. Consequently, you can use this single value in the fact table.
The major disadvantage of Method 3 lies in creating the new attribute if your business model does not already use a similar structure, as well as possibly adding complexity to the ETL process.
Joint child relationships
Some attributes exist at the intersection of other indirectly related attributes. Such attributes are called joint children.
Joint child relationships connect special attributes that are sometimes called cross-dimensional attributes, text facts, or qualities. They do not fit neatly into the modeling schemes you have learned about thus far. These relationships can be modeled and conceptualized like traditional attributes but, like facts, they exist at the intersection of multiple attribute levels.
Many source systems refer to these special attributes as flags. Therefore, if flags are referenced in your source system documentation, these are likely candidates for joint child relationships.
Joint child relationships are really another type of many-to-many relationship where one attribute has a many-to-many relationship to two otherwise unrelated attributes. For example, consider the relationship

The Context of Your Business Data: Attributes Project Design Guide7
264 Attribute relationships © 2010 MicroStrategy, Inc.
between three attributes: Promotion, Item, and Quarter. In this case, Promotion has a many-to-many relationship to both Item and Quarter, as shown in the following diagram.
An example of a promotion might be a “Red Sale” where all red items are on sale. A business might run this promotion around Valentine's Day and again at Christmas time.
Supporting joint child relationships
One way to resolve a many-to-many relationship is to have a relationship table for the attributes involved in the many-to-many relationships. In this case, you might create two relationship tables, one to relate Promotion and Item. The second relates Promotion and Quarter as shown in the following diagram.
These two tables are sufficient to answer questions such as:
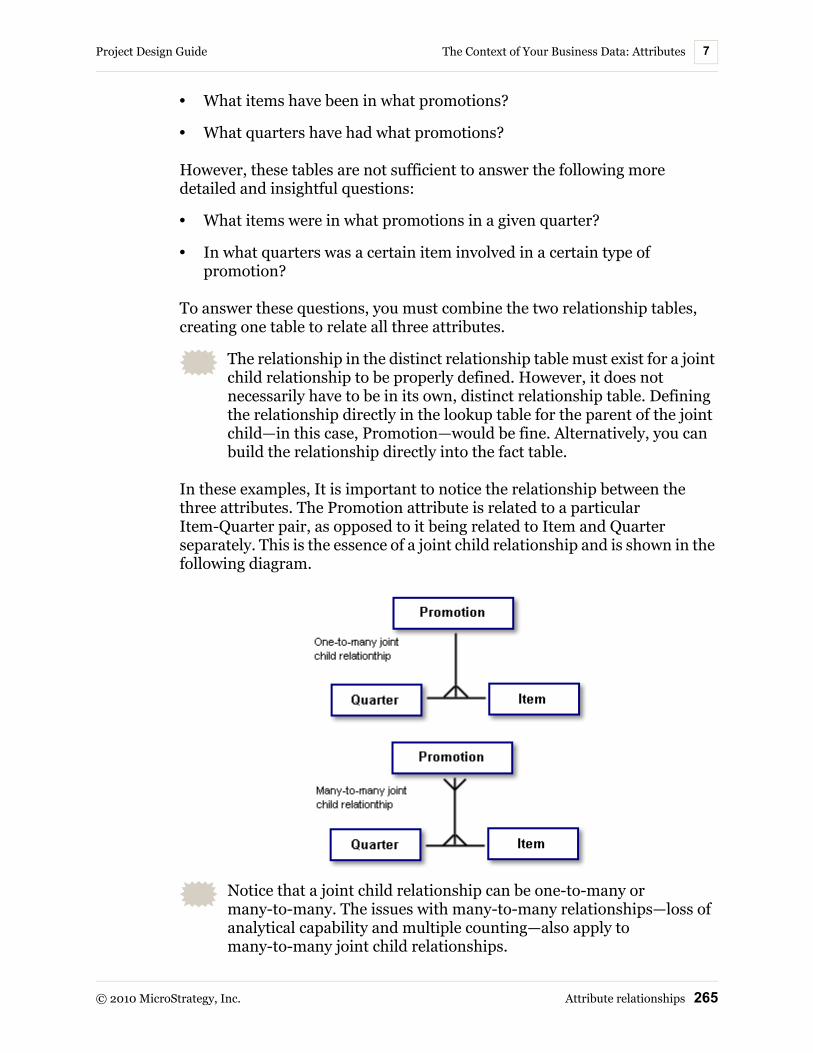
Project Design Guide The Context of Your Business Data: Attributes 7
© 2010 MicroStrategy, Inc. Attribute relationships 265
• What items have been in what promotions?
• What quarters have had what promotions?
However, these tables are not sufficient to answer the following more detailed and insightful questions:
• What items were in what promotions in a given quarter?
• In what quarters was a certain item involved in a certain type of promotion?
To answer these questions, you must combine the two relationship tables, creating one table to relate all three attributes.
The relationship in the distinct relationship table must exist for a joint child relationship to be properly defined. However, it does not necessarily have to be in its own, distinct relationship table. Defining the relationship directly in the lookup table for the parent of the joint child—in this case, Promotion—would be fine. Alternatively, you can build the relationship directly into the fact table.
In these examples, It is important to notice the relationship between the three attributes. The Promotion attribute is related to a particular Item-Quarter pair, as opposed to it being related to Item and Quarter separately. This is the essence of a joint child relationship and is shown in the following diagram.
Notice that a joint child relationship can be one-to-many or many-to-many. The issues with many-to-many relationships—loss of analytical capability and multiple counting—also apply to many-to-many joint child relationships.

The Context of Your Business Data: Attributes Project Design Guide7
266 Attributes that use the same lookup table: Attribute roles © 2010 MicroStrategy, Inc.
If you have a joint child relationship in your data, it is important for you to define it in MicroStrategy so that you get the correct data for reports that use the parent attribute in a joint child attribute. This ensures that when you need to join the fact table to the parent attribute of a joint child relationship—for example, to see sales by promotion—the join will always use both joint children rather than just one or the other.
Attributes that use the same lookup table: Attribute roles
Attribute roles allow you to use the same data to define and support two separate attributes. Suppose you define two attributes that have the same data definition but play different roles in your business model. For example, in the following image, notice that the attributes Origin Airport and Destination Airport are defined using the same lookup table, LU_AIRPORT, and column, AIRPORT_ID.
Although it makes sense to see JFK as either an origin or destination airport on a report, it is understood that destination airport data differs from origin airport data. You need to support the logical concepts of an origin airport and a destination airport, but you do not want to create two separate lookup tables with identical data. Creating two separate lookup tables would create redundancy, and thus take up more storage space and be harder to maintain.
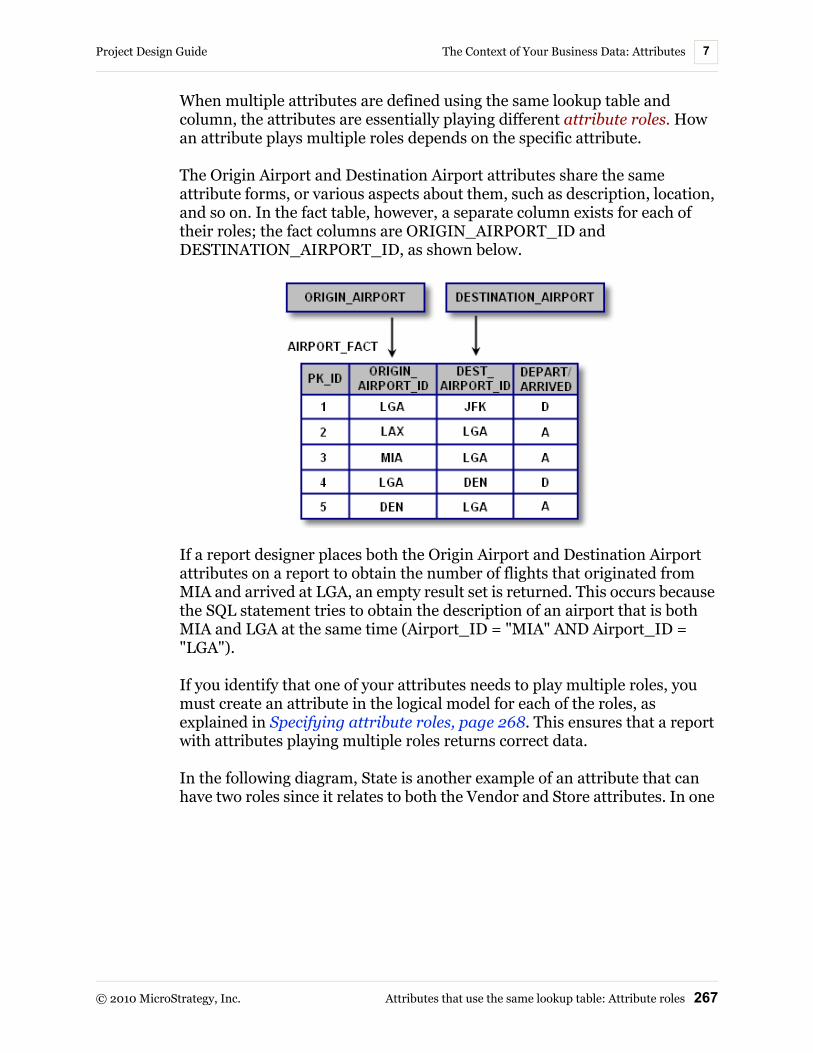
Project Design Guide The Context of Your Business Data: Attributes 7
© 2010 MicroStrategy, Inc. Attributes that use the same lookup table: Attribute roles 267
When multiple attributes are defined using the same lookup table and column, the attributes are essentially playing different attribute roles. How an attribute plays multiple roles depends on the specific attribute.
The Origin Airport and Destination Airport attributes share the same attribute forms, or various aspects about them, such as description, location, and so on. In the fact table, however, a separate column exists for each of their roles; the fact columns are ORIGIN_AIRPORT_ID and DESTINATION_AIRPORT_ID, as shown below.
If a report designer places both the Origin Airport and Destination Airport attributes on a report to obtain the number of flights that originated from MIA and arrived at LGA, an empty result set is returned. This occurs because the SQL statement tries to obtain the description of an airport that is both MIA and LGA at the same time (Airport_ID = "MIA" AND Airport_ID = "LGA").
If you identify that one of your attributes needs to play multiple roles, you must create an attribute in the logical model for each of the roles, as explained in Specifying attribute roles, page 268. This ensures that a report with attributes playing multiple roles returns correct data.
In the following diagram, State is another example of an attribute that can have two roles since it relates to both the Vendor and Store attributes. In one

The Context of Your Business Data: Attributes Project Design Guide7
268 Attributes that use the same lookup table: Attribute roles © 2010 MicroStrategy, Inc.
case, it refers to the location of a vendor. In the other, it refers to the location of a store. The State attribute is therefore said to be playing two roles.
In an OLTP system, roles are most often implemented as a single table, as shown in the above diagram. In the data warehouse, a query involving both Vendor State and Store State needs to use the State table twice in the same query. For example, a report is created to display vendors from Arkansas who sold to New York stores. The results may be blank if the data warehouse structure was set up incorrectly. The SQL statement tries to obtain the description of a state that is both Arkansas and New York simultaneously, generating the empty result set.
Specifying attribute roles
To see both roles on the same report, you must treat them as different attributes. That is, they must have different attribute names. To create unique attributes, you have the following options:
• Automatic attribute role recognition, where you create multiple attributes that have the same lookup table and allow MicroStrategy to automatically detect the multiple roles. Automatic recognition is enabled by the VLDB property Engine Attribute Role Options at the database instance level. For more information, refer to the MicroStrategy System Administration Guide.

Project Design Guide The Context of Your Business Data: Attributes 7
© 2010 MicroStrategy, Inc. Attributes that use the same lookup table: Attribute roles 269
• Explicit table aliasing, where you create multiple logical tables pointing to the same physical table and define those two logical tables as the lookup tables for the two attributes.
In a MicroStrategy project in which automatic attribute role recognition is enabled (meaning that the database instance-level VLDB property, Engine Attribute Role Options, is enabled), you can have a maximum of 99 attributes defined on the same column of the same lookup table. If you create more than this number of attributes, you encounter an error, and are unable to update the project schema or restart Intelligence Server.
Table aliasing provides advanced users with more control. If you are upgrading or have a very complex schema, it may be the better alternative. If you are new to MicroStrategy, however, it is easier to use automatic attribute role recognition. MicroStrategy recommends that you take advantage of automatic role recognition if you do not know the details of the modeling logic or the database.
Automatic recognition does not work if the attributes are in the same hierarchy, meaning that a child attribute is shared. For example, in the State example provided above, the two State attributes do not have a common child attribute.
In summary, if you identify that any one of your attributes needs to play multiple roles, an attribute must be created in the logical model for each of the roles. Remember this rule to help you identify attribute roles: If you want to see the same attribute multiple times on one report, as Ship Month and Order Month, for example, the attribute has multiple roles. In this example, Month is the attribute that has multiple roles. You can use either automatic attribute role recognition or explicit table aliasing to create the attribute roles.
Using automatic attribute role recognition
In the data warehouse, a query involving both Vendor State and Store State needs to use the State table twice in the same query to get correct results. You can set up two attributes, Store State and Vendor State, both of which use the

The Context of Your Business Data: Attributes Project Design Guide7
270 Attributes that use the same lookup table: Attribute roles © 2010 MicroStrategy, Inc.
same lookup table. The resulting SQL code contains a self-join with the LU_State table. The logical model would look like the following:
Note that both roles for the State attribute are included in the logical model so that “State” can be considered from two different perspectives. Since the state in which a vendor resides and the state in which one of the stores is located are two different things, the logical model must reflect that. Automatic recognition allows these two attributes, Vendor State and Store State, to access the same lookup table, using different attribute names for the same expression.
Automatic role recognition works only when the attributes use exactly the same expression, which in most cases simply represents a column or columns in a lookup table.
Consider the following sample desired report:
In this case, the request is, “Show me total sales by Store State for all my vendors in Arkansas (Store State ID = 15).” The same lookup table, LU_State, can be used for both attributes, Store State and Vendor State, if attribute roles are used. The two attributes refer to the same columns of that table.
To use automatic attribute role recognition, you must select the Engine Attribute Role Options, found in the database instance-level VLDB Properties under Query Optimization. See the MicroStrategy Desktop online help or the MicroStrategy System Administration Guide for steps to set this VLDB property.
Vendor State Vendor Store Store State
Metrics DollarSales
Vendor_State_ID=15 (Arkansas)
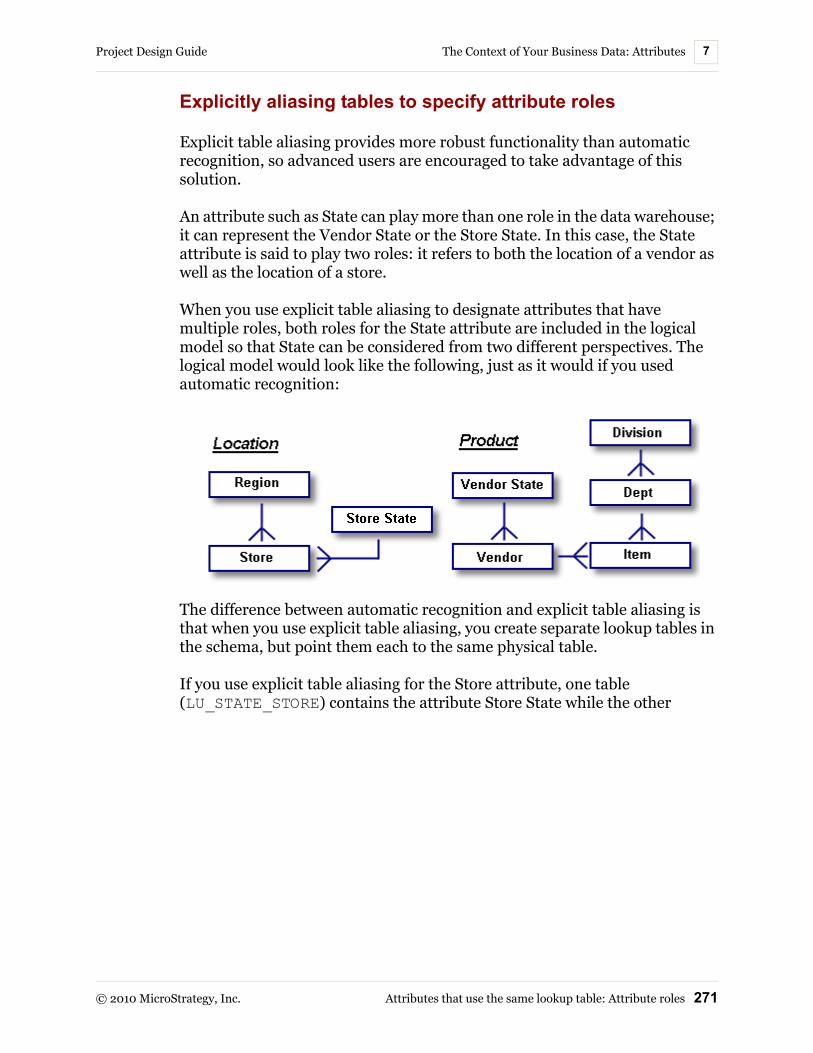
Project Design Guide The Context of Your Business Data: Attributes 7
© 2010 MicroStrategy, Inc. Attributes that use the same lookup table: Attribute roles 271
Explicitly aliasing tables to specify attribute roles
Explicit table aliasing provides more robust functionality than automatic recognition, so advanced users are encouraged to take advantage of this solution.
An attribute such as State can play more than one role in the data warehouse; it can represent the Vendor State or the Store State. In this case, the State attribute is said to play two roles: it refers to both the location of a vendor as well as the location of a store.
When you use explicit table aliasing to designate attributes that have multiple roles, both roles for the State attribute are included in the logical model so that State can be considered from two different perspectives. The logical model would look like the following, just as it would if you used automatic recognition:
The difference between automatic recognition and explicit table aliasing is that when you use explicit table aliasing, you create separate lookup tables in the schema, but point them each to the same physical table.
If you use explicit table aliasing for the Store attribute, one table (LU_STATE_STORE) contains the attribute Store State while the other

The Context of Your Business Data: Attributes Project Design Guide7
272 Attributes that use the same lookup table: Attribute roles © 2010 MicroStrategy, Inc.
(LU_STATE_VENDOR) contains Vendor State, as shown in the following diagram.
Consider the following sample desired report that should provide data about the total sales by Store State for all vendors in Arkansas (Store State ID = 15):
When explicit table aliasing is used, the two lookup tables LU_STATE_STORE and LU_STATE_VENDOR are used. Since they are just different names for the same physical table, the report accesses the same physical table, LU_STATE, for both state names, as shown by this sample SQL:
SELECT a12.State_Desc as State_Desc SELECT a13.State_Desc as State_Desc
FROM LU_STATE a12 LU_STATE a13
When you create a table alias, the selected table is copied, allowing you to rename a copy of the same table. When you are ready to create new attributes—as in the example discussed above—you can map the appropriate table to each attribute. In the case above, you would select the LU_STATE_STORE table for the Store State attribute and LU_STATE_VENDOR for Vendor State.
Table aliases are one kind of logical table. For information about logical tables, refer to Appendix B, Logical Tables.
Vendor State Vendor Store Store State
Metrics DollarSales
Vendor_State_ID=15 (Arkansas)

Project Design Guide The Context of Your Business Data: Attributes 7
© 2010 MicroStrategy, Inc. Attributes that use the same lookup table: Attribute roles 273
You can also use Architect to create attribute roles with explicit table aliasing, as described in Specifying attribute roles: Attributes that use the same lookup, page 163.
To create attribute roles with explicit table aliasing
This procedure provides steps to re-create the example of explicit table aliasing described in this section. The LU_STATE table is not included in the MicroStrategy Tutorial project. However, you can use the same high-level procedure and concepts as guidelines to create attribute roles in your project setup.
1 In MicroStrategy Desktop, log in to the project to create attribute roles with explicit table aliasing.
2 Navigate to the Schema Objects folder, and then select the Tables folder.
3 Right-click the LU_STATE table and select Create Table Alias. An LU_STATE(1) table is created.
4 Right-click LU_STATE(1), select Rename, and rename the table as LU_STATE_STORE.
5 Right-click the LU_STATE table and select Create Table Alias. An LU_STATE(1) table is created.
6 Right-click LU_STATE(1), select Rename, and rename the table as LU_STATE_VENDOR.
Create the attributes
7 Select the Attributes folder.
8 From the File menu, select New, and then Attribute. The Create New Form Expression dialog box opens.
9 From the Source table drop-down list, select LU_STATE_STORE.
10 In the Available columns pane, double-click STATE_ID, which identifies the attribute role.
11 Select Manual mapping and click OK. The Create New Attribute Form dialog box opens.

The Context of Your Business Data: Attributes Project Design Guide7
274 Attributes with multiple ID columns: Compound attributes © 2010 MicroStrategy, Inc.
12 From the Source table drop-down list, select the same LU_STATE_STORE table.
13 Click OK. The Attribute Editor opens.
14 Click New to map any other columns to attribute forms for the State Store attribute. You must make sure to map any State Store attribute forms to columns from the LU_STATE_STORE table.
15 Save the State Store attribute once you are finished mapping attribute forms to columns of the LU_STATE_STORE table.
16 Create a Vendor State attribute with the same sub-procedure (Create the attributes, page 273) used to create State Store above, except you must use the LU_STATE_VENDOR table instead of the LU_STATE_STORE table.
Attributes with multiple ID columns: Compound attributes
A compound attribute is an attribute with multiple columns specified as the ID column. This implies that more than one ID column is needed to uniquely identify the elements of that attribute. Generally, you create a compound attribute when your logical data model reflects that a compound key relationship is present. In the relational database, a compound key is a primary key that consists of more than one database column.
For example, a retail project has two attributes, Class and Item. Class is the parent of Item and has a one-to-many relationship with it. The values in the Item_ID column do not uniquely identify an item. The item shirt has an Item_ID of 1. However, there are different shirts, depending on the class—men’s, women’s, and children’s. Therefore, to uniquely identify a man’s shirt, Item_ID and Class_ID must be grouped together, creating a compound attribute.
All of the ID forms of the compound attribute should be within the same lookup table.

Project Design Guide The Context of Your Business Data: Attributes 7
© 2010 MicroStrategy, Inc. Attributes with multiple ID columns: Compound attributes 275
Example: Creating compound attributes
You must create a compound attributes when an attribute requires two or more columns to uniquely identify its elements. In the MicroStrategy Tutorial project, Distribution Center is an example of a compound attribute. To uniquely identify a distribution center, one must know two details about the distribution center: the ID of the distribution center and the country in which it exists. This data is represented by the Dist_Ctr_ID and Country_ID columns respectively. The same Distribution Center identification numbers can exist for different distribution centers, but in the same country, each distribution center has a unique identification number.
Therefore, both the Country_ID and Dist_Ctr_ID columns must be grouped together for the Distribution Center attribute. This ensures that data about distribution centers is displayed correctly and completely on a report. To support this functionality, a form group must be created. A form group is a grouping of attribute forms to create a compound attribute.
Follow the procedure below to create the Distribution Center compound attribute.
You can also use Architect to create compound attributes, as described in Creating attributes with multiple ID columns: Compound attributes, page 159.
To create the Distribution Center compound attribute
1 In MicroStrategy Desktop, log in to the project source that contains the MicroStrategy Tutorial project and then log into MicroStrategy Tutorial.
2 Navigate to the My Personal Objects folder, and open the My Objects folder.
3 From the File menu, select New, and then Attribute. The Attribute Editor opens, with the Create New Form Expression dialog box displayed on top of it.
4 From the Source table drop-down list, select the LU_DIST_CTR table. This is the table in which the two ID columns of Distribution Center reside.
5 Double-click the COUNTRY_ID column to add it to the Form expression pane on the right.
The Context of Your Business Data: Attributes Project Design Guide7
276 Attributes with multiple ID columns: Compound attributes © 2010 MicroStrategy, Inc.
6 Select Automatic mapping and click OK. The Create New Attribute Form dialog box opens.
7 In the Form general information area, in the Name field, type Country ID.
8 Keep all other defaults, and click OK.
9 In the Attribute Editor, click New to create the other attribute ID form. This attribute form maps to the distribution center ID column necessary to complete the definition of the Distribution Center attribute.
10 Double-click the DIST_CTR_ID column to add it to the Form expression pane on the right.
11 Select Automatic mapping and click OK. The Create New Attribute Form dialog box opens.
12 In the Form general information area, in the Name field, type Distribution Center ID.
13 In the Form category section, from the Category used drop-down list, select ID. Click OK.
You must designate this attribute form as an ID column so that it can be combined with the Country_ID form to create one unique identifier ID for the Distribution Center attribute.
Create a form group
14 A dialog box notifies you that another form (in this case, COUNTRY_ID) is already using the ID form category and that you must create a form group to combine the two ID columns. Click Yes. The Create New Attribute Form dialog box opens.
15 In the Name field, type Distribution Center and click OK. The Attribute Editor opens, with the form group you created in the Attribute forms pane.
16 Because this is only an example, close the Distribution Center attribute without saving your changes.
If you create a compound attribute, you must update the schema to see your changes in the project. Close all editors. Then, from the Schema menu, select Update Schema.

Project Design Guide The Context of Your Business Data: Attributes 7
© 2010 MicroStrategy, Inc. Using attributes to browse and report on data 277
Using attributes to browse and report on dataOnce attributes are built, they are used in two primary ways—browsing and reporting. Users browse through attributes to locate an attribute to use on a report, and users place an attribute on a report to display details about the particular attribute and how it relates to fact data. Each attribute can be displayed in a variety of forms so you must specify the default display of each of the attributes in the project. You can do this on a report-by-report basis, but you still must specify the global, or project-wide, default for each attribute.
You must choose a default attribute display for browsing and another for reporting. Report display forms are the attribute forms that appear as columns in a completed report. Browse forms are the attribute forms that appear as a user browses through the element list of an attribute in the Data Explorer in a project. Therefore, browse forms identify attribute elements. This separation allows for greater attribute display flexibility depending on the application.
The browse forms of the attribute are also used to display the attribute elements in the prompt details auto text code of a Report Services document. For information on Report Services documents, see the MicroStrategy Document Creation Guide.
When creating attributes, all forms are included as report display forms and browse forms by default. The only exception is if you create multiple attribute forms, the first form you create is not included as a report display or browse form.
An attribute’s report display forms determine which attribute forms are displayed by default when the report is executed. By selecting different forms for the attribute, you select a different set of values for display. For example, a report includes Region as an attribute. If ID is selected as the attribute form, the display could be a number such as four. If Description is selected as the attribute form, the display could be a name, such as Northwest. If a report lists the cities in which you have stores, then you might choose to display the Long Description form, such as Chicago, instead of the URL attribute form, that is, www.chicago.com.
You can also select which attribute forms are retrieved with the report results but not displayed on the grid. These browse forms are found in the Report Objects pane. In Grid view, you can add the attribute forms in Report Objects to the report without re-executing the report. For example you can include a cities URL attribute form as a browse attribute form so that your users can choose to display the form on a report.

The Context of Your Business Data: Attributes Project Design Guide7
278 Using attributes to browse and report on data © 2010 MicroStrategy, Inc.
To modify the attribute forms displayed, you can:
• Right-click an attribute on a report or template and select the desired attribute forms
• From the Data menu, select Attribute Display to open the Attribute Display dialog box
For steps to display attribute forms on a report or template, see the online help and the section below.
Defining how attribute forms are displayed by default
You can generally display attribute forms in a number of ways. For example, the Distribution Center attribute in the MicroStrategy Tutorial consists of an ID form group and a Description form. The ID form group is made up of two separate ID columns, Country_ID and Dist_Ctr_ID.
Displayed on a report, the Dist_Ctr_ID form shows the identification numbers of specific distribution centers in the data warehouse. The Description form of Distribution Center, however, displays the actual name of the Distribution Center such as “San Diego.”
You can use the Attribute Editor to determine how the attribute forms are displayed on a report. In the case of the Distribution Center attribute, you can specify whether the identification number of each distribution center, the distribution center names, or both are displayed. You can also determine which attribute forms are displayed when browsing a project with the Data Explorer.
Follow the example procedure below to set one of the Distribution Center attribute’s forms to be displayed in reports and while browsing the MicroStrategy Tutorial project.
You can also use Architect to define how attribute forms are displayed in reports, as described in Modifying how to use attributes to browse and report on data, page 161.
To display an attribute form in reports and in the Data Explorer
1 In the MicroStrategy Tutorial, navigate to the Schema Objects folder, open the Attributes folder, and then the Geography folder.

Project Design Guide The Context of Your Business Data: Attributes 7
© 2010 MicroStrategy, Inc. Using attributes to browse and report on data 279
2 Double-click the Distribution Center attribute. If a message is displayed asking if you want to use read only mode or edit mode, select Edit and click OK to open the Attribute Editor in edit mode so that you can make changes to the attribute. The Attribute Editor opens.
Note the following:
– If you are only given the option of opening the Attribute Editor in read only mode, this means another user is modifying the project’s schema. You cannot open the Attribute Editor in edit mode until the other user is finished with their changes and the schema is unlocked.
– For information on how you can use read only mode and edit mode for various schema editors, see Using read only or edit mode for schema editors, page 93.
3 Click the Display tab.
On the right, in the Report display forms pane, the description form of the Distribution Center is set as the only display form. This means that, when the Distribution Center attribute is used on a report, the actual names of the distribution centers are displayed. The ID 2 form in the Available forms pane represents the distribution centers’ identification numbers.
4 You can set the ID 2 form to be displayed in the following ways:
• To set the ID 2 form as a form that is displayed on a report by default: Select ID 2 from the Available forms pane and click the top > button to add the form to the Report display forms pane on the right.
• To set the ID 2 form so it is displayed in the Data Explorer when a user browses the Distribution Center attribute: Select ID 2 from the Available forms pane and click the bottom > button to add the form to the Browse forms pane on the right.
The Data Explorer makes hierarchies available for users to facilitate placing objects on reports. The Data Explorer is discussed in Enabling hierarchy browsing in reports: Data Explorer, page 299.
5 You can also define the default sort order for attributes on reports and the Data Explorer. For information on attribute form sorting options, see Displaying forms: Attribute form properties, page 238.
6 Because this is only an example, close the Attribute Editor without saving your changes.

The Context of Your Business Data: Attributes Project Design Guide7
280 Using attributes to browse and report on data © 2010 MicroStrategy, Inc.
You can also determine how attributes are displayed while users are editing and viewing reports. See the MicroStrategy Basic Reporting Guide for details.

© 2010 MicroStrategy, Inc. 281
88.CREATING HIERARCHIES TO ORGANIZE AND BROWSE ATTRIBUTES
Introduction
Hierarchies are groupings of attributes that can be displayed, either ordered or unordered, to reflect the relationships that exist between the attributes in a project.
In Chapter 2, The Logical Data Model, you learned how to use hierarchies to group related attributes in practical business areas. For example, you can include a Time hierarchy in your model that consists of Day, Week, Month, and Year attributes.
This chapter discusses hierarchies as they exist in the MicroStrategy environment and provides information on the two different types of hierarchies in MicroStrategy. These types of hierarchies include the system hierarchy and the user hierarchy. The system hierarchy is automatically created when you create a project and is maintained by the relationships that

Creating Hierarchies to Organize and Browse Attributes Project Design Guide8
282 Creating user hierarchies © 2010 MicroStrategy, Inc.
exist among the project’s schema objects. The user hierarchy is a hierarchy which you create specifically for your report designers.
This chapter explores how to create and configure user hierarchies in MicroStrategy and provides additional information about hierarchy functionality in MicroStrategy Desktop.
Creating user hierarchiesIn MicroStrategy Desktop, you create user hierarchies using the Hierarchy Editor or Architect. For an introduction to on user hierarchies and system hierarchies, see Types of hierarchies, page 285.
Follow the procedure below to create a user hierarchy with the Hierarchy Editor. For information on how to use Architect, see Creating user hierarchies using Architect, page 284.

Project Design Guide Creating Hierarchies to Organize and Browse Attributes 8
© 2010 MicroStrategy, Inc. Creating user hierarchies 283
To create a new user hierarchy
1 In MicroStrategy Desktop, log into the project source that contains your project and open the project.
2 In the Folder List, navigate to and open the Schema Objects folder.
3 Open the Hierarchies folder, and then the Data Explorer folder.
4 From the File menu, select New, and then Hierarchy. The Hierarchy Editor opens, followed immediately by the Select Attributes dialog box.
5 In the Available objects pane, select the attributes to use in the hierarchy and click the arrow to add them to the Selected objects pane. Click OK to close the Select Attributes dialog box. The attributes you selected appear in the Hierarchy Viewer.
6 The arrows that connect certain attributes denote a relationship between the connected attributes. You can use these relationships as the browsing or drilling relationships for your hierarchy, or you can create your own.
To create a browsing or drilling relationship, select in the middle of an attribute that is to be enabled to browse to and/or drill down to another attribute. Drag from the middle of the attribute to the related attribute. A browsing and/or drilling relationship is created between the two attributes.
7 To use the hierarchy as a drill hierarchy, select the Use as a drill hierarchy check box at the bottom of the Hierarchy Editor. If you clear this check box, the hierarchy is only used for browsing.
A drill hierarchy can be used for browsing as well as drilling. Drill hierarchies are discussed in Drilling using hierarchies, page 299.
8 Each attribute in a user hierarchy has properties that affect how that attribute is displayed and accessed in a hierarchy. You can right-click an attribute and configure the properties listed below:
• Define Browse Attributes: Defines the attributes to which users can browse to and/or drill to from the selected attribute. These relationships can also be defined by dragging-and-dropping from one attribute to another as described earlier in this procedure.

Creating Hierarchies to Organize and Browse Attributes Project Design Guide8
284 Creating user hierarchies © 2010 MicroStrategy, Inc.
• Define Attribute Filters: Specifies whether the data retrieved and displayed should be complete or filtered by any specific criteria. A filter on a hierarchy acts like a filter in a report. Only data satisfying the filter criteria is displayed (see Filtering attributes in a hierarchy, page 293).
• Set As Entry Point: Specifies whether the user can begin browsing in this hierarchy using this attribute (see Entry point, page 295).
• Element Display: Determines the elements a user can see. The element display may be Locked, Unlocked, or Limited (see Controlling the display of attribute elements, page 289).
9 Click Save and Close. The Save As dialog box opens.
10 Type a name for the hierarchy. Then navigate to the location in which you want to save the hierarchy.
You can save user hierarchies in any folder. However, to make the user hierarchy available for element browsing in the Data Explorer, you must place it in the Data Explorer sub-folder within the Hierarchies folder. This is discussed in Enabling hierarchy browsing in reports: Data Explorer, page 299.
11 From the Schema menu, select Update Schema.
Creating user hierarchies using Architect
Architect can be used to create and modify user hierarchies in a visually integrated environment. Architect allows you to view the tables, attributes, attribute relationships, facts, user hierarchies, and other project objects together as you design your project.
With Architect, you can support all of the features that are available in the Hierarchy Editor. Rather than focusing on one hierarchy at a time with the Hierarchy Editor, you can use Architect to create and modify multiple hierarchies for a project at one time. Review the chapters and sections listed below for information on Architect and steps to create and modify user hierarchies using Architect:
• Chapter 5, Creating a Project Using Architect
• Creating and modifying projects, page 100
• Creating and modifying user hierarchies, page 173

Project Design Guide Creating Hierarchies to Organize and Browse Attributes 8
© 2010 MicroStrategy, Inc. Types of hierarchies 285
Types of hierarchiesThe two types of hierarchies that exist in MicroStrategy include:
• System hierarchy: The system hierarchy is created according to the relationships defined between the attributes in your project. You do not need to create the system hierarchy; it is automatically created in Desktop when you create a project. Although the system hierarchy specifies an ordered set of all attributes in the project, it does not define ordering or grouping among attributes. The ordering and grouping of attributes, among other configurations, is defined in user hierarchies.
• User hierarchy: User hierarchies are groups of attributes and their relationships to each other, arranged in ways that make sense to a business organization. They are user-defined and do not need to follow the logical data model. As the structure of your business intelligence system evolves, you can modify the design of a user hierarchy to include additional attributes or limit user access to certain attributes. This type of hierarchy is created to provide flexibility in element browsing and report drilling. Steps to create user hierarchies are discussed in:
Creating user hierarchies, page 282, which describes creating user hierarchies with the Hierarchy Editor.
Creating and modifying user hierarchies, page 173, which describes creating user hierarchies using Architect.
System hierarchy: Project schema definition
The system hierarchy is the default hierarchy that MicroStrategy sets up for you each time you create a project. It contains all of the attributes in the project and is actually part of the schema definition. When you first create a project, the only hierarchy it contains is the system hierarchy.
The system hierarchy holds information on the relationships between attributes in the project. The system hierarchy cannot be edited but is updated every time you add or remove attribute children or parents in the Attribute Editor, or when you define attribute children in the Project Creation Assistant.
The system hierarchy is useful in determining relationships between all objects in the project. Attributes from the system hierarchy do not need to be part of an explicitly-defined user hierarchy. Any attributes that are not

Creating Hierarchies to Organize and Browse Attributes Project Design Guide8
286 Hierarchy organization © 2010 MicroStrategy, Inc.
assigned to a user hierarchy remain available to the system as report objects, filter conditions, and components of consolidations. These report objects are discussed in detail in the MicroStrategy Advanced Reporting Guide.
You can view the system hierarchy in the Data Explorer or in the Hierarchy Viewer, but not the Hierarchy Editor. You can access the Hierarchy Viewer from Graphical View in the Schema menu. The Hierarchy Viewer is discussed in detail in Using the Hierarchy Viewer, page 302.
User hierarchies: Logical business relationships
User hierarchies are sets of attributes and their relationships, arranged in specific sequences for a logical business organization. You create user hierarchies to define the browse and drill relationships between attributes. For example, you can create a Time hierarchy that contains the Year, Quarter, Month, and Day attributes. When you browse the attributes in the Data Explorer, you can double-click Year to get to Quarter and double-click Quarter to get to Month, and so on.
Whereas browsing occurs through the Data Explorer, in drilling the user actually chooses to move to higher or lower levels on a report or move across to levels within different hierarchies. For example, if the user drills on the Quarter attribute in a report, he or she can drill down to Month, up to Year, or across to an attribute within another hierarchy.
You can create user hierarchies in the Hierarchy Editor using one or more attributes from the system hierarchy.
A user hierarchy is the only type of hierarchy you can define, and you can create any number of user hierarchies for each project. You should define user hierarchies that correspond to specific areas of your company business model and data warehouse schema.
Hierarchy organizationThe best design for a user hierarchy is to organize or group attributes into logical business areas. This allows users to more easily locate attributes in a project and navigate from one attribute to another. For example, you can place related attributes into hierarchies by their level.

Project Design Guide Creating Hierarchies to Organize and Browse Attributes 8
© 2010 MicroStrategy, Inc. Hierarchy organization 287
The example below demonstrates the Location and Customer hierarchies. Within the Location hierarchy, State, City, and Store are organized according to their relationships to each other. The Customer hierarchy also groups together the attributes Company, Contact, and Customer.
When creating user hierarchies, keep in mind that hierarchies do not have to be separate from one another or necessarily follow the dimensional structure of your logical data model.
Hierarchy structure
While both a system hierarchy and user hierarchy allow you to navigate attributes in your project, only the user hierarchy allows you to logically define and order groups of attributes.
The rest of this chapter discusses user hierarchies and how to create and configure them in your project.
When you group attributes together into user hierarchies, you are developing a working design of the display and browse functions of the attributes. In the example below, there are two instances of the Region hierarchy. One hierarchy demonstrates Region having multiple States and the States having multiple Stores.
This hierarchy allows you to create drilling and browsing options to the lower levels to view Region, State, and Store on a report. However, if you only

Creating Hierarchies to Organize and Browse Attributes Project Design Guide8
288 Configuring hierarchy display options © 2010 MicroStrategy, Inc.
include Store in the Region hierarchy, as in the second example, then the only options for drilling or browsing are the Region and Store levels.
Viewing hierarchies: Hierarchy Viewer
The Hierarchy Viewer graphically represents user hierarchies and the system hierarchy. In the system hierarchy, the connections between the attributes represent the parent-child relationships. In user hierarchies, the connections show the browse paths between the attributes. The Aerial perspective provides an overview of hierarchies; its decreased scale allows you to navigate through the entire project.
The Hierarchy Viewer is accessed from the Graphical View option in the Schema menu. The Hierarchy Viewer is discussed in further detail in Using the Hierarchy Viewer, page 302.
Configuring hierarchy display optionsEach attribute in a user hierarchy has properties that affect how that attribute is displayed and accessed in a hierarchy. You can use the Hierarchy Editor to configure each of these properties, as shown in the following procedures:
• Element Display: Determines the elements a user can see. The element display may be locked, unlocked, or limited (see Controlling the display of attribute elements, page 289).

Project Design Guide Creating Hierarchies to Organize and Browse Attributes 8
© 2010 MicroStrategy, Inc. Configuring hierarchy display options 289
• Attribute Filters: Specifies whether the data retrieved and displayed should be complete or filtered by any specific criteria. A filter on a hierarchy acts like a filter in a report. Only data satisfying the filter criteria is displayed (see Filtering attributes in a hierarchy, page 293).
• Entry Point/Not an Entry Point: Specifies whether the user can begin browsing in this hierarchy using this attribute (see Entry point, page 295).
• Browse Attributes: Shows the attributes to which users can browse from a given attribute. Represented by lines that connect one attribute to others (see Hierarchy browsing, page 296).
The following sections explain these properties and how to use the Hierarchy Editor to configure each.
Controlling the display of attribute elements
The sections listed below describe various techniques to control the display of attribute elements:
• Locked/Unlocked attribute elements, page 289
• Limited attribute elements, page 291
Locked/Unlocked attribute elements
Locking a hierarchy prevents a user from viewing all elements of the specific attribute and any lower level attributes in the hierarchy. A hierarchy is referred to as locked when at least one attribute within that hierarchy has the Element Display option set to Locked. Anything higher in the hierarchy is still visible.
You can lock the hierarchy to restrict the user from viewing elements and lower level attributes for security reasons or to better manage lengthy hierarchies. By restricting the view of attribute elements and lower level attributes in the Data Explorer, you can prevent the expansion of long attribute element lists that can consume system resources. When you set the element display to locked, a padlock icon appears next to the attribute name.

Creating Hierarchies to Organize and Browse Attributes Project Design Guide8
290 Configuring hierarchy display options © 2010 MicroStrategy, Inc.
For example, the attribute Order is locked in the Data Explorer sample shown below.
While the user can view the attribute elements of Customer Region and Customer City, he or she cannot view information about each customer’s order. The Order attribute may be locked in order to prevent unauthorized users from accessing sensitive information about customer orders.
Prerequisites
• A hierarchy has been created.
To lock or unlock an attribute in a hierarchy
1 In MicroStrategy Desktop, open a hierarchy using either the Hierarchy Editor or Architect, as described below:
• Locate a hierarchy in the Folder List, right-click the hierarchy, and select Edit. The Hierarchy Editor opens.
• From the Schema menu, select Architect. MicroStrategy Architect opens.
From the Hierarchy View, in the Hierarchies drop-down list, select a hierarchy.
If a message is displayed asking if you want to use read only mode or edit mode, select Edit and click OK to open the schema editor in edit mode so that you can make changes to the hierarchy.
Note the following:
– If you are only given the option of using read only mode, this means another user is modifying the project’s schema. You cannot use edit mode until the other user is finished with their changes and the schema is unlocked.
Project Design Guide Creating Hierarchies to Organize and Browse Attributes 8
© 2010 MicroStrategy, Inc. Configuring hierarchy display options 291
– For information on how you can use read only mode and edit mode for various schema editors, see Using read only or edit mode for schema editors, page 93.
2 Lock or unlock an attribute using the options listed below:
• To lock an attribute, right-click an attribute, point to Element Display, and then select Locked. A padlock icon appears next to the locked attribute, and users can no longer view elements of this attribute.
• To unlock a locked attribute, right-click an attribute, point to Element Display, and then select Unlocked. The padlock icon is removed from the attribute, and users can now view the elements of this attribute.
3 In the Hierarchy Editor or Architect, click Save and Close to save your changes and return to Desktop.
4 From the Schema menu, select Update Schema.
You can also lock and unlock attributes when you edit them in the Display tab of the Attribute Editor. However, this locks and unlocks the attributes within the system hierarchy, not any user hierarchies that contain the attributes. For example, if the attribute Year is locked in the Attribute Editor, no elements for Year display in the Data Explorer when Year is expanded.
Limited attribute elements
Another way to restrict users from viewing attribute elements in the Data Explorer is to limit the number of elements that appear at one time. This method is useful when there are extensive attribute elements in a hierarchy. Instead of loading all attribute elements at once, you can set the limit to five or ten at a time. Also, retrieving a large number of elements at once can negatively impact system performance. The user can then click the arrows to see the next set of elements for that attribute.
For example, the Chocolate subcategory, shown below, contains many items. Rather than displaying all of them at once and overwhelming the user, a limit

Creating Hierarchies to Organize and Browse Attributes Project Design Guide8
292 Configuring hierarchy display options © 2010 MicroStrategy, Inc.
of five items has been set. The following graphic displays this view in the Data Explorer.
Prerequisites
• A hierarchy has been created.
To limit the display of attributes in a hierarchy
1 In MicroStrategy Desktop, open a hierarchy using either the Hierarchy Editor or Architect, as described below:
• Locate a hierarchy in the Folder List, right-click the hierarchy, and select Edit. The Hierarchy Editor opens.
• From the Schema menu, select Architect. MicroStrategy Architect opens.
From the Hierarchy View, in the Hierarchies drop-down list, select a hierarchy.
If a message is displayed asking if you want to use read only mode or edit mode, select Edit and click OK to open the schema editor in edit mode so that you can make changes to the hierarchy.
Note the following:
– If you are only given the option of using read only mode, this means another user is modifying the project’s schema. You cannot use edit mode until the other user is finished with their changes and the schema is unlocked.
– For information on how you can use read only mode and edit mode for various schema editors, see Using read only or edit mode for schema editors, page 93.
2 Right-click the attribute to limit, point to Element Display, and then select Limit. The Limit dialog box opens.

Project Design Guide Creating Hierarchies to Organize and Browse Attributes 8
© 2010 MicroStrategy, Inc. Configuring hierarchy display options 293
3 Type the number of elements to display at one time and click OK.
4 In the Hierarchy Editor or Architect, click Save and Close to save your changes and return to Desktop.
5 From the Schema menu, select Update Schema.
Filtering attributes in a hierarchy
Before reading this section, refer to the Filters chapter in the MicroStrategy Advanced Reporting Guide to understand what filters are and how to create them in MicroStrategy.
You can add filters to a hierarchy to control how data is retrieved and displayed. With a filter you can choose exactly which attribute elements to display in a hierarchy. For example, you can filter a hierarchy so that data for only one quarter is displayed, or data for only a few days of one quarter. Filters make data retrieval faster by only allowing specific data to be displayed.
You cannot use a prompt-based filter to filter a hierarchy.
Each attribute in the hierarchy can have multiple filters applied to it. When filtering attributes in a hierarchy, you are limiting the elements of the data returned when you browse the Data Explorer. Creating a limited hierarchy reduces the number of elements displayed at one time. Filters, however, limit the elements a user is allowed to see and therefore, perform a type of security.
Filters increase efficiency when retrieving data because you can limit user access to parts of a hierarchy when you apply filters to attributes. The filters allow the Data Explorer to display only the criteria you select, and the user is unable to see additional data in the hierarchy.
For example, you want to view only those customers who are younger than 30 years old. First, create a filter on Customer Age less than 30. In the Hierarchy Editor, add the filter to the Customer attribute. Update the project schema, and view the Customer hierarchy in the Data Explorer. Only those customers younger than 30 years old are displayed.
When adding filters to an attribute in a hierarchy, you need to make sure that each filter is relevant to the attribute’s information. MicroStrategy does not validate that the associated filter makes sense on that attribute.

Creating Hierarchies to Organize and Browse Attributes Project Design Guide8
294 Configuring hierarchy display options © 2010 MicroStrategy, Inc.
Prerequisites
• A filter has been created.
• A hierarchy has been created.
To apply a filter to an attribute in a hierarchy
1 In MicroStrategy Desktop, open a hierarchy using either the Hierarchy Editor or Architect, as described below:
• Locate a hierarchy in the Folder List, right-click the hierarchy, and select Edit. The Hierarchy Editor opens.
• From the Schema menu, select Architect. MicroStrategy Architect opens.
From the Hierarchy View, in the Hierarchies drop-down list, select a hierarchy.
If a message is displayed asking if you want to use read only mode or edit mode, select Edit and click OK to open the schema editor in edit mode so that you can make changes to the hierarchy.
Note the following:
– If you are only given the option of using read only mode, this means another user is modifying the project’s schema. You cannot use edit mode until the other user is finished with their changes and the schema is unlocked.
– For information on how you can use read only mode and edit mode for various schema editors, see Using read only or edit mode for schema editors, page 93.
2 Right-click the attribute to filter and select Define Attribute Filters.
3 If a tip about filtering opens, click OK. The Select Objects dialog box opens.
4 In the Available objects pane, select the filters to apply and click > to add them to the Selected objects pane.
5 Click OK to close the Select Objects dialog box. The attribute to which you applied the filter appears in the hierarchy with a filter icon.

Project Design Guide Creating Hierarchies to Organize and Browse Attributes 8
© 2010 MicroStrategy, Inc. Configuring hierarchy display options 295
6 In the Hierarchy Editor or Architect, click Save and Close to save your changes and return to Desktop.
Entry point
An entry point is a shortcut to an attribute in the Data Explorer. Creating an entry point grants users faster access to the attribute without having to browse through multiple attributes to reach different levels in a hierarchy. This is especially useful when accessing frequently-used attributes.
When you create a user hierarchy, the hierarchy, the attributes, and their elements appear in the Data Explorer. When you set an attribute to be an entry point, you are creating a shorter route to access that attribute. For example, a typical hierarchy is Time. When you click on Time, elements for each Year, such as 2007, 2006, and 2005, open. When you click on 2006, an element for each Quarter, such as Q1, Q2, Q3, and Q4, opens. If you are seeking Week 24, you need to open several levels of attributes to reach the correct data level, which is Week. If you set the attribute Week as an entry point, the attribute Week appears in the Data Explorer at the same level as Year. If an attribute is not set to be an entry point, it appears in its normal position within the hierarchy structure.
If you set a locked attribute as an entry point, it still appears in the hierarchy but with a padlock icon. You can see the locked attribute, but are unable to access elements or attributes below that level.
Prerequisites
• A hierarchy has been created.
To create entry points in a hierarchy
1 In MicroStrategy Desktop, open a hierarchy using either the Hierarchy Editor or Architect, as described below:
• Locate a hierarchy in the Folder List, right-click the hierarchy, and select Edit. The Hierarchy Editor opens.
• From the Schema menu, select Architect. MicroStrategy Architect opens.
From the Hierarchy View, in the Hierarchies drop-down list, select a hierarchy.
Creating Hierarchies to Organize and Browse Attributes Project Design Guide8
296 Configuring hierarchy display options © 2010 MicroStrategy, Inc.
If a message is displayed asking if you want to use read only mode or edit mode, select Edit and click OK to open the schema editor in edit mode so that you can make changes to the hierarchy.
Note the following:
– If you are only given the option of using read only mode, this means another user is modifying the project’s schema. You cannot use edit mode until the other user is finished with their changes and the schema is unlocked.
– For information on how you can use read only mode and edit mode for various schema editors, see Using read only or edit mode for schema editors, page 93.
2 Right-click the attribute to set as an entry point, and select Set As Entry Point. The attribute is marked with a green check mark to denote that it is an entry point.
To remove an entry point from an attribute, right-click an attribute and select Remove Entry Point.
3 In the Hierarchy Editor or Architect, click Save and Close to save your changes and return to Desktop.
4 From the Schema menu, select Update Schema.
Hierarchy browsing
Once you choose which attributes to place in a hierarchy, you can define the relationships between them. These relationships determine how users can browse the attributes from the Hierarchies folder.

Project Design Guide Creating Hierarchies to Organize and Browse Attributes 8
© 2010 MicroStrategy, Inc. Configuring hierarchy display options 297
For example, if Catalog, Category, Subcategory, and Item are the attributes that comprise the user hierarchy Catalog Items, the hierarchy resembles the example below, showing the parent/child relationships between the attributes. For example, in the hierarchy below, Category is a parent attribute of Category and Category is the child attribute of Category.
A user hierarchy does not need to have these direct relationships defined. It can simply be a collection of attributes.
Attributes in a hierarchy can have both browsing and drilling relationships between them. Browse attributes are attributes you specify a user can directly browse to from a given attribute in the user hierarchy. When you apply browse attributes to attributes in a hierarchy, you are specifying what levels of detail are visible when browsing the Data Explorer. Including hierarchies in the Data Explorer makes the hierarchies available for reports and to users in the project. For more information on including hierarchies in the Data Explorer, see Enabling hierarchy browsing in reports: Data Explorer, page 299.
For each attribute in a hierarchy, you can assign one or more browse attributes to it. Using the example above, some of these attributes have been assigned a browse attribute. Specifically:
Hierarchy Attribute Browse Attribute(s)
Catalog Category, Subcategory
Category Subcategory
Subcategory Catalog, Item
Item

Creating Hierarchies to Organize and Browse Attributes Project Design Guide8
298 Configuring hierarchy display options © 2010 MicroStrategy, Inc.
The addition of these browse attributes allows users to see the Subcategory elements directly from the Catalog attribute, without having to first browse down through the Category attributes to get to Subcategory. The ability to browse more directly through the hierarchy can be represented as shown below.
In the Data Explorer, the hierarchy described above resembles the example below.
Users can now view the subcategories in the catalog without first having to browse through the categories.

Project Design Guide Creating Hierarchies to Organize and Browse Attributes 8
© 2010 MicroStrategy, Inc. Configuring hierarchy display options 299
Enabling hierarchy browsing in reports: Data Explorer
You can make hierarchies available for browsing and including in reports by storing the hierarchies in the Data Explorer. Moving hierarchies to and from this folder also allows you to keep some hierarchies visible to users while hiding others. The Data Explorer is a tool in the Object Browser that holds the system hierarchy and the user hierarchies. When you create a new project, the system hierarchy for that project is automatically placed in the Data Explorer.
You can save user hierarchies in any folder. However, to make a user hierarchy available for browsing in the Data Explorer you must place it in the Data Explorer folder—a subfolder of the Hierarchies folder, which is located in the Schema Objects folder.
Drilling using hierarchies
Drilling is a function in MicroStrategy reports that allows users to browse different levels of attributes along specified paths. Depending on the level of the attributes included in the drilling specification, reports can allow users to drill down, up, and across to different levels of detail.
When a user selects a drilling path in a report, the report refreshes to display the selected level of detail. For example, on a report with the Year attribute and Revenue metric, the user can drill down on the Year attribute to a lower level attribute such as the Month attribute. A new report is automatically executed; on the new report, Revenue data is reported at the Month level.
You can make user hierarchies available for drilling. This option enables you to determine, at a project level, the attributes to which users can drill from other attributes. In the example of the Year and Month attributes, drilling is enabled in the Time hierarchy, which contains the two attributes. This allows a user to drill down from Year to Month and, if they need to, drill back up from Month to Year.
To enable a user hierarchy as a drill path, you must enable the user hierarchy to be used as a drill hierarchy in the Hierarchy Editor. If a user hierarchy is not enabled, the default drill path is defined by the System Hierarchy.
Therefore, you can think of browsing paths in a user hierarchy as potential drilling paths. For example, in the following hierarchy, Subcategory is a browse attribute of Catalog, which means that you can access the elements of Subcategory without having to necessarily access the elements of Catalog in Data Explorer. If you enable drilling in this hierarchy, you can drill from

Creating Hierarchies to Organize and Browse Attributes Project Design Guide8
300 Configuring hierarchy display options © 2010 MicroStrategy, Inc.
Catalog down to Subcategory—and any other browse attributes of Catalog—on a report.
A drill hierarchy can be used for browsing as well as drilling. However, the way in which you browse attributes may not be the same way in which you drill on attributes in reports. If your drilling and browsing paths between attributes are different, you should create separate drilling and browsing hierarchies.
Prerequisites
• A hierarchy has been created.
To define a user hierarchy as a drill hierarchy
1 In MicroStrategy Desktop, open a hierarchy using either the Hierarchy Editor or Architect, as described below.
• Locate a hierarchy in the Folder List, right-click the hierarchy, and select Edit. The Hierarchy Editor opens.
• From the Schema menu, select Architect. MicroStrategy Architect opens.
From the Hierarchy View, in the Hierarchies drop-down list, select a hierarchy.

Project Design Guide Creating Hierarchies to Organize and Browse Attributes 8
© 2010 MicroStrategy, Inc. Using the Hierarchy Viewer and Table Viewer 301
If a message is displayed asking if you want to use read only mode or edit mode, select Edit and click OK to open the schema editor in edit mode so that you can make changes to the hierarchy.
Note the following:
– If you are only given the option of using read only mode, this means another user is modifying the project’s schema. You use cannot edit mode until the other user is finished with their changes and the schema is unlocked.
– For information on how you can use read only mode and edit mode for various schema editors, see Using read only or edit mode for schema editors, page 93.
2 To define a user hierarchy as a drill hierarchy:
• With the Hierarchy Editor, select the Use as a drill hierarchy check box located at the bottom of the Hierarchy Editor.
• With Architect, right-click within the Hierarchy View and select Use As a drill hierarchy.
3 In the Hierarchy Editor or Architect, click Save and Close to save your changes and return to Desktop.
4 From the Schema menu, select Update Schema.
After a user hierarchy is enabled for drilling, the hierarchy contributes to the drilling path of any attributes in it. Additional information on drilling is available in the MicroStrategy Advanced Reporting Guide.
Using the Hierarchy Viewer and Table ViewerThrough the Hierarchy Viewer, MicroStrategy Architect gives you the ability to view the system hierarchy as well as all of your user hierarchies in a single place. The Table Viewer is another tool within MicroStrategy Architect that provides you with a bird’s eye view of some of the information within your project. It is used to view all of the tables in your project graphically.

Creating Hierarchies to Organize and Browse Attributes Project Design Guide8
302 Using the Hierarchy Viewer and Table Viewer © 2010 MicroStrategy, Inc.
Using the Hierarchy Viewer
The Hierarchy Viewer allows you to select the hierarchy you want to examine, and also allows you direct access to the attributes that comprise it. You can use the Hierarchy Viewer to view either the system hierarchy or any of your user hierarchies.
• When you view the system hierarchy, you can see the actual relationships between attributes, as defined by the system when the project was created.
• When you view a user hierarchy, you do not see true attribute relationships, but rather the structure of the user hierarchy as defined by a project designer, to facilitate user browsing and report development.
The Hierarchy Viewer gives you flexibility over how much of a given hierarchy you choose to view at once. You can see all of the entry points into a hierarchy at once, or you may select only one at a time. For details on entry points, see Entry point, page 295.
The Hierarchy Viewer also gives you direct access to any of the attributes in the hierarchy you choose to view. When you access a hierarchy’s attributes directly, you can define them as entry points. See Entry point, page 295 for more details on creating entry points.
To view the system hierarchy in the Hierarchy Viewer
1 In MicroStrategy Desktop, from the Schema menu, select Graphical View.
2 Select Hierarchies.
To view a user hierarchy in the Hierarchy Viewer
1 In the Hierarchy Viewer, from the Hierarchy menu, select the hierarchy to view.
2 Attributes that have a green check mark next to them are entry points. See Entry point, page 295 for more details on creating entry points.

Project Design Guide Creating Hierarchies to Organize and Browse Attributes 8
© 2010 MicroStrategy, Inc. Using the Hierarchy Viewer and Table Viewer 303
To edit an attribute from the Hierarchy Viewer
1 In the Hierarchy Viewer, right-click the attribute to edit.
2 Select Edit.
In the Hierarchy Viewer, the Aerial perspective provides an overview of the hierarchies in your project. Its decreased scale allows you to navigate through the entire project.
To access Aerial perspective mode in the Hierarchy Viewer
1 In the Hierarchy Viewer, from the View menu, select Aerial perspective. An aerial view of the hierarchy you are currently viewing is displayed. The green squares indicate attributes that are entry points.
2 The hierarchy in the Hierarchy Viewer shifts according to where you navigate in the aerial view. Click a section of the aerial view display to shift your view of a hierarchy to that particular section.
Using the Table Viewer
The Table Viewer allows you to view all of the tables in your project as well as the joins and/or relationships between those tables and the names of the individual columns in each table.
The tables that are displayed here are logical tables. They represent and indicate how Architect sees the tables that were brought into the project when it was created.
If you make changes to the actual tables in the data warehouse, you will need to update the logical table structure. See The size of tables in a project: Logical table size, page 349 for information on updating logical table structures.
You can also view all of this information using Architect, which is described in Chapter 5, Creating a Project Using Architect.

Creating Hierarchies to Organize and Browse Attributes Project Design Guide8
304 Using the Hierarchy Viewer and Table Viewer © 2010 MicroStrategy, Inc.
To view your project’s tables in the Table Viewer
1 In MicroStrategy Desktop, from the Schema menu, select Graphical View.
2 Select Tables.
To view more or less information about each table in the project
1 Open the Table Viewer, as described above.
2 In the Table Viewer, select Options.
3 From the Options menu, select or clear the options for any of the following, depending on what you want to see in the Table Viewer:
• Show joins
• Use circular joins
• Show relationships
• Show relationship types
• Show columns

© 2010 MicroStrategy, Inc. 305
99.OPTIMIZING AND MAINTAINING YOUR PROJECT
Introduction
Once your MicroStrategy project is set up and populated with schema objects, you are ready to start thinking about ways to better maintain the project and optimize it for both the short and long term.
This chapter introduces you to maintenance and optimization concepts such as tuning the interaction between your data warehouse and your project, creating aggregate tables, and using partition mapping, and explains how to use these methods to enhance your project. You can find this information in the sections listed below:
• Updating your MicroStrategy project schema, page 306—As you continue to enhance the design and functionality of your project, you will need to make various schema changes. To see any enhancements and changes to your project schema, you must update your project schema.
• Data warehouse and project interaction: Warehouse Catalog, page 308—As your data warehouse changes to meet new data logging requirements, your project must reflect these changes. This can include adding new tables to your project or removing tables that are no longer used. You can also tune the interaction between your data warehouse and

Optimizing and Maintaining Your Project Project Design Guide9
306 Updating your MicroStrategy project schema © 2010 MicroStrategy, Inc.
your MicroStrategy project to bring your data into MicroStrategy in a way that meets your requirements.
• Accessing multiple data sources in a project, page 330— With the MultiSource Option feature of Intelligence Server, you can connect a project to multiple relational data sources. This allows you to integrate all your information from various databases and other relational data sources into a single MicroStrategy project for reporting and analysis purpose.
• Improving database insert performance: parameterized queries, page 341— MicroStrategy’s support for parameterized queries can improve performance in scenarios that require the insert of information into a database.
• Using summary tables to store data: Aggregate tables, page 343—Aggregate tables store data at higher levels than the data was originally collected in the data warehouse. These summary tables provide quicker access to frequently-used data, reduce input/output and other resource requirements, and minimize the amount of data that must be aggregated and sorted at run time.
• Dividing tables to increase performance: Partition mapping, page 350—Partition mapping involves the division of large logical tables into smaller physical tables. Partitions improve query performance by minimizing the number of tables and records within a table that must be read to satisfy queries issued against the warehouse.
Updating your MicroStrategy project schemaAll of the schema objects—facts, attributes, hierarchies, transformations, and so on—in your project come together to form your project’s schema.
Although the concepts are related, the project schema is not the same as the physical warehouse schema. Rather, the project schema refers to an internal map that MicroStrategy uses to keep track of attribute relationships, fact levels, table sizes, and so on within the project.
Whenever you make any changes to a schema object you must indicate to MicroStrategy that new schema object definitions have been included and that these definitions need to be loaded into memory.

Project Design Guide Optimizing and Maintaining Your Project 9
© 2010 MicroStrategy, Inc. Updating your MicroStrategy project schema 307
You can do any of the following to update your project schema:
• Stop and restart MicroStrategy Intelligence Server, if in server-connected (3-tier) mode.
• Disconnect and reconnect to the project or the project source, if in direct (2-tier) mode.
• Manually update the schema.
Manually updating the schema allows you to determine which specific elements of the schema are updated.
To manually update the schema
1 In MicroStrategy Desktop, from the Schema menu, select Update Schema.
2 In the Schema Update dialog box, select or clear the following check boxes:
• Update schema logical information: Use this option if you added, modified, or deleted a schema object.
• Recalculate table keys and fact entry levels: Use this option if you changed the key structure of a table or if you changed the level at which a fact is stored.
• Recalculate table logical sizes: Use this option to use MicroStrategy Desktop’s algorithm to recalculate logical table sizes and override any modifications that you have made to logical table sizes.
Logical table sizes are a significant part of how the MicroStrategy SQL Engine determines the tables to use in a query.
• Recalculate project client object cache size: Use this option to update the object cache size for the project.
3 Click Update.
You can also update the schema with the last saved settings by clicking the Update Schema icon in the toolbar.

Optimizing and Maintaining Your Project Project Design Guide9
308 Data warehouse and project interaction: Warehouse Catalog © 2010 MicroStrategy, Inc.
Data warehouse and project interaction: Warehouse Catalog
This section discusses how the Warehouse Catalog can control the interaction between the data warehouse and the database instance for a project. The Warehouse Catalog queries the data warehouse and lists the tables and columns that exist in it. From this list, you can select the tables to add to your project. Every project can have a unique set of warehouse tables.
You can add warehouse tables to your project with the Warehouse Catalog, MicroStrategy Project Builder, or Architect. The Warehouse Catalog is better than Project Builder for maintaining the warehouse tables used for an existing project. Adding tables through Project Builder is useful only when you are creating a project for the first time, as later, adding tables in the project through Project Builder can become a cumbersome process. For information on Architect, see Chapter 5, Creating a Project Using Architect.
This section also discusses customizing catalog SQL statements, the structure of the SQL catalogs, and the default SQL statements used for each database.
This section covers the following topics:
• Before you begin using the Warehouse Catalog, page 309
• Accessing the Warehouse Catalog, page 309
• Adding and removing tables for a project, page 310
• Managing warehouse and project tables, page 311
• Modifying data warehouse connection and operation defaults, page 316
• Customizing catalog SQL statements, page 323
• Troubleshooting table and column messages, page 328
Note the following:
• You can also add tables to a project using MicroStrategy Query Builder. For more information on Query Builder, see the MicroStrategy Advanced Reporting Guide.

Project Design Guide Optimizing and Maintaining Your Project 9
© 2010 MicroStrategy, Inc. Data warehouse and project interaction: Warehouse Catalog 309
• You can connect to MDX Cube sources such as SAP BI, Hyperion Essbase, and Microsoft Analysis Services instead of a relational database. In this case, the MDX Cube Catalog handles tasks similar to the Warehouse Catalog. For more information, refer to the MicroStrategy MDX Cube Reporting Guide.
Before you begin using the Warehouse Catalog
Before you begin using the Warehouse Catalog, you need to be familiar with:
• Your schema, so you know how the information in your data warehouse should be brought into MicroStrategy
• How to create a project
Accessing the Warehouse Catalog
To access the Warehouse Catalog
1 On the Windows Start menu, point to Programs, then to MicroStrategy, then Desktop, and then select Desktop.
2 Log in to the project source that contains your project in MicroStrategy Desktop, and expand the project source to select your project.
You must use a login that has Architect privileges. For more information about privileges see the Permissions and Privileges appendix of the MicroStrategy System Administration Guide.
3 If you are using read only mode for the project, from the Schema menu, clear the Read Only Mode option to switch to edit mode.
Only one user can be editing a project at a given time. Therefore, if someone else is modifying the project, you cannot use the Warehouse Catalog. For more information on read only mode and edit mode, see Using read only or edit mode for schema editors, page 93.
4 From the Schema menu, select Warehouse Catalog. The Warehouse Catalog opens after it retrieves the table information from the warehouse database.

Optimizing and Maintaining Your Project Project Design Guide9
310 Data warehouse and project interaction: Warehouse Catalog © 2010 MicroStrategy, Inc.
Adding and removing tables for a project
As you become aware of the additional needs of report designers and users, it may become necessary to add additional tables from the data warehouse to your project. Also, as your project matures, you may need to remove tables from your project that are no longer used and are taking up space in the metadata.
You can access the Warehouse Catalog at any time to add additional tables from your data warehouse to your project and remove tables from your project.
For information on removing tables from a project that were removed from a data source, see Removing tables from the Warehouse Catalog that have been removed from their data source, page 314.
To add or remove tables after creating a project
1 Access the Warehouse Catalog for your project as described in To access the Warehouse Catalog, page 309. Log in to the project source that contains your project in MicroStrategy Desktop, and expand your project.
2 The left side of the Warehouse Catalog lists all available tables and the number of rows each table contains. The list on the right shows all the tables already being used in the project:
• To add tables: From the left side, select the tables you want to add to the Warehouse Catalog, and click > to add the selected tables. Click >> to add all the listed tables.
• To remove tables: From the left side, select the tables you want to add to the Warehouse Catalog, and click > to add the selected tables. Click >> to add all the listed tables.
• If you have a license for the MultiSource Option, you can add tables from multiple data sources into your project. For information on adding tables from multiple data sources into your project with the Warehouse Catalog, see Accessing multiple data sources in a project, page 330.
3 In the toolbar, click Save and Close to save your changes to the Warehouse Catalog. The table definitions are written to the metadata. This process can take some time to complete.

Project Design Guide Optimizing and Maintaining Your Project 9
© 2010 MicroStrategy, Inc. Data warehouse and project interaction: Warehouse Catalog 311
4 Update the project schema from the Schema menu, by selecting Update Schema.
Managing warehouse and project tables
The Warehouse Catalog allows you to view tables that have been included in the project, as well as those tables that are available in the warehouse but have not been included in the project. To access the Warehouse Catalog for a project, see Accessing the Warehouse Catalog, page 309.
As you make changes to the tables in the warehouse, you need to periodically load the updates into the Warehouse Catalog. You can update it by selecting Read the Warehouse Catalog from the Actions menu.
The Warehouse Catalog has the following sections:
• Select current database instance: From the drop-down list, select the database instance for the data source to view tables for. This option is available as part of MicroStrategy MultiSource Option, which allows you to access multiple data sources in a project, as described in Accessing multiple data sources in a project, page 330.
• Tables available in the database instance: Displays tables that are located in the data source for the selected database instance, but have not been included in the project. You can add tables to the project by double-clicking the tables or by selecting the tables and then clicking >.
• Tables being used in the project: Displays tables that have been selected to be part of the project. You can remove tables from the project by double-clicking the tables or by selecting the tables and then clicking <.
You can add or remove all the tables from one section to the other by clicking << and >> buttons.
Warehouse Catalog has the following menu options.
Menu Description
File
• Save Saves the current settings and status of the Warehouse Catalog.
• Exit Exits the Warehouse Catalog.
Tools
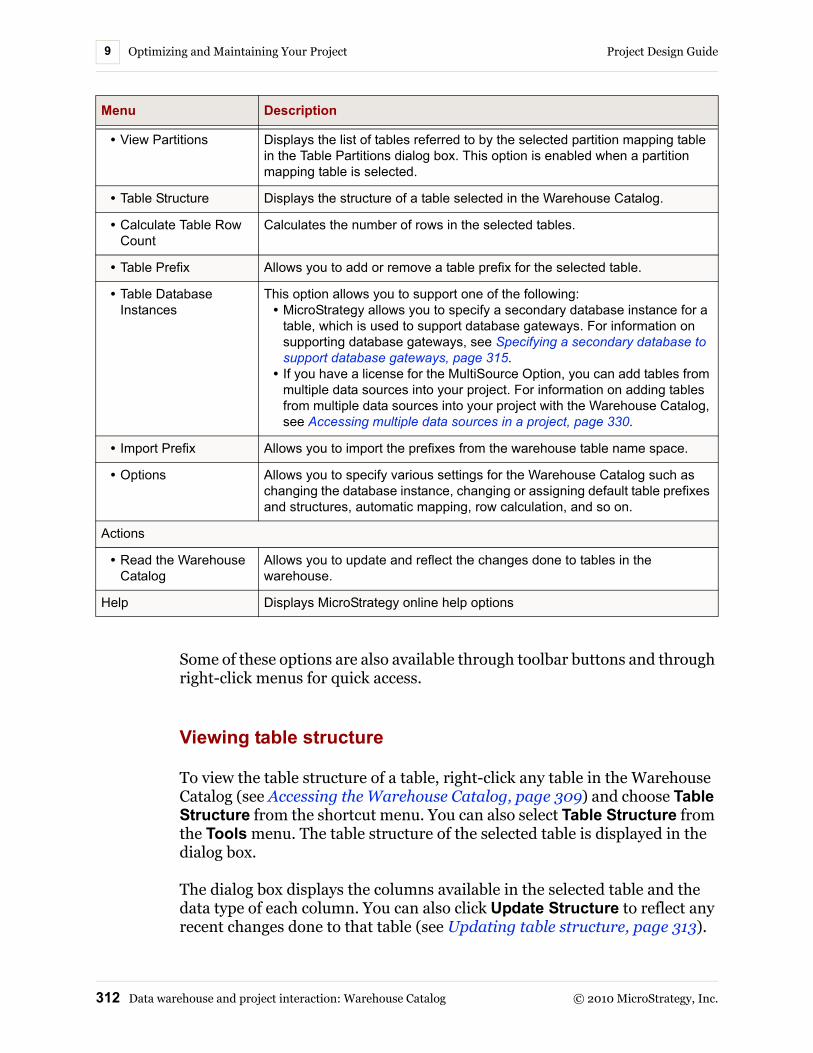
Optimizing and Maintaining Your Project Project Design Guide9
312 Data warehouse and project interaction: Warehouse Catalog © 2010 MicroStrategy, Inc.
Some of these options are also available through toolbar buttons and through right-click menus for quick access.
Viewing table structure
To view the table structure of a table, right-click any table in the Warehouse Catalog (see Accessing the Warehouse Catalog, page 309) and choose Table Structure from the shortcut menu. You can also select Table Structure from the Tools menu. The table structure of the selected table is displayed in the dialog box.
The dialog box displays the columns available in the selected table and the data type of each column. You can also click Update Structure to reflect any recent changes done to that table (see Updating table structure, page 313).
• View Partitions Displays the list of tables referred to by the selected partition mapping table in the Table Partitions dialog box. This option is enabled when a partition mapping table is selected.
• Table Structure Displays the structure of a table selected in the Warehouse Catalog.
• Calculate Table Row Count
Calculates the number of rows in the selected tables.
• Table Prefix Allows you to add or remove a table prefix for the selected table.
• Table Database Instances
This option allows you to support one of the following:• MicroStrategy allows you to specify a secondary database instance for a
table, which is used to support database gateways. For information on supporting database gateways, see Specifying a secondary database to support database gateways, page 315.
• If you have a license for the MultiSource Option, you can add tables from multiple data sources into your project. For information on adding tables from multiple data sources into your project with the Warehouse Catalog, see Accessing multiple data sources in a project, page 330.
• Import Prefix Allows you to import the prefixes from the warehouse table name space.
• Options Allows you to specify various settings for the Warehouse Catalog such as changing the database instance, changing or assigning default table prefixes and structures, automatic mapping, row calculation, and so on.
Actions
• Read the Warehouse Catalog
Allows you to update and reflect the changes done to tables in the warehouse.
Help Displays MicroStrategy online help options
Menu Description

Project Design Guide Optimizing and Maintaining Your Project 9
© 2010 MicroStrategy, Inc. Data warehouse and project interaction: Warehouse Catalog 313
When the data type of one or more columns is modified, you get a warning message of this change, which provides the following options:
• Click OK to apply the change to this column in all the tables it appears.
• Click Cancel to undo all data type changes. This action results in no changes being applied to any tables or columns.
The warning message appears only if you have selected the Display a warning if the columns data types are modified when updating the table structure option in the Warehouse Catalog Options dialog box. This option is selected by default.
Updating table structure
Whenever the structure of the warehouse table changes you have to update the table structure in the Warehouse Catalog for the changes to reflect in the MicroStrategy system. Some examples of these type of changes are when you add, delete, or rename a column in a table associated with a project,
To update the structure of a table
1 Access the Warehouse Catalog for your project (see Accessing the Warehouse Catalog, page 309). The Warehouse Catalog opens.
2 In the Tables being used in the project list, right-click the table that has changed and select Update Structure.
If the data type of one or more columns is modified, you receive a message warning of this change. Verify the changes from the information dialog box that opens and click OK to apply the change in this column to all the tables in which it appears.
3 Click Save and Close to close the Warehouse Catalog dialog box.
• If no object definitions have changed, the warehouse structure gets updated completely with the Update Structure command. For example, this would apply if you rename a column in the table and the column is not being used in any fact expression.
• If any of the object definitions have changed, the table structure is only partially updated with the Update Structure command. Then, you have to manually update the schema objects that depend on the outdated structure.

Optimizing and Maintaining Your Project Project Design Guide9
314 Data warehouse and project interaction: Warehouse Catalog © 2010 MicroStrategy, Inc.
For example, if you rename a column in a table, you have to manually update the facts that use this column. The procedure for manually updating the fact is as follows:
a Right-click the fact and select Edit. The Fact Editor opens.
b Select the fact expression and click Modify. The Modify Fact Expression dialog box opens.
c From the list of source tables select the source table from which the fact has been created. Edit the fact expression and click OK. You are returned to the Fact Editor.
d Click Save and Close to save the changes and close the Fact Editor.
e From the Schema menu, select Update Schema. The Schema Update dialog box opens.
f Click Update.
g Repeat the first two steps of this procedure to open the Warehouse Catalog and update the table structure.
h Click Save and Close to save the changes and close the Warehouse Catalog dialog box.
Viewing sample data
To view sample data from a table, right-click a table in the Warehouse Catalog (see Accessing the Warehouse Catalog, page 309) and choose Show Sample Data from the shortcut menu. You can also select Show Sample Data from the Tools menu. The first 100 rows of the table are returned as sample data in the Values dialog box.
To refresh the table data, click Reload table values.
Removing tables from the Warehouse Catalog that have been removed from their data source
When tables that are included in a project are removed from the data source that they were available in, you can use the Warehouse Catalog to remove these tables from the list of tables included in the project. This allows you to view an accurate list of tables that are included in the project from the selected data source.

Project Design Guide Optimizing and Maintaining Your Project 9
© 2010 MicroStrategy, Inc. Data warehouse and project interaction: Warehouse Catalog 315
The steps below show you how to perform this task using the Warehouse Catalog. To remove these tables using MicroStrategy Architect, see Removing tables from a project that have been removed from a data source, page 123.
If tables that were not included in a project are removed from the data source, these tables are automatically removed from the display of available tables in the Warehouse Catalog.
To remove the display of project tables that have been removed from the data source
1 In MicroStrategy Desktop, log in to a project.
2 From the Schema menu, select Warehouse Catalog. The Warehouse Catalog opens.
3 From the Warehouse Catalog toolbar, click Check for deleted catalog tables. The Deleted Catalog Tables dialog box opens.
4 Select the Delete check box for a table to remove it from the Tables being used in the project pane.
5 After you have selected all the tables to delete, click OK to return to the Warehouse Catalog.
6 From the Action menu, select Read the Warehouse Catalog. All tables that were selected to be deleted in the Deleted Catalog Tables dialog box are removed from the Tables being used in the project pane.
7 Click Save and Close to save your changes and close the Warehouse Catalog.
Specifying a secondary database to support database gateways
MicroStrategy allows you to specify a secondary database instance for a table, which is used to support database gateways. For example, in your environment you might have a gateway between two databases such as an Oracle database and a DB2 database. One of them is the primary database and the other is the secondary database. The primary database receives all SQL requests and passes them to the correct database. From the perspective of MicroStrategy products in this environment, you need to define two
Optimizing and Maintaining Your Project Project Design Guide9
316 Data warehouse and project interaction: Warehouse Catalog © 2010 MicroStrategy, Inc.
database instances, one for the primary database and another for the secondary database. The default database instance for the project is set to be the primary database. In the Warehouse Catalog, you must set the secondary database instance for any tables that are found in the secondary database. This way, MicroStrategy products know how to generate SQL for each table.
If you use database gateway support, you cannot use the MultiSource Option feature to add tables from multiple data sources into your project. For information on adding tables from multiple data sources into your project with the Warehouse Catalog, see Accessing multiple data sources in a project, page 330.
To specify a secondary database for a table
1 Access the Warehouse Catalog for your project (see Accessing the Warehouse Catalog, page 309). The Warehouse Catalog opens.
2 Right-click a table being used in the project, (in the pane on the right side) and select Table Database Instances. The Available Database Instances dialog box opens.
3 In the Primary Database Instance drop-down list, select the primary database instance for the table.
4 Select one or more Secondary Database Instances.
You cannot select the primary database instance as a secondary database instance.
5 Click OK to accept your changes and return to the Warehouse Catalog.
6 From the toolbar, select Save and Close to save your changes and close the Warehouse Catalog.
Modifying data warehouse connection and operation defaults
You can specify various settings for data warehouse connection and operation defaults using the Warehouse Catalog. Example settings include changing the database instance, changing or assigning default table prefixes and structures, automatic mapping, row calculation, and so on. The settings are available from the Warehouse Catalog, by choosing Options from the

Project Design Guide Optimizing and Maintaining Your Project 9
© 2010 MicroStrategy, Inc. Data warehouse and project interaction: Warehouse Catalog 317
Tools menu (see Accessing the Warehouse Catalog, page 309 for steps to access the Warehouse Catalog). The Warehouse Catalog Options dialog box opens, which allows you to perform the following tasks:
• Data warehouse connection and read operations
• Displaying table prefixes, row counts, and name spaces
• Mapping schema objects and calculating logical sizes for tables
Data warehouse connection and read operations
You can modify the database instance and database login used to connect the data warehouse to a project, as well as change how the database catalog tables are read. You can make these type of modification from the Catalog category, which is divided into the following subcategories:
• Warehouse Connection: Select the desired database instance to use for the project as well as the custom database login.
Database Instance: You can select the primary database instance for the Warehouse Catalog from the drop-down list.
The primary database instance acts as the main source of data for a project and is used as the default database instance for tables added to the project. Non-database related VLDB property settings are also inherited from the primary database instance.
If the desired database instance does not appear in the Database Instance box, or if it does but needs to be modified, you can select from the following:
– Click Edit to modify the selected database instance. The General tab of the Database Instances dialog box opens.
– Click New to create a new database instance. The Database Instance Wizard opens.
Refer to the MicroStrategy System Administration Guide for more information on either of these dialog boxes.
Custom Database Login: You can either select the database login or clear the login to use no database login.
For more information on the database login, see the online help.

Optimizing and Maintaining Your Project Project Design Guide9
318 Data warehouse and project interaction: Warehouse Catalog © 2010 MicroStrategy, Inc.
• Read Settings: You can customize the SQL that reads the Warehouse Catalog for every platform except Microsoft Access. Clicking Settings allows you to directly edit the catalog SQL statements that are used to retrieve the list of available tables from the Warehouse Catalog and the columns for the selected tables. When connected to a Microsoft Access data source, the Settings option is disabled. The default catalog SQL retrieves a DISTINCT list of tables and columns from all users. You could restrict the information returned, for example, by specifying certain conditions and table owners (see Customizing catalog SQL statements, page 323). You can also select the following check boxes:
Read the table Primary and Foreign Keys: Select this option to display, in MicroStrategy, which columns are defined as primary keys or foreign keys in the data source. Primary keys and foreign keys can help facilitate joining tables to create Query Builder reports, as described in the Advanced Reporting Guide.
Displaying primary key or foreign key information in MicroStrategy can also help users designing a project to determine which columns of data may be suitable to serve as the identification columns of attributes. For information on defining the primary key for tables included in a MicroStrategy project, see Defining the primary key for a table, page 391.
Count the number of rows for all tables when reading the database catalog: Select this option if you want to control whether or not the Warehouse Catalog should get the number of rows each table has when loading from the data warehouse. This option is helpful when you want to identify fact tables and aggregation tables. If performance is more important than obtaining the row count, do not select this option as it will have a negative effect on performance. By default this option is selected when you open the Warehouse Catalog for the first time.
Ignore current table name space when reading from the database catalog and update using new table name space: This option allows you to switch between warehouses found in different database name spaces. For more information, see Ignoring table name spaces when migrating tables, page 322 of this appendix. By default this option is selected.
Display a warning if the column data types are modified when updating the table structure: Select this option if you want to be warned when the data type for a column stored in the project is different from the one read from the data warehouse. The check for the data type change is only performed when updating a table’s structure. By default this option is selected.

Project Design Guide Optimizing and Maintaining Your Project 9
© 2010 MicroStrategy, Inc. Data warehouse and project interaction: Warehouse Catalog 319
Automatically update information for all Partition Mapping tables when reading the database catalog: Select this option to read the latest information for the partition mapping tables (PMTs) currently present in the project. This setting should be cleared when the number of PMTs in the project is so large that reading their structure is causing performance problems when opening the Warehouse Catalog. By default this option is selected.
Column Merging Options: When you add a new table to your data warehouse, it may redefine the data type for a column included in the project. For example, your project includes a table named Table1 that has column C1 of data type char(1). Then a new table named Table2 is added to the project, but it has column C1 set to data type char(4). This example is used to illustrate the options described below. When you update the table structure, the column data types are modified to maintain a consistent schema in one of three ways, depending on the option you select.
The options below do not handle the merge if the data type has changed to an incompatible data type. For example, a column is changed from data type char to data type integer. If the data type has changed to an incompatible data type, a warning is displayed and you are asked if you want to use the new data type.
– Use most recent data type: This option updates the column data type to use the most recent column definition. In the example above, the column data type for C1 would be changed to char(4) since Table2 was added after Table1.
– Use maximum denominator data type: This option updates the column data type to use the data type with the largest precision or scale. In the example above, the column data type for C1 would be changed to char(4), as defined in Table2. This is because char(4) has a higher precision than char(1) defined in Table1. If the data

Optimizing and Maintaining Your Project Project Design Guide9
320 Data warehouse and project interaction: Warehouse Catalog © 2010 MicroStrategy, Inc.
type has been changed to a different compatible data type, the data type with the largest precision or scale is used, as illustrated in the image below.
– Do not merge: This option renames the column in the newly added table, which allows the columns to have different data types. From the example above, column C1 uses the char(1) data type for Table1. Column C1 in Table2 is defined as a separate copy of C1 and uses the char(4) data type. This option can cause unwanted schema changes and should be used only when necessary.
• Read Mode: The Warehouse Catalog can be automatically read upon opening the Warehouse Catalog, or restricted to only be read when a read is manually requested:
Automatic: This option sets the Warehouse Catalog tables to be read as soon as the catalog browser is loaded.
Manual: This option sets the Warehouse Catalog tables to be read only when the read catalog action is selected.
Displaying table prefixes, row counts, and name spaces
You can choose to show or hide table prefixes, row counts, and name spaces, by using the View category. This category is divided into the following subcategories:
• Table Prefixes: You can specify whether table prefixes are displayed in table names and how prefixes are automatically defined for tables that are added to the project. You have the following options:

Project Design Guide Optimizing and Maintaining Your Project 9
© 2010 MicroStrategy, Inc. Data warehouse and project interaction: Warehouse Catalog 321
Display table prefixes in the main dialog: Select this option to display all prefixes in table names, including new tables added to the project. By default this option is selected.
Automatically define prefixes for all tables that are added to this project: This setting enables/disables the following options:
– Set a prefix based on the warehouse table name space or owner (import prefix): When this option is selected, the Warehouse Catalog reads the name space for each table being added, creates a prefix having the same text as the name space, and associates it with the table being added.
– Set a default prefix: Select this to add a prefix to tables when they are added to a project. This option is only active when the database supports prefixes. You can select the default prefix from the Default prefix box drop-down list or create a new table prefix by clicking Modify prefix list.
– Modify prefix list: You can create a new tables prefix or delete an existing prefix by selecting this option. The Table Prefixes dialog box opens. For more information on modifying the prefix list, see the online help.
• Table Row Counts: You can show or hide the number of rows per table, using the check box:
Display the number of rows per table: You can show or hide the values calculated for the number of rows for the tables. By default, this option is selected and the number of rows are shown.
• Table Name Spaces: You can show or hide the name space for each table, using the check box:
Display the name space for each table (if applicable): You can show or hide the owner or table name space where the table is located in the warehouse. By default, this option is selected and table name spaces are shown.
Mapping schema objects and calculating logical sizes for tables
The Schema category is divided into the following subcategories:
Optimizing and Maintaining Your Project Project Design Guide9
322 Data warehouse and project interaction: Warehouse Catalog © 2010 MicroStrategy, Inc.
• Automatic Mapping: When you add new tables to the Warehouse Catalog, you can determine whether existing schema objects in the project are mapped to these new tables automatically, using the following options:
Map schema objects to new tables automatically: Existing objects in the schema automatically map to tables you add to the project.
Do not map schema objects to the new tables: Objects in the schema are not automatically mapped to tables you add to the project.
These automatic mapping methods are only applied to existing schema objects when tables are added to the Warehouse Catalog. For example, the attribute Year with an attribute form mapped to YEAR_ID is included in a project. Then a new table which includes a YEAR_ID column is added to the Warehouse Catalog. With the Map schema objects to new tables automatically option selected, the Year attribute is automatically mapped when the new table is added.
If the table was added to the Warehouse Catalog first and then the attribute was created, the Warehouse Catalog automatic mapping settings do not determine whether the attribute and table are automatically mapped. Automatically mapping tables to schema objects when adding attributes or facts to a project is controlled by the Attribute Editor and Fact Editor, respectively.
• Table Logical Sizes: You can select whether the Warehouse Catalog calculates logical sizes for new tables using one of the following options:
Calculate the logical table sizes automatically: Logical sizes are automatically calculated for tables you add to the project.
Do not calculate table logical sizes: Logical sizes are not calculated for the tables you add to the project.
Ignoring table name spaces when migrating tables
It is a common practice to establish a secondary warehouse with less information than the primary warehouse for development and testing. Before going into production, you change the project to point to the primary warehouse.
Most database management systems (Oracle, DB2, and others) support the concept of a table name space, which is a way of organizing database tables into different storage spaces. This method allows you to repeat the same table name in different table name spaces. For instance, you can have LU_STORE in a table name space called dbo and another table LU_STORE in

Project Design Guide Optimizing and Maintaining Your Project 9
© 2010 MicroStrategy, Inc. Data warehouse and project interaction: Warehouse Catalog 323
another table name space called admin. You now have two tables dbo.LU_STORE and admin.LU_STORE. The table name space provides an extra piece of information that uniquely identifies the table.
When you add tables to a project, the Warehouse Catalog saves information to the appropriate table name space. This can cause a problem when you migrate from a warehouse that resides in a certain table name space to another warehouse in a different table name space. The Warehouse Catalog interprets the table as already in the project and not found in the new warehouse. This is because the Warehouse Catalog is looking for a table named dbo.LU_STORE, and the table is actually stored as admin.LU_STORE in the new production warehouse.
To solve this problem, select the Ignore current table name space when reading from the database catalog and update using new table name space check box. You can find this option in the Warehouse Catalog Options dialog box under the Catalog - Read Settings options subcategory. If you select this option, the Warehouse Catalog ignores the current table name space when it reads the catalog information. Thus, the Warehouse Catalog recognizes the two tables as the same table and saves the new table name space information. This setting allows you to migrate much more easily between warehouses. If the check box is cleared, the Warehouse Catalog defaults to identifying the table by both table name space and table name.
Customizing catalog SQL statements
In all supported warehouse platforms other than Microsoft Access, MicroStrategy uses SQL statements to query the relational database management system (RDBMS) catalog tables to obtain warehouse catalog information. This information includes catalog tables, columns, and their data types.
These catalog SQL statements vary from platform to platform and can be customized according to the characteristics of the specific warehouse.
Microsoft Access does not have catalog tables, so an ODBC call must be used to retrieve information about tables and columns in Access. By default, a similar ODBC call is used for the Generic DBMS database type, but you can choose to use custom catalog SQL for the generic type if you wish.
The MicroStrategy Warehouse Catalog can be configured to read the catalog information in one- or two-pass SQL mode. In two-pass SQL mode, it first reads only the tables from the database. The structure of individual tables is

Optimizing and Maintaining Your Project Project Design Guide9
324 Data warehouse and project interaction: Warehouse Catalog © 2010 MicroStrategy, Inc.
read only when the table is selected. This is the recommended option for interactive warehouse catalog building because no unnecessary catalog information is read from the database, which increases processing speed. One-pass SQL mode, on the other hand, reads all the tables and columns in one SQL statement. This option is recommended only if the catalog SQL is well customized to limit the amount of data returned by it.
The two retrieval options use different catalog SQL, but both can be customized in the Warehouse Catalog Options dialog box. In the following sections, the name Catalog Table SQL refers to the catalog SQL to retrieve the tables in the warehouse; that is, the first SQL used in a two-pass catalog retrieval.
The name Full Catalog SQL refers to the SQL used to read all the tables and columns in one pass.
To customize a catalog SQL, you must understand several important concepts and procedures:
• The table name space, page 324
• SQL placeholder strings and incomplete catalog SQL, page 325
• Structure of Catalog Table SQL, page 325
• Structure of Full Catalog SQL, page 325
• Modifying catalog SQL, page 326
• Default catalog SQL, page 327
The table name space
In a typical RDBMS platform, a table name does not uniquely identify it in a particular database installation. A table name space is a partition of the database installation in which table names are unique. Depending on the type of RDBMS, this name space can be the name of the database, the owner of the table, or a combination of both database and owner. In both the Catalog Table SQL and Full Catalog SQL, a name space gives each table a unique name. This helps you to avoid confusing tables that share the same table name.
The table name space is optional. A customized catalog SQL can omit the name space if duplicate table names do not present a problem in the warehouse database.

Project Design Guide Optimizing and Maintaining Your Project 9
© 2010 MicroStrategy, Inc. Data warehouse and project interaction: Warehouse Catalog 325
SQL placeholder strings and incomplete catalog SQL
The default system catalog SQL can contain certain placeholder strings that can be resolved at run time or must be completed manually by the user. These placeholders are:
• #LOGIN_NAME#—This placeholder is automatically replaced at run time with the login name used to connect to the database. You can leave this template in the customized SQL if you want the catalog SQL to yield different results depending on the warehouse login used. Otherwise, this template is replaced with the name of the database user who owns the warehouse tables of interest.
• #?Database_Name?#, #?Schema_Name?#—This catalog SQL placeholder is an incomplete SQL string that must be completed by the user before it can be executed. The string starts with #? and ends with ?#. The command #?Database_Name?#, used with Teradata, must be replaced with the name of the database containing the database tables. #?Schema_Name?#, used with DB2 AS/400 and MySQL, must be replaced with the name of the schema in which the database tables for the project reside.
Structure of Catalog Table SQL
Catalog Table SQL is expected to return two columns, one identifying the name space of the table and the other the name of the table. If a name space is not provided, only the table name column is required. Each row of the SQL result must uniquely identify a table. Duplicates are not allowed. The column that identifies the table name space uses the SQL column alias NAME_SPACE. The column that identifies the table name has the alias TAB_NAME. The following example is the default Catalog Table SQL for Oracle 8.0:
SELECT DISTINCT OWNER NAME_SPACE, TABLE_NAME TAB_NAME FROM ALL_TAB_COLUMNS WHERE OWNER = '#LOGIN_NAME#'
Structure of Full Catalog SQL
Full Catalog SQL is expected to return between five and seven columns, depending on the RDBMS platform and the customization.
The following aliases identify each column returned:
• NAME_SPACE (optional): the table name space

Optimizing and Maintaining Your Project Project Design Guide9
326 Data warehouse and project interaction: Warehouse Catalog © 2010 MicroStrategy, Inc.
• TAB_NAME (required): name of the table
• COL_NAME (required): name of the column
• DATA_TYPE (required): a string or a number that identifies the major data type of the column
• DATA_LEN (required): a number that describes the length or size of the column data
• DATA_PREC (optional): a number that describes the precision of the column data
• DATA_SCALE (optional): a number that describes the scale of a floating point column data
Full Catalog SQL must return its rows ordered first by NAME_SPACE, if available, and then by TAB_NAME.
The following example is the default Full Catalog SQL for Microsoft SQL Server 7.0:
SELECT U.name NAME_SPACE, T.name TAB_NAME, C.name COL_NAME, C.type DATA_TYPE, C.length DATA_LEN, C.prec DATA_PREC, C.scale DATA_SCALE FROM sysobjects T, syscolumns C, sysusers WHERE T.id = C.id and T.type in ('U', 'V') AND T.uid = U.uid ORDER BY 1, 2
Modifying catalog SQL
You can customize and modify the catalog SQL that is run against your database for each project. The catalog SQL can be modified in the Warehouse Catalog options for your project.
To modify the catalog SQL for your project
1 Access the Warehouse Catalog for your project (see Accessing the Warehouse Catalog, page 309). The Warehouse Catalog opens.
2 From the Tools menu, select Options. The Warehouse Catalog Options dialog box opens.
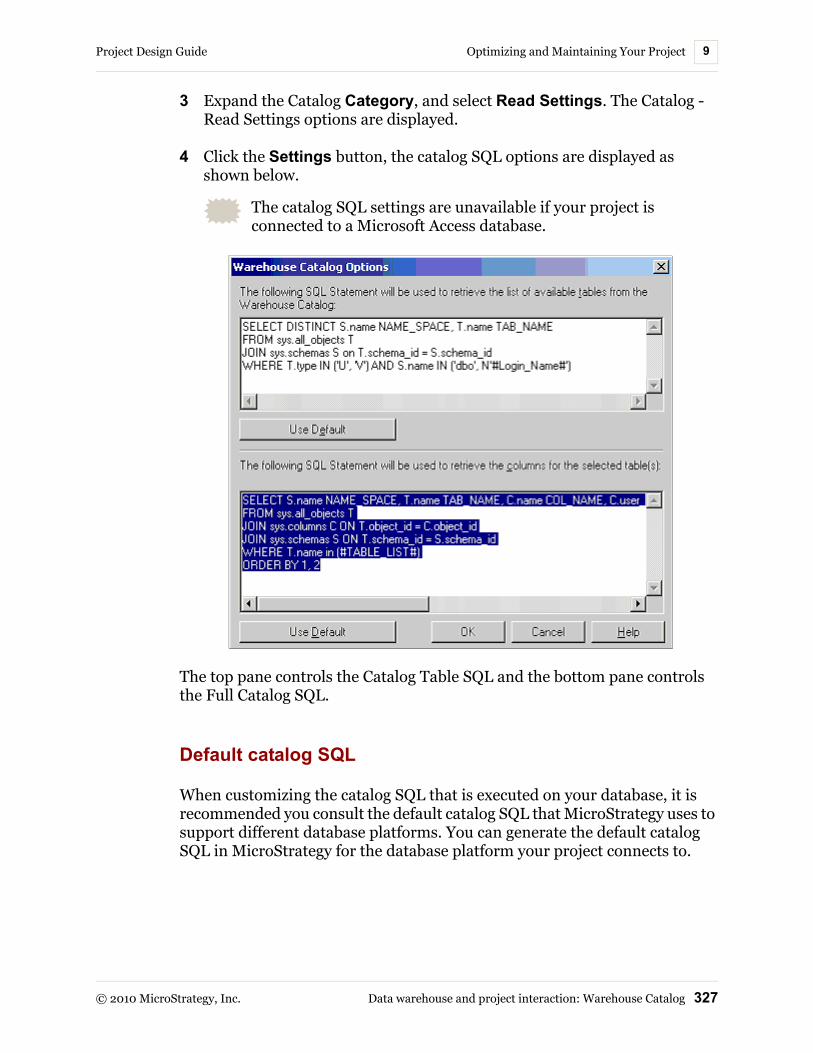
Project Design Guide Optimizing and Maintaining Your Project 9
© 2010 MicroStrategy, Inc. Data warehouse and project interaction: Warehouse Catalog 327
3 Expand the Catalog Category, and select Read Settings. The Catalog - Read Settings options are displayed.
4 Click the Settings button, the catalog SQL options are displayed as shown below.
The catalog SQL settings are unavailable if your project is connected to a Microsoft Access database.
The top pane controls the Catalog Table SQL and the bottom pane controls the Full Catalog SQL.
Default catalog SQL
When customizing the catalog SQL that is executed on your database, it is recommended you consult the default catalog SQL that MicroStrategy uses to support different database platforms. You can generate the default catalog SQL in MicroStrategy for the database platform your project connects to.
Optimizing and Maintaining Your Project Project Design Guide9
328 Data warehouse and project interaction: Warehouse Catalog © 2010 MicroStrategy, Inc.
To generate and view the default catalog SQL
1 Access the catalog SQL options for your project (see Modifying catalog SQL, page 326). A dialog box for the catalog SQL options is displayed.
• The top pane controls the Catalog Table SQL, which retrieves a list of available tables in the Warehouse Catalog.
• The bottom pane controls the Full Catalog SQL, which retrieves column information for the selected tables.
Before performing the next step, cut and paste the SQL statements in the two panes into any text editor. This allows you to save any modifications you have made previously to the catalog SQL statements, and then compare them to the default statements you are about to generate.
2 Generate and view the default catalog SQL for your database platform. Any text in the panes is overwritten with the default catalog SQL statements:
• To generate and view the default Catalog Table SQL for your database platform, click the upper-most Use Default button.
• To generate and view the default Full Catalog SQL for your database platform, click the bottom-most Use Default button.
You can use the default catalog SQL statements or compare and combine them with your own customized catalog SQL statements.
Troubleshooting table and column messages
You may encounter the following messages while using the Warehouse Catalog:
• Tables missing
• Columns data type changed
• Columns missing

Project Design Guide Optimizing and Maintaining Your Project 9
© 2010 MicroStrategy, Inc. Data warehouse and project interaction: Warehouse Catalog 329
Tables missing
This happens when one or more tables already in the project are removed from the data warehouse. Two cases can be seen:
• When the Warehouse Catalog is starting and retrieving the table information from the data warehouse and it detects that one or more tables already in the project are missing, it displays an error message which gives you the following options:
Leave the Table in the project: This leaves everything as is in the project metadata. However the definition in the project may be inconsistent with the real physical structure in the warehouse. This can result in SQL errors when running reports that need data from a “missing” table.
Remove the table from the project. In this case, the Warehouse Catalog does not check for any dependencies until you save the changes. If there are any dependencies, they are presented to you, and you have the option to proceed or cancel the operation.
• When the Warehouse Catalog tries to update the structure of a table that is missing in the warehouse, a message is shown which explains that the table structure update cannot proceed because the table was not found in the warehouse. In this case, no changes occur and the original table structure remains intact.
Columns data type changed
When the table structure is updated for one or more tables in which the column data types have been changed, you get a warning message showing the table name, column name, original data type, and new data type. You can click Cancel at any time to undo all data type changes. This results in no changes being applied to the tables and columns.
Columns missing
Missing columns are detected when Update Structure is performed. If this happens, the Warehouse Catalog checks for the following:
• Column is not mapped to any schema object: If this is the case, then no error message is shown.

Optimizing and Maintaining Your Project Project Design Guide9
330 Accessing multiple data sources in a project © 2010 MicroStrategy, Inc.
• Column is mapped to a schema object: If this is the case, then a message is displayed that gives details on objects, which are mapped to the missing column and the update structure operation is canceled. You are asked to remove the mapping before continuing with the update structure and original table structure is restored.
Accessing multiple data sources in a projectMicroStrategy provides an extension to Intelligence Server referred to as MultiSource Option. With this feature, you can connect a project to multiple relational data sources. This allows you to integrate all your information from various databases and other relational data sources into a single MicroStrategy project for reporting and analysis purpose. All data sources included by using the MultiSource Option are integrated as part of the same relational schema for a project.
Accessing multiple relational data sources in a single project can provide many benefits and reporting solutions. There is the obvious benefit of being able to integrate information from various data sources into a single project. Along with accessing data in data sources provided from a centralized server, you can also access personal relational data sources.
For example, a sales manager wants to include forecast data available in a spreadsheet stored on a sales representative’s local machine. By connecting to the spreadsheet as a relational data source, this forecast data can be viewed along with actual sales data from the centralized database.
MultiSource Option also allows you to use Freeform SQL, Query Builder, and MDX cube reports, that access secondary data sources, as filters on standard reports. For information on Freeform SQL and Query Builder reports, see the Advanced Reporting Guide. For information on MDX cube reports, see the MDX Cube Reporting Guide.
If you have a license for MultiSource Option, you can access multiple data sources in a project as described below:
• Connecting data sources to a project, page 331
• Adding data into a project, page 332

Project Design Guide Optimizing and Maintaining Your Project 9
© 2010 MicroStrategy, Inc. Accessing multiple data sources in a project 331
Connecting data sources to a project
You can connect a project to a data source through a database instance. A database instance specifies warehouse connection information, such as the data source name, login ID and password, and other data source specific information. For information on creating a database instance, see the Installation and Configuration Guide.
Once database instances have been created for your data sources, you can connect them to your project. However, keep in mind that if you include multiple data sources in a project, the data sources should all fit into the same logical data model and warehouse structure planned for your project. For information on planning a logical data model and a physical warehouse structure, see Chapter 2, The Logical Data Model and Chapter 3, Warehouse Structure for Your Logical Data Model.
The procedure below describes how to include multiple data sources in a project.
Prerequisites
• A project has been created.
• Database instances have been created for the data sources to include in a project.
• A license for MultiSource Option is required to connect multiple data sources to a project.
To include multiple data sources in a project
1 In Desktop, log in to a project.
2 Right-click the project and select Project Configuration. The Project Configuration Editor opens.
3 From the Categories list, expand Database Instances, and then select SQL Data Warehouses.
4 In the Database Instance pane, select the check box next to the database instances for the data sources to include in a project.
Selecting a check box for a database instance also makes its data source available for use with Query Builder and Freeform SQL. The availability of multiple data sources through Query Builder or Freeform SQL does not
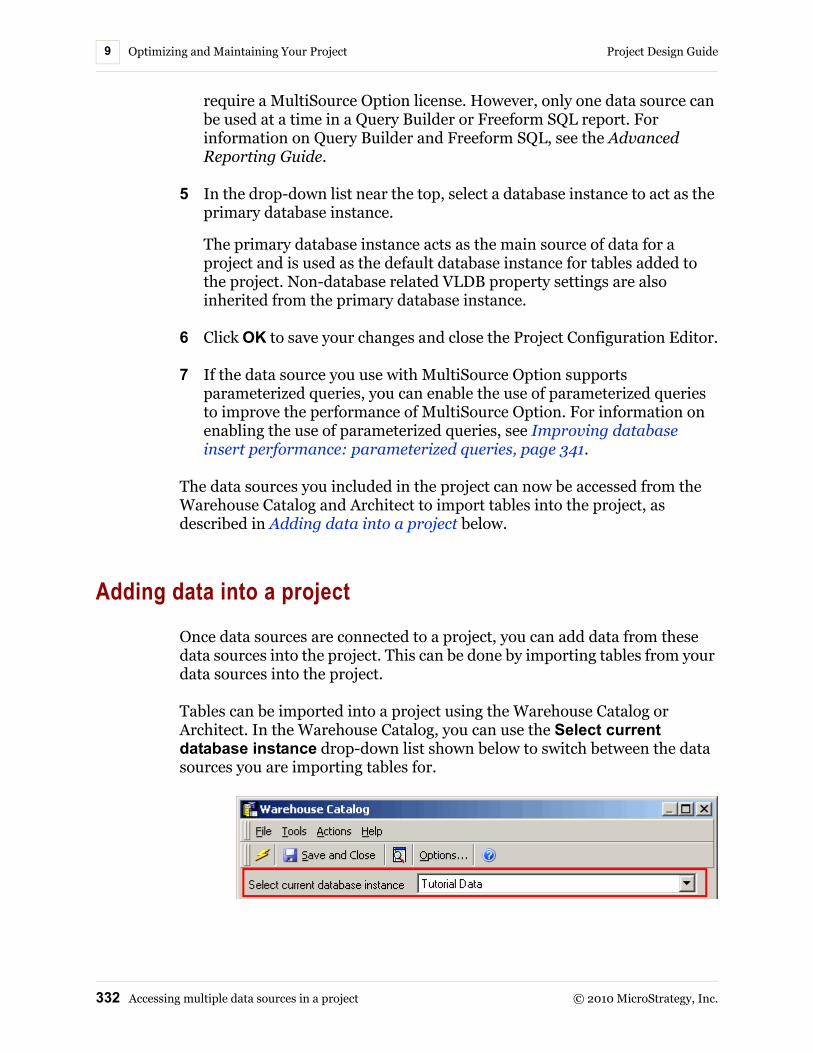
Optimizing and Maintaining Your Project Project Design Guide9
332 Accessing multiple data sources in a project © 2010 MicroStrategy, Inc.
require a MultiSource Option license. However, only one data source can be used at a time in a Query Builder or Freeform SQL report. For information on Query Builder and Freeform SQL, see the Advanced Reporting Guide.
5 In the drop-down list near the top, select a database instance to act as the primary database instance.
The primary database instance acts as the main source of data for a project and is used as the default database instance for tables added to the project. Non-database related VLDB property settings are also inherited from the primary database instance.
6 Click OK to save your changes and close the Project Configuration Editor.
7 If the data source you use with MultiSource Option supports parameterized queries, you can enable the use of parameterized queries to improve the performance of MultiSource Option. For information on enabling the use of parameterized queries, see Improving database insert performance: parameterized queries, page 341.
The data sources you included in the project can now be accessed from the Warehouse Catalog and Architect to import tables into the project, as described in Adding data into a project below.
Adding data into a project
Once data sources are connected to a project, you can add data from these data sources into the project. This can be done by importing tables from your data sources into the project.
Tables can be imported into a project using the Warehouse Catalog or Architect. In the Warehouse Catalog, you can use the Select current database instance drop-down list shown below to switch between the data sources you are importing tables for.

Project Design Guide Optimizing and Maintaining Your Project 9
© 2010 MicroStrategy, Inc. Accessing multiple data sources in a project 333
In Architect, you can use the Warehouse Tables pane shown below to switch between the data sources you are importing tables for.
If the tables you import from various sources all use different table names, the tables are imported exactly as they are when only a single data source is used. You can also import tables with the same name from different data sources, and is described in Supporting duplicate tables in multiple data sources below.
Supporting duplicate tables in multiple data sources
You can support the integration of duplicate tables in multiple data sources through the use of MultiSource Option. The MicroStrategy SQL Engine can then obtain any required attribute information from the data source that stores that information. This process can return this information to reports and documents without any extra considerations or tasks for a report or document designer.
Including duplicate copies of tables from different data sources allows MicroStrategy to execute within a single data source for certain types of queries.
For example, you have two data sources. One data source stores historical data for your company. The other data source stores forecast data for the same business sectors. Each data source includes duplicate copies of tables that store attribute information, which describe the context of data. The data

Optimizing and Maintaining Your Project Project Design Guide9
334 Accessing multiple data sources in a project © 2010 MicroStrategy, Inc.
sources differ in the availability of historical data versus forecast data, which is integrated into your MicroStrategy project through the use of facts and metrics.
In this scenario, including each copy of the tables that include attribute information from both data sources allows some queries to be processed within a single data source. By including these duplicate copies, users that only need to view historical data can have their query resolved within a single data source. Similarly, users that only need to view forecast data can have their query resolved completely within the other data source. This reduces the time and system resources required for these types of queries since working within a single data source is more efficient than querying across multiple data sources.
Including both historical and forecast data on the same report from these different data sources is also possible in this scenario through the use of MultiSource Option. However, since the historical and forecast data are only available in separate data sources, this query must include both data sources.
To import multiple copies of the same table from different data sources into a project, the requirements listed below must be met:
• The table name and column names must be exactly the same.
• One of the copies of the table must act as the primary table used in the project. All of the columns in this table must also be present in the other copies of the table from other data sources. The other copies of the table that are used as secondary tables can include additional columns of information. However, these additional columns are not included in the project when the table is added.
• When you import multiple copies of a table from multiple data sources, import the table that is to act as the primary table first. Once you import the primary table, you can begin importing secondary tables from the other data sources.
If you do not import the primary table first, you may have to remove some tables and then add them back into the project after the primary table is imported. This workflow may be required to update existing projects that did not previously use MultiSource Option.
• The data types of matching columns must be compatible. Compatibility of column data types is described below:
A Decimal data type with a scale of zero is compatible with the Integer data type.
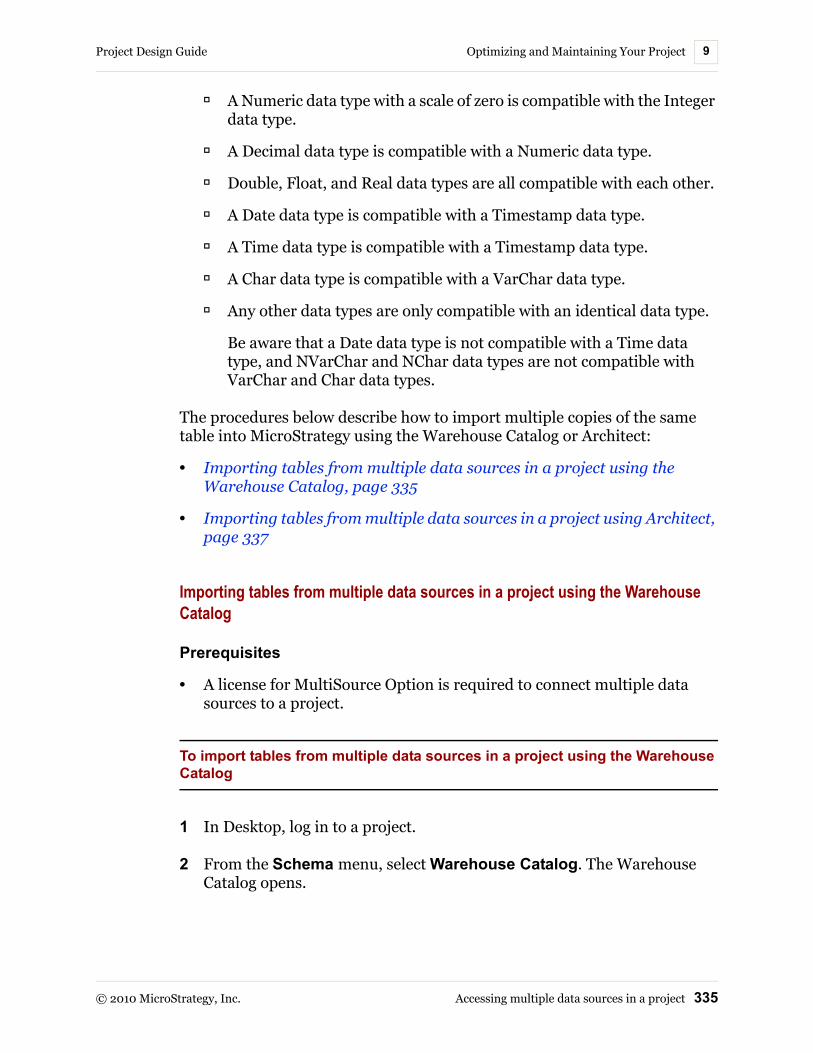
Project Design Guide Optimizing and Maintaining Your Project 9
© 2010 MicroStrategy, Inc. Accessing multiple data sources in a project 335
A Numeric data type with a scale of zero is compatible with the Integer data type.
A Decimal data type is compatible with a Numeric data type.
Double, Float, and Real data types are all compatible with each other.
A Date data type is compatible with a Timestamp data type.
A Time data type is compatible with a Timestamp data type.
A Char data type is compatible with a VarChar data type.
Any other data types are only compatible with an identical data type.
Be aware that a Date data type is not compatible with a Time data type, and NVarChar and NChar data types are not compatible with VarChar and Char data types.
The procedures below describe how to import multiple copies of the same table into MicroStrategy using the Warehouse Catalog or Architect:
• Importing tables from multiple data sources in a project using the Warehouse Catalog, page 335
• Importing tables from multiple data sources in a project using Architect, page 337
Importing tables from multiple data sources in a project using the Warehouse Catalog
Prerequisites
• A license for MultiSource Option is required to connect multiple data sources to a project.
To import tables from multiple data sources in a project using the Warehouse Catalog
1 In Desktop, log in to a project.
2 From the Schema menu, select Warehouse Catalog. The Warehouse Catalog opens.

Optimizing and Maintaining Your Project Project Design Guide9
336 Accessing multiple data sources in a project © 2010 MicroStrategy, Inc.
3 From the Select current database instance drop-down list, select the database instance for one of the data sources the table resides in. The first data source you use to import a table should be the one you plan to use as the primary data source for the table.
Importing a table from the primary database instance for a project or a non-primary database instance has an effect on how the table is updated when the primary database instance for a project is changed, as described in Importing tables as part of the project’s primary database instance, page 339.
4 In the Tables available in the database pane, select the table to add to the project and click the > button. The first copy of the table is added to the project and is displayed in the Tables being Used in the Project pane.
To add copies of a table from other database instances
5 From the Select current database instance drop-down list, select the database instance for a different data source that also includes the table.
6 In the Tables available in the database pane, select the table to add to the project and click the > button.
If all of the required conditions to import multiple copies of the table (listed in Supporting duplicate tables in multiple data sources, page 333) are met, a Warehouse Catalog Browser dialog box opens. To include a copy of the table in the project, select Indicate that TABLE_NAME is also available from the current DB instance, and click OK. The copy of the table is added to the project and is displayed in the Tables being Used in the Project pane.
Review any messages displayed when attempting to import a copy of a table from a different data source.
To add additional tables and configure the tables included in the project
7 To add tables from additional data sources, repeat the steps in To add copies of a table from other database instances above.
8 In the Tables being used in the project pane, right-click the table and select Table Database Instances. The Available Database Instances dialog box opens.
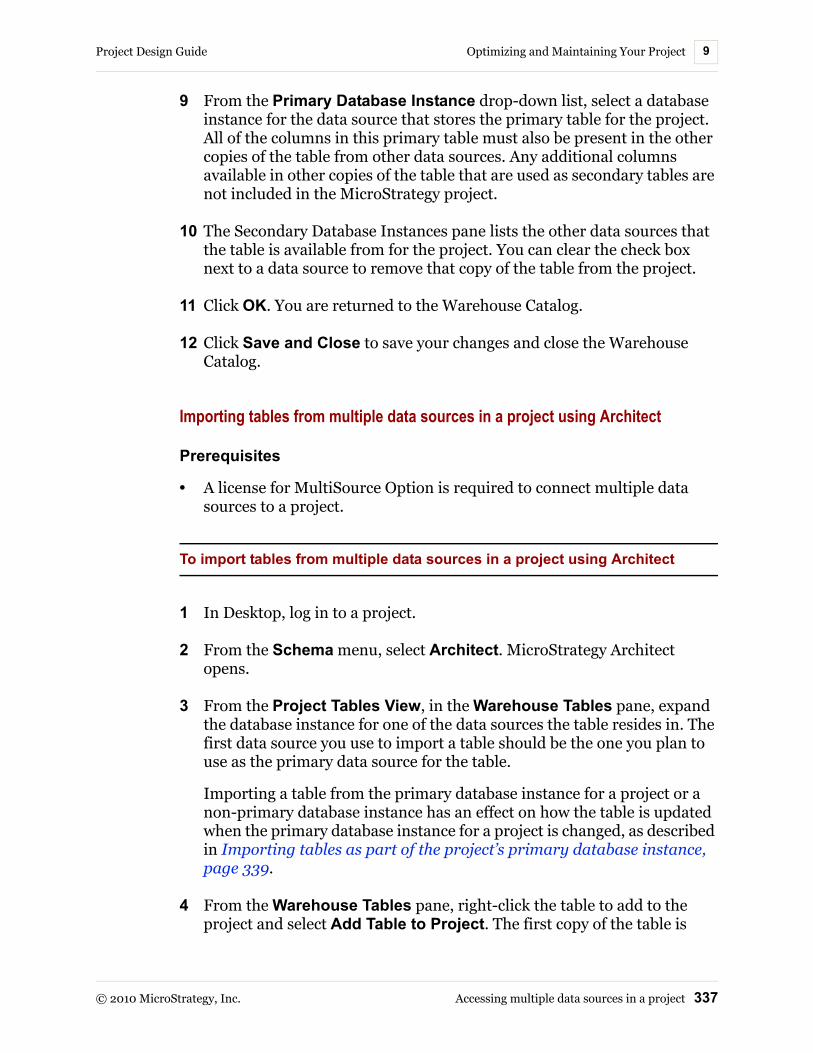
Project Design Guide Optimizing and Maintaining Your Project 9
© 2010 MicroStrategy, Inc. Accessing multiple data sources in a project 337
9 From the Primary Database Instance drop-down list, select a database instance for the data source that stores the primary table for the project. All of the columns in this primary table must also be present in the other copies of the table from other data sources. Any additional columns available in other copies of the table that are used as secondary tables are not included in the MicroStrategy project.
10 The Secondary Database Instances pane lists the other data sources that the table is available from for the project. You can clear the check box next to a data source to remove that copy of the table from the project.
11 Click OK. You are returned to the Warehouse Catalog.
12 Click Save and Close to save your changes and close the Warehouse Catalog.
Importing tables from multiple data sources in a project using Architect
Prerequisites
• A license for MultiSource Option is required to connect multiple data sources to a project.
To import tables from multiple data sources in a project using Architect
1 In Desktop, log in to a project.
2 From the Schema menu, select Architect. MicroStrategy Architect opens.
3 From the Project Tables View, in the Warehouse Tables pane, expand the database instance for one of the data sources the table resides in. The first data source you use to import a table should be the one you plan to use as the primary data source for the table.
Importing a table from the primary database instance for a project or a non-primary database instance has an effect on how the table is updated when the primary database instance for a project is changed, as described in Importing tables as part of the project’s primary database instance, page 339.
4 From the Warehouse Tables pane, right-click the table to add to the project and select Add Table to Project. The first copy of the table is

Optimizing and Maintaining Your Project Project Design Guide9
338 Accessing multiple data sources in a project © 2010 MicroStrategy, Inc.
added to the project and is displayed in the Project Tables View of Architect.
To add copies of a table from other database instances
5 From the Warehouse Tables pane, expand the database instance for a different data source that also includes the table.
6 From the Warehouse Tables pane, right-click the table to add to the project and select Add Table to Project.
If all of the required conditions to import multiple copies of the table (listed in Supporting duplicate tables in multiple data sources, page 333) are met, an Options dialog box opens. To include a copy of the table in the project, select Indicate that TABLE_NAME is also available from the current DB instance, and click OK. The copy of the table is added to the project and is displayed in the Project Tables View of Architect.
Review any messages displayed when attempting to import a copy of a table from a different data source.
To add additional tables and configure the tables included in the project
7 To add tables from additional data sources, repeat the steps in To add copies of a table from other database instances above.
8 From the Project Tables View, select the table. Information on the table is displayed in the Properties pane.
9 From the Properties pane, select the Primary DB Instance option, and then click ... (Browse). The Available Database Instances dialog box opens.
10 From the Primary Database Instance drop-down list, select a database instance for the data source that stores the primary table for the project. All of the columns in this primary table must also be present in the other copies of the table from other data sources. Any additional columns available in other copies of the table that are used as secondary tables are not included in the MicroStrategy project.
11 The Secondary Database Instances pane lists the other data sources that the table is available from for the project. You can clear the check box next to a data source to remove that copy of the table from the project.
12 Click OK. You are returned to Architect.

Project Design Guide Optimizing and Maintaining Your Project 9
© 2010 MicroStrategy, Inc. Accessing multiple data sources in a project 339
13 Click Save and Close to save your changes and close the Warehouse Catalog.
Importing tables as part of the project’s primary database instance
Importing a table from the primary database instance for a project or a non-primary database instance has an effect on how the table is updated when the primary database instance for a project is changed:
• If you import a table from the primary database instance for a project, the table's primary data source is updated when the primary database instance for the project is changed. This supports scenarios such as moving from a testing environment to a production environment where different database instances are used for each environment.
For example, tables are imported into a project from the primary database instance of a project. The primary database instance is for testing purposes. When the system is switched into production, a new production database instance is defined as the new primary database instance for the project. During the switch of primary database instances, all tables that were imported with the original (testing) primary database instance are modified to use the new (production) primary database instance. This example scenario is shown below, which illustrates that the tables remain connected to the new primary database instance.

Optimizing and Maintaining Your Project Project Design Guide9
340 Accessing multiple data sources in a project © 2010 MicroStrategy, Inc.
• If you import a table from a non-primary database instance for a project, the database instance used for the initial import remains as the primary data source for the table. This supports scenarios in which a table is only provided in secondary data sources that are not the primary data source for the project.
You can modify a table to always use the primary database instance as its primary data source. Steps on how to switch the database instance for a table are provided below.
To switch primary database instances for a table
1 In MicroStrategy Desktop, log in to a project.
2 From the Schema menu, select Warehouse Catalog. The Warehouse Catalog opens.
3 In the Tables being used in the project area, right-click a table and select Table Database Instances. The Available Database Instances dialog box opens.
4 From the Primary Database Instance drop-down list, select the database instance to act as the primary database instance for the table.
If you select the database instance that is also the project’s primary database instance, the table's primary data source is updated when the primary database instance for the project is changed.
5 Click OK. If any warnings are displayed, read the information and take any required action.
6 In the Warehouse Catalog, click Save and Close to save your changes.
Project Design Guide Optimizing and Maintaining Your Project 9
© 2010 MicroStrategy, Inc. Improving database insert performance: parameterized queries 341
Improving database insert performance: parameterized queries
MicroStrategy’s support for parameterized queries can improve performance in scenarios that require the insertion of information into a database. The scenarios that can benefit from the use of parameterized queries include:
• Reports that combine data from multiple data sources using MicroStrategy MultiSource Option. For information on MultiSource Option, see Accessing multiple data sources in a project, page 330.
• MicroStrategy data marts that are stored in a database other than the database used for the main data warehouse. For information on creating and using data marts, refer to the Advanced Reporting Guide.
• Metrics that use functions that are evaluated by the Analytical Engine. For information on functions, refer to the Functions Reference.
• Custom groups that use banding qualifications that are evaluated as normal calculations. For information on custom groups, refer to the Advanced Reporting Guide.
Parameterized queries are SQL queries that can use placeholders for data. Using placeholders allows these queries to be re-used. A common application of this re-usability is to combine multiple inserts of data into a database as a single query. The following is an example of a parameterized query:
INSERT INTO DMTABLE (Customer_ID, Customer_Name) VALUES (?, ?)
Combining multiple INSERT statements into a single query can improve the performance of inserting data into the database. The steps below show you how to enable the use of parameterized queries in MicroStrategy.
Prerequisites
• Parameterized queries are only supported by certain databases. Refer to your third-party database documentation to ensure that your database can support parameterized queries.
• A database instance has been created. This database instance must connect to the database to enable support for parameterized queries.

Optimizing and Maintaining Your Project Project Design Guide9
342 Improving database insert performance: parameterized queries © 2010 MicroStrategy, Inc.
To enable the use of parameterized queries
1 In MicroStrategy Desktop, log in to a project source with a user account that has administrative privileges.
2 From the Folder List, expand Administration, then expand Configuration Managers, and then select Database Instances. Database instances for the project source are displayed.
3 Right-click a database instance and select Edit. The Database Instances Editor opens.
4 To the right of the Database connection area, click Modify. The Database Connections dialog box opens.
5 On the Advanced tab, select the Use parameterized queries check box.
6 If you are enabling parameterized queries for one of the databases listed below, you must also include the following parameters:
• To enable parameterized queries for Oracle 10g, Oracle 10gR2, Oracle 11g, Oracle 9i, Sybase Adaptive Server 12.x, or Sybase ASE 15.x, type the following parameter in the Additional connection string parameters field:
EnableDescribeParam=1
• To enable parameterized queries for Teradata 12.0 or Teradata V2R6.2, type the following parameter in the Additional connection string parameters field:
EnableExtendedStmtInfo=Yes
7 Click OK to accept your changes and close the Database Connections dialog box.
8 Click OK to close the Database Instances Editor.
Project Design Guide Optimizing and Maintaining Your Project 9
© 2010 MicroStrategy, Inc. Using summary tables to store data: Aggregate tables 343
Using summary tables to store data: Aggregate tables
Aggregate tables are summary tables that store data at higher levels than it was stored when the data was initially captured and saved. Aggregate tables provide quicker access to frequently requested information, while retaining the traditional power of ROLAP to directly query the database to answer any questions. This section describes how and why aggregate tables are used.
MicroStrategy creates aggregates only on fact tables since lookup tables and relationship tables are usually significantly smaller. To understand aggregate tables, you should be familiar with fact tables in the context of data modeling and data warehousing. For more information on these topics, see Chapter 2, The Logical Data Model, Chapter 3, Warehouse Structure for Your Logical Data Model, and Chapter 6, The Building Blocks of Business Data: Facts.
When to use aggregate tables
MicroStrategy uses optimized SQL to query the relational database directly to answer users’ questions. Users can ask any question that is supported by the data in their warehouse and then analyze the results until they find a precise answer.
The disadvantage to this relational OLAP (ROLAP) methodology is that accessing huge fact tables can be potentially time-consuming. Multidimensional OLAP (MOLAP) is sometimes considered by some to be the answer to this problem. However, MOLAP is not scalable for large projects because of the difficulty of maintaining every possible combination of aggregates as the number of attributes and the amount of data increases. MicroStrategy’s solution is the use of aggregate tables to provide quicker access to frequently-accessed data while still retaining the power to answer any user query.
Aggregate tables are advantageous because they:
• Reduce input/output, CPU, RAM, and swapping requirements
• Eliminate the need to perform dynamic calculations
• Decrease the number of physical disk reads and the number of records that must be read to satisfy a query

Optimizing and Maintaining Your Project Project Design Guide9
344 Using summary tables to store data: Aggregate tables © 2010 MicroStrategy, Inc.
• Minimize the amount of data that must be aggregated and sorted at run time
• Move time-intensive calculations with complicated logic or significant computations into a batch routine from dynamic SQL executed at report run time
In summary, the MicroStrategy SQL Engine, in combination with aggregate tables and caching, can produce results at about the same speed as MOLAP. This combined solution allows questions to be answered on the fly and is also scalable for large databases.
Aggregation versus pre-aggregation
Whenever the display level of data on a report must differ from the level at which the data is initially captured, aggregation, that is, the rolling up of data, must occur. By default, aggregation occurs dynamically with a SQL statement at report run-time.
For example, sales data is stored by day in a fact table. A report requesting month-level data is executed. The daily values from the fact table are selected, sorted, and added to produce the monthly totals, as shown below.
Aggregation can also be completed before reports are executed; the results of the aggregation are stored in an aggregate table. This process is called pre-aggregation. You can build these pre-aggregated—or aggregate—tables

Project Design Guide Optimizing and Maintaining Your Project 9
© 2010 MicroStrategy, Inc. Using summary tables to store data: Aggregate tables 345
as part of the ETL process. If sales data is frequently requested at the month level, as in the previous example, an aggregate table with the sales data rolled up to the month level is useful.
Pre-aggregation eliminates the reading, sorting, and calculation of data from many database rows in a large, lower-level fact table at run time, as shown in the following example.
If the daily sales fact table is the lowest-level fact table and contains atomic-level data, it is referred to as a base table. In these terms, an aggregate table is any fact table whose data is derived by aggregating data from an existing base table.
Degree of aggregation
While MOLAP can provide fast performance when it answers a question, it requires a completely aggregated schema to answer most questions. That is, every possible combination of aggregate associations must be generated when the multidimensional cube is built. This ensures that all possible questions can be answered. This scenario becomes very difficult to maintain

Optimizing and Maintaining Your Project Project Design Guide9
346 Using summary tables to store data: Aggregate tables © 2010 MicroStrategy, Inc.
as the number of attributes and the amount of data increase, and therefore is not very scalable.
In a ROLAP environment, the degree of aggregation can be as dense or as sparse as is appropriate for your users. A densely aggregated warehouse has a large number of aggregate tables while a sparsely aggregated warehouse has fewer. Sparse aggregation refers to the fact that a given project only requires as many aggregate fact tables as is useful to its users.
ROLAP, therefore, provides much greater flexibility than MOLAP. Only the aggregate combinations that you determine are beneficial must be created. That is, if the aggregate table is useful in answering frequently-asked queries, its presence provides a response as fast as a MOLAP system can provide. However, if a certain aggregate combination is rarely or never used, the space in the RDBMS does not need to be consumed and the resources to build that table during the batch process do not need to be used.
Not every attribute level or hierarchy intersection is suitable for pre-aggregation. Build aggregate tables only if they can benefit users, since the creation and maintenance of aggregate tables requires additional work by the database administrator. Also, do not waste database space for tables that will not be used.
Consider the following factors when deciding whether to create aggregate tables:
• The frequency of queries at that level—Determining the frequency of queries at a specific level, page 346
• The relationship between the parent and child—Considering any related parent-child relationships, page 347
• The compression ratio—Compression ratio, page 348
Determining the frequency of queries at a specific level
Build aggregate tables only if they can be useful to your users. If aggregate tables are never accessed, they consume disk space and impose unnecessary burdens on the extraction, translation, and loading process, as well as the database backup routines.

Project Design Guide Optimizing and Maintaining Your Project 9
© 2010 MicroStrategy, Inc. Using summary tables to store data: Aggregate tables 347
However, usefulness is not always easy to quantify. For example, consider the following hierarchy:
A summary of data at the department level seems to be a good candidate for an aggregate table. However, if users frequently want to exclude inactive items, the query must use item-level data and summarize the department data dynamically. Therefore, the department aggregate tables would not be used in this situation.
Once your warehouse is in production, trace the usage of any aggregate tables to determine how frequently they are used in a day-to-day business environment. If any table is not used, eliminate it from the warehouse.
MicroStrategy Enterprise Manager allows you to easily track table usage. For more information on Enterprise Manager, see the MicroStrategy System Administration Guide.
Considering any related parent-child relationships
When an aggregate table is created, the child records are usually summarized into the parent record, based on the key combinations in a relationship table. In any hierarchical relationship, when the parent-child relationship is altered, all tables that hold that relationship or data relevant to it must be updated. Whether these relationships are dynamic or static change how they are aggregated into tables.
Dynamic relationships
When the relationship between parent and child elements change, the relationship is called dynamic. These changes often occur because of organizational restructuring; geographical realignment; or the addition, reclassification, or discontinuation of items or services. For example, a store can decide to reclassify the department to which items belong.

Optimizing and Maintaining Your Project Project Design Guide9
348 Using summary tables to store data: Aggregate tables © 2010 MicroStrategy, Inc.
Aggregate tables that contain dynamic relationships must be recalculated every time a change is made. If the tables are large, this process can take time, consume resources, and complicate the batch process. Frequent changes can mean aggregate tables are not optimal for this situation. Consider the frequency of the changes, the table size, and the impact on the batch process, and then balance the disadvantages against the advantages of having an aggregate table.
Also, rolling up an entire hierarchy can avoid many problems with relationship changes. For example, a table contains one value for the sum of all stores. It is not affected by a reorganization within the geography hierarchy.
Static relationships
When elements rarely or never change relationships, they are a part of static relationships. In these cases, maintaining aggregate tables is very easy. For example, time hierarchies are seldom dynamic—days do not migrate into different weeks, and fiscal weeks do not move into different months.
Compression ratio
The process of data aggregation applies an aggregate function, such as sum or average, to a set of child records to produce a single parent record. The average number of child records combined to calculate one parent record is called the compression ratio. One measure of effectiveness of an aggregate table can be estimated from this number, since it represents the decrease in records that must be read to respond to a query at that level.
Recall that some of the reasons to build aggregate tables include the reduction of disk I/O and the number of records that must be dynamically sorted and aggregated. Therefore, pre-aggregating data is effective only if the compression ratio is significant. For example, if the compression ratio is 3:2, the aggregate table requires 2/3 of the base table’s storage space but yields only a 1/3 reduction in the number of records. In contrast, if the compression ratio is 4:1, the aggregate table reduces the number of records by 3/4 and uses only 1/4 of the storage space.
When the number of elements differs significantly between two attributes in the same hierarchy, the compression ratio suggests that an aggregate table can provide more efficient queries. Also, for smaller base tables, the resource demands placed on the database server by dynamic aggregations decrease and therefore so does the effectiveness of pre-aggregation. To determine

Project Design Guide Optimizing and Maintaining Your Project 9
© 2010 MicroStrategy, Inc. Using summary tables to store data: Aggregate tables 349
when pre-aggregation is worthwhile for your system, you must balance the importance of speed of query response time and the availability of disk space and resources to maintain the schema.
For more information on ratios, refer to Cardinalities and ratios, page 32.
Creating aggregate tables
You can integrate aggregate tables in your project using the Warehouse Catalog in MicroStrategy Desktop, as outlined in the following procedure.
To use an aggregate table in an existing project
1 Using the Warehouse Catalog, add the table to the project. For steps to add tables using the Warehouse Catalog, see Adding and removing tables for a project, page 310.
2 Use the new table in the desired fact expressions and attribute form expressions.
If your aggregate table structure is consistent with your base fact table structure, Architect automatically adds it to the definitions of your existing attributes and facts. In other words, Architect is aggregate-aware. How does Architect know to use the aggregate table rather than the base fact table, when either could provide the answer to a query? The answer is logical table size.
The size of tables in a project: Logical table size
MicroStrategy Desktop assigns a size to every table in the project when you first add them to the project. These size assignments are stored in the metadata and are calculated based on the table columns and their corresponding attributes. Because Desktop uses the conceptual or logical attribute definitions when assigning sizes, this measurement is known as the logical table size.
When you run a report, the Analytical Engine chooses the smallest of all tables, based on logical table size, that contains enough data to answer the query. The initial logical table size is based on the number of attribute
Optimizing and Maintaining Your Project Project Design Guide9
350 Dividing tables to increase performance: Partition mapping © 2010 MicroStrategy, Inc.
columns and the various levels at which they exist in their respective hierarchies. For information on defining the logical table size of a table, see Defining logical table sizes, page 388.
Dividing tables to increase performance: Partition mapping
Partition mapping involves the division of large logical tables into smaller physical tables; this division is based on a definable data level, such as month or department. Partitions improve query performance by minimizing the number of tables and records within a table that must be read to satisfy queries issued against the warehouse. By distributing usage across multiple tables, partitions improve the speed and efficiency of database queries.
Time is the most common category for partitioning databases. Partitioning by time limits growth of the database tables and increases stability.
Server versus application partitioning
Partitioning can be managed by either the database server or the MicroStrategy application. Either way, tables are partitioned at the database level. The terms “application” and “server” refer to what manages the partitioned tables, not where the tables are split.
Server-level partitioning
The database server, rather than MicroStrategy, manages the partitioned tables in RDBMS server-level partitioning. The original fact table is not physically broken into smaller tables. Instead, the database server logically partitions the table according to parameters specified by the database administrator. You do not need to take any action in MicroStrategy to support the partitioning.
Since only the logical table is displayed to the end user, the partitioning is transparent to MicroStrategy. In contrast, in application-level partitioning the relational database is unaware of the partitioned tables.
Refer to your database documentation for details on server partitioning for your particular platform.

Project Design Guide Optimizing and Maintaining Your Project 9
© 2010 MicroStrategy, Inc. Dividing tables to increase performance: Partition mapping 351
Application-level partitioning
In application-level partitioning the application, rather than the RDBMS server, manages the partition tables. A partition base table (PBT) is a warehouse table that contains one part of a larger set of data. Partition tables are usually divided along logical lines, such as time or geography. MicroStrategy supports two types of partitioning:
• Metadata partition mapping, page 351—stores the mapping information in the project metadata
• Warehouse partition mapping, page 353—uses a specialized warehouse table to determine which table to access
Metadata partition mapping
Metadata partition mapping is the mapping of partitions where the mapping of partitions is performed and maintained in the project metadata by the application, in this case, MicroStrategy. MicroStrategy manages the mapping between the logical table and the physical tables. This approach makes it easier for you to specify a flexible partitioning schema.
In metadata partition mapping, you specify one or more partitioning attributes in the Metadata Partition Mapping Editor. Next you define what attribute elements within those attributes should point to which PBT. You create all of the rules for choosing the appropriate PBT here and the rules are stored in the MicroStrategy metadata.
For steps to create a metadata partition mapping, refer to the MicroStrategy Desktop online help.
Homogenous and heterogeneous partitions
Metadata partitions can be homogenous or heterogeneous. With heterogeneous partitioning, the PBTs can have different amounts of data stored in them at different levels. For example, one table can contain six months of sales data, while another stores an entire year. The PBT level, or key, refers to how the data is stored. For example, sales data for the current year can be stored at the daily level, while historical sales data is saved by month only. Heterogeneous partitions can therefore require additional long-term maintenance and organization because the data contained in them is stored at various levels throughout the partition.

Optimizing and Maintaining Your Project Project Design Guide9
352 Dividing tables to increase performance: Partition mapping © 2010 MicroStrategy, Inc.
MicroStrategy stores one PBT level for each partition. If all the PBTs within a partition are not stored at the same level, the highest PBT level is used as the PBT level of the partition. For instance, if all the sales data in the previous example is stored in one partition, you cannot access current sales at the day level. This is because the PBT level for the partition is month, which is higher than day. If you save current data in a partition at the daily level and the historical data in another partition at the month level, you are able to fully access the data.
In contrast, homogenous partitions must have the same amount of data stored at the same PBT level. The logical structure of the PBTs must be the same, that is, they must have the same facts and attributes defined. To continue with the previous examples, each table must store one year of data at the month level. Homogeneous partitions work well for frequently-accessed data such as information about the previous year.
When you define the particular PBT to which an attribute is linked in MicroStrategy, you do not need to specify whether or not the PBT is homogeneous or heterogeneous. MicroStrategy makes the distinction automatically depending, in part, on how the data is stored in the PBT.
Data slices
After PBTs are created, you define a data slice. The data slice acts as a filter that describes what portions of data are placed in the partition table. Based on this data slice, the MicroStrategy engine knows which table to get data from when generating the SQL.
A data slice holds the parameters that a partition is based upon, for example, Month=January. Instead of retrieving data for all months, the server knows to access a particular table that contains the data for January only. By creating a data slice with the partition, you can retrieve specific data quickly without time-consuming joins and searches.
It is important to create a reasonable and valid data slice because MicroStrategy cannot verify its accuracy or relevance. The data slice must make sense for the data. A poorly crafted data slice can lead to errors from generating incorrect SQL and retrieving the wrong data.
Data slicing displays and can be modified only for the metadata partitioning. Each partition mapping table must include at least one data slice. In a heterogeneous mapping, data slices can exist at different levels and can be composed of different keys.

Project Design Guide Optimizing and Maintaining Your Project 9
© 2010 MicroStrategy, Inc. Dividing tables to increase performance: Partition mapping 353
Attribute qualifications
To create data slices, you use attribute qualifications. Attribute qualifications are types of filters that are applied to attribute forms. These qualifications allow you to limit the type and amount of data that is returned for a report. For example, if you create a report that contains the attribute Country but you want to return only the data for France, you can create a qualification on the attribute Country and select France as the element that appears on the report.
For steps to create a data slice, refer to the MicroStrategy Desktop online help.
Warehouse partition mapping
Warehouse partition mapping is the mapping of partitions, where the mapping is performed by and maintained in the data warehouse. You can define a warehouse partition by using the MicroStrategy Warehouse Catalog to add a table with a special structure. This table contains the map for the partition, and is stored in the warehouse. Warehouse partitions divide tables physically along any number of attributes, although this is not visible to the user.
Warehouse partitions must be homogenous, unlike metadata partitions, so that the same amount of data is stored at the same PBT level and the same facts and attributes are defined. Homogenous partitioning divides data of equal levels, like January and February. A sample fact table and warehouse partitioning table are shown below for months. Note how the data exists at equal levels, for example, different months of the same year.

Optimizing and Maintaining Your Project Project Design Guide9
354 Dividing tables to increase performance: Partition mapping © 2010 MicroStrategy, Inc.
The original fact table, which contains all of the data, is not brought into the project. Rather, the database administrator creates multiple smaller physical tables in the data warehouse. Each table contains a subset of the data in the original fact table. The database administrator is responsible for keeping the partitions consistent and up-to-date. He or she must also create and maintain a partition mapping table (PMT), which is used to identify and keep track of the partitioned base tables as part of a logical whole.
After the PMT is created, when you run a report in Desktop or Web that requires information from one of the PBTs, the Query Engine first runs a pre-query to the PMT to determine which PBT to access to bring the data back for the report. The pre-query requests the PBT names associated with the attribute IDs from the filtering criteria. When it finds the name of the PBT, it calls the SQL Engine to write the appropriate SQL for the warehouse.
When using warehouse partition mapping, it is usually not necessary to bring in the individual PBT tables into the project. Doing so can cause errors if such tables are mistakenly mapped directly to schema objects. You should only include the PMT table in the project. With this strategy you can map all related schema objects to the PMT, which then accesses the correct PBT in the warehouse.
Note the following:
• There are no data slices in a warehouse partition.
• MicroStrategy supports warehouse partitions on both upgraded and newly created projects. These are added using the Warehouse Catalog Browser. For steps to add warehouse partitions, refer to the MicroStrategy Desktop online help.
Metadata versus warehouse partition mapping
Metadata partition mapping does not require any additional tables in the warehouse. Metadata partition mapping is generally recommended over warehouse partition mapping in MicroStrategy. However, if you already have warehouse partition tables set up and are migrating to a newer version of MicroStrategy, you can continue to use the warehouse partitions. If you are creating partitions for the first time, however, it is recommended you implement metadata partition mapping.
Metadata partition mapping is recommended because you create the rules in MicroStrategy that the Query Engine uses to generate the SQL to run reports. Because you create the partitions directly in the metadata, it is easier to maintain.

Project Design Guide Optimizing and Maintaining Your Project 9
© 2010 MicroStrategy, Inc. Dividing tables to increase performance: Partition mapping 355
Metadata partition mapping also allows both heterogeneous and homogenous partitions, unlike warehouse partition mapping. With heterogeneous partitions, the PBTs can have different amounts of data stored in them at different levels. Only homogenous partitions can be used in warehouse partition mapping. For steps to map partitions, refer to the MicroStrategy Desktop online help.

Optimizing and Maintaining Your Project Project Design Guide9
356 Dividing tables to increase performance: Partition mapping © 2010 MicroStrategy, Inc.

© 2010 MicroStrategy, Inc. 357
1010.CREATING TRANSFORMATIONS TO DEFINE TIME-BASED AND OTHER COMPARISONS
Introduction
Suppose you want to compare how much revenue your company grew last year to how much it grew this year. This type of analysis, called a TY/LY comparison (This Year versus Last Year), is a commonly used form of time-series analysis and is relevant to many different industries, including retail, banking, and telecommunications.
Transformations—schema objects you can create using attributes in your project—are one of the many MicroStrategy techniques used to perform time-series analysis.
To calculate a variance or a growth percentage such as last year’s revenue versus this year’s revenue, it is very convenient to use a transformation. Transformations are often the most generic approach and can be reused and applied to other time-series analyses. To use a transformation, a report designer creates a metric and applies the transformation to it.
Transformation-style analysis can also be supported using the Lag and Lead functions provided with MicroStrategy. These functions can be used to define metrics that compare values from different time periods without the use of transformations. For information on using these functions to support transformation-style analysis, see the Functions Reference.
Creating Transformations to Define Time-Based and Other Comparisons Project Design Guide10
358 Creating transformations © 2010 MicroStrategy, Inc.
This chapter discusses the different types of transformations and how to create them. It is assumed that you have some understanding of what metrics are, as transformation metrics are discussed in this chapter. For information on metrics and using transformations in metrics and reports, see the Metrics chapter of the MicroStrategy Advanced Reporting Guide.
Creating transformationsA transformation is a schema object that typically maps a specified time period to another time period, applying an offset value, such as current month minus one month.
Usually defined by a project designer, transformations are used in the definition of a metric to alter the behavior of that metric. Such a metric is referred to as a transformation metric. For example, time-related transformations are commonly used in metrics to compare values at different times, such as this year versus last year or current date versus month-to-date. Any transformation can be included as part of the definition of a metric and multiple transformations can be applied to the same metric. Transformation metrics are beyond the scope of this guide; for information about transformation metrics, refer to the MicroStrategy Advanced Reporting Guide.
Recall the example used in the introduction, the TY/LY comparison. To calculate this year’s revenue, you can use the Revenue metric in conjunction with a filter for this year. Similarly, to calculate last year's revenue, you can use the Revenue metric in conjunction with a filter for last year. However, a more flexible alternative is to use a previously created Last Year transformation in the definition of a new metric, last year’s revenue. With a single filter, on 2003 for example, the two metrics Revenue and Last Year Revenue give you results for 2003 and 2002, respectively.
Since a transformation represents a rule, it can describe the effect of that rule for different levels. For instance, the Last Year transformation intuitively describes how a specific year relates to the year before. It can in addition express how each month of a year corresponds to a month of the prior year. In the same way, the transformation can describe how each day of a year maps to a day of the year before. This information defines the transformation and abstracts all cases into a generic concept. That is, you can use a single metric with a last year transformation regardless of the time attribute contained on the report.

Project Design Guide Creating Transformations to Define Time-Based and Other Comparisons 10
© 2010 MicroStrategy, Inc. Creating transformations 359
While transformations are most often used for discovering and analyzing time-based trends in your data, not all transformations have to be time-based. An example of a non-time-based transformation is This Catalog/Last Catalog, which might use Catalog_ID-1 to perform the transformation.
Expression-based versus table-based transformations
The definition of the association between an original value and a transformed one can be represented in an expression that uses columns of the warehouse, constants, arithmetic operators, and mathematical functions. This is known as an expression-based transformation. However, it is sometimes desirable to precalculate these values and store them in a table designed for the transformation. This method is sometimes referred to as a table-based transformation.
The advantage of a table-based transformation is the possible use of indexing to speed query times. Another advantage is that table-based transformations provide additional flexibility beyond what formula expressions can produce. The drawback of this kind of transformation is that it requires the creation and management of an additional table in the warehouse. However, once the table is created, it usually significantly decreases the query time. Returning to the TY/LY example, you have the option of using a simple formula such as Year_ID - 1 in the definition of the transformation or precalculating the data and storing it in a column in a table.
A table-based transformation is required when a many-to-many transformation is performed. An example is a year-to-date calculation.
A significant advantage to the dynamic calculation of an expression-based transformation is that the database administrator does not have to create and maintain a transformation table. The drawback is that the system must perform the calculation every time.
A single transformation can use a combination of table-based and expression-based transformations. For example, you can create a last year transformation based on Year and Month. The ID of the Year attribute is in the format YYYY, so the transformation can use the expression Year_ID - 1. The ID for the Month attribute is in the format ‘MonthName,’ so you cannot easily use a mathematical expression. You must use a table instead. The following sections walk you through creating both a table-based transformation and an expression-based one.

Creating Transformations to Define Time-Based and Other Comparisons Project Design Guide10
360 Creating transformations © 2010 MicroStrategy, Inc.
Building a table-based transformation
The following example shows how to create a last year transformation based on a lookup table in MicroStrategy Tutorial, which pairs each year with the previous year. This transformation is used in the report displayed below, which compares revenue for this year and last year.
Creating the transformation metric and the report are discussed in the Transformation metrics section in the Metrics chapter of the MicroStrategy Advanced Reporting Guide.
To create a last year transformation based on a table
1 Log in to the project source that contains your project in MicroStrategy Desktop and expand your project.
2 From the File menu, point to New, and select Transformation. The Transformation Editor opens with the Select a Member Attribute dialog box displayed.
3 Double-click Time to open the folder, then double-click Year. The Year - Define a new member attribute expression dialog box opens.
4 Select the LU_Year table from the Table drop-down list. The table's columns appear in the Available columns list. Notice that this table contains a previous year column, which maps this year to last year.
5 Double-click the PREV_YEAR_ID column to place it in the expression box.

Project Design Guide Creating Transformations to Define Time-Based and Other Comparisons 10
© 2010 MicroStrategy, Inc. Creating transformations 361
6 Click OK.
7 Click Save and Close on the toolbar. Name the transformation Last Year (Table).
You have now created the transformation. A report designer can now use the transformation in a revenue metric to calculate last year’s revenue, then create a report using that transformation metric to obtain last year’s revenue.
Building an expression-based transformation
This example shows how to create a last year transformation using an expression rather than a table. The Year_ID is in the format YYYY, so the previous year is simply Year_ID minus one. For example, one subtracted from the year 2005 results in the previous year, 2004.
This transformation is added to the report shown in the table-based transformation example above. The resulting report is displayed below.
Note the following:
• Creating the transformation metric and the report are discussed in the Transformation metrics section in the Metrics chapter of the MicroStrategy Advanced Reporting Guide.
• The performance of reports that use expression-based transformations can be improved in certain scenarios using the Transformation Optimization VLDB property. For information on this VLDB property and how it can improve report performance, see the System Administration Guide.
Creating Transformations to Define Time-Based and Other Comparisons Project Design Guide10
362 Transformation components © 2010 MicroStrategy, Inc.
To create a last year transformation based on an expression
1 In MicroStrategy Desktop, from the File menu, point to New, and select Transformation. The Transformation Editor opens with the Select a Member Attribute dialog box displayed.
2 Double-click Time to open the folder, then double-click Year. The Year - Define a new member attribute expression dialog box opens.
3 Select the LU_Year table from the Table drop-down list. The table's columns appear in the Available columns list.
4 Double-click the YEAR_ID column to place it in the expression box.
5 Type -1 in the expression box. The transformation will subtract 1 from the Year ID to calculate last year’s ID.
6 Click Validate. The message “Valid expression” appears with a green check mark.
7 Click OK.
8 Click Save and Close on the toolbar. Name the transformation Last Year (Expression).
You have now created the last year transformation. A report designer can now use the transformation in a revenue metric to calculate last year’s revenue, then add it to the report created in the previous example.
Transformation componentsAll transformations have the following components:
• Member attributes: This component contains the attributes to which the transformation applies, that is, the different levels to which the rule applies.
For example, in the Last Year transformation in the MicroStrategy Tutorial, the member attributes are Year, Quarter, Month, and Day.
• Member tables: These tables store the data for the member attributes.

Project Design Guide Creating Transformations to Define Time-Based and Other Comparisons 10
© 2010 MicroStrategy, Inc. Transformation components 363
For an expression-based transformation, each member expression is based on a specific table, generally the lookup table corresponding to the attribute being transformed.
For a table-based transformation, this is the transformation table defining the relationship. For example, in the Last Year transformation, the member tables are LU_YEAR, LU_QUARTER, LU_MONTH, and LU_DAY, for the member attributes Year, Quarter, Month, and Day, respectively.
• Member expressions: Each member attribute has a corresponding expression.
For an expression-based transformation, this is a mathematical expression. In the most generic case, this expression uses constants, arithmetic operators, mathematical functions, and columns from the warehouse, typically the attribute ID column.
For example, you can create a Last Year transformation using Year_ID-1 as the expression. However, many cases can exist where the data is not conducive to such calculation. For instance, if you store Month as 200001 (January 2000), you cannot subtract one and receive December 1999 as the result.
For a table-based transformation, this is simply a column from a specific warehouse table specifically populated with data supporting the transformation. The rule is then not encapsulated in an expression but directly in the data of the column. Since the data defines the rule, this approach provides considerable flexibility in the transformation definition. It is particularly effective when no straightforward formula can express the rule. In fact, in the case of a many-to-many transformation, a separate table is required.
For example, in the Last Year transformation, the member expressions are LY_DAY_DATE, LY_MONTH_ID, LY_QUARTER_ID, and PREV_YEAR_ID. These are all columns from the lookup tables set in the Member tables field.
• Mapping type: This component determines how the transformation is created based on the nature of the data. The mapping can be one of the following:
One-to-one: A typical one-to-one relationship is “last year to this year.” One day or month this year maps exactly to one day or month from last year.

Creating Transformations to Define Time-Based and Other Comparisons Project Design Guide10
364 Transformation metrics and joint child attributes © 2010 MicroStrategy, Inc.
Many-to-many: A typical many-to-many relationship is year-to-date. For one date, many other dates are included in the year-to-date calculation.
Many-to-many transformations can lead to double-counting scenarios. For example, consider YearToDate defined as a many-to-many transformation and Revenue (YTD) as a transformation metric. Suppose this metric is used on a report that does not include the Day attribute, which is the member attribute on the template. In the report, a range of dates is specified in the filter. In this instance, the Revenue (YTD) metric will double count.
Transformation metrics and joint child attributes
Review the discussion of joint child attributes and relationships in Joint child relationships, page 263 before proceeding in this section.
In a report, a transformation metric displays the current attribute with transformed data, that is, the values for the transformation. For example, a report contains Quarter and the transformation metric Last Year’s Revenue. Each quarter is displayed, with the previous year’s revenue, as shown below:
When a joint child attribute—an attribute that exists at the intersection of other indirectly related attributes—is added, a conflict arises.
For more information about joint child attributes, see Joint child relationships, page 263.
For example, the joint child attribute Promotion is added to the previous report. The joint child attribute cannot be transformed because not all of its joint children—Quarter and Item—are time-related. The report displays the

Project Design Guide Creating Transformations to Define Time-Based and Other Comparisons 10
© 2010 MicroStrategy, Inc. Transformation metrics and joint child attributes 365
quarter, the promotion associated with a given quarter, and the revenue data from the date-promotion combination, minus one year. A sample report is shown below:
The displayed attributes should still be current, displaying transformed data. However, since the joint child attribute Promotion essentially exists in both the time dimension and a non-time dimension, it is not intuitive how the transformation should be performed.
Notice that the Valentine’s Day promotion existed in 2003 but not in 2002. While you may want to see it listed for 2002, remember that only the metric values are transformed, not the attributes. That is, since the Valentine’s Day promotion was not run in 2002, the Valentine’s Day-Q1 2002 combination cannot be displayed on the report. In summary, the Valentine’s Day promotion is not listed for Q1 2002 despite the existence of the last year transformation. This is the case because, again, transformations “transform” metric values such as Revenue, but not attributes such as Promotion.

Creating Transformations to Define Time-Based and Other Comparisons Project Design Guide10
366 Transformation metrics and joint child attributes © 2010 MicroStrategy, Inc.

© 2010 MicroStrategy, Inc. What is the MicroStrategy Tutorial? 367
AA.MICROSTRATEGY TUTORIAL
Introduction
This appendix provides information on the MicroStrategy Tutorial, including the data model and physical warehouse schema.
What is the MicroStrategy Tutorial?The MicroStrategy Tutorial is a MicroStrategy project, which includes a metadata and warehouse, and a set of demonstration applications designed to illustrate the features of the MicroStrategy platform.
A project is the highest-level of intersection of a data warehouse, metadata repository, and user community. Conceptually, the project is the environment in which all related reporting is done. A typical project contains reports, filters, metrics, and functions. You create projects that users access to run reports.
The theme of the MicroStrategy Tutorial project is a retail store for the time 2006 to 2008 that sells electronics, books, movies and music. The key features of the MicroStrategy Tutorial project include the following:

MicroStrategy Tutorial Project Design GuideA
368 What is the MicroStrategy Tutorial? © 2010 MicroStrategy, Inc.
• Hierarchies, including Customer, Geography, Products, and Time. Each hierarchy can be viewed graphically through MicroStrategy Desktop and MicroStrategy Web.
• Numerous customers and purchased items.
• Reporting areas: Customer Analysis, Enterprise Performance Management, Human Resources Analysis, Inventory and Supply Chain Analysis, Sales and Profitability Analysis, and Supplier Analysis.
• Options to create reports from MicroStrategy Desktop and MicroStrategy Web focusing on a particular analysis area, such as Customer, Inventory, Time, Products, Category, Employee, or Call Center.
MicroStrategy Tutorial reporting areas
MicroStrategy Tutorial reports and documents are grouped into various folders within the Public Objects\Reports folder of the MicroStrategy Tutorial project. These reports and documents are grouped into the following folders:
• Business Roles: This folder contains subfolders that reflect different types of business intelligence users within an organization, including Billing Managers, Brand Managers, Category Managers, Company Executives, District Sales Managers, Operations Managers, Regional Sales Managers, and Suppliers.
Each subfolder contains reports that would be of interest to the type of business user for which the subfolder is named. For instance, the Billing Managers folder contains an Invoice report and a customer-level transaction detail report. The Supplier folder contains a Supplier Sales report, and the Brand Managers subfolder contains a report called Brand Performance by Region.
• Dashboards and Scorecards: This folder contains various examples of different types of scorecards and dashboards. Using of MicroStrategy Report Services documents, you can create scorecards and dashboards. A Report Services document of this type is a visually intuitive display of data that summarizes key business indicators for a quick status check. Dashboards usually provide interactive features that let users change how they view the dashboard’s data. For information on creating and using dashboards, scorecards, and other Reporting Services documents, see the Report Services Document Creation Guide.
• Enterprise Reporting Documents: This folder contains examples of different types of standard enterprise reporting documents, such as scorecards and dashboards, managed metrics reports, production and

Project Design Guide MicroStrategy Tutorial A
© 2010 MicroStrategy, Inc. What is the MicroStrategy Tutorial? 369
operational reports, invoices and statements, and business reports. They are a sample of the types of reporting documents that can be built using MicroStrategy Report Services.
• MicroStrategy Platform Capabilities: This folder contains examples of many of the sophisticated capabilities within the MicroStrategy platform. Evaluators of the software, as well as customers, can use the examples to get a better feel for many of the platform’s capabilities. Customers can use the examples to guide the development of there own MicroStrategy applications.
The subfolders under these folders are named according to the capabilities that their reports exemplify. For example, the Graph Styles folder contains examples of most of the graph types that can be created in MicroStrategy, the MicroStrategy Data Mining Services folder contains examples of Linear Regression models and other data mining models built within MicroStrategy, and the MicroStrategy Mobile folder contains examples of reports and documents that can be viewed on a BlackBerry, iPhone, or iPad through the use of MicroStrategy Mobile.
• Subject Areas: This folder contains reports that are categorized further by topic. Topics covered include Customer Analysis, Enterprise Performance Management, Human Resource Analysis, Inventory and Supply Chain Analysis, Sales and Profitability Analysis, and Supplier Analysis.
Customer Analysis: Reports analyzing the customer base, studying areas such as Customer Income, Customer Counts, Revenue per Customer, and Revenue Growth.
Daily Analysis: Dashboards and reports containing information about sales, cost, revenue, revenue forecast, profit, and profit margins that are used to analyze the typical workflow of a company. The dashboards and reports are useful for a standard MicroStrategy demonstration.
Enterprise Performance Management: Reports containing information on revenue amounts, trends and forecasts, profits, profit margins, and profit forecasts. These reports make it easy for an executive at any level of the company to understand how the company is performing as a whole or at the region, category, and subcategory levels.
Human Resource Analysis: Reports containing information on employees, including headcount, birthdays, length of employment, and the top five employees by revenue. These reports are based on employees, time, geography, and sales. The Human Resources

MicroStrategy Tutorial Project Design GuideA
370 What is the MicroStrategy Tutorial? © 2010 MicroStrategy, Inc.
Analysis reports provide insight into human capital so that managers can boost the efficiency and effectiveness of their employees. Human Resource Representatives can highlight under-performing employees and misallocated headcount. Managers at all levels can focus on the performance of their employees, drill down to an individual employee detail level, view trends, and extract intelligence not otherwise evident.
Inventory and Supply Chain Analysis: Reports containing information based on supplier, product, cost, revenue and profit, such as Inventory and Unit Sales, or Inventory Received from Suppliers by Quarter. The Inventory reports track inventory information within the company and through to suppliers. Essentially, these reports show how many units of an item are on hand, how many are expected from a particular supplier, and how many units have been sold. Inventory reports are used to ensure that the supply chain is as efficient as possible. Using these reports, employees can analyze trends and details, quickly adjust inventory and distribution, and understand underlying supply chain costs and inefficiencies.
Sales and Profitability Analysis: Reports analyzing revenue and profit from multiple perspectives. Examples include Sales by Region, Revenue over Time, and Brand Performance by Region. The Product Sales reports allow managers and analysts to monitor and analyze sales trends, track corporate revenue goals, compare store-to-store performance, and respond more quickly and accurately to feedback from the marketplace. In turn, executives can analyze sales trends and details, quickly adjust pricing and promotions, identify product affinities and key profit centers, and understand costs and revenue trends.
Supplier Analysis: Reports containing supplier, sales, profit, and revenue information, such as Brand Sales by Supplier, Supplier Sell-Through Percentage, and Units Sold and Profit by Supplier. The Supplier reports allow managers and analysts to monitor and analyze vendor performance so that they can quickly identify performance problems. These reports track brands and items sold that came from a particular vendor. They also correlate profit and revenue information with particular suppliers so that relationships with key vendors can be strengthened.
You can deploy the out-of-the-box documents to your project by reconciling the documents' content to your own project objects. For example, you can use any of the Tutorial documents or dashboards mentioned above, or any of the documents and dashboards in the Analytical Modules, in your own project. To do this, you use the portable documents feature. A portable document contains all the design of the document without the data, allowing

Project Design Guide MicroStrategy Tutorial A
© 2010 MicroStrategy, Inc. MicroStrategy Tutorial data model 371
you to copy documents between projects, even when the projects do not have the same metadata. When you import the document into the replacement project, you map the document to the new project (referred to as reconciling the document). For instructions on creating and reconciling portable documents, see the Advanced Documents chapter of the Document Creation Guide.
MicroStrategy Tutorial data modelA logical data model graphically depicts the flow and structure of data in a business environment. It provides a way of organizing facts so that they can be analyzed from different business perspectives. For example, a simple logical data model for a retail company can organize all necessary facts by store, product, and time, which are the three common business perspectives typically associated with retail business.
For detailed information about data modeling, see Chapter 2, The Logical Data Model.
For MicroStrategy Tutorial, the areas of analysis discussed earlier, Customer Analysis, Human Resources Analysis, and so on, are organized into the following hierarchical groupings:
• Geography hierarchy, page 372
• Products hierarchy, page 374
• Customers hierarchy, page 375
• Time hierarchy, page 378

MicroStrategy Tutorial Project Design GuideA
372 MicroStrategy Tutorial data model © 2010 MicroStrategy, Inc.
Data modeling notations
The following notations are used in graphical depictions of hierarchies.
Geography hierarchy
The Geography hierarchy contains attributes such as Country and Region, as well as Distribution Center, Call Center, and employee-specific attributes. It is easy to understand why Country and Region are in the Geography hierarchy, but what about Distribution Center, Call Center, and the employee-related attributes?
The data used in MicroStrategy Tutorial is based upon a fictitious company that sells electronics, movies, music, and books. The company does not have physical stores, but instead does its business from catalog and Web sales. Customers review the products in a printed or online catalog and call in their order over the phone. The order is then processed by an employee located at one of the call centers. The order is then fulfilled by a distribution center that holds the correct item and sends it through one of the shippers.
Symbol Indicates Definition
entry point An entry point is a shortcut to an attribute element in the Data Explorer. Creating an entry point grants you faster access to the attribute without having to browse through multiple attributes to reach different levels of the hierarchy.
attribute A data level defined by the system architect and associated with one or more columns in the data warehouse lookup table. Attributes include data classifications like Region, Order, Customer, Age, Item, City, and Year. They provide a handle for aggregating and filtering at a given level.
one-to-many relationship
An attribute relationship in which every element of a parent attribute relates to multiple elements of a child attribute, while every element of the child attribute relates to only one element of the parent. The one-to-many attribute relationship is the most common in data models.
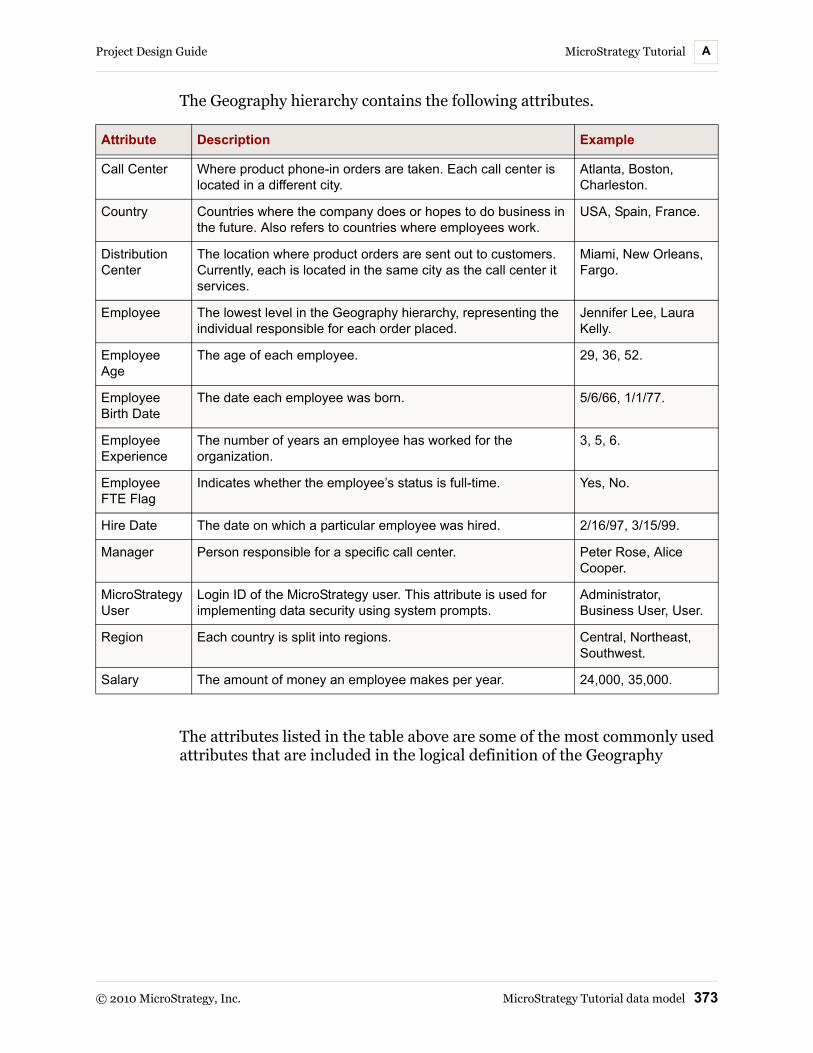
Project Design Guide MicroStrategy Tutorial A
© 2010 MicroStrategy, Inc. MicroStrategy Tutorial data model 373
The Geography hierarchy contains the following attributes.
The attributes listed in the table above are some of the most commonly used attributes that are included in the logical definition of the Geography
Attribute Description Example
Call Center Where product phone-in orders are taken. Each call center is located in a different city.
Atlanta, Boston, Charleston.
Country Countries where the company does or hopes to do business in the future. Also refers to countries where employees work.
USA, Spain, France.
Distribution Center
The location where product orders are sent out to customers. Currently, each is located in the same city as the call center it services.
Miami, New Orleans, Fargo.
Employee The lowest level in the Geography hierarchy, representing the individual responsible for each order placed.
Jennifer Lee, Laura Kelly.
Employee Age
The age of each employee. 29, 36, 52.
Employee Birth Date
The date each employee was born. 5/6/66, 1/1/77.
Employee Experience
The number of years an employee has worked for the organization.
3, 5, 6.
Employee FTE Flag
Indicates whether the employee’s status is full-time. Yes, No.
Hire Date The date on which a particular employee was hired. 2/16/97, 3/15/99.
Manager Person responsible for a specific call center. Peter Rose, Alice Cooper.
MicroStrategy User
Login ID of the MicroStrategy user. This attribute is used for implementing data security using system prompts.
Administrator, Business User, User.
Region Each country is split into regions. Central, Northeast, Southwest.
Salary The amount of money an employee makes per year. 24,000, 35,000.
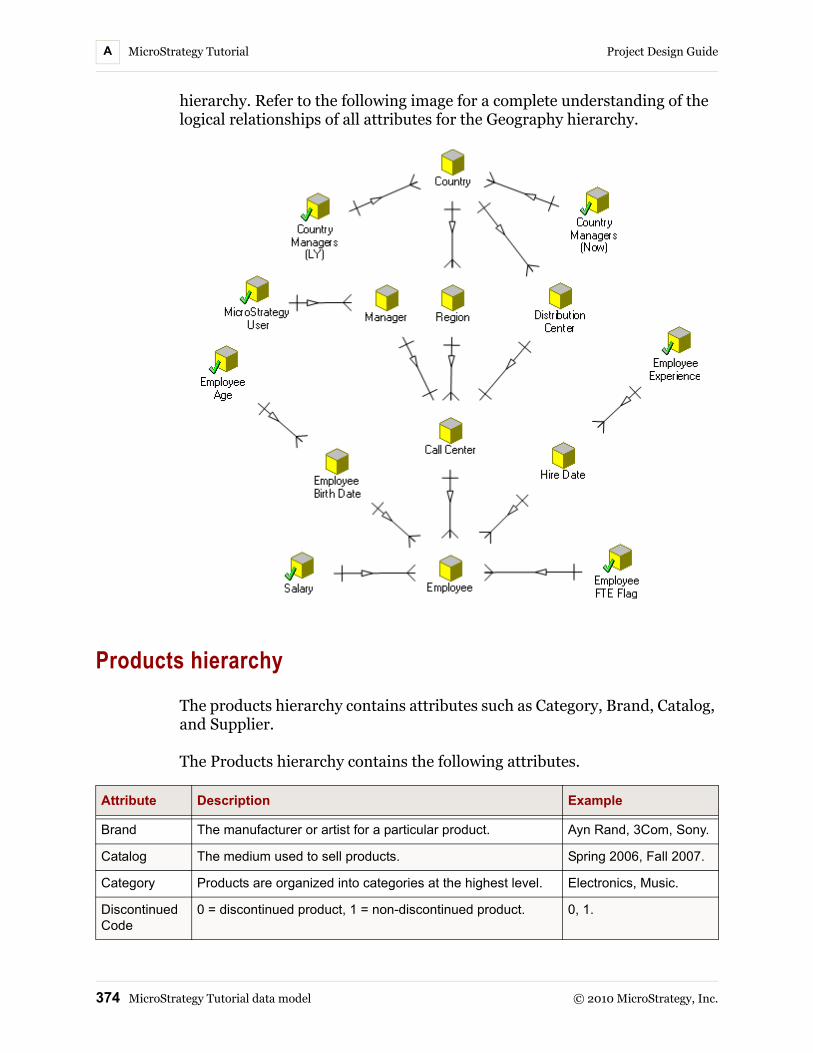
MicroStrategy Tutorial Project Design GuideA
374 MicroStrategy Tutorial data model © 2010 MicroStrategy, Inc.
hierarchy. Refer to the following image for a complete understanding of the logical relationships of all attributes for the Geography hierarchy.
Products hierarchy
The products hierarchy contains attributes such as Category, Brand, Catalog, and Supplier.
The Products hierarchy contains the following attributes.
Attribute Description Example
Brand The manufacturer or artist for a particular product. Ayn Rand, 3Com, Sony.
Catalog The medium used to sell products. Spring 2006, Fall 2007.
Category Products are organized into categories at the highest level. Electronics, Music.
Discontinued Code
0 = discontinued product, 1 = non-discontinued product. 0, 1.

Project Design Guide MicroStrategy Tutorial A
© 2010 MicroStrategy, Inc. MicroStrategy Tutorial data model 375
The attributes listed in the table above are some of the most commonly used attributes that are included in the logical definition of the Products hierarchy. Refer to the following image for a complete understanding of the logical relationships of all attributes for the Products hierarchy.
Customers hierarchy
The Customers hierarchy contains customer demographic and purchase information, such as Customer Age, Income Bracket, Payment Method, and Ship Date.
Item The individual product sold. The Great Gatsby, Sony Discman.
Subcategory Used to further differentiate a subset of products within a category.
Business, Cameras, Drama.
Supplier The distributor for a set of brands. McGraw Hill, Disney Studios.
Warranty The time period in months during which a manufacturer repairs a broken item (specific to Narrowcast Server).
3, 5.
Attribute Description Example

MicroStrategy Tutorial Project Design GuideA
376 MicroStrategy Tutorial data model © 2010 MicroStrategy, Inc.
The Customers hierarchy contains the following attributes.
Attribute Description Example
Age Range The segregation of customers between a certain age group.
24 and under, 28 and above.
Customer The name of the individual customer. Selene Allen, Chad Laurie.
Customer Address
The postal address of the customer. 1717 Mcknight Ln, 1734 Benson St.
Customer Age The age of a particular customer at a current point in time.
26, 38, 59.
Customer Birth Date
The date on which the Customer was born. 8/4/50, 4/30/72.
Customer City The city where the customer resides. Albany, Chicago, Memphis.
Customer Country
The country where the customer resides. USA, Spain, France.
Customer Email The email address of the customer. [email protected], [email protected].
Customer Gender
The gender of the customer. Male, Female.
Customer Region
The region where the customer resides. Northeast, South, France.
Customer State The state where the customer resides. Maine, North Dakota.
Days to Ship The number of days remaining for the order to be shipped from the Distribution Center.
1, 5, 6.
Education Level The highest level of education of the customer. High School, Undergraduate, Graduate.
First Order Date The date of the first order placed by the customer. 2/14/2007.
Household Count
The number of houses owned by the customer. 2, 4, over 6.
Housing Type The type of housing owned by the customer. Renter, Owner, Dependent.
Income Bracket The salary range reported by the customer. $31,000 - 40,000, $61,000 - 70,000.
Last Order Date The date of the last order placed by the customer. 2/28/2009.
Marital Status The marital status of the customer. Married, Single.
Order The tracking number associated with a particular group of items purchased.
167, 2635.
Payment Method
The way a customer pays for an order. Amex, Check.

Project Design Guide MicroStrategy Tutorial A
© 2010 MicroStrategy, Inc. MicroStrategy Tutorial data model 377
The attributes listed in the table above are some of the most commonly used attributes that are included in the logical definition of the Products
Phone Plan The type of phone plan purchased by the customer. Student, Single, Double, Family Small.
Phone Usage The current phone usage of the customer that includes the time, date, and billing details of the call.
Active Months: 24, Average Minutes Off-peak: 412.60294, Average Minutes On-peak: 91.54584, Expire Date: 12/14/2009 12:00:00 am.
Promotion Date range for a particular discount period under which an item is purchased (Sales Date).
9/1/06 - 9/4/06, 2/16/07 - 2/19/07.
Promotion Type Type of discount period offered (Sale type). Holiday Sale, Back-to-School Sale.
Rush Order Indicates whether a customer chose to expedite delivery of an order.
1 (rush order), 0 (not a rush order).
Ship Date The date on which an order is shipped from the distribution center.
9/15/06, 3/26/07.
Shipper The vendor used to send products to the customer. Pronto Packages, MailFast.
Status The current account status of the customer. New, Active.
Zip Code The zip code of the area where the customer resides. 07026, 36303.
Attribute Description Example

MicroStrategy Tutorial Project Design GuideA
378 MicroStrategy Tutorial data model © 2010 MicroStrategy, Inc.
hierarchy. Refer to the following image for a complete understanding of the logical relationships of all attributes for the Products hierarchy.
Time hierarchy
The Time hierarchy contains time-specific attributes such as Year, Quarter, Month, and Day.
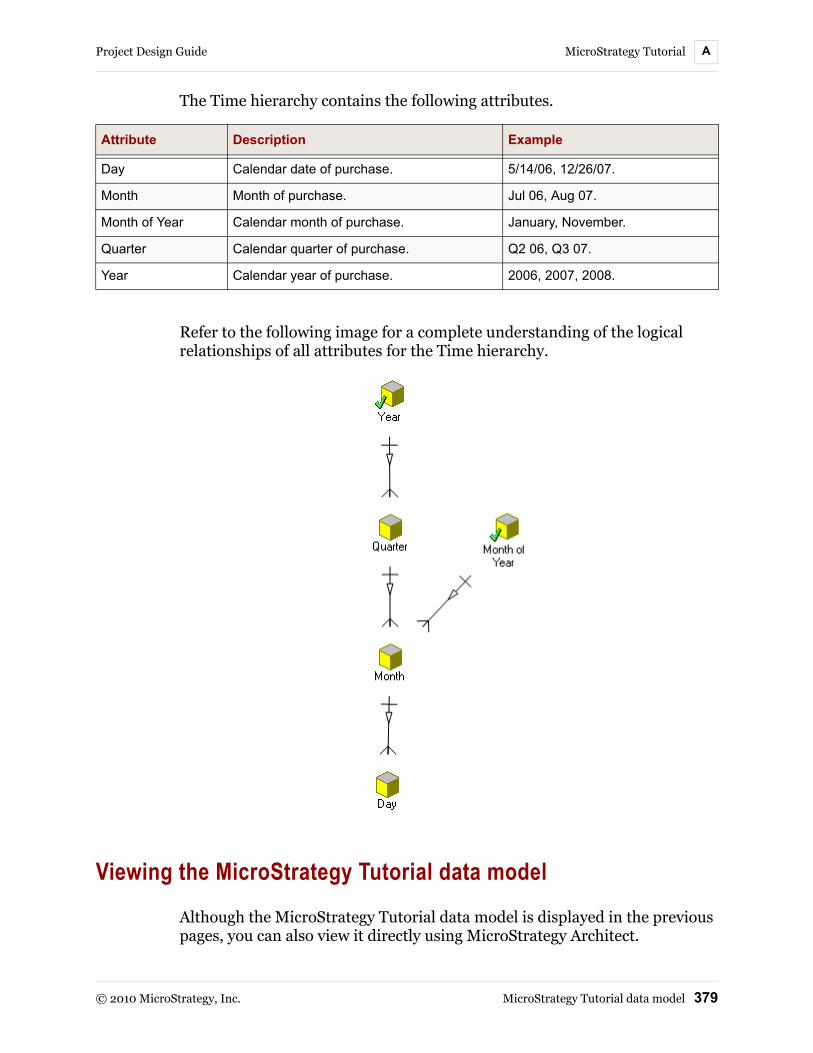
Project Design Guide MicroStrategy Tutorial A
© 2010 MicroStrategy, Inc. MicroStrategy Tutorial data model 379
The Time hierarchy contains the following attributes.
Refer to the following image for a complete understanding of the logical relationships of all attributes for the Time hierarchy.
Viewing the MicroStrategy Tutorial data model
Although the MicroStrategy Tutorial data model is displayed in the previous pages, you can also view it directly using MicroStrategy Architect.
Attribute Description Example
Day Calendar date of purchase. 5/14/06, 12/26/07.
Month Month of purchase. Jul 06, Aug 07.
Month of Year Calendar month of purchase. January, November.
Quarter Calendar quarter of purchase. Q2 06, Q3 07.
Year Calendar year of purchase. 2006, 2007, 2008.

MicroStrategy Tutorial Project Design GuideA
380 MicroStrategy Tutorial schema © 2010 MicroStrategy, Inc.
To view the MicroStrategy Tutorial data model using Architect
1 If you are not already using the MicroStrategy Tutorial, log in to the project source containing the MicroStrategy Tutorial and expand the MicroStrategy Tutorial project. You must log in as a user with administrative privileges.
2 Right-click the MicroStrategy Tutorial project and select Architect. MicroStrategy Architect opens.
3 From the Hierarchy View, in the Hierarchies drop-down list, select System Hierarchy. The system hierarchy is displayed.
A project’s system hierarchy defines the relationships between all the attributes in a project. Attribute relationships determine how the engine generates SQL, how tables and columns are joined and used, and which tables are related to other tables. For information on defining attribute relationships using Architect, see Defining attribute relationships, page 166.
4 From the hierarchies drop-down list you can select a different hierarchy such as Customers, Geography, Products, and Time. These are user hierarchies that define browsing and drilling functionality between attributes. For information on creating user hierarchies using Architect, see Creating and modifying user hierarchies, page 173.
5 To save the layout display of a hierarchy, from the File menu, select Export Image. Type a name and select an image type to save the image as, and click Save.
MicroStrategy Tutorial schemaA schema is a logical and physical definition of warehouse data elements, physical characteristics, and relationships, derived from the logical data model.
The logical data model provides a picture of all the pieces of information necessary to understand your data and how it relates to your business. It is a graphic-intensive technique that results in a data model representing the definition, characteristics, and relationships of data in a business, technical, or conceptual environment.

Project Design Guide MicroStrategy Tutorial A
© 2010 MicroStrategy, Inc. MicroStrategy Tutorial schema 381
The physical warehouse schema is based on the logical data model, such as Day, Item, Store, or Account. Several physical warehouse schemas can be derived from the same logical data model. While the logical data model tells you what facts and attributes to create, the physical warehouse schema tells you where the underlying data for those objects is stored. The physical warehouse schema describes how your data is stored in the data warehouse.
Exploring the MicroStrategy Tutorial schema
MicroStrategy Architect provides an intuitive way to explore the MicroStrategy Tutorial schema. Before you begin exploring the Tutorial schema using Architect, there are a few conventions and fact information that can help you understand the overall Tutorial schema.
The following prefixes and suffixes are used to identify different types of tables.
Many tables include a combination of attributes and facts. Some of the basic facts from which metrics in the MicroStrategy Tutorial were created from are listed below.
Symbol Indicates Definition
LU_ a lookup table A database table used to uniquely identify attribute elements. They typically consist of descriptions of dimensions. Lookup tables are usually joined to fact tables to group the numeric facts in the fact table by dimensional attributes in the lookup tables.
REL_ a relationship table
While lookup tables store information about one or more attributes, relationship tables store information about the relationship between two attributes. Relationship tables contain the ID columns of two or more attributes, thus defining associations between them.
_SLS a table with sales information
A database table used to store sales data (revenue, profit, cost, and so on) at different logical levels. These tables include a combination of attribute and fact definitions. For example, the YR_CATEGORY_SLS table includes the attributes Year and Category, along with facts such as Revenue, Cost, Profit, and so on. Storing these facts in this table makes their data available at the Year and Category level.
Fact Description
Begin on hand The number of individual items available at the beginning of each month.
Churn The trends and profiles of the acquired, retained, and lost customers.
Cost The total amount charged by the supplier to the company.

MicroStrategy Tutorial Project Design GuideA
382 MicroStrategy Tutorial schema © 2010 MicroStrategy, Inc.
The steps below show you how to explore the MicroStrategy Tutorial schema using Architect.
To explore the MicroStrategy Tutorial schema using Architect
1 If you are not already using the MicroStrategy Tutorial, log in to the project source containing the MicroStrategy Tutorial and expand the MicroStrategy Tutorial project. You must log in as a user with administrative privileges.
Customer Id The unique identification number allocated to the customer by the company.
Discount A monetary reduction made from a regular price.
End on hand The number of individual items remaining at the close of each month.
Freight The compensation paid for the transportation of goods.
Gross Revenue
The total income received from the company’s product sales before deducting the expenses.
Item inventory The month level item inventories used for End on hand and Begin on hand type inventory calculations. This fact also supports year-to-date and month-to-date analysis.
On Order Quantity
The quantity ordered by the customer.
Profit The excess of the selling price of goods over their cost.
Recency The number of days elapsed since the last purchase was made by the customer.
Revenue The total income produced by a given source accounting for all product sales deducting discounts.
Rush Charge The amount of money charged to expedite delivery service.
Target Quantity
The target set for the product units sold.
Tenure The duration an employee is employed by the company.
Unit Cost The amount of money charged by the supplier to the company per individual item purchased.
Unit Price The amount of money charged by the company to the customer per individual item sold.
Unit Profit Unit price - Unit cost.
Units Received
The number of individual items acquired from a supplier.
Units Sold The number of individual items bought by customers.
Fact Description

Project Design Guide MicroStrategy Tutorial A
© 2010 MicroStrategy, Inc. MicroStrategy Tutorial schema 383
2 Right-click the MicroStrategy Tutorial project and select Architect. MicroStrategy Architect opens.
3 Select the Project Tables View. All the tables included in the MicroStrategy Tutorial project are displayed.
4 To view the physical columns for each table:
a From the Options menu, select Settings. The MicroStrategy Architect Settings dialog box opens.
b On the Display settings tab, select Display table physical view.
c Click OK to return to Architect.
Tables are displayed to show the columns within each table, including the column name and data type.
5 To view the physical columns for each table, along with the MicroStrategy schema object they define:
a From the Options menu, select Settings. The MicroStrategy Architect Settings dialog box opens.
b On the Display settings tab, select Display table logical view.
c Click Advanced Options.
d Select all the check boxes for the Display table logical view option. For a description of each option, see Displaying columns and attribute forms in tables, page 106.
e Click OK.
f Click OK to return to Architect.
Tables are displayed to show the schema objects and the columns used to define the schema objects.
6 To view attribute relationships in the Project Tables View, from the View menu, select Show relationships.
7 From the Properties pane, you can use the Attribute, Facts, and Tables tabs to browse the various tables and schema objects for the Tutorial project.
8 To organize tables for further insight into the Tutorial project, you can create layers. For information on creating layers using Architect, see Organizing project tables: Layers, page 130.

MicroStrategy Tutorial Project Design GuideA
384 MicroStrategy Tutorial schema © 2010 MicroStrategy, Inc.
9 To save the layout display of the Tutorial project schema, from the File menu, select Export Image. Type a name and select an image type to save the image as, and click Save.

© 2010 MicroStrategy, Inc. Logical tables 385
BB.LOGICAL TABLES
Introduction
MicroStrategy uses logical tables to relate the data stored in your data warehouse to the schema objects that constitute a MicroStrategy project. Logical tables and logical table aliases represent physical tables in your data warehouse. Logical views are defined using SQL queries against the data warehouse, which can combine data from multiple physical tables into one logical table representation in MicroStrategy.
This chapter introduces you to the different types of logical tables, with a focus on how you can use the logical view feature to take advantage of the enhanced schema support in MicroStrategy.
Logical tablesLogical tables are MicroStrategy objects that form the foundation of a schema. Physical tables in a data warehouse consist of columns, and logical tables in the MicroStrategy schema relate this column data to attributes and facts. These attributes and facts are part of the report definition that the MicroStrategy Engine refers to when a report is executed.
Logical Tables Project Design GuideB
386 Logical tables © 2010 MicroStrategy, Inc.
The types of logical tables are:
• Logical table: A logical representation of a physical table that MicroStrategy uses to generate SQL. A logical table is created for each physical table that is imported into a project, using the Warehouse Catalog. This type of logical table maps directly to physical tables in the data warehouse. These physical tables are referenced in the SQL that is generated for the report.
This type of logical table is the most common logical table. Based on these tables, you can create MicroStrategy schema objects, such as attributes and facts. For more information on how to use the Warehouse Catalog, refer to the Help (search for “Warehouse Catalog”).
Logical tables also allow you to support the following configurations:
Defining logical table sizes, page 388
Defining the primary key for a table, page 391
• Logical table alias: A logical table that uses a different name for a physical table. One physical table can have more than one logical table alias. Logical table aliases are used to create attribute roles.
When an attribute plays more than one role, you need to create an attribute in the logical model for each of the roles. To accomplish this, you create multiple logical table aliases pointing to the same physical table and define those logical table aliases as the lookup tables for the attributes in different roles.
For example, if the Customer table is used to represent both Ship to Customer and Bill to Customer, you can create a logical table alias to resolve the double usage case. First, create a logical table alias by copying the existing logical table and giving it a different name; then define the new attributes using the appropriate tables.
For detailed information on attribute roles, refer to Attributes that use the same lookup table: Attribute roles, page 266. To create a logical table alias, right-click the logical table name and select Create Table Alias. For step-by-step instructions, refer to the Help (search for “Create a table alias”).
• Logical view: A logical table that is created using a SQL statement instead of being a direct representation of a physical table. Once created, the logical view can be used in the same way as any logical table. The logical view is also referenced in the SQL that is generated for the report; the whole SQL query is displayed in the place of physical tables, as is

Project Design Guide Logical Tables B
© 2010 MicroStrategy, Inc. Logical tables 387
standard for other logical tables. Logical views are created using the Table Editor.
If your project supports data internationalization, you cannot use logical views as lookup tables for attributes that use translated data. For information on supporting data internationalization, see Supporting data internationalization, page 57.
Logical views are different from the above-mentioned logical tables and logical table aliases for the following reasons:
Logical views do not map directly to physical tables in the data warehouse, and instead are defined using SQL queries.
Logical views are manually created to return data, from potentially multiple physical tables, as one logical table. Logical tables and logical table aliases can only retrieve data from a single physical table.
However, once logical views are created, they can be used in the same way as logical tables and logical table aliases. This means that you can use the logical views to build attributes and facts, and that you can also create logical table aliases for the logical views.
The biggest benefit of using logical views is that you can model a MicroStrategy schema that cannot be supported with only the physical database structures in the data warehouse. Many common modeling scenarios are easier to manage using logical views. Examples are:
Slowly-changing dimensions
Attribute form expressions from multiple tables
Consolidated dimension tables
Recursive hierarchies
For common usage examples, refer to Logical view examples, page 394.
In the MicroStrategy Tutorial, logical tables and all the other schema objects are stored in the Schema Objects folder. Using the Logical Table Editor, you can define your logical view using a SQL statement, as well as view the content of all the logical tables and their associated warehouse tables.
Whenever you create or add logical tables, logical table aliases, or logical views to the project, you need to update the schema. The Update Schema option can be accessed from the Schema menu.

Logical Tables Project Design GuideB
388 Creating logical tables © 2010 MicroStrategy, Inc.
Creating logical tablesLogical tables are brought into the project by using the Warehouse Catalog or Architect, and table aliases are created by duplicating existing logical tables. Steps on how to add logical tables to a project are provided for both methods, as listed below:
• Using Architect: Adding, removing, and administering tables, page 119
• Using the Warehouse Catalog: Adding and removing tables for a project, page 310
Defining logical table sizes
MicroStrategy assigns a size to every table in the project when you initially add it to the project. These size assignments are based on the columns in the tables and the attributes to which those columns correspond. Because MicroStrategy uses the conceptual or logical attribute definitions to assign a size to each table in the project, this measurement is referred to as logical table size.
The logical table size determines which logical table to use to answer a query when multiple logical tables would provide the same data. The table with the lowest logical table size is used, as a lower logical table size means the table has a higher level of aggregation. The performance of accessing a table with a higher level of aggregation is usually better than accessing a table with a lower level of aggregation.
MicroStrategy initially assigns logical table sizes based on an algorithm that takes into account the number of attribute columns and the various levels at which they exist in their respective hierarchies. If this does not meet your requirements, you can define the logical table size for a table as required.
For example, a base fact table contains millions of rows of transaction-level data. The other tables have only higher-level or summary information. Since the levels of the attributes are lower in the base fact table, the base fact table is assigned a higher value for its logical table size than are the summary tables with higher-level attributes. This means the table with summary information is used to return data rather than the table with transaction-level data when the tables can be used to answer the same query.

Project Design Guide Logical Tables B
© 2010 MicroStrategy, Inc. Creating logical tables 389
However, in the example scenario described above, there may be a reason that you want to access the table with transaction-level data instead of the table with summary information. In these types of scenarios, you can manually define the logical table size for a table, for which you have the following options:
• Defining the logical table size of a single table, page 389
• Defining logical table size while comparing all project tables, page 390
Defining the logical table size of a single table
The steps to define the logical table size of a single table using the Table Editor are described below.
To define the logical table size of a single table
1 From MicroStrategy Desktop, log in to a project.
Browse to the location where you store your tables, and double-click the desired table. If a message is displayed asking if you want to use read only mode or edit mode, select Edit and click OK to open the Table Editor in edit mode so that you can make changes to the table. The Table Editor opens.
Note the following:
• If you are only given the option of using read only mode, this means another user is modifying the project’s schema. You cannot use edit mode until the other user is finished with their changes and the schema is unlocked.
• For information on how you can use read only mode and edit mode for various schema editors, see Using read only or edit mode for schema editors, page 93.
2 On the Logical View tab, in the Logical size area, type the value for the table’s logical size.
If multiple tables can be used to answer the same query, the table with the lowest logical table size is used.
3 To lock the logical table size of a table, select the Preserve this logical size when updating schema information check box. When a table’s

Logical Tables Project Design GuideB
390 Creating logical tables © 2010 MicroStrategy, Inc.
logical size is locked, the table is excluded from the logical table size calculation when a schema update is performed.
4 Click Save and Close to save your modifications to the table and close the Table Editor.
5 You must update the schema for the new logical table size to take effect. Close all editors, then from the Schema menu, select Update Schema.
Defining logical table size while comparing all project tables
The steps to define the logical table size of a table while comparing all project tables are described below.
To define the logical table size of a table while comparing all project tables
1 From MicroStrategy Desktop, log in to a project.
From the Schema menu, select Edit Logical Size. If a message is displayed asking if you want to use read only mode or edit mode, select Edit and click OK to open the Logical Size Editor in edit mode so that you can make changes to the table’s logical size. The Logical Size Editor opens.
Note the following:
• If you are only given the option of using read only mode, this means another user is modifying the project’s schema. You cannot use edit mode until the other user is finished with their changes and the schema is unlocked.
• For information on how you can use read only mode and edit mode for various schema editors, see Using read only or edit mode for schema editors, page 93.
2 In the Size value column for a table, type the desired value for the table's logical size.
Note the following:
• If multiple tables can be used to answer the same query, the table with the lowest logical table size is used.
• You can sort any column in the Logical Size Editor by clicking on the column heading.

Project Design Guide Logical Tables B
© 2010 MicroStrategy, Inc. Creating logical tables 391
• You can display the number of rows in each table by selecting Show the table row count from the Edit menu.
3 To lock the size of a table, select that table’s Size locked check box. When a table’s logical size is locked the table is excluded from the logical table size calculation when a schema update is performed. To unlock the table's size, clear the Size locked check box.
To lock or unlock all table values displayed, click the Lock all or Unlock all toolbar options.
4 To allow MicroStrategy to calculate the table logical size automatically for all tables, click the Calculate all icon.
5 From the File menu, select Save to save your changes.
6 From the File menu, select Close to close the Logical Size Editor.
7 You must update the schema for any new logical table sizes to take effect. Close all editors, then from the Schema menu, select Update Schema.
Defining the primary key for a table
MicroStrategy requires each table to have a primary key, which is a unique value identifying each distinct data record or row. A primary key can be defined by one or more columns in the table. For more information on primary keys, see Uniquely identifying data in tables with key structures, page 37.
MicroStrategy determines the primary key for a table based on the attributes mapped to the columns of the table. In the Table Editor on the Layout tab, a key icon displayed by the attribute name indicates that the attribute is part of the primary key for this table. The primary key is made up of the lowest level attributes. For example, a warehouse table's primary key is defined using the columns CUSTOMER_ID, PRODUCT_ID, and ORDER_ID. If these three columns are mapped to attributes in MicroStrategy, then the primary key is represented correctly. In this case, from the Table Editor’s Layout tab, you can select the The key specified is the true key for the warehouse table check box. This is the default behavior for all tables added to a MicroStrategy project.
If the primary key for the warehouse table is not identical to the attributes listed as key attributes for the table in MicroStrategy, clear the The key specified is the true key for the warehouse table check box. Using the

Logical Tables Project Design GuideB
392 Creating logical views © 2010 MicroStrategy, Inc.
example described above, consider the scenario in which CUSTOMER_ID and PRODUCT_ID are mapped to MicroStrategy attributes, but ORDER_ID is not mapped to an attribute in MicroStrategy. In this case, only CUSTOMER_ID and PRODUCT_ID would be recognized by MicroStrategy as part of the table’s primary key. In this scenario, this check box should be cleared so that the warehouse table’s primary key can be verified. Otherwise, selecting this check box for such a scenario could cause incorrect or erroneous data to be returned.
Creating logical viewsLogical views can be created in MicroStrategy Desktop using the Table Editor, which is shown in the image below.
The Object Browser lists all tables and columns that have been imported into the project. Any physical table in the project database instance can be used in the SELECT statement. The SQL statement panel is where you type in your SQL query, while the Mapping panel is where you map the columns returned by the SQL query.
Since SQL queries are required to create logical views, you should be experienced with using SQL before you use the logical view feature. It is your responsibility to ensure the accuracy and validity of your SQL statements. In

Project Design Guide Logical Tables B
© 2010 MicroStrategy, Inc. Creating logical views 393
addition, you should also understand that the SQL query entered for logical views is not modified in any way by MicroStrategy. Therefore, make sure that your RDBMS is optimized to answer the query that you create.
Because the MicroStrategy Engine does not parse through the SQL syntax, the statistics log does not contain any information about the actual physical tables accessed; the logical view is logged instead. The same holds true if you use a view in the database, in which case table objects accessed are not logged either.
In the SQL generated for a report, logical views are generated as either a derived table or a common table expression (CTE) depending on the type of database that you use. It is recommended that you use derived tables to define logical views, although CTEs are also supported by some databases. Derived tables are advantageous because they are nested in the SQL generated by the Engine. CTEs, however, are not nested in the SQL because this would result in invalid SQL syntax. For best usage, check your third-party database documentation.
When the MicroStrategy Engine needs to use a logical table that maps directly to a physical database table, it inserts the name of the table into the FROM clause. For a logical view, which maps to a SQL statement, the MicroStrategy Engine inserts the SQL syntax in the FROM clause. The Engine generates derived table syntax to represent the logical view.
The results of logical views are not cached. Instead, the logical view appears as additional syntax in the report SQL generated by MicroStrategy.
The steps on how to create a logical view are described below.
To create a logical view in the Table Editor
1 From the File menu, select New and then Logical Table. The Table Editor is displayed with the Physical View tab selected by default.
2 In the SQL Statement panel, type your SQL statement. You can drag and drop columns from the Object Browser to insert into the statement.
It is recommended that you use derived tables to define logical views because the logical view SQL syntax becomes nested inside SQL statements generated by the Engine. Although common table expressions (CTEs) are also supported for some databases, these expressions cannot be nested in the SQL because this would result in invalid SQL syntax. Check your database for best usage.

Logical Tables Project Design GuideB
394 Logical view examples © 2010 MicroStrategy, Inc.
3 Click Add to map columns returned by the SQL statement.
4 Type in the column name under Column Object. This creates a new column.
Alternatively, you can also drag and drop columns from the Object Browser to the Column Object cell. By doing this, you map an existing column to the logical view.
The names of the columns must match exactly the column aliases defined in the SQL statement. However, the order of the columns does not have to match the order in which the column aliases appear in the SQL statement.
5 Select a Data Type for the column by using the drop-down list.
If you used an existing column in the mapping in this step, you inherited the data type of that column. Keep in mind that if you change the data type, the change will affect all the tables with that column.
6 Modify the Precision and Scale of the column, if applicable.
7 Save and close the logical table.
8 From the Schema menu, select Update Schema to ensure that the new logical view is loaded into the project.
Logical view examplesThe following business cases are intended to help you understand how you can use the logical view feature in your applications.
Business case 1: Distinct attribute lookup table
Many star schemas feature a single lookup table that is shared by all the attributes in one dimension (see the following example). While it is possible to model a schema with such a dimension table, often two problems arise:
• The model cannot support fact tables at the level of attributes that are not keys. This restriction applies to summary tables as well as to intermediate results that may be generated by the SQL Engine.

Project Design Guide Logical Tables B
© 2010 MicroStrategy, Inc. Logical view examples 395
Usually, in one-SQL-pass reports, the MicroStrategy Engine joins the fact table with one lookup table and does the aggregation. If there is no distinct list of attribute elements, you may double count if you have to join to a table where that attribute is part of the key.
• Too many rows in the dimension table may slow down the SELECT DISTINCT query, thus affecting element browsing requests that display a list of attribute elements, for example, when populating pick lists for prompts.
The following is an example lookup table for Store, Market, and Region.
Lookup_store
In this table, Market and Region are not the keys. Therefore, if the requested fact table is at the Market or Region level, a direct join between the fact table and the above lookup table may result in double-counting. To avoid that, you can use the Logical View feature to define another logical table Lookup_Market as follows:
Select Market_ID, Market_Name,Region_ID From Lookup_store Where level=1
Then use this table as the lookup table for Market. When it is joined with a Market-level fact table (Market_Sales), the following report SQL is generated:
Select a11.Market_ID,a11.Market_Desc, SUM(a12.Sales)
From (select Market_ID, Market_Name,Region_ID from Lookup_Store where level=1) a11, Market_Sales a12
Where a11.Market_ID = a12.Market_ID Group by a11.Market_ID,
a11.Market_Name
Store_ID Store_Name Market_ID Market_Name Region_ID Region_Name Level
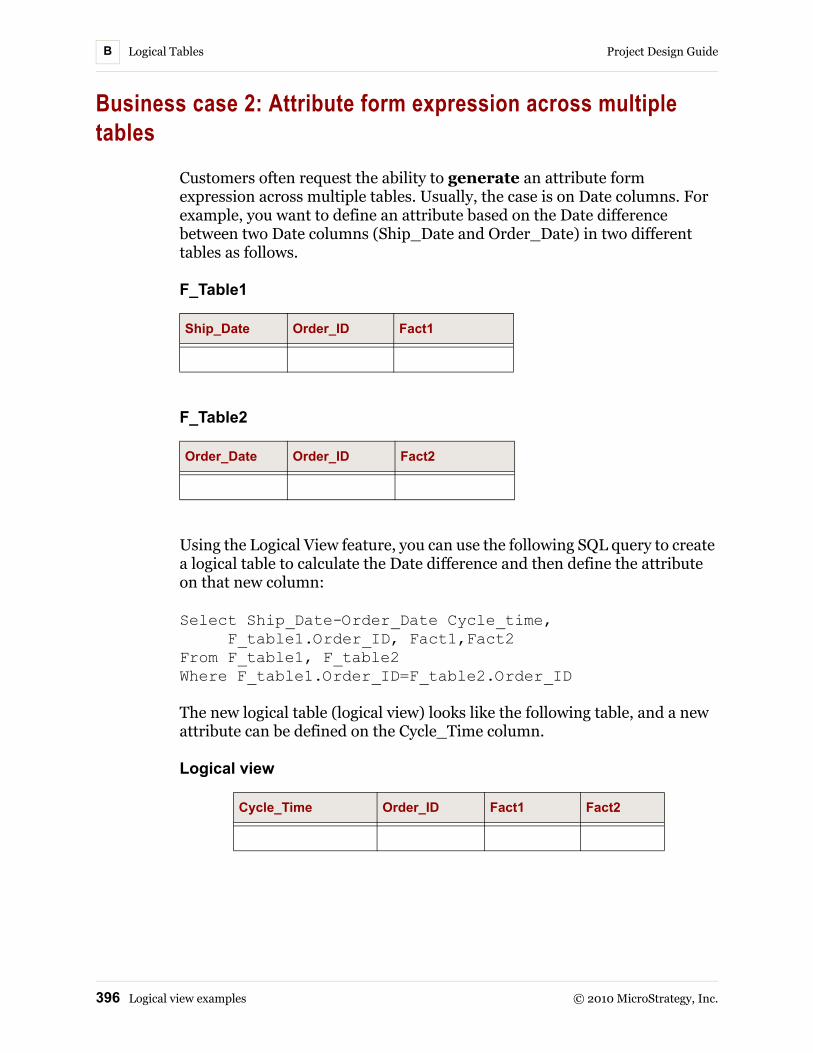
Logical Tables Project Design GuideB
396 Logical view examples © 2010 MicroStrategy, Inc.
Business case 2: Attribute form expression across multiple tables
Customers often request the ability to generate an attribute form expression across multiple tables. Usually, the case is on Date columns. For example, you want to define an attribute based on the Date difference between two Date columns (Ship_Date and Order_Date) in two different tables as follows.
F_Table1
F_Table2
Using the Logical View feature, you can use the following SQL query to create a logical table to calculate the Date difference and then define the attribute on that new column:
Select Ship_Date-Order_Date Cycle_time, F_table1.Order_ID, Fact1,Fact2
From F_table1, F_table2 Where F_table1.Order_ID=F_table2.Order_ID
The new logical table (logical view) looks like the following table, and a new attribute can be defined on the Cycle_Time column.
Logical view
Ship_Date Order_ID Fact1
Order_Date Order_ID Fact2
Cycle_Time Order_ID Fact1 Fact2

Project Design Guide Logical Tables B
© 2010 MicroStrategy, Inc. Logical view examples 397
Business case 3: Slowly changing dimensions
Slowly changing dimensions (SCDs) are a common characteristic in many business intelligence environments. Usually, dimensional hierarchies are presented as independent of time. For example, a company may annually reorganize their sales organization or recast their product hierarchy for each retail season. “Slowly” typically means after several months or even years. Indeed, if dimensional relationships change more frequently, it may be better to model separate dimensions.
SCDs are well documented in the data warehousing literature. Ralph Kimball has been particularly influential in describing dimensional modeling techniques for SCDs (see The Data Warehouse Toolkit, for instance). Kimball has further coined different distinctions among ways to handle SCDs in a dimensional model. For example, a Type I SCD presents only the current view of a dimensional relationship, a Type II SCD preserves the history of a dimensional relationship, and so forth.
The discussion below is based on an example sales organization that changes slowly in time as the territories are reorganized; for example, sales representatives switch districts in time.
As-is vs. as-was analysis
One of the capabilities available with slowly changing dimensions is the ability to perform either “as-is” analysis or “as-was” analysis:
• “As-is” analysis presents a current view of the slowly changing relationships. For example, show me sales by District according to the way Districts are organized today.
• “As-was” analysis presents a historical view of the slowly changing relationships. For example, show me sales by District according to the way Districts were organized at the time the sales transactions occurred.
The techniques described here provide the flexibility to perform either type of analysis. They also provide you an easy way to specify which type of analysis you would like to perform.

Logical Tables Project Design GuideB
398 Logical view examples © 2010 MicroStrategy, Inc.
Example 1: Compound key with Effective Date and End Date
One way to physically store an SCD is to employ Effective Date and End Date columns that capture the period of time during which each element relationship existed. In the example below, Sales Rep Jones moved from District 37 to District 39 on 1/1/2004, and Kelly moved from District 38 to 39 on 7/1/2004.
For information on compound keys, please refer to Lookup tables: Attribute storage, page 38.
LU_SALES_REP
When using this type of dimensional lookup table, the fact table must include a date field, such as a transaction date.
FACT_TABLE
Sales_Rep_ID Sales_Rep_Name District_ID Eff_Dt End_Dt
1 Jones 37 1/1/1900 12/31/2003
2 Smith 37 1/1/1900 12/31/2099
3 Kelly 38 1/1/1900 6/30/2004
4 Madison 38 1/1/1900 12/31/2099
1 Jones 39 1/1/2004 12/31/2099
3 Kelly 39 7/1/2004 12/31/2099
Sales_Rep_ID Trans_Dt Sales
1 9/1/2003 100
2 9/10/2003 200
3 9/15/2003 150
1 3/1/2004 200
2 3/10/2004 250
3 3/15/2004 300
2 9/5/2004 125
3 9/15/2004 275
4 9/20/2004 150

Project Design Guide Logical Tables B
© 2010 MicroStrategy, Inc. Logical view examples 399
To specify the MicroStrategy schema
1 Create a logical view to represent just the current District-Sales Rep relationships.
LVW_CURRENT_ORG
select Sales_Rep_ID, District_ID from LU_SALES_REP where End_Dt = '12/31/2099'
2 Create another logical view that performs the “as-was” join between the lookup table and fact table, resulting in a fact view at the District level.
The resulting view is an “as-was” or historical view, which captures the Sales Rep-District relationships that existed at the time the transactions occurred.
LVW_HIST_DISTRICT_SALES
select District_ID, Trans_Dt, sum(sales) sales
from LU_SALES_REP L join FACT_TABLE F
on(L.Sales_Rep_ID = F.Sales_Rep_ID) where F.Trans_Dt between L.Eff_Dt and
L.End_Dt group by District_ID, Trans_Dt
3 Create a table alias LU_CURRENT_DISTRICT for LU_DISTRICT.
4 Define the following attributes:
• Sales Rep:
– @ID = sales_rep_id; @Desc = sales_rep_name
– Tables: LU_SALES_REP (lookup), LVW_CURRENT_ORG, FACT_TABLE
• Current District:
– @ID = district_id; @Desc = district_name
– Tables: LU_CURRENT_DISTRICT (lookup), LVW_CURRENT_ORG

Logical Tables Project Design GuideB
400 Logical view examples © 2010 MicroStrategy, Inc.
– Child: Sales Rep
• Historical District:
– @ID = district_id; @Desc = district_name
– Tables: LU_DISTRICT (lookup), LU_SALES_REP, LVW_HIST_DISTRICT_SALES
– Child: Sales Rep
• Date:
– @ID = date_id, trans_dt
– Tables: LU_TIME (lookup) , FACT_TABLE, LVW_HIST_DISTRICT_SALES
• Month:
– @ID = MONTH_ID
– Tables: LU_TIME (lookup)
5 Define the Sales fact:
• Expression: sales
• Tables: FACT_TABLE, LVW_HIST_DISTRICT_SALES
6 Define the metric as required:
• Sales: SUM(sales)
The result of this is a logical schema that looks like the following:
LU_CURRENT_DISTRICT LU_CURRENT_ORG LU_SALES_REP FACT_TABLE
Current District Sales Rep Sales Rep Sales Rep
Current District Historical District
Date
Sales LU_TIME
Date
LVW_HISTORICAL_ DISTRICT_SALES
Month
Historical District

Project Design Guide Logical Tables B
© 2010 MicroStrategy, Inc. Logical view examples 401
As-was analysis
Specify the “as-was” analysis by using the Historical District attribute on reports:
• Report definition: Historical District, Month, Sales
• Resulting SQL
Select a11.District_ID District_ID, max(a13.District_Name) District_Name, a12.Month_ID Month_ID, sum(a11.SALES) WJXBFS1
From (select District_ID, Trans_dt,sum(sales) sales from LU_SALES_REP L join FACT_TABLE F on (L.Sales_rep_ID = F.Sales_rep_ID) where F.trans_dt between L.EFF_DT and L.END_DT
group by District_ID, Trans_dt) a11 join LU_TIME a12 on (a11.Trans_dt = a12.Date_ID) join LU_DISTRICT a13 on (a11.District_ID =a13.District_ID)
group by a11.Distrcit_ID, a12.Month_ID
• Report results
Date
Sales
LU_CURRENT_DISTRICT LU_CURRENT_ORG LU_SALES_REP FACT_TABLE

Logical Tables Project Design GuideB
402 Logical view examples © 2010 MicroStrategy, Inc.
As-is analysis
Specify the “as-is” analysis by using the Current District attribute on reports:
• Report definition: Current District, Month, Sales
• Resulting SQL
select a12.District_ID District_ID, max (a14.District_Name) District_Name, a13.Month_ID Month_ID, sum(a11.SALES) WJXBFS1
from FACT_TABLE a11 join (select Sales_rep_ID, District_ID from LU_SALES_REP where END_DT = '12/31/2099')a12 on (a11.Sales_Rep_ID =
a12.Sales_Rep_ID) join LU_TIME a13 on (a11.Trans_dt = a13.Date_ID) join LU_DISTRICT a14 on (a12.District_ID = a14.District_ID)
group by a12.District_ID, a13.Month_ID
• Report result
Example 2: New surrogate key for each changing element
A more flexible way to physically store a SCD is to employ surrogate keys and introduce new rows in the dimension table whenever a dimensional relationship changes. Another common characteristic is to include an indicator field that identifies the current relationship records. An example set of records is shown below.
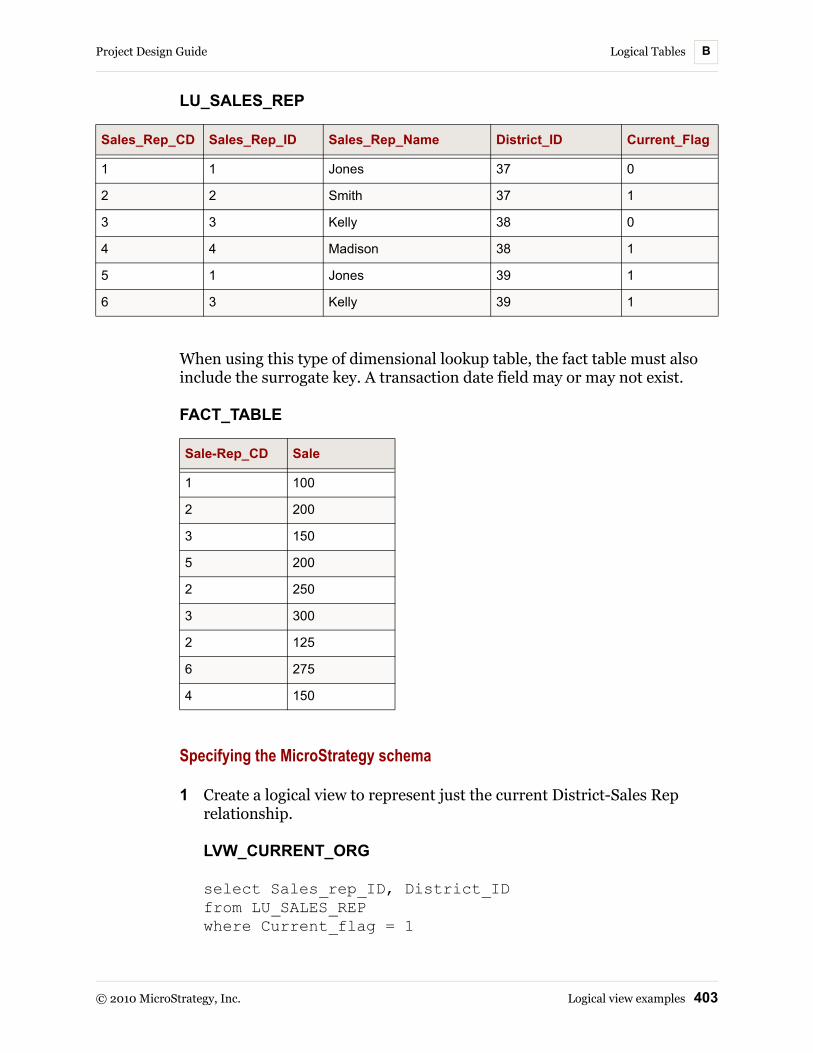
Project Design Guide Logical Tables B
© 2010 MicroStrategy, Inc. Logical view examples 403
LU_SALES_REP
When using this type of dimensional lookup table, the fact table must also include the surrogate key. A transaction date field may or may not exist.
FACT_TABLE
Specifying the MicroStrategy schema
1 Create a logical view to represent just the current District-Sales Rep relationship.
LVW_CURRENT_ORG
select Sales_rep_ID, District_ID from LU_SALES_REP where Current_flag = 1
Sales_Rep_CD Sales_Rep_ID Sales_Rep_Name District_ID Current_Flag
1 1 Jones 37 0
2 2 Smith 37 1
3 3 Kelly 38 0
4 4 Madison 38 1
5 1 Jones 39 1
6 3 Kelly 39 1
Sale-Rep_CD Sale
1 100
2 200
3 150
5 200
2 250
3 300
2 125
6 275
4 150

Logical Tables Project Design GuideB
404 Logical view examples © 2010 MicroStrategy, Inc.
2 Create a table alias LU_CURRENT_DISTRICT for LU_DISTRICT.
3 Define the following attributes:
• Sales Rep Surrogate:
– @ID = sales_rep_cd
– Tables: LU_SALES_REP (lookup), FACT_TABLE
• Sales Rep:
– @ID = sales_rep_id; @Desc = sales_rep_name
– Tables: LU_SALES_REP (lookup), LVW_CURRENT_ORG
– Child: Sales Rep Surrogate
• Current District:
– @ID = district_id; @Desc = district_name
– Tables: LU_CURRENT_DISTRICT (lookup), LVW_CURRENT_ORG
– Child: Sales Rep
• Historical District:
– @ID = district_id; @Desc = district_name
– Tables: LU_DISTRICT (lookup), LU_SALES_REP
– Child: Sales Rep
• Date:
– @ID = date_id, trans_dt
– Tables: LU_TIME (lookup), FACT_TABLE
• Month:
– @ID = MONTH_ID
– Tables: LU_TIME (lookup)
– Child: Date
4 Define the Sales fact:
• Expression: sales

Project Design Guide Logical Tables B
© 2010 MicroStrategy, Inc. Logical view examples 405
• Tables: FACT_TABLE, LVW_HIST_DISTRICT_SALES
5 Define the metric as required:
• Sales: SUM(sales)
The result is a logical schema as follows:
As-was analysis
Specify the “as-was” analysis by using the Historical District attribute on reports:
• Report definition: Historical District, Month, Sales
• Resulting SQL
select a12.District_ID District_ID, max(a14.Distrcit_Name) Distrcit_Name, a13.Month_ID Month_ID, sum(a11.SALES) WJXBFS1
from FACT_TABLE a11 join LU_SALES_REP a12
on (a11.Sales_Rep_CD = a12.Sales_Rep_CD)
join LU_TIME a13 on (a11.Trans_dt = a13.Date_ID)
join LU_DISTRICT a14 on (a12.District_ID =
LU_CURRENT_DISTRICT LU_CURRENT_ORG LU_SALES_REP FACT_TABLE LU_TIME
Current District Sales Rep Sales Rep Surrogate
Sales Rep Surrogate
Date
Current District Sale rep Date Month
Historical District
Sales
LVW_HISTORICAL_ DISTRICT_SALES
Historical District

Logical Tables Project Design GuideB
406 Logical view examples © 2010 MicroStrategy, Inc.
a14.District_ID) group by a12.District_ID,
a13.Month_ID
• Report results
As-is analysis
Specify the “as-is” analysis by using the Current District attribute on reports:
• Report definition: Current District, Month, Sales
• Resulting SQL:
select a13.District_ID District_ID, max(a15.Distrcit_Name) District_Name, a14.Month_ID Month_ID, sum(a11.SALES) WJXBFS1
from FACT_TABLE a11 join LU_SALES_REP a12 on (a11.Sales_Rep_CD =
a12.Sales_Rep_CD) join (select Sales_rep_ID, District_ID
from LU_SALES_REP where current_flag = 1)
a13 on (a12.Sales_Rep_ID = a13.Sales_Rep_ID)
join LU_TIME a14 on (a11.Trans_dt = a14.Date_ID)
join LU_DISTRICT a15 on (a13.District_ID = a15.District_ID)
group by a13.District_ID, a14.Month_ID
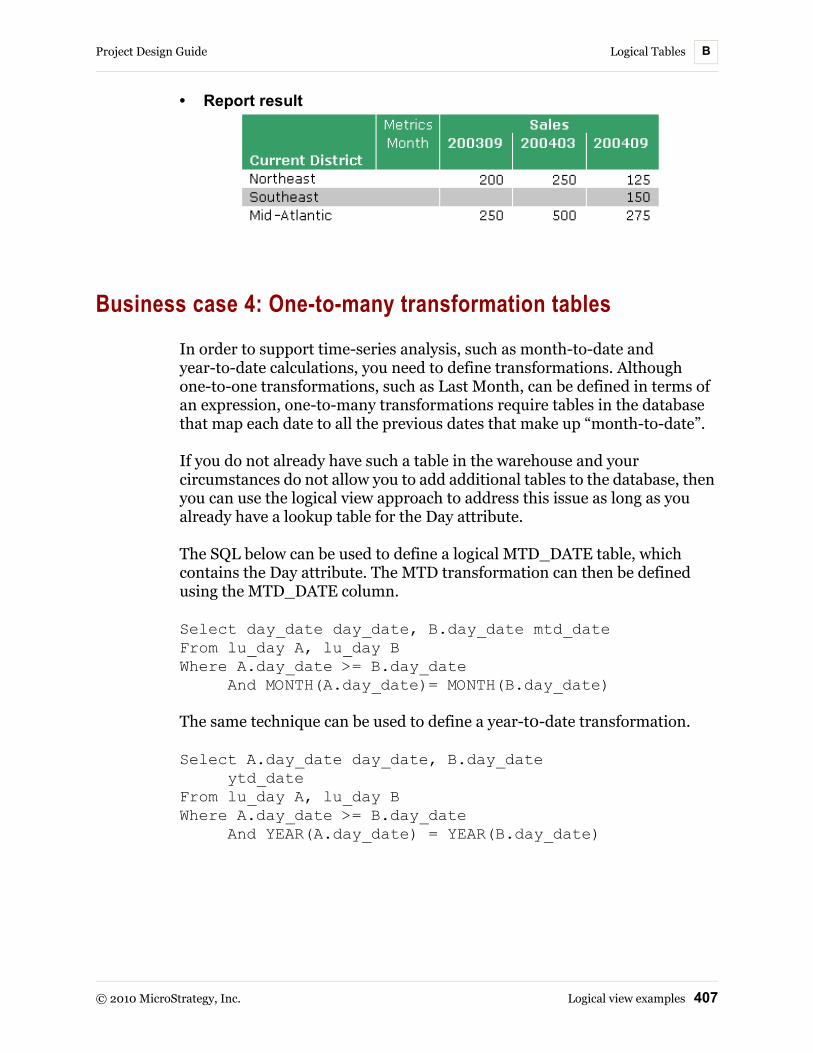
Project Design Guide Logical Tables B
© 2010 MicroStrategy, Inc. Logical view examples 407
• Report result
Business case 4: One-to-many transformation tables
In order to support time-series analysis, such as month-to-date and year-to-date calculations, you need to define transformations. Although one-to-one transformations, such as Last Month, can be defined in terms of an expression, one-to-many transformations require tables in the database that map each date to all the previous dates that make up “month-to-date”.
If you do not already have such a table in the warehouse and your circumstances do not allow you to add additional tables to the database, then you can use the logical view approach to address this issue as long as you already have a lookup table for the Day attribute.
The SQL below can be used to define a logical MTD_DATE table, which contains the Day attribute. The MTD transformation can then be defined using the MTD_DATE column.
Select day_date day_date, B.day_date mtd_date From lu_day A, lu_day B Where A.day_date >= B.day_date
And MONTH(A.day_date)= MONTH(B.day_date)
The same technique can be used to define a year-t0-date transformation.
Select A.day_date day_date, B.day_date ytd_date
From lu_day A, lu_day B Where A.day_date >= B.day_date
And YEAR(A.day_date) = YEAR(B.day_date)

Logical Tables Project Design GuideB
408 Logical view examples © 2010 MicroStrategy, Inc.
Business case 5: Outer joins between attribute lookup tables
A common request is the ability to generate an outer join between attribute lookup tables for a report that contains only attributes (that is, no metrics). For example, consider the tables below.
Given this structure, you could model an attribute hierarchy as follows:
• Business Unit -< Department -< Employee
• Hire Date -< Employee
• Emergency Contact -< Employee
In addition, the relationship between Employees and Emergency Contacts is such that each employee may have up to one contact, which means not all employees have contacts on record. One of the reports you probably would like to create may look like the following:
NULLS are displayed for employees who do not have emergency contacts.
However, if you model the attributes as described below, you would not get the desired output:
• Employee:
EMPLOYEE EMERGENCY CONTACT DEPARTMENT
EMP_ID EMP_ID DEPT_ID
FIRST_NAME CONTACT_FIRST_NAME DEPT_NAME
LAST_NAME CONTACT_LAST_NAME BUS_UNIT_ID
HIRE_DATE CONTACT_PHONE_NUMBER
DEPT_ID
Employee Department Emergency Contact Phone Number
Gonzalez, James Marketing
Dawson, John Finance Dawson, Jane 555-1212
Larkins, Abraham R & D Taylor, Mary 555-3456
Walker, George Finance Walker, Martha 555-9876
... ... ... ...

Project Design Guide Logical Tables B
© 2010 MicroStrategy, Inc. Logical view examples 409
@ID = EMP_ID, @[First Name] = FIRST_NAME, @[Last Name] = LAST_NAME
Tables: EMPLOYEE (lookup), EMERGENCY_CONTACT
• Department:
@ID = DEPT_ID
Tables: DEPARTMENT (lookup), EMPLOYEE
Child: Employee
• Hire Date:
@ID = HIRE_DATE
Tables: EMPLOYEE (lookup)
Child: Employee
• Emergency Contact:
@ID = CONTACT_PHONE_NUMBER, @[First Name] = CONTACT_FIRST_NAME, @[Last Name] = CONTACT_LAST_NAME
Tables: EMERGENCY_CONTACT (lookup)
Child: Employee
Using the above model, the SQL generated would join the EMPLOYEE table to the EMERGENCY_CONTACT table, and only those employees who have emergency contacts would appear in the final result. In order to see all employees, you can perform an outer join using a logical view, described as follows.
Using a logical view for an outer join
To perform an outer join for the case described above, you can use the following SQL and the list of columns to map to the view:
select E.EMP_ID, E.FIRST_NAME, E.LAST_NAME, E.HIRE_DATE, E.DEPT_ID, C.CONTACT_FIRST_NAME,

Logical Tables Project Design GuideB
410 Logical view examples © 2010 MicroStrategy, Inc.
C.CONTACT_LAST_NAME, C.CONTACT_PHONE_NUMBER
from EMPLOYEE E left outer join EMERGENCY_CONTACT C on (E.EMP_ID = C.EMP_ID)
Make sure to include all columns from the original child table (for example, EMPLOYEE). The new logical table LVW_EMERGENCY_CONTACT can then be used to define attributes as follows:
• Employee:
@ID = EMP_ID, @[First Name] = FIRST_NAME, @[Last Name] = LAST_NAME
Tables: EMPLOYEE (lookup), LVW_EMERGENCY_CONTACT
• Department:
@ID = DEPT_ID
Tables: DEPARTMENT (lookup), EMPLOYEE, LVW_EMERGENCY_CONTACT
Child: Employee
• Hire Date:
@ID = HIRE_DATE
Tables: EMPLOYEE (lookup), LVW_EMERGENCY_CONTACT
Child: Employee
• Emergency Contact:
LVW_EMERGENCY_CONTACT
EMP_ID
FIRST_NAME
LAST_NAME
HIRE_DATE
DEPT_ID
CONTACT_FIRST_NAME
CONTACT_LAST_NAME
CONTACT_PHONE_NUMBER

Project Design Guide Logical Tables B
© 2010 MicroStrategy, Inc. Logical view examples 411
@ID = CONTACT_PHONE_NUMBER, @[First Name] = CONTACT_FIRST_NAME, @[Last Name] = CONTACT_LAST_NAME
Tables: EMERGENCY_CONTACT (lookup), LVW_EMERGENCY_CONTACT
Child: Employee
The Employee attribute is not represented in the original EMERGENCY_CONTACT table and all attributes represented in the EMPLOYEE table are also represented in the LVW_EMERGENCY_CONTACT table.
Now if we run a report with Employee and Emergency Contact attributes, the EMPLOYEE table will be outer joined to the EMERGENCY_CONTACT table, and NULLs will be returned for any employees who do not have emergency contacts. Also note that if we run a report that includes only the Employee attribute, it will be executed against the EMPLOYEE table; the EMERGENCY_CONTACT table will be joined only when necessary.
This technique is applicable any time that the lookup tables should always be outer joined. The technique does not work when the lookup tables should sometimes be outer joined and sometimes be inner joined.

Logical Tables Project Design GuideB
412 Logical view examples © 2010 MicroStrategy, Inc.

© 2010 MicroStrategy, Inc. Mapping of external data types to MicroStrategy data types 413
CC.DATA TYPES
Introduction
To generate SQL or retrieve data from data sources, MicroStrategy must be aware of the data types that exist in your database. As each RDBMS supports a different set of data types, MicroStrategy generalizes them into a set of MicroStrategy-specific data types.
Mapping of external data types to MicroStrategy data types
When you create a project and add tables from your data warehouse to the MicroStrategy Warehouse Catalog, MicroStrategy automatically maps the columns within those tables to MicroStrategy-specific data types. Each column from your database becomes associated with a MicroStrategy data type.
This database data type to MicroStrategy data type mapping is necessary, in part, because each database names data types in different ways. Data types that may be conceptually the same can have different names. Therefore,
Data Types Project Design GuideC
414 Mapping of external data types to MicroStrategy data types © 2010 MicroStrategy, Inc.
MicroStrategy must map every column brought into the project schema to an internal data type.
Suppose you add a table to the Warehouse Catalog. In your relational database, a column within that table has a data type of “SMALLINT.” MicroStrategy maps this column to a MicroStrategy-specific data type, for example, “INTEGER.” This allows MicroStrategy to maintain a consistent SQL generation process.
The MicroStrategy data type stores data values internally and in the metadata repository and is later used during SQL generation when defining intermediate tables, and data mart tables, and generating the correct syntax for literals. The data type is also used whenever multi-pass SQL is used, as with custom groups. For more information about data marts and custom groups, see the MicroStrategy Advanced Reporting Guide.
The table below lists the supported data types for supported databases as well as the MicroStrategy data type that is used to define the data in MicroStrategy. For information on MicroStrategy data types, see MicroStrategy data types, page 432.The databases that are listed in this table include:
• Access, page 415
• Composite, page 416
• DB2, page 417
• Generic, page 418
• HP Neoview, page 419
• Informix, page 420
• MetaMatrix, page 421
• MySQL, page 422
• Netezza, page 423
• Oracle, page 424
• PostgreSQL, page 425
• Red Brick, page 426
• SQL Server, page 427
• Sybase, page 428

Project Design Guide Data Types C
© 2010 MicroStrategy, Inc. Mapping of external data types to MicroStrategy data types
• Sybase IQ, page 429
• Tandem, page 430
• Teradata, page 431
Database Supported database data types MicroStrategy data type
Access BINARY Binary
BOOLEAN Integer
BYTE Integer
CURRENCY Numeric
DATE Timestamp
DATETIME Timestamp
DOUBLE Double
FLOAT Double
INT Integer
INTEGER Integer
INTEGER2 Integer
INTEGER4 Integer
LONG Integer
LONG BINARY LongVarBin
LONGTEXT LongVarChar
MEMO LongVarChar
NUMBER Double
NUMERIC Double
REAL Real
SHORT Integer
SINGLE Real
SMALLINT Integer
TEXT Char
TIME Time
TIMESTAMP Timestamp

Data Types Project Design GuideC
416 Mapping of external data types to MicroStrategy data types © 2010 MicroStrategy, Inc.
Composite BIT Binary
BIT VARYING VarBin
CHAR Char
CHAR VARYING (added from DTMAPPING.PDS)
VarChar
CHARACTER (added from DTMAPPING.PDS)
Char
CHARACTER VARYING (added from DTMAPPING.PDS)
VarChar
DATE Date
DECIMAL Decimal
DOUBLE PRECISION (added from DTMAPPING.PDS)
Float
FLOAT Float
INT (added from DTMAPPING.PDS) Integer
INTEGER Integer
NUMERIC Numeric
REAL Real
SMALLINT (added from DTMAPPING.PDS)
Integer
TIME Time
TIMESTAMP Timestamp
VARBIT (added from DTMAPPING.PDS) VarBin
VARCHAR VarChar
Database Supported database data types MicroStrategy data type

Project Design Guide Data Types C
© 2010 MicroStrategy, Inc. Mapping of external data types to MicroStrategy data types
DB2 BIGINT Big Decimal
BLOB LongVarBin
CHAR Char
CHARACTER Char
CLOB LongVarChar
DATE Date
DEC Numeric
DECIMAL Numeric
DOUBLE Double
DOUBLE PRECISION Double
FLOAT Double
GRAPHIC NChar
INT Integer
INTEGER Integer
LABEL VarChar
LONG VarChar
LONG VARCHAR VarChar
LONGVAR VarChar
NUM Numeric
NUMERIC Numeric
RAW VarBin
REAL Real
SMALLINT Integer
TIME Time
TIMESTAMP Timestamp
TIMESTMP Timestamp
VARCHAR VarChar
VARGRAPHIC NVarChar
Database Supported database data types MicroStrategy data type

Data Types Project Design GuideC
418 Mapping of external data types to MicroStrategy data types © 2010 MicroStrategy, Inc.
Generic BIT Binary
BIT VARYING VarBin
CHAR Char
CHAR VARYING VarChar
CHARACTER Char
CHARACTER VARYING VarChar
DATE Date
DECIMAL Decimal
DOUBLE PRECISION Float
FLOAT Float
INT Integer
INTEGER Integer
NUMERIC Numeric
REAL Real
SMALLINT Integer
VARBIT VarBin
VARCHAR VarChar
Database Supported database data types MicroStrategy data type

Project Design Guide Data Types C
© 2010 MicroStrategy, Inc. Mapping of external data types to MicroStrategy data types
HP Neoview BIGINT (added from DTMAPPING.PDS) Big Decimal
BINARY (added from DTMAPPING.PDS) Binary
BIT Integer
BIT VARYING ??? not in DTMAPPING.PDS
CHAR Char
DATE Date
DECIMAL (added from DTMAPPING.PDS) Decimal
DOUBLE (added from DTMAPPING.PDS) Double
FLOAT Float
INTEGER Integer
LONGVARCHAR (added from DTMAPPING.PDS)
LongVarChar
NCHAR NChar
NCHAR VARYING NVarChar
NLONGVARCHAR (added from DTMAPPING.PDS)
LongVarChar
NUMERIC Numeric
REAL Real
SMALLINT (added from DTMAPPING.PDS)
Integer
TIME Time
TIMESTAMP Timestamp
TINYINT (added from DTMAPPING.PDS) Integer
VARBINARY (added from DTMAPPING.PDS)
LongVarBin
LONGVARBINARY (added from DTMAPPING.PDS)
LongVarBin
VARCHAR VarChar
Database Supported database data types MicroStrategy data type

Data Types Project Design GuideC
420 Mapping of external data types to MicroStrategy data types © 2010 MicroStrategy, Inc.
Informix BOOLEAN Char
BYTE LongVarBin
CHAR Char
CHARACTER Char
DATE Date
DATETIME Timestamp
DATETIME HOUR TO SECOND (not in DTMAPPING.PDS)
Timestamp
DATETIME YEAR TO SECOND (not in DTMAPPING.PDS)
Timestamp
DEC Decimal
DECIMAL Decimal
DOUBLE PRECISION Double
FLOAT Double
INT Integer
INT8 (Changed from DTMAPPING.PDS) Big Decimal
INTEGER Integer
LVARCHAR LongVarChar
MONEY Numeric
NCHAR NChar
NUMERIC Decimal
NVARCHAR NVarChar
REAL Real
SERIAL Integer
SERIAL8 Integer
SMALLFLOAT Real
SMALLINT Integer
TEXT LongVarChar
VARCHAR VarChar
Database Supported database data types MicroStrategy data type

Project Design Guide Data Types C
© 2010 MicroStrategy, Inc. Mapping of external data types to MicroStrategy data types
MetaMatrix BIGDECIMAL Numeric
BIGINTEGER Integer
BLOB VarBin
BOOLEAN Binary
BYTE Integer
CHAR Char
CLOB VarChar
DATE Date
DOUBLE (added from DTMAPPING.PDS) Double
FLOAT Float
INTEGER Integer
LONG Integer
SHORT Integer
STRING VarChar
TIME Time
TIMESTAMP Timestamp
Database Supported database data types MicroStrategy data type

Data Types Project Design GuideC
422 Mapping of external data types to MicroStrategy data types © 2010 MicroStrategy, Inc.
MySQL BIGINT Integer
BINARY Binary
BIT Unsigned
BLOB LongVarBin
CHAR Char
DATE Date
DATETIME Timestamp
DECIMAL Decimal
DOUBLE Double
ENUM Char
FLOAT Float
INT Integer
LONGBLOB LongVarBin
LONGTEXT LongVarChar
MEDIUMBLOB LongVarBin
MEDIUMINT Integer
MEDIUMTEXT LongVarChar
NCHAR NChar
NVARCHAR NVarChar
SET Char
SMALLINT Integer
TEXT LongVarChar
TIME Time
TIMESTAMP Timestamp
TINYBLOB LongVarBin
TINYINT Integer
TINYTEXT LongVarChar
VARBINARY VarBin
VARCHAR VarChar
YEAR Integer
Database Supported database data types MicroStrategy data type

Project Design Guide Data Types C
© 2010 MicroStrategy, Inc. Mapping of external data types to MicroStrategy data types
Netezza BIGINT Big Decimal
BIT Binary
BIT VARYING VarBin
BYTEINT Integer
CHAR Char
CHAR VARYING VarChar
CHARACTER Char
CHARACTER VARYING VarChar
DATE Date
DATETIME Timestamp
DEC Numeric
DECIMAL Numeric
DOUBLE Float
DOUBLE PRECISION Float
FLOAT Float
FLOAT4 Float
FLOAT8 Float
INT Integer
INT1 Integer
INT2 Integer
INT4 Integer
INT8 Big Decimal
INTEGER Integer
NCHAR NChar
NUMERIC Numeric
NVARCHAR NVarChar
REAL Real
SMALLINT Integer
TIME Time
TIMESTAMP TimeStamp
VARCHAR VarChar
Database Supported database data types MicroStrategy data type

Data Types Project Design GuideC
424 Mapping of external data types to MicroStrategy data types © 2010 MicroStrategy, Inc.
Oracle BLOB LongVarBin
CHAR Char
CLOB LongVarChar
DATE Timestamp
DECIMAL Numeric
FLOAT Float
INTEGER Numeric
LONG LongVarChar
LONG RAW LongVarBin
LONG VARCHAR LongVarChar
NCHAR NChar
NUMBER Numeric
NVARCHAR2 NVarChar
RAW VarBin
REAL Float
SMALLINT Numeric
TIMESTAMP(6) Timestamp
VARCHAR VarChar
VARCHAR2 VarChar
Database Supported database data types MicroStrategy data type

Project Design Guide Data Types C
© 2010 MicroStrategy, Inc. Mapping of external data types to MicroStrategy data types
PostgreSQL BOOL Integer
BIT Binary
CHAR Char
DATE Date
DECIMAL Decimal
FLOAT4 Real
FLOAT8 Double
INT2 Integer
INT4 Integer
INT8 Integer
NUMERIC Decimal
TEXT LongVarChar
TIME Time
TIMESTAMP Timestamp
VARBIT VarBin
VARCHAR VarChar
Database Supported database data types MicroStrategy data type
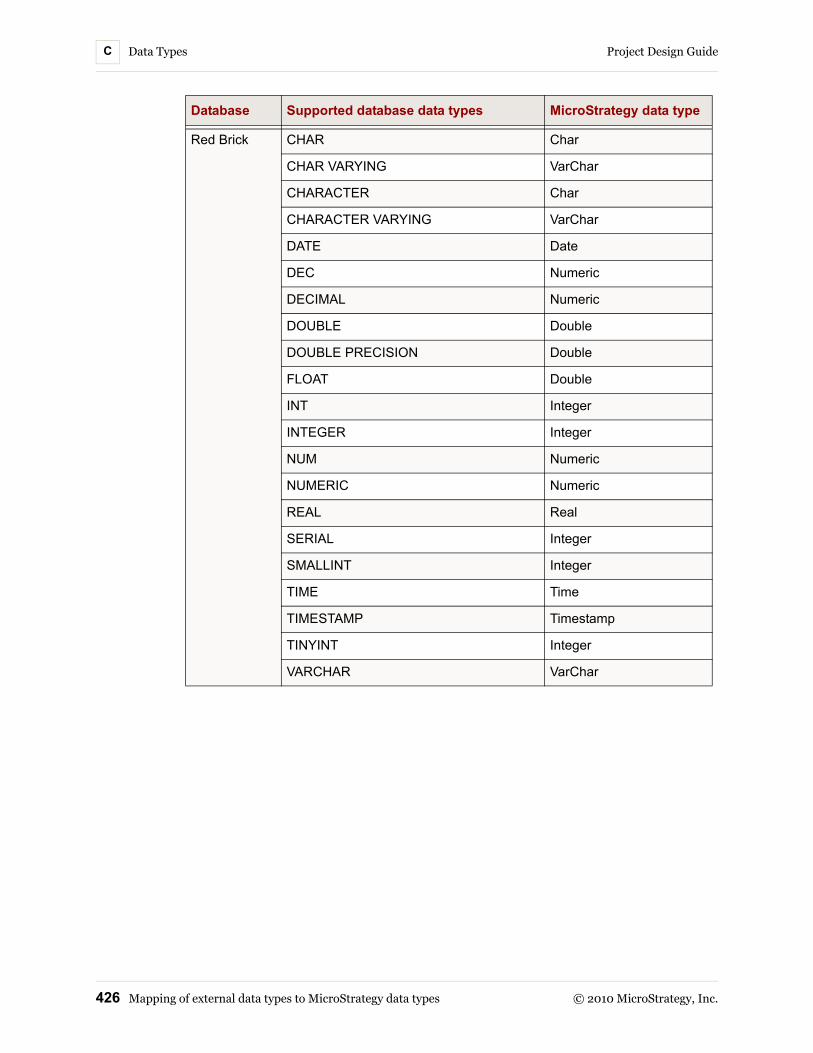
Data Types Project Design GuideC
426 Mapping of external data types to MicroStrategy data types © 2010 MicroStrategy, Inc.
Red Brick CHAR Char
CHAR VARYING VarChar
CHARACTER Char
CHARACTER VARYING VarChar
DATE Date
DEC Numeric
DECIMAL Numeric
DOUBLE Double
DOUBLE PRECISION Double
FLOAT Double
INT Integer
INTEGER Integer
NUM Numeric
NUMERIC Numeric
REAL Real
SERIAL Integer
SMALLINT Integer
TIME Time
TIMESTAMP Timestamp
TINYINT Integer
VARCHAR VarChar
Database Supported database data types MicroStrategy data type

Project Design Guide Data Types C
© 2010 MicroStrategy, Inc. Mapping of external data types to MicroStrategy data types
SQL Server BIGINT Numeric
BINARY VarBin
BIT Binary
CHAR VarChar
CHARACTER VarChar
DATETIME Timestamp
DEC Numeric
DECIMAL Numeric
DOUBLE Float
DOUBLE PRECISION Float
FLOAT Float
IMAGE LongVarBin
INT Integer
INTEGER Integer
MONEY Numeric
NCHAR NChar
NUMERIC Numeric
NVARCHAR NVarChar
REAL Float
SMALLDATETIME Timestamp
SMALLINT Integer
SMALLMONEY Numeric
TEXT LongVarChar
TIMESTAMP VarBin
TINYINT Unsigned
VARBINARY VarBin
VARCHAR VarChar
Database Supported database data types MicroStrategy data type

Data Types Project Design GuideC
428 Mapping of external data types to MicroStrategy data types © 2010 MicroStrategy, Inc.
Sybase BINARY Binary
BIT Binary
CHAR Char
DATETIME Timestamp
DECIMAL Numeric
FLOAT Float
IMAGE LongVarBin
INT Integer
INTEGER Integer
LONG VARCHAR LongVarChar
MONEY Numeric
REAL Real
SMALL DATETIME Timestamp
SMALLINT Integer
SMALLMONEY Numeric
TEXT LongVarChar
TINYINT Unsigned
UNICHAR NChar
UNIVARCHAR NVarChar
VARBINARY VarBin
VARCHAR VarChar
Database Supported database data types MicroStrategy data type

Project Design Guide Data Types C
© 2010 MicroStrategy, Inc. Mapping of external data types to MicroStrategy data types
Sybase IQ BIGINT Big Decimal
BINARY Binary
BIT Binary
CHAR Char
DATE Date
DATETIME Timestamp
DECIMAL Numeric
DOUBLE Double
FLOAT Float
INT Integer
INTEGER Integer
LONG BINARY LongVarBin
LONG VARCHAR LongVarChar
MONEY Numeric
NUMERIC Numeric
REAL Real
SMALLDATETIME Timestamp
SMALLINT Integer
SMALLMONEY Numeric
TIME Time
TIMESTAMP Timestamp
TINYINT Unsigned
UNSIGNED BIGINT Unsigned
UNSIGNED INT Unsigned
UNSIGNED SMALLINT Unsigned
VARBINARY VarBin
VARCHAR VarChar
Database Supported database data types MicroStrategy data type

Data Types Project Design GuideC
430 Mapping of external data types to MicroStrategy data types © 2010 MicroStrategy, Inc.
Tandem BIGINT Big Decimal
BIT Integer
CHAR Char
DATE Date
DATETIME Timestamp
DECIMAL Decimal
DOUBLE PRECISION Double
FLOAT Double
INT Integer
INTEGER Integer
MONEY Double
NUMERIC Decimal
REAL Float
SMALLDATETIME Timestamp
SMALLINT Integer
SMALLMONEY Double
TEXT Char
TIMESTAMP Timestamp
TINYINT Integer
VARBYTE ???
VARCHAR VarChar
Database Supported database data types MicroStrategy data type

Project Design Guide Data Types C
© 2010 MicroStrategy, Inc. Mapping of external data types to MicroStrategy data types
Teradata BLOB LongVarBin
BYTE Binary
BYTEINT Integer
BYTEINTEGER Integer
BYTES Binary
CHAR Char
CHARACTER Char
CHARACTERS Char
CHARS Char
CLOB LongVarChar
DATE Date
DEC Decimal
DECIMAL Decimal
DOUBLE PRECISION Double
FLOAT Double
INT Integer
INTEGER Integer
LONG VARCHAR VarChar
NCHAR NChar
NVARCHAR NVarChar
NUMERIC Decimal
REAL Double
SMALLINT Integer
TIME Time
TIMESTAMP Timestamp
VARBYTE VarBin
VARCHAR VarChar
Database Supported database data types MicroStrategy data type

Data Types Project Design GuideC
432 MicroStrategy data types © 2010 MicroStrategy, Inc.
MicroStrategy data typesWhen the data warehouse catalog is read from the Warehouse Catalog, all columns in the database are automatically mapped to one of the following MicroStrategy data types.
Data Type Description
Big Decimal High-precision fixed point numbers.
Binary Fixed-length bit strings.Similar to ANSI BIT.
Char Fixed-length character strings.Similar to ANSI CHAR.
Date Calendar dates.Similar to ANSI DATE.
Decimal Fixed point numbers up to 15 digits of precision.Similar to ANSI DECIMAL.
Double 8-byte floating point numbers.Similar to ANSI DOUBLE PRECISION.
Float 4-byte floating point numbers.Similar to ANSI FLOAT.
Integer Signed integer values.Similar to ANSI INTEGER.
LongVarBin Large strings of bits.Similar to ANSI BLOB.
LongVarChar Large strings of characters.Similar to ANSI CLOB.
NChar Fixed-length character strings used to support various character sets.
Numeric Fixed point numbers up to 15 digits of precision.Similar to ANSI NUMERIC.
NVarChar Variable-length character strings used to support various character sets.
Real 4-byte floating point numbers.Similar to ANSI REAL.
Time Time of day.Similar to ANSI TIME.

Project Design Guide Data Types C
© 2010 MicroStrategy, Inc. Format types 433
If the Warehouse Catalog displays a column with data type as Unknown, it implies that the data type in the database has not mapped to one of the MicroStrategy data types.
Format typesAttribute forms are also associated with a MicroStrategy format type, which specifies how attribute form values should be displayed on MicroStrategy interfaces. You specify the format type of an attribute form in the Form Format: Type drop-down menu in the Attribute Editor.
The attribute form format types are described in the following table.
Timestamp Combinations of calendar date and time of day.Similar to ANSI TIMESTAMP.
Unsigned Unsigned integer values.
VarBin Variable-length bit strings.Similar to ANSI BIT VARYING.
VarChar Variable-length character strings.Similar to ANSI VARCHAR.
Data Type Description
Format Type Description
Big Decimal Information is stored and displayed in the Big Decimal form, which represents high-precision fixed point numbers. For more information about Big Decimal, see Big Decimal, page 436.
Binary Information from binary data types is stored and displayed as a string of characters. For more information on support of binary data types, see Appendix C, MicroStrategy support for binary data types.
Date Information is stored and displayed as dates in a sequential form to perform calculations on the dates. It represents dates in the MM/DD/YYYY format.
Datetime Information is stored and displayed both as date and time in the format specific to the data. The date follows the MM/DD/YYYY format and time follows the HH:MM:SS format.
Email Information is stored and displayed in the form of an e-mail address.
HTML Tag Information is stored and displayed as an HTML tag.
Number Information is stored and displayed in a number format.

Data Types Project Design GuideC
434 Data type and format type compatibility © 2010 MicroStrategy, Inc.
Data type and format type compatibilityIf you change the MicroStrategy data type of one of the columns in your project—using a column alias, for example—you must also change the format type of the attribute. The data type of your column must be consistent with the format type you select because SQL generation issues can occur if the format type and data type are incompatible. You are warned in the Attribute Editor whenever you have selected a format type that is incompatible with the data type of your column.
For example, you edit the ID form of the Year attribute in the Attribute Editor. In the Column Alias tab, you notice that the Year attribute is assigned an “Integer” data type. However, you create a new column alias and assign it the “Date” data type.
When you return to the Definition pane in the Attribute Editor, you must select an appropriate format type from the Form Format: Type drop-down menu. This format type must be compatible with the data type you assigned in the Column Alias tab. If you select a format type that is incompatible with the data type and click OK to exit the Attribute Editor, a warning message appears notifying you of the incompatibility. Although you have the option to continue by clicking Yes, doing so can still result in SQL generation issues.
The following chart is intended to guide you in assigning format types that are compatible with the data type you have assigned to a column.
Different format types are compatible with different data types given the specific data in your column. Therefore, some of the data
Picture stored and displayed the form of an image file, such as bitmap, JPG, or GIF.
Text Information is stored and displayed in a text format.
Time Information is stored and displayed as time in the HH:MM:SS format. This displays only the time and not the date.
URL Information is stored and displayed as either an absolute or a relative Universal Resource Locator.
Format Type Description

Project Design Guide Data Types C
© 2010 MicroStrategy, Inc. Data type and format type compatibility 435
type-format type combinations below may not work with your specific data.
Supporting the BLOB format type
Columns in your data source that use BLOB format types can be mapped to attribute forms and facts in MicroStrategy. BLOB format types are represented in MicroStrategy as the LongVarBin data type. This data type is treated as a long string of binary data. This representation in MicroStrategy has the following effects on including data from a BLOB format type on a MicroStrategy report or document:
• Since the BLOB format type is represented as a LongVarBin, the data is displayed in either binary or hexadecimal representation. The data is not converted into any other format such as an image or PDF format. Therefore, columns in a data source that use BLOB format types to
Data Type Compatible Format Types
Big Decimal Big Decimal
Binary Number, Text, Picture
Char Text, URL, E-mail, HTML Tag
Date Date, Datetime
Decimal Number
Double Number
Float Number
Integer Number
LongVarBin Picture, BLOB, Text depending on data
LongVarChar Picture, Text
Numeric Number
Real Number
Time Time, Datetime
Timestamp Datetime, Date or Time depending on data
Unsigned Number
VarBin Picture, Text
VarChar Text, URL, E-mail, HTML Tag, Picture

Data Types Project Design GuideC
436 Big Decimal © 2010 MicroStrategy, Inc.
represent images, PDFs, or other non-binary or hexadecimal data should not be included in MicroStrategy.
• MicroStrategy supports BLOB format types that include data records of up to 32 Kilobytes. If a BLOB, that contains more than 32 Kilobytes, is included in a report, this can cause an error with a message such as String data, right truncated.
Big DecimalBig Decimal is a MicroStrategy-specific data type that allows users to support high-precision attribute ID values that have more than 15 digits of precision, such as BIGINT and DECIMAL (precision, scale) data types. Examples of such attribute ID values are account numbers, credit card numbers, and long integers.
Using the Big Decimal data type
With the Big Decimal data type, MicroStrategy preserves the precision of attribute ID values and attribute ID forms when displaying IDs and performing operations such as filtering, drilling, and page-by. For more information about these operations, see the MicroStrategy Basic Reporting Guide.
You can define attributes that are identified by numeric columns in the database. These numeric columns can have more than 15 digits of precision, such as account numbers and other long integers. You must use the Big Decimal data type to handle these values, because these data values have higher precision and cannot be stored in normal numeric data types.
If you do not associate high-precision database fields with the Big Decimal data type, you may see numbers truncated starting with the 16th digit. The WHERE clause in the report SQL statement in drill reports may truncate numbers starting from the 16th digit, and page-by may not return results.
When using the Big Decimal data type, follow the rules listed below:
• Constant: You can force a constant to be stored as a Big Decimal value by enclosing it in hash marks. For example, you can define a filter as “Customer@ID exactly #12345678#”, even though 12345678 does not necessarily require the Big Decimal data type.

Project Design Guide Data Types C
© 2010 MicroStrategy, Inc. MicroStrategy support for binary data types 437
• Attribute form: If you change the column data type to Big Decimal on the Column Alias tab in the Attribute Editor, you must also select Big Decimal as the form format type in the Form format: Type drop-down menu in the Definition tab.
• Attribute ID: Follow the steps in the topic Defining attributes with high-precision ID forms in the MicroStrategy Desktop online help.
• Metric: Although it is possible to define Big Decimal as the data type for metric values, consider the following drawbacks:
Precision is lost when any Analytical Engine calculation is performed, the metric is used in a data field in a document, the metric is subtotaled, or metric values are displayed in Graph view.
Number formatting strings are not supported on the Web.
Some number formatting strings are not supported in MicroStrategy Desktop.
When qualifying on a Big Decimal metric, you must explicitly identify high-precision constants by enclosing the value within hash (#) symbols. For example, #1234567890123456#.
Note that the Warehouse Catalog does not automatically map DECIMAL(p, s) or NUMERIC(p, s) columns to the Big Decimal MicroStrategy data type even when the precision is greater than 15. This is because Big Decimal should only be used when the column is used as an attribute ID form.
MicroStrategy support for binary data typesMicroStrategy maps binary data types from databases to either the Binary or Varbin MicroStrategy data types. For example, some databases are listed below with their various binary data types and what they are mapped to in MicroStrategy:
Database Mapped to Binary Data Type Mapped to Varbin Data Type
Oracle Not Applicable Raw
Teradata Byte Varbyte
SQL Server Binary Varbinary
Sybase IQ Binary Varbinary
Sybase ASE Binary Varbinary
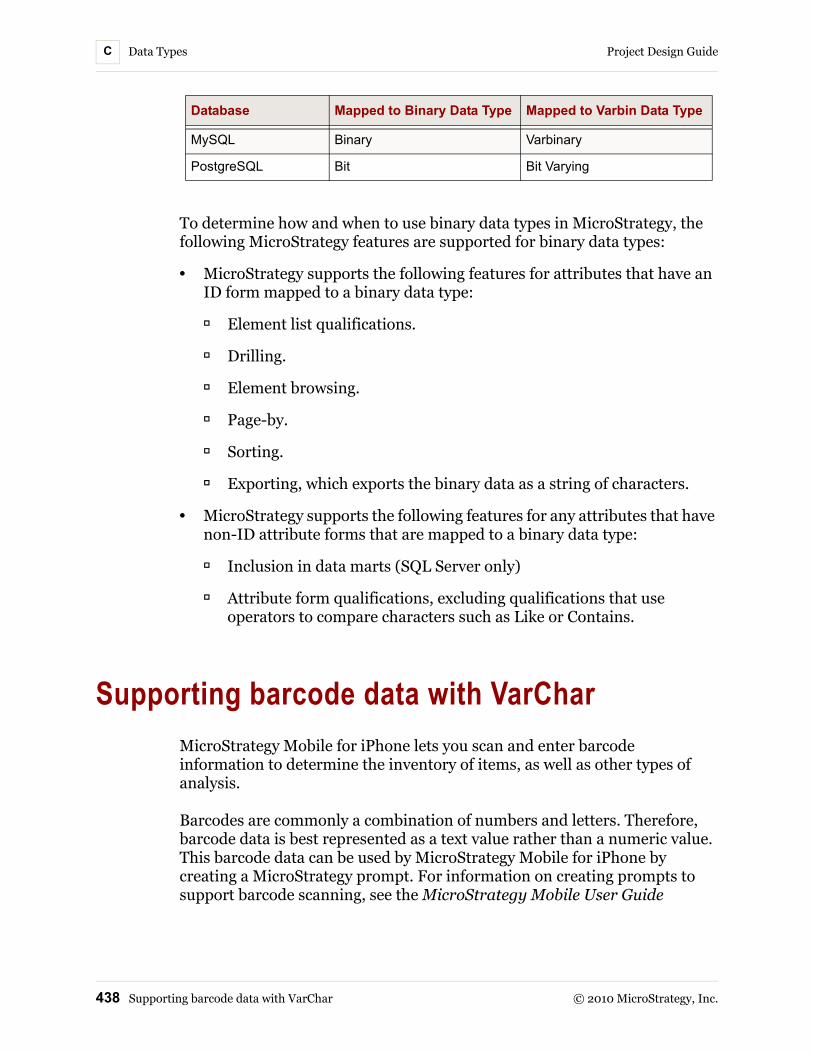
Data Types Project Design GuideC
438 Supporting barcode data with VarChar © 2010 MicroStrategy, Inc.
To determine how and when to use binary data types in MicroStrategy, the following MicroStrategy features are supported for binary data types:
• MicroStrategy supports the following features for attributes that have an ID form mapped to a binary data type:
Element list qualifications.
Drilling.
Element browsing.
Page-by.
Sorting.
Exporting, which exports the binary data as a string of characters.
• MicroStrategy supports the following features for any attributes that have non-ID attribute forms that are mapped to a binary data type:
Inclusion in data marts (SQL Server only)
Attribute form qualifications, excluding qualifications that use operators to compare characters such as Like or Contains.
Supporting barcode data with VarCharMicroStrategy Mobile for iPhone lets you scan and enter barcode information to determine the inventory of items, as well as other types of analysis.
Barcodes are commonly a combination of numbers and letters. Therefore, barcode data is best represented as a text value rather than a numeric value. This barcode data can be used by MicroStrategy Mobile for iPhone by creating a MicroStrategy prompt. For information on creating prompts to support barcode scanning, see the MicroStrategy Mobile User Guide
MySQL Binary Varbinary
PostgreSQL Bit Bit Varying
Database Mapped to Binary Data Type Mapped to Varbin Data Type

Project Design Guide Data Types C
© 2010 MicroStrategy, Inc. Supporting barcode data with VarChar 439
To support barcode scanning using MicroStrategy Mobile for iPhone, you must store the barcode data used in the associated prompt with a database data type that supports text data. MicroStrategy recommends using the VarChar data type for your database to store the barcode data. For information on how VarChar data types from databases are mapped to MicroStrategy data types, see Mapping of external data types to MicroStrategy data types, page 413.

Data Types Project Design GuideC
440 Supporting barcode data with VarChar © 2010 MicroStrategy, Inc.

© 2010 MicroStrategy, Inc. Glossary: aggregate function 441
GLOSSARY
aggregate function A numeric function that acts on a column of data and produces a single result. Examples include SUM, COUNT, MAX, MIN, and AVG.
aggregate table A fact table that stores data that has been aggregated along one or more dimensions.
See pre-aggregation.
application-level partition
In application-level partitioning, the application rather than the database server manages the partition tables. MicroStrategy supports two methods of application-level partitioning: metadata partition mapping and warehouse partition mapping.
Compare database-level partition.
application object An object used to provide analysis of and insight into relevant data. The definition of application objects such as reports, documents, filters, templates, custom groups, metrics, and prompts are derived from schema objects. All of these objects can be built and manipulated in MicroStrategy Desktop. Reports and documents can also be created and manipulated in MicroStrategy Web.

Glossary Project Design Guide
442 Glossary: attribute © 2010 MicroStrategy, Inc.
attribute A data level defined by the system architect and associated with one or more columns in a data warehouse lookup table. Attributes include data classifications like Region, Order, Customer, Age, Item, City, and Year. They provide a means for aggregating and filtering at a given level.
See also:
• attribute element
• attribute form
• child attribute
• constant attribute
• derived attribute
• parent attribute
attribute element A unique set of information for an attribute, defined by the attribute forms. For example, New York and Dallas are elements of the attribute City; January, February, and March are elements of the attribute Month.
attribute form One of several columns associated with an attribute that are different aspects of the same thing. ID, Name, Last Name, Long Description, and Abbreviation could be forms of the attribute Customer. Every attribute supports its own collection of forms.
attribute form expression
A mapping to the columns in the warehouse that are used to represent a specific attribute form in SQL.
attribute relationship See relationship.
attribute role A database column that is used to define more than one attribute. For example, Billing City and Shipping City are two attributes that have the same table and columns defined as a lookup table.

Project Design Guide Glossary
© 2010 MicroStrategy, Inc. Glossary: axis 443
axis A vector along which data is displayed. There are three axes—Row, Column, and Page. When a user defines a template for a report, he places template units—attributes, dimensions, metrics, consolidations, and custom groups—along each axis.
See also:
• column
• row
base fact column A fact column represented by a single column in a fact table.
browse attribute An attribute a user can directly browse to from a given attribute in a user hierarchy.
business intelligence (BI) system
A system that facilitates the analysis of volumes of complex data by providing the ability to view data from multiple perspectives.
cache A special data store holding recently accessed information for quick future access. This is normally done for frequently requested reports, whose execution is faster because they need not run against the database. Results from the data warehouse are stored separately and can be used by new job requests that require the same data. In the MicroStrategy environment, when a user runs a report for the first time, the job is submitted to the database for processing. However, if the results of that report are cached, the results can be returned immediately without having to wait for the database to process the job the next time the report is run.
cardinality The number of unique elements for an attribute.

Glossary Project Design Guide
444 Glossary: child attribute © 2010 MicroStrategy, Inc.
child attribute The lower-level attribute in an attribute relationship.
See also:
• parent attribute
• relationship
column 1) A one-dimensional vertical array of values in a table.
2) The set of fields of a given name and data type in all the rows of a given table.
3) MicroStrategy object in the schema layer that can represent one or more physical table columns or no columns.
See also:
• axis
• row
column alias In a fact definition, the specific name of the column to be used in temporary tables and SQL statements. Column aliases also include the data type to be used for the fact and allow you to modify the names of existing metrics for use in data mart reports without affecting the original metric.
compound attribute An attribute that has more than one key (ID) form.
compound key In a relational database, a primary key consisting of more than one database column.
compression ratio The average number of child records combined to calculate one parent record. For example, the compression of ratio between monthly data and yearly data is 12:1. This is used to determine where aggregate tables would have the greatest impact. The larger the compression ratio between two attributes, the more you stand to gain by creating an aggregate table that pre-calculates the higher-level data.

Project Design Guide Glossary
© 2010 MicroStrategy, Inc. Glossary: conditionality 445
conditionality Conditionality of a metric enables you to associate an existing filter object with the metric so that only data that meets the filter conditions is included in the calculation.
configuration object A MicroStrategy object appearing in the system layer and usable across multiple projects. Configuration objects include these object types: users, database instances, database login IDs, schedules.
constant attribute See implicit attribute.
Data Explorer A portion of the interface used to browse through data contained in the warehouse. Users can navigate through hierarchies of attributes that are defined by the administrator to find the data they need.
data source A data source is any file, system, or storage location which stores data that is to be used in MicroStrategy for query, reporting, and analysis.
A data warehouse can be thought of as one type of data source, which refers more specifically to using a database as your data source. Other data sources include text files, Excel files, and MDX Cube sources such as SAP BW, Microsoft Analysis Services 2000 and 2005, and Hyperion Essbase.
See also:
• data warehouse
• MDX Cube source
data warehouse 1) A database, typically very large, containing the historical data of an enterprise. Used for decision support or business intelligence, it organizes data and allows coordinated updates and loads.
2) A copy of transaction data specifically structured for query, reporting, and analysis.
See also data source.
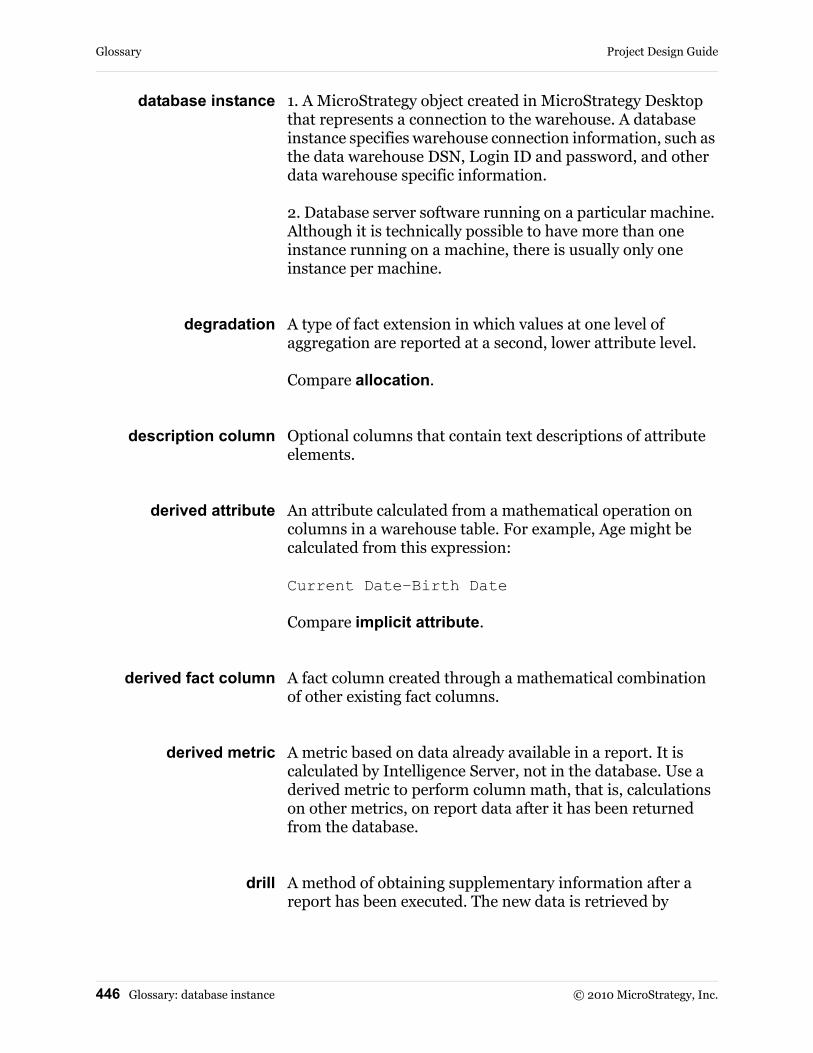
Glossary Project Design Guide
446 Glossary: database instance © 2010 MicroStrategy, Inc.
database instance 1. A MicroStrategy object created in MicroStrategy Desktop that represents a connection to the warehouse. A database instance specifies warehouse connection information, such as the data warehouse DSN, Login ID and password, and other data warehouse specific information.
2. Database server software running on a particular machine. Although it is technically possible to have more than one instance running on a machine, there is usually only one instance per machine.
degradation A type of fact extension in which values at one level of aggregation are reported at a second, lower attribute level.
Compare allocation.
description column Optional columns that contain text descriptions of attribute elements.
derived attribute An attribute calculated from a mathematical operation on columns in a warehouse table. For example, Age might be calculated from this expression:
Current Date–Birth Date
Compare implicit attribute.
derived fact column A fact column created through a mathematical combination of other existing fact columns.
derived metric A metric based on data already available in a report. It is calculated by Intelligence Server, not in the database. Use a derived metric to perform column math, that is, calculations on other metrics, on report data after it has been returned from the database.
drill A method of obtaining supplementary information after a report has been executed. The new data is retrieved by

Project Design Guide Glossary
© 2010 MicroStrategy, Inc. Glossary: dynamic relationship 447
re-querying the Intelligent Cube or database at a different attribute or fact level.
See also:
• page-by
• pivot
• sort
• subtotal
• surf
dynamic relationship When the relationship between elements of parent and child attributes changes. These changes often occur because of organizational restructuring; geographical realignment; or the addition, reclassification, or discontinuation of items or services. For example, a store may decide to reclassify the department to which items belong.
element browsing Navigating through hierarchies of attribute elements. For example, viewing the list of months in a year.
entity relationship diagram (ERD)
A diagram that provides a graphical representation of the physical structure of the data in the source system, which lets you easily recognize tables and columns and the data stored in those columns.
entry level The lowest level set of attributes at which a fact is available for analysis.
entry point In a user hierarchy, a shortcut to an attribute in the Data Explorer which is helpful in allowing users to more easily access frequently-used attributes in the Data Explorer.
extraction, transformation, and
loading (ETL)
1) The process used to populate a data warehouse from disparate existing database systems.
2) Third-party software used to facilitate such a process.

Glossary Project Design Guide
448 Glossary: fact © 2010 MicroStrategy, Inc.
fact 1) A measurement value, often numeric and typically aggregatable, stored in a data warehouse.
2) A schema object representing a column in a data warehouse table and containing basic or aggregated numbers—usually prices, or sales in dollars, or inventory quantities in counts.
See also metric.
fact column A column in a database table that contains fact data.
fact expression A mapping of facts to physical columns in the warehouse. Fact expressions can be as simple as a fact column name from the warehouse or as sophisticated as a formula containing fact columns and numeric constants. Facts can have multiple fact expressions.
fact table A database table containing numeric data that can be aggregated along one or more dimensions. Fact tables can contain atomic or summarized data.
filter A MicroStrategy object that specifies the conditions that the data must meet to be included in the report results. Using a filter on a report narrows the data to consider only the information that is relevant to answer your business question, since a report queries the database against all the data stored in the data warehouse.
A filter is composed of at least one qualification, which is the actual condition that must be met for the data to be included on a report. Multiple qualifications in a single filter are combined using logical operators. Examples include "Region = Northeast" or "Revenue > $1 million".
A filter is normally implemented in the SQL WHERE clause.
form group a grouping of attribute forms to create a compound attribute. A form group must be created to create a compound key,

Project Design Guide Glossary
© 2010 MicroStrategy, Inc. Glossary: heterogeneous column naming 449
which identifies that an attribute form requires more than one ID column to uniquely identify its elements.
See also compound key.
heterogeneous column naming
Columns in different tables in a database that store the same data but have different names. For example, one column named Customer in one table and one named Customer Name in a different table, both containing customer names.
hierarchy A set of attributes defining a meaningful path for element browsing or drilling. The order of the attributes is typically—though not always—defined such that a higher attribute has a one-to-many relationship with its child attributes.
highly denormalized schema
Schema type where not only are higher-level attribute ID columns present within all related tables, but the description columns are present as well.
highly normalized schema
Schema type where lookup tables contain unique developer-designed attribute keys.
homogeneous column naming
Columns in different tables of a database that contain the same data and have the same column name.
ID column A column that contains attribute element identification codes. All attributes must have an ID column.
implicit attribute An attribute that does not physically exist in the database because it is created at the application level. Such an attribute has its expression defined as a constant value, though nothing is saved in a column. For example, you may wish to create columns in the database with a value of 1 for every row to get around COUNT limitations. You do not have to actually create the column, though, because in the Attribute Editor, you can just enter a “1” in the expression to create a count. Implicit attributes are useful in analyzing and retrieving information. When analyzing data, you can use constant
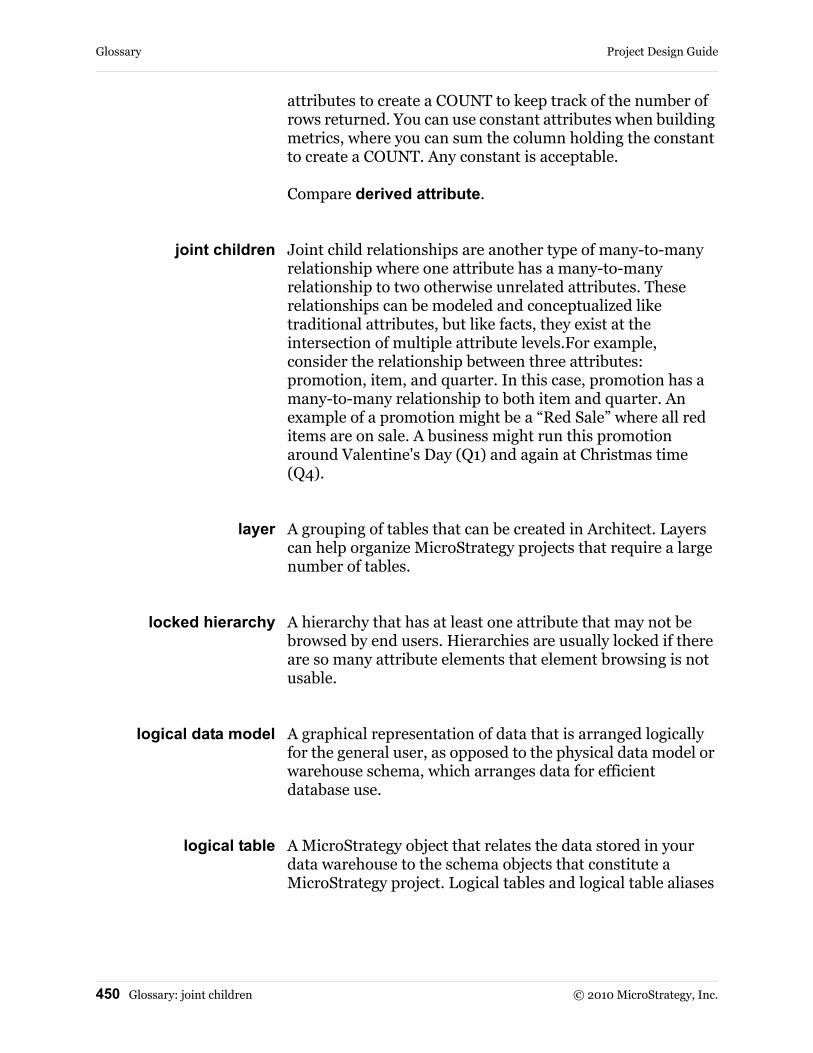
Glossary Project Design Guide
450 Glossary: joint children © 2010 MicroStrategy, Inc.
attributes to create a COUNT to keep track of the number of rows returned. You can use constant attributes when building metrics, where you can sum the column holding the constant to create a COUNT. Any constant is acceptable.
Compare derived attribute.
joint children Joint child relationships are another type of many-to-many relationship where one attribute has a many-to-many relationship to two otherwise unrelated attributes. These relationships can be modeled and conceptualized like traditional attributes, but like facts, they exist at the intersection of multiple attribute levels.For example, consider the relationship between three attributes: promotion, item, and quarter. In this case, promotion has a many-to-many relationship to both item and quarter. An example of a promotion might be a “Red Sale” where all red items are on sale. A business might run this promotion around Valentine's Day (Q1) and again at Christmas time (Q4).
layer A grouping of tables that can be created in Architect. Layers can help organize MicroStrategy projects that require a large number of tables.
locked hierarchy A hierarchy that has at least one attribute that may not be browsed by end users. Hierarchies are usually locked if there are so many attribute elements that element browsing is not usable.
logical data model A graphical representation of data that is arranged logically for the general user, as opposed to the physical data model or warehouse schema, which arranges data for efficient database use.
logical table A MicroStrategy object that relates the data stored in your data warehouse to the schema objects that constitute a MicroStrategy project. Logical tables and logical table aliases

Project Design Guide Glossary
© 2010 MicroStrategy, Inc. Glossary: logical table size 451
are direct representations of physical tables in your data warehouse.
See also:
• logical table size
• logical view
logical table size A relative size or weight for a logical table in a project. The logical table size determines which logical table to use to answer a query when multiple logical tables would provide the same data. The table with the lowest logical table size is used, as a lower logical table size means the table has a higher level of aggregation. The performance of accessing a table with a higher level of aggregation is usually better than accessing a table with a lower level of aggregation.
See also:
• logical table
• logical view
logical view A logical table that is defined using SQL queries against the data warehouse, which can combine data from multiple physical tables into one logical table representation in MicroStrategy.
See also:
• logical table
• logical table size
lookup table A database table used to uniquely identify attribute elements. They typically consist of descriptions of dimensions. Lookup tables are usually joined to fact tables to group the numeric facts in the fact table by dimensional attributes in the lookup tables.

Glossary Project Design Guide
452 Glossary: managed object © 2010 MicroStrategy, Inc.
managed object A schema object unrelated to the project schema, which is created by the system and stored in a separate system folder. Managed objects are used to map data to attributes, metrics, hierarchies and other schema objects for Freeform SQL, Query Builder, MDX Cube reports, and reports created using Import Data.
many-to-many An attribute relationship in which multiple elements of a parent attribute can relate to multiple elements of a child attribute, and vice versa.
See also:
• one-to-one
• one-to-many
• many-to-one
• relationship
many-to-one An attribute relationship in which (1) multiple elements of a parent attribute relate to only one element of a child attribute, and (2) every element of the child attribute can relate to multiple elements of the parent.
See also:
• one-to-one
• one-to-many
• many-to-many
• relationship
MDX cube A MDX cube is a collection or set of data retrieved from an MDX cube source, which is imported into MicroStrategy and mapped to various objects to allow query, reporting, and analysis on the data.
See also MDX cube source.

Project Design Guide Glossary
© 2010 MicroStrategy, Inc. Glossary: MDX cube source 453
MDX cube source When integrated with MicroStrategy, the third-party tools SAP BW, Microsoft Analysis Services, and Hyperion Essbase are referred to as MDX cube sources. You can import and map data from these different MDX cube sources in MicroStrategy to query, report on, and analyze data with MicroStrategy.
MicroStrategy can integrate with MDX cube source data as well as access data from a relational database concurrently.
See also:
• MDX cube
• data source
metadata A repository whose data associates the tables and columns of a data warehouse with user-defined attributes and facts to enable the mapping of the business view, terms, and needs to the underlying database structure. Metadata can reside on the same server as the data warehouse or on a different database server. It can even be held in a different RDBMS.
See also metadata shell.
metadata shell A set of blank tables that are created when you initially implement a MicroStrategy business intelligence environment.
See also metadata.
metric 1) A business calculation defined by an expression built with functions, facts, attributes, or other metrics. For example: sum(dollar_sales) or [Sales] - [Cost]
2) The MicroStrategy object that contains the metric definition.
See also fact.
moderately normalized schema
Schema type having the same basic structure as the highly normalized schema, but here the higher-level attribute ID columns are present within all related tables.

Glossary Project Design Guide
454 Glossary: MOLAP © 2010 MicroStrategy, Inc.
MOLAP Multidimensional online analytical processing.
multithreaded Characteristic of a process that supports the simultaneous execution of multiple threads. The startup code initiates the primary thread of a process by passing the main function address to the operating system. When the primary thread terminates, the process terminates.
narrowcast application In a business intelligence environment, an application that allows for the distribution of personalized business information to subscribed users. In MicroStrategy, Narrowcast Server is a proactive information delivery server that allows for this distribution of information through e-mail, printers, file services, SMS, and mobile devices.
object Conceptually, an object is the highest grouping level of information about one concept, used by the user to achieve the goal of specified data analysis. More concretely, an object is any item that can be selected and manipulated, including folders, reports, facts, metrics, and so on.
one-to-many An attribute relationship in which every element of a parent attribute can relate to multiple elements of a child attribute, while every element of the child attribute relates to only one element of the parent. The one-to-many attribute relationship is the most common in data models.
See also:
• one-to-one
• many-to-many
• many-to-one
• relationship

Project Design Guide Glossary
© 2010 MicroStrategy, Inc. Glossary: one-to-one 455
one-to-one An attribute relationship in which every element of the parent attribute relates to exactly one element of the child attribute, and vice versa.
See also:
• one-to-many
• many-to-one
• many-to-many
• relationship
online analytical processing (OLAP)
A system with analytical processing that involves activities such as manipulating transaction records to calculate sales trends, growth patterns, percent to total contributions, trend reporting, and profit analysis.
online transaction processing (OTLP)
Typically, databases or mainframes that store transactional data. Transactional processing involves the simple recording of transactions such as sales, inventory, withdrawals, or deposits.
page-by Segmenting data in a grid report by placing available attributes, consolidations, and metrics on a third axis called the Page axis. Since a grid is two-dimensional, only a slice of the cube can be seen at any one time. The slice is characterized by the choice of elements on the Page axis. By varying the selection of elements, the user can page through the cube.
See also:
• drill
• pivot
• sort
• subtotal
• surf

Glossary Project Design Guide
456 Glossary: parent attribute © 2010 MicroStrategy, Inc.
parent attribute The higher-level attribute in an attribute relationship with one or more children.
See also:
• child attribute
• relationship
partial relationship An attribute relationship in which elements of one attribute relate to elements of a second attribute, while the opposite is not necessarily true.
See also:
• relationship
• one-to-many
• many-to-one
• many-to-many
partition base table A warehouse table that contains one part of a larger set of data. Partition tables are usually divided along logical lines, such as time or geography. Also referred to as a PBT.
See also partition mapping.
partition mapping The division of large logical tables into smaller physical tables based on a definable data level, such as month or department. Partitions minimize the number of tables and records within a table that must be read to satisfy queries issued against the warehouse. By distributing usage across multiple tables, partitions improve the speed and efficiency of database queries.

Project Design Guide Glossary
© 2010 MicroStrategy, Inc. Glossary: partition mapping table 457
partition mapping table A warehouse table that contains information used to identify the partitioned base tables as part of a logical whole. Also referred to as a PMT.
See also:
• partition base table
• partition mapping
physical warehouse schema
A detailed graphic representation of your business data as it is stored in the data warehouse. It organizes the logical data model in a method that make sense from a database perspective.
See also schema.
pivot To reconfigure data on a grid report by placing report objects (attributes, metrics, consolidations) on different axes. Also, to reconfigure a grid report by interchanging row and column headers, and hence the associated data. Subset of cross-tab.
See also:
• drill
• page-by
• sort
• subtotal
• surf
port number The port number is how a server process identifies itself on the machine on which it is running. For example, when the Intelligence Server machine receives a network call from a client (Desktop, Web, Narrowcast Server, Command Manager, and so on), it knows to forward those calls to the Intelligence Server port number that is specified in the call.

Glossary Project Design Guide
458 Glossary: pre-aggregation © 2010 MicroStrategy, Inc.
pre-aggregation Aggregation, or the calculation of numeric data at a specific attribute level, that is completed before reports are run, with the results stored in an aggregate table.
See also:
• aggregate table
• aggregation
prefix A prefix is stored in the project metadata associated with a table or tables and is used by the Engine to generate SQL. Also, the Catalog Server uses it to obtain table sample values and row counts. In most cases, it should match the name space field since it is used to qualify on a specific table belonging to a certain owner or name space. Prefixes can be defined and modified from the Warehouse Catalog interface.
See also table name space.
primary key In a relational database, the set of columns required to uniquely identify a record in a table.
process An executing application comprising one or more threads. Processes use temporary private address spaces and control operating system resources such as files, dynamic memory allocations, pipes, and synchronization objects.
project 1) The highest-level intersection of a data warehouse, metadata repository, and user community, containing reports, filters, metrics, and functions.
2) An object containing the definition of a project, as defined in (1). The project object is specified when requesting the establishment of a session.

Project Design Guide Glossary
© 2010 MicroStrategy, Inc. Glossary: project source 459
project source Defines a connection to the metadata repository and is used by various MicroStrategy products to access projects. A direct project source is a two-tier connection directly to a metadata repository. A server project source is a 3-tier connection to a MicroStrategy Intelligence Server. One project source can contain many projects and the administration tools found at the project source level are used to monitor and administer all projects in the project source.
prompt 1) MicroStrategy object in the report definition that is incomplete by design. The user is asked during the resolution phase of report execution to provide an answer that completes the information. A typical example with a filter is choosing a specific attribute on which to qualify.
2) In general, a window requesting user input, as in “type login ID and password at the prompt.”
qualification The actual condition that must be met for data to be included on a report. Examples include "Region = Northeast" or "Revenue > $1 million". Qualifications are used in filters and custom groups. You can create multiple qualifications for a single filter or custom group, and then set how to combine the qualifications using the logical operators AND, AND NOT, OR, and OR NOT.
quality relationship The relationship between a parent attribute and two or more “joint child” attributes. The parent attribute is referred to as a “quality” because its definition is complete only with the intersection of its joint children.
ratio The relationship in quantity, amount, or size between the cardinalities of related attributes.
See also cardinality.
relate table A table containing the ID columns of two or more attributes, thus defining associations between them.

Glossary Project Design Guide
460 Glossary: relational database management system © 2010 MicroStrategy, Inc.
relational database management system
A relational database management system (RDBMS) is a program that lets you create, update, and administer a relational database. A relational database is a collection of data items organized as a set of formally-described tables from which data can be accessed or reassembled in many different ways without having to reorganize the database tables.
The leading RDBMS products are Oracle, IBM DB2 and Microsoft SQL Server.
relationship An association specifying the nature of the connection between one attribute (the parent) and one or more other attributes (the children). For example, City is a child attribute of State.
See also:
• parent attribute
• child attribute
• partial relationship
• quality relationship
• one-to-one
• one-to-many
• many-to-one
• many-to-many
report The central focus of any decision support investigation, a report allows users to query for data, analyze that data, and then present it in a visually pleasing manner.
See also:
• filter
• template
report creation The process of building reports from existing, predesigned reports in MicroStrategy Desktop or in MicroStrategy Web.

Project Design Guide Glossary
© 2010 MicroStrategy, Inc. Glossary: report design 461
report design The process of building reports from basic report components using the Report Editor in MicroStrategy Desktop or MicroStrategy Web.
row The horizontal axis of a report.
See also:
• axis
• column
schema 1) The set of tables in a data warehouse associated with a logical data model. The attribute and fact columns in those tables are considered part of the schema itself.
2) The layout or structure of a database system. In relational databases, the schema defines the tables, the fields in each table, and the relationships between fields and tables.
schema object A MicroStrategy object created, usually by a project designer, that relates the information in the logical data model and physical warehouse schema to the MicroStrategy environment. These objects are developed in MicroStrategy Architect, which can be accessed from MicroStrategy Desktop. Schema objects directly reflect the warehouse structure and include attributes, facts, functions, hierarchies, operators, partition mappings, tables, and transformations.
shortcut object A MicroStrategy object that represents a link to any other MicroStrategy object such as report, filter, metric, and so forth.
server definition A MicroStrategy object stored in the metadata containing information about the configuration of an Intelligence Server.
server instance The combination of an Intelligence Server running with a particular server definition.

Glossary Project Design Guide
462 Glossary: simple key © 2010 MicroStrategy, Inc.
simple key In a relational database, a primary key that requires only one column to uniquely identify a record within a table.
sort Arranging data according to some characteristic of the data itself (alphabetical descending, numeric ascending, and so forth).
See also:
• drill
• page-by
• pivot
• subtotal
• surf
source system Any system or file that captures or holds data of interest.
star schema A highly denormalized physical warehouse schema in which lookup tables are consolidated so that every attribute ID and description column for a given hierarchy exists in one table.
statistics tables Tables that are used to record a variety of statistical information about the usage and performance of a MicroStrategy system.
Structured Query Language (SQL)
The query language standardized in 1986 by the American National Standards Institute (ANSI) and used to request information from tables in a relational database and to manipulate the tables’ structure and data.

Project Design Guide Glossary
© 2010 MicroStrategy, Inc. Glossary: subtotal 463
subtotal A totaling operation performed for a portion of a result set.
See also:
• drill
• page-by
• pivot
• sort
• surf
surf To add filters, attributes, attribute elements, metrics, and functions to existing analysis objects.
See also:
• drill
• page-by
• pivot
• sort
• subtotal
system hierarchy The superset hierarchy containing all attributes in a project. Unlike a browse hierarchy, it is not explicitly created but is automatically deduced by the MicroStrategy platform from all information available to it.
Compare user hierarchy.
table name space A field that is read from the warehouse catalog and used to organize databases. This field cannot be modified from the product since it is actually stored in the warehouse. Each table object in the metadata stores the name space or owner from which it came. This is needed to uniquely identify each table saved in the project when comparing table information in the metadata to the real one in the warehouse.
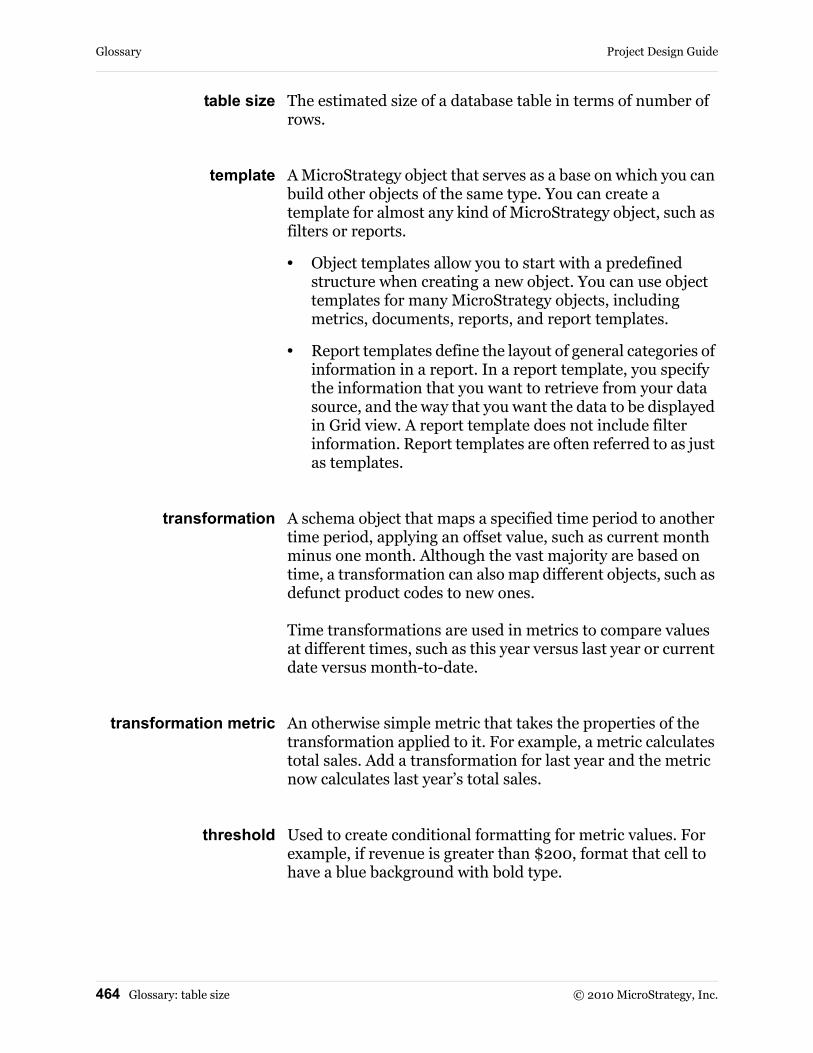
Glossary Project Design Guide
464 Glossary: table size © 2010 MicroStrategy, Inc.
table size The estimated size of a database table in terms of number of rows.
template A MicroStrategy object that serves as a base on which you can build other objects of the same type. You can create a template for almost any kind of MicroStrategy object, such as filters or reports.
• Object templates allow you to start with a predefined structure when creating a new object. You can use object templates for many MicroStrategy objects, including metrics, documents, reports, and report templates.
• Report templates define the layout of general categories of information in a report. In a report template, you specify the information that you want to retrieve from your data source, and the way that you want the data to be displayed in Grid view. A report template does not include filter information. Report templates are often referred to as just as templates.
transformation A schema object that maps a specified time period to another time period, applying an offset value, such as current month minus one month. Although the vast majority are based on time, a transformation can also map different objects, such as defunct product codes to new ones.
Time transformations are used in metrics to compare values at different times, such as this year versus last year or current date versus month-to-date.
transformation metric An otherwise simple metric that takes the properties of the transformation applied to it. For example, a metric calculates total sales. Add a transformation for last year and the metric now calculates last year’s total sales.
threshold Used to create conditional formatting for metric values. For example, if revenue is greater than $200, format that cell to have a blue background with bold type.

Project Design Guide Glossary
© 2010 MicroStrategy, Inc. Glossary: user hierarchy 465
user hierarchy A named set of attributes and their relationships, arranged in specific sequences for a logical business organization. They are user-defined and are used to define the browse and drill relationships between attributes.
virtual cube 1) In an OLAP data model, a conceptual, multidimensional representation of data. Unlike a physical cube, a virtual cube does not perform data retrieval and consequently lacks the performance problems and size limitations associated with a physical cube. A virtual cube maps MicroStrategy objects such as hierarchies and metrics to OLE DB for OLAP objects.
2) The result of mapping a logical data model to an OLE DB for OLAP multidimensional model after hierarchies and metrics have been selected from a project. No physical cube is created or loaded, but a definition of the virtual cube structure is stored in MicroStrategy metadata.

Glossary Project Design Guide
466 Glossary: virtual cube © 2010 MicroStrategy, Inc.

© 2010 MicroStrategy, Inc. 467
INDEX
Aaccessing
Project Creation Assistant 83Warehouse Catalog 309
adding
table to a project 86adding a table to a project 86, 119aerial perspective of hierarchy 288, 303aggregate function defined on 348
aggregate table defined on 343
advantages 343base table 345compression ratio 348effectiveness 348integrating into project 349logical table size 349parent-child relationship 347pre-aggregation 344query frequency 346
aggregate-aware 349aggregation defined on 344
degree of 345dense 345dynamic 344sparse 345
alias
attribute column 248fact column 142, 188, 196table 269, 271
allocation expression 211analysis, time-series 357application-level partition defined on 351
Architect defined on 14, 99adding tables 121displaying data sources 120modifying tables 125removing tables 122toolbar options 118updating tables 124
atomic defined on 345
attribute defined on 9Attribute Creation Wizard 219Attribute Editor 224browse form 277cardinality 32child 23column alias 248component. See report display form
and browse form.
compound 159, 274

Index Project Design Guide
468 © 2010 MicroStrategy, Inc.
compound key 159, 274constant 248creating in Project Creation
Assistant 220creating using Attribute Editor 226cross-dimensional. See joint child rela-
tionship.
derived attribute 243derived expression 153, 243display 161, 277element. See attribute element.
example 21expression 217filtering in a hierarchy 293form. See attribute form.
heterogeneous mapping 155, 245identifying 28implicit 248in hierarchy 23joint child relationship 263many-to-many relationship 253, 256many-to-one relationship 253multiple counting in relationship 258nonrelated 254one-to-many relationship 253one-to-one relationship 252overview 21parent 23properties 217, 218qualification 353ratio 32relationship. See attribute relationship.
report display form 277role. See attribute role.
simple expression 241system hierarchy 166, 252virtual 248
attribute component. See report display
form and browse form.
Attribute Creation Wizard 219using 220
Attribute Editor 224creating an attribute 226creating an attribute form 238updating a hierarchy 285
attribute element defined on 22, 230example 22overview 22
attribute form defined on 33
creating with Attribute Editor 238display 161, 277example 33expression 240group 275qualification 353
attribute relationship defined on 23, 166, 252
as property of attribute 217example 23identifying 29in lookup table 39overview 23
attribute role defined on 267
automatic recognition 268, 269explicit table alias 269, 271
automatic attribute role recognition 268
Bbarcode, support with iPhone 438base fact column 43base table defined on 345
pre-aggregation 344BI architecture 2browse
attribute 297form 277

Project Design Guide Index
© 2010 MicroStrategy, Inc. 469
browsing 297enabling in a hierarchy 299
building a logical data model 25business intelligence (BI)
system defined on 1
Ccalculating
growth percentage 357logical table size 321variance 357
cardinality for an attribute 32Cartesian join 252catalog
SQL 323category. See hierarchy.
child attribute 23class. See hierarchy.
column defined on 36, 312base fact column 43data type. See column data type.
derived fact 43description 37fact 37heterogeneous naming 45homogeneous naming 46ID 37physical warehouse schema 36
column alias defined on 196
attribute 248fact 142, 188, 196
column data type
changed 329compound attribute 159, defined on 274
creating 275compound key defined on 37
compound attribute and 159, 274compression ratio defined on 348
Configuration Wizard 76connecting
to a database 317consolidating lookup tables 53constant attribute 248creating
attribute 226compound attribute 275fact 179hierarchy 282logical data model 25project 79user hierarchy 282
cross product join 206cross-dimensional attribute. See joint child
relationship.
customizing catalog SQL 323
DData Explorer defined on 299, 299
enabling hierarchy browsing 175, 284, 299
data model. See logical data model.
data provider. See project source.
data slice 352data source defined on 6
displaying in Architect 120Excel files 6Import Data 6MDX cube sources 6text files 6
data type
Big Decimal 436changed in column 329example 414high-precision 436mapping and 413warehouse catalog 432

Index Project Design Guide
470 © 2010 MicroStrategy, Inc.
data warehouse defined on 4connecting to 78modifying default options 129physical schema and 35schema type 47structure 47Warehouse Catalog 308
database
connection operation 317custom login 317gateway support 315read operation 317secondary 315
database gateways, example 315database instance defined on 75
database management system 322degradation defined on 207
dense aggregation 345derived
attribute 243fact 138, 191fact column 43
derived facts, example 192description column defined on 37
Desktop. See MicroStrategy Desktop.
dimension
See also hierarchy.
disallowing fact entry level 211drilling using a hierarchy 299dynamic aggregation 344dynamic relationship defined on 347
Eelement, attribute 230entity relationship diagram
(ERD) defined on 26
entity. See hierarchy.
entry level defined on 179
entry point 295ERD. See entity relationship diagram.
ETL. See extraction, transformation, and loading process.
examples
attribute display for browsing 277attribute elements 22, 230attribute form expressions 240attribute forms 33, 217attribute qualifications 353attribute relationships 23, 252attribute roles 266attributes 21attributes, heterogeneous
mapping 245column alias 196compound attributes 275configuration objects 9dashboards and scorecards 368data model sample 24data types 414database gateways 315derived facts 192documents 368drilling using hierarchies 299ETL 4fact degradations 207facts, disallowing reporting 212heterogeneous column names 193hierarchies 286, 347internationalization 233logical data model 17, 24, 371logical tables 386logical views 394multiple data sources 330parent/child relationship 254partitions 351physical schema 35, 381

Project Design Guide Index
© 2010 MicroStrategy, Inc. 471
project 367simple and compound keys 38sort order 239source system for capturing data 2table data sample 314table relation 200transformations 358unique identifiers 32
explicit table alias 269, 271expression map 190expression-based transformation 359
creating 361member expression 363member table 363
extension, level 198extraction, transformation, and loading
(ETL) process defined on 4, 5
Ffact 20, defined on 177
allocation expression 211base fact column 43column alias 142, 188, 196column. See fact column.
creating 179cross product join 206degradation defined on 207
derived 138, 191derived fact column 43disallowing 211extension 198Fact Creation Wizard 180fact definition 188, 189Fact Editor 180, 184fact entry level 179fact relation 204heterogeneous fact column 140, 194hierarchy and 24
identifying 27implicit 191level extension 188, 198table 41table relation 200table. See fact table.
fact column defined on 36, defined on 37
base 43derived 43heterogeneous 140, 194
Fact Creation Wizard 180Fact Editor 180, 185fact expression defined on 190
fact table defined on 178
column naming 46level 44overview 20warehouse and 41
filtered hierarchy 293flag 263form
attribute 236expression 240group 275
form group defined on 275
Ggateway support for database 315growth percentage calculation 357
Hheterogeneous
attribute mapping 155, 245column naming defined on 45
fact column 140, 194partition mapping 351
heuristics

Index Project Design Guide
472 © 2010 MicroStrategy, Inc.
schema creation 102hierarchy 281
aerial perspective 303Attribute Editor 285attribute filter 293attributes in 23browse attribute 297browsing 297, 299creating 282Data Explorer and 175, 284, 299defining 30displaying 289drilling 299enabling browsing 299entry point 295example 286, 347fact in 24filtering an attribute in 293Hierarchy Editor 286, 288, 299Hierarchy Viewer 288limited 291locked 289logical data model and 23organization 286Project Creation Assistant 285structure 287system hierarchy 285user hierarchy 286
Hierarchy Editor 286, 288, 299Hierarchy Viewer 288highly denormalized schema 53
higher level lookup table 53highly normalized schema 48homogeneous
column naming 46partition mapping 352, 353
Iimplicit attribute defined on 248
implicit fact 191Import Data 70
data sources 6international technical support xxvinternationalization 89
about 57and attribute elements 165and attribute forms 165character sets 64defining languages 85displaying columns for 107enabling 89example 233
iPhone
scanning barcodes 438supporting the Map widget 64
Jjoin, cross product 206joint child defined on 263
joint child attribute and transformation metric 364
joint child relationship 263
Kkey
compound 37simple 37
Llayer defined on 130
level
extension 198limited hierarchy 291

Project Design Guide Index
© 2010 MicroStrategy, Inc. 473
locked hierarchy defined on 289
logical defined on 388
logical data model defined on 17
attribute in 23building 25cardinality 32conventions 30design factors 55example 17, 24for MicroStrategy Tutorial 371, 380ratio 32sample 24schema type 47source of structure 27unique identifier 31
logical table defined on 385, 386creating 388defining logical table size 388
logical table size 349, defined on 388
logical view defined on 385, 386creating 392examples 394
login, custom 317lookup table defined on 38
attribute relationship and 39consolidating 53many-to-many relationship 40one-to-one relationship 39
Mmanaged object
Import Data 71many-to-many
relationship defined on 253
design considerations 256example 29lookup table 40relate table 41
many-to-many transformation
double-counting 364table-based transformation and 359
many-to-one relationship defined on 253
Map widget
supporting 64mapping
schema object in Warehouse Catalog 321
mapping type 363many-to-many 364one-to-one 363
member
attribute 362expression 363table 362
metadata defined on 8connecting to 77shell 73table 76
metadata partition mapping 351attribute qualification 353data slice 352warehouse partition mapping
versus 354metadata shell defined on 73
metric
transformation 358MicroStrategy Desktop 11MicroStrategy metadata. See metadata.
MicroStrategy Mobile
barcode scanning with iPhone 438supporting the Map widget 64
MicroStrategy Project Builder. See Project Builder.
MicroStrategy Tutorial 367data model 379logical data model 371, 380

Index Project Design Guide
474 © 2010 MicroStrategy, Inc.
physical schema 381physical warehouse schema 381schema 380viewing the data model 379viewing the physical schema 381
MicroStrategy Web Universal 12migrating a table 322moderately normalized schema 51MOLAP defined on 343
multidimensional data model. See logical data model.
multiple counting 257
Nnonrelated attributes 254normalized schema 49, 51
Oobject, user 10OLTP 3one-to-many relationship defined on 253
example 29relate table 40
one-to-one relationship defined on 252
lookup table 39online analytical processing. See OLAP.
online transaction processing. See OLTP.
opening
Project Creation Assistant 83Warehouse Catalog 309
Pparent attribute 23parent-child relationship 23, 347
dynamic 347static 348
partition base table defined on 351, 354partition mapping defined on 350
application-level 351attribute qualification 353data slice 352example 351heterogeneous 351homogeneous 352, 353metadata 351, 354partition base table 354server-level 350table 312, 354type 351warehouse 353, 354
partition mapping table defined on 354
PBT. See partition base table.
physical warehouse schema defined on 35
design factors 55example 35for MicroStrategy Tutorial 381sample 381
planning a project 80PMT. See partition mapping table.
pre-aggregation defined on 344
aggregate table 343base table 345compression ratio 348integrating aggregate table 349logical table size 349parent-child relationship 347query frequency 346
prefix 321primary key defined on 37
logical tables defined on 391
project defined on 13
adding a table to 86, 119adding tables using Architect 121

Project Design Guide Index
© 2010 MicroStrategy, Inc. 475
aggregate table 349creating 79data warehouse 86integrating an aggregate table 349managing a table 310managing a table for 310modifying tables using Architect 125planning 80Project Builder 95Project Creation Assistant 84, 86, 114removing a table from 86removing tables using Architect 122sample project 367schema 306source. See project source.
table management 310updating tables using Architect 124Warehouse Catalog 86warehouse table in 86, 119
Project Builder 95Project Creation Assistant 82, 285project source defined on 73
connecting to 77creating 82
Qqualification for an attribute form 353quality. See joint child relationship.
query frequency 346
Rratio for an attribute 32RDBMS defined on 4
server-level partitioning 350read operation for a database 317relate table 40related attributes. See attribute relation-
ship.
relation, fact 204relational database management system.
See RDBMS.
relationship
dynamic 347many-to-many 256parent-child 347relate table 40, 41static 348
removing
table from a project 86report display form 277row count for table 320
Sschema
creation heuristics 102highly denormalized 53highly normalized 49MicroStrategy Tutorial project 380moderately normalized 51object 13physical warehouse 35project 306star 53type. See schema type.
updating 307schema type 47
comparison 56server-level partitioning 350simple
expression 240key 37
source system defined on 2, 5, 26sparse aggregation 345SQL defined on 4
attributes and columns in 21

Index Project Design Guide
476 © 2010 MicroStrategy, Inc.
catalog 323default catalog SQL 327facts and columns in 20
star schema 53static relationship defined on 348
structure
of hierarchy 287of table 312
Structured Query Language. See SQL.
summary table 343support. See technical support.
supported data type 414system hierarchy 166, 252,
defined on 285
Ttable
adding to a project 86, 119, 121aggregate 343alias 269, 271calculating logical size 321calculating size 321compound key 37creating logical table 388defining logical table size 388fact table defined on 41, 178key 37logical table 386logical view 386lookup 38, 39managing for a project 311migrating 322modifying 125name space 312, 318, 320physical warehouse schema 36prefix 320primary key 37relation 200
removing from a project 122row count 320sample data 314simple key 37size defined on 349
summary 343table alias 386Table Editor 389transformation 359updating 124updating structure 313viewing structure 312warehouse table in Project Creation
Assistant 86Table Editor 389table-based member expression 363table-based transformation 359
creating 360member table 363
technical support xxviinternational xxv
text fact. See joint child relationship.
time-series analysis 357toolbar
options for Architect 118transformation defined on 358
components 362double-counting 364example 358expression-based 359, 361many-to-many 359mapping type 363member attribute 362member expression 363member table 362metric 358metric. See transformation metric.
one-to-one mapping type 363

Project Design Guide Index
© 2010 MicroStrategy, Inc. 477
table-based 359, 360transformation metric defined on 358
joint child attribute 364troubleshooting
column data type changed 329column missing 329data warehouse connection 328table missing 329
Uunique identifier 31updating
project schema 307table structure 313
user defined object. See fact expression.
user hierarchy defined on 286
browse attribute 297browsing 297creating 282displaying 289drilling 299enabling browsing 299entry point 295filtering an attribute in 293limited 291locked 289structure 287
user object 10using attribute form versus characteristic
attribute 251
Vvariance calculation 357viewing
sample data model 379sample table data 314sample warehouse schema 381
table structure 312virtual attribute 248
WWarehouse Catalog
accessing 309column missing 329connection operation 317data type 329database gateway support 315default catalog SQL 327displaying information 320managing 311mapping schema object 321read operation 317troubleshooting 328updating table structure 313usage and settings 308viewing table structure 312
warehouse partition mapping 353metadata partition mapping
versus 354partition base table 354partition mapping table 354
warehouse table in Project Creation Assistant 86
warehouse, physical schema 35, 381

Index Project Design Guide
478 © 2010 MicroStrategy, Inc.


