Microstructure-informed modelling of damage evolution in cement paste Mingzhong Zhang, Andrey P. Jivkov ⇑ Mechanics and Physics of Solids Research Team, School of Mechanical, Aerospace and Civil Engineering, The University of Manchester, Oxford Road, Manchester M13 9PL, UK highlights Macroscopic behaviour from microstructure features and meso-scale principles. Derivation of microstructure features from high-resolution micro-CT images. Construction of site-bond model with microstructure information. Demonstration of agreement between calculated responses and experimental data. Quantitative assessment of microstructure effects on macroscopic behaviour. article info Article history: Received 27 January 2014 Received in revised form 6 May 2014 Accepted 12 June 2014 Keywords: Cement paste Microstructure Image analysis Micromechanics Brittle ligament Damage evolution abstract Cement paste is a binder for cementitious materials and plays a critical role in their engineering-scale properties. Understanding fracture processes in such materials requires knowledge of damage evolution in cement paste. A site-bond model with elastic-brittle spring bundles is developed here for analysis of the mechanical behaviour of cement paste. It incorporates key microstructure information obtained from high resolution micro-CT. Volume fraction and size distribution of anhydrous cement grains are used for calculating model length scale and elasticity. Porosity and pore size distribution are used to allocate local failure energies. Macroscopic damage emerges from the generation of micro-crack population repre- sented by bond removals. Effects of spatial distribution, porosity and sizes of pores on tensile strength and damage are investigated quantitatively. Results show a good agreement with experiment data, dem- onstrating that the proposed technology can predict mechanical and fracture behaviour of cementitious materials based exclusively on microstructure information. Ó 2014 The Authors. Published by Elsevier Ltd. This is an open access article under the CC BY license (http:// creativecommons.org/licenses/by/3.0/). 1. Introduction Concrete is the most popular and widely used construction material in the world. The fracture behaviour of concrete has been a great concern for many years and remains a challenge due to con- crete’s complex and heterogeneous porous microstructure extend- ing over wide range of length scales from nanometres to millimetres [1]. At meso-scale, concrete can be considered as a three-phase composite consisting of aggregate, matrix (i.e. cement paste) and interfacial transition zone (ITZ) between aggregate and matrix. ITZ is a ‘‘special’’ cement paste that has a higher initial water-to-cement mass ratio (w/c) compared to matrix [2]. There- fore, to study the mechanical properties and failure of concrete, one must first understand the damage evolution and fracture pro- cess in cement paste, which depends on its microstructure. In order to characterise the 3D microstructure of cement paste, a variety of techniques including computer-aided simulation and experimental tests have been proposed and developed in the past few decades. Among them, computer-based cement hydration models, e.g. CEMHYD3D [3], HYMOSTRUC3D [4,5] and the more recently proposed lic (pronounced Mike) [6] are commonly applied to simulate the hydration process and gradual formation of the microstructure of cement paste. As a non-destructive tech- nique, X-ray micro-computed tomography (micro-CT) has many advantages compared to other experimental techniques and has been successfully utilised to obtain the 3D microstructure of cement paste at a high resolution of 0.5 lm/voxel [7]. Many approaches have been proposed to develop the so-call micromechanical models by taking into account the underlying microstructure and mechanical properties of components of cement paste in recent years [8–20]. The important feature of the micromechanical models is that the material damage at the contin- uous level is introduced by the nucleation and evolution of micro- http://dx.doi.org/10.1016/j.conbuildmat.2014.06.017 0950-0618/Ó 2014 The Authors. Published by Elsevier Ltd. This is an open access article under the CC BY license (http://creativecommons.org/licenses/by/3.0/). ⇑ Corresponding author. Tel.: +44 161 306 3765. E-mail address: [email protected](A.P. Jivkov). Construction and Building Materials 66 (2014) 731–742 Contents lists available at ScienceDirect Construction and Building Materials journal homepage: www.elsevier.com/locate/conbuildmat
Transcript
Construction and Building Materials 66 (2014) 731–742
Microstructure-informed modelling of damage evolution in cementpaste
http://dx.doi.org/10.1016/j.conbuildmat.2014.06.0170950-0618/� 2014 The Authors. Published by Elsevier Ltd.This is an open access article under the CC BY license (http://creativecommons.org/licenses/by/3.0/).
Mingzhong Zhang, Andrey P. Jivkov ⇑Mechanics and Physics of Solids Research Team, School of Mechanical, Aerospace and Civil Engineering, The University of Manchester, Oxford Road, Manchester M13 9PL, UK
h i g h l i g h t s
�Macroscopic behaviour from microstructure features and meso-scale principles.� Derivation of microstructure features from high-resolution micro-CT images.� Construction of site-bond model with microstructure information.� Demonstration of agreement between calculated responses and experimental data.� Quantitative assessment of microstructure effects on macroscopic behaviour.
a r t i c l e i n f o
Article history:Received 27 January 2014Received in revised form 6 May 2014Accepted 12 June 2014
Cement paste is a binder for cementitious materials and plays a critical role in their engineering-scaleproperties. Understanding fracture processes in such materials requires knowledge of damage evolutionin cement paste. A site-bond model with elastic-brittle spring bundles is developed here for analysis ofthe mechanical behaviour of cement paste. It incorporates key microstructure information obtained fromhigh resolution micro-CT. Volume fraction and size distribution of anhydrous cement grains are used forcalculating model length scale and elasticity. Porosity and pore size distribution are used to allocate localfailure energies. Macroscopic damage emerges from the generation of micro-crack population repre-sented by bond removals. Effects of spatial distribution, porosity and sizes of pores on tensile strengthand damage are investigated quantitatively. Results show a good agreement with experiment data, dem-onstrating that the proposed technology can predict mechanical and fracture behaviour of cementitiousmaterials based exclusively on microstructure information.� 2014 The Authors. Published by Elsevier Ltd. This is an open access article under the CC BY license (http://
creativecommons.org/licenses/by/3.0/).
1. Introduction
Concrete is the most popular and widely used constructionmaterial in the world. The fracture behaviour of concrete has beena great concern for many years and remains a challenge due to con-crete’s complex and heterogeneous porous microstructure extend-ing over wide range of length scales from nanometres tomillimetres [1]. At meso-scale, concrete can be considered as athree-phase composite consisting of aggregate, matrix (i.e. cementpaste) and interfacial transition zone (ITZ) between aggregate andmatrix. ITZ is a ‘‘special’’ cement paste that has a higher initialwater-to-cement mass ratio (w/c) compared to matrix [2]. There-fore, to study the mechanical properties and failure of concrete,one must first understand the damage evolution and fracture pro-cess in cement paste, which depends on its microstructure.
In order to characterise the 3D microstructure of cement paste,a variety of techniques including computer-aided simulation andexperimental tests have been proposed and developed in the pastfew decades. Among them, computer-based cement hydrationmodels, e.g. CEMHYD3D [3], HYMOSTRUC3D [4,5] and the morerecently proposed lic (pronounced Mike) [6] are commonlyapplied to simulate the hydration process and gradual formationof the microstructure of cement paste. As a non-destructive tech-nique, X-ray micro-computed tomography (micro-CT) has manyadvantages compared to other experimental techniques and hasbeen successfully utilised to obtain the 3D microstructure ofcement paste at a high resolution of 0.5 lm/voxel [7].
Many approaches have been proposed to develop the so-callmicromechanical models by taking into account the underlyingmicrostructure and mechanical properties of components ofcement paste in recent years [8–20]. The important feature of themicromechanical models is that the material damage at the contin-uous level is introduced by the nucleation and evolution of micro-
732 M. Zhang, A.P. Jivkov / Construction and Building Materials 66 (2014) 731–742
cracks. Discrete lattice models that represent a material by a latticesystem of beam or spring elements are the most popular microme-chanical models and seem to offer promising modelling strategy toexplain fracture processes in cement paste [20]. Based on the sim-plest regular lattice with cubic cells, a lattice beam model has beenproposed by Schlangen and van Mier [8], and further developedand adopted by Qian [19] to simulate the fracture processes incementitious materials at different length scales. However, it hasbeen pointed out that this lattice is not physically realistic in termsof shape of the represented phases in cement paste and is unable toprovide a linear elastic response with an appropriate elastic mod-ulus and Poisson’s ratio [21]. Moreover, the obtained stress–straincurves of cement paste under uniaxial tests remain not realistic[14]. Man [15] developed two more complex 3D lattice beam mod-els based on face-centred cubic packing (fcc) and hexagonal closepacking (hcp) to investigate the fracture behaviour of concrete atmeso-scale. However, the effects of spatial and size distributionof pores were not taken into account.
To overcome such limitations a site-bond model using a bi-reg-ular lattice of truncated octahedral cells for elasticity has beenrecently proposed by Jivkov and Yates [21] and subsequently usedto simulate the micro-crack population and damage evolution inconcrete accounting for pore size distribution [20,22,23]. Themicrostructure of concrete was represented by truncated octahe-dral cells, which were regarded as the best choice for a regular rep-resentation of a solid. The interactions between unit cells weremodelled by structural beam elements. One problem of this modelis that the relationship between the global elasticity and local ele-ment properties cannot be established analytically. To deal withthis issue, the site-bond model for elasticity was reformulated byZhang et al. [24] by using elastic springs instead of beams to repre-sent the microscopic interactions between sites. The relationshipbetween spring constants and macroscopic elastic parameterswas analytically derived and validated.
The main purpose of this work is to develop the site-bond tech-nology to study the macroscopic behaviour and damage evolutionof cement paste considering its underlying microstructure attri-butes such as porosity, pore size distribution, volume fractionand particle size distribution of unhydrated cement. X-ray micro-CT along with image processing and analysis techniques is usedto capture the microstructure features of cement paste. A site-bondassembly with sites at centres of truncated octahedral cells andbonds connecting the neighbouring cells is applied to representthe microstructure of cement paste, where unhydrated cementparticles are placed on each site and pores of different sizes areassigned to bonds according to the measured microstructure fea-tures. The simulated microstructure of cement paste is then sub-jected to different loading conditions. The fracture process anddamage evolution are simulated by removing failed bonds. A seriesof statistical analyses is performed to quantitatively investigate theeffects of pore spatial distribution, porosity and pore size distribu-tion on macroscopic mechanical properties and damage evolution.The simulation results are compared with the available experimen-tal data.
Fig. 1. Micro-CT image of the 28 days old cement paste.
2. 3D microstructure of cement paste
This work is focused on pure Portland cement paste withoutany interfacial transition zone between aggregate and matrix.The microstructure evolution of cement paste due to cementhydration was investigated by using a non-destructive technique,X-ray micro-computed tomography, which is different from othertraditional experimental approaches, e.g. optical microscope andscanning electron microscope where sample preparations, suchas polishing and drying, may damage the microstructure. Based
on a series of image processing and analyses, pore size distributionand particle size distribution of anhydrous cement grains weremeasured. Details of the extraction techniques are given in the fol-lowing three sub-sections.
2.1. X-ray micro-computed tomography data
The specimen used here was prepared using ASTM type I Port-land cement. The w/c ratio of cement paste specimen is 0.5. Afterdrill mixing in a plastic beaker, small parts of the paste werepoured into the syringe and then injected into a micro circularplastic tube with an internal diameter of 250 lm. The micro plastictube filled with cement paste was sealed and cured under standardconditions until testing. The specimen was scanned at curing agesof 7 and 28 days using a high resolution Xradia MicroXCT-200 CTmachine at the Beckman Institute for Advanced Science and Tech-nology at University of Illinois at Urbana-Champaign (UIUC, USA),operating at 50 keV/10 W. The X-ray shadow projections of speci-men were digitized as 2000 � 2000 pixels with a resolution of0.5 lm and were processed to obtain reconstructed cross-sectionimages using the algebraic method implemented in the Xradiareconstruction software. This resulted in a 3D stack of virtual sec-tions, each consisting of 512 � 512 voxels with a linear X-rayattenuation coefficient, displayed as an 8-bit image with grey scalevalues from 0 (black) to 255 (white).
Fig. 1 shows the micro-CT image of a cylinder region with200 lm in diameter and 100 lm in thickness extracted from thereconstructed 3D image of the 28 days old cement paste. FromFig. 1 some characteristics of cement paste components can beseen. The darkest phases correspond to pores. The brightest phasesare anhydrous cement grains. Hydration products are shown asgrey.
2.2. Image segmentation
X-ray micro-CT images are composed of voxels, each of whichhas a unique grey scale value. Prior to morphometrical analysisof the micro-CT images, image segmentation was carried out toidentify different phases in hardened cement paste, i.e. pore,hydration product and anhydrous cement grain. A large numberof segmentation techniques are available in literature. The mostused one is to define a global threshold value based on the grey-level histogram [7]. Voxels that have grey scale values lower orhigher than the defined threshold value are considered as
M. Zhang, A.P. Jivkov / Construction and Building Materials 66 (2014) 731–742 733
background or object, respectively. In this study, this thresholdingmethod is selected for segmentation purposes. A detailed descrip-tion of this thresholding method for cement paste can be found in[7].
Fig. 2a illustrates a typical micro-CT slice of cement paste. Toavoid the possible edge effects, a cylindrical region of interest(ROI) with a diameter of 476 voxels and thickness of 200 voxelsis extracted from the centre of the slices where the cement pasteis considered to be the most homogeneous. The grey scale valueat the inflection point in the cumulative volume fraction curve ofROI is firstly defined as the threshold value (T1) to segment poresfrom solid phases, i.e. hydration products and anhydrous cementgrains. This gives rise to a binary image, where pores are shownas black and solid phases are shown as white, as seen in Fig. 2b.Subsequently, a threshold value (T2) corresponding to the transi-tion points between the two peaks, which are associated withhydration products and anhydrous cement, is determined to sepa-rate anhydrous cement grains from other phases. As a conse-quence, another binary image is obtained, as shown in Fig. 2c.Voxels with grey scale values lower than T1 is treated as pores.Voxels that have grey scale values higher than T2 are consideredto be anhydrous cement grains. The remaining voxels representshydration products. Thus, the microstructure of cement paste con-sisting of pores, hydration products and anhydrous cement grainscan be obtained. To illustrate the acquired microstructure, a cubicvolume of interest (VOI) of 100 � 100 � 100 lm3 is taken from thecentre of ROI. The 3D microstructure of VOI resulting from imagesegmentation is shown in Fig. 2d. It can be seen that the originalgrey scale image is converted into a ternary image of blue, grey
and dark red phases which devotes pores, hydration productsand anhydrous cement grains, respectively.
2.3. Microstructure features
After image segmentation, the 3D microstructure of cementpaste can be quantitatively characterised. In this study, attentionis focused on several microstructure features such as porosity, poresize distribution, volume fraction and size distribution of anhy-drous cement grains. To obtain these parameters, a series of imageanalyses is performed using the ‘‘Analyze particles’’ function ofImageJ, a public domain Java-based image processing program(National Institutes of Health, USA).
The binary image derived from image segmentation is replacedby a new 8-bit image including simple outlines of the measuredparticles by capturing the outlines of phases of interest, e.g., poresand anhydrous cement grains. Fig. 3a and b shows the obtainedimages containing outlines of pores and anhydrous cement grainscorresponding to binary images presented in Fig. 2b and c,respectively.
From this analysis, porosity and volume fraction of anhydrouscement grains are calculated as the ratios of the area inside theoutlines to the total area of ROI using area measurements fromthe binary images. The results of porosity and volume fraction ofanhydrous cement grains for cement paste specimens with curingages of 7 and 28 days are listed in Table 1. Both porosity and vol-ume fraction of unhydrated cement decrease gradually withincreasing curing age due to the progress of cement hydration.
(c) anhydrous cement grain; (d) 3D microstructure of volume of interest
Fig. 4. Pore size distribution of cement pastes with various curing ages.
Fig. 3. Outlines of the measured phases: (a) pore; (b) anhydrous cement grain.
Table 1Porosity and volume fraction of anhydrous cement grains of cement pastes at variouscuring ages.
Fig. 5. Particle size distribution of unhydrated cement of cement pastes withvarious curing ages.
734 M. Zhang, A.P. Jivkov / Construction and Building Materials 66 (2014) 731–742
The construction of the microstructure-informed site-bondmodel, Section 3, is based on a random allocation of features, unhy-drated cement particles and pores, with sizes belonging to theexperimentally measured distributions. Assuming spherical shapesfor pores and particles, the experimental sizes (radii) were calcu-lated from the measured areas of the corresponding segmentedfeatures, example in Fig. 3. The sizes of the features, ci, were usedto construct cumulative probability distributions with standardmedian ranking, where for n features with sizes ordered as c1 6 c2
6 . . . 6 cn, the cumulative probability for features with sizes lessthan ci is given by F(c < ci) = (i – 0.3)/(n + 0.4). Figs. 4 and 5 showthe obtained cumulative probability functions for pore and
unhydrated cement particle sizes of cement paste specimens atages of 7 and 28 days. It can be seen that both the sizes of largestpore and particle, and fractions of large pores and unhydratedcement particles all decrease with the increase of curing age. Forthe random allocation of pore and particle sizes to the model, agenerator of uniformly distributed random numbers 0 6 p < 1 isused. For a given p, the calculated size of a feature is c = F�1(p),which is performed by interpolation between experimental datapoints. The process ensures that the distribution of features sizesin the model comes from the same population as in theexperiment.
3. Site-bond model
3.1. Discrete representation of material volume
In the site-bond model [20–24], a material volume is repre-sented by an assembly of truncated octahedral cells, each of whichhas six square and eight regular hexagonal faces, as illustrated inFig. 6a. The centre of each unit cell is regarded as a site, which isconnected to its neighbouring sites by fourteen bonds. These bondsare classified into two groups: B1 consists of six bonds in principaldirections (normal to the square faces) and B2 comprises eightbonds in octahedral directions (normal to the hexagonal faces),as illustrated in Fig. 6b. In this work, the bonds are modelled withelastic-brittle normal and shear springs to represent the relative
Table 2Direction vectors of bonds of the site-bond assembly.
Bond B1 Bond B2
b nðbÞib nðbÞi
1 (1, 0, 0) 1 ð1=ffiffiffi3p
;�1=ffiffiffi3p
;�1=ffiffiffi3pÞ
2 (0, 1, 0) 2 ð1=ffiffiffi3p
;1=ffiffiffi3p
;�1=ffiffiffi3pÞ
3 (0, 0, 1) 3 ð1=ffiffiffi3p
;�1=ffiffiffi3p
;1=ffiffiffi3pÞ
4 (�1, 0, 0) 4 ð1=ffiffiffi3p
;1=ffiffiffi3p
;1=ffiffiffi3pÞ
5 (0, �1, 0) 5 ð�1=ffiffiffi3p
;1=ffiffiffi3p
;1=ffiffiffi3pÞ
6 (0, 0, �1) 6 ð�1=ffiffiffi3p
;�1=ffiffiffi3p
;1=ffiffiffi3pÞ
7 ð�1=ffiffiffi3p
;1=ffiffiffi3p
;�1=ffiffiffi3pÞ
8 ð�1=ffiffiffi3p
;�1=ffiffiffi3p
;�1=ffiffiffi3pÞ
site
(b) (c) (a)
Fig. 6. Cellular lattice: (a) site-bond assembly; (b) unit cell with bonds; (c) normal and shear springs.
M. Zhang, A.P. Jivkov / Construction and Building Materials 66 (2014) 731–742 735
deformations between two adjacent cells, as presented in Fig. 6c.This is sufficient for the loading cases used; the addition of angu-lar-type springs resisting twist and bending deformations is underdevelopment for applications to more general loading cases.
3.2. Spring elastic properties
The starting point for the derivation of the elastic spring con-stants is the equivalence of the strain energy stored in a unit cellof volume V between the discrete (Udisc) and the continuum system(Ucont),
Udisc ¼ Ucont ð1Þ
We use a linear homogeneous displacement field for derivingthe spring constants, i.e. the components of the displacement vec-tor are arbitrary linear functions of the coordinates. Non-linear dis-placement fields, introducing rotations and curvatures, wouldactivate the potential angular springs, which is outside the scopeof the present study. Under the assumed displacement field, thestrain energy in the continuum cell is given by.
Ucont ¼12
ZVredV ¼ 1
2CijkleijeklV ð2Þ
where C represents the stiffness tensor of the material, e is the strainfield. The strain energy stored in the discrete cell is
Udisc ¼14
X14
b¼1
kðbÞn uðbÞn uðbÞn þ kðbÞs uðbÞs uðbÞs
� �
¼ 14
X14
b¼1
ðLðbÞÞ2
kðbÞn nðbÞi eijnðbÞj nðbÞk ekln
ðbÞl
�
þ kðbÞs eklnðbÞl � nðbÞi eijn
ðbÞj nðbÞk
� �ekmnðbÞm � nðbÞn enmnðbÞm nðbÞk
� ��ð3Þ
where the superscript b represents the bth bond (spring), Nb is thetotal number of bonds, kðbÞn and kðbÞs denotes the constants of normaland shear springs, uðbÞn and uðbÞs stand for the corresponding relativedisplacements, L(b) is the length of bond b, nðbÞi is the direction vec-tor. Note that the factor is 1/4, because only half of the springlengths belong to the unit cell.
From Eqs. (1)–(3), the following relation is easily derived
Cijkl ¼1
2V
XNb
b
LðbÞ� �2
kðbÞs diknðbÞj nðbÞl þ kðbÞn � kðbÞs
� �nðbÞi nðbÞj nðbÞk nðbÞl
� �ð4Þ
where dik is the Kronecker’s delta.For the site-bond assembly shown in Fig. 6, if the spacing
between two adjacent sites in principal directions is denoted byL, bonds B1 and B2 have lengths of L and
ffiffiffi3p
L=2 , respectively.The volume of the unit cell V equals L3/2. The model length scale,L, is dictated by microstructure characteristics as described in Sec-tion 4. Each bond has one normal spring and two shear springs. Thetwo shear springs of one bond have the same stiffness coefficient.The spring constants are denoted by kp
n and kps , ko
n and kos for princi-
pal bonds B1 and octahedral bonds B2, respectively. The unit cellbond vectors nðbÞi are given in Table 2.
Substitution of these into Eq. (4) provides the following relationbetween the stiffness tensor components and the spring constants
C1111 ¼23L
3kpn þ ko
n þ 2kos
� �¼ C2222 ¼ C3333 ð5Þ
C1122 ¼23L
kon � ko
s
� �¼ C1133 ¼ C2233 ¼ C2211 ¼ C3311 ¼ C3322 ð6Þ
C1212 ¼23L
3kps þ ko
n þ 2kos
� �¼ C1313 ¼ C2323 ¼ C2121 ¼ C3131 ¼ C3232
ð7Þ
Other Cijkl ¼ 0 ð8Þ
With the Voigt notation, the spring constants are can beexpressed as
kpn ¼ �ko
n þL2
C11 þ 2C12ð Þ ð9Þ
kps ¼ �ko
n þL2
2C12 þ C44ð Þ ð10Þ
kos ¼ ko
n �3L2
C12 ð11Þ
Thus, the four normal and shear stiffness coefficients of thebonds are related to three constants, representing cubic elasticity.For cubic elasticity, the stiffness tensors can be given in terms ofthe bulk modulus K and two shear moduli G1 and G2 as follows
C11 ¼ K þ 43
G2 ð12Þ
C12 ¼ K � 23
G2 ð13Þ
C44 ¼ G1 ð14Þ
(a) (b)
Fig. 7. Constitutive model and failure criteria for springs: (a) normal springs; (b) shear springs.
736 M. Zhang, A.P. Jivkov / Construction and Building Materials 66 (2014) 731–742
Hence in the most general case the proposed spring-based site-bond model could represent materials with cubic elasticity withprescribed bulk and shear moduli. The system for determiningspring constants, however, is over-determined. Out of the infinitelymany possibilities to resolve the over-determinacy, we select thestiffness coefficient for shear springs of bonds B1, kp
s , to be zero,since the contribution of kp
s to macroscopic elasticity can be repre-sented in terms of ko
s , as seen in Eqs. (9)–(11). From this all mate-rials with cubic elasticity that can be represented by the model canbe derived. Our interest is in isotropic materials, for which the bulkand shear moduli are related to Young’s modulus E and Poisson’sratio v as: K ¼ E=ð3ð1� 2mÞÞ and G1 ¼ G2 ¼ G ¼ E=ð2ð1þ mÞÞ. Thusthe spring constants are determined as follows
kps ¼ 0; kp
n ¼EL
4ð1þ mÞð1� 2mÞ ;
kon ¼
ð1þ 2mÞEL4ð1þ mÞð1� 2mÞ ; ko
s ¼ð1� 4mÞEL
4ð1þ mÞð1� 2mÞ ð15Þ
The result shows that the proposed lattice can represent anyisotropic elastic material with Poisson’s ratio in the range�1=2 6 m 6 1=4, if all spring stiffness coefficients are required tobe non-negative. This is significant improvement over previousregular lattices, where only isotropic materials with zero Poisson’sratio could be represented in [8,19]. For materials with Poisson’sratio higher than 1/4, the negative shear spring constant requiredseem to be non-physical. However, it was found that the negativestiffness coefficient has a physical explanation at the molecularlevel [25]. Therefore, a negative ko
s in this scheme can be used tomodel a material with a Poisson’s ratio higher than 1/4 but lowerthan 1/2, which covers most of engineering materials.
To validate the derived spring constants, two benchmark testsincluding uniaxial tension and plane-strain tension were per-formed in a previous work [24]. It was shown that the simulatedmacroscopic Young’s modulus, Poisson’s ratio and shear modulusconverged to the theoretical values, i.e. the boundary effectsbecame negligible, when the size of cubic site-bond assemblywas larger than 15L � 15L � 15L. Hence, a model of cubic regionwith size of 20L � 20L � 20L will be used in the followingsimulations.
3.3. Spring elastic-brittle behaviour
The spring elastic-brittle behaviour is represented by linearelastic and linear softening branches separated by a damage initi-ation point. The elasticity is dictated by Eq. (16) for given macro-scopic elastic properties and microstructure-related length scale.The softening branch approximates the local post-initiation resis-tance of the matrix to failure. The adopted constitutive modelsfor normal and shear springs are illustrated in Fig. 7, where ut;max
and us;max represent the deformation of the normal and shearsprings at damage initiation with corresponding maximum normalFt;max and shear forces Fs;max; Wt;max and Ws;max represent the defor-mation of the normal and shear springs at failure (set to 2ut;max and2us;max, respectively); kn ¼ Ft;max=ut;max is the stiffness coefficient ofthe normal spring and ks ¼ Ft;max=ut;max is the stiffness coefficient ofthe shear spring. For normal springs, failure in compression is notallowed, which is achieved by setting the critical compressivedeformation as uc;max ¼ �10ut;max and the maximum compressiveforce as Fc;max ¼ �10Ft;max. With these settings, the spring behav-iour is fully controlled by prescribed local failure energy, Gf shadedin grey in Fig. 7.
The effect of cement porosity is introduced via the failure ener-gies of the springs. The bonds are assigned notional areas equal tothe areas of their corresponding faces in the cellular structure. Foreach bond of the model, the failure energy is calculated byGf ¼ 2cAe, where c denotes the surface energy of the materialand Ae is the effective area of the face, i.e. the difference betweenthe original face area (A0) and the cross-section area of poresassigned to the face (Ap) as described in Section 4. The failureenergy assigned to the normal and shear springs in a bond is pres-ently the same.
4. Modelling and simulation
In this study, a material volume of size 20L � 20L � 20L is used.The corresponding cellular structure contains 17,261 cells; thesite-bond model has the same number of sites and 113,260 bonds.The microstructure of cement paste is modelled as a three-phasecomposite structure consisting of anhydrous cement grains, hydra-tion products and pores. Anhydrous cement grains are located atthe centres of all cells. Other places in cells are occupied by hydra-tion products, in which pores with sizes ranging from zero to themaximum pore size are involved and reside notionally at the inter-faces between cells. The anhydrous cement grains and the hydra-tion products provide a combined elastic response. Theproperties of hydration product are averaged over all types ofhydrates, including calcium silicate hydrates (C–S–H), portlandite(CH) and ettringite (AFt) of different mass densities. The macro-scopic elastic parameters, Young’s modulus E and Poisson’s ratiov, and the surface energy c are taken from literature. These are gen-erally obtained from nano-indentation tests and X-ray photoelec-tron spectroscopy measurements, respectively. The values usedin our simulations are given in Table 3 with the correspondingreferences.
4.1. Microstructure incorporation
The microstructure information obtained experimentally isintroduced into the site-bond model in two steps:
Table 3Macroscopic elastic constants and surface energy of different phases.
M. Zhang, A.P. Jivkov / Construction and Building Materials 66 (2014) 731–742 737
Step I: The volume fraction and particle size distribution ofanhydrous cement grains measured from X-ray micro-CT scans(Fig. 5 and Table 1) are used for calculating the model length scale,L. Anhydrous cement grains of different sizes are assigned ran-domly to all sites of the cellular structure according to the experi-mental particle size distribution. A generator of uniformlydistributed random numbers 0 6 r < 1 is used to assign grainswith different sizes to individual sites. For each site, a randomnumber r is generated and the assigned grain size is derived asRi ¼ F�1ðrÞ, where F(Ri) is the cumulative probability of grain sizespresented in Fig. 5. A comparison of simulated and experimentalparticle size distributions is shown in Fig. 8. This process ensuresthat the simulated grain size distribution of anhydrous cement fitsthe measured size distribution from X-ray micro-CT scans verywell. In terms of shape, anhydrous cement grains are assumed tobe spherical. As a result, each cell has one spherical anhydrouscement grain with size of Ri.
The cell size is calculated from the volume fraction of anhy-drous cement grains, /a, and the volume of the cellular structurewith N cells via /aNL3=2 ¼
Pi4pR3
i =3. The stiffness coefficients ofnormal and shear springs in each bond are calculated from thegiven macroscopic Young’s modulus E, Poisson’s ratio v and thedetermined cell size L using Eq. (15).
Step II: The porosity and pore size distribution measured fromX-ray micro-CT scans (Fig. 4 and Table 1) are used for calculatingthe bond failure energies. Pores are assigned randomly to thebonds using the same method described in Step I. Notionally, theassignment is to the faces of the cellular structure, but the processdoes not constrain the pore positions; these could be anywhere inthe region belonging to a bond. The assignment continues until theprescribed porosity in the modelled material volume is reached.The critical failure energy of bonds is calculated from the pre-scribed surface energy and the intact area associated with the bondvia Gf ¼ 2cAe, as explained in Section 3.3. Thus, all bonds of giventype have the same elastic spring constants but different criticalfailure energy due to the different pore sizes assigned. Due to theexistence of pores with different sizes in bonds, the critical failureenergy of each bond varies from the maximum failure energy 2cA0
Fig. 8. Comparison between the simulated and experimental particle size distri-butions of 28 days old cement paste.
for pore size of zero to zero for pore area close to the intact area ofthe face, e.g. square face or hexagonal face. If the pore area in abond is equal to or larger than the corresponding face area, thisbond is removed before loading.
4.2. Boundary conditions
Two loading cases, uniaxial tension and plane strain, are consid-ered in this work. The former is used to compare predictions forstress–strain behaviour to available experimental data. The latteris used to demonstrate expected behaviour of the material aheadof a macroscopic crack, where plain strain conditions prevail. Theloads are applied via prescribed displacements to the boundarysites of the site-bond model. Considering a coordinate system(X1, X2, X3), the displacements and reaction forces of sites on theboundaries are referred to as (u1, u2, u3) and (F1, F2, F3), respec-tively. For uniaxial tension, the sites on X1 = 0, X2 = 0 and X3 = 0are fixed in the X1-, X2- and X3-directions, respectively. A displace-ment of u1 = L which corresponds to a strain of e = L/20L = 0.05 isimposed at X1 = 20L. Other sites are free. For plane strain, the siteson X1 = 0, X2 = 0, X3 = 0 and X3 = 20L are fixed in the X1-, X2- and X3-directions, respectively. Constant displacements of u1 = L and u2 = Lare applied at X1 = 20L and X2 = 20L, respectively.
4.3. Numerical simulations and macroscopic damage measures
The simulations of damage evolution are performed by using anin-house code in association with Abaqus. The in-house code isused to control the failure of bonds. Abaqus is used as a solver toget repetitive solutions for equilibrium. At each load step, the in-house code obtains the forces, deformations and calculates bondenergies. The bond fails when its energy reaches the assigned fail-ure energy, mimicking the creation of a micro-crack along theinterface between the two cells joined by the bond. Upon failurethe bond is removed from the site-bond assembly. After thisupdate the assembly is solved by Abaqus for equilibrium. Thisresults in a redistribution of forces in the structure and consecutivefailures of bonds. The simulation is continued until all bonds fail orthe prescribed strain is met. The macroscopic damage is thusemerging from the generation and evolution of micro-crackpopulation.
The macroscopic stresses at each load step are calculated bydividing the corresponding total reaction forces by the boundaryarea. To quantitatively describe the damage evolution, some scalardamage parameters are required. The standard damage variable, DE
is defined as the relative change in Young’s modulus as follows
DE ¼ 1� Ei
E0ð16Þ
where E0 denotes the initial (undamaged) elastic modulus, and Ei
stands for the current (damaged) modulus. In the beginning, DE isequal to zero when the bonds are intact and finally turn into onewhen all of the bonds fail. To capture possible development of dam-age-induced anisotropy, four additional damage variables are intro-duced measuring relative changes in bulk and shear moduli
DK ¼ 1� Ki
K0¼ ðrh=evÞiðrh=evÞ0
ð17Þ
DG¼1� Gi
G0¼ ðsj=ejÞiðsj=ejÞ0
sj¼rj�rh; ej¼ ej�ev ðj¼1;2;3Þ
ð18Þwhere rh and ev represent the hydrostatic stress and volumetricstrain, respectively, Sj and ej are the deviatoric stress and strain,respectively.
738 M. Zhang, A.P. Jivkov / Construction and Building Materials 66 (2014) 731–742
5. Results and discussion
5.1. Damage evolution under uniaxial tension
Fig. 9 shows the simulated stress–strain curve of a generatedcement paste specimen at 28 days of curing under uniaxial tensionusing the aforementioned modelling procedure. On a single 64-bitPC (Processor: 2.0 GHz, RAM memory: 32 GB), the simulation timefor this case is about 3 h. As seen in Fig. 9, the initial elastic part isperfectly linear followed by a ‘‘graceful’’ non-linear response priorto the peak point. From this curve, some important parameterssuch as global elastic modulus, tensile strength, strain at peakpoint and fracture energy of cement paste can be obtained, whichcan be used as input to estimate the mechanical properties andfracture process of cementitious materials at a coarser length scale,e.g. mortar and concrete. The elastic modulus is the slope of thestress–strain curve at the linear elastic stage. The tensile strengthand peak strain correspond to tensile stress and strain at peakpoint, respectively. The fracture energy can be determined by inte-grating the area below the stress–strain curve. The fracture energyis a primary parameter for continuum-based fracture models, e.g.cohesive zone model. In this work, attention is placed on the ten-sile strength and damage evolution.
Fig. 10 shows the development of the damage variables, i.e. DE,DK and DG, defined in Section 4.3 with the applied strain. It can beseen that the damage parameter DE based on the relative reductionof the Young’s modulus is equal to the damage parameters DK and
Fig. 9. Simulated stress–strain curve of 28 days old cement paste under uniaxialtension.
Fig. 10. Damage evolution in 28 days old cement paste under uniaxial tension.
DG based on the relative changes of the hydrostatic stress and thethree components of the deviatoric stress. This indicates that thesimulated cement paste specimen maintains macroscopic isotropyduring damage evolution under uniaxial tensile loading. When thedeformation is small, the damage variables remain close to zerowith few isolated local failures. With the increase of deformation,the growing population of micro-cracks drives the increase of themacroscopic damage. The initially slow damage growth is stillassociated with isolated local failures. This regime is followed bya more rapid increase of damage after approximately 1 � 10�4
applied strain, associated with micro-crack coalescences. The fail-ure of the specimen occurs at approximately 8% damage, whichis a result of an ‘‘avalanche’’-like, i.e. nearly instantaneous, failureof a set of bonds critical for the specimen integrity.
Comparison between Figs. 9 and 10 suggests that the isolatedfailures have negligible effect on the non-linear stress–strainresponse and observable non-linearity occurs with micro-crackgrowth via coalescence. The avalanche-failure characterises thepeak in the stress–strain response. It should be noted that thepost-peak softening response, sometimes demonstrated by authorswith different modelling approaches, was not achieved under ten-sile loading with the proposed simulation methodology as it wouldrequire computationally expensive short increments to separatefailing bonds close to specimen failure. This was outside the pur-pose of the work.
5.2. Damage evolution under plane strain
Fig. 11 shows the predicted stress–strain response of cementpaste at 28 days of curing under plane strain. Non-linearity ishardly observed and the specimen fails in an almost perfectly brit-tle manner. The difference from uniaxial tension can be explainedwith the fact that in the case of plane strain each bond in the site-bond assembly is subjected to a higher combined action of trans-verse tension stress and shear stress at a same load step comparedto that under uniaxial tension, and the bonds are broken more rap-idly and suddenly. As a result, both the tensile strength and strainat peak point of the specimen are lower, as shown in Fig. 11.
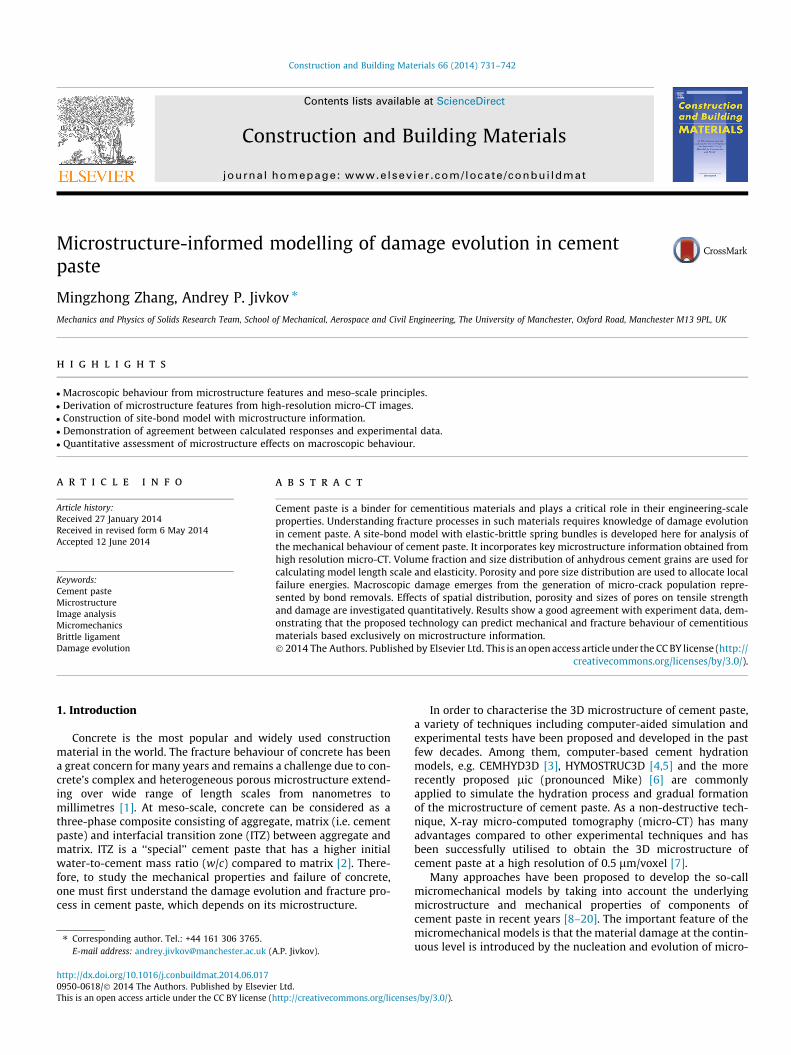
The corresponding evolution of damage parameters is illus-trated in Fig. 12. The damage parameters DG1, DG2 and DG3 denotethe relative changes of the longitudinal shear moduli in X1-, X2-and X3- directions, respectively. It can be seen that the values ofthe damage parameters are low at the failure point, which deter-mines the glass-like mechanical response. This results from anearly avalanche-like failure of bonds and implies more brittle char-acteristic of cement paste under plane strain. In addition, the
Fig. 11. Simulated stress–strain curve of 28 days old cement paste under planestrain.
Fig. 12. Damage evolution in 28 days old cement paste under plane strain.Fig. 13. Relationship between tensile strength and porosity of cement paste.
M. Zhang, A.P. Jivkov / Construction and Building Materials 66 (2014) 731–742 739
development of damage in different directions is different, whichillustrates that under plane strain the generated micro-crack pop-ulation yields damage-induced anisotropy in the cement pastespecimen. The directional dependence of damage evolution inthe specimen can be explained by the fact that the generatedmicrostructure of cement paste specimen is heterogeneous dueto the different assigned pore sizes on different bonds. Furtherinsight into this aspect is obtained by statistical analyses as pre-sented in the following sections.
5.3. Influence of pore spatial distribution
Pores are considered as initial defects before mechanical load-ing. To investigate the influence of random distribution of poresin location on mechanical properties and damage evolution, a setof 40 cement paste samples with curing age of 28 days are gener-ated. The measured porosity and volume fraction of anhydrouscement grains are 12.58% and 8.65%, respectively. The pore sizedistribution and particle size distribution of unhydrated cementare shown in Figs. 4 and 5. These parameters are fixed for samplegeneration. Because the spatial distribution of pores in the systemis random, the corresponding simulated microstructures of cementpaste represented by the site-bond assembly are different. Thesesamples are then subjected to uniaxial tensile loading and the ten-sile strength is obtained.
Here, the statistical parameters such as mean value, standarddeviation and coefficient of variation of tensile strength for allthe 40 cement paste samples are calculated from the simulatedresults. An average tensile strength of 6.96 MPa is found for28 days old cement paste with w/c of 0.5 (porosity is 12.58%). Thisis consistent with the experimental results reported by Robler andOdler [28], who measured the tensile strength of cement pastespecimens at different curing ages with various w/c ratios. It waspresented that the tensile strength of 28 days old specimens withw/c ratios of 0.47 and 0.52 is 9 MPa and 6 MPa, respectively, thecorresponding porosities of which are 11.1% and 13.3% [28]. Thecoefficient of variation in tensile strength is approximately 5%,which indicates that the random spatial distribution of initialdefects (pores) in the specimen has a negligible effect on themechanical properties of cement paste and damage evolution.
5.4. Influence of porosity
To study the influence of initial defects amount on mechanicalproperties and damage evolution in a quantitative manner, a seriesof 7 days old cement paste samples with identical volume densityand particle size distribution of unhydrated cement, and pore size
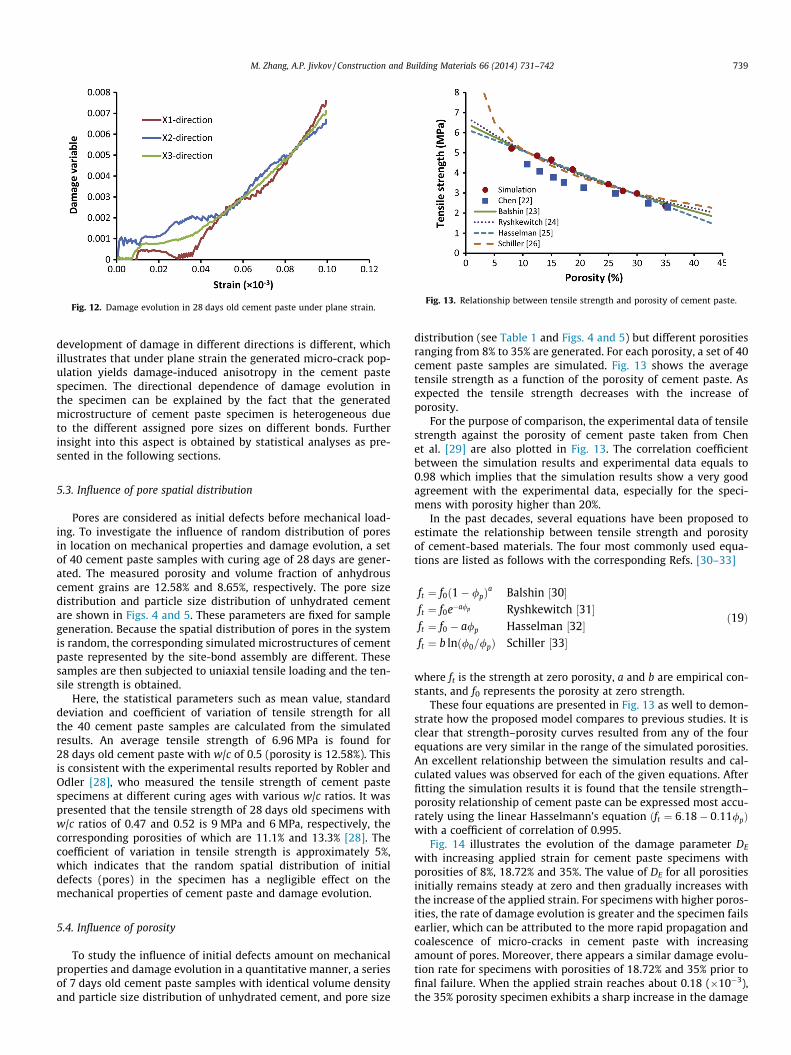
distribution (see Table 1 and Figs. 4 and 5) but different porositiesranging from 8% to 35% are generated. For each porosity, a set of 40cement paste samples are simulated. Fig. 13 shows the averagetensile strength as a function of the porosity of cement paste. Asexpected the tensile strength decreases with the increase ofporosity.
For the purpose of comparison, the experimental data of tensilestrength against the porosity of cement paste taken from Chenet al. [29] are also plotted in Fig. 13. The correlation coefficientbetween the simulation results and experimental data equals to0.98 which implies that the simulation results show a very goodagreement with the experimental data, especially for the speci-mens with porosity higher than 20%.
In the past decades, several equations have been proposed toestimate the relationship between tensile strength and porosityof cement-based materials. The four most commonly used equa-tions are listed as follows with the corresponding Refs. [30–33]
ft ¼ f0ð1� /pÞa Balshin ½30�
ft ¼ f0e�a/p Ryshkewitch ½31�ft ¼ f0 � a/p Hasselman ½32�ft ¼ b lnð/0=/pÞ Schiller ½33�
ð19Þ
where ft is the strength at zero porosity, a and b are empirical con-stants, and f0 represents the porosity at zero strength.
These four equations are presented in Fig. 13 as well to demon-strate how the proposed model compares to previous studies. It isclear that strength–porosity curves resulted from any of the fourequations are very similar in the range of the simulated porosities.An excellent relationship between the simulation results and cal-culated values was observed for each of the given equations. Afterfitting the simulation results it is found that the tensile strength–porosity relationship of cement paste can be expressed most accu-rately using the linear Hasselmann’s equation ðft ¼ 6:18� 0:11/pÞwith a coefficient of correlation of 0.995.
Fig. 14 illustrates the evolution of the damage parameter DE
with increasing applied strain for cement paste specimens withporosities of 8%, 18.72% and 35%. The value of DE for all porositiesinitially remains steady at zero and then gradually increases withthe increase of the applied strain. For specimens with higher poros-ities, the rate of damage evolution is greater and the specimen failsearlier, which can be attributed to the more rapid propagation andcoalescence of micro-cracks in cement paste with increasingamount of pores. Moreover, there appears a similar damage evolu-tion rate for specimens with porosities of 18.72% and 35% prior tofinal failure. When the applied strain reaches about 0.18 (�10�3),the 35% porosity specimen exhibits a sharp increase in the damage
Fig. 14. Damage evolution in cement paste specimens with various porosities. Fig. 16. Damage evolution in cement paste specimens with curing ages of 7 and28 days.
740 M. Zhang, A.P. Jivkov / Construction and Building Materials 66 (2014) 731–742
evolution rate. This corresponds to the sudden simultaneous rup-ture of bonds in the system.
5.5. Influence of pore size distribution
Besides the random arrangement and amount of pores, otherfactors affecting potentially the mechanical behaviour the develop-ment of damage in cement paste are pore size distribution, volumedensity and particle size distribution of unhydrated cement. Thisinformation can be extracted from cement paste specimens withdifferent curing ages. To estimate the effects of such factors, simu-lations are carried out on the specimens with curing ages of 7 and28 days. It is found that the calculated cell size L according to themethod presented in Section 4 for these two specimens is verysimilar, approximately 20 lm, although their volume density andparticle size distribution of unhydrated cement particles are differ-ent. It should be noted that this outcome is specific to the experi-mental data used, where the changes in particle size distributionand volume density lead to a combined negligible effect on themodel length scale. The outcome could be different for differentcement types.
Fig. 15 shows the simulated stress–strain curves for specimensunder uniaxial tensile loading. For the 7 days old specimen, verylittle non-linearity is observed and it tends to fail suddenly andin a strictly brittle manner compared to the 28-day old specimen.The corresponding development of DE is presented in Fig. 16. Thedamage evolution in two specimens follows a very similar path.
Fig. 15. Simulated stress–strain curve of 7 days and 28 days old cement pastesunder uniaxial tension.
However, the value of DE prior to failure for 7-day old specimenis much lower than that for 28-day old specimen. This result canbe explained by the fact that the 7-day specimen has a higherporosity than the 28-day old specimen and more large pores areassigned to bonds. Hence, more bonds in the system have lowercritical failure energies and tend to fail more quickly. As a conse-quence, the 7-day specimen exhibits a more brittle response than28-day old specimen under uniaxial tension.
The main difference between the generated site-bond assem-blies for these specimens is the random distribution of pores inspace, porosity and pore size distribution in the system. The effectsof the first two factors have been discussed above. Therefore, thissection is focused on the influence of pore size distribution. As pre-sented in Section 5.3, the average tensile strength of 28-day oldcement paste is 6.96 MPa, the porosity of which is 12.58%. For com-parison, the porosity of 7-day old cement paste is set to 12.58% aswell. According to the derived linear relation between tensilestrength and porosity, the strength of the 7-day old cement pasteshould be the same as for the 28-day old cement. However, thesimulations provided a tensile stress of the 7-day old cement pasteof 6.17 MPa, which is 11.4% lower than the tensile strength of 28-day old cement paste. This difference is entirely attributed to thedifferent pore size distribution in these two specimens. This resultsuggests that the linear porosity tensile strength relation is validonly for media with identical distribution of pore sizes. More gen-eral relation between porosity, pore size distribution and tensilestrength (as well as fracture energy) is subject of ongoing work.
Some quantitative assessment of the observed behaviour isoffered with Fig. 17, which shows the probability density of pore
Fig. 17. Probability density of pore sizes in specimens with curing ages of 7 and28 days.
M. Zhang, A.P. Jivkov / Construction and Building Materials 66 (2014) 731–742 741
sizes in specimens with curing ages of 7 and 28 days. It is clear thatthe volume fraction of large pores in the 7-day old specimen ismuch higher than that in the 28-day old specimen. Moreover,the largest pore size in the 7-day old specimen is about 20 lm,which is greater than the maximum pore size of 13 lm in the28-day old specimen. The largest pore size is frequently of interestin investigation of fracture behaviour of cementitious materials.Here, specimens with the same overall porosity but different poresize distribution have different tensile strengths demonstrates thatthe size and volume fracture of large pores play a critical role inoverall rupture strength. This agrees very well with the basic frac-ture theory suggesting that the largest flaw should determine thefracture strength.
5.6. General discussion
In this work, cement paste was considered as a three-phasecomposite, consisting of anhydrous cement grains, hydration prod-ucts and pores. The changes in the microstructure of cement pastewere reflected solely by the changes of volume fractions, size andspatial distribution of each phase from tomography data at variouscuring ages. Although progress is continuously made in X-ray CTtechnique, it is still a big challenge to identify different hydratesin hydration product, such as high-/low-density calcium silicatehydrates (C–S–H), portlandite (CH) and ettringite (AFt). It is evena bigger challenge to obtain the mechanical properties of differentphases required for our modelling approach. Therefore, in thisstudy, the hydration product is assumed to be a composite of thesehydrates with constant mechanical properties, as described in Sec-tion 4. Clearly, the chemical changes occurring during hydrationaffect the mechanical properties of the constituents. The incorpora-tion of such time-dependent changes is a subject of ongoing workon advancing the proposed model.
6. Conclusions
A strategy for linking key microstructure characteristics ofcement paste to its macroscopic behaviour is proposed as a devel-opment of the site-bond model. The strategy considers the paste asa three-phase medium and incorporates: (1) the volume fractionand size distribution of anhydrous cement particles as length-scaledetermining features; and (2) the porosity and pore size distribu-tion as failure determining features. Basic material properties arerequired to accomplish the model: (1) engineering-scale elasticconstants for calibration of local elasticity; and (2) atomic scalesurface energy for definition of local failure. The result is thus atechnology for predicting macroscopic properties from meso-scaleprinciples. The following conclusions can be drawn from the find-ings presented:
� Damage development in cement paste, consequently theobserved stress–strain response and fracture energy, dependsstrongly on the loading mode – this has important implicationsfor the use of experimentally derived constitutive behaviours ine.g. integrity assessment of structures with existing macro-scopic defects.� Uniaxial tension generates distribution of local failures that
maintains the material response isotropic. More complex load-ing conditions result in damage-induced anisotropic responsewith apparent embrittlement under equal other conditions.� Porosity affects strongly the mechanical properties and damage
evolution. Higher porosity yields more brittle response underequal other conditions. Tensile strength–porosity relation ofcement paste can be expressed using the linear Hasselmann’sequation and is in a good agreement with experimental results.
� Pore size distribution has an additional effect on the damageevolution and macroscopic behaviour. Larger fractions of largepores yield more brittle response. This result is consistent withbasic fracture theory.
The work provides new insights into the failure behaviour ofcement paste. The proposed technology can be used for the predic-tion of changes in mechanical properties and toughness withcement aging, so far as the changes in the microstructure areknown. The site-bond modelling strategy can be extended to inves-tigate the fracture processes and damage evolution in mortar andconcrete, as well as in a large class of other quasi-brittle materials.Further, the strategy allows for the incorporation of time-depen-dent effects in cement-based materials. These opportunities aresubject of ongoing works.
Acknowledgments
The authors acknowledge the support from EPSRC via Grant EP/J019763/1, ‘‘QUBE: Quasi-Brittle fracture: a 3D experimentally-val-idated approach’’, and from BNFL for the Research Centre for Rad-waste & Decommissioning. The authors also express their gratitudeto Dr. Y. He (Wuhan University of Technology, China) for sharing X-ray micro-CT image data used in this work.
References
[1] Haecker CJ, Garboczi EJ, Bullard JW, Bohn RB, Sun Z, Shah SP, et al. Modelingthe linear elastic properties of Portland cement paste. Cem Concr Res2005;35:1948–60.
[2] Zhang M, Ye G, van Breugel K. Multiscale lattice Boltzmann-finite elementmodelling of chloride diffusivity in cementitious materials. Part I: Algorithmand implementation. Mech Res Commun http://dx.doi.org/10.1016/j.mechrescom.2013.09.002.
[3] Bentz DP. Modelling cement microstructure: pixels, particles and propertyprediction. Mater Struct 1998;32:189–95.
[4] van Breugel K. Simulation of hydration and formation of structure in hardeningcement-based materials. PhD Thesis, Delft University and Technology, Delft,The Netherlands; 1991.
[5] Ye G. Experimental study and numerical simulation of the development of themicrostructure and permeability of cementitious materials. PhD Thesis, DelftUniversity and Technology, Delft, The Netherlands; 2003.
[6] Bishnoi S, Scrivener KL. Mic: a new platform for modeling the hydration ofcements. Cem Concr Res 2009;39:266–74.
[7] Zhang M, He Y, Ye G, Lange DA, van Breugel K. Computational investigation onmass diffusivity in Portland cement paste based on X-ray computedmicrotomography (lCT) image. Constr Build Mater 2012;27:472–81.
[8] Schlangen E, van Mier JGM. Experimental and numerical analysis ofmicromechanism of fracture of cement based composite. Cem Concr Compos1992;14(2):105–18.
[9] Bolander JE, Choi S, Duddukuri SR. Fracture of fiber-reinforced cementcomposites: effects of fiber dispersion. Inter J Fracture 2008;154(1):73–86.
[10] Chang CS, Wang TK, Sluys LJ, van Mier JGM. Fracture modelling using a micro-structural mechanics approach – I. Theory and formulation. Eng Fract Mech2002;69:1941–58.
[11] Lilliu G, van Mier JGM. 3D lattice type fracture model for concrete. Eng FractMech 2003;70:927–41.
[12] Šmilauer V, Bittnar Z. Microstructure-based micromechanical prediction ofelastic properties in hydrating cement paste. Cem Concr Res2006;36:1708–18.
[13] Yip M, Li Z, Liao B, Bolander JE. Irregular lattice models of fracture ofmultiphase particulate materials. Int J Fracture 2006;140:113–24.
[14] Bernard F, Kamali-Bernard S, Prince W. 3D multi-scale modelling ofmechanical behaviour of sound and leached mortar. Cem Concr Res2008;38:449–58.
[15] Man H. Analysis of 3D scale and size effects in numerical concrete. PhD Thesis,ETH Zürich, Switzerland; 2010.
[16] Grassl P, Jirasek M. Meso-scale approach to modelling the fracture processzone of concrete subjected to uniaxial tension. Int J Solids Struct2010;47:957–68.
[17] Zheng J, Zhou X, Shao L, Jin X. Simple three-step analytical scheme forprediction of elastic moduli of hardened cement paste. J Mater Civil Eng2010;22(1):1191–4.
[18] Pichler B, Hellmich C. Upscaling quasi-brittle strength of cement paste andmortar: a multi-scale engineering mechanics model. Cem Concr Res2011;41:467–76.
[19] Qian Z. Multiscale modeling of fracture processes in cementitious materials.PhD Thesis, Delft University and Technology, Delft, The Netherlands; 2012.
742 M. Zhang, A.P. Jivkov / Construction and Building Materials 66 (2014) 731–742
[20] Jivkov AP, Engelberg DL, Stein R, Petkovski M. Pore space and brittle damageevolution in concrete. Eng Fract Mech 2013;110:378–95.
[21] Jivkov AP, Yates JR. Elastic behaviour of a regular lattice for meso-scalemodelling of solids. Int J Solids Struct 2012;79:3089–99.
[22] Jivkov AP, Gunther M, Travis KP. Site-bond modelling of porous quasi-brittlemedia. Mineral Mag 2012;76:2969–74.
[23] Jivkov AP. Structure of micro-crack population and damage evolution in quasi-brittle media. Theor Appl Fract Mech 2014; http://dx.doi.org/10.1016/j.tafmec.2014.04.003, [in press].
[24] Zhang M, Morrison CN, Jivkov AP. A meso-scale site-bond model for elasticity:theory and calibration. Mater Res Innov 2014;18(S2):982–6.
[25] Zhao S, Zhao G. Implementation of a high order lattice spring model forelasticity. Int J Solids Struct 2012;49:2568–81.
[26] Bernard O, Ulm FJ, Lemarchand E. A multiscale micromechanics-hydrationmodel for the early-age elastic properties of cement-based materials. CemConcr Res 2003;33:1293–309.
[27] Djouani F, Chehimi MM, Benzarti K. Interactions of fully formulated epoxywith model cement hydrates. J Adhes Sci Technol 2013;27(5–6):469–89.
[28] Röbler M, Odler I. Investigations on the relationship between porosity,structure and strength of hydrated Portland cement pastes I. Effect ofporosity. Cem Concr Res 1985;15:320–30.
[29] Chen X, Wu S, Zhou J. Influence of porosity on compressive and tensilestrength of cement mortar. Constr Build Mater 2013;40:869–74.
[30] Balshin MY. Relation of mechanical properties of powder metals and theirporosity and the ultimate properties of porous-metal ceramic materials. DoklAskd Nauk SSSR 1949;67(67):831–4.
[31] Ryshkevitch R. Compression strength of porous sintered alumina and zirconia.J Am Ceram Soc 1953;36:65–8.
[32] Hasselman DPH. Griffith flaws and the effect of porosity on tensile strength ofbrittle ceramics. J Am Ceram Soc 1969;52:457.
[33] Schiller KK. Strength of porous materials. Cem. Concr. Res. 1971;1:419–22.