1 STAR JPSS Annual Science Team Meeting, 27-30 August 2018 MICROWAVE INTEGRATED RETRIEVAL SYSTEM (MIRS): Hydrological Products and Applications Chris Grassotti CICS-MD and NOAA/NESDIS/STAR MiRS Team: S. Liu, R. Honeyager, Y-K. Lee, Q. Liu Help from: G. Chirokova, P. Meyers, H. Meng [email protected]29 August 2018
Transcript
1STAR JPSS Annual Science Team Meeting, 27-30 August 2018
2STAR JPSS Annual Science Team Meeting, 27-30 August 2018
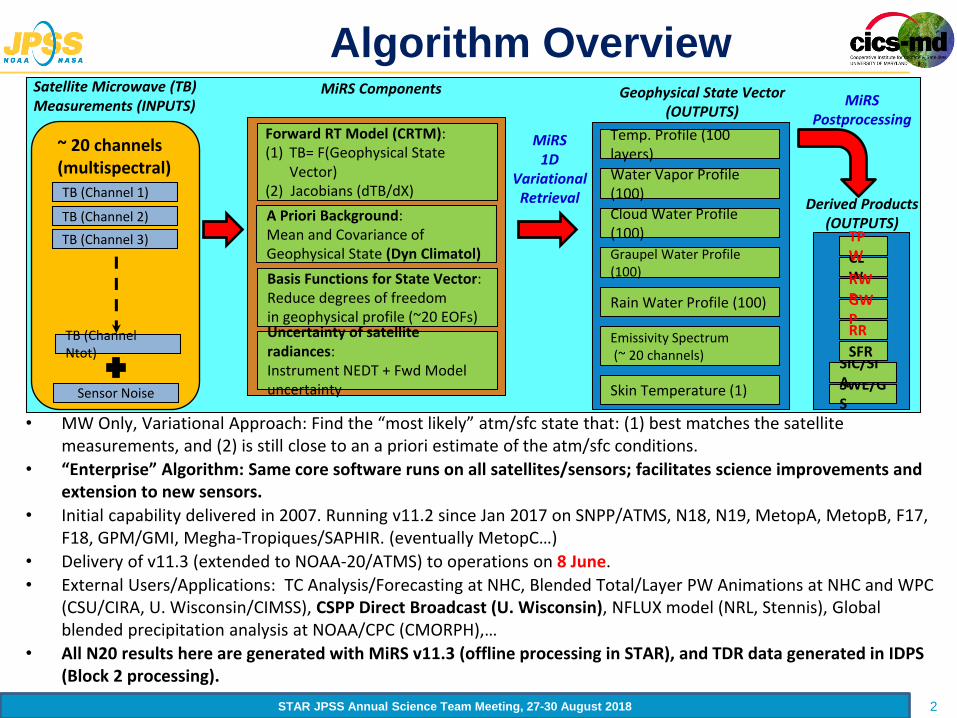
Algorithm Overview
~ 20 channels (multispectral)
Temp. Profile (100 layers)
Water Vapor Profile (100)
Emissivity Spectrum(~ 20 channels)
Skin Temperature (1)
Cloud Water Profile (100)
Graupel Water Profile (100)
Rain Water Profile (100)
Satellite Microwave (TB) Measurements (INPUTS)
Geophysical State Vector (OUTPUTS)
TB (Channel 1)
TB (Channel 2)
TB (Channel 3)
TB (Channel Ntot)
MiRS Components
Forward RT Model (CRTM):(1) TB= F(Geophysical State
Vector)(2) Jacobians (dTB/dX)
A Priori Background:Mean and Covariance ofGeophysical State (Dyn Climatol)
Basis Functions for State Vector:Reduce degrees of freedomin geophysical profile (~20 EOFs)Uncertainty of satellite radiances:Instrument NEDT + Fwd Model uncertaintySensor Noise
MiRS1D
Variational Retrieval
MiRSPostprocessing
RR
CLWRWPGWP
TPW
SWE/GS
SIC/SIA
SFR
Derived Products(OUTPUTS)
• MW Only, Variational Approach: Find the “most likely” atm/sfc state that: (1) best matches the satellite measurements, and (2) is still close to an a priori estimate of the atm/sfc conditions.
• “Enterprise” Algorithm: Same core software runs on all satellites/sensors; facilitates science improvements and extension to new sensors.
• Initial capability delivered in 2007. Running v11.2 since Jan 2017 on SNPP/ATMS, N18, N19, MetopA, MetopB, F17, F18, GPM/GMI, Megha-Tropiques/SAPHIR. (eventually MetopC…)
• Delivery of v11.3 (extended to NOAA-20/ATMS) to operations on 8 June.
• External Users/Applications: TC Analysis/Forecasting at NHC, Blended Total/Layer PW Animations at NHC and WPC (CSU/CIRA, U. Wisconsin/CIMSS), CSPP Direct Broadcast (U. Wisconsin), NFLUX model (NRL, Stennis), Global blended precipitation analysis at NOAA/CPC (CMORPH),…
• All N20 results here are generated with MiRS v11.3 (offline processing in STAR), and TDR data generated in IDPS (Block 2 processing).
3STAR JPSS Annual Science Team Meeting, 27-30 August 2018
Examples of MiRS Products with Hydrology
Applications
Rain Rate (mm/h) TPW (mm)
SWE (cm) Snowfall Rate (mm/h)
Plus Application Developer Products: Blended TPW and Layer PW, TC Intensity,…
4STAR JPSS Annual Science Team Meeting, 27-30 August 2018
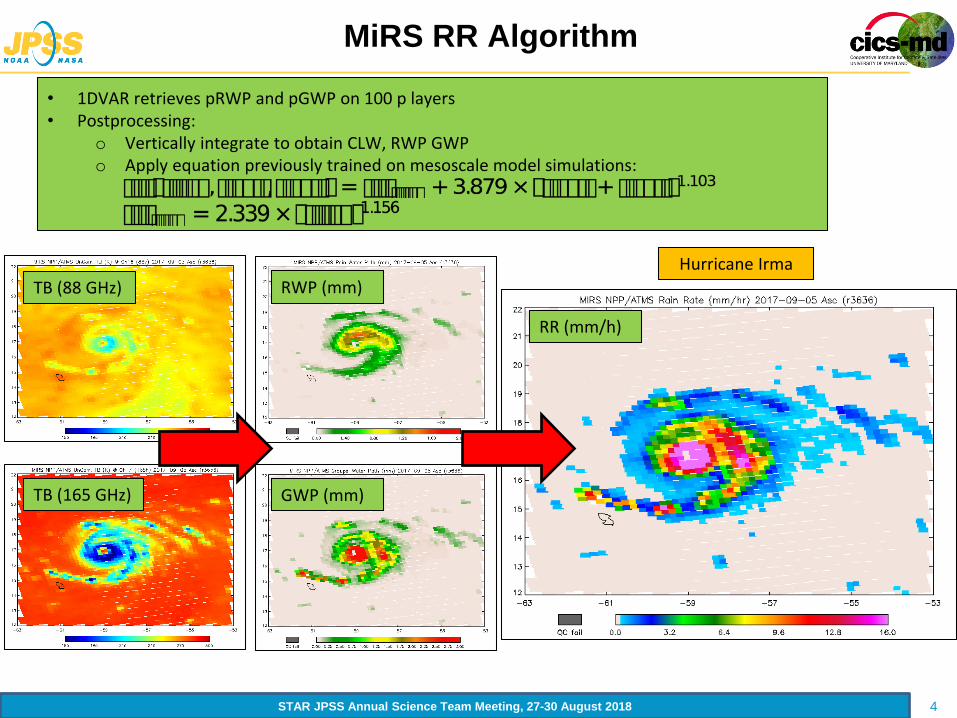
• 1DVAR retrieves pRWP and pGWP on 100 p layers• Postprocessing:
o Vertically integrate to obtain CLW, RWP GWPo Apply equation previously trained on mesoscale model simulations:
MiRS RR Algorithm
RWP (mm)
GWP (mm)
RR (mm/h)
Hurricane Irma
TB (88 GHz)
TB (165 GHz)
5STAR JPSS Annual Science Team Meeting, 27-30 August 2018
7STAR JPSS Annual Science Team Meeting, 27-30 August 2018
Hurricane Harvey:
MiRS ATMS Rain Rate and TPW, 24 August 2017
Rain Rate (mm/h)
TPW (mm)
Descending Ascending
Cross-section
Cross-section
8STAR JPSS Annual Science Team Meeting, 27-30 August 2018
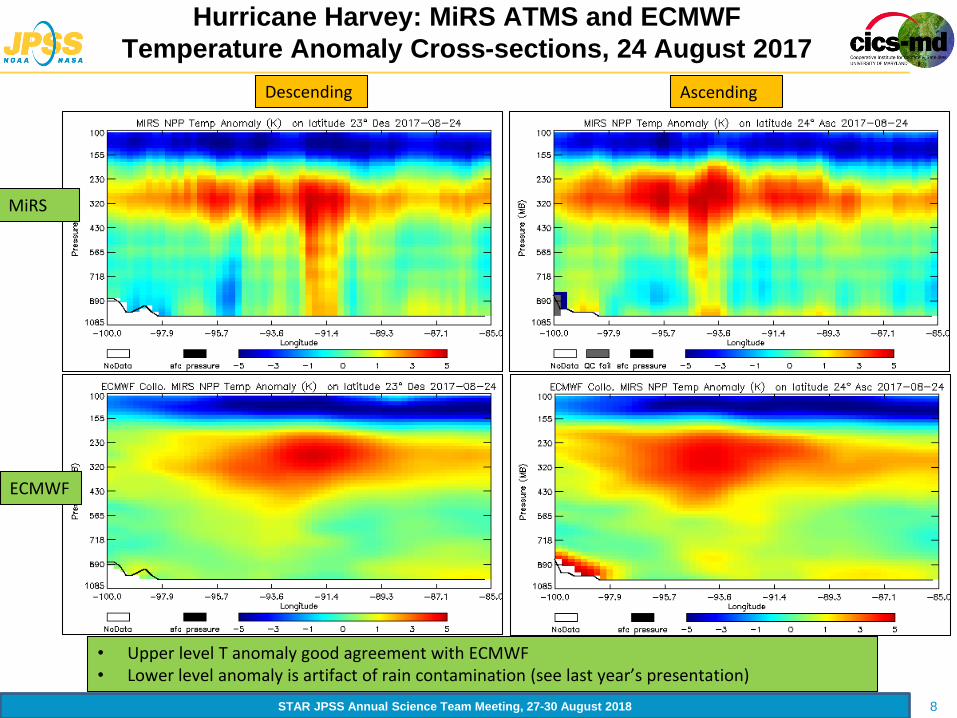
Hurricane Harvey: MiRS ATMS and ECMWF
Temperature Anomaly Cross-sections, 24 August 2017
Descending Ascending
MiRS
ECMWF
• Upper level T anomaly good agreement with ECMWF• Lower level anomaly is artifact of rain contamination (see last year’s presentation)
9STAR JPSS Annual Science Team Meeting, 27-30 August 2018
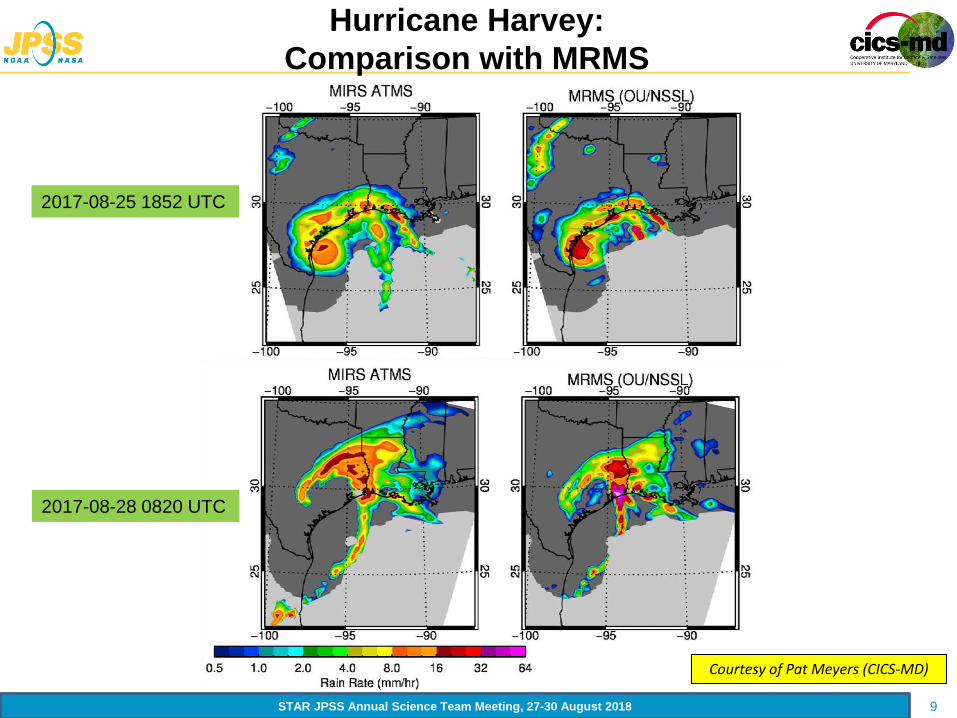
Hurricane Harvey:
Comparison with MRMS
2017-08-28 0820 UTC
2017-08-25 1852 UTC
Courtesy of Pat Meyers (CICS-MD)
10STAR JPSS Annual Science Team Meeting, 27-30 August 2018
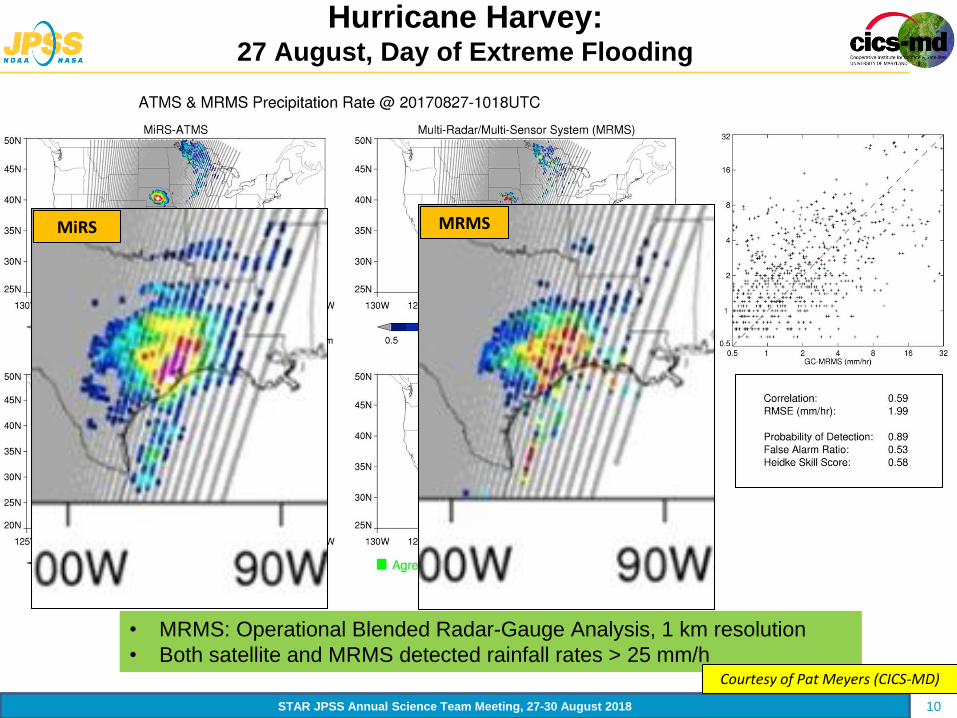
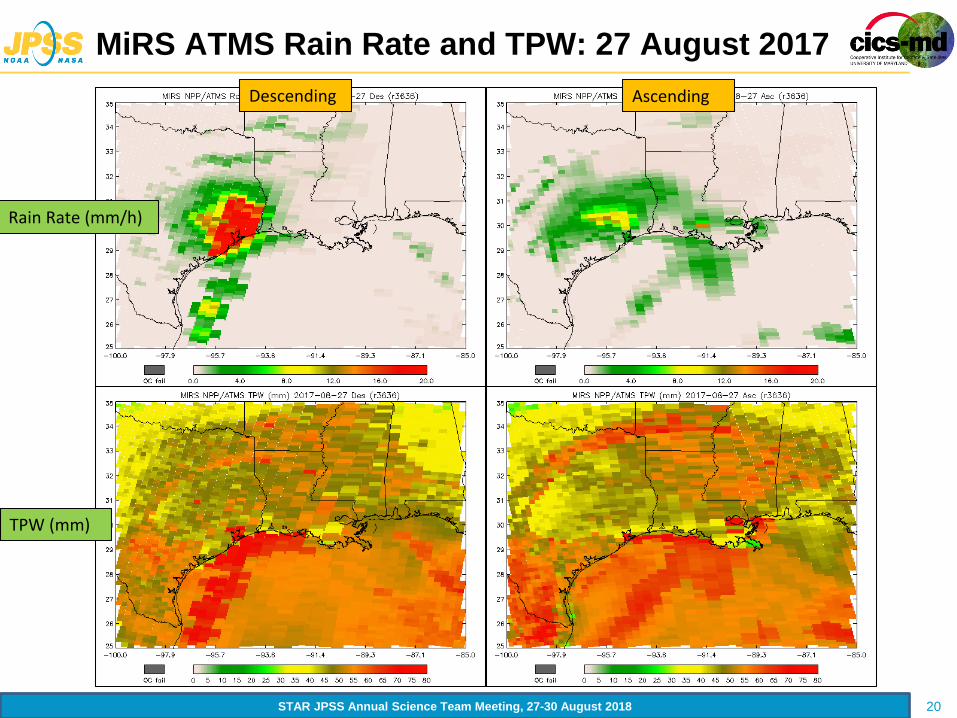
Hurricane Harvey:27 August, Day of Extreme Flooding
• MRMS: Operational Blended Radar-Gauge Analysis, 1 km resolution
• Both satellite and MRMS detected rainfall rates > 25 mm/h
MiRS MRMS
Courtesy of Pat Meyers (CICS-MD)
11STAR JPSS Annual Science Team Meeting, 27-30 August 2018
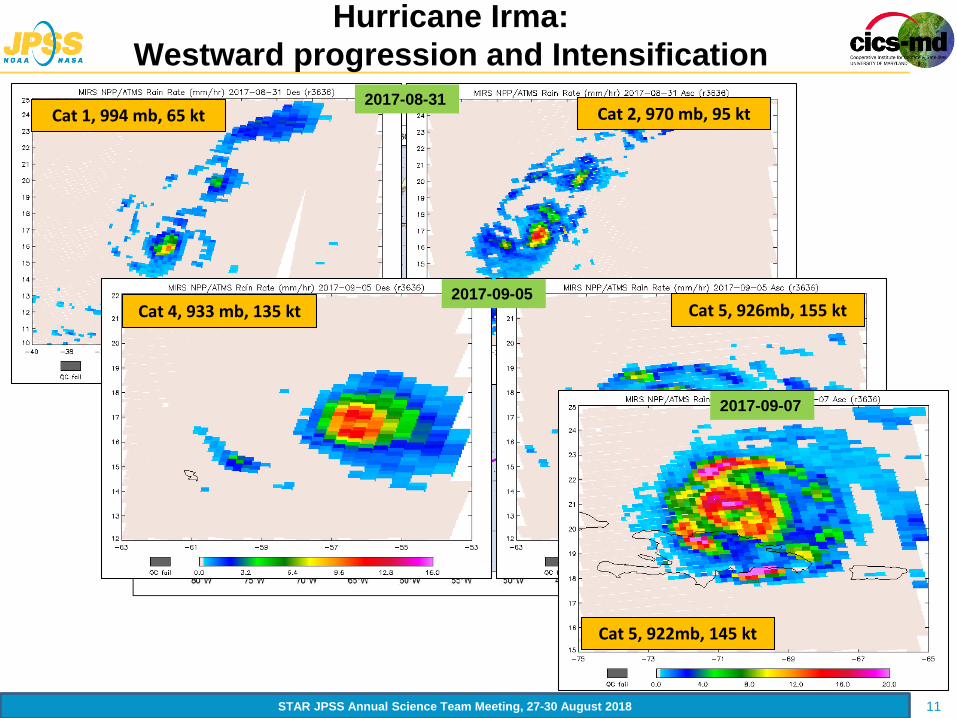
Hurricane Irma:
Westward progression and Intensification
2017-08-31
2017-09-05
2017-09-07
Cat 1, 994 mb, 65 kt Cat 2, 970 mb, 95 kt
Cat 4, 933 mb, 135 kt Cat 5, 926mb, 155 kt
Cat 5, 922mb, 145 kt
12STAR JPSS Annual Science Team Meeting, 27-30 August 2018
Northeastern Snowstorm: 14 March 2017
Rain rate (mm/h) TPW (mm)
• High rain rates over ocean and southern areas (Caribbean moisture plume)
• Missing RR over snow covered land (algorithm does not retrieve precipitation when
snow cover detected)
• Complementarity with SFR algorithm (retrieves over land only); see Huan Meng’s
presentation next.
13STAR JPSS Annual Science Team Meeting, 27-30 August 2018
Application: Blended Layer Precipitable Water
Combines MiRS WV from up to 7 Polar Satellites
for Rapid Refresh and Advection (NWP-based winds)
Gitro et al., 2018: Using the multisensor advected layered precipitable water product in the operational forecast environment. J. Operational Meteor., 6 (6), 59-73, doi: https://doi.org/10.15191/nwajom.2018.0606
To be implemented at NHC and WPC
Layer PW provides detail not present in TPW retrievals.
Courtesy of John Forsythe
Sept 2014 case of extreme precipitation over Central US
14STAR JPSS Annual Science Team Meeting, 27-30 August 2018
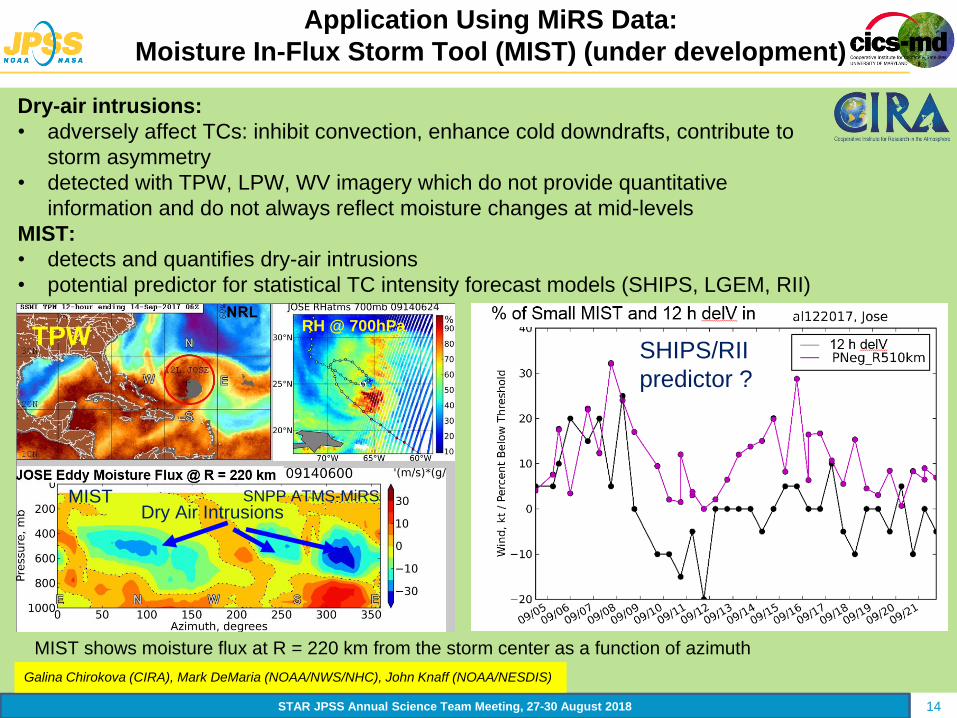
MIST shows moisture flux at R = 220 km from the storm center as a function of azimuth
Galina Chirokova (CIRA), Mark DeMaria (NOAA/NWS/NHC), John Knaff (NOAA/NESDIS)
Dry Air IntrusionsMIST
TPWRH @ 700hPa
SNPP ATMS-MiRS
SHIPS/RII
predictor ?
15STAR JPSS Annual Science Team Meeting, 27-30 August 2018
Two Operational ATMS Better Than One: MiRS
Rain Rate for Hurricane Hector
SNPP 2018-08-04, 1015 UTC N20 2018-08-04, 0924 UTC
SNPP 2018-08-04, 2304 UTC N20 2018-08-04, 2213 UTC
Des
Asc
Doubling the number of ATMS
overpasses increases odds
that TCs fall within the (near
nadir) “sweet spot” of swath.
Swath edge
Swath edge
16STAR JPSS Annual Science Team Meeting, 27-30 August 2018
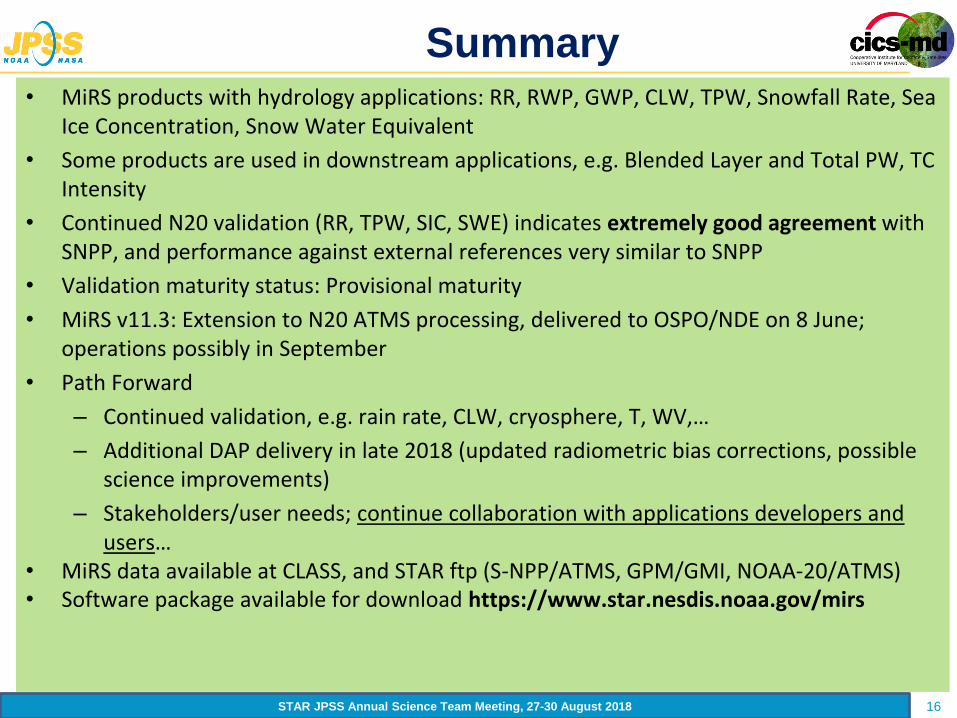
• MiRS products with hydrology applications: RR, RWP, GWP, CLW, TPW, Snowfall Rate, Sea Ice Concentration, Snow Water Equivalent
• Some products are used in downstream applications, e.g. Blended Layer and Total PW, TC Intensity
• Continued N20 validation (RR, TPW, SIC, SWE) indicates extremely good agreement with SNPP, and performance against external references very similar to SNPP
• MiRS v11.3: Extension to N20 ATMS processing, delivered to OSPO/NDE on 8 June; operations possibly in September
• Path Forward
– Continued validation, e.g. rain rate, CLW, cryosphere, T, WV,…
– Additional DAP delivery in late 2018 (updated radiometric bias corrections, possible science improvements)
– Stakeholders/user needs; continue collaboration with applications developers and users…
• MiRS data available at CLASS, and STAR ftp (S-NPP/ATMS, GPM/GMI, NOAA-20/ATMS)• Software package available for download https://www.star.nesdis.noaa.gov/mirs
Summary
17STAR JPSS Annual Science Team Meeting, 27-30 August 2018
Extra Slides
18STAR JPSS Annual Science Team Meeting, 27-30 August 2018
• Algorithm Overview
• Rain rate validation– N20 and SNPP ATMS comparisons with Stage IV
• Case Studies– Hurricane Harvey (August 2017)
– Hurricanes Irma and Jose (Sept 2017)
– Northeastern Snowstorm (14 March 2017)
– Advantage of 2 operational ATMS for TC monitoring
• Summary and Path Forward
Outline
19STAR JPSS Annual Science Team Meeting, 27-30 August 2018
Hurricane Harvey:
MiRS ATMS Rain Rate and TPW, 25 August 2017
Rain Rate (mm/h)
TPW (mm)
Descending Ascending
20STAR JPSS Annual Science Team Meeting, 27-30 August 2018