Mid-Biennium Budget Adjustments FY2017-18 and FY2018-19 March 2018 Members of the Appropriations Committee Sen John Stinner (C) Sen Mike McDonnell Sen Kate Bolz (VC) Sen Tony Vargas Sen Robert Clements Sen Dan Watermeier Sen Robert Hilkemann Sen Anna Wishart Sen John Kuehn
Appendix A Detailed Listing 2018 Budget Adjustments – All Funds ................................. 32
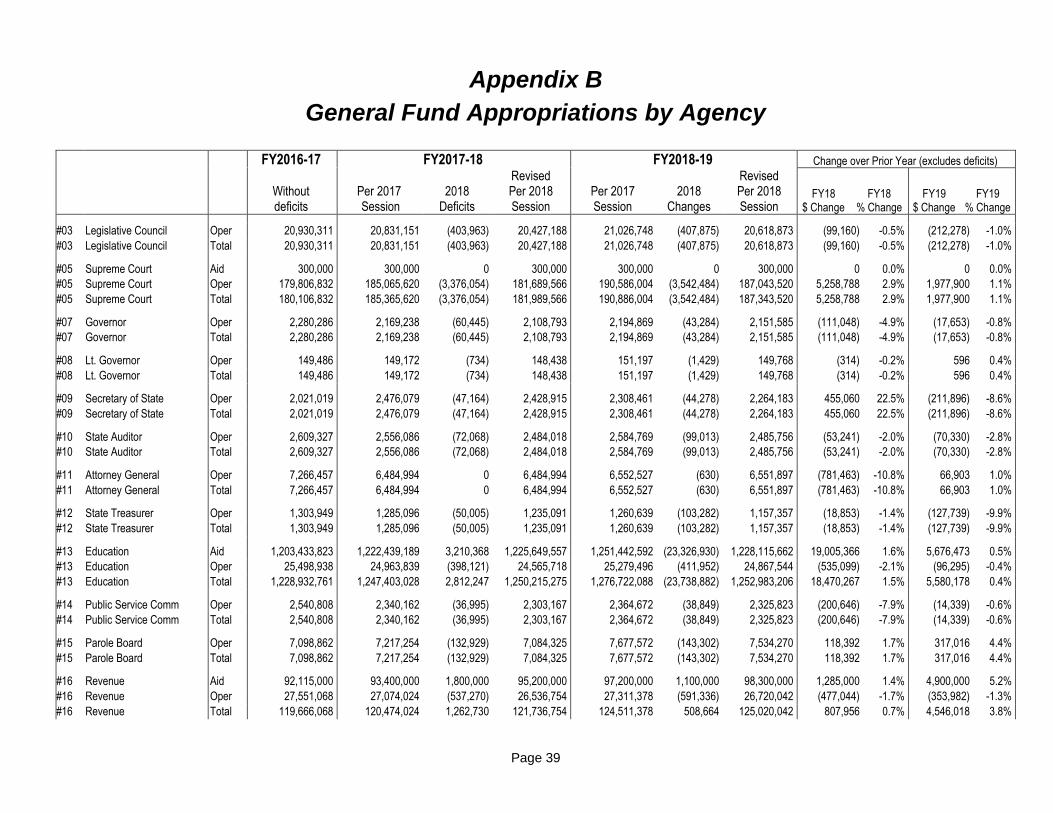
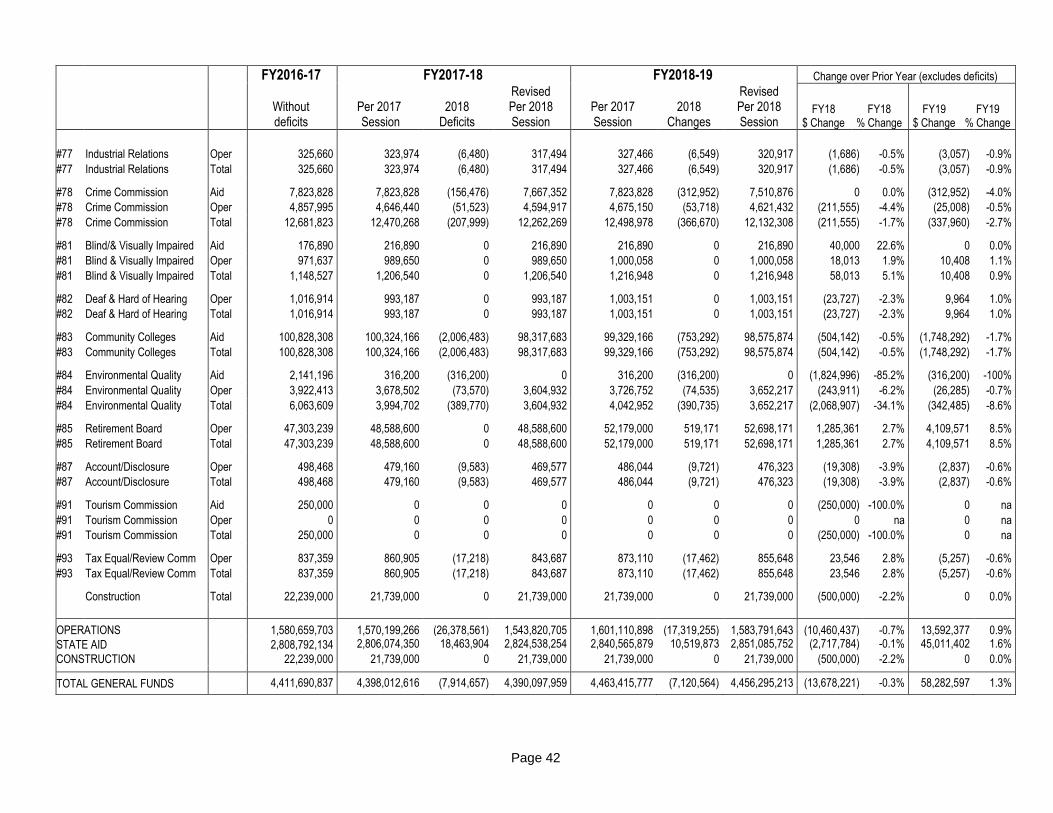
Appendix B General Fund Appropriations by Agency ...................................................... 39
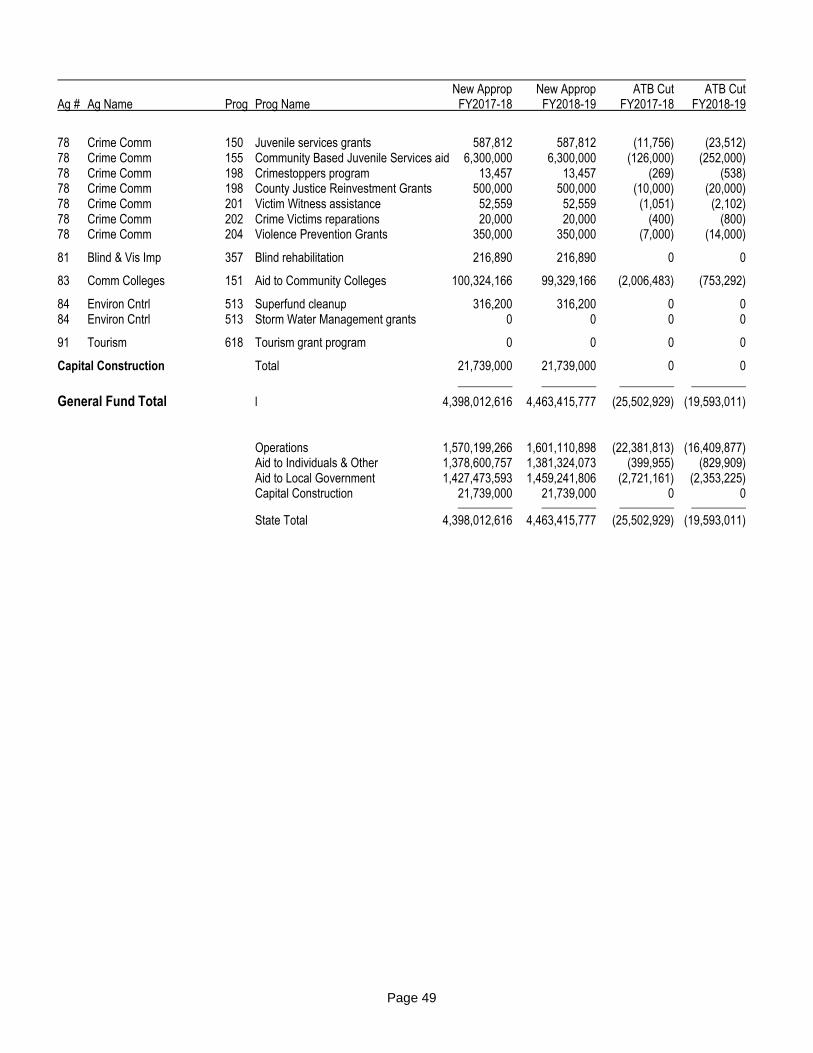
Appendix C General Fund Appropriations by State Aid Program ..................................... 43
Appendix D Across the Board Reductions – Committee Proposal .................................. 45
Appendix E Projected Budget – Following Biennium ....................................................... 50
Page 1
Highlights
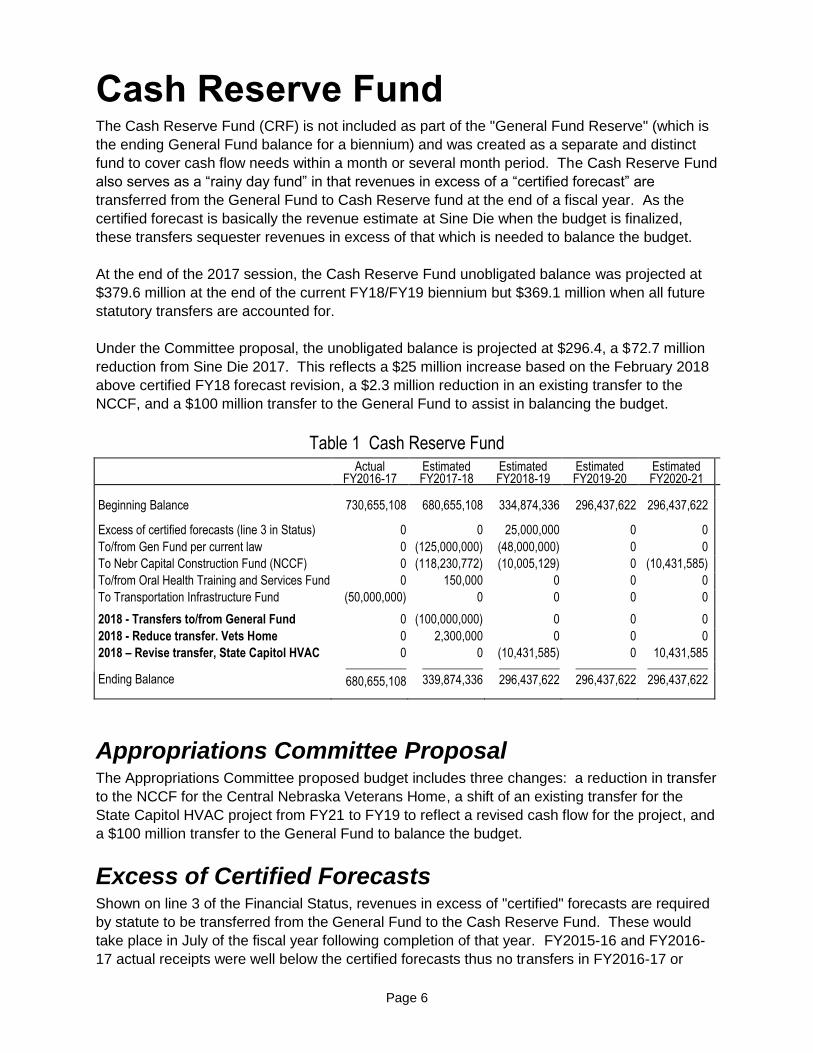
General Fund Financial Status When the 2017 Legislature adjourned, a FY2017-18 and FY2018-19 biennial budget was
enacted and a balanced budget was achieved. Spending was limited to a two year average
increase of .6%. Increases in TEEOSA, Medicaid eligibility and utilization, employee salary and
health insurance costs, and homestead exemption reimbursement required significant
reductions in other areas of the budget in order to achieve that low percent change.
Since that time increases in child welfare costs, a lower than budgeted federal Medicaid match
rate, and a large reduction in revenue forecasts in October 2017 resulted in a budget shortfall
relative to the required minimum reserve of roughly $210 million. The choices available in
addressing this shortfall were relatively simple; increase revenues, reduce expenditures or
some combination of the two. What is not simple is the combination of those budget actions.
The Committee proposed budget adjustments maximizes the amount of revenue available at
the current tax rates (including the February 2018 forecast revisions), and a level of budget
reductions that balances the budget while utilizing an amount of Cash Reserve Fund monies
that maintains an unobligated balance of almost $300 million in the Cash Reserve Fund.
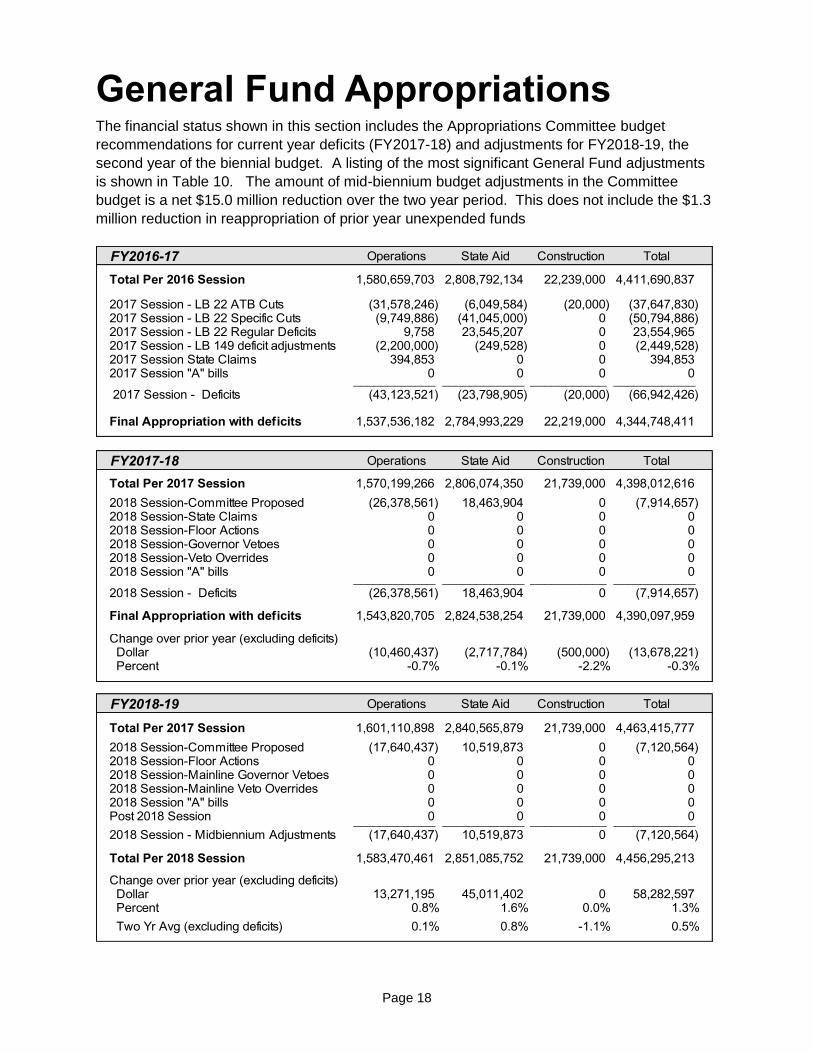
General Fund Budget Adjustments The Appropriations Committee proposed adjustments result in a net reduction of General Fund
new appropriations of $15.0 million over the two year period.
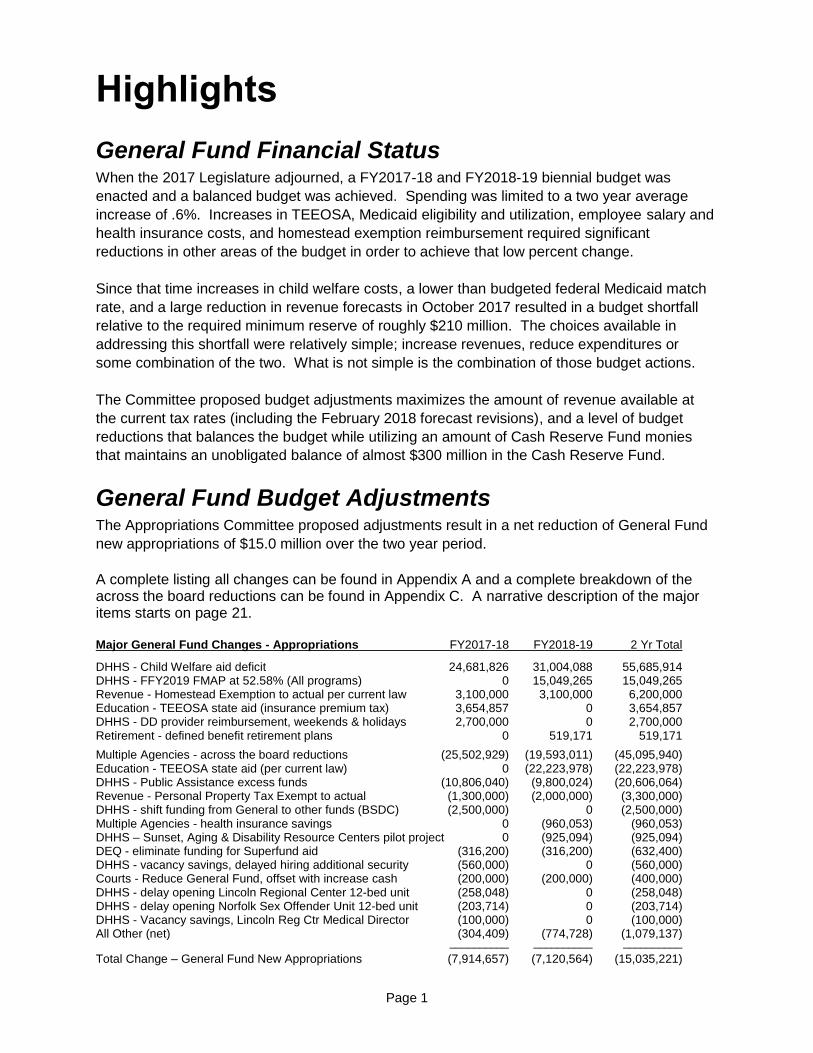
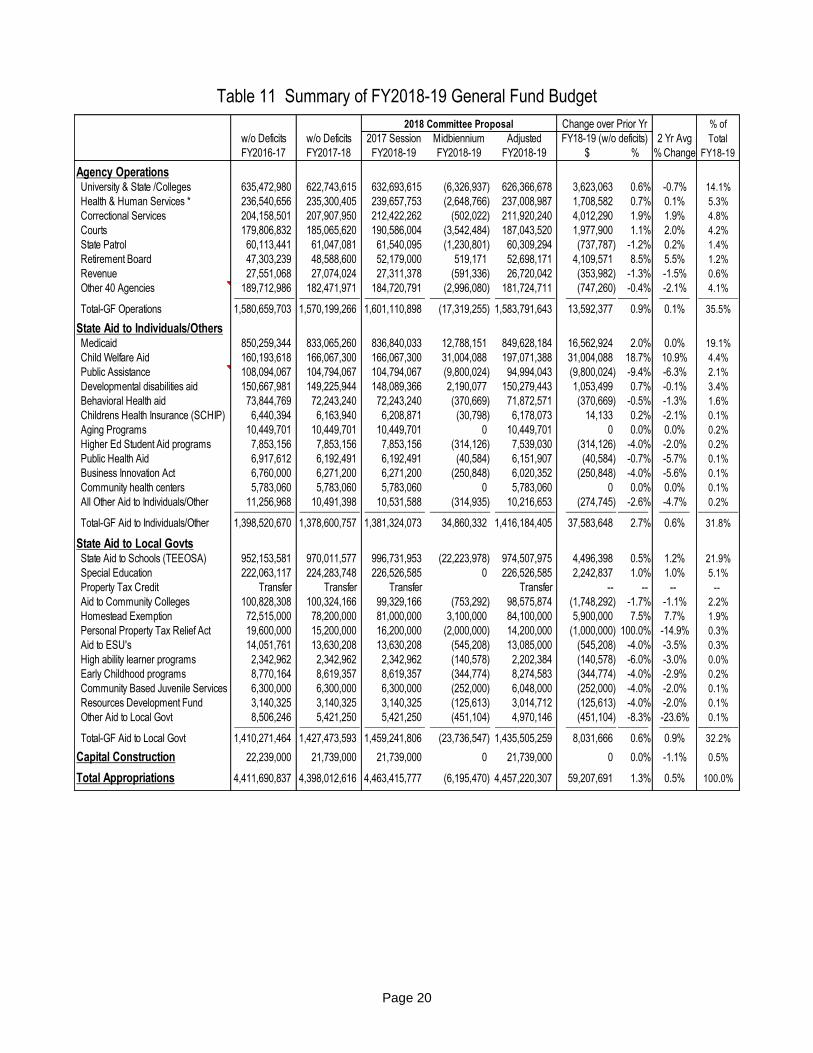
A complete listing all changes can be found in Appendix A and a complete breakdown of the across the board reductions can be found in Appendix C. A narrative description of the major items starts on page 21. Major General Fund Changes - Appropriations FY2017-18 FY2018-19 2 Yr Total
DHHS - Child Welfare aid deficit 24,681,826 31,004,088 55,685,914 DHHS - FFY2019 FMAP at 52.58% (All programs) 0 15,049,265 15,049,265 Revenue - Homestead Exemption to actual per current law 3,100,000 3,100,000 6,200,000 Education - TEEOSA state aid (insurance premium tax) 3,654,857 0 3,654,857 DHHS - DD provider reimbursement, weekends & holidays 2,700,000 0 2,700,000 Retirement - defined benefit retirement plans 0 519,171 519,171
Multiple Agencies - across the board reductions (25,502,929) (19,593,011) (45,095,940) Education - TEEOSA state aid (per current law) 0 (22,223,978) (22,223,978) DHHS - Public Assistance excess funds (10,806,040) (9,800,024) (20,606,064) Revenue - Personal Property Tax Exempt to actual (1,300,000) (2,000,000) (3,300,000) DHHS - shift funding from General to other funds (BSDC) (2,500,000) 0 (2,500,000) Multiple Agencies - health insurance savings 0 (960,053) (960,053) DHHS – Sunset, Aging & Disability Resource Centers pilot project 0 (925,094) (925,094) DEQ - eliminate funding for Superfund aid (316,200) (316,200) (632,400) DHHS - vacancy savings, delayed hiring additional security (560,000) 0 (560,000) Courts - Reduce General Fund, offset with increase cash (200,000) (200,000) (400,000) DHHS - delay opening Lincoln Regional Center 12-bed unit (258,048) 0 (258,048) DHHS - delay opening Norfolk Sex Offender Unit 12-bed unit (203,714) 0 (203,714) DHHS - Vacancy savings, Lincoln Reg Ctr Medical Director (100,000) 0 (100,000) All Other (net) (304,409) (774,728) (1,079,137) __________ __________ __________
Total Change – General Fund New Appropriations (7,914,657) (7,120,564) (15,035,221)
Page 2
General Fund Revenue Forecasts Revenue estimates for FY2017-18 and FY2018-19 are the February 2018 forecasts from the
Nebraska Economic Forecast Advisory Board (NEFAB). These forecasts yield a projected
adjusted revenue growth of 3.8% in FY17-18 and 4.9% in FY18-19, an average growth of 4.4%.
While this two year growth is below the 4.75% historical average, the average growth for the
three prior three years was 2.3%
For the following biennium or what’s commonly referred to as the “out years”, the preliminary
estimates for FY2019-20 and FY2020-21 are prepared by the Legislative Fiscal Office (LFO)
using the “capped” historical average methodology. This “smoothing” technique derives “out
year” revenue estimates by calculating the level of revenues that would yield a five year average
growth (FY16 to FY21) roughly equal to the 36 year historical average (4.75%) less .25% which
is the projected impact of indexing the tax brackets as enacted in LB987 (2014). Under this
method, revenue growth for the two years would average 6.4%.
Impact of Federal Tax Changes On December 22, 2017, President Trump signed into law the Tax Cuts and Jobs Act (TCJA),
significantly changing the tax code for the United States. Nebraska is a state of rolling
conformity to the federal tax code, hence any changes in the federal tax code can affect the
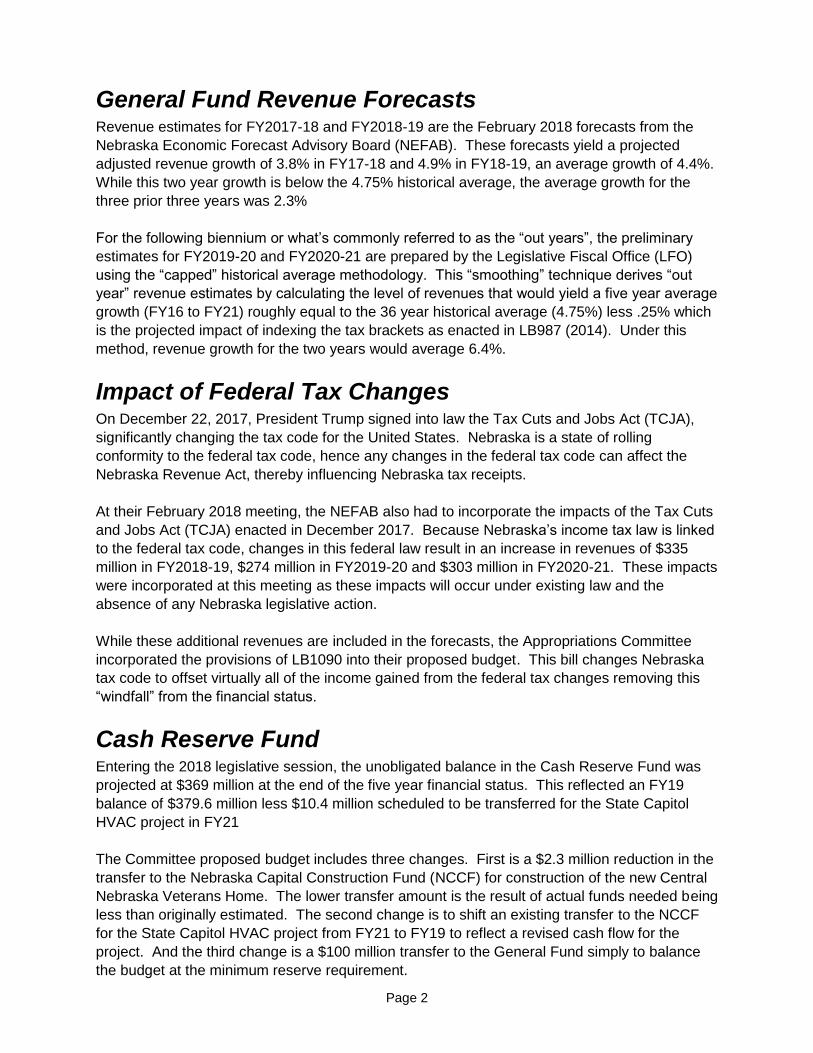
To/from Gen Fund per current law 0 (125,000,000) (48,000,000) 0 0
To Nebr Capital Construction Fund (NCCF) 0 (118,230,772) (10,005,129) 0 (10,431,585) From Excess from Oral Health Training & Services Fund 0 150,000 0 0 0
To Transportation Infrastructure Fund (50,000,000) 0 0 0 0
LB 946 To General Fund 0 (100,000,000) 0 0 0
LB 946 Reduce transfer to NCCF (Vets Home) 0 2,300,000 0 0 0
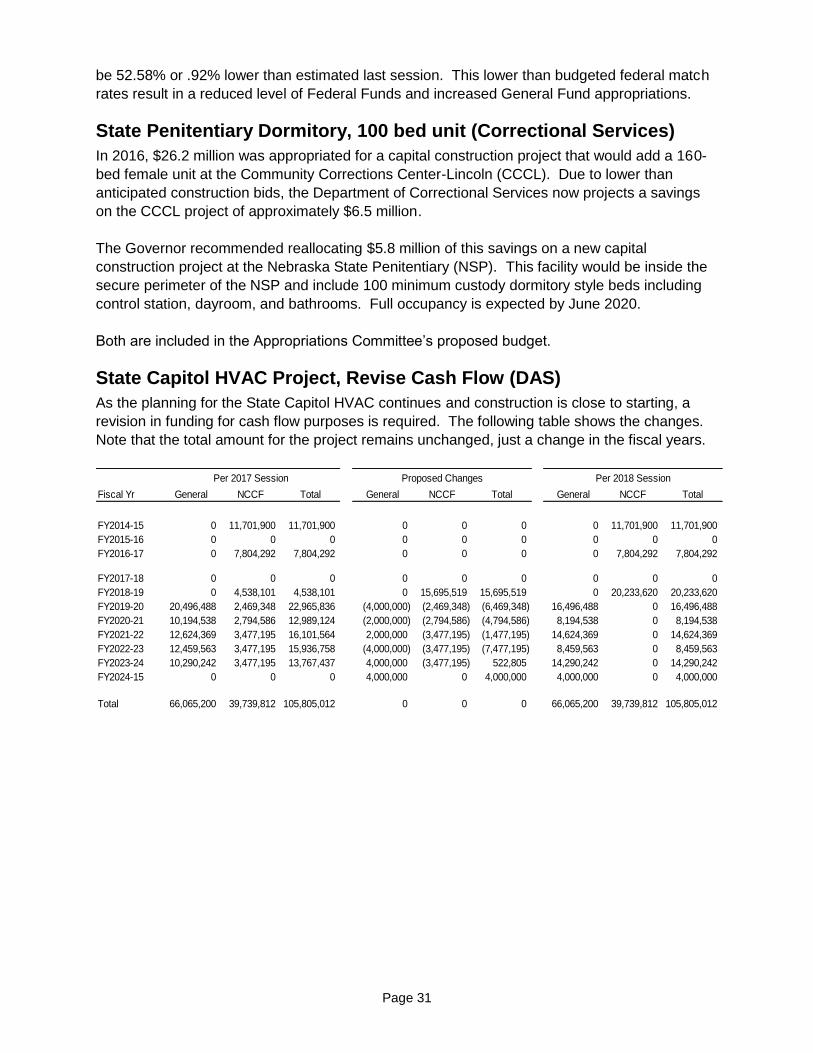
LB 946 Revise transfer to NCCF (Capitol HVAC project) 0 0 (10,431,585) 0 10,431,585___________ ___________ ___________ ___________ ___________
the Department of Revenue issued a report which summarizes the major provisions of the TCJA
and the impact on Nebraska tax receipts.
On the individual income tax side, the TCJA:
- Changes rates and brackets; - Increases the standard deduction; - Eliminates personal exemptions; - Limits itemized deductions; - Changes the inflation adjustment method; - Increases the child tax credit; - Creates a new dependent credit for dependents older than 17; - Creates a new pass-through deduction; - Allows immediate expensing of capital expenditures; and - Increases the estate tax exemption amount.
The TCJA also reformed the tax code for corporations. The TCJA greatly reduces the corporate
tax rate from 35 percent to 21 percent. It also switched to a territorial tax system rather than the
worldwide taxation system for multinational corporations. At the same time, the TCJA greatly
expanded the tax base for corporations. Major items related to the changes in the taxation of
corporations under the TCJA include : Reducing the rate, repatriation of deferred foreign
income, 100% deduction of dividends received by domestic parents of foreign subsidiaries, cost
recovery (IRC Section 179 expensing and immediate expensing), limitation on business interest
expense deduction, limitation on net operating loss (NOL) deduction, repeal of deduction for
income attributable to domestic production activities, and cash accounting for small businesses.
The following table shows the impact on state revenues of the various federal tax provisions on
a tax year basis, January 1 to December 31. Since the state fiscal year runs from July 1 to June
30, the impact on a fiscal year basis is different especially in the first fiscal year where the
impact includes a full tax year plus six months withholding difference.
Table 6 – Impact of Tax Cuts and Jobs Act (TCJA) – Tax Year Basis
Dept of Revenue Report (February 2018) TY2018 TY2019 TY2020 TY2021
Individual Income Tax
Federal brackets and rates 0 0 0 0
Standard deduction (higher fed standard) 11,000,000 12,000,000 12,000,000 12,000,000
Personal exemption 209,000,000 220,000,000 232,000,000 244,000,000
Limit on business interest expenses deduction 13,000,000 21,000,000 23,000,000 23,000,000
Limit on net operating loss (NOL) deduction 9,000,000 12,000,000 15,000,000 15,000,000
Repeal of deduction, certain domestic production 6,000,000 11,000,000 11,000,000 11,000,000
Cash accounting for small business (6,000,000) (8,000,000) (4,000,000) (4,000,000)
Adjust to equal Feb Report (3,000,000) 1,000,000 0 2,000,000 ___________ ___________ ___________ ___________
Total - Corp Income Tax 33,000,000 7,000,000 10,000,000 31,000,000
Page 14
Table 7 Actual and Projected General Fund Revenues Sales and Individual Corporate Miscellaneous Total Net Adjusted Fiscal Year Use Tax Income Tax Income Tax Taxes and
The Appropriations Committee adjusts the budgeted TEEOSA aid amount to the level called for
under the existing law as calculated and released by the Dept of Education January 12, 2017.
In total this is $25.4 million lower than estimate at Sine Die last year and was included in the
budget enacted at that time. Taking into consideration changes in the Insurance Premium funds
the overall changes in General Funds are a reduction of $22,223,979 in FY2018-19
The following table shows the total amounts for TEEOSA aid (under current law), the key data
elements important in determining the total, and the dollar and percent changes.
Actual Actual Current Law Estimated Estimated
FY2016-17 FY2017-18 FY2018-19 FY2019-20 FY2020-21
Key Assumptions School Disbursements 3.8% 3.3% 3.4% 3.5% 4.0% Gen Fund Operating Expenditures (GFOE) 3.9% 3.7% 3.1% 3.5% 4.0% Property Valuations (assessed) 10.4% 4.6% 2.9% 1.9% 3.5% Property Valuations (adjusted) 10.4% 5.2% 2.9% 1.9% 3.5% Adjusted to Assessed Valuation Ratio 100.1% 100.6% 100.7% 100.7% 100.7% Cost Growth Factor 5.00% 4.00% 3.00% 4.00% 5.00% Local Effort Rate $1.0000 $1.0203 $1.0203 $1.0000 $1.0000 TEEOSA Total by Fund Source General Funds 952,153,580 970,011,577 974,507,975 1,045,362,595 1,124,413,259 Insurance Premium Tax 27,159,388 28,256,832 25,000,000 24,700,000 25,200,000 Lottery funds, reorg incentives 0 473,345 906,222 0 0 ___________ __________ __________ __________ ___________
Total TEEOSA state aid 979,312,968 998,741,754 1,000,414,197 1,070,062,595 1,149,613,259 General Funds - Change over Prior Year Dollar 5,613,919 17,857,997 4,496,398 70,854,621 79,050,664 Percent 0.6% 1.9% 0.5% 7.3% 7.6% Two Yr Avg % Change 2.2% 1.2% 7.4% All Funds - Change over Prior Year Dollar 6,276,343 19,428,786 1,672,444 69,648,398 79,550,664 Percent 0.6% 2.0% 0.2% 7.0% 7.4% Two Yr Avg % Change 2.5% 1.1% 7.2%
The following table shows the chronology of the TEEOSA estimates since Sine Die 2017. The
amounts shown are total TEEOSA aid including amounts financed with General Funds and
Insurance Premium Tax. Since Sine Die 2017 the estimates for the formula data elements and
subsequent aid amount, have now been replaced with actual data that is utilized to certify the
FY2018-19 TEEOSA state aid. This includes calculation of formula students, actual Annual
Financial Report data which is the basis for calculating NEEDS and other receipts, and property
valuations which is the basis for calculating yield from local effort rate.
Page 22
There were two revisions in the TEEOSA number. The first revision was made at the statutory
joint meeting where the Department of Education (NDE), the Property Tax Administrator, the
Legislative Fiscal Analyst, and the budget division of DAS are to provide an estimate for the
upcoming year. This was the estimate used in the Governors recommendation. The second
changes occurred with the development of the NDE calculation of aid under the current law in
January 2018.
All Funds All Funds All Funds All Funds
FY2017-18 FY2018-19 FY2019-20 FY2020-21
Sine Die 2017 (with May 2017 certification) 998,741,754 1,025,769,482 1,119,516,889 1,198,006,211
Valuation, 2017 from 3.48% DPAT Est to 2.88% DPAT certified 0 (17,276,553) (17,108,835) (17,707,644)
All Other NEEDS changes 0 (1,168,654) (1,555,397) (2,022,015)
Lower effective Yield from Local Effort Rate 0 1,257,639 8,674,342 8,977,910
Actual FY17 AFR, higher Other Receipts 0 (807,584) (836,777) (823,037)
Transition Aid (LB 1067) 0 669,550 0 0
Increase lottery funds for transition aid 0 0 0 0
__________ __________ __________ __________
Total Change - NDE Jan 2018 0 (1,615,844) (15,549,023) (16,571,581)
NDE Jan 2018 998,741,754 1,000,414,197 1,070,062,595 1,149,613,260
Change Since Sine Die 2017
Total Change - Fall 2017 Joint Meeting 0 (23,739,441) (33,905,270) (31,821,370)
Total Change - NDE Jan 2018 0 (1,615,844) (15,549,023) (16,571,581) __________ __________ __________ __________ Total Change - All Funds 0 (25,355,285) (49,454,293) (48,392,951)
Change in Insurance Premium Tax 0 3,800,856 4,814,575 5,047,661
Change in TEEOSA (General Funds) 0 (22,223,979) (44,639,719) (43,345,290)
Page 23
Homestead Exemption (Revenue)
Total certificates for the current fiscal year and amended request for the Homestead Exemption
in 2016 is $81,278,386 while the current appropriation for FY17-18 was $78.2 million. Since the
counties may amend their requests for reimbursement of tax loss up to the May 30th statutory
deadline, the Department of Revenue requested an amended appropriation of $81.3 million for
the current fiscal year, an increase of $3.1 million from the current appropriation. With a higher
FY2017-18 baseline amount, the FY2018-19 appropriation is also increased by the same
amount of $3.1 million.
Personal Property Tax Reimbursement (Revenue)
LB 259 enacted in the 2015 session, adopted the Personal Property Tax Relief Act. The bill
provided for an exemption from the property tax on the first $10,000 of valuation of tangible
personal property in each tax district in which a personal property tax return is required to be
filed.
Based on the 2017 certifications from the counties for the locally assessed personal property tax
loss and the Department’s most recent estimate for the centrally assessed personal property,
tax loss for the current fiscal year equals $13,807,419 below the original estimated and
budgeted level of $15.2 million. This allowed for a reduction in the FY2017-18 appropriation
level of $1.3 million allowing for a small contingency for potential amendments. In addition, it is
estimated that the appropriation for FY2018-19 can also be decreased from $16.2 million to
$14.2 million, a decrease of $2.0 million based on the FY18 actual results.
Child Welfare Shortfall (DHHS)
DHHS requested additional General Funds of $24,681,826 for FY 2017-18 and $31,004,088
General Funds for FY 2018-19 to finance increased Child Welfare aid costs. The biennial
appropriation for Child Welfare aid only included increases for the PromiseShip (formerly
Nebraska Families Collaborative) contract and also included reductions for drug testing and
kinship care support. The primary reasons for the deficit are 1) More children are being served.
Entries into the child welfare system have increased while the rate at which cases are closed
has remained relatively flat. 2) The number of services per child is up by 11% compared to FY
2016. Of these services family support increased by the largest amount. 3) Subsidized
adoptions and guardianships are up. These costs are offset initially by reductions in foster care
payments, but the costs compound over time as they continue until the child reaches age 19. 4)
There was a significant disparity in payments for tribal contracts. They have been revised so all
rates are standardized which resulted in higher costs. 5) It appears savings for kinship care is
less than projected.
A review of year to date expenditures confirms that the current pace of expenditures leads to
the $24 million shortfall. Both the Governor and Appropriations Committee included the
requested funding in their proposals.
Public Assistance, Lower than Budgeted Spending (DHHS)
The Department of Health and Human Services (DHHS) has analyzed the FY2017-18 spend
rate and reviewed projections for FY 2018-19 for the various public assistance programs.
Based on their analysis, actual spending patterns were below appropriations levels allowing for
a reduction in General Fund appropriations by $10,806,040 for FY 2017-18 and $9,800,024 for
FY 2018-19. All subprograms were underspending except Employment First. And through
Page 24
December 2017, program 347 was underspending by 11% of the current year General Fund
appropriation and 13% with the carryover funding included. Both the Governor and
Appropriations Committee reduced the appropriations per the agency request.
Medicaid Match Rate, Lower than Budgeted (DHHS)
The current biennial budget for FY2018-19 enacted last session, was based on a federal
medical assistance percentage (FMAP) of 53.50% rate for FFY2019 which starts October 2019.
This 53.5% rate was a March 2017 estimate from the Federal Funds Information Service (FFIS)
It is now known that the actual FFY2019 FMAP will be 52.58% or .92% lower than estimated
last session. This lower than budgeted federal match rates result in a higher state match and
increased General Fund appropriations. The FMAP affects multiple program as shown below.
Program Type FY2017-18 FY2018-19
33 Developmental disability service coordination Oper 0 111,641
344 Childrens Health Insurance (SCHIP) Aid (30,798)
348 Medicaid Aid 0 12,788,151
354 Child Welfare Aid 0 0
365 Mental Health operations Oper 0 0
421 Beatrice State Develop Center (BSDC) Oper 0 (9,806)
424 Developmental disability aid Aid 0 2,190,077 _________ _________
Total GF impact of FMAP change 0 15,049,265
Developmental Disability Aid - residential provider reimbursement,
weekends & holidays (DHHS)
A discrepancy in definitions and billing rates was found during the process of revising the
federal Medicaid waivers. There was duplicated billing for day programming beyond 35 hours
per week. After the billing errors were identified, the Centers for Medicare and Medicaid
indicated the unallowable payments needed to cease and desist and all previous claims for
these services were to be reviewed for overpayments. So, beginning October 1, 2016, the
payments to providers of developmental disability services from the Department of Health and
Human Services only included the state share of funding for over 35 hours per week of service.
In response to the federal ruling, the Legislature provided an additional $4,663,144 of General
Funds in LB 22 (2017) plus an estimated $1,636,856 of unobligated reappropriated General
Funds from FY16 to reimburse providers for federal funds which were lost due to the billing
errors. The funds were to cover federal funds lost for a five month period from October of 2016
through February of 2017. It was assumed the Medicaid waivers would be approved by March
1, 2017 and federal funding would be restored to the providers at that time. However, the
approval of the Medicaid waivers did not occur until May 1st, so providers incurred an additional
loss of $5,399,138 of federal funds. The Appropriations Committee proposal includes $2.7
million of general funds in FY2017-18 to offset about 50% of the federal fund deficiency.
Sunset of the Aging and Disability Resource Centers (ADRCs) pilot
project (DHHS)
In the 2015 session, LB 320 directed the Department of Health and Human Services to develop
three pilot projects to establish Aging and Disability Resource Centers (ADRC). Area Agencies
on Aging (AAA) applied for the grants for the pilot projects. The ADRCs pilot projects are
Page 25
schedule to sunset on June 30, 2018. The funding totaling $925,094 was inadvertently
continued into FY2018-19 last session and is removed under the committee proposal.
Eliminate funding for Superfund aid (DEQ)
Legislation adopted in 2017 allows for transfers from the Petroleum Release Remedial Action
Cash Fund to the Superfund Cost Share Cash Fund. The Governor's recommendation provides
for the elimination of General Fund appropriations for the Superfund program. The required
state match would be provided from the cash fund. General Fund savings amount to $316,200
each year.
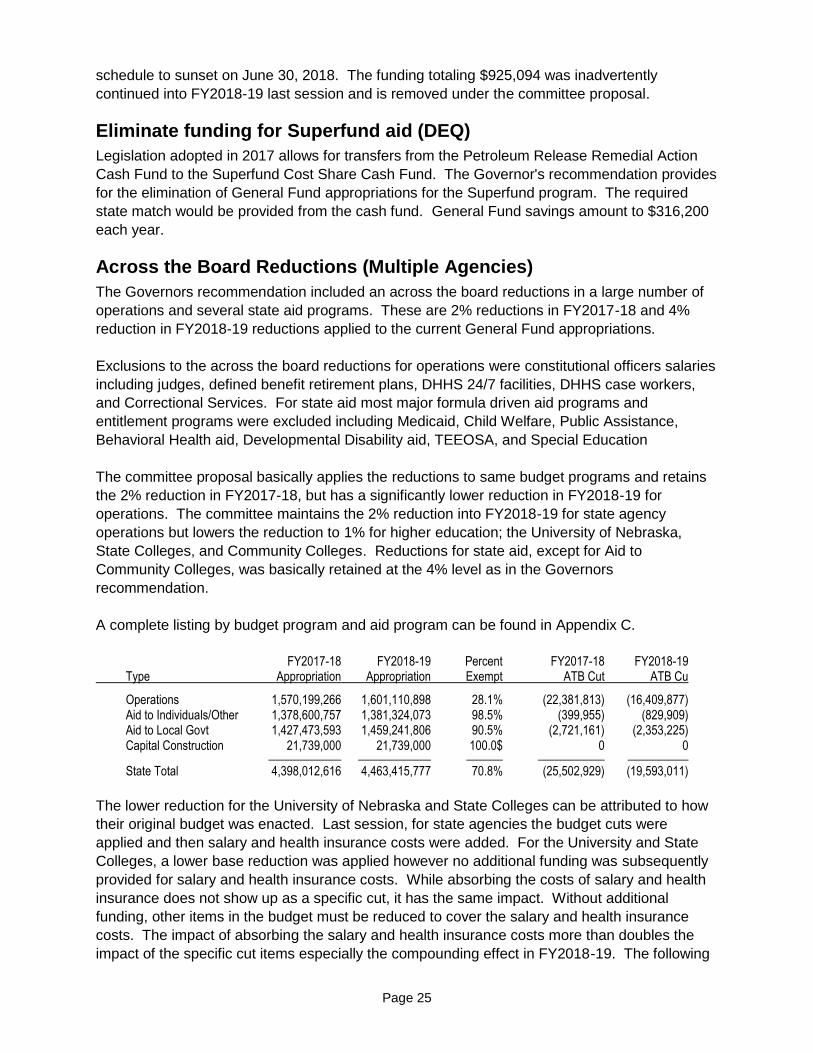
Across the Board Reductions (Multiple Agencies)
The Governors recommendation included an across the board reductions in a large number of
operations and several state aid programs. These are 2% reductions in FY2017-18 and 4%
reduction in FY2018-19 reductions applied to the current General Fund appropriations.
Exclusions to the across the board reductions for operations were constitutional officers salaries
including judges, defined benefit retirement plans, DHHS 24/7 facilities, DHHS case workers,
and Correctional Services. For state aid most major formula driven aid programs and
entitlement programs were excluded including Medicaid, Child Welfare, Public Assistance,
Behavioral Health aid, Developmental Disability aid, TEEOSA, and Special Education
The committee proposal basically applies the reductions to same budget programs and retains
the 2% reduction in FY2017-18, but has a significantly lower reduction in FY2018-19 for
operations. The committee maintains the 2% reduction into FY2018-19 for state agency
operations but lowers the reduction to 1% for higher education; the University of Nebraska,
State Colleges, and Community Colleges. Reductions for state aid, except for Aid to
Community Colleges, was basically retained at the 4% level as in the Governors
recommendation.
A complete listing by budget program and aid program can be found in Appendix C.
FY2017-18 FY2018-19 Percent FY2017-18 FY2018-19 Type Appropriation Appropriation Exempt ATB Cut ATB Cu
Operations 1,570,199,266 1,601,110,898 28.1% (22,381,813) (16,409,877) Aid to Individuals/Other 1,378,600,757 1,381,324,073 98.5% (399,955) (829,909) Aid to Local Govt 1,427,473,593 1,459,241,806 90.5% (2,721,161) (2,353,225) Capital Construction 21,739,000 21,739,000 100.0$ 0 0 ____________ ____________ ______ ___________ __________
State Total 4,398,012,616 4,463,415,777 70.8% (25,502,929) (19,593,011)
The lower reduction for the University of Nebraska and State Colleges can be attributed to how
their original budget was enacted. Last session, for state agencies the budget cuts were
applied and then salary and health insurance costs were added. For the University and State
Colleges, a lower base reduction was applied however no additional funding was subsequently
provided for salary and health insurance costs. While absorbing the costs of salary and health
insurance does not show up as a specific cut, it has the same impact. Without additional
funding, other items in the budget must be reduced to cover the salary and health insurance
costs. The impact of absorbing the salary and health insurance costs more than doubles the
impact of the specific cut items especially the compounding effect in FY2018-19. The following
Page 26
table shows the impact when comparing specific cuts only and then when taking into
consideration absorbing the salary and health insurance costs.
Total 66,065,200 39,739,812 105,805,012 0 0 0 66,065,200 39,739,812 105,805,012
Page 32
Appendix A
Detailed Listing of All Budget Adjustments (Across the board reductions are shown collectively at the end of this table. Details can be found in Appendix C)
Current Biennium Est for Following Biennium Fund FY2017-18 FY2018-19 FY2019-20 FY2020-21
#05-Supreme Court
3 Health insurance savings Gen 0 (3,728) (3,728) (3,728) 4 Health insurance savings Gen 0 (3,339) (3,339) (3,339) 6 Health insurance savings Gen 0 (30,190) (30,190) (30,190) 7 Health insurance savings Gen 0 (26,543) (26,543) (26,543) 52 General Fund reduction offset with increase cash Gen (200,000) (200,000) (200,000) (200,000) 52 General Fund reduction offset with increase cash Cash 200,000 200,000 200,000 200,000
#07-Governor
2 Health insurance savings Gen 0 (674) (674) (674) 18 Health insurance savings Gen 0 (1,684) (1,684) (1,684) 21 One-time reduction Gen (20,000) 0 0 0
#08-Lt. Governor
8 Health insurance savings Gen 0 (687) (687) (687)
#9-Secretary of State
9 Health insurance savings Gen 0 (490) (490) (490) 45 Cash increase to offset ATB reduction Cash 0 70,418 70,418 70,418 51 Shift funding, UCC Central Filing to Enforcement of Standards Cash 200,000 0 0 0 89 Shift funding, UCC Central Filing to Enforcement of Standards Cash (200,000) 0 0 0
#10-State Auditor
10 Health insurance savings Gen 0 (572) (572) (572) 10 Reduce appropriation for waived health insurance coverage Gen (23,394) 0 0 0
506 Shift audit costs to cash funded program, review of local government Gen (48,674) (98,441) (98,441) (98,441) 525 Shift audit costs to cash funded program, review of local government Cash 48,674 98,441 98,441 98,441
Page 33
Current Biennium Est for Following Biennium Fund FY2017-18 FY2018-19 FY2019-20 FY2020-21
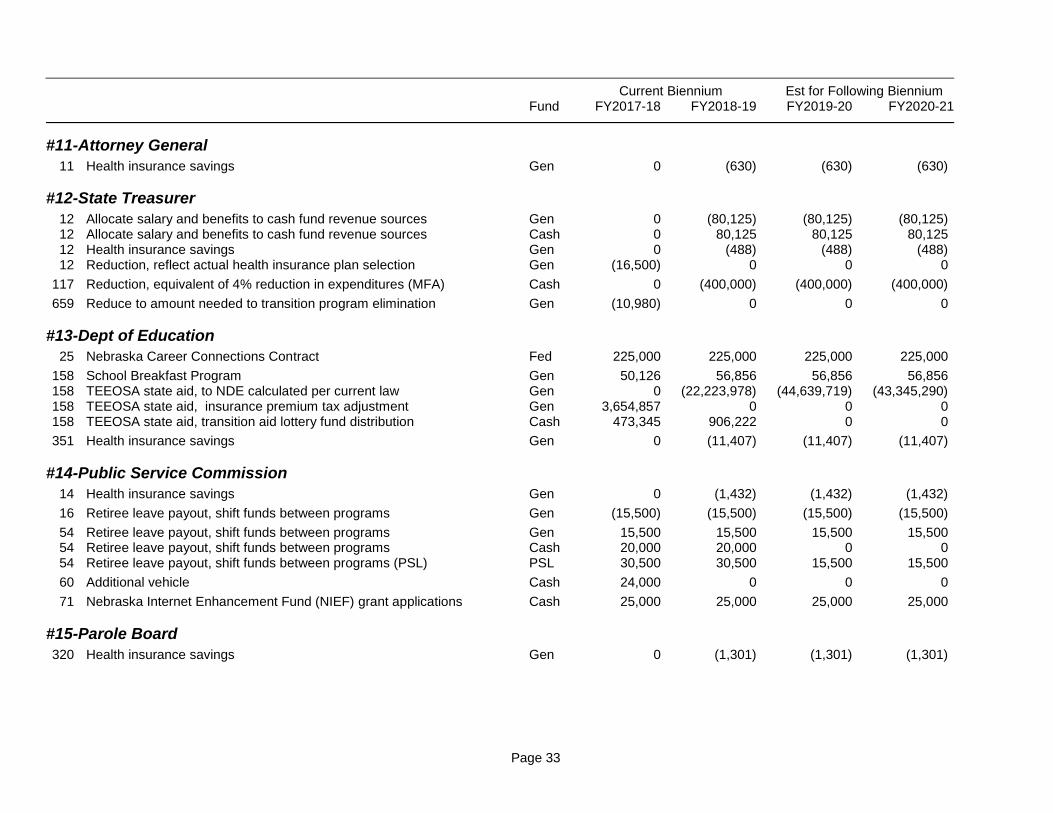
#11-Attorney General
11 Health insurance savings Gen 0 (630) (630) (630)
#12-State Treasurer
12 Allocate salary and benefits to cash fund revenue sources Gen 0 (80,125) (80,125) (80,125) 12 Allocate salary and benefits to cash fund revenue sources Cash 0 80,125 80,125 80,125 12 Health insurance savings Gen 0 (488) (488) (488) 12 Reduction, reflect actual health insurance plan selection Gen (16,500) 0 0 0
117 Reduction, equivalent of 4% reduction in expenditures (MFA) Cash 0 (400,000) (400,000) (400,000)
659 Reduce to amount needed to transition program elimination Gen (10,980) 0 0 0
#13-Dept of Education
25 Nebraska Career Connections Contract Fed 225,000 225,000 225,000 225,000
158 School Breakfast Program Gen 50,126 56,856 56,856 56,856 158 TEEOSA state aid, to NDE calculated per current law Gen 0 (22,223,978) (44,639,719) (43,345,290) 158 TEEOSA state aid, insurance premium tax adjustment Gen 3,654,857 0 0 0 158 TEEOSA state aid, transition aid lottery fund distribution Cash 473,345 906,222 0 0
351 Health insurance savings Gen 0 (11,407) (11,407) (11,407)
#14-Public Service Commission
14 Health insurance savings Gen 0 (1,432) (1,432) (1,432)
16 Retiree leave payout, shift funds between programs Gen (15,500) (15,500) (15,500) (15,500)
54 Retiree leave payout, shift funds between programs Gen 15,500 15,500 15,500 15,500 54 Retiree leave payout, shift funds between programs Cash 20,000 20,000 0 0 54 Retiree leave payout, shift funds between programs (PSL) PSL 30,500 30,500 15,500 15,500
60 Additional vehicle Cash 24,000 0 0 0
71 Nebraska Internet Enhancement Fund (NIEF) grant applications Cash 25,000 25,000 25,000 25,000
#15-Parole Board
320 Health insurance savings Gen 0 (1,301) (1,301) (1,301)
Page 34
Current Biennium Est for Following Biennium Fund FY2017-18 FY2018-19 FY2019-20 FY2020-21
#16-Dept of Revenue
13 Allocate salary and benefits among all budget programs Gen 0 (49,061) (49,061) (49,061) 13 Allocate salary and benefits among all budget programs Cash 0 49,061 49,061 49,061 13 Health insurance savings Gen 0 (314) (314) (314)
108 Adjust Homestead Exemption to actual under current law Gen 3,100,000 3,100,000 3,100,000 3,100,000
109 Adjust Personal Property Tax Exemption to actual under current law Gen (1,300,000) (2,000,000) (2,000,000) (2,000,000)
178 Base reduction to align appropriation with estimated expenditures Gen (49,174) (49,174) (49,174) (49,174)
250 Health insurance savings Gen 0 (60,023) (60,023) (60,023) 250 Vacancy Savings due to delayed hiring of additional security personnel Gen (560,000) 0 0 0
344 Shift appropriation, Children's Health Insurance (NCHIP) to Medicaid Gen (2,500,000) 0 0 0 344 FFY2019 FMAP at 52.58% (Prog 344 SCHIP) Gen 0 (30,798) (30,798) (30,798) 344 FFY2019 FMAP at 52.58% (Prog 344 SCHIP) Fed 0 30,798 30,798 30,798
347 Public Assistance excess, use to offset child welfare aid Gen (10,806,040) (9,800,024) (9,800,024) (9,800,024)
348 Shift appropriation, Children's Health Insurance (NCHIP) to Medicaid Gen 2,500,000 0 0 0 348 FFY2019 FMAP at 52.58% (Prog 348 Medicaid) Gen 0 12,788,151 12,788,151 12,788,151 348 FFY2019 FMAP at 52.58% (Prog 348 Medicaid) Fed 0 (14,978,228) (14,978,228) (14,978,228)
354 Child Welfare Aid deficit Gen 24,681,826 31,004,088 31,004,088 31,004,088
359 Health insurance savings Gen 0 (578) (578) (578)
365 Delay opening Lincoln Regional Center 12-bed unit Gen (258,048) 0 0 0 365 One-time vacancy savings - Lincoln Regional Center Medical Director Gen (100,000) 0 0 0 365 Delay opening Norfolk Sex Offender Unit 12-bed unit Gen (203,714) 0 0 0 365 Do not fill Norfolk Sex Offender Unit psychology position Gen (34,534) (82,844) (82,844) (82,844) 365 Health insurance savings Gen 0 (163,545) (163,545) (163,545) 365 Reduce general operating expenses Gen 0 (10,686) (10,686) (10,686)
Page 35
Current Biennium Est for Following Biennium Fund FY2017-18 FY2018-19 FY2019-20 FY2020-21
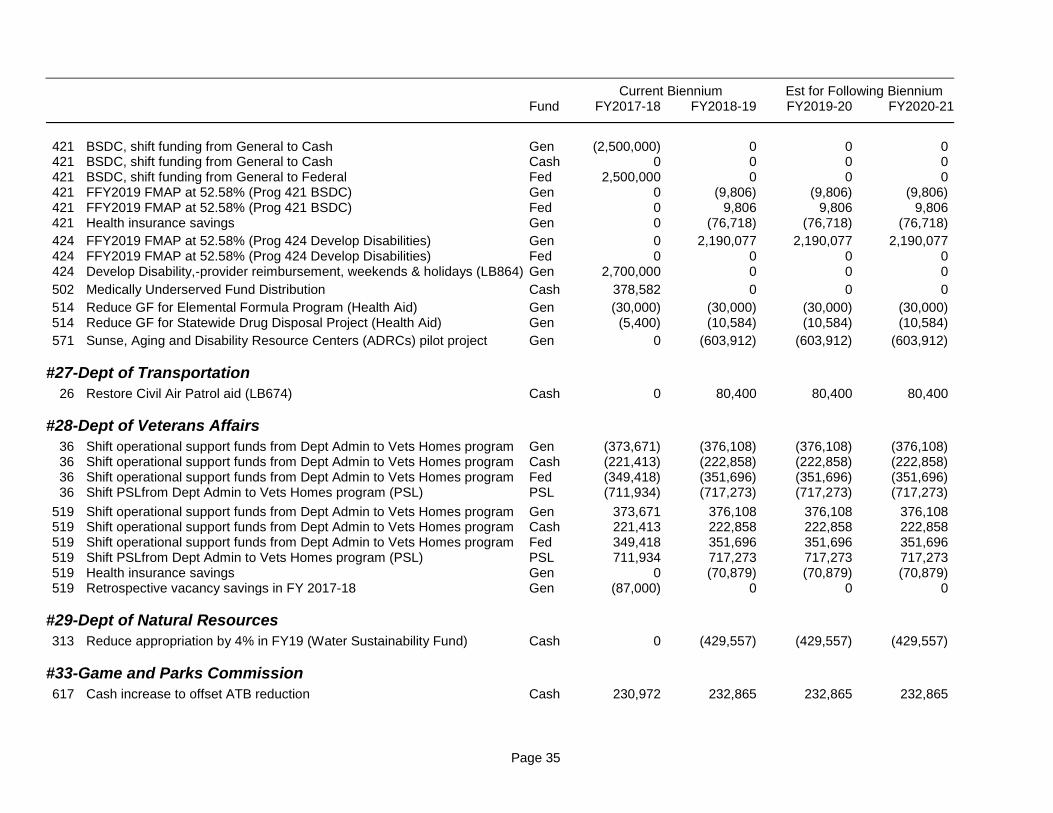
421 BSDC, shift funding from General to Cash Gen (2,500,000) 0 0 0 421 BSDC, shift funding from General to Cash Cash 0 0 0 0 421 BSDC, shift funding from General to Federal Fed 2,500,000 0 0 0 421 FFY2019 FMAP at 52.58% (Prog 421 BSDC) Gen 0 (9,806) (9,806) (9,806) 421 FFY2019 FMAP at 52.58% (Prog 421 BSDC) Fed 0 9,806 9,806 9,806 421 Health insurance savings Gen 0 (76,718) (76,718) (76,718)
502 Medically Underserved Fund Distribution Cash 378,582 0 0 0
514 Reduce GF for Elemental Formula Program (Health Aid) Gen (30,000) (30,000) (30,000) (30,000) 514 Reduce GF for Statewide Drug Disposal Project (Health Aid) Gen (5,400) (10,584) (10,584) (10,584)
571 Sunse, Aging and Disability Resource Centers (ADRCs) pilot project Gen 0 (603,912) (603,912) (603,912)
#27-Dept of Transportation
26 Restore Civil Air Patrol aid (LB674) Cash 0 80,400 80,400 80,400
#28-Dept of Veterans Affairs
36 Shift operational support funds from Dept Admin to Vets Homes program Gen (373,671) (376,108) (376,108) (376,108) 36 Shift operational support funds from Dept Admin to Vets Homes program Cash (221,413) (222,858) (222,858) (222,858) 36 Shift operational support funds from Dept Admin to Vets Homes program Fed (349,418) (351,696) (351,696) (351,696) 36 Shift PSLfrom Dept Admin to Vets Homes program (PSL) PSL (711,934) (717,273) (717,273) (717,273)
519 Shift operational support funds from Dept Admin to Vets Homes program Gen 373,671 376,108 376,108 376,108 519 Shift operational support funds from Dept Admin to Vets Homes program Cash 221,413 222,858 222,858 222,858 519 Shift operational support funds from Dept Admin to Vets Homes program Fed 349,418 351,696 351,696 351,696 519 Shift PSLfrom Dept Admin to Vets Homes program (PSL) PSL 711,934 717,273 717,273 717,273 519 Health insurance savings Gen 0 (70,879) (70,879) (70,879) 519 Retrospective vacancy savings in FY 2017-18 Gen (87,000) 0 0 0
#29-Dept of Natural Resources
313 Reduce appropriation by 4% in FY19 (Water Sustainability Fund) Cash 0 (429,557) (429,557) (429,557)
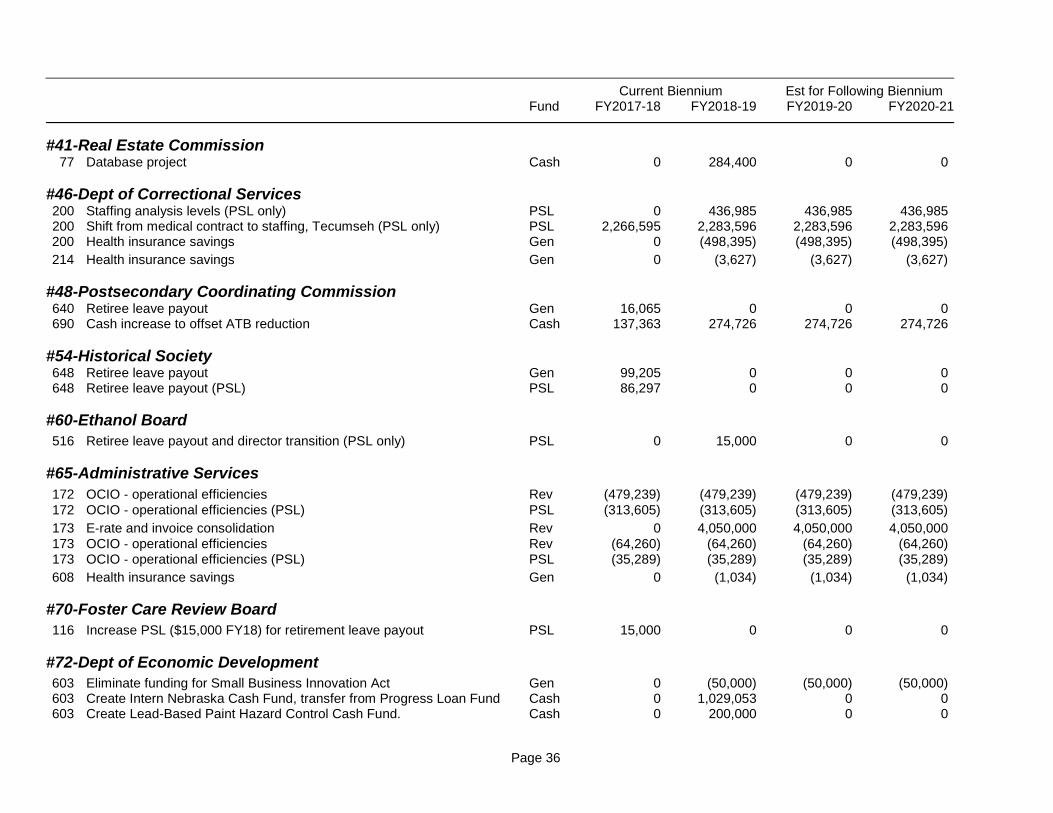
603 Eliminate funding for Small Business Innovation Act Gen 0 (50,000) (50,000) (50,000) 603 Create Intern Nebraska Cash Fund, transfer from Progress Loan Fund Cash 0 1,029,053 0 0 603 Create Lead-Based Paint Hazard Control Cash Fund. Cash 0 200,000 0 0
Page 37
Current Biennium Est for Following Biennium Fund FY2017-18 FY2018-19 FY2019-20 FY2020-21
#78-Crime Commission
198 Retiree leave payout (PSL only) PSL 29,882 0 0 0 199 Health insurance savings Gen 0 (1,775) (1,775) (1,775)
#81-Blind/Visually Impaired
357 Reduce federal fund, reduction in federal re-allotment Fed (76,232) (154,021) (154,021) (154,021) 357 Reduce federal fund, reduction in federal re-allotment Fed (16,707) (33,404) (33,404) (33,404)
#84-Dept of Environmental Quality
513 Eliminate funding for Superfund aid Gen (316,200) (316,200) (316,200) (316,200)
#85-Public Employees Retirement Board
41 Retiree leave payout (PSL) PSL 38,085 0 0 0
515 Statutory Contribution - School 2% Gen 0 1,149,954 1,149,954 1,149,954 515 Statutory Contribution - OPS service annuity Gen 0 243,169 243,169 243,169 515 Actuarially required contribution - Judges plan Gen 0 (311,387) (311,387) (311,387) 515 Actuarially required contribution - State Patrol plan Gen 0 (562,565) (562,565) (562,565)
430 Cash fund authority, rural practice loan repayment assistance Cash 125,000 150,000 0 0
Page 38
Current Biennium Est for Following Biennium Fund FY2017-18 FY2018-19 FY2019-20 FY2020-21
Capital Construction Projects
927 Lincoln Community Corrections project, lower than estimated project cost NCCF 0 (6,500,000) 0 0
929 State Penitentiary Dormitory project, use Community Corrections savings NCCF 0 5,800,000 0 0
922 State Capitol HVAC project, revised cash flow Gen 0 0 (4,000,000) (2,000,000) 922 State Capitol HVAC project, revised cash flow NCCF 0 15,695,519 (2,469,348) (2,794,586)
Across the Board Cuts
-- Across the Board Reductions - operations Gen (22,381,813) (16,409,877) (16,409,877) (16,409,877) -- Across the Board Reductions - state aid Gen (3,121,116) (3,183,134) (3,183,134) (3,183,134)
General Funds Gen (7,914,657) (7,120,564) (33,536,305) (30,241,876) Cash Funds Cash 2,273,811 3,311,154 721,479 721,479 Federal Funds Fed 2,632,061 (14,711,690) (14,711,690) (14,711,690) Revolving Funds Rev (543,499) 3,506,501 3,506,501 3,506,501 Nebraska Capital Construction Fund (NCCF) NCCF 0 14,995,519 (2,469,348) (2,469,348) __________ __________ __________ __________
Comm Colleges Aid to Community Colleges 100,828,308 100,324,166 (2,006,483) 98,317,683 99,329,166 (753,292) 98,575,874 (504,142) -0.5% (1,748,292) -1.7%
Total General Fund State Aid 2,808,792,134 2,806,074,350 18,463,904 2,824,538,254 2,840,565,879 10,519,873 2,851,085,752 (2,717,784) -0.1% 45,011,402 1.6%
Page 45
Appendix D
General Fund Across the Board Reductions-Committee
New Approp New Approp ATB Cut ATB Cut Ag # Ag Name Prog Prog Name FY2017-18 FY2018-19 FY2017-18 FY2018-19
Agency Operations 3 Legislative Council 1 Salaries-State Senators 632,982 632,982 0 0 3 Legislative Council 122 Legislative Services 9,704,478 9,842,839 (194,090) (196,857) 3 Legislative Council 123 Clerk of the Legislature 3,994,016 4,041,041 (79,880) (80,821) 3 Legislative Council 126 Legislative Research Services 694,143 704,179 (13,883) (14,083) 3 Legislative Council 127 Revisor of Statutes 1,426,047 1,443,179 (28,521) (28,863) 3 Legislative Council 129 Legislative Audit 688,666 698,095 (13,773) (13,962) 3 Legislative Council 501 Intergovernmental Cooperation 460,463 392,841 (9,209) (7,857) 3 Legislative Council 504 Office of Public Counsel 1,553,847 1,577,140 (31,077) (31,543) 3 Legislative Council 638 Fiscal and Program analysis 1,676,509 1,694,452 (33,530) (33,889)
9 Sec of State 9 Salary-Secretary of State 117,920 119,069 0 0 9 Sec of State 22 Departmental administration 272,933 270,199 (5,459) (5,404) 9 Sec of State 45 Election Administration 1,928,397 1,760,450 (38,568) (35,209) 9 Sec of State 86 Records management 156,829 158,743 (3,137) (3,175)
11 Attorney General 11 Salary-Attorney General 135,082 136,560 0 0 11 Attorney General 496 Water Litigation 0 0 0 0 11 Attorney General 507 Interpret & application of law 6,349,912 6,415,967 0 0
12 Treasurer 12 Salary-State Treasurer 125,591 127,183 0 0 12 Treasurer 24 State Disbursement Unit 1,126,230 1,133,456 (22,525) (22,669) 12 Treasurer 659 Long Term Care Savings Plan 33,275 0 0 0
13 Education 25 Departmental administration 15,843,982 15,964,868 (316,880) (319,297) 13 Education 351 Vocational rehabilitation 5,057,824 5,252,202 0 0 13 Education 401 Services for Deaf & Hard of Hearing 2,043,402 2,043,602 (40,868) (40,872) 13 Education 402 School for the Visually Impaired 2,018,631 2,018,824 (40,373) (40,376)
Page 46
New Approp New Approp ATB Cut ATB Cut Ag # Ag Name Prog Prog Name FY2017-18 FY2018-19 FY2017-18 FY2018-19
14 Public Service Com. 14 Salaries-PSC commissioners 490,438 493,800 0 0 14 Public Service Com. 16 Expenses-PSC commissioners 83,884 78,884 (1,678) (1,577) 14 Public Service Com. 54 Enf of stds-common carriers 1,765,840 1,791,988 (35,317) (35,840)
15 Parole Board 320 Parole Board salaries 570,787 577,500 0 0 15 Parole Board 358 Board of Parole 6,646,467 7,100,072 (132,929) (142,001)
18 Agriculture 78 Dept of Agriculture 5,662,109 5,723,024 (113,242) (114,460)
21 Fire Marshal 193 Protection of people and property 3,142,557 3,266,400 (62,851) (65,328) 21 Fire Marshal 340 Training Division 867,553 878,531 (17,351) (17,570) 21 Fire Marshal 845 Nebr Public Safety Communication System 136,669 113,198 (2,733) (2,264)
23 Labor 194 Protection of people and prope 636,886 634,675 (12,738) (12,693)
25 HHS System 32 Prescription Drug Cost Savings Act 0 0 0 0 25 HHS System 33 Administration 137,671,998 140,441,712 (2,255,374) (2,307,033) 25 HHS System 178 Bureau of Examining Boards 104,912 104,912 0 0 25 HHS System 179 Public Health Administration 0 0 0 0 25 HHS System 250 Juvenile Services 22,349,549 22,652,972 0 0 25 HHS System 353 Childrens Commission to #70 to #70 0 0 25 HHS System 359 Young adult voluntary services 1,784,760 1,787,085 0 0 25 HHS System 365 Mental Health/Regional Centers 56,904,953 57,996,887 0 0 25 HHS System 421 Developmental Disability/BSDC 16,484,233 16,674,185 0 0
31 Military Dept 544 Natl & state guard 2,973,885 2,995,363 (59,478) (59,907) 31 Military Dept 545 Civil defense & emerg planning 1,382,197 1,384,573 (27,644) (27,691)
32 Ed Lands & Funds 529 Land surveyors 380,603 345,999 0 0
33 Game and Parks 336 Wildlife conservation 1,356,375 1,372,680 0 0 33 Game and Parks 337 Administration 824,023 832,684 0 0 33 Game and Parks 549 Parks--admin & operations 6,790,396 6,851,295 0 0 33 Game and Parks 550 Planning and federal aid 455,817 460,713 0 0 33 Game and Parks 617 Engineering & area maintenance 2,084,613 2,109,951 (230,972) (232,865) 33 Game and Parks 846 Nebr Public Safety Communication System 37,384 16,029 0 0
50 State Colleges 48 Agency-wide 52,142,227 52,142,227 (1,042,845) (521,423)
51 University of Nebr. 515 Agency-wide 570,601,388 580,551,388 (11,412,028) (5,805,514)
Page 47
New Approp New Approp ATB Cut ATB Cut Ag # Ag Name Prog Prog Name FY2017-18 FY2018-19 FY2017-18 FY2018-19
54 Historical Society 553 Nebraska Sesquicentennial Commission 58,427 0 (1,169) 0 54 Historical Society 648 Historical Society 4,355,539 4,400,113 (87,111) (88,002)
64 State Patrol 100 Public protection 59,432,443 60,182,993 (1,188,649) (1,203,660) 64 State Patrol 630 Capital Security 252,435 252,435 (5,049) (5,048) 64 State Patrol 850 Nebr Public Safety Communication System 1,362,203 1,104,667 (27,244) (22,093)
68 Latino-American Comm 537 Latino American Commission 207,673 211,023 0 0
69 Arts Council 326 Promotion/development 595,401 590,041 (11,908) (11,801)
70 Foster Care Review 116 Foster care review 1,881,909 1,905,530 (37,638) 0 70 Foster Care Review 353 Childrens Commission 180,000 180,000 (3,600) (3,600)
72 Economic Development 601 Community Affairs 261,434 264,686 (5,229) (5,293) 72 Economic Development 603 Industry Recruitment 4,631,985 4,684,709 (92,640) (93,694)
76 Indian Affairs 584 Commission on Indian Affairs 225,825 230,128 0 0
25 HHS System 38 Behavioral Health Aid 72,243,240 72,243,240 0 0 25 HHS System 175 Medical student assistance/RHOP 709,086 709,086 (14,182) (28,363) 25 HHS System 344 Children's Health Insurance (SCHIP) 6,163,940 6,208,871 0 0 25 HHS System 347 Public Assistance 104,794,067 104,794,067 0 0 25 HHS System 348 Medicaid 833,065,260 836,840,033 0 0 25 HHS System 354 Child Welfare aid 166,067,300 166,067,300 0 0 25 HHS System 424 Developmental disabilities aid 149,225,944 148,089,366 0 0 25 HHS System 502 Community health centers 5,783,060 5,783,060 0 0 25 HHS System 514 Health Aid 6,192,491 6,192,491 0 0 25 HHS System 559 Care Management 2,315,560 2,315,560 0 0 25 HHS System 571 Area agencies on aging 8,134,141 8,134,141 0 0
29 Nat Resources 304 Nebr Water Conservation Fund 1,881,367 1,881,367 (37,627) (75,255) 29 Nat Resources 307 Resources Development Fund 3,140,325 3,140,325 (62,807) (125,613)
31 Military Dept 192 Governors Emergency Program 0 0 0 0 31 Military Dept 548 Guard tuition assistance 608,775 608,775 (12,176) (24,351)
33 Game & Parks 338 Niobrara Council 42,011 42,011 0 0
34 Library Comm 302 Local libraries 1,295,085 1,295,085 (25,902) (51,803)
46 Corrections 200 Vocational and Life Skills Program 3,500,000 3,500,000 0 0 46 Corrections 750 County jail cost reimbursement 0 0 0 0
48 Coord. Comm 690 Nebr Opportunity Grant Program 6,868,156 6,868,156 (137,363) (274,726) 48 Coord. Comm 691 Access College Early Scholarship 985,000 985,000 (19,700) (39,400)
69 Arts Council 327 Aid to arts programs 943,069 943,069 (18,861) (37,723)
72 Econ Develop 601 State aid to development districts 500,000 500,000 0 (30,000) 72 Econ Develop 603 Business Innovation Act 6,271,200 6,271,200 (125,424) (250,848) 72 Econ Develop 603 Grow Nebraska 50,000 50,000 0 0
Page 49
New Approp New Approp ATB Cut ATB Cut Ag # Ag Name Prog Prog Name FY2017-18 FY2018-19 FY2017-18 FY2018-19
78 Crime Comm 150 Juvenile services grants 587,812 587,812 (11,756) (23,512) 78 Crime Comm 155 Community Based Juvenile Services aid 6,300,000 6,300,000 (126,000) (252,000) 78 Crime Comm 198 Crimestoppers program 13,457 13,457 (269) (538) 78 Crime Comm 198 County Justice Reinvestment Grants 500,000 500,000 (10,000) (20,000) 78 Crime Comm 201 Victim Witness assistance 52,559 52,559 (1,051) (2,102) 78 Crime Comm 202 Crime Victims reparations 20,000 20,000 (400) (800) 78 Crime Comm 204 Violence Prevention Grants 350,000 350,000 (7,000) (14,000)
83 Comm Colleges 151 Aid to Community Colleges 100,324,166 99,329,166 (2,006,483) (753,292)
84 Environ Cntrl 513 Superfund cleanup 316,200 316,200 0 0 84 Environ Cntrl 513 Storm Water Management grants 0 0 0 0
91 Tourism 618 Tourism grant program 0 0 0 0
Capital Construction Total 21,739,000 21,739,000 0 0 _________ _________ _________ _________
General Fund Total l 4,398,012,616 4,463,415,777 (25,502,929) (19,593,011) Operations 1,570,199,266 1,601,110,898 (22,381,813) (16,409,877) Aid to Individuals & Other 1,378,600,757 1,381,324,073 (399,955) (829,909) Aid to Local Government 1,427,473,593 1,459,241,806 (2,721,161) (2,353,225) Capital Construction 21,739,000 21,739,000 0 0 _________ _________ _________ _________
State Total 4,398,012,616 4,463,415,777 (25,502,929) (19,593,011)
Page 50
Appendix E
General Fund Spending Assumptions - Following Biennium
For the “following biennium” (FY2019-20 and FY2020-21), the budget numbers reflect the annualized impact
of the 2017 budget actions plus an estimate of future year increases in entitlement programs, salary and
health insurance increases, and other funding requirements that are normally not optional. It is an estimate
based on “current law”, i.e. an estimate of future obligations with no change to the underlying law.
Amounts shown in this section do not reflect budget actions that might take place during the 2018 session
including revised TEEOSA school aid estimates. The on-going impact of the 2018 items into FY20 and FY21
are shown with those individual items.
Table 14 Projected Budget Increases-Following Biennium (includes on-going impact of 2017 budget actions, excludes impact of any potential 2018 changes)
Annual % Change Projected Increases Dollar Changes from FY19 Base Year FY20 FY21 2 Yr Avg FY2019-20 FY2020-21
FY2018-19 Base Appropriation 4,463,415,777 4,463,415,777
Aid to K-12 Schools (TEEOSA GF only) 9.4% 7.1% 8.2% 93,270,362 171,026,596
Special Education 2.5% 2.5% 2.5% 5,663,165 11,467,908
Community Colleges 3.5% 3.5% 3.5% 3,476,521 7,074,720