33
1 Mid Day Meal Scheme Ministry of HRD Government of India MDM-PAB Meeting – Manipur on 30.04.2009
| Date post: | 03-Jan-2016 |
| Category: |
Documents |
| Upload: | ivan-russell |
| View: | 20 times |
| Download: | 0 times |

11
Mid Day Meal SchemeMinistry of HRD
Government of IndiaMDM-PAB Meeting – Manipuron 30.04.2009

2
Review of Implementation of MDMS in MANIPUR
(Primary + Upper Primary)(1.4.2008 to 31.12.2008)
Part-I
Ministry of HRD, Govt. of India
3
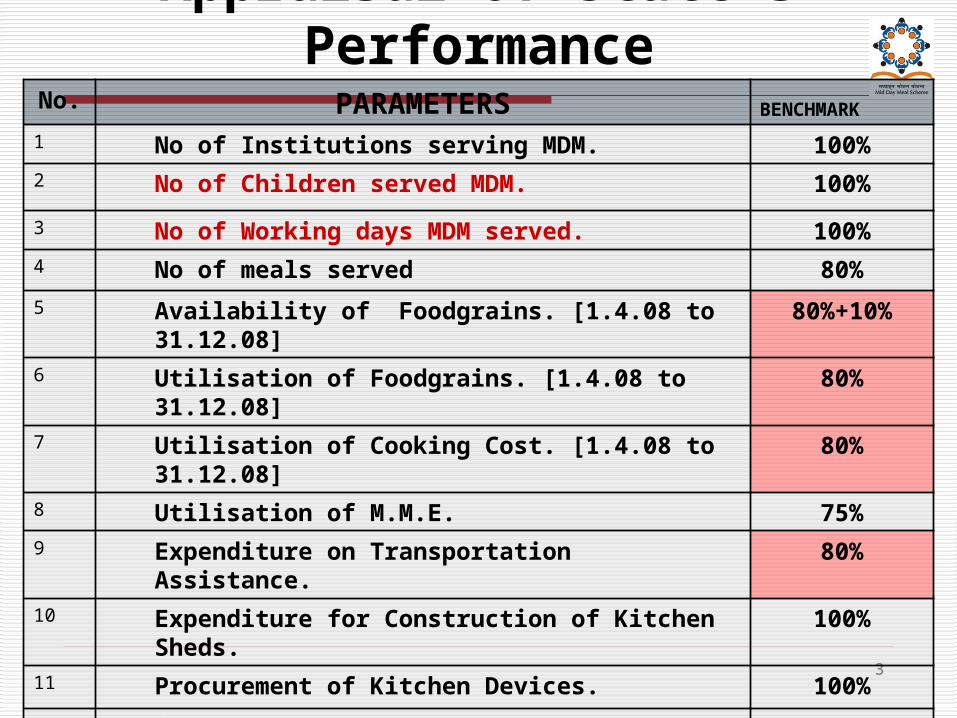
Appraisal of State’s Performance
No. PARAMETERS BENCHMARK
1 No of Institutions serving MDM. 100%2 No of Children served MDM. 100%3 No of Working days MDM served. 100%4 No of meals served 80%5 Availability of Foodgrains. [1.4.08 to 31.12.08] 80%+10%6 Utilisation of Foodgrains. [1.4.08 to 31.12.08] 80%7 Utilisation of Cooking Cost. [1.4.08 to
31.12.08]80%
8 Utilisation of M.M.E. 75%9 Expenditure on Transportation Assistance. 80%10 Expenditure for Construction of Kitchen Sheds. 100%11 Procurement of Kitchen Devices. 100%12 QPRs 03

4
No. of Schools Covered (PY + UP.PY) 5555
1679
38763408
465
2943
0
1000
2000
3000
4000
5000
6000
P rim ary Upper P rim ary T otal (P Y + U P Y )
No. of Ins titutes No. of Ins titutes s erv ing MDM
76% covered
28% covered
61% covered
MDM meal is served only in such upper primary schools which are attached with primary schools.

NON-COVERAGE (24%): Primary Schools
Ministry of HRD, Govt. of India
Sl. No.
Districts No. of Institutio
ns
No. of Institution
serving MDM
NON-COVERAGENo. %
1 Thoubal 393 343 50 13%2 Imphal
(W) 452 380 72 16%3 Bishnupur 285 239 46 16%4 Senapati 587 474 113 19%5 Imphal(E) 517 395 122 24%6 Tamenglon
g 316 241 75 24%7 Ukhrul 391 287 104 27%8 Ccpur 530 360 170 32%9 Chandel 405 224 181 45%
TOTAL 3876 2943 933 24%

NON-COVERAGE (72%): Upper primary Schools
Ministry of HRD, Govt. of India
Sl. Districts No. of Institutio
ns
No. of Institution
serving MDM
NON-COVERAGENo. %
1 Ccpur 168 73 95 57%2 Senapati 174 73 101 58%3 Bishnupur 158 54 104 66%4 Tamenglong 125 41 84 67%5 Ukhrul 215 56 159 74%6 Chandel 106 25 81 76%7 Thoubal 163 35 128 79%8 Imphal(W) 297 58 239 80%9 Imphal(E) 273 50 223 82%
TOTAL 1679 465 1214 72%

7
PAB Approval Vs State Performance (No. of children in
Q1+Q2+Q3)
300466
66080
234386 227691
33658
194033
0
50000
100000
150000
200000
250000
300000
350000
P rim ary Upper P rim ary T otal (P Y + U P Y )
As per P AB Approv al As per S tate (Ac tuals )
Ministry of HRD, Govt. of India
83% Covered
51% Covered
76% Covered
-72,775 =24% NON-COVERAGE

17 % of Children not covered under MDM (Primary)
Sl. No.
Districts Target as per MDM-PAB
Approval for 2008-09
Average No. of children availing
MDM as on 31.12.2008
DifferenceNo. of
children not
availing MDM
%
LOW1 Senapati 42669 18307 -24362 -57%2 Imphal (W) 21850 16748 -5102 -23%3 Ccpur 21504 17290 -4214 -20%4 Chandel 17975 14630 -3345 -19%
MDM-PAB Approval (Target) Vs Average no. of Children Availed MDM (Achievement)
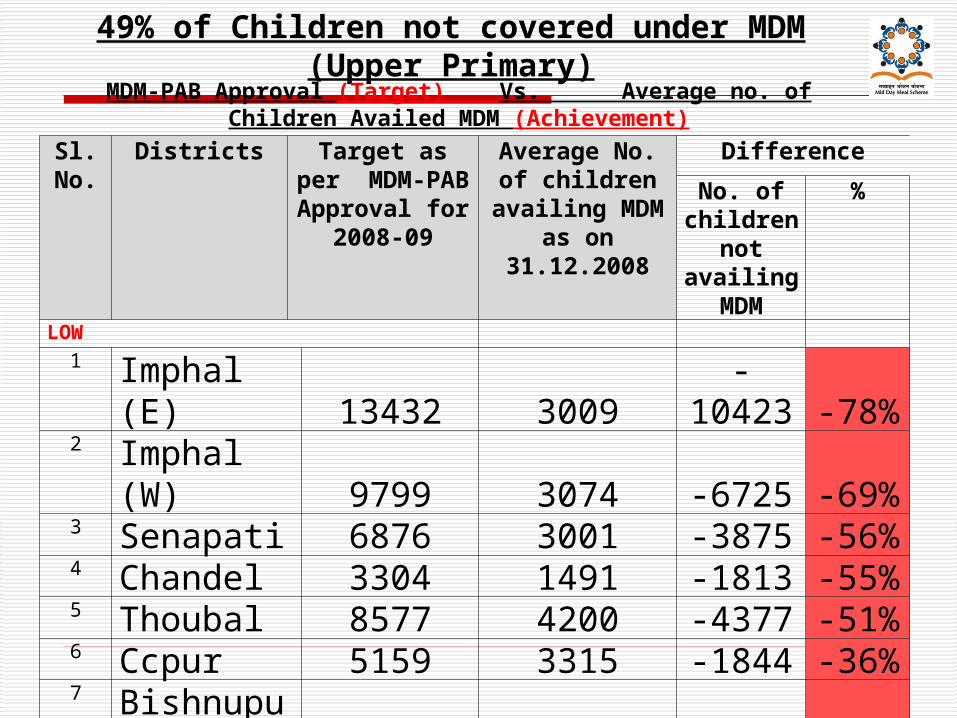
49% of Children not covered under MDM (Upper Primary)
Sl. No.
Districts Target as per MDM-PAB
Approval for 2008-09
Average No. of children availing
MDM as on 31.12.2008
Difference
No. of children
not availing MDM
%
LOW
1 Imphal (E) 13432 3009 -10423 -78%2 Imphal (W) 9799 3074 -6725 -69%3 Senapati 6876 3001 -3875 -56%4 Chandel 3304 1491 -1813 -55%5 Thoubal 8577 4200 -4377 -51%6 Ccpur 5159 3315 -1844 -36%7 Bishnupur 6373 4276 -2097 -33%
MDM-PAB Approval (Target) Vs. Average no. of Children Availed MDM (Achievement)

10
PAB Approval Vs State Performance (No. of Working Days in
Q1+Q2+Q3)
88
168
210
0
50
100
150
200
250
PAB Approval for FY-2008-09
PAB Approval for Q1,Q2, Q3
As per State (Actuals) Q1,Q2, Q3
Ministry of HRD, Govt. of India
80% 42%100%

11
PAB Approval Vs State Performance
(No. of Meals in Q1+Q2+Q3)
2.00
5.05
6.31
0.00
1.00
2.00
3.00
4.00
5.00
6.00
7.00
As per P AB Approv alfor F Y-2008-09
As per P ABApprov al(Q1+Q2+Q3)
As per S tate(Q1+Q2+Q3)
meals served
meals to be served
100%
Benchmark 80 %
80%31%
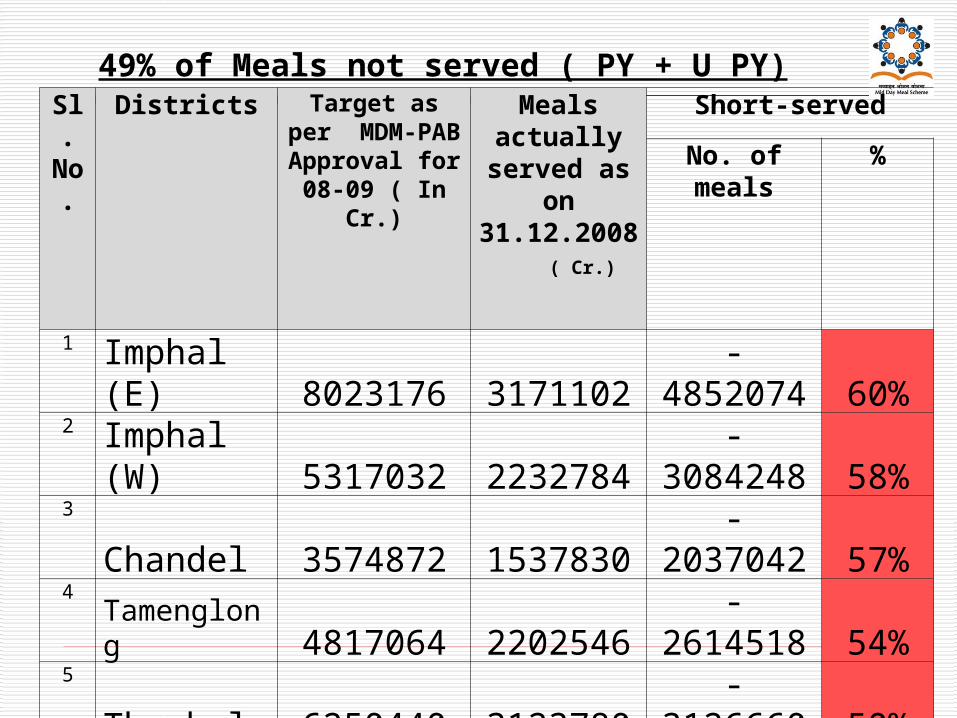
49% of Meals not served ( PY + U PY)Sl.
No.Districts Target as per
MDM-PAB Approval for 08-
09 ( In Cr.)
Meals actually served as on 31.12.2008
( Cr.)
Short-servedNo. of meals %
1
Imphal (E) 8023176 3171102-
4852074 60%2 Imphal
(W) 5317032 2232784-
3084248 58%3
Chandel 3574872 1537830-
2037042 57%4
Tamenglong 4817064 2202546-
2614518 54%5
Thoubal 6250440 3123780-
3126660 50%6
Ccpur 4479384 2247895-
2231489 50%7
Bishnupur 4123224 2155300-
1967924 48%8
Senapati 8323560 4520817-
3802743 46%9
Ukhrul 5569536 3647195-
1922341 35%
13
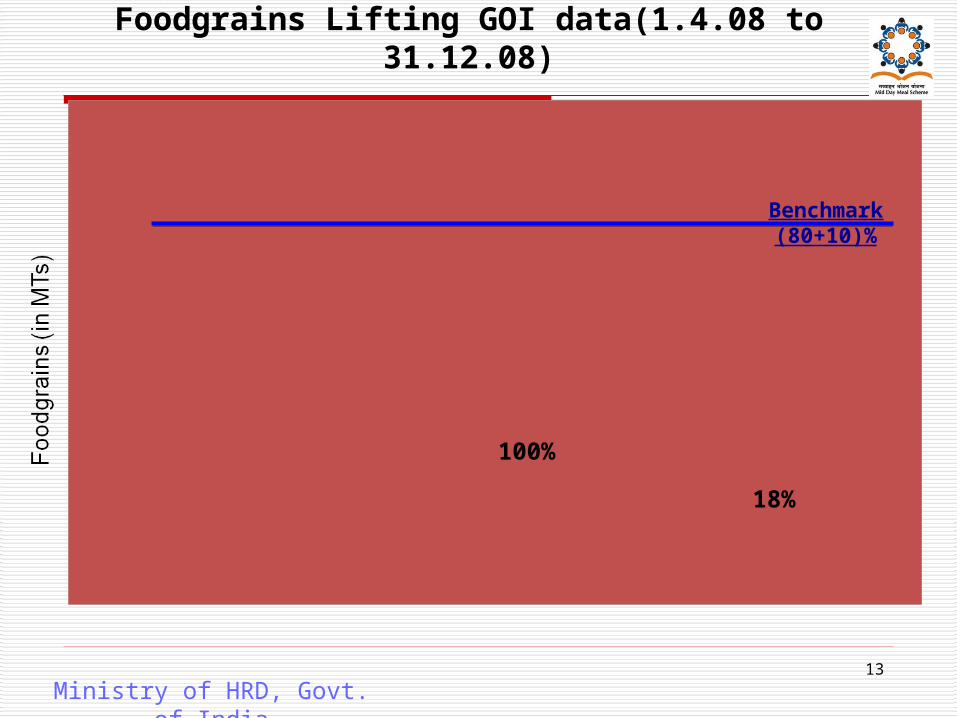
Foodgrains Lifting GOI data(1.4.08 to 31.12.08)
1281
427
7004
0
1000
2000
3000
4000
5000
6000
7000
8000
O pening balance(01-04-2008)
Allocation( as perrequirement)/P AB
L ifting B y thestate(Q 1+Q 2+Q 3)
100%
Ministry of HRD, Govt. of India
18%
Benchmark (80+10)%

14
Foodgrains Lifting AWP&B data (1.4.08 to 31.12.08)
2292
307
6576
0
1000
2000
3000
4000
5000
6000
7000
O pening balance(01-04-2008)
Allocation( as perrequirement)/P AB
L ifting B y thestate(Q 1+Q 2+Q 3)
100%
Ministry of HRD, Govt. of India
35%
Benchmark (80+10)%

15
Food grains lifting Month-wise cumulative (Including USB*)
427 427 427802
12511708 1708 1708 1708
5841167
17512335
29183502
40854669
5253
0
1000
2000
3000
4000
5000
6000
Apr* May J un J ul Aug S ep Oct Nov D ec
C um Ac tual lifting C um Ideal lifting
Ministry of HRD, Govt. of India
Including unspent balance of 427 MTs as on 31.3.2008

16
Foodgrains Utilisation (Q1+Q2+Q3)
2599
7004
1711
0
1000
2000
3000
4000
5000
6000
7000
8000
Allocation( as perrequirement)
Availability(US B +L ifted) Utilis ation(Q1+Q2+Q3)
37%
Ministry of HRD, Govt. of India
100%
Benchmark 80%
24%

17
Cooking Cost Utilisation(1.4.2008 to 31.12.2008)
2094.382432.00
337.62
0.00
500.00
1000.00
1500.00
2000.00
2500.00
3000.00
Allocation( as perrequirement)
Utilisation(Q 1+Q 2+Q 3) Un-utilized
Co
oki
ng
Co
st (
In L
akh
s)
14%
Ministry of HRD, Govt. of India
86%100%
Benchmark 80%

18
Mismatch of Utilisation-AWP&B 09-10No of meals served, Foodgrains, Cooking Cost
(Q1+Q2+Q3)
37%
14%
49%
0%
10%
20%
30%
40%
50%
60%
1Meals F ood G rains C ooking C ost
Ministry of HRD, Govt. of India
Benchmark 80%

19
Mismatch in Utilisation of Foodgrains and Cooking cost (District-wise)
42%
49%
14% 16%
0%
10%
20%
30%
40%
50%
60%
Ukhrul S enapati
F oodgrains C ooking C ost
Ministry of HRD, Govt. of India
All districts are having low utilisation for cooking cost ranging from 18% to 35%.
35% 26%
Benchmark 80%

20
MME Utilisation (1.4.08 to 31.12.08)
5.93
31.28
25.35
0.00
5.00
10.00
15.00
20.00
25.00
30.00
35.00
Allocation E xpenditure Unspent B alance
MM
E (
In L
akh
s)
Ministry of HRD, Govt. of India
100% 81% 19%

21
Transport Assistance Utilisation (1.4.08 to 31.12.08)
87.53
0.00
10.00
20.00
30.00
40.00
50.00
60.00
70.00
80.00
90.00
100.00
Allocation( as perrequirement)
E xpenditure(Q 1+Q 2+Q 3) Unspent B alance
Tra
nsp
ort
Ass
ista
nce
(In
Lak
hs)
Ministry of HRD, Govt. of India
100%
DATA NOT PROVIDED

22
Achievement during 2008-09 (Kitchen Sheds)
704
1174
P hys ical (units ) F inancial (L akhs)
Allocated Achievement(C )
Ministry of HRD, Govt. of India
DA
TA
NO
T
PR
OV
IDE
D
DA
TA
NO
T
PR
OV
IDE
D

23
Achievement during 2008-09 (Kitchen Devices)
73
1457
73
P hys ical (units ) F inancial (L akhs)
Allocated Achievement (C )
Ministry of HRD, Govt. of India
100%
DA
TA
NO
T
PR
OV
IDE
D

24
Performance Score card – A Summary
Sl Component Achievement
Benchmark
1. No of Schools covered 61% 100%
2. No of Children covered 76% 100%
3. No of Working Days 42% 80%
4. No of meals served 49% 80%
5. Foodgrains Availability 24% 90%
6. Foodgrains Utilisation 37% 80%
7. Cooking Cost Utilisation 14% 80%
8. MME Utilisation 81% 75%
9. Transport Assistance NA 80%
10. Kitchen Shed construction
NA 100%
11. Kitchen Devices procurement
NA 100%
12. QPRs 02 nos. 3 nos.

25
ISSUES
.
QPR FOR 3RD QUARTER YET TO BE RECEIVED.
DATA FOR TRANSPORT ASSISTANCE YET TO BE RECEIVED FOR ENTIRE YEAR.
DATA ON CONTRUCTION OF KITCHEN SHEDS YET TO BE RECEIVED FOR ENTIRE YEAR.
STATE GOVT. IS YET TO CONFIRM THE LIFTING OF FOOD GRAINS BY THE F.C.I. FOR AUG. SEP 2008 FOR PRIMARY & UPPER PRIMARY. --- THIS IS DELAYING PAYMENT TO F.C.I.
ACTUAL CONSUMPTION OF COOKING COST FOR UPPER PRIMARY IS YET TO BE RECEIVED. AT-9A(5).
MDM IS NOT SERVED IN SCHOOLS WHICH ARE EXCLUSIVELY FOR UPPER PRIMARY.

26
VIEWS OF MDM DIVISION ON THE OBSERVATIONS OF MI
.
THE MONITORING INSTITUTION (MANIPUR UNIV.)HAVE NOT GIVEN THE REPORT AS PER TERM OF REFERENCES. ALTHOUGH THIS WAS MENTIONED TO THEM IN AUG 2008.
THE MONITORING INSTITUTES ARE REQUIRE TO GIVE THEIR VIEWS IN RESPECT OF 25 POINTS BUT THE REPORTS DO NOT COVER THESE POINTS.
THE REPORT FOR THE PERIOD 01-AUG-08 TO 31-MAR-09 THOUGHT SHORT, IS ALARMING.
MDM IS NOT SERVED DAILY IN SENAPATI & UKHRUL DISTRICTS. IT IS ONLY SERVED FOR 4-5 TIMES IN A YEAR.
IN TAMENGLONG DISTRICT, MDM IS IMPLEMENTED AS PER THE SUPPLY OF GOVT. OF INDIA.

27
Analysis of State’s Proposal
for 2009-10
Ministry of HRD, Govt. of India

28
Time Series
2.43
2.71
2.02 1.94
2.492.33
0
1
1
2
2
3
3
Population MDM Enrolment Availing MDM
2007-08 2008-09
Ministry of HRD, Govt. of India
04%
04%08%

No of Children (PRIMARY)
2.332.49
1.94
2.34
2.012.21
Ministry of HRD, Govt. of India
PO
PU
LA
TIO
N (
08-
09)
EN
RO
LM
EN
T (
08-0
9)
A
VA
ILIN
G (
08-0
9)
D
EM
AN
D (
09-1
0)*
SS
A (
07-0
8)
P
AB
200
8-09
*IT INCLUDES EGS/AIE CENTERS.THESE ARE NOT INCLUDED IN
FIGURE AVAILING MDM (08-09).

30
No of Children (UPPER PRIMARY)
1.55
0.66
0.34
0.66
0.44
0.66
Ministry of HRD, Govt. of India
PO
PU
LA
TIO
N
EN
RO
LM
EN
T
AV
AIL
ING
DE
MA
ND
SS
A
PA
B 0
8-0
9

31
No. of School days
No Source of Data No of Days
1 DISE/SSA data (07-08) 202
2 DISE/SSA data (08-09) 203
3 MDM approval (08-09) 210
4 Benchmark (Q1+Q2+Q3) 168
5 AVG.Performance(Q1+Q2+Q3) 88
6 State Demand ( 2009-10) 220

32
PAB’s Recommendations (2009-10)
No Details As per State Plan (Table No.16/16-A)
PAB approval for 2008-09
1 Children availing MDM Primary 2,21,219 2,34,386 Upper Primary 66,046 66,080 TOTAL (B) 2,87,265 3,00,466 2 Working Days Primary 220 210 Upper Primary 220 210

33
Thank You
Ministry of HRD, Govt. of India
