Mid-Term Review Winter 2010 For questions 1-3, fill out the information in the following chart. Picture Name Characteristics Spiral We live in a spiral galaxy. The arms come out and spiral around. Contains lots of gas and dust and new stars. Elliptical Has little gas and dust-contains mainly old stars; shaped like a pancake. Irregular Does not have any shape. 4. Define Star- A huge glowing ball of gas undergoing nuclear fusion 5. Define Universe- Space and everything in it. 6. What are galaxies made of? Stars 7. What galaxy do we live in? Milky Way 8. Place in order from largest to smallest: Galaxy, Universe, Solar System Universe, Galaxy, and Solar System.
Transcript
Mid-Term Review Winter 2010
For questions 1-3, fill out the information in the following chart.
Picture Name Characteristics
Spiral We live in a spiral
galaxy. The arms
come out and spiral
around. Contains
lots of gas and dust
and new stars.
Elliptical Has little gas and
dust-contains mainly
old stars; shaped
like a pancake.
Irregular Does not have any
shape.
4. Define Star- A huge glowing ball of gas undergoing nuclear fusion
5. Define Universe- Space and everything in it.
6. What are galaxies made of? Stars
7. What galaxy do we live in? Milky Way
8. Place in order from largest to smallest: Galaxy, Universe, Solar System Universe, Galaxy, and Solar
System.
9. Using the following words, create a flowchart illustrating the life cycle of a small/medium and a large/
super massive star. Black Dwarf, Red Giant, Neutron Star, White Dwarf, Super giant, Black Hole,
Supernova, Main Sequence, and Protostar.
10. What is the determining factor for a star’s pathway?
11. Scientists use the Hertzsprung-Russell diagram as a tool to help classify stars in our solar system.
What characteristics do scientists use to classify stars? Brightness, temperature, and color
12.How would a scientist classify the star Deneb
compared to our sun? Deneb is brighter,
hotter, and white.
13. Name a red, main sequence on the H-R
diagrams. Barnard’s Star
Nebula
Protostar
Main
Sequence Red Giant
White
dwarf
Black
dwarf
Black hole
Neutron
star
Supernova
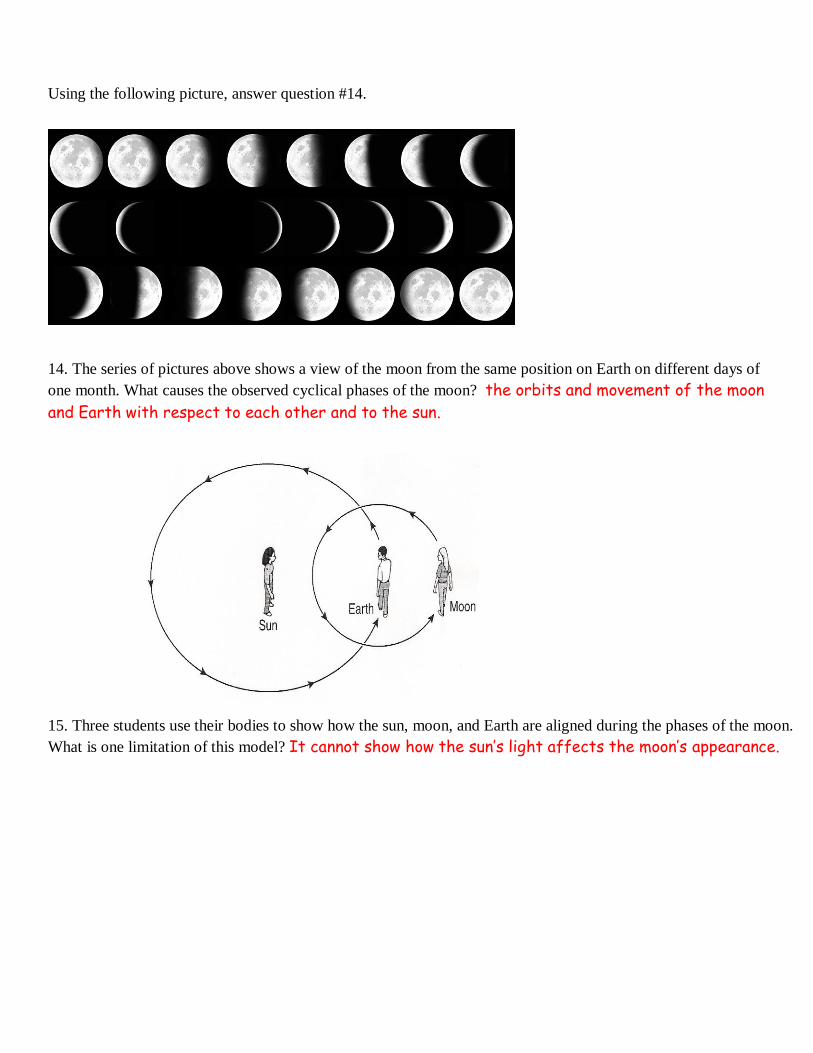
Using the following picture, answer question #14.
14. The series of pictures above shows a view of the moon from the same position on Earth on different days of
one month. What causes the observed cyclical phases of the moon? the orbits and movement of the moon
and Earth with respect to each other and to the sun.
15. Three students use their bodies to show how the sun, moon, and Earth are aligned during the phases of the moon.
What is one limitation of this model? It cannot show how the sun’s light affects the moon’s appearance.
16. Using the diagram below (on left), Fill in a name and letter of the appropriate placement on the diagram of
the moon phase at each appropriate phase. They are not in order.
17. How long does it take the moon
to go through its cycle of phases? About one
month
18. How long does it take to get from point
A to E? about two weeks.
19. The gradual change in the length of
your shadow over the course of the day
is caused by…? The rotation of the Earth
around it’s axis.
20. The fact that Earth’s axis is tilted 23.5o is responsible for……? Earth’s seasons.
21. What causes the change from day to night on Earth? The Earth’s rotation around it’s axis.
22. How long does it take for the Earth to orbit the sun? One year
23. When the north end of Earth’s axis is tilted toward the sun, North America will experience? Summer .
Earth
G
C
E A
H F
D B
Sun
Letter Name of Moon Phase Picture of Moon Phase
A New moon
E Full moon
B Waxing Crescent
F Waning Gibbous
C First quarter
G Third Quarter
D Waxing Gibbous
H Waning Crescent
24. Using the above diagram, which letter(s),illustrates the position of the Earth, Moon, and Sun during a SPRING
tide? B
25, Using the above diagram, which letter(s), illustrates the position of the Earth, Moon, and Sun during a NEAP
tide? A
26. Fill in the name of the season for each position.
Letter Name of Season (Northern
Hemisphere)
Name of Season (Southern
Hemisphere)
A Winter Summer B Spring Fall C Summer Winter D Fall Spring
27. Which motion do the arrows in the diagram represent? The Earth’s revolution causing seasons
28. Fill in the chart regarding Physical and Chemical Weathering.
Type of Weathering Definition What causes it? Give specific examples.
Physical The breaking down of rock without
any change to what the rock is
made of. Sometimes called
mechanical weathering.
Freezing/thawing
Plant roots
Animals digging
Wind
Running water Chemical The breaking down of rock by
changing what it is made of.
Rusting (oxidation)
Rain (hydrolysis)
Salt decay
29. As a river enters a larger body of water, sediments are deposited over a wide area. Which of these
landforms is likely to be formed at the site of deposition? Deltas
30. Over the past summer Ms. Turner discovered a new tropical island in the South Pacific. When the
Australian government heard of Ms. Turner’s discovery, they immediately sent 1,000 people to build houses
along the beautiful ocean front. What is the most probable effect that the building of homes along the sea shore
will have on the beaches of Turner Island? Beach erosion will increase.
31. This diagram shows three stages in the formation of a beach.
Which process is mostly responsible for the breaking down of the rock cliff into sand-sized sediment?
Weathering
32. Define erosion- The carrying of sediments away.
33. Define weathering- The breaking up of rock.
34.
35. A wall of rocks is built seaward from a popular Texas beach to reduce erosion along the stretch of beach.
The illustration shows the direction of the long shore drift.
Based on the illustration, predict what the beach will look like in several years as a result of the
construction of the rock wall. D
Four identical sand castles are shown to the left. Which
sand castle will most likely be eroded fastest by the wind?
C, there is no rock to block the sand castle and
the wind is blowing harder.
37. In the diagram to the left, What landform is at point A?
Mountain
38. In the diagram to the left, what landform is at point B?
Valley
39. Which earth-changing process is responsible for most
mountain building? plate tectonic movement
40. The Mississippi River Delta is a large, fertile, fan shaped landform located at the mouth of the Mississippi
River where the moving waters of the river meet the calmer waters of the Gulf of Mexico. The
Mississippi River Delta is an example of a landform created by…..? Regional erosional deposition
41. How can hurricanes be helpful? They transport excess heat out of the tropics as they move pole
ward into higher latitudes.
42. Where do hurricanes form? In the ocean.
43. What does a hurricane need to keep it going? Warm ocean water.
44. The sun is the Earth’s main source of energy. Solar energy is absorbed by the ocean and the continents. Which
absorb more of the sun’s energy and why? The oceans absorb more because they are cooler than land.
36. What type of topographic feature is in
the diagram to the left? Mountain
Use the diagram below to answer questions 45 and 46.
45. Which map view best represents the topography of this region? A
46. Which of the following describes how this landscape would change due to repeated flooding?
a. The hills will decrease in height and the river will change course.
b. The hills will increase in height and the river will dry up.
c. The hills will increase in height and the river will remain the same.
d. The hills will decrease in height and the river will widen.
47. What does the map with the
currents show?
Along the west coasts of the
continents, the currents flow toward
the equator in both hemispheres. Along
the east coasts of the continents, the
currents flow from the equator toward
the poles.
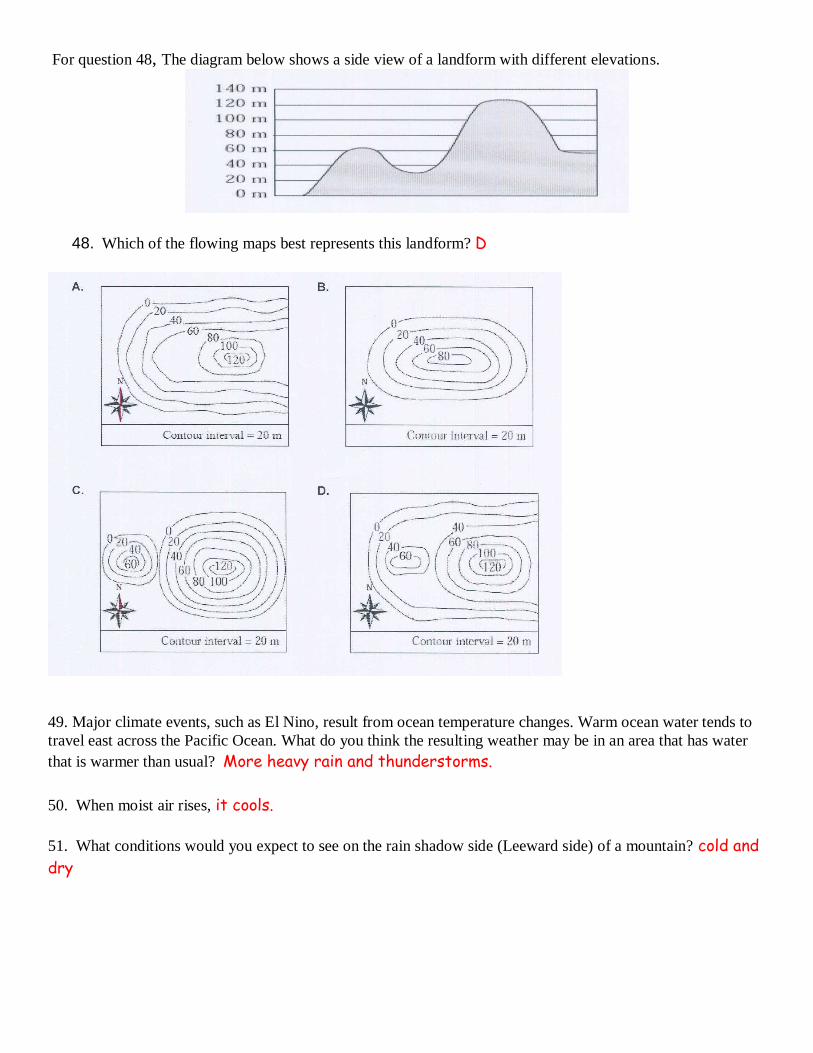
For question 48, The diagram below shows a side view of a landform with different elevations.
48. Which of the flowing maps best represents this landform? D
49. Major climate events, such as El Nino, result from ocean temperature changes. Warm ocean water tends to
travel east across the Pacific Ocean. What do you think the resulting weather may be in an area that has water
that is warmer than usual? More heavy rain and thunderstorms.
50. When moist air rises, it cools.
51. What conditions would you expect to see on the rain shadow side (Leeward side) of a mountain? cold and
dry
52. Look at the map below. Why is Norway, at 60º N latitude, far warmer than southern Greenland and northern
Labrador which are at the same latitude? The Gulf Steam Current and the North Atlantic Drift
Current carry heat to warm Europe.
53. How does elevation affect temperature? increased elevation produces lower temperatures
54. The water cycle is driven by energy from an external source—the Sun. What does the Sun’s energy do to
water in the water cycle? It causes water to evaporate.
55. Most scientists agree that an increase in the amount of greenhouse gases entering Earth’s atmosphere
causes-? an increase in melting of polar ice caps
56. Heat energy from the lower latitudes is transferred to colder Earth regions by planetary wind circulation
mainly through the process of ..? convection currents
57.Air pressure is usually highest when the air is …? cool and humid
58. What would most likely cause a hurricane to decrease in strength? It moving over a continent.
59. As you sit on the beach, you notice that the breeze, which had been blowing toward the water from the land,
shifts so that it is blowing off the water toward land. What event has just occurred? The temperature over
the land has become higher than the temperature over the water.
Greenland
Norway
Labrador
Weather data is normally recorded at positions A, B, C, and D on the weather station model shown below.
60. At which position should the measurements from a rain gauge be recorded? B
61. The map below shows four coastal locations labeled A, B, C, and D.
62. The climate of which location is warmed by a nearby major ocean current? Point C, Gulf Stream
Current goes up past the eastern side of the United States and across the Atlantic
Ocean towards Europe.
63. Which point on the map of the globe is most likely to be in the path of a hurricane? Point R, because
hurricanes start around the equator in warm water.
Examine the drawing below.
64. What causes surface winds to blow from the ocean towards land? Energy from the sun heats land
more rapidly than the ocean, causing a pressure difference that creates wind movement.
65. A group of students in Dallas is assigned to gather weather data for the entire month of October to
investigate the relationship between cold fronts and precipitation. The students are allowed to use any available
laboratory equipment to make their measurements. What is the first step the students should take in preparation
for the laboratory activity? Decide which data is needed to conduct the activity.
66. The table below gives air temperature data over land and over the sea for six successive hours labeled A
through F. What weather event is occurring around time D? The breeze is switching from a sea breeze
to a land breeze. Remember the breeze is over the section that the temperature is lower.
Time Land (oF) Sea (
oF)
Time A 73.1 70.0
Time B 71.4 69.7
Time C 69.7 69.4
Time D 68.1 69.2
Time E 66.4 69.0
Time F 64.7 68.8
67. At 3:15 one afternoon, the temperature over the land reaches its highest value for the day, about 89 oF.
The temperature over the adjacent water is about 72 oF. What would the expected weather conditions be at this
time? Cloudy skies and a sea breeze
68. In the northern hemisphere, how do the winds of a hurricane rotate? In a counterclockwise
direction.
69. A hurricane is approaching the coast. According to the weather station data shown below, which of the
weather stations is closest to the hurricane? Station C.
70. In the northern hemisphere, how do the winds of a hurricane rotate? In a counterclockwise
direction.
71. The symbol shown below is from a northern hemisphere weather station that is fairly close to a
hurricane. North is toward the top of the image. Where is the eye of the hurricane, relative to this weather
station? The eye is north of the weather station.
72. What does the symbol shown below tell you about the weather at City A?
Clear skies, with strong winds (30 miles/hour) from the southeast
73. A weather station is located 500 km directly east of a second station. Winds at the eastern station are
blowing from the south. Winds at the western station are blowing from the north. What is true about the
weather system near these two locations? A low pressure system is location between the two
stations.
74. Which of the following statements best describes the weather conditions at positions A and B shown
below? It is warmer at position A than at position B. This is because the round half circles
(which represent a cold front) are pointed toward position B.
Use the following scenario to answer questions 75-83
Hypothesis – Billy Jo has had some terrible headaches lately. He decided to go to the doctor and they
decided to put him in a drug trial for an experimental medication. He showed up to the trial and was placed
in group A. There were two more groups (B and C) besides his. Group A was given a yellow pill. Group B
was given a blue pill and group C was given a white one. Each group was given the same pill at the same
time everyday for a week. Almost 80% of group A felt better, 65% group B felt better and 10% of group C
felt better. What everybody didn’t know was that while group A and B were given different medications,
group C was given a sugar pill instead (a placebo).
75. Define Independent Variable. The independent variable is the variable that the experimenter
changes. It is sometimes called the manipulated variable. You should only have one
independent variable in a good experiment.
76. Define Dependent Variable. The dependent variable is the variable that you measure. It is
sometimes called the responding variable.
77. Define Controlled Variable. The controlled variable is the variable(s) that stay the same.
78. Define control group. The control group is the group that the experimenter is keeping the
same, does not change.
79. Define experimental group. The experimental group is the group that the experimenter is
changing.
80. What is a controlled variable in this test? The controlled variable for this test was the doctor
and that the pills where given at the same time.
81. What is the independent variable in this test? The pills.
82. What is the dependent variable in this test? How well the groups felt after taking the pills
(where their headaches gone.)
83. What is the control group? Group C was the control group since they got a placebo.
84. What is the experimental group? Groups A and B were the experimental groups.
85. What is the volume (in ml) of the liquid in this graduated cylinder?
32ml
86. What is the mass (in grams) if the triple beam balance is reading the following.
60g + 400g + 7.5g = 467.5g
87. The graduated cylinder illustrated below contained exactly 50 ml
of water before vinegar was added to it.
Based on the measurement shown on the graduated cylinder, what was the
volume of the added vinegar?
68ml – 50ml = 18ml
Make sure you read the meniscus (bottom
part of the liquid) in a graduated cylinder.
88. What is the volume (in ml) of the metal box in this graduated cylinder? 18ml – 9ml = 9 ml
There will be 100 questions on this test. The rest of the questions will be over the same material in this review
only asked in a different way. There will be several additional questions involving variables, reading graphs and