73
NORTHERN TERRITORY GOVERNMENT MID-YEAR REPORT 2016-17

NORTHERN TERRITORY GOVERNMENT
Department of Treasury and Finance19 The Mall, GPO Box 1974, Darwin NT 0801Telephone: +61 8 8999 7425
www.treasury.nt.gov.au
MID-YEARREPORT
2016-17

2016‑17 Mid‑Year Report


1
ContentsUnder Treasurer’s Certification 2Chapter 1 Overview 3Chapter 2 Fiscal Outlook and Strategy 7Chapter 3 Economic Outlook 23Chapter 4 Uniform Presentation Framework 31
General Government Sector Comprehensive Operating Statement 32General Government Sector Balance Sheet 33General Government Sector Cash Flow Statement 34Public Non Financial Corporation Sector Comprehensive Operating Statement 35Public Non Financial Corporation Sector Balance Sheet 36Public Non Financial Corporation Sector Cash Flow Statement 37Non Financial Public Sector Comprehensive Operating Statement 38Non Financial Public Sector Balance Sheet 39Non Financial Public Sector Cash Flow Statement 40General Government Sector Taxes 412016-17 Loan Council Allocation 41
Chapter 5 Agency Output Statements 43Auditor-General’s Office 44Northern Territory Electoral Commission 44Ombudsman’s Office 44Department of the Chief Minister 45Department of the Legislative Assembly 45Northern Territory Police, Fire and Emergency Services 46Department of Trade, Business and Innovation 47Department of Treasury and Finance 48Northern Territory Treasury Corporation 48Department of Infrastructure, Planning and Logistics 49Land Development Corporation 50Department of the Attorney-General and Justice 51Department of Health 52Top End Health Service 53Central Australia Health Service 53Department of Housing and Community Development 54NT Home Ownership 54Office of the Commissioner for Public Employment 55Department of Primary Industry and Resources 56Department of Environment and Natural Resources 57Department of Tourism and Culture 57Territory Wildlife Parks 58Department of Corporate and Information Services 58NT Fleet 59Data Centre Services 59Aboriginal Areas Protection Authority 59Department of Education 60Territory Families 61
Appendix A Classification of Entities in the Northern Territory 63Appendix B Glossary 64

2
2016-17 Mid-Year Report
Under Treasurer’s CertificationIn accordance with the provisions of the Fiscal Integrity and Transparency Act, I certify that the financial projections included in the 2016-17 Mid-Year Report are based on Government decisions that I was aware of, or were made available to me by the Treasurer, before 24 November 2016. The projections are presented in accordance with the Uniform Presentation Framework.
David Braines-Mead A/Under Treasurer 25 November 2016

Overview 3
Chapter 1Overview
The 2016-17 Mid-Year Report has been prepared in accordance with the Fiscal Integrity and Transparency Act (FITA), which requires the Treasurer to prepare and publicly release a mid-year fiscal outlook report each year.
The Mid-Year Report provides an update on the current economic and fiscal outlook for the Territory and includes material variations that have occurred since the August 2016 Pre-Election Fiscal Outlook Report (PEFO) and their effect on the remainder of 2016-17 and the forward estimates.
Fiscal OutlookSince PEFO, the financial projections have been updated to include the 2015-16 final outcome and the election commitments of the new Northern Territory Government, which assumed office on 27 August 2016.
As part of the 2016 election campaign, the Territory Government announced a number of commitments that underpin its policy platform. These election commitments are largely categorised under the broad headings of Children and Social Development, Jobs, Lifestyle, and Trust and Governance. The budgetary effect of these commitments forms the baseline for the 2016-17 Mid-Year Report. The overall net cost of the Government’s official election commitments contained in this report remains consistent with that provided prior to the August 2016 election.
Recurrent commitments are estimated to cost $23.9 million in 2016-17, rising to $77.6 million in 2019-20. In addition to the recurrent commitments, the Government has committed an additional $100 million to fund an infrastructure stimulus package. The cost of the overall commitments is predominantly being met through a combination of savings and reprioritisation identified in a number of specific areas and the application of the contingency reserve previously incorporated in the Budget forward estimates.
In isolation these commitments have resulted in increased fiscal deficits in 2017-18 and 2018-19, but an improvement in 2016-17 and 2019-20.
Overall, the changes in estimated outcomes since PEFO have been influenced by the following key factors:
• the 2015-16 final budget outcome;
• Government’s election commitments;
• the Territory’s contribution to the Royal Commission into the Child Protection and Youth Detention Systems of the Northern Territory announced by the Prime Minister on 26 July 2016; and
• a reduction in GST revenues.
As a result, the fiscal balance deficit is projected to be $875 million in 2016-17 before trending to improvement over the forward years to a $29 million surplus in 2019-20, the year the Government has committed to returning the Budget to surplus.
Table 1.1 highlights the key fiscal aggregates for the general government sector and the non financial public sector for the 2016-17 Mid-Year Report.

4 Overview
2016-17 Mid-Year Report
Table 1.1: Key Fiscal Indicators and Aggregates
2015-161 2016‑17 2017-18 2018-19 2019-20
Outcome Budget Forward Estimates
$M $M $M $M $M
General government sector
Net operating balance 293 1 ‑ 64 ‑ 72 67
Non financial public sector
Fiscal balance - 78 - 875 - 459 - 183 29
Net debt 1 850 2 669 3 059 3 182 3 134
Net debt to revenue (%) 27 40 47 49 46
1 Mid-Year Report reflects actual outcome.Source: Department of Treasury and Finance
The key outcomes for the fiscal outlook presented in the 2016-17 Mid-Year Report are:
• a general government operating surplus of $1 million in 2016-17, with operating deficits projected for both 2017-18 and 2018-19 before returning to a surplus of $67 million in 2019-20;
• fiscal deficits for the non financial public sector forecast in 2016-17 through to 2018-19 before returning to a surplus of $29 million in 2019-20;
• net debt of $1.85 billion in 2015-16, increasing to $3.1 billion in 2019-20; and
• a net debt to revenue ratio of 27 per cent in 2015-16, rising to 46 per cent in 2019-20.
Further information on the comparison between the estimates contained in the 2016-17 Mid-Year Report and those projected at the time of PEFO is provided in Chapter 2.
Economic OverviewThe Territory’s economic growth strengthened from 2.0 per cent in 2014-15 to 2.7 per cent in 2015-16, comparable to the national rate of 2.8 per cent. Growth in 2015-16 was driven by net exports, which increased by 50.6 per cent, with both household and public consumption also contributing to growth.
Gross state product (GSP) is the preferred measure of overall economic activity, especially when comparing against other states and territories, as it is a broad measure of the value added to the Territory economy in each year. State final demand (SFD) is a major component of GSP. It comprises private and public consumption and investment. Since the 2016-17 Budget was delivered in May 2016, the Australian Bureau of Statistics (ABS) released the 2015-16 estimates of SFD, which showed a decline of 12.5 per cent, mainly driven by a decline in private investment. This decrease, although larger than anticipated, is broadly in line with the expected return to historical levels of private investment, following record levels seen over recent years as a result of the significant impact of large, resource-based projects undertaken in the Territory.
Both GSP and SFD have been revised in the latest release from ABS, with revisions from 2009-10 onwards, including significant upward revision to GSP in 2012-13 and downward revision in 2014-15.

Overview 5
Consumption, exports and public sector investment in infrastructure are expected to support Territory economic growth over the coming years, as construction on the Ichthys liquefied natural gas (LNG) project transitions from the construction to operation and production phase. Record high levels of private investment in recent years associated with Ichthys LNG and other major projects are expected to decline in the medium term, also leading to a lower level of imports as the reliance on imported machinery, equipment and pre-assembled modules reduces. As a result, the Territory’s economy is expected to continue to expand over the coming years.
The estimate of economic growth from 2016-17 is unchanged from the 2016 Budget and is expected to moderate to 1.5 per cent before increasing to 5.0 per cent in 2017-18. This reflects expected commencement of exports from the Ichthys LNG project in late 2017, likely to be a key contributor to economic growth over the coming years. The timing of this transition will affect levels of economic growth in the forward estimates. Similar to forecasts for overall economic growth, the expectations for SFD are unchanged from those published in the 2016 Budget, reflecting the decline in private investment and transition of the Territory economy to export and consumption-led growth, also supported by public investment.
The Territory has recorded modest employment growth results in recent years, mainly due to the closure of the alumina refinery in Gove along with the scaling back or closure of other mining operations. Employment grew by 1.3 per cent in 2015-16, but is expected to remain below long-term trends as the Ichthys LNG project transitions to the less labour-intensive operation and production phase.
Unemployment and participation have continued to remain strong, with both measures recording favourable results compared to the national trend. The unemployment forecast for 2016-17 has been revised down to 4.0 per cent to more closely reflect current labour market conditions. As the Ichthys LNG project moves towards the export phase, workers will likely depart the Territory unless other projects extend their stay. This outward movement is expected to limit the impact of the wind-down of the construction phase of the project on the Territory’s unemployment rate.
The Territory’s population increased by 0.4 per cent in annual terms to 243 792 persons in 2015. The subdued growth resulted from declines in net overseas migration from historically high levels in recent years, and lower inflows from interstate. The Ichthys LNG project is likely to remain a major determinant of population growth over the next few years, with outward population flows associated with the project’s construction completion expected to largely constrain population growth. Population forecasts have been revised down from those published in the 2016-17 Budget to 0.8 per cent for 2016-17 and 2017-18, in line with slightly lower growth in 2015 relative to estimates.
Wage and price pressures in the Territory have eased with both expected to be below trend levels in 2016-17 and through the forward estimates, reflecting the effect of moderate population and employment growth. The lower costs of housing, particularly rents, and lower transportation costs (fuel) were the main detractors of growth in the Darwin consumer price index. As a result, forecasts for the Darwin consumer price index have been revised down from 2016-17 through the forward estimates. In the medium term, wage growth in the Territory is expected to remain subdued, in line with national expectations, with a key factor being a reduction in labour demand as construction activity associated with major projects reduces. Wage price forecasts remain unchanged from the 2016-17 Budget.

6 Overview
2016-17 Mid-Year Report
Table 1.2: Key Economic Results and Forecasts (%)
2015-16 2016‑17 2017-18 2018-19 2019-20
Budget Actual Estimate Forecast
Gross state product1 2.1 2.7 1.5 5.0 4.1 3.8
State final demand1 - 5.4 - 12.5 - 2.3 - 1.8 3.9 3.7
Population2 0.6 0.4 0.8 0.8 1.3 1.5
Employment3 1.5 1.3 0.3 0.7 0.7 0.8
Unemployment rate4 4.6 4.2 4.0 4.4 4.7 4.7
Consumer price index3 - 0.3 0.1 0.5 1.4 1.9 2.4
Wage price index3 2.2 2.2 1.9 2.3 2.5 2.7
1 Year ended June, year-on-year percentage change, inflation adjusted.2 As at December, annual percentage change.3 Year ended June, year-on-year percentage change.4 Year average.Source: Department of Treasury and Finance, Australian Bureau of Statistics
Further detail on the updated economic forecasts is provided in Chapter 3.

Fiscal Outlook and Strategy 7
Chapter 2 Fiscal Outlook and StrategyOverview
The information provided in this chapter meets the requirement under section 10(1)(a) of the Fiscal Integrity and Transparency Act (FITA) for each fiscal outlook report to contain updated financial projections for the budget year and the following three financial years for the general government and non financial public sectors.
In addition, this chapter also provides:
•a comparison of the estimates presented in the previous fiscal outlook report, which was the August 2016 Pre-Election Fiscal Outlook Report (PEFO);
•an assessment of projections against the former government’s fiscal strategy targets; and
•updated information on the Statement of Risks.
Updated Fiscal ProjectionsKey Fiscal Indicators – Operating Statement
Table 2.1 presents the key general government and non financial public sector operating statement indicators for 2016-17 through to 2019-20, compared to the estimates provided in PEFO.
Table 2.1: Key Fiscal Indicators – Operating Statement
2015-161 2016-17 2017-18 2018-19 2019-20
Outcome Budget Forward Estimates
$M $M $M $M $M
General government sector
Net operating balance
2016 PEFO 232 5 - 34 - 87 23
2016-17 Mid-Year Report 293 1 - 64 - 72 67
Variation 61 - 4 - 30 15 44
Non financial public sector
Fiscal balance
2016 PEFO - 93 - 876 - 431 - 154 1
2016-17 Mid-Year Report - 78 - 875 - 459 - 183 29
Variation 15 1 - 28 - 29 28
1 Mid-Year Report reflects actual outcome.Source: Department of Treasury and Finance
General Government Sector Net Operating BalanceThe general government operating balance for 2016-17 is projected to be a surplus of $1 million compared to the $5 million projected at the time of the PEFO.
Although not significant, the $4 million lower estimate in 2016-17 is due to a number of offsetting changes.
The carry forward of expenditure, new policy decisions of the Government and reduced GST revenue, the latter flowing through to all forward estimates, largely accounts for the worsening in 2017-18. For 2018-19 and 2019-20, savings measures and the drawdown of the contingency

8 Fiscal Outlook and Strategy
2016-17 Mid-Year Report
reserve has offset the effect of new recurrent policy decisions, resulting in improvements in the operating balance in both years. However, consistent with PEFO, the operating balance remains in deficit in 2017-18 and 2018-19 before returning to surplus in 2019-20.
Non Financial Public Sector Fiscal BalanceThe general government sector excludes public non financial corporations, such as Power and Water Corporation, Territory Generation and Jacana Energy. Therefore the fiscal balance measure is assessed at the non financial public sector to ensure the financial performance of these entities is reflected in Government’s fiscal targets and outcomes.
As shown in Table 2.1, the fiscal balance, which includes the operating balance plus net investment in capital spending, remains relatively unchanged in 2016-17 when compared to PEFO. This is despite a number of offsetting movements as shown in Table 2.5 later in this chapter.
The increased deficit in 2017-18 is largely consistent with the changes affecting the lower operating result described above.
In contrast to the improved operating position, the fiscal balance deficit worsens in 2018-19 reflecting the increased investment applied to infrastructure across the Territory in that year.
A surplus of $29 million is projected in 2019-20, an improvement of $28 million when compared to the $1 million surplus projected in PEFO. This represents the improvement in the operating balance partly offset by an increase in net capital payments.
Reconciliation with Previous Fiscal ProjectionsThis section addresses the requirement under section 10(1)(f) of FITA that each fiscal outlook report is to contain an explanation of the factors and considerations that contributed to any material differences between the updated financial projections and the equivalent projections published in the last fiscal outlook report.
The most recent fiscal outlook report published under FITA was the August 2016 PEFO. The fiscal projections contained in this report have been updated to reflect policy and non-policy changes since PEFO. Policy variations are the result of Government decisions to implement new or expand agency programs and savings measures. Non-policy variations are either due to influences outside the Government’s control, such as the timing of receipts from the Commonwealth or changes in economic parameters.
Policy and Non-Policy Changes since PEFOTable 2.2 highlights the effect of both policy and non-policy changes on the non financial public sector’s fiscal balance since PEFO.
Table 2.2: Non Financial Public Sector – Policy and Non-Policy Changes since PEFO
2016-17 2017-18 2018-19 2019-20
Budget Forward Estimates
$M $M $M $M
2016 PEFO - 876 - 431 - 154 1
Policy changes - 15 - 45 - 41 12
Non-policy changes 16 17 13 16
2016-17 Mid-Year Report - 875 - 459 - 183 29
Source: Department of Treasury and Finance

Fiscal Outlook and Strategy 9
Policy Changes since PEFOTable 2.3 highlights the effect of policy changes on the non financial public sector’s fiscal balance since PEFO.
Table 2.3: Non Financial Public Sector – Policy Changes since PEFO
2016-17 2017-18 2018-19 2019-20
Budget Forward Estimates
$M $M $M $M
Policy decisions – election commitments
Recurrent commitments - 19 - 59 - 57 - 64
Infrastructure stimulus - 50 - 50
Revenue measures - 3 - 13 - 13 - 13
Savings and contingency measures 35 79 79 89
Subtotal 13 - 45 - 41 12
Policy decisions – other
Royal Commission costs - 25
Other - 3
Total policy - 15 - 45 - 41 12
Source: Department of Treasury and Finance
The most significant policy changes to the Budget and forward estimates are the effect of Government’s election commitments.
New commitments including infrastructure stimulus and revenue measures total $341 million across the budget cycle and are largely offset by savings measures and the use of the contingency reserve, which total $282 million. Consistent with the costings released just prior to the August election these commitments represent a net improvement in 2016-17, a worsening in 2017-18 and 2018-19, and an improvement in 2019-20. Key policy changes are discussed in further detail below.
Election Commitments Election commitments made in the lead up to the 2016 election have now been incorporated into this Mid-Year Report.
Recurrent commitments and infrastructure stimulusRecurrent commitments total $19 million in 2016-17, rising to $64 million ongoing from 2019-20, with key commitments including:
•funding of $15.5 million in 2016-17 rising to $31 million ongoing from 2019-20 for additional school resourcing;
•funding of $5 million in 2017-18 rising to $15.8 million ongoing from 2019-20 for police resourcing and recruitment;
•funding of $3 million ongoing from 2017-18 to introduce an Independent Commission Against Corruption to the Territory; and
•$1 million in 2017-18 rising to $5 million ongoing from 2019-20 to expand the Nurse-Family Partnership Program for nurse home visits.
In addition, $50 million has been allocated in both 2017-18 and 2018-19 to fund an infrastructure stimulus package using part of the proceeds from the long-term lease of the Port of Darwin previously set aside in the Northern Territory Infrastructure Development Fund.

10 Fiscal Outlook and Strategy
2016-17 Mid-Year Report
Supplementing these commitments, which have been provided with additional funding, are a number of election commitments required to be funded from within existing resources and consequently do not affect the projections in this report.
These initiatives relate to the Government’s key priorities of Children and Social Development, Lifestyle, Jobs, and Trust and Governance, and largely propose a change in approach or emphasis to existing functions and accordingly will be delivered by agencies from within existing resources.
Revenue MeasuresRevenue measures relate to Government’s commitment to introduce a first home buyers stamp duty discount on the first $500 000 of the purchase of an established home for eligible first homeowners. The purchase price is capped at $650 000. As a result, stamp duty collections are projected to be lower by $4.8 million in 2016-17, increasing to $13.2 million ongoing from 2017-18.
Savings and Contingency MeasuresSavings measures total $35 million in 2016-17, rising to $50 million by 2019-20. These measures are to be achieved without compromising the delivery of core government services, through efficiencies resulting from machinery of government changes combined with reductions in discretionary spending such as advertising, communications, marketing and travel costs.
Also included in the savings measures is Government’s commitment to replace the Alcohol Mandatory Treatment program with the Banned Drinking Register and increase focus on diversionary programs to provide a more holistic approach in tackling alcohol-related social and health problems.
PEFO outlined that the forward estimates included a contingency reserve of around 1 per cent per annum of operating expenses. The reserve allowed for a level of unforeseen changes to be managed within existing projections in the form of a Treasurer’s Advance, as well as incorporating $30 million ongoing per annum to support new and expanded recurrent initiatives in the forward years.
In addition to the savings measures introduced, Government has utilised a proportion of the contingency amount included in the forward estimates to fund its election commitments and minimise the effect on the projected outcomes.
Other Policy ChangesOther policy decisions of Government include additional funding of $25 million to meet the Territory’s commitment to contribute up to 50 per cent of the Commonwealth’s total cost of conducting the Royal Commission into the Protection and Detention of Children in the Northern Territory (initially announced as the Royal Commission into the Child Protection and Youth Detention Systems of the Northern Territory). As highlighted in PEFO the cost of implementing any recommendations that arise from the Royal Commission are not quantifiable at this time and, consequently, not included in the revised fiscal projections.
There is also $3 million to support the Scientific Inquiry on Hydraulic Fracturing in the Territory.
Non-Policy Changes since PEFOTable 2.4 highlights the effect of non-policy changes on the non financial public sector’s fiscal balance since PEFO.

Fiscal Outlook and Strategy 11
Table 2.4: Non Financial Public Sector – Non-Policy Changes since PEFO
2016-17 2017-18 2018-19 2019-20
Budget Forward Estimates
$M $M $M $M
Taxation revenue 15
Interest variations 3 6 14 14
Commonwealth and agency-related adjustments 22 23 9 12
GST revenue - 24 - 12 - 10 - 10
Total non policy 16 17 13 16
Source: Department of Treasury and Finance
The non-policy variations since PEFO result in improvements in the fiscal balance in 2016-17 and all forward years. Key variations include:
•a $15 million one-off increase in taxation revenue in 2016-17, primarily payroll tax and stamp duty collections, with the increases not flowing through to the forward estimates;
• lower than anticipated interest expenses due to lower borrowing requirements over the forward estimates;
•Commonwealth and other agency-related adjustments, resulting in an improvement in 2016-17 and all forward years; offset by
• lower than anticipated GST receipts in 2015-16, with the factors affecting the decrease flowing through to 2016-17 and the forward estimates.
Consolidated Table of Changes since PEFOTable 2.5 sets out the consolidated changes in the non financial public sector fiscal balance for 2016-17, for which the most significant items have already been described above in the reconciliation with previous fiscal projections section of this chapter.

12 Fiscal Outlook and Strategy
2016-17 Mid-Year Report
Table 2.5: Variations to the Non Financial Public Sector’s Fiscal Balance since PEFO
2016-17
$M
2016 PEFO - 875.6
REVENUE
Revenue – policy
First home buyers stamp duty discount - 4.8
Cease one-off grant for stamp duty 2.0
Total revenue – policy - 2.8
Revenue – non policy
Taxation 15.4
GST revenue - 24.0
Tied Commonwealth revenue 53.6
Total revenue – non policy 45.0
TOTAL REVENUE 42.2
OPERATING EXPENSES
Expenses – policy
Savings measures - 34.5
Election commitments 19.0
Royal Commission 25.0
Other 3.1
Total expenses – policy 12.6
Expenses – non policy
Commonwealth expenses and transfers between years and to capital 34.7
Interest expense - 2.7
Depreciation 2.2
Total expenses – non policy 34.2
TOTAL OPERATING EXPENSES 46.8
Net capital payments
Other - 3.1
Depreciation - 2.2
TOTAL NET CAPITAL PAYMENTS - 5.3
TOTAL EXPENSES 41.5
TOTAL VARIATION 0.8
2016-17 MID-YEAR REPORT - 874.8
Source: Department of Treasury and Finance

Fiscal Outlook and Strategy 13
Operating Revenue – Forward EstimatesTable 2.6 sets out the revised revenue projections.
Table 2.6: Non Financial Public Sector – Revenue
2015-161 2016-17 2017-18 2018-19 2019-20
Outcome Budget Forward Estimates
$M $M $M $M $M
Revenue
2016 PEFO 6 714 6 577 6 478 6 467 6 769
2016-17 Mid-Year Report 6 735 6 619 6 464 6 451 6 753
Variation 21 42 - 14 - 16 - 16
1 Mid-Year Report reflects actual outcome.Source: Department of Treasury and Finance
Total operating revenue is projected to increase by an average of 0.7 per cent over the forward estimates period, slightly lower than the 1 per cent projected at the time of PEFO.
The $42 million increase in 2016-17 largely relates to additional Commonwealth-tied funds, one-off increases in taxation revenue, offset by lower GST revenue. Lower GST revenue and the first homeowner stamp duty discount largely account for the lower revenues from 2017-18 to 2019-20.
GST RevenueThe parameters that influence the amount of GST revenue the Territory receives are national GST collections, GST relativities as assessed by the Commonwealth Grants Commission (CGC) and the Territory’s share of the national population.
The Commonwealth released its 2015-16 Final Budget Outcome (FBO) in September 2016. The FBO showed that the actual GST pool for 2015-16 was $57 352 million, which is lower than the Commonwealth’s Budget-time projections by $98 million. In addition, the Territory’s share of the national population in the FBO was also lower than Commonwealth predictions.
The lower than expected FBO population and GST pool numbers for 2015-16 have flow-on effects to the projections for 2016-17 and forward years, resulting in an overall reduction of $56 million in GST revenue over the budgetary cycle, compared to the projections in PEFO.
Taxation RevenueTaxation revenue is the most significant component of the Territory’s own-source revenue and has been revised upwards by $15 million in 2016-17 when compared to PEFO projections.
The increase in taxation revenues in 2016-17 is largely attributable to a one-off increase in payroll tax ($9 million) collected primarily due to the additional pay period that occurred in June 2016 for which payroll tax was received in July 2016. In addition, year-to-date commercial conveyance stamp duty collections ($6 million) are higher than expected and have also contributed to the upward revision of revenue estimates in 2016-17.
The introduction of the first home buyers stamp duty discount on the first $500 000 of the purchase of an established home, up to the value of $650 000, for eligible first homeowners has resulted in lower taxation revenues being forecast across the forward estimates.
Tied Commonwealth FundingThe remaining significant change in revenue estimates since PEFO predominantly relates to tied Commonwealth funding, which has increased by $53.6 million in 2016-17 and to a lesser extent in forward years. This largely represents additional funding provided under the National Health Reform agreement and increased funding for highly specialised drugs and other health-related programs.

14 Fiscal Outlook and Strategy
2016-17 Mid-Year Report
These tied funding adjustments tend not to affect the fiscal outcome over time as increases in revenue are generally matched by a corresponding increase in expenditure.
Operating ExpensesTable 2.7 sets out the revised expense projections of total expenditures for 2016-17 and the forward estimates.
Table 2.7: Non Financial Public Sector – Expenditure
2015-161 2016-17 2017-18 2018-19 2019-20
Outcome Budget Forward Estimates
$M $M $M $M $M
Operating expenses
2016 PEFO 6 394 6 556 6 508 6 563 6 741
2016-17 Mid-Year Report 6 414 6 603 6 523 6 532 6 680
Variation 20 47 15 - 31 - 61
Net capital payments
2016 PEFO 413 896 401 58 27
2016-17 Mid-Year Report 400 891 401 102 44
Variation - 13 - 5 0 44 17
1. Mid-Year Report reflects actual outcome.Source: Department of Treasury and Finance
Total operating expenditure is projected to increase by an average of 0.4 per cent over the forward estimates period, slightly lower than the 0.9 per cent growth estimated in PEFO. This is due, in part, to the higher base in 2016-17 as a result of the increase in tied Commonwealth funding and the Territory’s contribution to the total cost of conducting the Royal Commission into the Protection and Detention of Children in the Northern Territory.
The revised operating expenditure over the forward estimates incorporates the effect of Government’s election commitments that are largely offset by savings measures and the application of the contingency reserve as described earlier in this chapter. While the effect on total operating expenses varies between years, these budget improvement measures contribute to the moderation in growth of expenses over the forward estimates.
In addition, compared to PEFO, interest expenses have been revised down by $16 million in 2018-19 and 2019-20, reflecting revised borrowing requirements, and contribute to the lower total operating expenses in those years.
The basis of the parameters used remains unchanged from PEFO. The main parameters used to adjust forward estimates are:
•wages – inflator;
•consumer price index (CPI) – inflator; and
•efficiency dividend – deflator.
As highlighted in PEFO, a contingency reserve of around 1 per cent of operating expenses had been provided for in all forward estimate years. The reserve allowed for a level of unforeseen changes to revenue and expenses to be managed within existing projections, as well as incorporating $30 million ongoing per annum to support new and expanded recurrent initiatives in the forward years.
Consistent with its costed election commitments, Government has elected to partially utilise the contingency reserve to offset new spending initiatives. As a result, there is reduced capacity for

Fiscal Outlook and Strategy 15
additional new initiatives across the forward years without the application of additional savings measures or higher revenues.
There have also been variations to net capital spending resulting in increases of $44 million in 2018-19 and $17 million in 2019-20. The net $61 million increase in outer years represents the Government’s capital-related election commitments that are largely funded by the application of the contingency reserve and reprioritisation of around $200 million in projects on the forward works program to minimise the effect on the fiscal balance.
These initiatives form part of the Government’s commitment to establish a 10-year infrastructure program to support the construction industry and promote local employment. Key initiatives include the $1.1 billion housing program in remote regions over the next 10 years and $100 million over two years for an infrastructure stimulus package.
Key Fiscal Indicators – Balance SheetTable 2.8: Non Financial Public Sector – Net Debt and Net Debt to Revenue Ratio
2015-161 2016-17 2017-18 2018-19 2019-20
Outcome Budget Forward Estimates
Net debt ($M)
2016 PEFO 1 847 2 665 3 023 3 118 3 094
2016-17 Mid-Year Report 1 850 2 669 3 059 3 182 3 134
Variation 3 4 36 64 40
Net debt to revenue (%)
2016 PEFO 28 41 47 48 46
2016-17 Mid-Year Report 27 40 47 49 46
Variation - 1 - 1 0 1 0
1. Mid-Year Report reflects actual outcome.Source: Department of Treasury and Finance
As shown in Table 2.8, net debt and net debt to revenue are projected to increase over the forward estimates period, with a cumulative increase of $40 million by 2019-20 when compared to PEFO. The variations since PEFO are largely driven by lower GST revenues, which have in aggregate been reduced by $56 million over the budget cycle.
The net debt to revenue measure remains largely unchanged since PEFO and is projected to peak at 49 per cent in 2018-19 before reducing to 46 per cent by 2019-20.
Assessment of Updated Fiscal Outlook against the Fiscal StrategyThe fiscal strategy is an important element in setting out and measuring adherence to a government’s fiscal objectives. The fiscal strategy currently in place was developed by the former government with the principal aim of returning the budget to surplus by 2017-18 through the elimination of the fiscal balance deficit at the non financial public sector.
The analysis in this chapter is an assessment of the updated 2016-17 mid-year fiscal projections against the former government’s fiscal objectives and targets, as required by FITA.

16 Fiscal Outlook and Strategy
2016-17 Mid-Year Report
Key Fiscal IndicatorsKey fiscal target: by 2017-18 the fiscal imbalance in the Territory’s non financial public sector is to be eliminatedThe fiscal balance is an operating statement measure that differs from the net operating balance as it includes spending on capital items but excludes depreciation. A fiscal surplus indicates that a government is saving more than enough to finance all its investment spending. A fiscal deficit position indicates that a government’s level of investment is greater than its level of savings.
As a result of reduced revenue growth and a range of policy decisions undertaken by the former government, the fiscal balance returned to a deficit position in 2015-16. This Mid-Year Report continues to project fiscal deficits from 2016-17 to 2018-19 before returning to a surplus position in 2019-20 (Table 2.1).
This assessment remains largely unchanged from that in PEFO.
Associated fiscal outcome: by 2016-17, the Territory’s general government sector is achieving a net operating surplusThe net operating balance is measured by the general government sector’s total annual revenues less its total annual operating expenses (including annual depreciation, a non-cash expense). A net operating deficit indicates that total annual operating expenses exceed total annual revenues.
While an operating surplus was achieved in 2015-16 and is forecast for 2016-17, operating deficits are projected in 2017-18 and 2018-19 before a return to surplus in 2019-20 (Table 2.1).
This assessment remains largely unchanged from that in PEFO.
Associated fiscal outcome: by 2016-17, taxation effort in the Territory’s general government sector is more on par with the average effort of the statesTaxation effort assesses the extent to which a particular jurisdiction’s capacity to raise revenue is above or below the Australian average of 100 per cent. This measure is a lagging indicator as the CGC updates the information annually based on the actual outcome of the previous year. The Territory’s taxation effort has increased from 88 per cent in 2013-14 to 104 per cent in 2014-15, the latest year assessed by the CGC, and remains unchanged since PEFO. With taxation revenue lower in 2015-16, and projected to remain lower in 2016-17 and the forward years than in 2014-15, it is expected that the Territory’s taxation effort will moderate back to or below the average effort of the states at the next CGC update.
Associated fiscal outcome: by 2016-17, the Territory’s government owned corporation is moving towards commercial rates of return on capital employedUpon the initial implementation of this fiscal measure in the 2013-14 Budget, the Territory had only one government owned corporation, the Power and Water Corporation (PWC). However, as a result of the utilities reform agenda, PWC was separated into three distinct entities, Territory Generation, Jacana Energy and PWC. In order to provide a more accurate assessment against this element of the fiscal strategy, the three entities have been consolidated to remove transactions between each other.
The commercial rate of capital employed associated with this target is 6 per cent. For 2015-16, the government owned corporations achieved an average rate of return of 4.3 per cent. The forecast of 4 per cent contained in PEFO remains unchanged for the Mid-Year Report.
Associated fiscal outcome: by 2020, the Territory’s non financial public sector net debt as a percentage of revenue is returning towards 60 per centThis element of the fiscal strategy continues to be achieved well before the 2020 stated target.

Fiscal Outlook and Strategy 17
Due to forecast fiscal balance deficits up to 2019-20, net debt is projected to rise over the forward estimates period but the ratio to revenue will peak at 49 per cent in 2018-19, below the 60 per cent target (Table 2.8).
This element of the strategy remains unchanged since PEFO.
ConclusionThe Mid-Year Report consolidates changes since PEFO and confirms Government’s commitment to return the Budget to surplus by 2019-20. However, prevailing economic conditions and recent reductions in GST revenue presents an immediate challenge for Government to return the Budget to a sustainable position by the targeted year.
The revised fiscal projections forecast a moderate fiscal surplus of $29 million in 2019-20 compared to the $1 million surplus projected at the time of PEFO. Given the level of commitments that Government has identified to be funded from within existing reserves and the proposed savings measures built into the revised projections, these will need to be achieved to ensure the budget does not return to a deficit position in the target year.
Risks and Contingent LiabilitiesAs required under section 10(1)(e) of Fiscal Integrity and Transparency Act (FITA), each fiscal outlook report is required to contain ‘a statement of the risks, quantified as far as practicable, that could materially affect the updated financial projections, including any contingent liabilities and any Government negotiations that have yet to be finalised’.
This section outlines the potential effect of risks to the Budget due to changes in revenue and expense estimates, and the likelihood of contingent liabilities becoming actual liabilities.
Risks to the BudgetRevenue
GST RevenueVolatility in GST revenue represents the largest revenue risk for the Northern Territory, with GST revenue accounting for about half of the Territory’s total revenue. The risk was clearly evident in the context of the development of the 2016-17 Budget where GST revenue estimates were reduced by $145 million in the Budget year and around $750 million over the budget cycle due to a lower relative share, when compared to previous estimates. Subsequently, the Commonwealth’s 2015-16 Final Budget Outcome released in September 2016 has resulted in further reductions to the Territory’s GST revenue estimates. These changes in GST revenue estimates have significantly affected the Territory’s fiscal capacity in all years.
The Territory’s GST entitlement is dependent on three parameters: national GST collections; the Territory’s share of the national population; and GST relativities as determined by the Commonwealth Treasurer based on recommendations from the CGC. There are many variables that influence each of these parameters, adding to the complexity of forecasting GST revenue for the Territory over the Budget and forward estimates period. Notwithstanding the Commonwealth’s FBO, the growth rates for the population and GST pool parameters and the estimated GST relativities used to inform the PEFO remain unchanged for the 2016-17 Mid-Year Report.
The method by which GST is distributed is criticised from time to time by the larger states, with the intent generally being a move away from the current approach of providing each state with the capacity to provide the average level of services to one that provides them with a minimum GST share or a population-based GST share.

18 Fiscal Outlook and Strategy
2016-17 Mid-Year Report
The Prime Minister recently proposed consideration of a floor on GST relativities, in order to address Western Australia’s long-standing complaint that it is not receiving enough GST revenue due to declining relativities. This proposal would be a movement away from a horizontal fiscal equalisation-based GST distribution, would have significant financial implications for the Territory and could result in the Territory being unable to deliver services at current standards unless substantial fiscal deficits are maintained on an ongoing basis. The Territory Government is actively participating in intergovernmental processes to ensure principles of horizontal fiscal equalisation are not undermined.
NationalGSTCollections – The Territory’s estimates of national GST collections in 2016-17 and over the forward estimates period have been revised downwards since PEFO to take into account lower than expected collections in 2015-16.
The Territory’s GST revenue is directly affected by variations in national GST collections. A ±1 percentage point change in the growth rate of GST collections is estimated to have a ±$31 million impact on the Territory’s GST revenue in 2016-17. If variations of ±1 percentage point occurred in each of the Budget and forward estimates years, the cumulative impact on Territory GST revenue is about ±$335 million.
Territory’sShareof NationalPopulation – Overall, the Territory’s population is expected to grow at a slower rate than nationally over the Budget and forward estimates period. Estimates of the Territory’s population growth relative to the national rate influence the Territory’s share of the national population and therefore affect forecasts of the Territory’s GST revenue. The effect of a ±1 percentage point variation in the Territory’s forecast population growth is estimated at ±$30 million in 2016-17, all other things being equal. The cumulative impact of a ±1 percentage point variation in the estimate of the Territory’s population growth rate over the Budget and forward estimates period is about ±$331 million.
GSTRelativities – The CGC is responsible for recommending GST relativities, which are updated each year to incorporate new data and changes in states’ fiscal capacities. In its 2016 Update, the CGC recommended a significant decrease in the Territory’s GST relativity from 5.57053 in 2015-16 to 5.28450 in 2016-17.
Predicting future relativities is the most difficult aspect of estimating future GST revenue, with allocation of relativities being a zero-sum game. As such, with the expectation that Western Australia’s relativity will continue to improve, there is an expectation that the Territory’s relativity will continue to decrease. GST relativities to apply in 2017-18 are expected to be finalised around March 2017.
The impact of a 1 per cent variation in the Territory’s GST relativity is around ±$31 million per annum. A ±1 percentage point variation in the Territory’s GST relativity in each year of the forward estimates period would have a cumulative effect of around ±$130 million.
The above analysis examines the effect of variations in estimates of each parameter in isolation. However, these parameters often interact and, as a result, variations in each parameter could have a compounding or offsetting effect on GST revenue estimates.
Other Commonwealth Grants and SubsidiesCommonwealth funding is provided under either the Intergovernmental Agreement on Federal Financial Relations (IGA) through specific purpose payments (SPPs), National Health Reform (NHR) payments, Students First – A Fairer Funding Agreement for Schools payments and national partnership (NP) payments, or through Commonwealth own-purpose expenses (COPEs) provided directly to agencies.

Fiscal Outlook and Strategy 19
The IGA affords flexibility of expenditure across the relevant sector for SPPs (in 2016-17 provided for the skills and workforce, disability and housing sectors) without input controls, co-investment or maintenance of effort requirements. These payments are ongoing and indexed on a sector-specific basis, providing a degree of certainty for the Territory’s budgeting, although adequacy of indexation in terms of capturing cost growth remains an ongoing risk.
NHR payments are predominantly based on either hospital activity or ‘block funding’ for smaller hospitals in recognition of their circumstances. A risk remains that the Territory’s circumstances will not be adequately recognised in the funding arrangements, therefore potentially affecting the adequacy of Commonwealth funding.
NP agreements continue to include many risks to states including co-investment, input controls, burdensome reporting and administrative arrangements, and potential withdrawal of funding at the Commonwealth’s discretion. The expiry of NP agreements, which are time limited, also potentially poses a risk to the Territory’s Budget, particularly where funding has raised service delivery expectations.
Funding associated with 19 NP agreements, including schedules under agreements, totalling $38.7 million is due to expire by the end of 2016-17. Should the funding under these agreements not be renewed or rolled into an existing SPP, the Territory would need to either reduce service delivery levels or provide additional funding. In addition, timing of Commonwealth decisions regarding the treatment of expiring NP agreements and their funding is critical to ensure continuity of service delivery or allow for alternative approaches to be considered should funding not be available. Another significant example of an expiring NP is the NP Agreement on Remote Housing, which concludes at the end of 2017-18. The services currently delivered under this agreement include property and tenancy management expected to be maintained on an ongoing basis after the completion of the NP. In the absence of further funds coming from the Commonwealth, this would affect the updated projections contained in this report.
The Commonwealth has not committed to funding arrangements for health and hospitals or school education beyond 2019-20. With uncertainty around the long-term funding arrangements for these core service areas, there is a significant risk of reduced tied funding levels to all states and territories. Additionally, if future Commonwealth reform agendas are introduced that may affect delivery and funding arrangements for core government services and not adequately recognise the needs of the Territory, there is a risk that funding for these services may be insufficient to continue the current level of services, requiring either budget reprioritisation or a reduction in the scope of services provided.
Own-Source RevenueThe amount of revenue received from Territory taxes and royalties is dependent on the performance of the Territory economy and other external factors. Forecasting such revenue involves judgments and assumptions made about the performance of the various economic factors and indicators that directly affect Territory taxes and royalties, such as growth in wages, employment, average hours worked, commodity and residential property prices, market activity and exchange rates.
The risks in forecasting the various elements of the Territory’s own-source revenue remain unchanged from those included in PEFO and the May 2016 Budget.
Expenses and PaymentsThe forward estimates for expenses are based on known policy decisions, with adjustments for non-policy changes.
The most significant risk to the expense estimates is increasing budget pressure due to increased cost and demand influences.

20 Fiscal Outlook and Strategy
2016-17 Mid-Year Report
Future enterprise bargaining agreements represent a risk to the Budget to the extent that the outcome of negotiations is over and above amounts currently factored into the forward estimates.
The 2016-17 Budget and PEFO included an increase to the efficiency dividend in all years, from 1 per cent to 2 per cent in 2016-17, 3 per cent in 2017-18 and then 2 per cent in both 2018-19 and 2019-20. These efficiencies together with further approved savings measures of the new government pose a risk to the Budget and forward estimates to the extent that agencies are unable to find this level of savings and efficiencies.
In accordance with the FITA, the 2016-17 Mid-Year Report includes forward estimates up to 2019-20. There is the potential for the fiscal aggregates beyond the forward estimates period to be affected by existing commitments. These could either take the form of recurrent costs not expected to crystallise until later in the forward estimates period, recurrent initiatives that roll out over time and have therefore not yet reached their peak of funding, or capital infrastructure for which the associated recurrent costs are not fully incorporated into forward years as their completion falls either close to or outside of the forward estimates period. For example, as part of the 2016 Budget the Territory announced net additional funding of $25 million per annum ongoing from 2018-19 to operate the Palmerston Regional Hospital. This level of funding is premised on the assumption that the current activity-based funding arrangement (that is, activity growth funded by the Commonwealth at 45 per cent of the national efficient price) will continue. Any change to either the overall cost to operate the hospital or the Commonwealth funding methodology will affect the level of the Territory’s funding contribution and thus the projections contained in this report.
Royal Commission into the Protection and Detention of Children of the Northern TerritoryThe Royal Commission into the Protection and Detention of Children in the Northern Territory is expected to report by 31 March 2017. The Territory’s contribution to the Commonwealth to conduct the Royal Commission has now been factored into this report. However the cost of implementing any recommendations that arise from the Royal Commission are not quantifiable at this time and not included in the revised fiscal projections but are likely to affect the fiscal aggregates contained in this Mid-Year Report.
Government Owned CorporationsPWC has now been structurally separated into three government owned corporations, PWC, Territory Generation and Jacana Energy. While it is expected that this reform will result in future operational efficiencies, there is a risk of higher costs in the short term as each entity focuses on business improvements.
All three government owned corporations have incorporated future efficiencies in their respective 2016-17 Statement of Corporate Intent. If they are unable to achieve their Statement of Corporate Intent targets they will represent an ongoing risk to the Budget.
Risks to Economic ForecastsEconomic forecasts are subject to a number of upside and downside risks and uncertainties. Economic conditions in the Territory also tend to be highly volatile due to the relatively small size of the Territory’s economy, the impact of major projects and external factors such as movements in commodity prices, and this is often reflected in the available data, which can be subject to significant revisions.
The volatility of the Territory’s economy presents an underlying risk to forecasts, particularly in relation to the reporting of capital expenditure for major projects, as evidenced by the Australian Bureau of Statistic’s significant revisions to its 2015-16 GSP results for the Territory. Some data is confidentialised, making it difficult to report when actual expenditure occurs. There are

Fiscal Outlook and Strategy 21
also difficulties associated with the measurement of interstate trade flows and other complexities associated with the balancing item of gross state product (GSP), the components of which are not published publicly.
Most significant for Territory forecasts is the timing of the Ichthys liquefied natural gas (LNG) project. Given the size of the project, it has been factored into current forecasts based on publicly available information, including timing of completion and anticipated commencement of production. However, any delays in the transition of the project from construction to the production and export phase as well as variations in investment and costs have the potential to influence a range of economic indicators, particularly GSP growth, employment and population forecasts.
There are also a range of other potential projects not included in the Territory’s economic forecasts, given the uncertainty around final investment decisions, timing, levels of proposed expenditure and other impacts on the economy, including projects such as the Darwin luxury hotel development, Project Sea Dragon, Berrimah Farm land release and some initiatives outlined in the 2016 Defence White Paper.
The Territory economy is heavily exposed to changes in the global economy. Movements in global commodity prices can have significant impacts on the viability of mining activity in the Territory, as experienced in recent years. Global oil prices can also affect the cost of living and doing business in the Territory, not only regarding the price of automotive fuel for consumers, but also transport costs, as well as other goods and services.
Movements in the Australian dollar against other currencies (mainly the United States dollar) will influence the cost of the Territory’s imports and the competitiveness of Territory goods and services exports, largely affecting industries such as tourism, agriculture, mining and manufacturing.
Economic conditions in other Australian jurisdictions present risks to the Territory’s economic forecasts. This includes effects on the labour market and interstate migration flows. The relative labour market conditions in other jurisdictions can affect the availability of labour in the Territory. Interest rate movements also present an uncertainty for the Territory economy, particularly influencing business, residential property and household consumption and investment.
Adverse weather conditions and natural disasters (such as cyclones, flooding, drought and climate variability) are also key risks to many of the Territory’s economic forecasts and have the potential to place upward pressure on food prices due to effects on agricultural production across the country.
Contingent LiabilitiesContingent liabilities are potential future costs to Government that may arise from guarantees, indemnities, legal and contractual claims as they constitute a risk to the Territory’s financial position. The Territory’s contingent liabilities are predominantly unchanged from PEFO.
For more information on contingent liabilities, refer to Chapter 5 in PEFO: Risks to the Updated Financial and Economic Projections and the 2015-16 Treasurer’s Annual Financial Report.

22
2016-17 Mid-Year Report

Economic Outlook 23
Chapter 3Economic OutlookKey Economic Indicators
Growth in the Northern Territory economy strengthened from 2.0 per cent in 2014-15 to 2.7 per cent in 2015-16. This growth was mainly driven by consumption and net exports and follows significant revisions in the Territory’s reported economic growth from 2009-10 onwards by the Australian Bureau of Statistics (ABS), including a downward revision to growth in 2014-15 from the originally published result of 10.5 per cent and an upward revision in 2012-13 (from 6.6 per cent to 15.8 per cent). Economic growth is expected to moderate to 1.5 per cent in 2016-17, before strengthening from 2017-18, mainly due to stronger exports.
The 2015-16 results across the range of key economic indicators have been broadly in line with the Department of Treasury and Finance’s estimates from the 2016-17 Budget and August 2016 Pre-Election Fiscal Outlook Report (PEFO). Minor revisions have been made to some forecasts as part of this Mid-Year Report following the release of more updated data and information.
Table 3.1 provides the latest actuals and forecasts for key economic indicators for the Territory. Recent trends and factors underpinning the change in forecasts are discussed in the following sections.
Table 3.1: Key Economic Results and Forecasts (%)
2015-16 2016-17 2017-18 2018-19 2019-20
Budget Actual Estimate Forecast
Gross state product1 2.1 2.7 1.5 5.0 4.1 3.8
State final demand1 - 5.4 - 12.5 - 2.3 - 1.8 3.9 3.7
Population2 0.6 0.4 0.8 0.8 1.3 1.5
Employment3 1.5 1.3 0.3 0.7 0.7 0.8
Unemployment rate4 4.6 4.2 4.0 4.4 4.7 4.7
Consumer price index3 - 0.3 0.1 0.5 1.4 1.9 2.4
Wage price index3 2.2 2.2 1.9 2.3 2.5 2.7
1 Year ended June, year-on-year percentage change, inflation adjusted.2 As at December, annual percentage change.3 Year ended June, year-on-year percentage change.4 Year average.Source: Department of Treasury and Finance, Australian Bureau of Statistics
Economic GrowthThe Territory economy recorded moderate growth of 2.7 per cent in 2015-16, with total gross state product (GSP) reaching $23.6 billion. Private investment contracted for the first time since 2010 -11, following record levels reached in 2014-15. Growth in 2015-16 was driven mainly by consumption and net exports of goods and services.
The Territory recorded the fourth highest economic growth of the jurisdictions, which ranged from 1.3 per cent in Tasmania to 3.5 per cent in New South Wales (Figure 3.1). Nationally, gross domestic product increased by 2.8 per cent in 2015-16.

24 Economic Outlook
2016-17 Mid-Year Report
Figure 3.1: Change in Gross State Product, Gross Domestic Product, 2015-16
Source: ABS, Australian National Accounts; State Accounts, Cat. No. 5220.0
At 2.7 per cent, the 2015-16 outcome was predominantly in line with the 2.1 per cent forecast in PEFO. Due to the significant revisions to GSP data by ABS, it is difficult to directly compare forecasts of the main drivers of growth (consumption, investment and international trade) with the actual result, however the underlying trend in economic activity at this level remains consistent with results published in PEFO and the 2016-17 Budget. As a result, forecasts for economic growth remain unchanged.
Economic growth in 2015 -16 was driven mainly by an increase in net exports of goods and services, which increased by 50.6 per cent, along with improved household and public consumption, with total consumption increasing by 3.9 per cent.
GSP is the preferred measure of overall economic activity, especially when comparing against other states and territories, as it is a broad measure of the value added to the Territory economy in each year. State final demand (SFD) is a major component of GSP. It comprises private and public consumption and investment. Since the 2016-17 Budget was delivered in May 2016, the ABS has released the 2015-16 estimates of SFD, which showed a decline of 12.5 per cent, mainly driven by a decline in private investment (Figure 3.2). This decrease, although larger than anticipated, is broadly in line with the expected return to historical levels of private investment following record levels seen over recent years as a result of the significant impact of large, resource-based projects undertaken in the Territory.
Both GSP and SFD have been revised in the latest release from ABS, with revisions from 2009-10 onwards and include significant upward revision to GSP in 2012-13 and downward revision in 2014-15.
Territory economic growth over the forward estimates period has the potential to be volatile if there are changes to the timing of construction completion of the Ichthys liquid natural gas (LNG) project and the corresponding commencement of exports. The timing of other projects including initiatives outlined in the 2016 Defence White Paper could also have a significant effect on economic growth in the outer years.
1.3
1.9 1.9 2.0
2.7
3.3 3.4 3.5
2.8
0
1
2
3
4
Tas SA WA Qld NT Vic ACT NSW Aust
%

Economic Outlook 25
Figure 3.2: Territory investment and consumption as a proportion of SFD
Source: ABS, Australian National Accounts: State Accounts, Cat. No. 5220.0
Household ConsumptionGrowth in total consumption strengthened from 1.5 per cent in 2014-15 to 3.9 per cent in 2015-16, higher than the 1.5 per cent forecast in PEFO. Private (household) consumption increased by 5.2 per cent to $10.5 billion and public consumption increased by 2.0 per cent to $7.2 billion.
A moderate increase in household consumption is forecast for 2016-17, in line with employment forecasts. Retail trade in the Territory continues to ease, however this only comprises around half of household consumption and its relative contribution can vary with areas like personal services, travel and leisure activities, which are outside the scope of retail trade data. Slowing residential unit construction may also detract from household consumption through reduced spending on furnishings and household items. However, this is expected to be partly offset by continued lower housing costs, in particular rents, which can help boost disposable income levels.
Dwelling InvestmentIn 2015-16, dwelling investment in the Territory declined by 9.1 per cent. This continued moderation in dwelling investment follows record growth of 49.6 per cent in 2013-14, when there were high levels of residential unit construction, along with strong growth in new house construction.
The residential property market in the Territory has continued to soften in 2016, primarily reflecting increased dwelling supply over recent years and moderating population growth. This has resulted in a narrowing between housing demand and supply in the property market, which has placed downward pressure on property prices and rents.
The decline in dwelling investment is expected to continue in the short term, with the number and value of building approvals continuing to decline in recent data releases. In the medium term, ongoing land release and subsequent house construction in new suburbs such as Zuccoli in Palmerston and the newly released Northcrest in Berrimah are expected to dampen the decline in dwelling investment.
Business InvestmentBusiness investment, which had previously been the largest contributor to economic growth in the Territory in the past few years, increasing by an annual average of 50.7 per cent over 2011-12 to 2014-15, declined by 34.4 per cent in 2015-16. This investment has been largely driven by the expansion of the construction industry, particularly the Ichthys LNG project, as well as construction
0
20
40
60
80
100
96 97 98 99 00 01 02 03 04 05 06 07 08 09 10 11 12 13 14 15 16
Private consumption Public consumption Public investment Private investment
%
Year ended June

26 Economic Outlook
2016-17 Mid-Year Report
of the Darwin Correctional Centre, the duplication of Tiger Brennan Drive, various mine site expansions and record levels of residential construction (Figure 3.3).
Business investment is expected to continue to decline as construction on the Ichthys LNG project nears completion. Over the medium term, the decline in business investment is expected to be offset by an increase in exports as the Ichthys LNG project transitions from the construction to the operational production phase.
Figure 3.3: Value of Territory Construction Work Done (moving annual total)
Source ABS, Construction Work Done, Cat. no. 8755.0
Public Final DemandPublic final demand in the Territory decreased by 1.0 per cent in 2015-16, following an increase of 5.0 per cent in 2014-15. Public investment fell by 16.4 per cent to $1.3 billion while public consumption increased by 2.0 per cent to $7.2 billion. The decline in public investment reflects the completion of the Darwin Correctional Precinct in 2014-15.
Public investment is expected to continue to strengthen over the short to medium term, driven by the ongoing commitment to Territory Government infrastructure spending, particularly on roads, as well as projects such as expansion works at the Owen Springs power station in Alice Springs, upgrades to the Royal Darwin Hospital and the construction of the Palmerston Regional Hospital.
International TradeNet exports of goods and services increased by 50.6 per cent to $3.9 billion in 2015-16, reflecting a significant decline in goods imports to the Territory, which was largely due to the arrival of the last of the large modules and key machinery components for the Ichthys LNG project. However, there was also a decline in total exports from the Territory, reflecting a reduction of export volumes of mineral commodities likely related to lower commodity prices.
In the short term, improvements in the Territory’s net exports are forecast to continue, particularly due to lower levels of import activity as record levels of private investment return to more sustainable levels. In the outer years exports are expected to increase rapidly as the Ichthys LNG project begins production in 2017-18, providing a significant boost to net exports.
PopulationGrowth in the Territory’s population increased to 0.4 per cent in 2015, marginally lower than the 2016-17 Budget Papers estimate of 0.6 per cent. Natural increase contributed 2846 people and net overseas migration contributed 739 people (Figure 3.4). These increases were offset by net interstate migration outflows (2732 people).
0123456789
10
00 01 02 03 04 05 06 07 08 09 10 11 12 13 14 15 16
Engineering Non-residential Residential TotalYear ended June
$B
Blacktip, Montara, GEMCO
Railway, Bayu-Undan gas field
Darwin LNG plant
Alcan G3 refinery expansion
INPEX, Montara, mine expansions, Darwin Correctional Precinct
INPEX workers' accommodation village

Economic Outlook 27
Figure 3.4: Components of Territory Population Growth (moving annual total)
Source: ABS, Australian Demographic Statistics, Cat. No. 3101.0
In the March quarter 2016, annual population growth in the Territory increased by 0.4 per cent with net interstate migration outflows continuing to detract from growth. The extent of the loss has been smaller compared to recent large outflows experienced in 2014.
PEFO forecasts for population growth in 2016 and 2017 have been revised down from 1.0 per cent to 0.8 per cent, in line with slightly lower growth in 2015 relative to estimates. Population growth forecasts for 2018 (1.3 per cent) and 2019 (1.5 per cent) remain unchanged. The Ichthys LNG project is likely to remain a major determinant of population growth in the short term with the demand for labour during the construction phase peaking in 2016, before declining as the project transitions toward the less labour-intensive operations phase throughout 2017. As a consequence, outward population flows associated with the projects construction completion are expected to largely constrain population growth to levels reflective of natural increase.
Labour MarketEmployment
Resident employment in the Territory increased by 1.3 per cent in 2015-16, similar to the 1.5 per cent growth estimated in the 2016-17 Budget Papers (Figure 3.5). The increase was driven by an increase in full-time employment (up 0.8 per cent) and an increase in part-time employment (up 3.6 per cent).
Industries that experienced increases in employment in 2015-16 include accommodation and food services (up 13.7 per cent), mining (up 18.6 per cent) and retail trade (up 7.4 per cent). Industries that recorded a decline in employment include agriculture, forestry and fishing (down 40.1 per cent) and professional, scientific and technical services (down 20.0 per cent).
In the year to October 2016, Territory employment increased by 0.1 per cent, driven by a 2.2 per cent increase in part-time female employment, 0.9 per cent increase in full-time female employment and a 9.8 per cent increase in part-time male employment while full-time male employment decreased by 2.3 per cent. This greater growth in part-time employment is occurring across Australia, with an increase of 4.1 per cent nationally in year-on-year terms.
Employment growth is expected to be modest from 2016-17 to 2019-20 with the labour-intensive construction phase of the Ichthys LNG project currently operating at peak employment. Employment in the Territory is expected to grow below long-term trends, with a shift from the construction sector as the main driver to an increased reliance on general growth across other key industries in the Territory. The Territory Government’s road infrastructure program, construction
- 4
- 2
0
2
4
6
8
95 96 97 98 99 00 01 02 03 04 05 06 07 08 09 10 11 12 13 14 15 16
Total growth
Number of persons(000)
Natural increase
Net overseas migration
Net interstate migration
Year ended June

28 Economic Outlook
2016-17 Mid-Year Report
of the Palmerston Regional Hospital and Commonwealth Government’s defence infrastructure upgrades are expected to contribute to employment growth in the short term.
Figure 3.5: Year-on-Year Change in Employment
Source: ABS, Labour Statistics, Cat. No. 6101.0
UnemploymentThe Territory’s unemployment rate averaged 4.2 per cent in 2015-16, slightly below the estimate of 4.6 per cent in the 2016-17 Budget Papers.
In September 2016, average annual unemployment in the Territory decreased slightly to 4.0 per cent and is trending downwards. As a result, the annual average unemployment rate forecast for 2016-17 has been revised downwards to 4.0 per cent to reflect current labour market conditions in the Territory.
In the forward years, unemployment is expected to increase to 4.7 per cent in 2018-19. The Ichthys LNG project is expected to have drawn people from interstate and overseas, therefore as the project moves towards the export phase workers will likely depart the Territory unless other projects extend their stay. This outward movement is expected to limit the impact of the wind-down of the Ichthys LNG project’s construction phase on the Territory’s unemployment rate.
Consumer Price IndexThe Darwin consumer price index (CPI) continued to moderate from a peak of 3.7 per cent year-on-year growth in 2013-14 to growth of 0.1 per cent in 2015-16 (Figure 3.6). Moderate growth in the Darwin CPI over 2015-16 was due to declines in housing costs (mainly rents and electricity costs), transport costs (mainly fuel and new motor vehicle costs) and recreation and culture costs (mainly domestic holiday and accommodation costs). Alcohol and tobacco, and health costs continued to make the largest contributions to growth in the Darwin CPI.
The moderation in the Darwin CPI, while sharper than that experienced in the rest of Australia, broadly follows the national trend, with the eight capital cities’ CPI moderating to 1.4 per cent in 2015-16.
More recent data released from the ABS for the September quarter 2016 show that year-on-year movement in the Darwin CPI was flat, while the eight capital cities’ CPI growth further moderated to 1.3 per cent.
Forecasts of the Darwin CPI have been revised down from PEFO estimates to reflect the impact of moderate population and employment growth, along with lower input, labour and housing costs,
- 2
0
2
4
6
8
06 07 08 09 10 11 12 13 14 15 16
%
Year ended June
Australia
Territory

Economic Outlook 29
and the continuing effects of moderate growth in transport, food and recreation, and culture costs on the forward year inflation estimates.
The forecast of moderate growth of the Darwin CPI over the forward estimates is consistent with inflation growth estimates of 1.5 per cent to 2.5 per cent for the national economy published by the Reserve Bank of Australia.
Figure 3.6: Year-on-Year Change in Consumer Price Index, Darwin and Eight Capital Cities
Source: ABS, Consumer Price Index, Australia, Cat. No. 6401.0
Wage Price IndexIn 2015-16, growth in the Territory’s wage price index (WPI) moderated to 2.2 per cent, from 2.6 per cent growth in 2014-15. This is consistent with trends in other jurisdictions and reflects subdued national labour market demand and continuing moderate inflation growth.
Over the medium term, wage growth in the Territory is expected to be moderate, in line with national expectations, with a key factor of Territory wage growth being a reduction in demand for labour as construction of the Ichthys LNG project is completed and transitions to the operational and production phase in 2017-18.
0
1
2
3
4
5
06 07 08 09 10 11 12 13 14 15 16 17Year ended June
%
Darwin
Eight capital cities

30
2016-17 Mid-Year Report

Uniform Presentation Framework 31
Chapter 4Uniform Presentation Framework
Under the Uniform Presentation Framework (UPF), the Commonwealth, state and territory governments have agreed to publish information in a standard format in their budget papers. The UPF is based on accounting standard AASB 1049 Whole of Government and General Government Sector Financial Reporting, which harmonises government finance statistics and generally accepted accounting principles with the objective of improving the clarity and transparency of government financial statements.
The harmonised standard means government financial reports are presented on the same basis by all jurisdictions, resulting in greater transparency and consistency.
The Fiscal Integrity and Transparency Act (FITA) requires fiscal outlook reports be prepared in accordance with external reporting standards, including the Australian Accounting Standards and the UPF.
The tables in this chapter meet the Territory’s reporting obligations under both FITA and the UPF. They include, for the general government, public non financial corporations and non financial public sectors of government, a:
•Comprehensive Operating Statement;
•Balance Sheet; and
•Cash Flow Statement.
The financial statements include the August 2016 Pre-Election Fiscal Outlook Report (PEFO), revised 2016-17 estimate and 2017-18 to 2019-20 forward estimates.
Also included are supplementary tables presenting general government sector taxes and the revised 2016-17 Loan Council Allocation.

32 Uniform Presentation Framework
2016-17 Mid-Year Report
Table 4.1
General Government Sector Comprehensive Operating Statement 2016-17 2016-17 2017-18 2018-19 2019-20
PEFO Revised Forward Estimates
$000 $000 $000 $000 $000
REVENUE
Taxation revenue 586 893 599 463 592 203 608 349 625 065
Current grants 4 245 449 4 266 935 4 260 295 4 335 174 4 588 965
Capital grants 370 982 372 797 190 499 34 705 15 615
Sales of goods and services 380 981 379 559 405 442 409 066 408 834
Interest income 88 037 87 547 86 106 89 712 91 874
Dividend and income tax equivalent income 53 426 59 451 70 946 57 151 106 173
Other revenue 195 419 198 351 173 026 172 791 171 640
TOTAL REVENUE 5 921 187 5 964 103 5 778 517 5 706 948 6 008 166
less EXPENSES
Employee benefits expense 2 171 903 2 206 216 2 247 605 2 257 546 2 327 696
Superannuation expenses
Superannuation interest cost 133 639 133 639 129 094 128 080 128 080
Other superannuation expenses 203 062 200 306 202 189 203 308 204 080
Depreciation and amortisation 331 062 333 265 333 779 331 789 330 510
Other operating expenses 1 492 840 1 510 441 1 469 408 1 478 554 1 517 074
Interest expenses 211 608 208 906 205 425 210 162 213 320
Other property expenses
Current grants 940 671 938 720 925 609 888 257 934 375
Capital grants 170 621 169 584 57 843 38 779 33 033
Subsidies and personal benefit payments 260 526 262 347 271 234 242 944 252 796
TOTAL EXPENSES 5 915 932 5 963 424 5 842 186 5 779 419 5 940 964
equals NET OPERATING BALANCE 5 255 679 - 63 669 - 72 471 67 202
plus Other economic flows – included in operating result
31 626 31 626 32 502 33 962 34 918
equals OPERATING RESULT 36 881 32 305 - 31 167 - 38 509 102 120
plus Other economic flows – other comprehensive income
186 662 186 689 166 745 226 454 240 173
equals COMPREHENSIVE RESULT – total change in net worth before transactions with owners in their capacity as owners
223 543 218 994 135 578 187 945 342 293
NET OPERATING BALANCE 5 255 679 - 63 669 - 72 471 67 202
less Net acquisition of non financial assets
Purchases of non financial assets 1 142 310 1 139 209 768 079 509 393 394 238
Sales of non financial assets - 84 874 - 84 874 - 69 723 - 62 117 - 62 117
less Depreciation 331 062 333 265 333 779 331 789 330 510
plus Change in inventories
plus Other movements in non financial assets
equals Total net acquisition of non financial assets 726 374 721 070 364 577 115 487 1 611
equals FISCAL BALANCE - 721 119 - 720 391 - 428 246 - 187 958 65 591

Uniform Presentation Framework 33
Table 4.2
General Government Sector Balance Sheet 2016-17 2016-17 2017-18 2018-19 2019-20
PEFO Revised Forward Estimates
$000 $000 $000 $000 $000
ASSETS
Financial assets
Cash and deposits 163 337 89 618 41 296 48 043 77 853
Advances paid 156 021 161 158 146 932 129 617 115 489
Investments, loans and placements 1 914 618 1 892 203 1 783 847 1 841 826 1 902 776
Receivables 300 675 375 030 390 115 389 540 418 175
Equity
Investments in other public sector entities 2 548 732 2 150 673 2 143 938 2 124 807 2 125 760
Investments – other
Other financial assets 16 249 16 249 16 249 16 249 16 249
Total financial assets 5 099 632 4 684 931 4 522 377 4 550 082 4 656 302
Non financial assets
Inventories 13 468 13 468 13 468 13 468 13 468
Property, plant and equipment 14 470 809 14 443 124 14 823 321 14 954 428 14 971 659
Investment property 98 694 99 694 88 694 77 694 66 694
Other non financial assets 122 439 122 557 122 537 122 517 122 497
Total non financial assets 14 705 410 14 678 843 15 048 020 15 168 107 15 174 318
TOTAL ASSETS 19 805 042 19 363 774 19 570 397 19 718 189 19 830 620
LIABILITIES
Deposits held 331 076 327 808 343 708 354 752 381 687
Advances received 277 784 282 881 274 895 266 315 257 083
Borrowing 3 088 945 2 988 940 3 181 813 3 348 883 3 340 059
Superannuation 4 041 654 4 104 850 3 945 850 3 707 349 3 468 849
Other employee benefits 576 932 595 861 596 861 596 861 596 861
Payables 202 793 206 575 207 830 208 568 208 327
Other liabilities 761 585 853 511 880 514 908 590 908 590
TOTAL LIABILITIES 9 280 769 9 360 426 9 431 471 9 391 318 9 161 456
NET ASSETS/(LIABILITIES) 10 524 273 10 003 348 10 138 926 10 326 871 10 669 164
Contributed equity
Accumulated surplus/(deficit) 2 241 318 2 143 313 2 285 626 2 492 702 2 834 042
Reserves 8 282 955 7 860 035 7 853 300 7 834 169 7 835 122
NET WORTH 10 524 273 10 003 348 10 138 926 10 326 871 10 669 164
NET FINANCIAL WORTH1 - 4 181 137 - 4 675 495 - 4 909 094 - 4 841 236 - 4 505 154
NET FINANCIAL LIABILITIES2 6 729 869 6 826 168 7 053 032 6 966 043 6 630 914
NET DEBT3 1 463 829 1 456 650 1 828 341 1 950 464 1 882 711
1 Net financial worth equals total financial assets minus total liabilities.2 Net financial liabilities equals the sum of total liabilities less total financial assets excluding investments in other public sector entities.3 Net debt equals the sum of deposits held, advances received and borrowing, minus the sum of cash and deposits, advances paid and
investments, loans and placements.

34 Uniform Presentation Framework
2016-17 Mid-Year Report
Table 4.3
General Government Sector Cash Flow Statement 2016-17 2016-17 2017-18 2018-19 2019-20
PEFO Revised Forward Estimates$000 $000 $000 $000 $000
Cash receipts from operating activitiesTaxes received 586 893 599 463 592 203 608 349 625 065Receipts from sales of goods and services 312 369 310 867 337 332 340 459 340 422Grants and subsidies received 4 616 431 4 639 732 4 450 794 4 369 879 4 604 580Interest receipts 88 037 87 547 86 106 89 712 91 874Dividends and income tax equivalents 73 888 77 774 62 838 65 649 77 538Other receipts 419 824 422 758 397 567 397 556 395 017Total operating receipts 6 097 442 6 138 141 5 926 840 5 871 604 6 134 496Cash payments for operating activitiesPayments for employees - 2 476 922 - 2 508 479 - 2 560 522 - 2 578 964 - 2 656 250Payment for goods and services - 1 678 561 - 1 696 204 - 1 608 218 - 1 618 448 - 1 675 065Grants and subsidies paid - 1 371 652 - 1 370 365 - 1 254 131 - 1 168 609 - 1 220 204Interest paid - 211 760 - 209 065 - 205 217 - 209 803 - 213 432Other payments Total operating payments - 5 738 895 - 5 784 113 - 5 628 088 - 5 575 824 - 5 764 951NET CASH FLOWS FROM OPERATING ACTIVITIES 358 547 354 028 298 752 295 780 369 545Cash flows from investments in non financial assetsSales of non financial assets 84 874 84 874 69 723 62 117 62 117Purchases of non financial assets - 1 142 310 - 1 139 209 - 768 079 - 509 393 - 394 238Net cash flows from investments in non financial assets - 1 057 436 - 1 054 335 - 698 356 - 447 276 - 332 121NET CASH FROM OPERATING ACTIVITIES AND INVESTMENTS IN NON FINANCIAL ASSETS
- 698 889 - 700 307 - 399 604 - 151 496 37 424
Net cash flows from investments in financial assets for policy purposes1
1 809 1 809 14 226 17 315 14 128
Net cash flows from investments in financial assets for liquidity purposes
317 017 317 017 136 269 - 28 606 - 30 621
NET CASH FLOWS FROM INVESTING ACTIVITIES - 738 610 - 735 509 - 547 861 - 458 567 - 348 614Net cash flows from financing activitiesAdvances received (net) - 10 583 - 10 583 - 7 986 - 8 580 - 9 232Borrowing (net) - 8 448 - 108 448 192 873 167 070 - 8 824Deposits received (net) - 41 416 - 33 523 15 900 11 044 26 935Other financing (net) NET CASH FLOWS FROM FINANCING ACTIVITIES - 60 447 - 152 554 200 787 169 534 8 879NET INCREASE/DECREASE IN CASH HELD - 440 510 - 534 035 - 48 322 6 747 29 810Net cash flows from operating activities 358 547 354 028 298 752 295 780 369 545Net cash flows from investments in non financial assets - 1 057 436 - 1 054 335 - 698 356 - 447 276 - 332 121CASH SURPLUS (+)/DEFICIT (-) - 698 889 - 700 307 - 399 604 - 151 496 37 424Future infrastructure and superannuation contributions/earnings2
- 24 441 - 24 441 - 25 907 - 27 461 - 29 109
UNDERLYING SURPLUS (+)/DEFICIT (-) - 723 330 - 724 748 - 425 511 - 178 957 8 315Additional information to the Cash Flow StatementCASH SURPLUS (+)/DEFICIT (-) - 698 889 - 700 307 - 399 604 - 151 496 37 424Acquisitions under finance leases and similar arrangements ABS GFS SURPLUS (+)/DEFICIT (-) including finance leases and similar arrangements
- 698 889 - 700 307 - 399 604 - 151 496 37 424
1 Includes equity acquisitions, disposals and privatisations (net).2 Contributions for future infrastructure and superannuation requirements.

Uniform Presentation Framework 35
Table 4.4
Public Non Financial Corporation Sector Comprehensive Operating Statement 2016-17 2016-17 2017-18 2018-19 2019-20
PEFO Revised Forward Estimates
$000 $000 $000 $000 $000
REVENUE
Current grants 187 757 187 757 192 863 164 327 171 201
Capital grants 45 145 45 145 31 585 26 340 24 023
Sales of goods and services 687 368 687 368 730 515 780 305 824 343
Interest income 3 797 3 797 3 293 3 216 3 544
Other revenue 31 709 31 709 29 025 32 599 36 665
TOTAL REVENUE 955 776 955 776 987 281 1 006 787 1 059 776
less EXPENSES
Employee benefits expense 107 340 107 340 95 457 90 991 89 250
Superannuation expenses 16 905 16 905 17 096 16 934 16 934
Depreciation and amortisation 190 090 190 090 198 680 203 220 209 006
Other operating expenses 514 106 514 943 548 374 592 503 575 450
Interest expenses 68 189 67 325 69 069 68 854 75 702
Other property expenses 19 306 19 306 24 434 20 637 42 542
Current grants 225 225 231 237 243
Capital grants
Subsidies and personal benefit payments 1 907 1 907 1 898 1 941 1 984
TOTAL EXPENSES 918 068 918 041 955 239 995 317 1 011 111
equals NET OPERATING BALANCE 37 708 37 735 32 042 11 470 48 665
plus Other economic flows – included in operating result
- 12 367 - 12 367 - 11 519 - 10 047 - 3 956
equals OPERATING RESULT 25 341 25 368 20 523 1 423 44 709
plus Other economic flows – other comprehensive income
- 34 - 34 - 74 - 3 - 23
equals COMPREHENSIVE RESULT – total change in net worth before transactions with owners in their capacity as owners
25 307 25 334 20 449 1 420 44 686
NET OPERATING BALANCE 37 708 37 735 32 042 11 470 48 665
less Net acquisition of non financial assets
Purchases of non financial assets 335 774 335 774 210 262 165 883 227 043
Sales of non financial assets - 1 026 - 1 026 - 154 - 1 359 - 1 359
less Depreciation 190 090 190 090 198 680 203 220 209 006
plus Change in inventories 6 344 6 344 5 275 5 290 5 305
plus Other movements in non financial assets 18 740 18 740 19 228 19 729 19 965
equals Total net acquisition of non financial assets 169 742 169 742 35 931 - 13 677 41 948
equals FISCAL BALANCE - 132 034 - 132 007 - 3 889 25 147 6 717
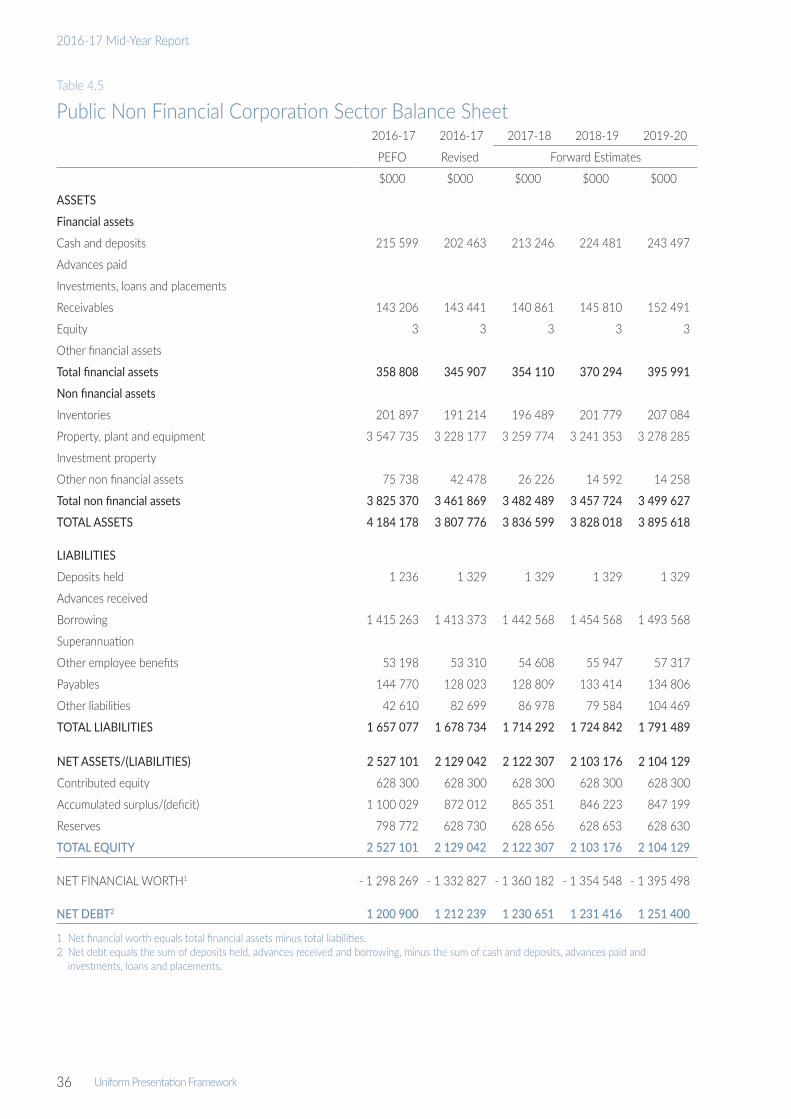
36 Uniform Presentation Framework
2016-17 Mid-Year Report
Table 4.5
Public Non Financial Corporation Sector Balance Sheet 2016-17 2016-17 2017-18 2018-19 2019-20
PEFO Revised Forward Estimates
$000 $000 $000 $000 $000
ASSETS
Financial assets
Cash and deposits 215 599 202 463 213 246 224 481 243 497
Advances paid
Investments, loans and placements
Receivables 143 206 143 441 140 861 145 810 152 491
Equity 3 3 3 3 3
Other financial assets
Total financial assets 358 808 345 907 354 110 370 294 395 991
Non financial assets
Inventories 201 897 191 214 196 489 201 779 207 084
Property, plant and equipment 3 547 735 3 228 177 3 259 774 3 241 353 3 278 285
Investment property
Other non financial assets 75 738 42 478 26 226 14 592 14 258
Total non financial assets 3 825 370 3 461 869 3 482 489 3 457 724 3 499 627
TOTAL ASSETS 4 184 178 3 807 776 3 836 599 3 828 018 3 895 618
LIABILITIES
Deposits held 1 236 1 329 1 329 1 329 1 329
Advances received
Borrowing 1 415 263 1 413 373 1 442 568 1 454 568 1 493 568
Superannuation
Other employee benefits 53 198 53 310 54 608 55 947 57 317
Payables 144 770 128 023 128 809 133 414 134 806
Other liabilities 42 610 82 699 86 978 79 584 104 469
TOTAL LIABILITIES 1 657 077 1 678 734 1 714 292 1 724 842 1 791 489
NET ASSETS/(LIABILITIES) 2 527 101 2 129 042 2 122 307 2 103 176 2 104 129
Contributed equity 628 300 628 300 628 300 628 300 628 300
Accumulated surplus/(deficit) 1 100 029 872 012 865 351 846 223 847 199
Reserves 798 772 628 730 628 656 628 653 628 630
TOTAL EQUITY 2 527 101 2 129 042 2 122 307 2 103 176 2 104 129
NET FINANCIAL WORTH1 - 1 298 269 - 1 332 827 - 1 360 182 - 1 354 548 - 1 395 498
NET DEBT2 1 200 900 1 212 239 1 230 651 1 231 416 1 251 400
1 Net financial worth equals total financial assets minus total liabilities.2 Net debt equals the sum of deposits held, advances received and borrowing, minus the sum of cash and deposits, advances paid and
investments, loans and placements.

Uniform Presentation Framework 37
Table 4.6
Public Non Financial Corporation Sector Cash Flow Statement 2016-17 2016-17 2017-18 2018-19 2019-20
PEFO Revised Forward Estimates$000 $000 $000 $000 $000
Cash receipts from operating activitiesReceipts from sales of goods and services 709 424 709 562 728 949 771 236 813 689Grants and subsidies received 232 900 232 900 224 448 190 667 195 226Interest receipts 3 854 3 854 3 281 3 210 3 534Other receipts 12 680 12 680 9 797 12 870 16 700Total operating receipts 958 858 958 996 966 475 977 983 1 029 149Cash payments for operating activitiesIncome tax equivalents paid - 33 571 - 33 571 - 22 693 - 19 137 - 41 023Payments for employees - 132 656 - 132 656 - 121 089 - 116 318 - 114 546Payment for goods and services - 513 384 - 514 463 - 536 304 - 580 382 - 569 843Grants and subsidies paid - 2 132 - 2 132 - 2 129 - 2 178 - 2 227Interest paid - 68 198 - 67 233 - 70 123 - 69 025 - 75 258Other payments Total operating payments - 749 941 - 750 055 - 752 338 - 787 040 - 802 897NET CASH FLOWS FROM OPERATING ACTIVITIES 208 917 208 941 214 137 190 943 226 252Cash flows from investments in non financial assetsSales of non financial assets 1 026 1 026 154 1 359 1 359Purchases of non financial assets - 335 774 - 335 774 - 210 262 - 165 883 - 227 043Net cash flows from investments in non financial assets - 334 748 - 334 748 - 210 108 - 164 524 - 225 684NET CASH FROM OPERATING ACTIVITIES AND INVESTMENTS IN NON FINANCIAL ASSETS
- 125 831 - 125 807 4 029 26 419 568
Net cash flows from investments in financial assets for policy purposes1
Net cash flows from investments in financial assets for liquidity purposes
NET CASH FLOWS FROM INVESTING ACTIVITIES - 334 748 - 334 748 - 210 108 - 164 524 - 225 684Net cash flows from financing activitiesAdvances received (net) Borrowing (net) 95 052 93 052 29 195 12 000 39 000Deposits received (net) Dividends paid - 20 071 - 20 071 - 22 441 - 27 184 - 20 552Other financing (net) 15 000 15 000 NET CASH FLOWS FROM FINANCING ACTIVITIES 89 981 87 981 6 754 - 15 184 18 448NET INCREASE/DECREASE IN CASH HELD - 35 850 - 37 826 10 783 11 235 19 016Net cash flows from operating activities 208 917 208 941 214 137 190 943 226 252Net cash flows from investments in non financial assets - 334 748 - 334 748 - 210 108 - 164 524 - 225 684Dividends paid - 20 071 - 20 071 - 22 441 - 27 184 - 20 552CASH SURPLUS (+)/DEFICIT (-) - 145 902 - 145 878 - 18 412 - 765 - 19 984Additional information to the Cash Flow StatementCASH SURPLUS (+)/DEFICIT (-) - 145 902 - 145 878 - 18 412 - 765 - 19 984Acquisitions under finance leases and similar arrangements ABS GFS SURPLUS (+)/DEFICIT (-) including finance leases and similar arrangements
- 145 902 - 145 878 - 18 412 - 765 - 19 984
1 Includes equity acquisitions, disposals and privatisations (net).

38 Uniform Presentation Framework
2016-17 Mid-Year Report
Table 4.7
Non Financial Public Sector Comprehensive Operating Statement 2016-17 2016-17 2017-18 2018-19 2019-20
PEFO Revised Forward Estimates
$000 $000 $000 $000 $000
REVENUE
Taxation revenue 577 054 589 624 582 369 598 617 615 333
Current grants 4 245 449 4 266 935 4 260 795 4 335 674 4 589 465
Capital grants 385 211 387 026 203 925 42 432 20 560
Sales of goods and services 1 044 867 1 042 758 1 111 828 1 165 574 1 209 564
Interest income 88 037 87 547 86 106 89 712 91 874
Dividend and income tax equivalent income 11 679 17 704 19 328 15 963 19 898
Other revenue 224 697 227 629 199 611 202 950 205 865
TOTAL REVENUE 6 576 994 6 619 223 6 463 962 6 450 922 6 752 559
less EXPENSES
Employee benefits expense 2 279 243 2 313 556 2 343 062 2 348 537 2 416 946
Superannuation expenses
Superannuation interest cost 133 639 133 639 129 094 128 080 128 080
Other superannuation expenses 217 802 215 046 217 120 218 077 218 849
Depreciation and amortisation 521 152 523 355 532 459 535 009 539 516
Other operating expenses 1 973 359 1 991 110 1 983 544 2 037 253 2 058 904
Interest expenses 276 000 272 434 271 201 275 800 285 478
Other property expenses
Current grants 882 877 880 926 866 302 827 396 871 918
Capital grants 139 705 138 668 39 684 20 166 13 955
Subsidies and personal benefit payments 132 695 134 516 140 307 142 156 146 779
TOTAL EXPENSES 6 556 472 6 603 250 6 522 773 6 532 474 6 680 425
equals NET OPERATING BALANCE 20 522 15 973 - 58 811 - 81 552 72 134
plus Other economic flows – included in operating result
19 259 19 259 20 983 23 915 30 962
equals OPERATING RESULT 39 781 35 232 - 37 828 - 57 637 103 096
plus Other economic flows – other comprehensive income
183 762 183 762 173 406 245 582 239 197
equals COMPREHENSIVE RESULT – total change in net worth before transactions with owners in their capacity as owners
223 543 218 994 135 578 187 945 342 293
NET OPERATING BALANCE 20 522 15 973 - 58 811 - 81 552 72 134
less Net acquisition of non financial assets
Purchases of non financial assets 1 478 084 1 474 983 978 341 675 276 621 281
Sales of non financial assets - 85 900 - 85 900 - 69 877 - 63 476 - 63 476
less Depreciation 521 152 523 355 532 459 535 009 539 516
plus Change in inventories 6 344 6 344 5 275 5 290 5 305
plus Other movements in non financial assets 18 740 18 740 19 228 19 729 19 965
equals Total net acquisition of non financial assets 896 116 890 812 400 508 101 810 43 559
equals FISCAL BALANCE - 875 594 - 874 839 - 459 319 - 183 362 28 575

Uniform Presentation Framework 39
Table 4.8
Non Financial Public Sector Balance Sheet 2016-17 2016-17 2017-18 2018-19 2019-20
PEFO Revised Forward Estimates
$000 $000 $000 $000 $000
ASSETS
Financial assets
Cash and deposits 163 360 89 641 41 319 48 066 77 876
Advances paid 156 021 161 158 146 932 129 617 115 489
Investments, loans and placements 1 914 618 1 892 203 1 783 847 1 841 826 1 902 776
Receivables 435 219 479 165 485 174 494 675 505 281
Equity
Investments in other public sector entities 21 631 21 631 21 631 21 631 21 631
Investments – other 3 3 3 3 3
Other financial assets 16 249 16 249 16 249 16 249 16 249
Total financial assets 2 707 101 2 660 050 2 495 155 2 552 067 2 639 305
Non financial assets
Inventories 215 365 204 682 209 957 215 247 220 552
Property, plant and equipment 18 018 544 17 671 301 18 083 095 18 195 781 18 249 944
Investment property 98 694 99 694 88 694 77 694 66 694
Other non financial assets 198 177 165 035 148 763 137 109 136 755
Total non financial assets 18 530 780 18 140 712 18 530 509 18 625 831 18 673 945
TOTAL ASSETS 21 237 881 20 800 762 21 025 664 21 177 898 21 313 250
LIABILITIES
Deposits held 116 736 126 697 131 814 131 623 139 542
Advances received 277 784 282 881 274 895 266 315 257 083
Borrowing 4 504 208 4 402 313 4 624 381 4 803 451 4 833 627
Superannuation 4 041 654 4 104 850 3 945 850 3 707 349 3 468 849
Other employee benefits 630 130 649 171 651 469 652 808 654 178
Payables 335 138 322 331 324 362 329 697 330 838
Other liabilities 807 958 909 171 933 967 959 784 959 969
TOTAL LIABILITIES 10 713 608 10 797 414 10 886 738 10 851 027 10 644 086
NET ASSETS/(LIABILITIES) 10 524 273 10 003 348 10 138 926 10 326 871 10 669 164
Contributed equity
Accumulated surplus/(deficit) 3 341 347 3 015 325 3 150 977 3 338 925 3 681 241
Reserves 7 182 926 6 988 023 6 987 949 6 987 946 6 987 923
NET WORTH 10 524 273 10 003 348 10 138 926 10 326 871 10 669 164
NET FINANCIAL WORTH1 - 8 006 507 - 8 137 364 - 8 391 583 - 8 298 960 - 8 004 781
NET FINANCIAL LIABILITIES2 8 028 138 8 158 995 8 413 214 8 320 591 8 026 412
NET DEBT3 2 664 729 2 668 889 3 058 992 3 181 880 3 134 111
1 Net financial worth equals total financial assets minus total liabilities.2 Net financial liabilities equals the sum of total liabilities less total financial assets excluding investments in other public sector entities.3 Net debt equals the sum of deposits held, advances received and borrowing, minus the sum of cash and deposits, advances paid and
investments, loans and placements.

40 Uniform Presentation Framework
2016-17 Mid-Year Report
Table 4.9
Non Financial Public Sector Cash Flow Statement 2016-17 2016-17 2017-18 2018-19 2019-20
PEFO Revised Forward Estimates$000 $000 $000 $000 $000
Cash receipts from operating activitiesTaxes received 577 054 589 624 582 369 598 617 615 333Receipts from sales of goods and services 998 311 996 191 1 042 150 1 087 900 1 130 498Grants and subsidies received 4 630 658 4 653 959 4 464 720 4 378 106 4 610 027Interest receipts 88 037 87 547 86 106 89 712 91 874Dividends and income tax equivalents 20 246 24 132 17 704 19 328 15 963Other receipts 432 238 435 172 407 089 410 151 411 442Total operating receipts 6 746 544 6 786 625 6 600 138 6 583 814 6 875 137Cash payments for operating activitiesPayments for employees - 2 599 739 - 2 631 296 - 2 671 777 - 2 685 550 - 2 761 064Payment for goods and services - 2 168 197 - 2 186 163 - 2 120 116 - 2 174 760 - 2 221 020Grants and subsidies paid - 1 155 111 - 1 153 824 - 1 045 738 - 988 347 - 1 032 652Interest paid - 276 104 - 272 444 - 272 059 - 275 618 - 285 156Other payments Total operating payments - 6 199 151 - 6 243 727 - 6 109 690 - 6 124 275 - 6 299 892NET CASH FLOWS FROM OPERATING ACTIVITIES 547 393 542 898 490 448 459 539 575 245Cash flows from investments in non financial assetsSales of non financial assets 85 900 85 900 69 877 63 476 63 476Purchases of non financial assets - 1 478 084 - 1 474 983 - 978 341 - 675 276 - 621 281Net cash flows from investments in non financial assets - 1 392 184 - 1 389 083 - 908 464 - 611 800 - 557 805NET CASH FROM OPERATING ACTIVITIES AND INVESTMENTS IN NON FINANCIAL ASSETS
- 844 791 - 846 185 - 418 016 - 152 261 17 440
Net cash flows from investments in financial assets for policy purposes1
16 809 16 809 14 226 17 315 14 128
Net cash flows from investments in financial assets for liquidity purposes
317 017 317 017 136 269 - 28 606 - 30 621
NET CASH FLOWS FROM INVESTING ACTIVITIES - 1 058 358 - 1 055 257 - 757 969 - 623 091 - 574 298Net cash flows from financing activitiesAdvances received (net) - 10 583 - 10 583 - 7 986 - 8 580 - 9 232Borrowing (net) 86 604 - 15 396 222 068 179 070 30 176Deposits received (net) - 5 566 4 303 5 117 - 191 7 919Other financing (net) NET CASH FLOWS FROM FINANCING ACTIVITIES 70 455 - 21 676 219 199 170 299 28 863NET INCREASE/DECREASE IN CASH HELD - 440 510 - 534 035 - 48 322 6 747 29 810Net cash flows from operating activities 547 393 542 898 490 448 459 539 575 245Net cash flows from investments in non financial assets - 1 392 184 - 1 389 083 - 908 464 - 611 800 - 557 805CASH SURPLUS (+)/DEFICIT (-) - 844 791 - 846 185 - 418 016 - 152 261 17 440Future infrastructure and superannuation contributions/earnings2
- 24 441 - 24 441 - 25 907 - 27 461 - 29 109
UNDERLYING SURPLUS (+)/DEFICIT (-) - 869 232 - 870 626 - 443 923 - 179 722 - 11 669Additional information to the Cash Flow StatementCASH SURPLUS (+)/DEFICIT (-) - 844 791 - 846 185 - 418 016 - 152 261 17 440Acquisitions under finance leases and similar arrangements ABS GFS SURPLUS (+)/DEFICIT (-) including finance leases and similar arrangements
- 844 791 - 846 185 - 418 016 - 152 261 17 440
1 Includes equity acquisitions, disposals and privatisations (net).2 Contributions for future infrastructure and superannuation requirements.

Uniform Presentation Framework 41
Table 4.10
General Government Sector Taxes
2016-17 PEFO
2016-17 Revised
2017-18 Forward Estimate
$M $M $M
Taxes on employers’ payroll and labour force 294 304 298
Payroll taxes 294 304 298
Taxes on property 104 111 99
Stamp duties on financial and capital transactions 104 111 99
Taxes on the provision of goods and services 118 114 121
Taxes on gambling 76 76 79
Taxes on insurance 42 38 42
Taxes on the use of goods and performance of activities 71 71 73
Motor vehicle registration fees 71 71 73
TOTAL TAXES 587 599 592
Table 4.11
2016-17 Loan Council Allocation Budget-time
Estimate Mid-Year Estimate
$M $M
General government sector cash deficit (+)/surplus (-) 617 700
Public non financial corporations sector cash deficit (+)/surplus (-) 146 146
Non financial public sector cash deficit (+)/surplus (-) 763 846
less Acquisitions under finance leases and similar arrangements
equals ABS GFS cash deficit (+)/surplus (-) 763 846
less Net cash flows from investments in financial assets for policy purposes 17 17
plus Memorandum items
2016-17 LOAN COUNCIL ALLOCATION 746 829
Note: The worsening in the Mid-Year Estimate when compared to the original May 2016 Budget largely reflects funding decisions made by the former government and carry forward of expenditure from 2015-16 into 2016-17. This revised estimate is outside the 2 per cent tolerance limit of non financial public sector operating cash receipts of $136 million when compared to the original Loan Council allocation of $150 million.

42
2016-17 Mid-Year Report

Agency Output Statements 43
Chapter 5Agency Output StatementsOverview
This chapter provides high-level financial summary information for each budget sector agency and business division incorporating the new agencies formed following the Administrative Arrangements Order of 12 September 2016.
For agencies, output tables are presented setting out the 2016-17 Budget, as per the August 2016 Pre-Election Fiscal Outlook Report (PEFO), and the revised 2016-17 mid-year Budget. Where an agency has been restructured since PEFO, the Budget column has been backcast for comparative purposes and therefore presents the PEFO budget position as though the new agency structure had been in place prior to the Administrative Arrangement Order changes of 12 September 2016.
The output tables include total expenses and total appropriation by purpose for each agency’s current output groups and outputs.
Detailed information, such as output and business line descriptions, performance measures and key variations, has not been provided however this information will be included in Budget Paper No. 3 when the 2017-18 Budget is released in May 2017.
For business divisions, business line information is presented for the PEFO Budget and the revised 2016-17 mid-year Budget for income, expenses and the net surplus/deficit before income tax.
The 2016-17 Mid-Year Report information includes policy changes to incorporate Government’s election commitments. Detailed information in relation to these commitments, including the revised infrastructure program, will be provided in the 2017-18 Budget Papers.

44 Agency Output Statements
2016-17 Mid-Year Report
Auditor-General’s Office2016-17 2016-17
Output Group/Output Budget (PEFO) Revised
$000 $000
Audit and Reviews 4 250 4 250
Audit and Reviews 4 250 4 250
Corporate and Governance 635 635
Corporate and Governance 635 635
Total expenses 4 885 4 885
Appropriation
Output 3 152 3 152
Northern Territory Electoral Commission2016-17 2016-17
Output Group/Output Budget (PEFO) Revised
$000 $000
Electoral Services 3 338 3 338
Electoral Services 3 338 3 338
Corporate and Governance 180 180
Corporate and Governance 180 180
Total expenses 3 518 3 518
Appropriation
Output 2 372 2 372
Ombudsman’s Office2016-17 2016-17
Output Group/Output Budget (PEFO) Revised
$000 $000
Ombudsman Operations 2 060 2 060
Ombudsman Operations 2 060 2 060
Corporate and Governance 280 280
Corporate and Governance 280 280
Total expenses 2 340 2 340
Appropriation
Output 1 948 1 948

Agency Output Statements 45
Department of the Chief Minister2016-17 2016-17
Output Group/Output Budget (PEFO) Revised
$000 $000
Advice and Coordination 36 789 38 075
Strategic Policy Coordination 17 657 15 966
Regional Coordination and Aboriginal Affairs 17 819 17 746
Inquiries and Commissions 1 313 4 363
Government Business Support 25 531 25 494
Support to Ministers and Leader of the Opposition 17 973 17 936
Support to the Administrator 2 750 2 750
Government Services 4 808 4 808
Corporate and Governance 7 733 7 723
Corporate and Governance 7 313 7 303
Shared Corporate Services Provided 420 420
Total expenses 70 053 71 292
Appropriation
Output 59 777 62 684
Commonwealth 1 668
Department of the Legislative Assembly2016-17 2016-17
Output Group/Output Budget (PEFO) Revised
$000 $000
Parliamentary Services 29 053 29 053
Assembly Services 3 639 3 639
Members and Client Services 15 893 15 893
Building Management Services 9 521 9 521
Corporate and Governance 1 454 1 454
Corporate and Governance 1 454 1 454
Total expenses 30 507 30 507
Appropriation
Output 24 208 24 208
Capital 41 41

46 Agency Output Statements
2016-17 Mid-Year Report
Northern Territory Police, Fire and Emergency Services2016-17 2016-17
Output Group/Output Budget (PEFO) Revised
$000 $000
Community Safety and Crime Prevention 110 965 111 356
Community Safety and Crime Prevention 110 965 111 356
General Policing Crime Detection Investigation and Prosecution 202 331 202 782
Response Services 66 138 66 372
Investigations 90 266 90 585
Services to the Judicial Process 45 927 45 825
Road Safety Services 28 452 28 553
Road Safety Services 28 452 28 553
Fire Prevention and Response Management 38 256 38 219
Fire Prevention and Response Management 38 256 38 219
Emergency Services 6 823 7 218
Emergency Services 6 823 7 218
Corporate and Governance 16 373 16 357
Corporate and Governance 16 373 16 357
Total expenses 403 200 404 485
Appropriation
Output 329 073 332 118
Capital 20 571 16 870
Commonwealth 27 283 27 283

Agency Output Statements 47
Department of Trade, Business and Innovation2016-17 2016-17
Output Group/Output Budget (PEFO) Revised
$000 $000
Business and Industry Development and Support 64 477 59 459
Business and Innovation NT 40 073 35 223
Procurement NT 3 614 3 614
Northern Australia Development and Trade 11 748 11 835
Strategic Infrastructure and Projects 8 128 7 873
Chief Scientist 914 914
Employment and Skilling 109 755 106 094
Employment and Skilling NT 109 755 106 094
Corporate and Governance 5 929 5 924
Corporate and Governance 5 929 5 924
Total expenses 180 161 171 477
Appropriation
Output 148 385 143 602
Capital 964 964
Commonwealth 20 313 20 313

48 Agency Output Statements
2016-17 Mid-Year Report
Department of Treasury and Finance2016-17 2016-17
Output Group/Output Budget (PEFO) Revised
$000 $000
Financial Management 5 663 5 663
Financial Management 5 663 5 663
Economic 121 883 121 883
Economic Services 10 240 10 240
Payments on Behalf of Government 111 643 111 643
Territory Revenue 17 672 17 672
Territory Revenue 7 172 7 172
Tax-Related Subsidies 10 500 10 500
Superannuation 2 990 2 990
Superannuation 2 990 2 990
Economic Regulation 1 518 1 518
Utilities Commission 1 518 1 518
Corporate and Governance 5 233 5 233
Corporate and Governance 4 864 4 864
Shared Corporate Services Provided 369 369
Total expenses 154 959 154 959
Appropriation
Output 148 645 148 645
Northern Territory Treasury Corporation2016-17 2016-17
Business Line Budget (PEFO) Revised
$000 $000
Income 219 371 215 805
Government Loans and Investments 219 371 215 805
Expenses 207 692 198 101
Government Loans and Investments 207 692 198 101
SURPLUS (+)/DEFICIT (-) BEFORE INCOME TAX 11 679 17 704

Agency Output Statements 49
Department of Infrastructure, Planning and Logistics2016-17 2016-17
Output Group/Output Budget (PEFO) Revised
$000 $000
Infrastructure Investment Program Support and Delivery 35 243 35 481
Infrastructure Investment Delivery 28 188 28 427
Program Support 3 859 3 858
Asset Management 3 196 3 196
Lands and Planning 52 455 52 451
Land Development 9 992 9 991
Development Assessment Services 3 927 3 927
Crown Land Estate Management 21 153 21 152
Aboriginal Land 1 297 1 297
Lands Planning 2 684 2 684
Building Advisory Services 3 940 3 939
Land Information 9 462 9 461
Logistics Infrastructure and Services 257 265 258 742
Passenger Transport 56 974 56 973
Registration Licensing and Road Safety 16 712 16 705
Transport Regulation and Compliance 6 574 6 571
Transport Planning and Delivery 160 753 162 241
Transport Assets 16 252 16 252
Strategy Policy and Legislation 5 663 5 662
Strategy Policy and Legislation 5 663 5 662
Statutory Bodies 540 539
Northern Territory Planning Commission 540 539
Corporate and Governance 20 177 19 898
Corporate and Governance 20 177 19 898
Total expenses 371 343 372 773
Appropriation
Output 239 504 239 434
Capital 356 032 349 232
Commonwealth 259 300 259 300

50 Agency Output Statements
2016-17 Mid-Year Report
Land Development Corporation2016-17 2016-17
Business Line Budget (PEFO) Revised
$000 $000
Income 18 941 18 941
Residential Development 5 682 5 682
Industrial Development 13 259 13 259
Expenses 15 538 15 511
Residential Development 4 661 4 653
Industrial Development 10 877 10 858
SURPLUS (+)/DEFICIT (-) BEFORE INCOME TAX 3 403 3 430
Residential Development 1 021 1 029
Industrial Development 2 382 2 401

Agency Output Statements 51
Department of the Attorney-General and Justice2016-17 2016-17
Output Group/Output Budget (PEFO) Revised
$000 $000Legal Services 39 314 37 539
Solicitor for the Northern Territory 12 130 11 437 Crime Victims Services Unit 5 974 5 935 Legal Policy 20 142 19 160 Criminal Justice Research and Statistics 1 068 1 007
Custodial Services 170 907 170 984 Custodial Operations 160 701 160 778 Education and Offender Programs 10 206 10 206
Correctional Industries and Employment 22 373 22 456 Correctional Industries and Employment 22 373 22 456
Community Corrections 23 320 24 709 Community Corrections 22 606 23 951 Parole Board 714 758
Court Support Services 46 842 46 815 Higher Courts 12 296 12 271 Lower Courts and Tribunals 26 388 26 386 Fines Recovery Unit 2 992 2 992 Integrated Justice Information System 5 166 5 166
Director of Public Prosecutions 13 250 12 774 Director of Public Prosecutions 13 250 12 774
Independent Offices 14 465 14 204 Consumer Affairs 2 181 2 414 Anti-Discrimination Commission 2 226 2 099 Information and Public Interest Disclosures Commission 1 195 1 127 Registrar-General 2 620 2 620 Public Trustee 1 014 1 014 Health and Community Services Complaints Commission 1 215 1 146 Children’s Commissioner 1 516 1 428 Office of Parliamentary Counsel 2 498 2 356
Regulatory Support 44 896 48 167 Licencing NT 36 728 39 486 NT Worksafe 8 168 8 681
Corporate and Governance 13 412 12 593 Corporate and Governance 13 412 12 593
Total expenses 388 779 390 241
AppropriationOutput 298 944 299 001 Capital 6 319 8 319 Commonwealth 8 995 8 995

52 Agency Output Statements
2016-17 Mid-Year Report
Department of Health2016-17 2016-17
Output Group/Output Budget (PEFO) Revised
$000 $000
Territory-Wide Primary Health Care 31 181 14 120
Territory-Wide Primary Health Care 31 181 14 120
Disease Prevention and Health Protection 21 288 21 330
Environmental Health 4 206 4 206
Disease Control 17 082 17 124
Community Treatment and Extended Care 142 020 141 458
Alcohol and Other Drugs 39 863 35 575
Disability Services 93 758 96 534
Mental Health 8 399 9 349
Corporate and Governance 93 596 94 653
Corporate and Governance 49 545 50 602
Shared Services Provided 44 051 44 051
National Critical Care and Trauma Response 10 495 10 495
National Critical Care and Trauma Response 10 495 10 495
Office of the Public Guardian 4 608 4 608
Office of the Public Guardian 4 608 4 608
Health Services 1 102 357 1 133 957
Top End and Central Australia Health Services 1 102 357 1 133 957
Total expenses 1 405 545 1 420 621
Appropriation
Output 1 023 745 1 011 400
Capital 31 679 31 679
Commonwealth 62 690 65 366

Agency Output Statements 53
Top End Health Service2016-17 2016-17
Output Group/Output Budget (PEFO) Revised
$000 $000
Top End Hospitals 527 053 559 597
Top End Hospitals 527 053 559 597
Community Treatment and Extended Care 44 363 42 282
Mental Health 30 976 30 311
Aged Care 1 370 3 575
Alcohol and Other Drugs 12 017 8 396
Primary Health Care 112 447 122 299
Remote Primary Health Care 80 257 86 124
Urban Primary Health Care 14 125 14 125
Top End-Wide Community Services 18 065 22 050
Top End-Wide Support Services 169 572 166 251
Top End-Wide Support Services 169 572 166 251
Total expenses 853 435 890 429
Income 830 938 870 566
SURPLUS(+)/DEFICIT (-) BEFORE INCOME TAX - 22 497 - 19 863
Central Australia Health Service2016-17 2016-17
Output Group/Output Budget (PEFO) Revised
$000 $000
Central Australia Hospitals 239 644 235 774
Central Australia Hospitals 239 644 235 774
Community Treatment and Extended Care 29 201 26 561
Mental Health 17 589 17 574
Aged Care 258 785
Alcohol and Other Drugs 11 354 8 202
Primary Health Care 50 739 61 788
Remote Primary Health Care 36 702 48 276
Urban Primary Health Care 6 714 6 848
Central Australia-Wide Community Services 7 323 6 664
Central Australia-Wide Support Services 67 630 68 933
Central Australia-Wide Support Services 67 630 68 933
Total expenses 387 214 393 056
Income 377 905 385 868
SURPLUS (+)/DEFICIT (-) BEFORE INCOME TAX - 9 309 - 7 188

54 Agency Output Statements
2016-17 Mid-Year Report
Department of Housing and Community Development2016-17 2016-17
Output Group/Output Budget (PEFO) Revised
$000 $000
Housing Services 300 647 307 184
Housing Services Delivery 252 895 258 932
Housing Program Delivery 47 752 48 252
Community Development 319 727 319 142
Community Development 136 166 136 166
Language Services 9 127 9 127
Local Government 93 950 93 950
Homelands, Outstations and Town Camps 60 907 60 907
Strategy and Planning 19 577 18 992
Corporate and Governance 17 808 17 687
Corporate and Governance 17 808 17 687
Total expenses 638 182 644 013
Appropriation
Output 254 725 259 645
Capital 56 304 56 304
Commonwealth 227 095 231 877
NT Home Ownership2016-17 2016-17
Business Line Budget (PEFO) Revised
$000 $000
Income 12 723 12 723
NT Home Ownership 12 723 12 723
Expenses 12 674 12 522
NT Home Ownership 12 674 12 522
SURPLUS (+)/DEFICIT (-) BEFORE INCOME TAX 49 201

Agency Output Statements 55
Office of the Commissioner for Public Employment2016-17 2016-17
Output Group/Output Budget (PEFO) Revised
$000 $000
Employment Services 6 609 6 609
Employee and Industrial Relations 2 358 2 358
Workforce Planning and Development 3 489 3 489
Public Sector Appeals and Grievance Reviews 762 762
Corporate and Governance 984 984
Corporate and Governance 564 564
Shared Corporate Services Received 420 420
Total expenses 7 593 7 593
Appropriation
Output 5 862 5 862

56 Agency Output Statements
2016-17 Mid-Year Report
Department of Primary Industry and Resources2016-17 2016-17
Output Group/Output Budget (PEFO) Revised
$000 $000
Food Industry Development 29 960 34 169
Market and Enterprise Development 16 112 20 200
Plant Industries Development 8 264 8 261
Livestock Industries Development 4 651 4 776
Major Economic Projects 933 932
Resource and Product Integrity 24 340 24 378
Biosecurity and Animal Welfare 11 906 11 788
Fisheries 12 434 12 590
Water Testing Services 2 619 2 619
Water Testing Services 2 619 2 619
Industry Development 12 140 12 127
Industry Reporting 1 655 1 655
Geoscience and Industry Development Services 10 485 10 472
Mining Services 21 173 21 166
Mineral Titles Management 3 429 3 429
Mining Operations Management 6 135 6 129
Legacy Mines 11 609 11 608
Energy Services 3 905 3 899
Energy Management 3 905 3 899
Corporate and Governance 9 884 10 122
Corporate and Governance 9 884 10 122
Total expenses 104 021 108 480
Appropriation
Output 72 902 77 186
Capital 251 251
Commonwealth 20 126 20 010

Agency Output Statements 57
Department of Environment and Natural Resources2016-17 2016-17
Output Group/Output Budget (PEFO) Revised
$000 $000
Environment and Natural Resources 54 180 54 850
Fauna and Flora 7 209 8 032
Rangelands 12 556 13 340
Water Resources 17 703 16 443
Bushfires 9 256 9 580
Environment 7 456 7 455
Statutory Body 557 557
Northern Territory Environment Protection Authority 557 557
Corporate and Governance 5 408 5 406
Corporate and Governance 5 408 5 406
Total expenses 60 145 60 813
Appropriation
Output 45 709 45 661
Capital 974 974
Commonwealth 2 831 2 135
Department of Tourism and Culture2016-17 2016-17
Output Group/Output Budget (PEFO) Revised
$000 $000
Tourism and Culture 243 992 245 337
Parks and Wildlife 50 244 50 339
Tourism NT 47 326 48 299
Arts and Museums 53 025 52 917
Sport and Recreation 57 328 58 060
Darwin Waterfront Corporation 19 733 19 733
NT Major Events Corporation 16 336 15 989
Corporate and Governance 6 568 6 568
Corporate and Governance 6 568 6 568
Total expenses 250 560 251 905
Appropriation
Output 215 947 216 123
Capital 305 305
Commonwealth 775 775

58 Agency Output Statements
2016-17 Mid-Year Report
Territory Wildlife Parks 2016-17 2016-17
Business Line Budget (PEFO) Revised
$000 $000
Income 10 462 10 462
Territory Wildlife Park 5 208 5 208
Alice Springs Desert Park 5 254 5 254
Expenses 12 243 12 243
Territory Wildlife Park 6 427 6 427
Alice Springs Desert Park 5 816 5 816
SURPLUS (+)/DEFICIT (-) BEFORE INCOME TAX - 1 781 - 1 781
Department of Corporate and Information Services2016-17 2016-17
Output Group/Output Budget (PEFO) Revised
$000 $000
Shared Services 205 991 201 929
Finance Services 16 712 16 809
Human Resource Services 31 303 31 699
Procurement Services 3 150 3 654
Information and Communications Technology Services 36 359 37 247
Property Leasing Services 90 305 88 557
Asset Services 19 162 12 371
Project Services 9 000 11 592
Corporate and Governance 5 959 5 956
Corporate and Governance 4 979 4 989
Shared Corporate Services Provided 980 967
Total expenses 211 950 207 885
Appropriation
Output 145 537 144 679
Capital 53 418 53 073

Agency Output Statements 59
NT Fleet2016-17 2016-17
Business Line Budget (PEFO) Revised
$000 $000
Income 42 414 42 414
Vehicle Fleet Services 42 414 42 414
Expenses 32 406 32 464
Vehicle Fleet Services 32 406 32 464
SURPLUS (+)/DEFICIT (-) BEFORE INCOME TAX 10 008 9 950
Data Centre Services2016-17 2016-17
Business Line Budget (PEFO) Revised
$000 $000
Income 24 941 24 941
Data Centre Management 24 941 24 941
Expenses 21 604 21 364
Data Centre Management 21 604 21 364
SURPLUS (+)/DEFICIT (-) BEFORE INCOME TAX 3 337 3 577
Aboriginal Areas Protection Authority2016-17 2016-17
Output Group/Output Budget (PEFO) Revised
$000 $000
Protection of Sacred Sites 3 676 3 676
Protection of Sacred Sites 3 676 3 676
Corporate and Governance 1 225 1 225
Corporate and Governance 1 225 1 225
Total expenses 4 901 4 901
Appropriation
Output 2 716 2 716

60 Agency Output Statements
2016-17 Mid-Year Report
Department of Education2016-17 2016-17
Output Group/Output Budget (PEFO) Revised
$000 $000
Government Education 704 616 724 636
Early Years 24 241 25 676
International Education 937 985
Middle Years Education 133 792 137 225
Preschool Education 44 255 47 664
Primary Education 371 338 380 158
Senior Years Education 120 162 123 037
Tertiary Education 9 891 9 891
Non-Government Education 243 576 243 585
Middle Years Education 70 229 70 232
Primary Education 127 071 127 075
Senior Years Education 46 276 46 278
Corporate Governance 30 491 30 491
Corporate and Governance 30 491 30 491
Total expenses 978 683 998 712
Appropriation
Output 561 904 577 138
Commonwealth 340 021 340 021

Agency Output Statements 61
Territory Families2016-17 2016-17
Output Group/Output Budget (PEFO) Revised
$000 $000
Seniors and Carers 29 854 29 854
Seniors and Carers 29 854 29 854
Community Engagement and Programs 4 862 4 862
Gender Equity 1 498 1 498
Social Inclusion 3 364 3 364
Children and Families 203 465 203 537
Child Protection 26 416 26 978
Out of Home Care 101 476 101 134
Family Support 28 893 28 688
Youth Justice 23 399 23 456
Domestic Violence 23 281 23 281
Corporate and Governance 15 350 16 488
Corporate and Governance 13 489 14 858
Shared Corporate Services Received 1 861 1 630
Total expenses 253 531 254 741
Appropriation
Output 226 985 227 275
Commonwealth 16 910 16 910

62
2016-17 Mid-Year Report

63Appendix A
Appendix A Classification of Entities in the Northern TerritoryNon Financial Public Sector
General GovernmentAboriginal Areas Protection AuthorityAuditor‑General’s OfficeAustralAsia Railway Corporation1
Batchelor Institute of Indigenous Tertiary Education1
Central Australia Health Service2
Central Holding AuthorityDarwin Waterfront Corporation1
Data Centre Services2
Department of the Attorney‑General and JusticeDepartment of the Chief MinisterDepartment of Corporate and Information ServicesDepartment of EducationDepartment of Environment and Natural ResourcesDepartment of Health Department of Housing and Community DevelopmentDepartment of Infrastructure, Planning and LogisticsDepartment of the Legislative AssemblyDepartment of Primary Industry and ResourcesDepartment of Tourism and CultureDepartment of Trade, Business and InnovationDepartment of Treasury and Finance Desert Knowledge Australia1
Motor Accidents (Compensation) Commission1
Museums and Art Galleries Board of the Northern Territory1
Nominal Insurer’s Fund1
Northern Territory Electoral CommissionNorthern Territory Legal Aid Commission1
Northern Territory Major Events Company Pty Ltd1
Northern Territory Police, Fire and Emergency ServicesNT Build Statutory Corporation1
NT Fleet2
NT Home Ownership2
Office of the Commissioner for Public EmploymentOmbudsman’s OfficeTerritory FamiliesTerritory Wildlife Parks2
Top End Health Service2
Public Non Financial Corporations Indigenous Essential Services Pty Ltd1
Jacana Energy1,3
Land Development Corporation2
Power and Water Corporation1,3
Territory Generation1,3
1 Non‑budget sector entity.2 Government business division.3 Government owned corporation.

64 Appendix B
2016-17 Mid-Year Report
Appendix B Glossary
Advances/advances paidAdvances are the creation of financial assets (that is, an increase in the indebtedness to government units) with the aim of funding particular enterprise, household or government activities.
AgencyA unit of government administration, or office or statutory corporation, nominated in an Administrative Arrangements Order for the purposes of the Financial Management Act and including, where the case requires, a part or division (by whatever name called) of an agency.
AppropriationAn authority given by the Legislative Assembly to make payments, now or at some future time, for the purposes stated, up to the limit of the amount in the particular Act.
Australian accounting standardsStatements of accounting standards that can be applied in preparation and presentation of financial statements.
Capital grantsTransactions in which the ownership of an asset (other than cash and inventories) is transferred from one institutional unit to another, cash is transferred to enable the recipient to acquire another asset, or the funds realised by the disposal of another asset are transferred, for which no economic benefits of equal value are receivable or payable in return.
Cash surplus/deficitReported in the Cash Flow Statement and measures the net impact of cash flows during the period. It equals net cash flows from operating activities plus net cash flows from acquisition and disposal of non financial assets, less distributions paid, less value of assets acquired under finance leases and similar arrangements.
Commonwealth own‑purpose expenses (COPE) Payments by the Commonwealth for goods and services and associated transfer payments for the conduct of its general government activities.
Comprehensive resultThe net result of all items of income and expense recognised for the period. It is the aggregate of operating result and other movements in equity, other than transactions with owners as owners.
Consumer price index (CPI)A general indicator of the prices paid by household consumers for a specific basket of goods and services, in one period relative to the cost of the same basket in a base period.
Contingent liabilityA potential financial obligation arising out of a condition, situation, guarantee or indemnity, the ultimate effect of which will be confirmed only on the occurrence or non‑occurrence of one or more uncertain future events.

Appendix B 65
Current grantsAmounts payable or receivable for current purposes for which no economic benefits of equal value are receivable or payable in return.
Finance leaseLease agreements that transfer substantially all the risks and benefits relating to ownership of an asset from the lessor (legal owner) to the lessee (party using the asset).
Financial assetAny asset that is:
•cash;
•an equity instrument of another entity;
•a contractual right:
− to receive cash or another financial asset from another entity; or
− to exchange financial assets or financial liabilities with another entity under conditions potentially favourable to the entity; or
•a contract that will or may be settled in the entity’s own equity instruments and is:
− a non‑derivative for which the entity is or may be obliged to receive a variable number of the entity’s own equity instruments; or
− a derivative that will or may be settled other than by the exchange of a fixed amount of cash or another financial asset for a fixed number of the entity’s own equity instruments.
For this purpose, the entity’s own equity instruments do not include instruments that are themselves contracts for the future receipt or delivery of the entity’s own equity instruments.
Fiscal balance (net lending/borrowing)Fiscal balance, also referred to as net lending/borrowing, is an operating statement measure that differs from the net operating balance as it includes spending on capital items but excludes depreciation. A net lending (or fiscal surplus) balance indicates that a government is saving more than enough to finance all its investment spending. A net borrowing (or fiscal deficit) position indicates that a government’s level of investment is greater than its level of savings.
General government sectorDefined in Government Finance Statistics as an entity or group of entities mainly engaged in the production of goods and or services outside the normal market mechanism. Goods and services are provided free of charge or at nominal charges well below costs of production.
Generally accepted accounting principles (GAAP)Term used to describe broadly the body of principles that governs the accounting for financial transactions underlying the preparation of a set of financial statements.
Goods and services tax (GST) revenueOn 1 July 2000, the Commonwealth introduced GST. Payments from the Commonwealth return the GST revenue to the states and territories, replacing the previous general purpose grants.
Government business division (GBD)A Territory‑controlled trading entity that follows commercial practices and is required to comply with competitive neutrality principles.

66 Appendix B
2016-17 Mid-Year Report
Government finance statistics (GFS)Refers to statistics that measure the financial transactions of governments and reflect the impact of those transactions on other sectors of the economy. GFS in Australia are developed by the Australian Bureau of Statistics in conjunction with all governments and are mainly based on international statistical standards developed, in consultation with member countries, by the International Monetary Fund.
Government owned corporationAn entity in which its objectives are to operate at least as efficiently as any corporate business and maximise sustainable return to government. The Government Owned Corporations Act adopts the shareholder model of corporate governance. The Territory has three government owned corporations, Power and Water Corporation, power generation (Territory Generation) and power retail corporation (Jacana Energy).
GrantsTransactions in which one unit provides goods, services, assets (or extinguishes a liability) or labour to another unit without receiving approximately equal value in return. Grants can either be of a current or capital nature (see current grants and capital grants).
Grants can be paid as general purpose grants, which refer to grants not subject to conditions regarding their use. Alternatively, they may be paid as specific purpose grants, which are paid for a particular purpose and or have conditions attached regarding their use.
Gross domestic product (GDP)The total value of goods and services produced in Australia over the period for final consumption. Intermediate goods, or those used in the production of other goods, are excluded. Gross domestic product can be calculated by summing total output, total income or total expenditure.
GuaranteeAn undertaking to answer for the debt or obligations of another person or entity.
IndemnityA written undertaking to compensate, protect or insure another person or entity against future financial loss, damage or liability.
Intergovernmental agreementAn agreement signed by all states and the Commonwealth in December 2008 defining the framework for federal financial relations, encompassing Commonwealth funding to states through general revenue assistance, specific purpose payments and national partnership payments.
Loan Council The Australian Loan Council coordinates borrowing by Commonwealth and state governments. Current arrangements seek to emphasise transparency of public sector finances, through financial market scrutiny of proposed borrowing to restrict borrowing to prudent levels.
Loan Council Allocation The nomination to the Loan Council of the level of financing required.
Memorandum items – Loan CouncilMemorandum items are used to adjust the cash surplus/deficit to include in the Loan Council Allocation certain transactions that may have the characteristics of public sector borrowings but do not constitute formal borrowings.

Appendix B 67
National partnership agreementsNational partnership (NP) agreements are agreements between the Commonwealth, states and territories with defined objectives, outcomes, outputs and performance measures related to the delivery of projects of national significance or to facilitate reforms.
National partnership paymentsNP payments are tied Commonwealth grants provided to states and territories to enable them to achieve the outcomes and outputs of an NP agreement.
Net cash flows from investments in financial assets (liquidity management purposes)Cash receipts from liquidation or repayment of investments in financial assets for liquidity management purposes less cash payments for such investments. Investment for liquidity management purposes means making funds available to others with no policy intent and with the aim of earning a commercial rate of return.
Net cash flows from investments in financial assets (policy purposes) Cash receipts from the repayment and liquidation of investments in financial assets for policy purposes less cash payments for acquiring financial assets for policy purposes. Acquisition of financial assets for policy purposes is distinguished from investments in financial assets (liquidity management purposes) by the underlying government motivation for acquiring the assets. Acquisition of financial assets for policy purposes is motivated by government policies such as encouraging the development of certain industries or assisting citizens affected by natural disasters.
Net debtNet debt measures a government’s net stock of selected gross financial liabilities less financial assets.
Net debt equals the sum of deposits held, advances received, government securities, loans and other borrowing less the sum of cash and deposits, advances paid and investments, loans and placements.
Net financial liabilitiesTotal liabilities less financial assets, other than equity in public non financial corporations and public financial corporations. This measure is broader than net debt, as it includes significant liabilities, other than borrowings (for example, accrued employee liabilities such as superannuation and long service leave entitlements). For the public non financial corporation and public financial corporation sectors, it is equal to negative net financial worth.
Net financial worthA measure of a government’s net holdings of financial assets. It is calculated from the Uniform Presentation Framework Balance Sheet as financial assets minus liabilities. Net financial worth is a broader measure than net debt as it incorporates provisions (such as superannuation, but excludes depreciation and doubtful debts) as well as holdings of equity. Net financial worth includes all classes of financial assets and liabilities.
Net operating balance The revenue from transactions minus expenses from transactions. It is a summary measure of the ongoing sustainability of operations and excludes gains and losses resulting from changes in price levels and other changes in the volume of assets. It is the component of the change in net worth that is due to transactions and can be attributed directly to government policies.

68 Appendix B
2016-17 Mid-Year Report
Net worthProvides a relatively comprehensive picture of a government’s overall financial position. It is calculated as total assets less total liabilities less shares and other contributed capital. It includes a government’s non financial assets such as land and other fixed assets, which may be sold and used to repay debt, as well as its financial assets and liabilities including debtors, creditors and superannuation liabilities. Net worth also shows asset acquisitions over time, giving an indication of the extent to which borrowings are used to finance asset purchases, rather than only current expenditure.
Non financial assetsAssets that are not financial assets, predominantly land and other fixed assets.
Non financial public sectorThe sector formed through a consolidation of the general government and public non financial corporation subsectors.
Other economic flowsChanges in the volume or value of an asset or liability that do not result from transactions (such as revaluations and other changes in the volume of assets).
Other superannuation expenseIncludes all superannuation expenses from transactions except superannuation interest cost. It generally includes current service cost, which is the increase in entitlements associated with the employment services provided by employees in the current period. Superannuation actuarial gains/losses are excluded as they are considered other economic flows.
PayablesIncludes short‑term and long‑term trade debt and accounts payable, grants and interest payable.
Public financial corporationsGovernment‑controlled entities that perform central bank functions and or have the authority to incur liabilities and acquire financial assets in the market on their own account.
Public non financial corporationsPublic enterprises primarily engaged in the production of goods or services of a non financial nature, for sale in the market place, at prices that aim to recover most of the costs involved.
ReceivablesIncludes short‑term and long‑term trade credit and accounts receivable, grants, taxes and interest receivable.
Sale of goods and servicesRevenue from the direct provision of goods and services and includes fees and charges for services rendered, sale of goods and services, fees from regulatory services and work done as an agent for private enterprises. It also includes rental income under operating leases and on produced assets, such as buildings and entertainment, but excludes rental income from the use of non‑produced assets, such as land. User charges include sale of goods and services revenue.
Specific purpose payments (SPPs)A Commonwealth financial contribution to support state delivery of services in a particular sector. Payments are made from the Commonwealth Treasury to state treasuries and are appropriated to the relevant Territory agency.
State final demand (SFD)Final consumption expenditure plus gross fixed capital formation in each jurisdiction. It represents the total expenditure on consumption and investment in a jurisdiction.

Appendix B 69
Treasurer’s AdvanceAn appropriation purpose of that name as specified in an Appropriation Act, which provides a pool of funds specifically set aside in each Budget to meet one‑off unexpected costs that arise during the year and are substantial enough to warrant additional appropriation.
Uniform Presentation Framework (UPF) A uniform framework agreed by the Australian Loan Council in 2000, which is a revision of the agreement reached at the 1991 Premiers’ Conference. The UPF was further updated and re‑issued in April 2008 to incorporate accounting standard AASB 1049 Whole of Government and General Government Sector Financial Reporting. The UPF specifies that the Commonwealth, state and territory governments will present a minimum set of budget and financial outcome information based on the government finance statistics, according to an agreed format and specified Loan Council reporting arrangements.

NORTHERN TERRITORY GOVERNMENT
Department of Treasury and Finance19 The Mall, GPO Box 1974, Darwin NT 0801Telephone: +61 8 8999 7425
www.treasury.nt.gov.au
MID-YEARREPORT
2016-17


