The presence of optical displays from atmospherichydrometeors can be quite informative of the shapesand orientations, and even the sizes, of the ice orwater particles that cause the phenomenon. In thisway, observations of halos, arcs, and coronas in cirrusclouds, for example, can be considered a form of pas-sive remote sensing that reveals information on thecontent of these ice clouds. The mere presence ofhalos and many arcs establishes, on the basis of ray-tracing theory simulations, that the particles display
When this research was performed, K. Sassen �[email protected]�, J. Zhu, and S. Benson were with the Department ofMetrology, University of Utah, Salt Lake City, Utah 84112. K.Sassen is now with the Geophysical Institute, P. O. Box 757320,University of Alaska Fairbanks, Fairbanks, Alaska 99775-7320.
Received 18 January 2002; revised manuscript received 20 May2002.
a basic hexagonal symmetry and that the ice crystalscan be oriented in certain fashions as they fallthrough the atmosphere. Because of the effects ofdiffraction during the scattering of Sun �or Moon�light, the crystals must be ��25 �m in maximumdimension to generate bright halos, according to lab-oratory findings.1 That some particles are capableof maintaining uniform orientations is in itself anindication of particle size: planar or columnar crys-tals greater than approximately 100–200 �m areneeded, according to light pillar studies.2 The ap-pearance of corona or iridescence, however, indicatesparticle sizes of ��30 �m. It has only recently beenproved that small hexagonal ice crystals in cirrus cangenerate the corona3,4 and iridescence5 phenomena.
There are three fundamental scattering processesthat lead to the formation of optical displays: inter-nal scattering following refraction, surface reflectionand diffraction.6–8 Refraction of sunlight throughice crystals produces colored displays because of the�slight� dependence of the refractive index of ice onwavelength. Thus colored halos and arcs reveal re-
fracted ray paths, whereas white arcs are caused bysurface reflections. Diffraction and ray interferenceproduces colorization through the superimposition offorward-scattered peaks in the angular phase func-tion whose positions depend on particle size relativeto the incident wavelength of light. Provided thatthe particle-size spectrum is sufficiently narrow topromote this effect, the angular positions of the col-ored rings formed about the Sun can be used to inferthe mean particle size.3,9
The ability of nonspherical hydrometeors to be-come uniformly oriented in space, which is so impor-tant for understanding many optical displays, comesfrom the action of aerodynamic drag forces, which arefunctions of particle fall speed �i.e., shape, density,and size� and air density �height�. As a particle of agiven shape increases in size, its orientation will betransformed from random owing to the effects ofBrownian motions, to aligned horizontally with itsmaximum cross section presenting the greatest ob-struction to the air flow, to developing fall attitudeinstabilities that arise from the shedding of vorticesin the rapidly falling particles’ wake, which can causea fluttering or spiral motion. The Reynolds numberRe � v d�� provides a convenient factor to relate theparticle terminal velocity v, diameter d, and kine-matic viscosity � of the fluid: for ice crystals fallingin air, d is an equivalent size usually taken as themaximum dimension of the particle and � is propor-tional to air pressure. As reviewed in Ref. 2, a va-riety of evidence indicates that stable particle fallattitudes are achieved under the condition that 1 �Re � 100. For plate and thick plate crystals, Re � 1for d �200–300 �m at a typical cirrus cloud pressureof 300 hPa.2
Interestingly, although cirrus ice crystal shape isfundamentally a function of ambient temperature,10
the crystal growth rate also has an effect. The rateof crystal growth is controlled foremost by the tem-perature and the amount of water-vapor supersatu-ration above ice, but the ventilation effect producedduring fall can also be important. That is, the dif-fusion of water vapor to the growing surfaces of icecrystals is modulated by the streamlines of air flowabout the particle. Moreover, the manner in whichwater molecules stick to the ice surface varies accord-ing to the trace contaminants that are introducedduring the ice nucleation process. Thus the nucle-ation process of an ice crystal, and its size, shape, andorientation, are all interrelated.
2. Dataset and Current Analysis
The nature and purpose of the Facility for Atmo-spheric Remote Sensing �FARS� high-cloud data sethas been described in detail in the first three parts ofthis series of papers,10–12 and in Ref. 13 a thoroughdescription of the instrumentation at FARS is given.In general, an extended time ground-based observa-tion approach was employed at FARS to help to testand improve satellite-based radiance cloud algo-rithms as part of the first International SatelliteCloud Climatology Program �ISCCP� regional exper-
iment, or Project FIRE.14 Although various remote-sensor combinations were used for selected casestudies, at the foundation of the program were theCloud Polarization Lidar �CPL�, visible and infraredradiometers, and all-sky fisheye photographs of thecloud conditions. Color fisheye images and nine vol-umes of transcribed field notes are relied on here tocharacterize the occurrence of cirrus cloud optical dis-plays. Additional information is provided by thezenith-pointing CPL, which is based on a 1.5-J output0.1-Hz ruby �0.694-�m� laser transmitter. Thebackscattered laser energy is measured in the planesof polarization orthogonal and parallel to that of the�vertically� polarized laser pulse, from which the lin-ear depolarization ratio, or value, is derived aftercorrection for differences in the gains of the two re-ceiver channels. The laser backscatter depolariza-tion technique is a powerful tool for inferringinformation concerning the shape and orientation ofice crystals in the atmosphere.10
To convert the FARS observations into useful sta-tistics regarding the occurrence of optical displays wehave devised a procedure that we hope will facilitatefuture comparisons with data from other locales.We begin by creating a file for each FARS observationperiod, which normally is �3 h in length, and this isbroken into �1-h periods. Three sources of informa-tion are then examined. These are the field notesand color fisheyes collected by the lidar operator aswell as height-versus-time plots of lidar values inthe �visually identified� cirrus clouds. A basic 1-hanalysis interval was chosen because the fisheyes arenormally obtained every 20 min during daylight,times that are anchored to the times of geostationarysatellite imagery at 5 min past each hour and accom-panied by extensive field notes on cloud conditions�including optical displays�. In other words, eachperiod is supported by at least three fisheyes andextensive cloud descriptions: Additional field notesare routinely collected, and extra photographs aretaken particularly to monitor optical displays. Thedata used here extend from March 1991 to November2001, over which time the taking of field notes, pho-tographs, and lidar data was uniformly structured.
We first record whether cirrus clouds are presentduring the majority of each 1-h interval. Of the totalof 2016 1-h periods with cirrus present, 1561 werecollected during daylight. The 455 night periods arenot used in our main optical display analysis becauseof the lack of a reliable light source �i.e., the Moon�,although some information is stored. If cirrus opti-cal displays are present, the analysis records eachtype of display �according to Table 1� and then char-acterizes its variability and relative brightness �Ta-ble 2�. The 25 types of displays listed in column 1 ofTable 1 exclude the rarer arcs that could not be ver-ified photographically. Note that if an optical dis-play is variable, only the most developed of theconditions for each type �i.e., complete over particlehalo, corona over aureole� is reported in each period.Attempts are also made to break down the cirrus intotheir meteorological source and to note some special
cloud properties, whether or not optical displays arepresent. These properties are listed in Table 2 un-der the heading Special. The most important prop-erty is whether the lidar detects horizontally orientedice crystals, in view of the known connections be-tween halo arcs and oriented ice crystals. For thispurpose the height-versus-time value displays areexamined for cirrus cloud regions containing �0.15, which are considered to represent orientedcrystal-dominated conditions.10 It is further notedwhether these anisotropic conditions, which we con-firm by tipping the lidar up to 5° from the zenith, arewidespread or variable during each period.
This scheme was adopted in view of the particularcomposition of the FARS high-cloud data set and inresponse to the quintessential nature of optical phe-nomena in cirrus clouds: their often great temporalvariability. In some cases, optical displays may lastonly for seconds; in others, for many hours. Impor-tantly, this basic feature reflects the persistence ofthe cirrus cloud microphysical conditions that arerequired for the creation of various displays. Notethat the reports for the 22° and 46° halos are split intogroups in Table 1 that indicate the degree of com-
Table 1. Compilation of the 1-h Daylight Cirrus Periods That Yield the Total Number of Indicated Optical Display Types and Are Then Subdivideda
Total diffraction 177 140 28 9 97 8 6 40 26Total number of displays 1149 524 408 217 737 89 49 197 77
aSubdivisions are as follows: those periods that display no extensive horizontally oriented planar ice crystals �No XLS�, variablecrystals �Part XLS�, and widespread crystals �XLS�, and those periods associated with midlatitude �Midl�, anvil �Anvl�, orographic �Orog�,tropical–subtropical �Trop�, and contrail-dominated �Cont� cirrus.
Table 2. Categories Used To Characterize the Properties of Each ofthe Cirrus Cloud Optical Phenomena �over �1-h Periods�
Listed in Table 1
A. Longevity1. Prolonged2. Variable3. Brief–sporadic
B. Intensity–colorization1. Bright2. Diffuse �poorly colored�3. Very weak
pleteness of the displays. Both the upper and thelower portions of halos are often seen alone, presum-ably because of the scattering enhancements fromunrecognized upper and lower tangent arcs.
3. Statistical Occurrences of Optical Displays
A. General Daylight Results
In view of the structure of the FARS cloud data set,the basic statistical unit used here is the percentageof 1-h data intervals that yield various optical dis-plays with respect to the total sample of valid day-light cirrus observations. �We also, however,provide statistics relative to the subset of data thatproduced optical displays.� Thus our findings referto the efficacy of our local cirrus to generate opticaldisplays and not to the overall frequencies at whichthe displays are continuously present. Concerningpotential biases in the FARS data record, most ob-servations were conducted in support of afternoonand evening polar-orbiting satellite overpasses whencirrus were present.11 The single observer respon-sible for FARS data collection has a good workingknowledge of optical phenomena, and one of the earlygoals of the research was to record the presence ofdisplays as part of a passive remote-sensing approachto aid in the study of cirrus cloud microphysical con-tent. Thus, although there was a tendency to initi-ate FARS observations when displays were alreadypresent to study their properties, it is unlikely thatthis practice has had a significant effect on the sta-tistics that we now present.
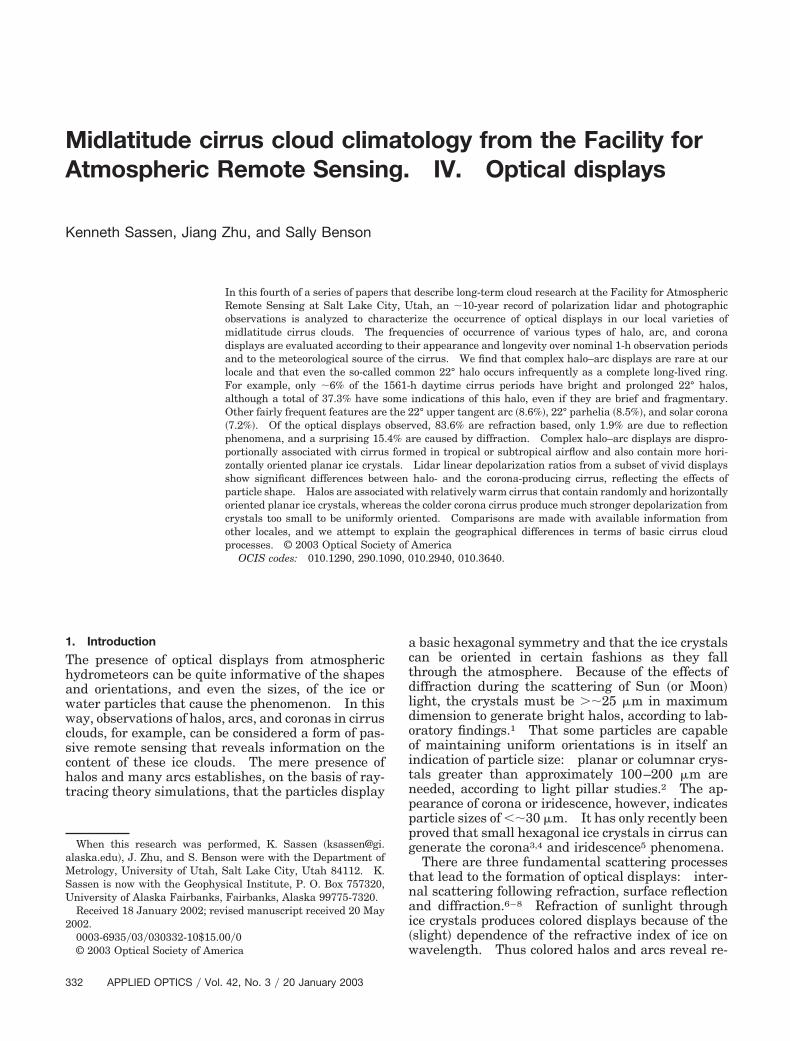
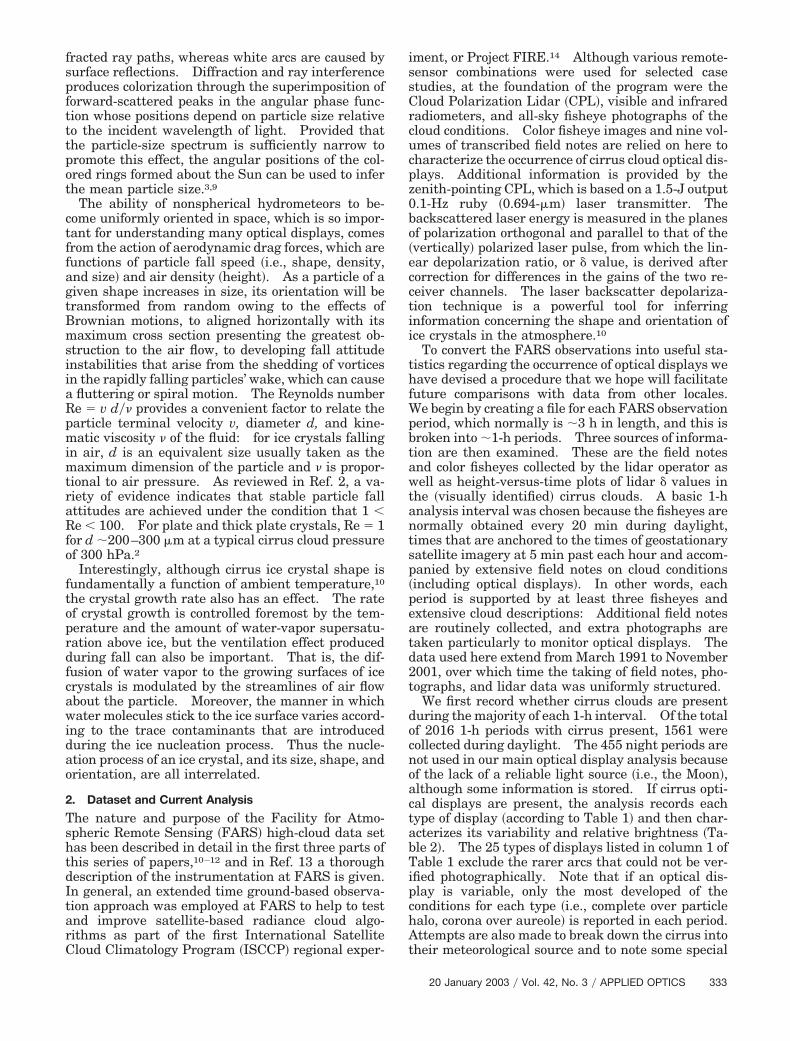
In Table 1 are provided the total number of 1-hperiods during which each of the 25 optical displaytypes was observed during daylight in cirrus, regard-less of its intensity or longevity. Of the total 1561-hdaylight periods, displays were noted during 825 ofthese periods. Thus the percentage of periods thatproduced at least one display is 52.9% of the totaldays sample. In as much as on average 1.39 types ofdisplay are observed in each period that optics arepresent, the total number of display entries is 1149.Figure 1 shows the number of optical display typesreported in each 1-h period, which is strongly skewedto a few displays per period but contains a tail ofmultidisplay events. Figure 2 depicts the occur-rence of the major optical display types in terms oftheir percentage of the total period when displayswere present. The prevalence of the 22° halo,whether it is complete or not, is indicated by itsnearly 50% occurrence.
Also given in Table 1 are the total numbers ofdisplays generated through refraction, reflection, anddiffraction. It is apparent that some arcs associatedwith the 22° halo and most of the 46° halo and asso-ciated arc types are rare at FARS. For example,FARS sightings of a complete 46° halo or a lowerParty arc are absent. Displays from reflection phe-nomena are especially rare �1.9% when any display ispresent� compared with 83.6% of refraction phenom-ena and the 15.4% of diffraction displays.
B. Visual Quality of Displays
Although this is not apparent from Table 1, addi-tional information relating to the visual intensity andlongevity of the displays is present in the data set.To address this issue we divided the 3-by-3 matrix,that describes the relative visual effect of optical dis-plays into three groups, using the Longevity �A� andIntensity–Colorization �B� groupings in Table 2. Wethen subjectively define good displays as the collec-tion of A1 B1, A1 B2, and A2 B1: fair displaysas A1 B3, A2 B2, and A3 B1; and poor displaysas A2 B3, A3 B2, and A3 B3. This criterionprovides an approach with which to evaluate the rel-ative intensity and persistence of optical displays.
Table 3 shows the distribution of these display rat-ings for each display type. Only complete 22° halos
Fig. 1. Probability-density function plot of the frequency of thetotal number of optical display types reported in each 1-h daylightperiod with optical displays.
Fig. 2. Pie chart showing the breakdown of the major opticaldisplay types with respect to the total number of day optical dis-play periods.
can be seen to have a fairly high occurrence �37%� ofgood-quality displays. Overall, 19.8%, 28.3%, and52.0% of the displays fell into the good, fair, and poorgroups, respectively. In other words, approximatelyone half of the displays were brief and vague and mayhave been overlooked by a casual observer.
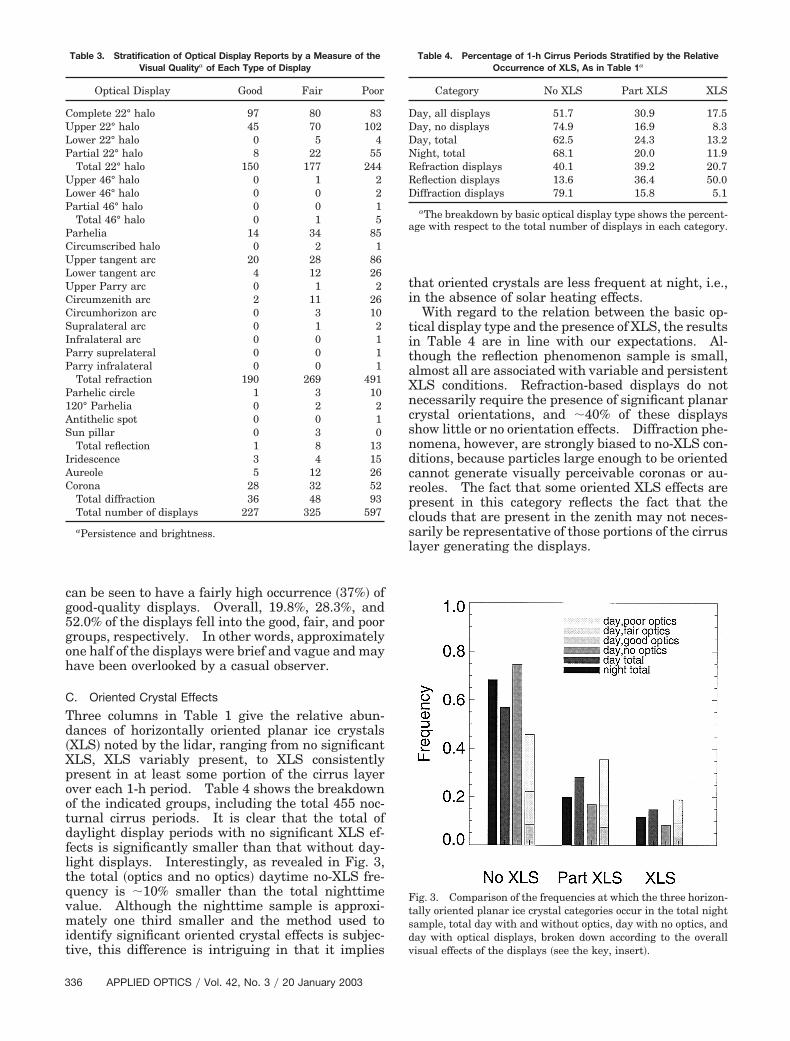
C. Oriented Crystal Effects
Three columns in Table 1 give the relative abun-dances of horizontally oriented planar ice crystals�XLS� noted by the lidar, ranging from no significantXLS, XLS variably present, to XLS consistentlypresent in at least some portion of the cirrus layerover each 1-h period. Table 4 shows the breakdownof the indicated groups, including the total 455 noc-turnal cirrus periods. It is clear that the total ofdaylight display periods with no significant XLS ef-fects is significantly smaller than that without day-light displays. Interestingly, as revealed in Fig. 3,the total �optics and no optics� daytime no-XLS fre-quency is �10% smaller than the total nighttimevalue. Although the nighttime sample is approxi-mately one third smaller and the method used toidentify significant oriented crystal effects is subjec-tive, this difference is intriguing in that it implies
that oriented crystals are less frequent at night, i.e.,in the absence of solar heating effects.
With regard to the relation between the basic op-tical display type and the presence of XLS, the resultsin Table 4 are in line with our expectations. Al-though the reflection phenomenon sample is small,almost all are associated with variable and persistentXLS conditions. Refraction-based displays do notnecessarily require the presence of significant planarcrystal orientations, and �40% of these displaysshow little or no orientation effects. Diffraction phe-nomena, however, are strongly biased to no-XLS con-ditions, because particles large enough to be orientedcannot generate visually perceivable coronas or au-reoles. The fact that some oriented XLS effects arepresent in this category reflects the fact that theclouds that are present in the zenith may not neces-sarily be representative of those portions of the cirruslayer generating the displays.
Table 3. Stratification of Optical Display Reports by a Measure of theVisual Qualitya of Each Type of Display
Total diffraction 36 48 93Total number of displays 227 325 597
aPersistence and brightness.
Table 4. Percentage of 1-h Cirrus Periods Stratified by the RelativeOccurrence of XLS, As in Table 1a
Category No XLS Part XLS XLS
Day, all displays 51.7 30.9 17.5Day, no displays 74.9 16.9 8.3Day, total 62.5 24.3 13.2Night, total 68.1 20.0 11.9Refraction displays 40.1 39.2 20.7Reflection displays 13.6 36.4 50.0Diffraction displays 79.1 15.8 5.1
aThe breakdown by basic optical display type shows the percent-age with respect to the total number of displays in each category.
Fig. 3. Comparison of the frequencies at which the three horizon-tally oriented planar ice crystal categories occur in the total nightsample, total day with and without optics, day with no optics, andday with optical displays, broken down according to the overallvisual effects of the displays �see the key, insert�.
The final five columns of Table 1 give a breakdown ofthe cirrus daylight displays with respect to the gen-erating mechanism, source region, or both �see Table2�. Table 5 further breaks down the sample bysource for all day periods with and without optics�and their average� and also lists the average for eachbasic type of display. �Nighttime data are excludedbecause there is no expectation that diurnal effectswill be important in this regard.� It is clear thatdifferences are apparent in the optics and no-opticsgroupings. Cirrus that generate displays have con-siderably lower frequencies of occurrence with anviland orographic cirrus but much higher frequenciesfor tropical–subtropical cirrus in relation to the no-optics sample. These findings reflect the influencesof a number of key factors in determining cirrus icecrystal shapes. Both anvil and orographic cirrusgenerally form in relatively strong updrafts, and, inthe case of anvil cirrus, vertical particle transportfrom lower �warmer� levels may be important. Themorphologies of ice crystal shape under such condi-tions are not likely conducive to pristine shapes, incomparison to the generally slow uplifts of �midlati-tude or tropically derived� synoptic-scale cirrus for-mation. In addition, the fact that the tropical–subtropical cirrus disproportionally generate opticaldisplays implies that the nature of the ice formingparticles that are representative of this source regionis of further importance, as is discussed below.
With respect to the relation between the cirrussource and the three basic scattering processes thatare responsible for the displays, it is particularly in-teresting that diffraction phenomena are strongly bi-ased toward tropical–subtropical cirrus, which areoften relatively high and cold at our location,3 andcontrail-derived cirrus of fairly young age. In otherrespects, it is again shown that cirrus formed fromanvils and orographic wave clouds are not generallysuitable microphysically for the generation of opticaldisplays.
E. Temporal Relationships
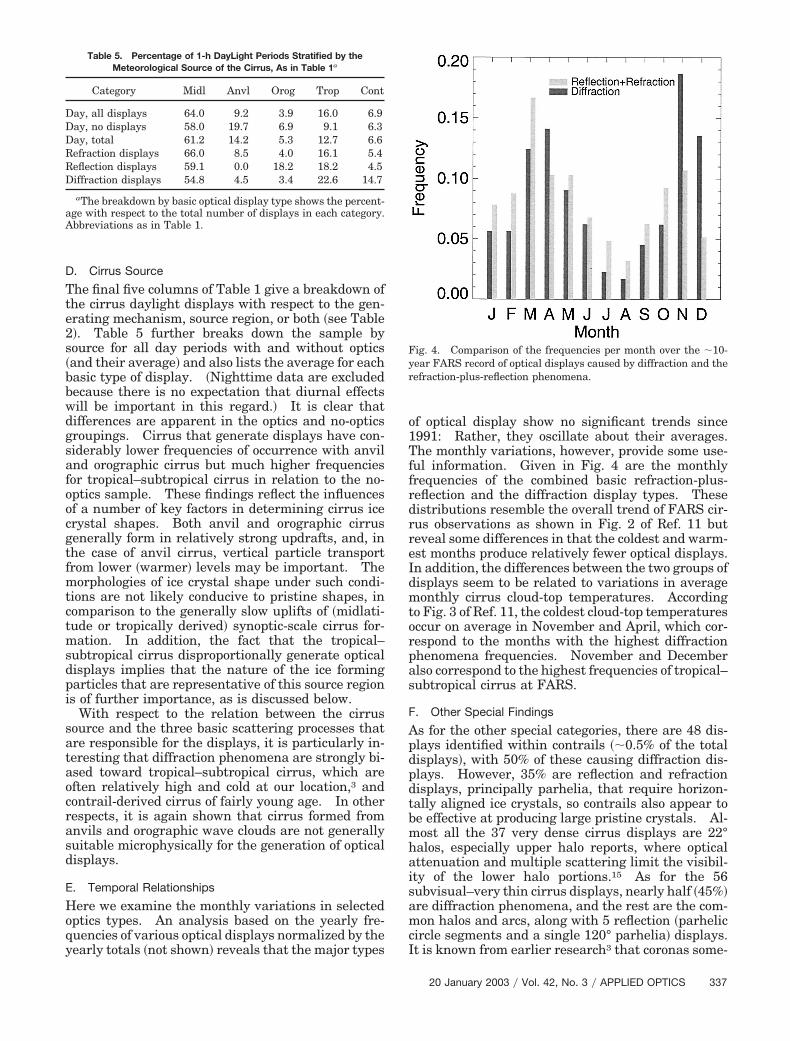
Here we examine the monthly variations in selectedoptics types. An analysis based on the yearly fre-quencies of various optical displays normalized by theyearly totals �not shown� reveals that the major types
of optical display show no significant trends since1991: Rather, they oscillate about their averages.The monthly variations, however, provide some use-ful information. Given in Fig. 4 are the monthlyfrequencies of the combined basic refraction-plus-reflection and the diffraction display types. Thesedistributions resemble the overall trend of FARS cir-rus observations as shown in Fig. 2 of Ref. 11 butreveal some differences in that the coldest and warm-est months produce relatively fewer optical displays.In addition, the differences between the two groups ofdisplays seem to be related to variations in averagemonthly cirrus cloud-top temperatures. Accordingto Fig. 3 of Ref. 11, the coldest cloud-top temperaturesoccur on average in November and April, which cor-respond to the months with the highest diffractionphenomena frequencies. November and Decemberalso correspond to the highest frequencies of tropical–subtropical cirrus at FARS.
F. Other Special Findings
As for the other special categories, there are 48 dis-plays identified within contrails ��0.5% of the totaldisplays�, with 50% of these causing diffraction dis-plays. However, 35% are reflection and refractiondisplays, principally parhelia, that require horizon-tally aligned ice crystals, so contrails also appear tobe effective at producing large pristine crystals. Al-most all the 37 very dense cirrus displays are 22°halos, especially upper halo reports, where opticalattenuation and multiple scattering limit the visibil-ity of the lower halo portions.15 As for the 56subvisual–very thin cirrus displays, nearly half �45%�are diffraction phenomena, and the rest are the com-mon halos and arcs, along with 5 reflection �parheliccircle segments and a single 120° parhelia� displays.It is known from earlier research3 that coronas some-
Table 5. Percentage of 1-h DayLight Periods Stratified by theMeteorological Source of the Cirrus, As in Table 1a
aThe breakdown by basic optical display type shows the percent-age with respect to the total number of displays in each category.Abbreviations as in Table 1.
Fig. 4. Comparison of the frequencies per month over the �10-year FARS record of optical displays caused by diffraction and therefraction-plus-reflection phenomena.
times reveal the presence of otherwise visually unde-tected cirrus and that corona generation is facilitatedin physically thin clouds with narrow particle-sizedistributions.
G. Nocturnal Findings
Finally, an examination of the available lunar dis-plays from 79 �of 455� 1-h cirrus night periods showsthat approximately one third of the displays corre-spond to the halos and arcs that are commonly seenduring daylight but that the remainder are diffrac-tion displays. Nearly half are reddish-colored lunaraureole displays, which suggests that small-radiusrings around the Sun may be often washed out by themuch stronger solar glare.
4. Lidar Depolarization Analysis from Case Studies
To explore further the connections between the iceparticle shapes and orientations that are responsiblefor cirrus optical displays and the lidar values inthese clouds, we selected a number of case studiesinvolving unusually vivid and protracted displays forspecial analysis. Because of the usual mismatch be-tween the lidar zenith sample and the relative posi-tion of the display, it is preferable to treat thoseclouds that produce persistent optical phenomenon toremove the potential affects of spatial and temporalinhomogeneities in cirrus cloud content. In view ofthe statistics given above, few types of long-lived dis-play would generate a statistically robust -valuesample, except for cirrus that generate the common22° halo- and corona-producing clouds. Thereforethese two types of display have been singled out foranalysis as illustrative of lidar samples related to twowidely different types of cirrus cloud composition.
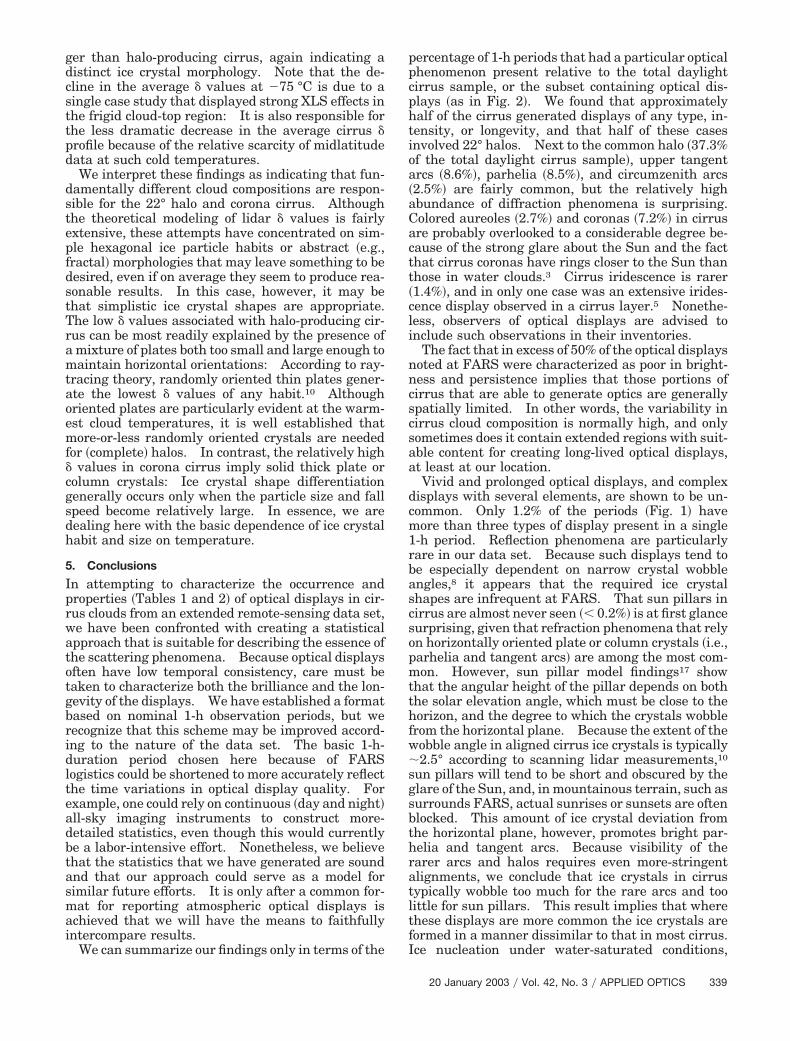
A total of eight 22° halo and five corona extendedcirrostratus case studies were selected, which com-prised 28.1 and 13.1 h of observations, respectively, ofzenith lidar measurements.16 The general proper-ties of these two cloud samples, compared with 10-year overall mean cirrus cloud properties recorded atFARS11, are provided in Table 6. The dependence ofthe values, which represent 75-m �10-point� heightand 2-min �12-shot� time averages, on the tempera-ture at the lidar sample �derived from local Salt LakeCity radiosondes� is given in Fig. 5. In this figure the profiles for the 22° halo and corona case studies arecompared with the mean FARS depolarization datafrom all cirrus.10
It is clear that, with respect to the usual cirrusclouds probed at FARS, both of these halo- andcorona-producing cirrus have distinct properties.Cirrus layers that generate 22° halos have lower and
warmer cloud bases. Although average cloud-topheights are slightly higher than the mean value inthis sample, there is a tendency for many halo-producing cirrus to be especially low-lying and warm.These cirrus also display significantly lower values,especially in the planar crystal growth regime be-tween approximately �10 ° and �20 °C, where adominance of specular reflections from horizontallyoriented ice plates is to be expected. However, the values are also as much as 0.05 lower at colder tem-peratures, implying that these cirrus contain distinctice crystal populations.
Corona-producing cirrus, however, are consider-ably higher and colder than both the mean and thehalo cirrus clouds, and the tropopause heights asso-ciated with them are exceptionally high �Table 6�. Itis likely that these cloud layers, confined to the up-permost troposphere, are thin because multiple scat-tering and a dilution of the small-particle diffractionpattern would occur in thicker clouds, which arelikely to contain larger particles at lower altitudes.The depolarization produced by these clouds is higherthan normal and is approximately 0.05–0.10 stron-
Table 6. Mean Cirrus Cloud Properties Associated with the Eight 22° Halo Case Studies, the Climatological Mean for the Entire FARS MidlatitudeCirrus Sample, and the Five Corona Case Studies
Sample Base Height �km� Top Height �km� Tropopause Height �km� Base Temperature �°C� Top Temperature �°C�
Fig. 5. Comparison of lidar linear depolarization profiles versusambient temperature for the subsets of eight vivid and prolonged22° halo and five corona case studies relative to the mean FARStotal day-plus-night sample from Ref. 10.
ger than halo-producing cirrus, again indicating adistinct ice crystal morphology. Note that the de-cline in the average values at �75 °C is due to asingle case study that displayed strong XLS effects inthe frigid cloud-top region: It is also responsible forthe less dramatic decrease in the average cirrus profile because of the relative scarcity of midlatitudedata at such cold temperatures.
We interpret these findings as indicating that fun-damentally different cloud compositions are respon-sible for the 22° halo and corona cirrus. Althoughthe theoretical modeling of lidar values is fairlyextensive, these attempts have concentrated on sim-ple hexagonal ice particle habits or abstract �e.g.,fractal� morphologies that may leave something to bedesired, even if on average they seem to produce rea-sonable results. In this case, however, it may bethat simplistic ice crystal shapes are appropriate.The low values associated with halo-producing cir-rus can be most readily explained by the presence ofa mixture of plates both too small and large enough tomaintain horizontal orientations: According to ray-tracing theory, randomly oriented thin plates gener-ate the lowest values of any habit.10 Althoughoriented plates are particularly evident at the warm-est cloud temperatures, it is well established thatmore-or-less randomly oriented crystals are neededfor �complete� halos. In contrast, the relatively high values in corona cirrus imply solid thick plate orcolumn crystals: Ice crystal shape differentiationgenerally occurs only when the particle size and fallspeed become relatively large. In essence, we aredealing here with the basic dependence of ice crystalhabit and size on temperature.
5. Conclusions
In attempting to characterize the occurrence andproperties �Tables 1 and 2� of optical displays in cir-rus clouds from an extended remote-sensing data set,we have been confronted with creating a statisticalapproach that is suitable for describing the essence ofthe scattering phenomena. Because optical displaysoften have low temporal consistency, care must betaken to characterize both the brilliance and the lon-gevity of the displays. We have established a formatbased on nominal 1-h observation periods, but werecognize that this scheme may be improved accord-ing to the nature of the data set. The basic 1-h-duration period chosen here because of FARSlogistics could be shortened to more accurately reflectthe time variations in optical display quality. Forexample, one could rely on continuous �day and night�all-sky imaging instruments to construct more-detailed statistics, even though this would currentlybe a labor-intensive effort. Nonetheless, we believethat the statistics that we have generated are soundand that our approach could serve as a model forsimilar future efforts. It is only after a common for-mat for reporting atmospheric optical displays isachieved that we will have the means to faithfullyintercompare results.
We can summarize our findings only in terms of the
percentage of 1-h periods that had a particular opticalphenomenon present relative to the total daylightcirrus sample, or the subset containing optical dis-plays �as in Fig. 2�. We found that approximatelyhalf of the cirrus generated displays of any type, in-tensity, or longevity, and that half of these casesinvolved 22° halos. Next to the common halo �37.3%of the total daylight cirrus sample�, upper tangentarcs �8.6%�, parhelia �8.5%�, and circumzenith arcs�2.5%� are fairly common, but the relatively highabundance of diffraction phenomena is surprising.Colored aureoles �2.7%� and coronas �7.2%� in cirrusare probably overlooked to a considerable degree be-cause of the strong glare about the Sun and the factthat cirrus coronas have rings closer to the Sun thanthose in water clouds.3 Cirrus iridescence is rarer�1.4%�, and in only one case was an extensive irides-cence display observed in a cirrus layer.5 Nonethe-less, observers of optical displays are advised toinclude such observations in their inventories.
The fact that in excess of 50% of the optical displaysnoted at FARS were characterized as poor in bright-ness and persistence implies that those portions ofcirrus that are able to generate optics are generallyspatially limited. In other words, the variability incirrus cloud composition is normally high, and onlysometimes does it contain extended regions with suit-able content for creating long-lived optical displays,at least at our location.
Vivid and prolonged optical displays, and complexdisplays with several elements, are shown to be un-common. Only 1.2% of the periods �Fig. 1� havemore than three types of display present in a single1-h period. Reflection phenomena are particularlyrare in our data set. Because such displays tend tobe especially dependent on narrow crystal wobbleangles,8 it appears that the required ice crystalshapes are infrequent at FARS. That sun pillars incirrus are almost never seen �� 0.2%� is at first glancesurprising, given that refraction phenomena that relyon horizontally oriented plate or column crystals �i.e.,parhelia and tangent arcs� are among the most com-mon. However, sun pillar model findings17 showthat the angular height of the pillar depends on boththe solar elevation angle, which must be close to thehorizon, and the degree to which the crystals wobblefrom the horizontal plane. Because the extent of thewobble angle in aligned cirrus ice crystals is typically�2.5° according to scanning lidar measurements,10
sun pillars will tend to be short and obscured by theglare of the Sun, and, in mountainous terrain, such assurrounds FARS, actual sunrises or sunsets are oftenblocked. This amount of ice crystal deviation fromthe horizontal plane, however, promotes bright par-helia and tangent arcs. Because visibility of therarer arcs and halos requires even more-stringentalignments, we conclude that ice crystals in cirrustypically wobble too much for the rare arcs and toolittle for sun pillars. This result implies that wherethese displays are more common the ice crystals areformed in a manner dissimilar to that in most cirrus.Ice nucleation under water-saturated conditions,
such as in supercooled stratus clouds on the Antarcticplateau or in glaciating altocumulus layers, for ex-ample, may produce more-suitably shaped ice crys-tals.
It is also interesting that we have detected a sig-nificant difference between the occurrence of orientedplanar ice crystals not only in the optics and theno-optics daylight samples but also in the total day-time �1651-h� versus total nightime �455-h� data sets.This appears to provide a signature of diurnal effectson cirrus cloud microphysical content, which will befurther investigated because of its potential impor-tance to climate research activities. The presence ofsolar heating effects may influence ice crystal shapedirectly through light absorption or by affecting cir-rus cloud dynamics through radiative interactions.18
The evidence from the lidar depolarization studiesindicates that vivid halo-producing cirrus probablycontain pristine planar ice crystals, which producerelatively low values when they are both randomlyand horizontally oriented.10 Providing the propercrystal face angles for concentrated halo scatteringrequires a pristine shape, and the particles must besolid for the best displays.19 Departures from a per-fect, solid hexagonal crystal shape will also increaseparticle fall attitude instabilities. Compared withnonoptics cirrus, those cirrus that produce opticaldisplays are much more likely to contain extensiveregions of oriented planar crystals. Although manyarcs require the presence of column crystals oriented�analogously� with their long axes in the horizontalplane, we assume that the presence of oriented platesmeans that simple columns and thick plates are alsomore likely to occur than irregular crystals in theseclouds: The plates are proxies for regular crystalgrowth in any habit.
Because of the lack of a common reporting format,it is difficult to compare our findings with those inother geographical regions. However, partial re-sults are available from extensive amateur halo-observing networks in Holland,20 Finland,21 andGermany.22 It is clear that the rarer arcs and halos,as reported by observers in Europe and the Antarc-tic,8 occur considerably more frequently than in oursample. Parry arcs and 120° parhelia, for example,are observed perhaps once every few years at ourlocation �whether lidar data are being collected ornot�, compared with averages of seven or eight a yearin Holland.20 It may be that the zeal of amateurobservers to capture rare events contributes to misi-dentifications in some cases. It should be noted,however, that in our case no attempt has been madeto identify the hypothesized rare halos of odd radii8that lie close to that of the common 22° halo and soare practically indistinguishable from their commoncousin.
In addition, there are other reasons why regionalstatistics would be expected to differ. The most ob-vious is that the frequency of occurrence of cirrusclouds can be expected to differ from locale to locale,depending on the dominant weather patterns.11 Ac-cording to a variety of observational and modeling
studies, latitude can also have an effect on the typesof display that are observable from a particular lo-cale. Some displays require solar elevation anglesthat are uncommon at high latitudes, such as thecircumhorizon arc. Other displays at moderate an-gles are favored at high latitudes �e.g., Antarctica�because of the small range of solar angles encoun-tered there.
Perhaps more fundamentally, in view of recent ev-idence23 and our findings regarding halo geographicvariability, it seems probable that the cirrus ice crys-tal nucleation and growth chemistry affects particlemorphology to the extent that optical displays serveas tracers of the explicit cloud microphysics involved.Our statistics show that the most complex and long-lived displays, are disproportionately related to cir-rus in air masses that have advected over FARS fromtropical or subtropical regions. �Moreover, it is oftendifficult to differentiate between tropical–subtropicaland the default midlatitude cirrus categories becausesatellite imagery cannot always disclose the previoushistory of cirrus entrained into midlatitude upper airtroughs.� The single case shown in Fig. 1 when 10different optical displays were present concurrentlywas due to a unique tropical cirrus case, as describedin Ref. 23. As was pointed out in that study, themanner in which cirrus ice crystals are nucleatedappears to affect the generation of optical displays:They are apparently favored when sea-salt nuclei arepresent. This conclusion follows from the chemistryof ice growth, which affects crystal morphologythrough the interference of trace amounts of contam-inants that are contained in the original cirrus cloud-forming particle.
Finally, it should not be overlooked that the cirruscloud temperature and generation mechanism have abasic affect on ice crystal shape as well. Tendenciestoward relatively warm or cold cirrus will be reflectedin the local frequencies of optical displays. Lowerhalo frequencies have been found here for anvil andorographic cirrus clouds than for other midlatitudecirrus types. Also in this regard, it was previouslypointed out that the cirrus studied at FARS oftenoccur in large scale synoptic weather patterns thatare generally unfavorable for cirrus generation.11
In other words, they occur in regions of large-scaledescending air motions, where particle evaporationmay have a dominant influence on cirrus cloud con-tent. Such ice crystals have rounded edges,24 whichare hardly conducive to halo–arc formation. Thus,in conclusion, it should not be surprising that geog-raphy can have a large effect on the occurrence ofoptical phenomena in cirrus clouds.
Recent FARS cirrus cloud research has beenfunded by National Science Foundation grant ATM-9528287 and NASA grant NAG1-2083.
References1. K. Sassen and K. N. Liou, “Scattering of polarized light by
water droplet, mixed phase and ice crystal clouds. II. An-gular depolarizing and multiple scattering behavior,” J. At-mos. Sci. 36, 852–861 �1979�.
2. K. Sassen, “Remote sensing of planar ice crystal fall attitudes,”J. Meteorol. Soc. Jpn. 58, 422–429 �1980�.
3. K. Sassen, “Corona producing cirrus cloud properties derivedfrom polarization lidar and photographic analyses,” Appl. Opt.30, 3421–3428 �1991�.
4. K. Sassen, G. G. Mace, J. Hallett, and M. R. Poellot, “Corona-producing ice clouds: a case study of a cold cirrus layer,” Appl.Opt. 37, 1477–1585 �1998�.
5. K. Sassen, “Cirrus cloud iridescence: a rare case study,” Appl.Opt. 42, 486–491 �2003�.
6. R. A. R. Tricker, Ice Crystal Halos, facsimile reproduction �Op-tical Society of America, Washington, D.C., 1979�.
7. R. Greenler, Rainbows, Halos, and Glories �Cambridge U.Press, Cambridge, 1980�.
8. W. Tape, Atmospheric Halos, Vol. 64 of Antarctic ResearchSeries �American Geophysical Union, Washington, D.C., 1994�.
9. J. A. Lock and L. Yang, “Mie theory of the corona,” Appl. Opt.30, 3408–3414 �1991�.
10. K. Sassen and S. Benson, “A midlatitude cirrus cloud clima-tology from the Facility for Atmospheric Remote Sensing. II.Microphysical properties derived from lidar depolarization,” J.Atmos. Sci. 58, 2103–2112 �2001�.
11. K. Sassen and J. R. Campbell, “A midlatitude cirrus cloudclimatology from the Facility for Atmospheric Remote Sensing.I. Macrophysical and synoptic properties,” J. Atmos. Sci. 58,481–496 �2001�.
12. K. Sassen and J. M. Comstock, “A midlatitude cirrus cloudclimatology from the Facility for Atmospheric Remote Sensing.III. Radiative properties,” J. Atmos. Sci. 58, 2113–2127�2001�.
13. K. Sassen, J. M. Comstock, Z. Wang, and G. G. Mace, “Cloudand aerosol research capabilities at FARS. The Facility for
14. S. K. Cox, D. S. McDougal, D. A. Randall, and R. A. Schiffer,“FIRE—the first ISCCP regional experiment,” Bull. Am. Me-teorol. Soc. 13, 114–118 �1987�.
15. E. Trankle and R. G. Greenler, “Multiple scattering effects inhalo phenomena,” J. Opt. Soc. Am. A 4, 591–599 �1987�.
16. S. Benson, “Lidar depolarization study to infer cirrus cloudmicrophysics,” M.S. thesis �University of Utah, Salt Lake City,Utah, 1999�.
17. R. G. Greenler, M. Drinkwine, A. J. Mallmann, and G. Blu-menthal, “The origin of sun pillars,” Am. Sci. 60, 292–302�1972�.
18. S. Dobbie and P. Jonas, “Radiative influences on the structureand lifetime of cirrus clouds,” Q. J. R. Meteorol. Soc. 127,2663–2682 �2001�.
19. K. Sassen, N. C. Knight, Y. Takano, and A. J. Heymsfield,“Effects of ice crystal structure on halo formation: cirruscloud experimental and ray-tracing modeling studies,” Appl.Opt. 30, 4590–4601 �1994�.
20. P.-P. H. Verschure, “Thirty years of observing and document-ing sky optical phenomena,” Appl. Opt. 37, 1585–1588 �1998�.
22. L. T. Crowley and M. Schroeder, “Halo frequencies,” unpub-lished report of the Halo Research Section of the GermanArbertskrieses Meteore, Berlin, Germany, 1999.
23. K. Sassen and Y. Takano, “Parry arc: a polarization lidar, raytracing, and aircraft case study,” Appl. Opt. 39, 6738–6745�2000�.
24. J. Nelson, “Sublimation of ice crystals”, J. Atmos. Sci. 55,910–919 �1998�.