42
Midterm Exam Review Microeconomics Econ EB122 Summer 2012 Inst. Shan A . Garib Mohawk College
| Date post: | 25-Dec-2015 |
| Category: |
Documents |
| Upload: | jeffery-todd |
| View: | 235 times |
| Download: | 1 times |

Midterm Exam ReviewMicroeconomics
Econ EB122 Summer 2012
Inst. Shan A . GaribMohawk College
Opportunity Cost• Opportunity cost: the value of the highest-
valued alternative that must be forgone when a choice is made. It is the evaluation of a trade-off.
• Marginal benefits and costs: the benefits and opportunity costs associated with one additional unit of the good.
Positive and Normative Analysis
• positive economics– Uses science and numbers to describe things– Eg. It is 23 degrees Celsius outside
• normative economics– relies on value judgments to evaluate or
recommend alternative policies
Scarcity the Fundamental Economic Problem
• Scarcity: wants > production • Production is any activity converting resources
in to goods and services
Microeconomics vs. Macroeconomics
• Microeconomics - the study of individual economic agents and individual markets
• Macroeconomics - the study of economic aggregates, the big picture

Simplifying assumptions
• ceteris paribus –all else being equal
Price Elasticity
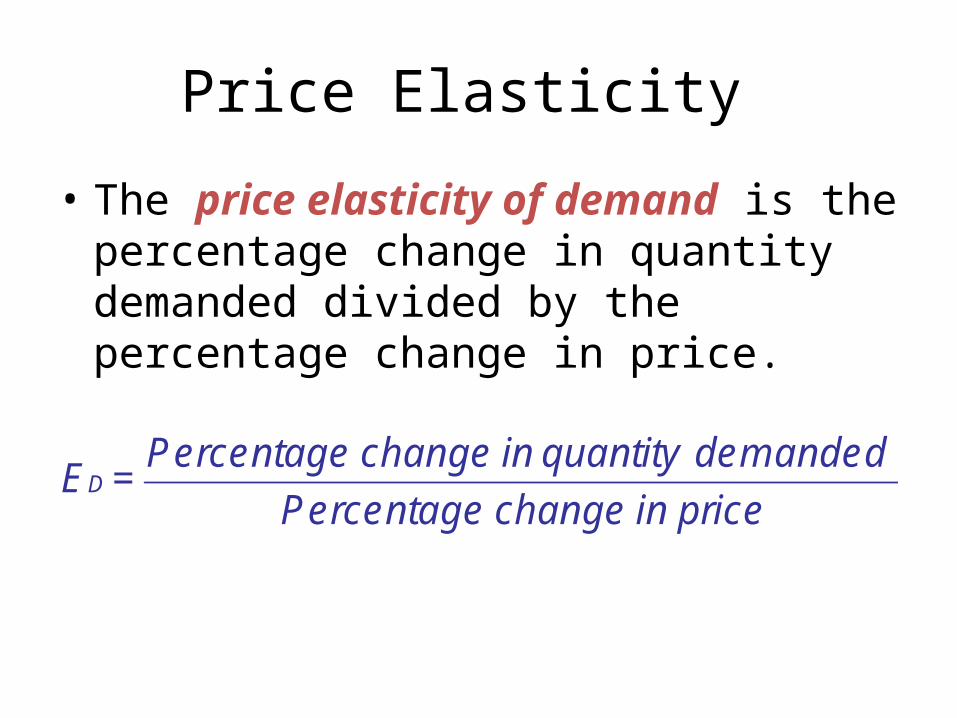
• The price elasticity of demand is the percentage change in quantity demanded divided by the percentage change in price.
price in change Percentage
demanded quantity in change Percentage=ED
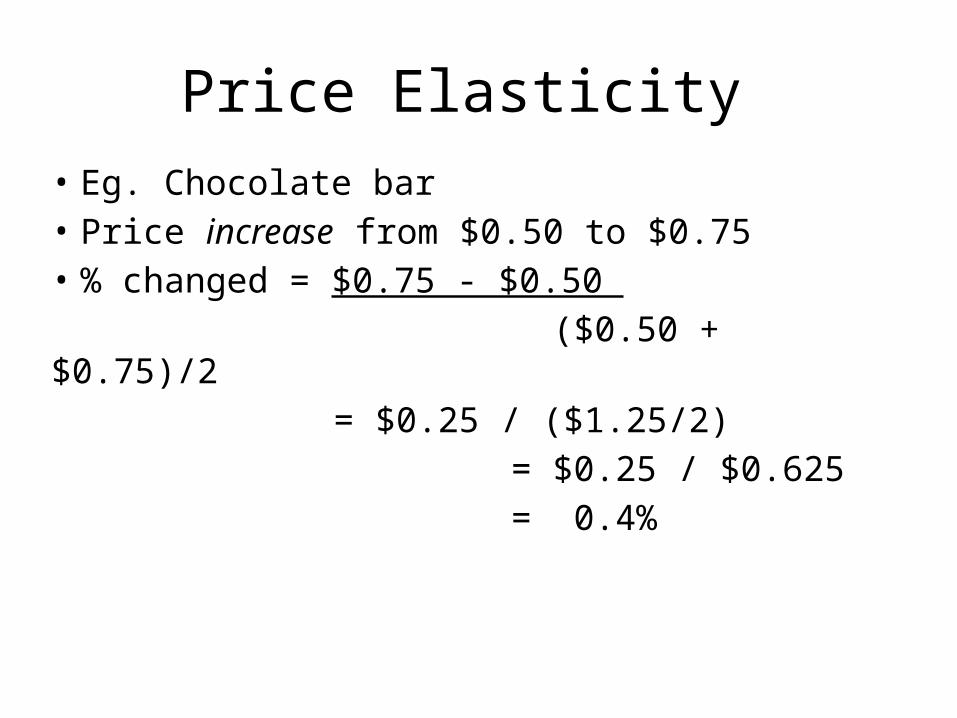
Price Elasticity • Eg. Chocolate bar • Price increase from $0.50 to $0.75• % changed = $0.75 - $0.50 ($0.50 + $0.75)/2
= $0.25 / ($1.25/2) = $0.25 / $0.625 = 0.4%
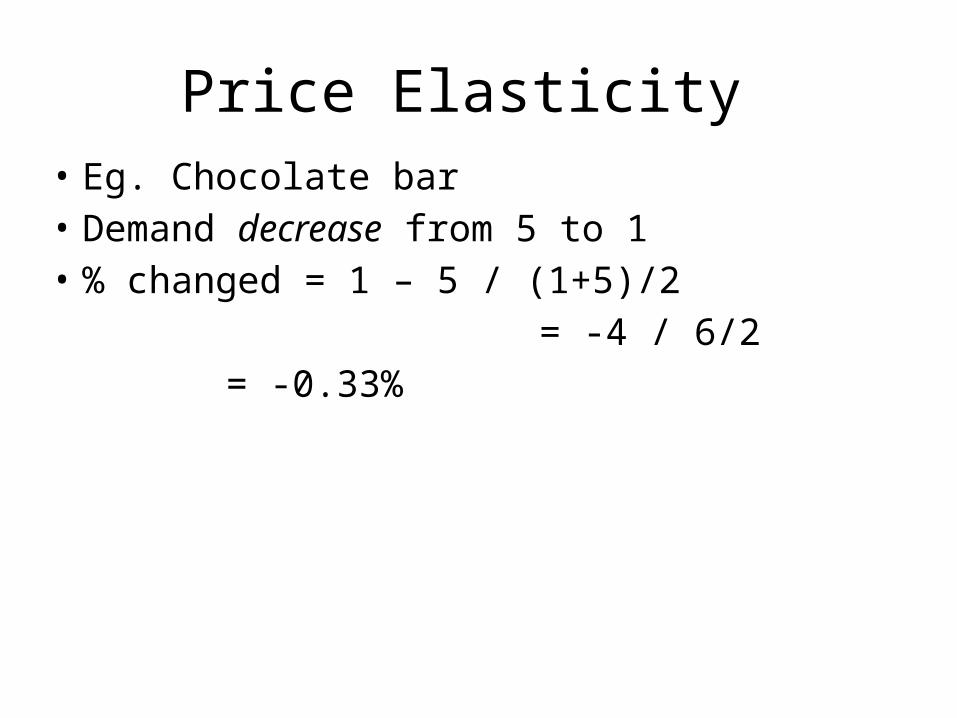
Price Elasticity • Eg. Chocolate bar • Demand decrease from 5 to 1• % changed = 1 – 5 / (1+5)/2 = -4 / 6/2
= -0.33%
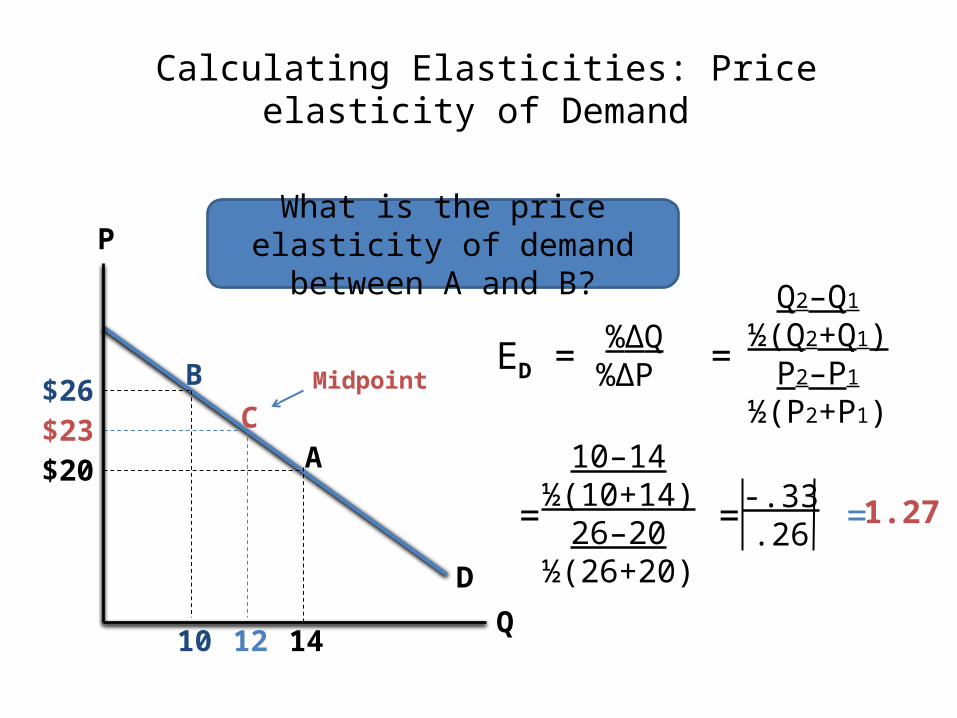
Calculating Elasticities: Price elasticity of Demand
D
P
Q
What is the price elasticity of demand between A and B?
$20
10
$26
14
MidpointB
A
ED = %ΔQ%ΔP
Q2–Q1
½(Q2+Q1)P2–P1
½(P2+P1)
=
C
12
$23
=
10–14½(10+14)
26–20½(26+20)
-.33.26 = 1.27 =

Pure Command Economy
• Public/Government ownership of all resources
• No private ownership Eg. Russia, Cuba and China - Communist
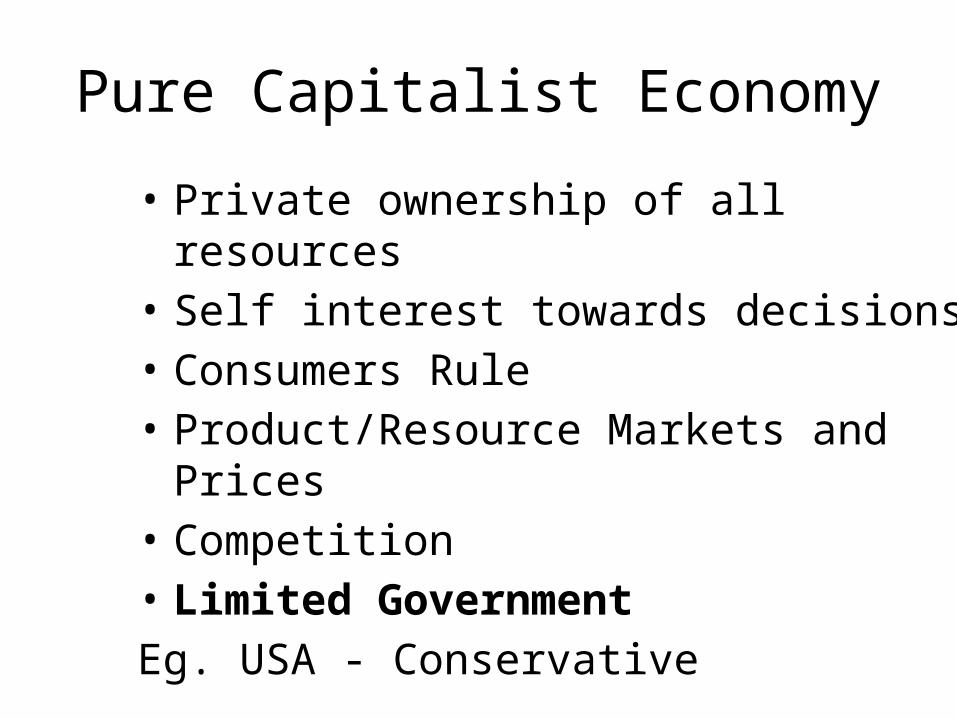
Pure Capitalist Economy
• Private ownership of all resources• Self interest towards decisions • Consumers Rule• Product/Resource Markets and Prices• Competition• Limited Government Eg. USA - Conservative

Mixed Economic System• Public and Private ownership of all resources Eg. Canada - Liberal
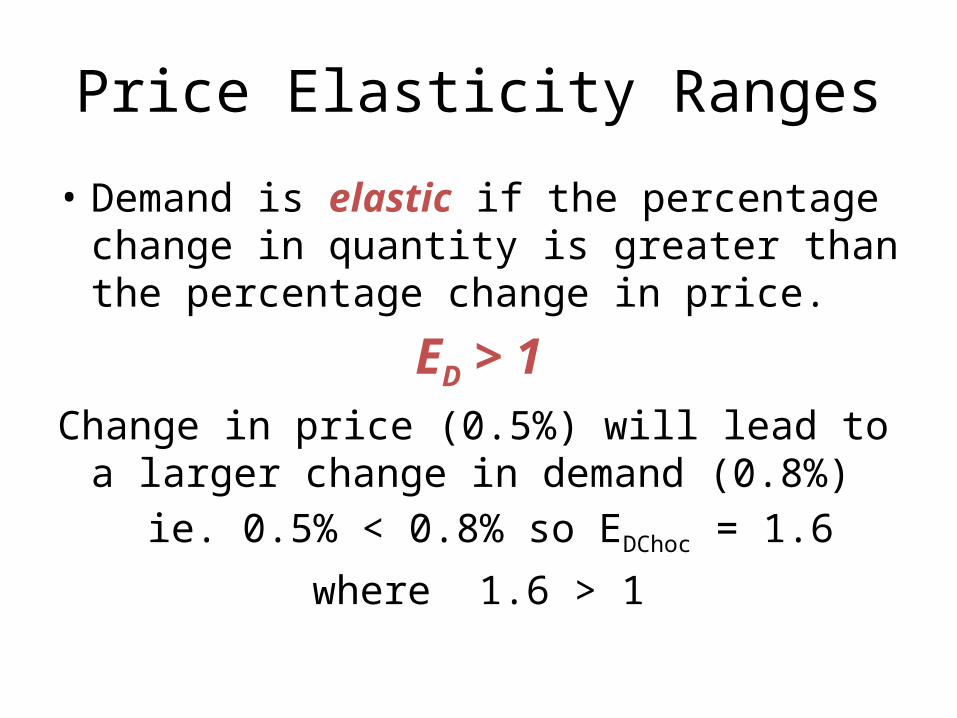
Price Elasticity Ranges
• Demand is elastic if the percentage change in quantity is greater than the percentage change in price.
ED > 1Change in price (0.5%) will lead to a larger
change in demand (0.8%) ie. 0.5% < 0.8% so EDChoc = 1.6
where 1.6 > 1
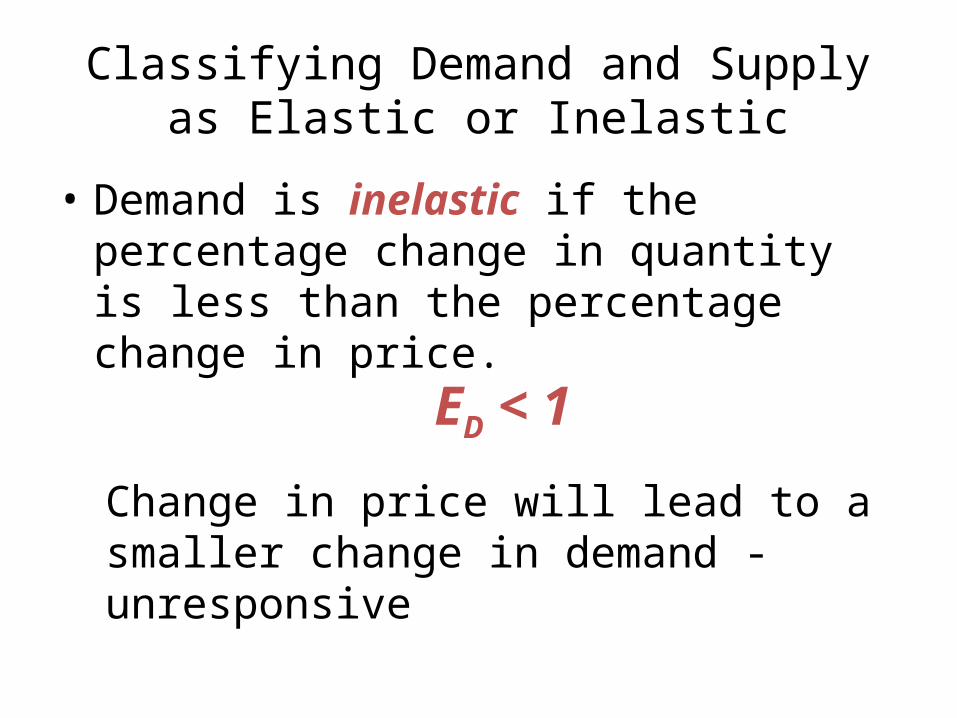
Classifying Demand and Supply as Elastic or Inelastic
• Demand is inelastic if the percentage change in quantity is less than the percentage change in price.
ED < 1
Change in price will lead to a smaller change in demand - unresponsive
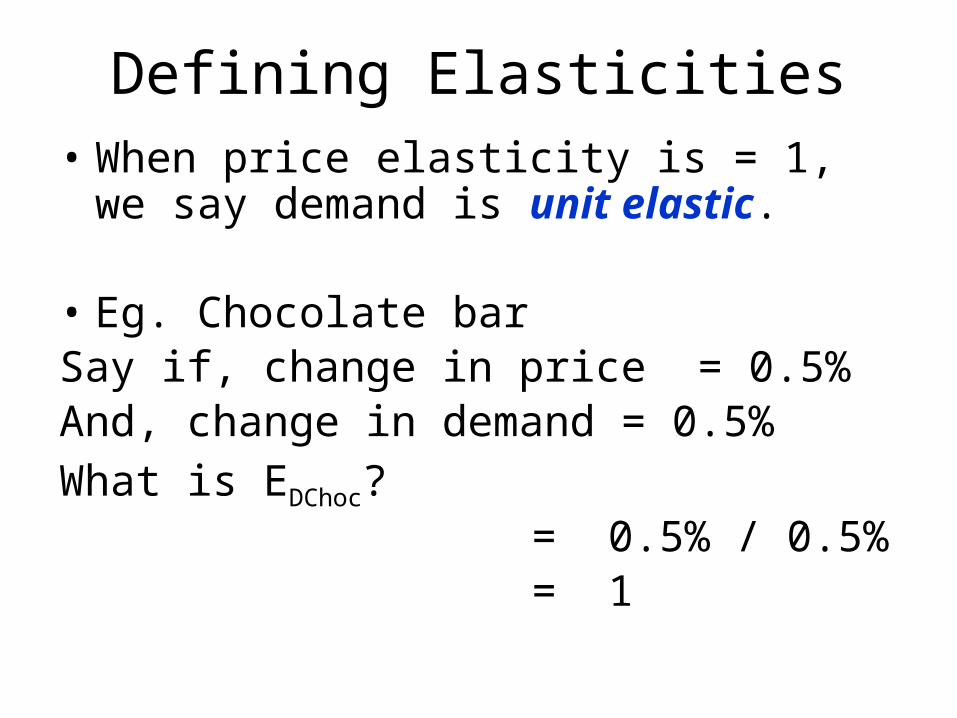
Defining Elasticities• When price elasticity is = 1, we say demand is
unit elastic.
• Eg. Chocolate bar Say if, change in price = 0.5%And, change in demand = 0.5%What is EDChoc?
= 0.5% / 0.5% = 1
Production Possibilities Curve• The production possibilities curve shows the
maximum quantity of goods and services that can be produced when the existing resources are used fully and efficiently.
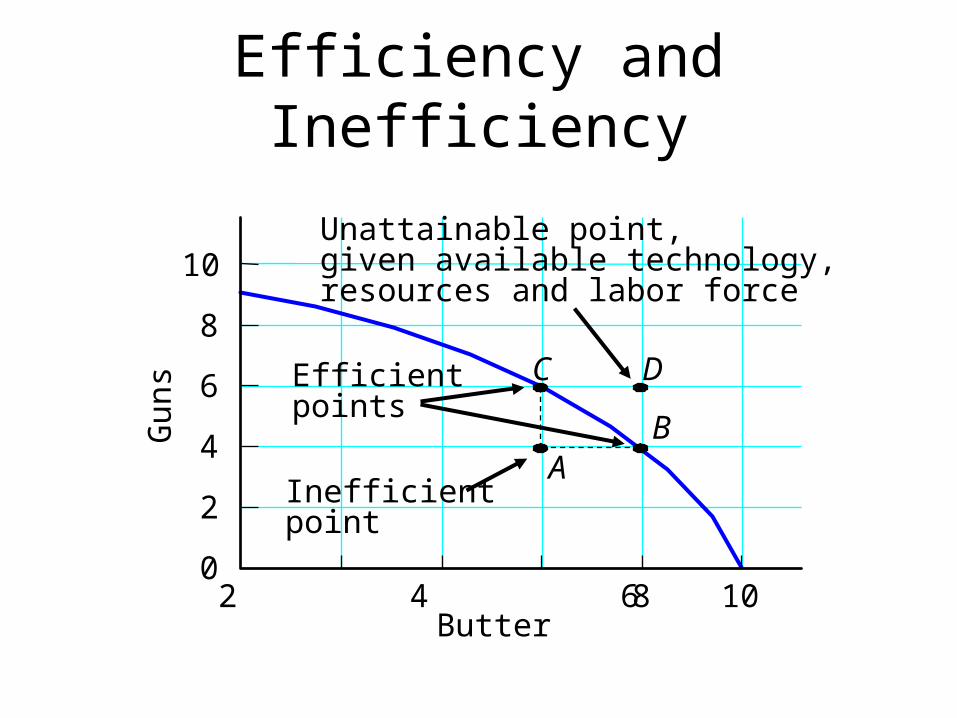
Efficiency and InefficiencyG
uns
10
8
6
4
2
0 2 4 6 8 10
Butter
C D
A
B
Efficientpoints
Inefficientpoint
Unattainable point, given available technology, resources and labor force
Opportunity Cost • The Law of Increasing Relative costs:
– When society takes more resources to producing more of one good the opportunity increases for each unit produced
Eg. Below, Country A at pt. “A” give 5, get 20 (or 1/4) : Country B gives 20, gets 25 (or 4/5)So, 1 /4 < 4 /5 should specialize in Coco NutsAs move further down curve Country A gives up more then gets ie. Higher OppCost
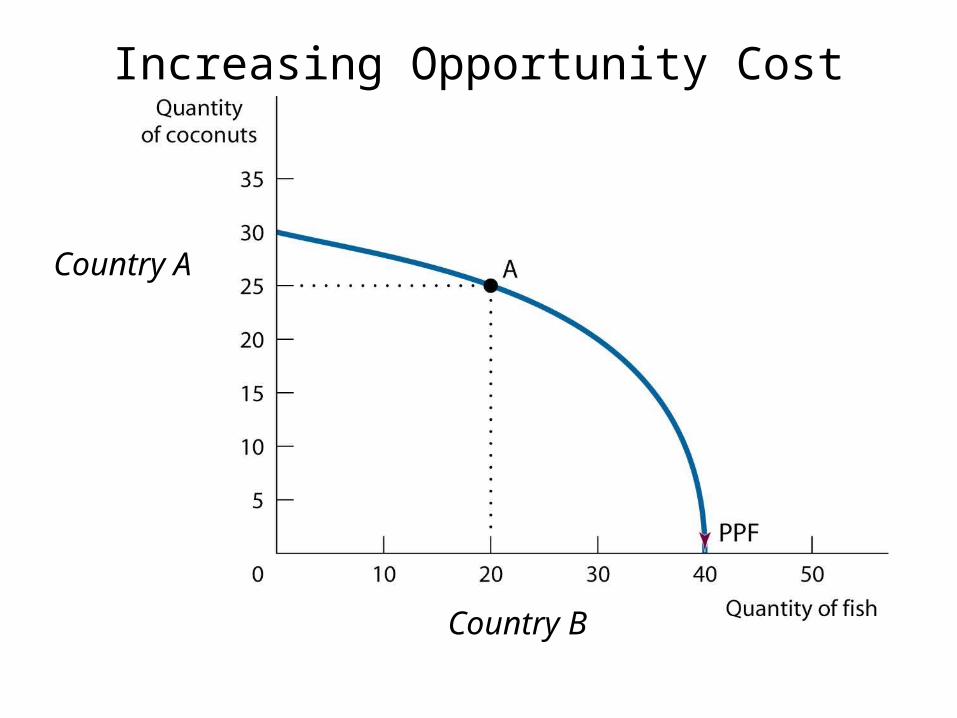
Increasing Opportunity Cost
Country A
Country B
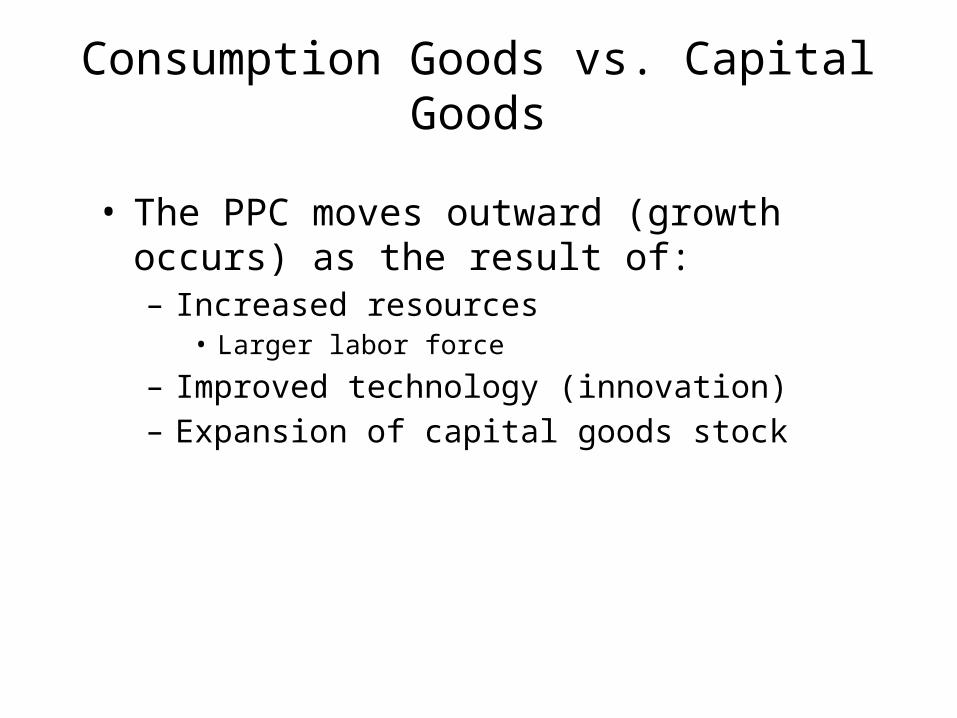
Consumption Goods vs. Capital Goods
• The PPC moves outward (growth occurs) as the result of:– Increased resources
• Larger labor force
– Improved technology (innovation)– Expansion of capital goods stock
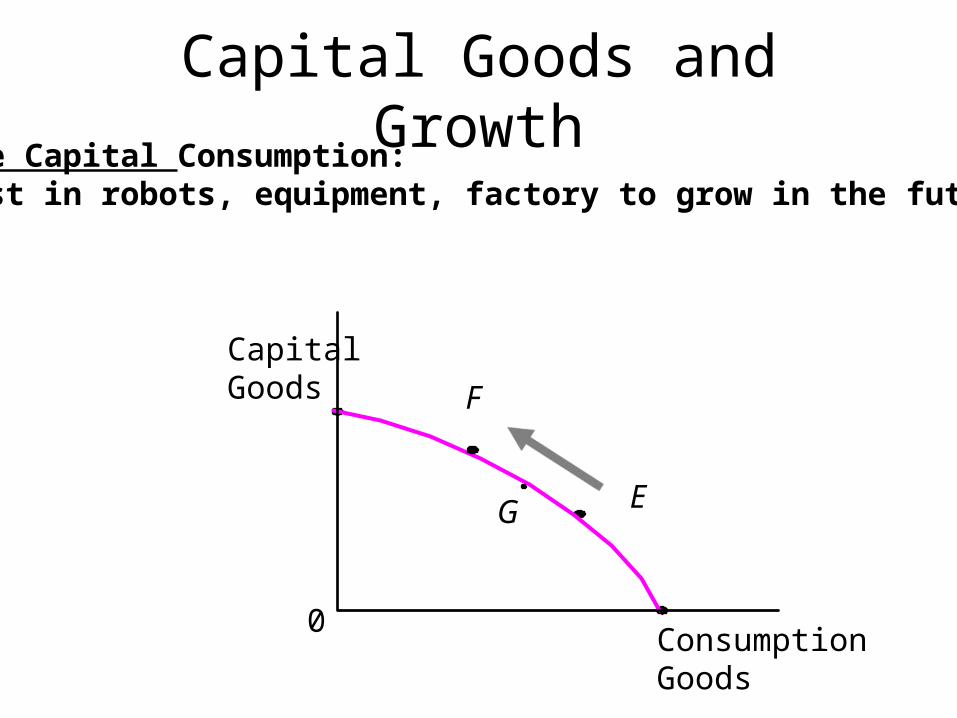
Choose Capital Consumption:-invest in robots, equipment, factory to grow in the future
CapitalGoods
Consumption Goods
0
Capital Goods and Growth
E
F
G
Shifts in the Production Possibility Curve
• More output is represented by an outward shift in the production possibility curve.
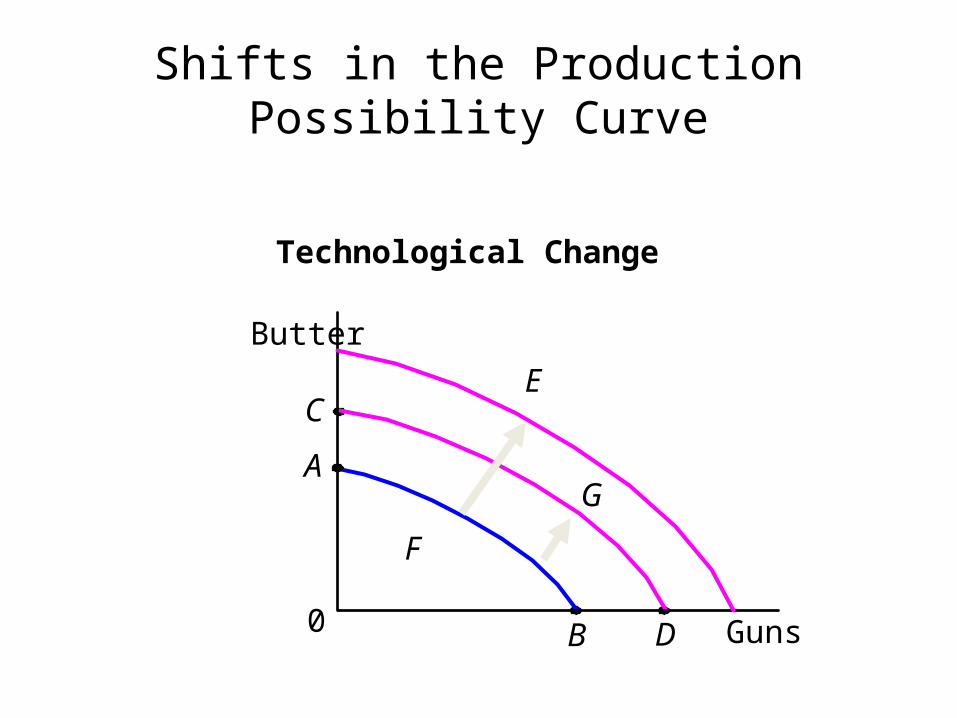
Technological Change
Butter
A
B Guns0
Shifts in the Production Possibility Curve
C
D
E
F
G
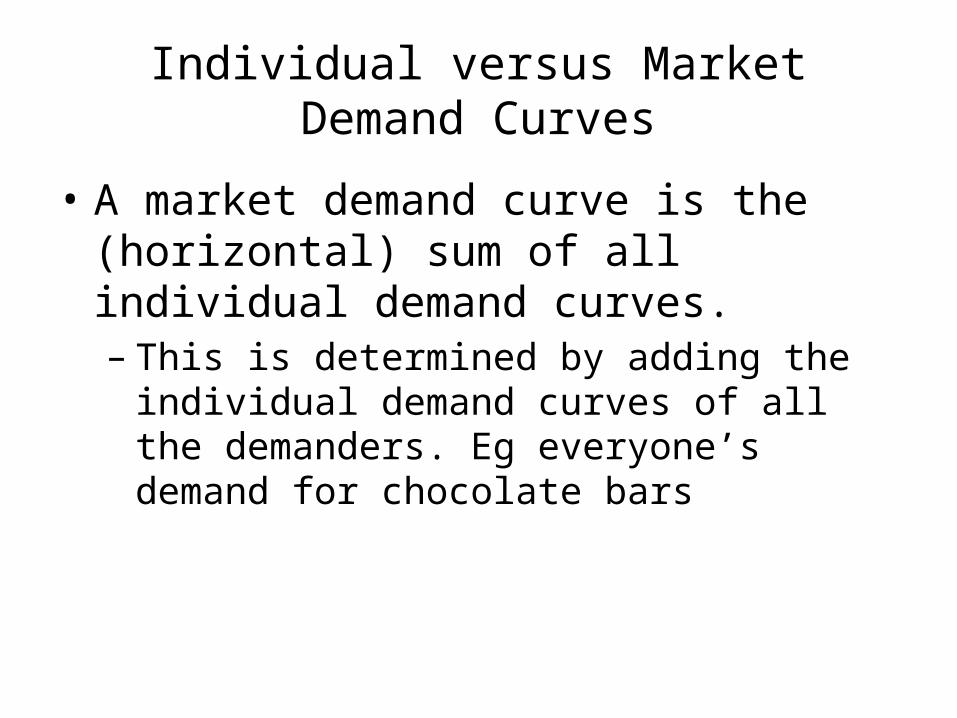
Individual versus Market Demand Curves
• A market demand curve is the (horizontal) sum of all individual demand curves.– This is determined by adding the individual
demand curves of all the demanders. Eg everyone’s demand for chocolate bars
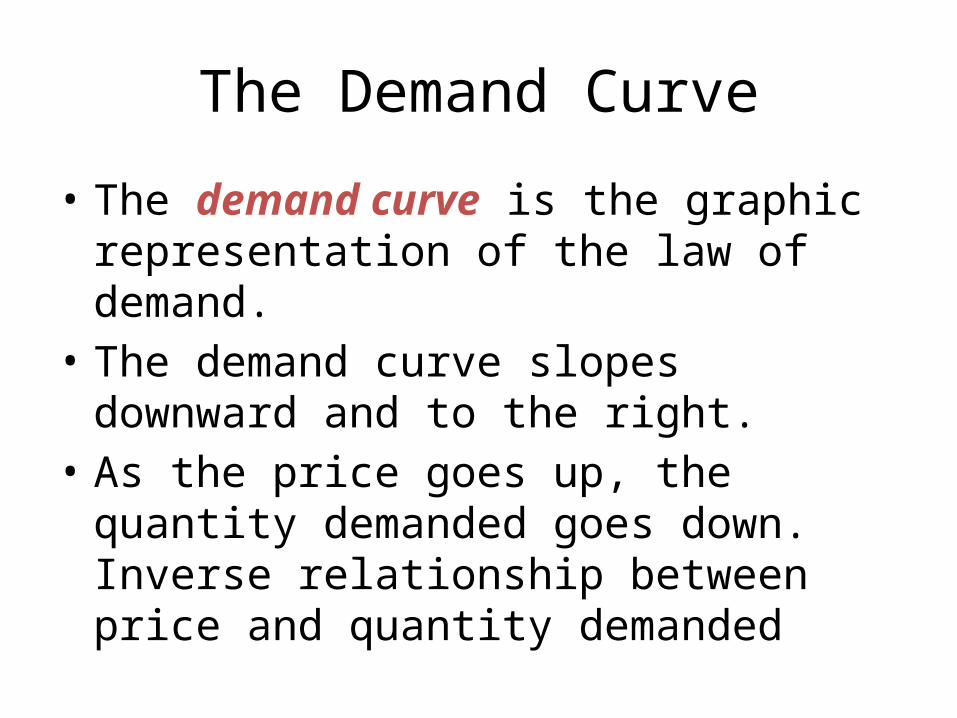
The Demand Curve
• The demand curve is the graphic representation of the law of demand.
• The demand curve slopes downward and to the right.
• As the price goes up, the quantity demanded goes down. Inverse relationship between price and quantity demanded
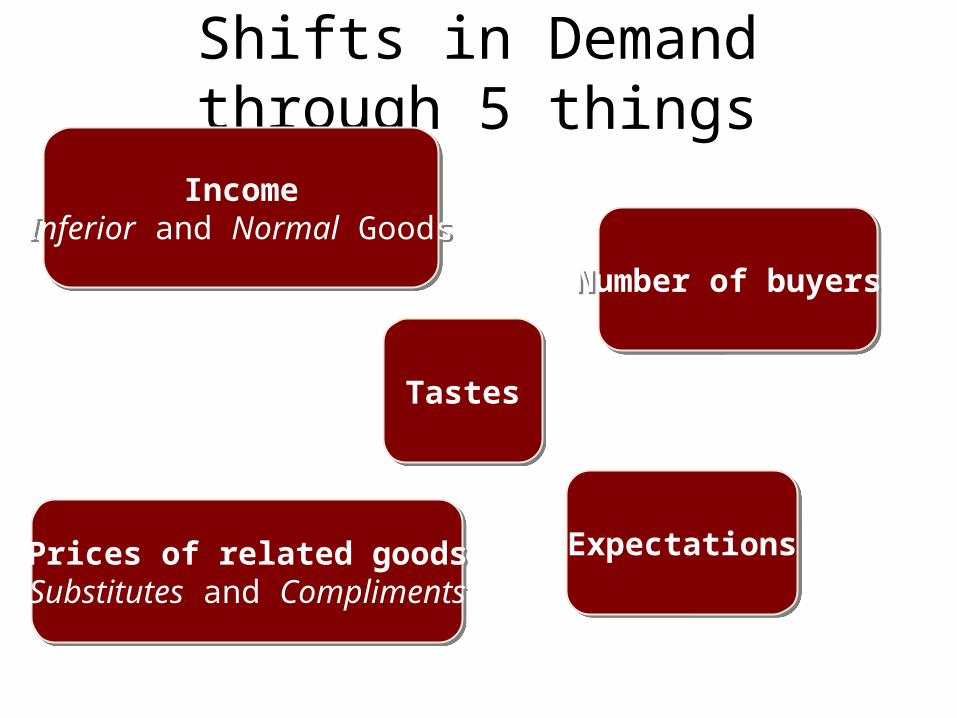
Shifts in Demand through 5 things
TastesTastes
IncomeInferior and Normal Goods
IncomeInferior and Normal Goods
Number of buyers Number of buyers
ExpectationsExpectationsPrices of related goodsSubstitutes and Compliments
Prices of related goodsSubstitutes and Compliments
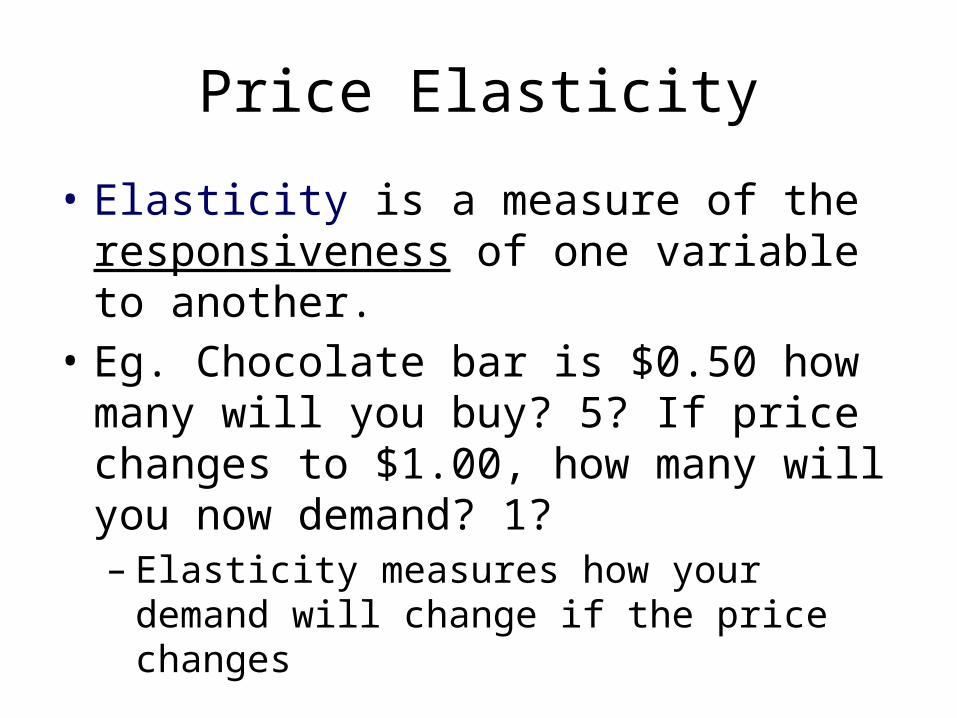
Price Elasticity
• Elasticity is a measure of the responsiveness of one variable to another.
• Eg. Chocolate bar is $0.50 how many will you buy? 5? If price changes to $1.00, how many will you now demand? 1?– Elasticity measures how your demand will change
if the price changes
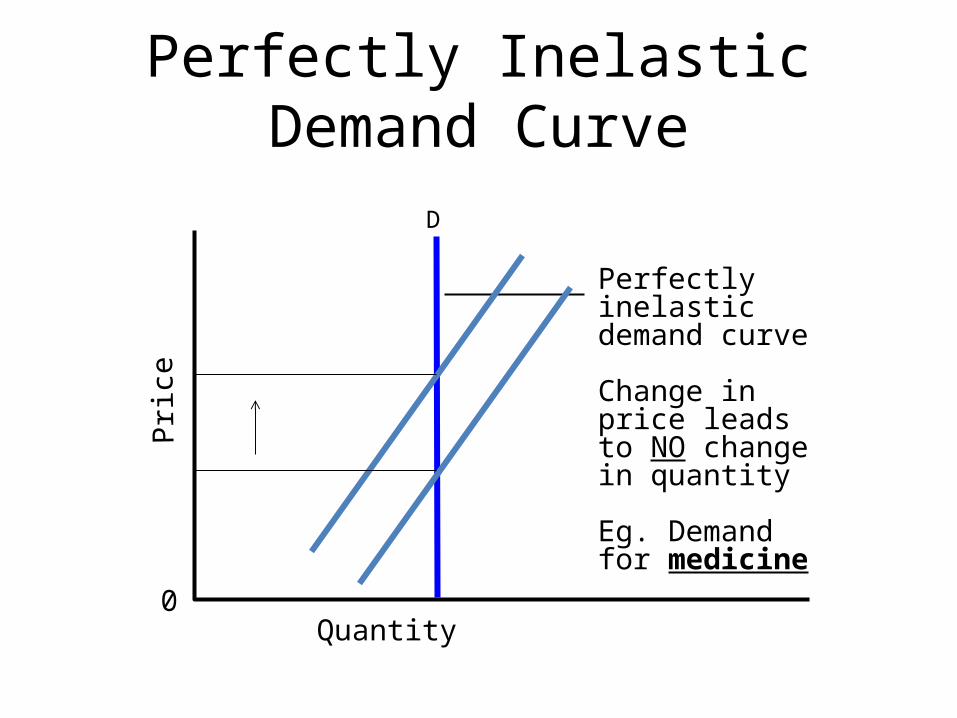
Perfectly inelastic demand curve
Change in price leads to NO change in quantity
Eg. Demand for medicine
Pric
e
0Quantity
Perfectly Inelastic Demand Curve
D
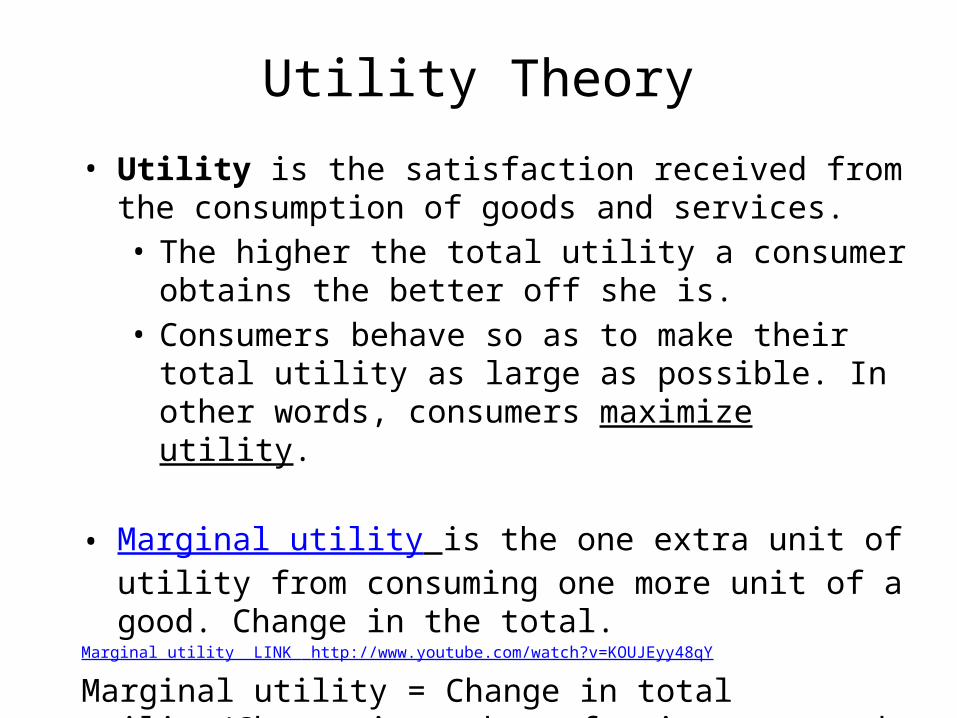
Utility Theory• Utility is the satisfaction received from the consumption of
goods and services. • The higher the total utility a consumer obtains the better
off she is. • Consumers behave so as to make their total utility as large
as possible. In other words, consumers maximize utility.
• Marginal utility is the one extra unit of utility from consuming one more unit of a good. Change in the total.
Marginal utility LINK http://www.youtube.com/watch?v=KOUJEyy48qY
Marginal utility = Change in total utility/Change in number of units consumed
Optimizing Consumption Choices
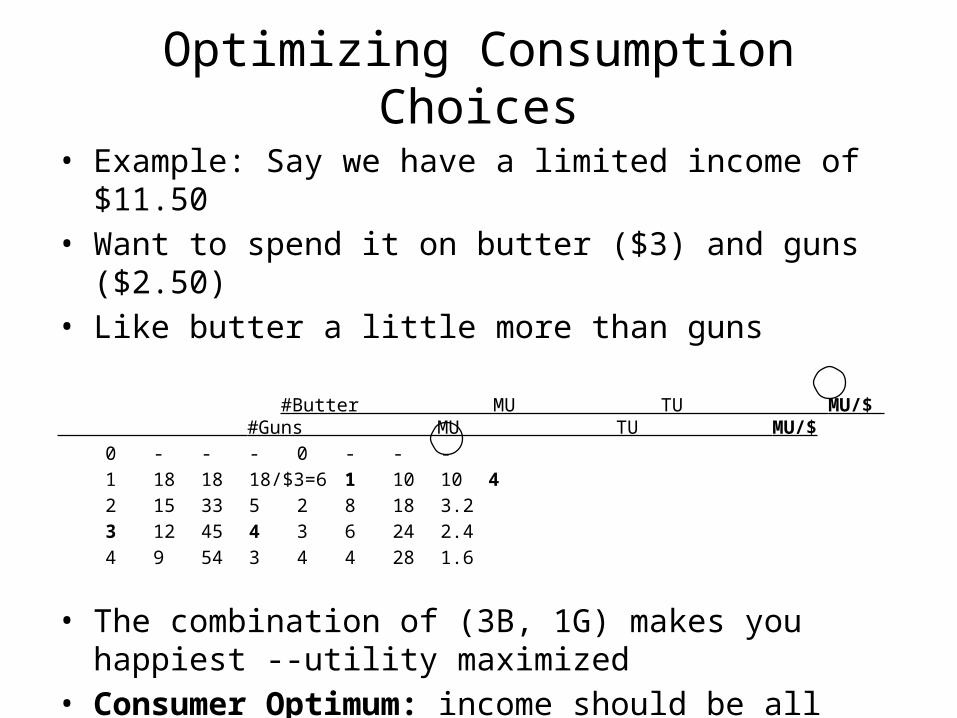
• Example: Say we have a limited income of $11.50• Want to spend it on butter ($3) and guns ($2.50)• Like butter a little more than guns
#Butter MU TU MU/$ #Guns MU TU MU/$0 - - - 0 - - - 1 18 18 18/$3=6 1 10 10 42 15 33 5 2 8 18 3.23 12 45 4 3 6 24 2.44 9 54 3 4 4 28 1.6
• The combination of (3B, 1G) makes you happiest --utility maximized
• Consumer Optimum: income should be all spent so that the last dollar on each gets the same MU
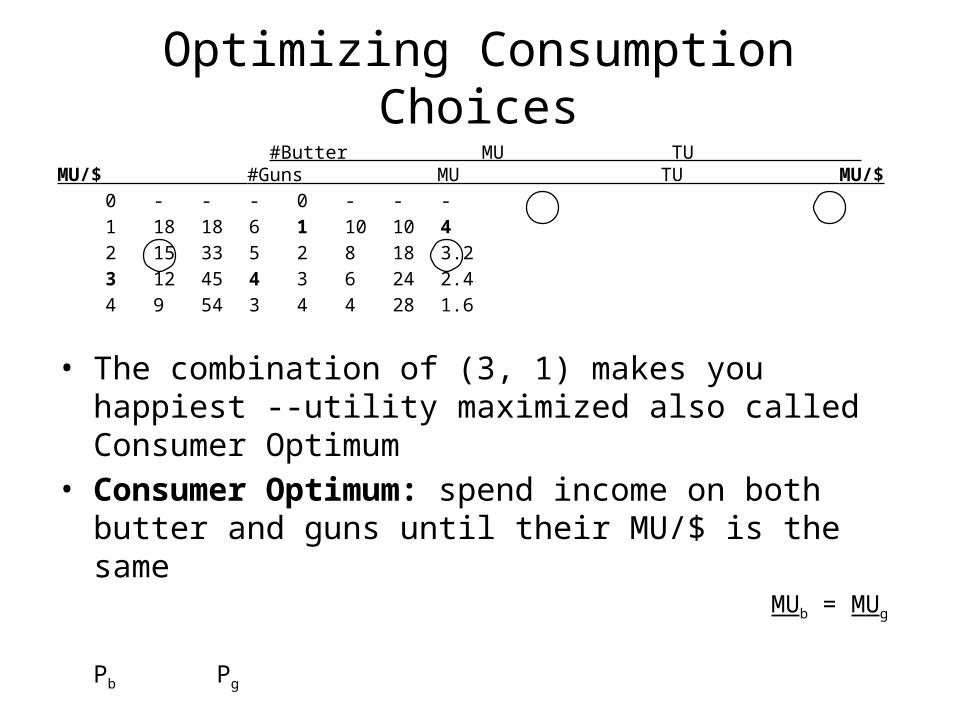
Optimizing Consumption Choices #Butter MU TU MU/$ #Guns MU TU MU/$
0 - - - 0 - - - 1 18 18 6 1 10 10 42 15 33 5 2 8 18 3.23 12 45 4 3 6 24 2.44 9 54 3 4 4 28 1.6
• The combination of (3, 1) makes you happiest --utility maximized also called Consumer Optimum
• Consumer Optimum: spend income on both butter and guns until their MU/$ is the same
MUb = MUg
Pb Pg
or, 12/$3 = 10/$2.50
or, 4 = 4
Complements and Substitutes
• Substitutes are goods that can be used in place of another. Eg. Butter and margarine!
• Substitutes have positive cross-price elasticities.
• As margarine price goes up, demand for butter goes up too!!!
Complements and Substitutes
• Complements are goods that are used in conjunction with other goods.
• Complements have negative cross-price elasticities.
• Eg. Peanut butter and jelly...when the price of up, demand for jelly goes down.
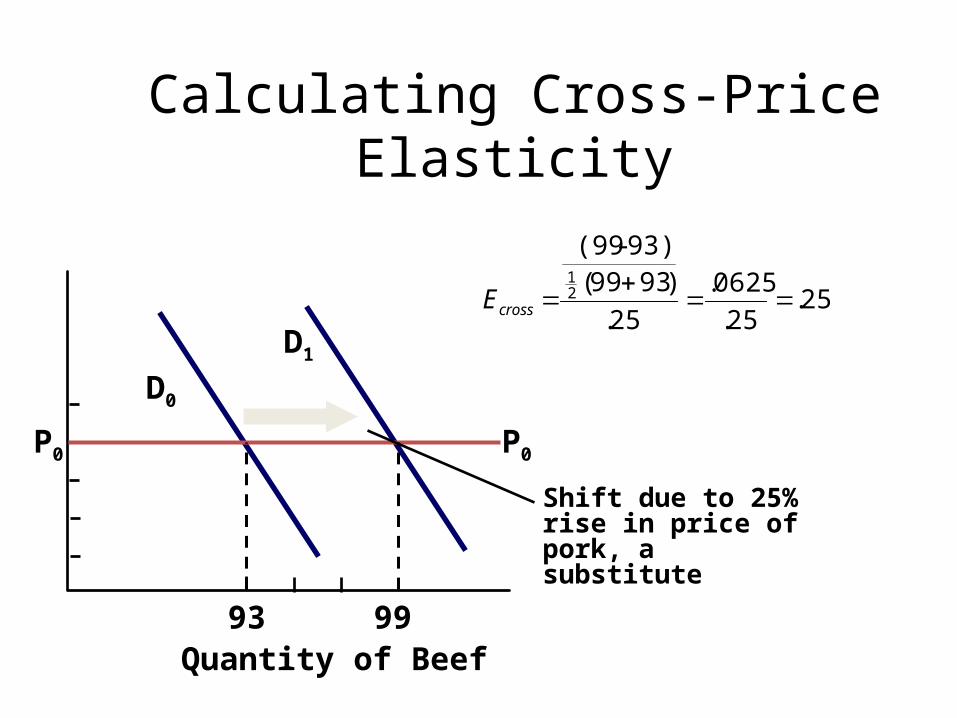
Calculating Cross-Price Elasticity
D0
P0
D1
P0
93Quantity of Beef
99
Shift due to 25% rise in price of pork, a substitute
25.25.
0625.
25.
)9399(93)-(99
21
crossE
Income Elasticity of Demand
• An increase in income generally increases one’s consumption of almost all goods.
• The increase may be greater for some goods than for others.
Income Elasticity of Demand
• Normal goods are those whose consumption increases with an increase in income.
• They have income elasticities greater than zero or positive
Income Elasticity of Demand
• Inferior goods are those whose consumption decreases when income increases.
• Inferior goods have income elasticities less than zero.
Firms Maximize Profit
• Accountants focus on explicit costs and revenues
• Economists and accountants measure profit differently
• Economists focus on both explicit and implicit costs and revenue
Economic profit = (explicit and implicit revenue) – (explicit and implicit cost)
Implicit Cost example is opportunity cost of land
Short Run vs. Long Run
• A firm chooses from all possible production techniques
• All inputs are variable
• The production process can be divided into the long run and the short run
Short run Long run
• A firm is constrained in regard to what production decisions it can make
• Some inputs are fixed eg. 6 people demand salad, need time to hire
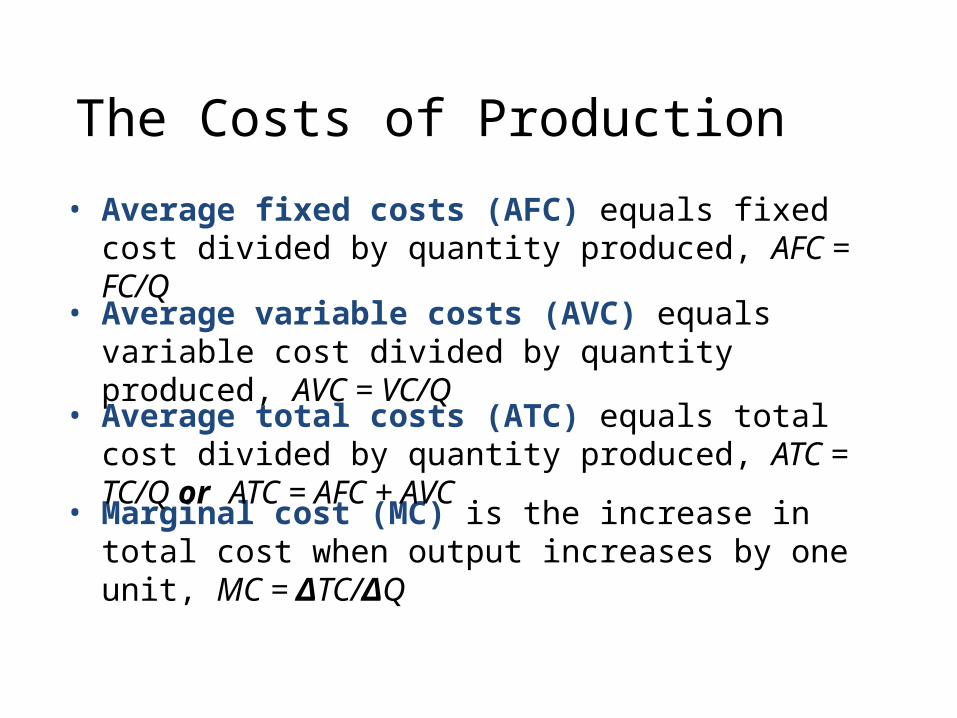
The Costs of Production• Average fixed costs (AFC) equals fixed cost divided
by quantity produced, AFC = FC/Q
• Marginal cost (MC) is the increase in total cost when output increases by one unit, MC = ΔTC/ΔQ
• Average variable costs (AVC) equals variable cost divided by quantity produced, AVC = VC/Q
• Average total costs (ATC) equals total cost divided by quantity produced, ATC = TC/Q or ATC = AFC + AVC
Perfectly Competitive Markets Ch 9.This material will also be on the exam.
In Perfectly Competitive Markets :
1. The Firm is price taker so the demand curve for the firms product is horizontal (perfectly inelastic)
2. No firm can make an economic profit
3. Demand and supply intersect at marginal cost. Example:Demand = Supply = $5, then in a perfectly competitive market in equilibrium, marginal cost is also $5.
In other words, in equilibrium: Demand = Supply = Marginal Cost = $5


