36
Midterm Review PU515 – Applied Biostatistics Dana Colbert-Wheeler, MHA, MCHES
| Date post: | 27-Dec-2015 |
| Category: |
Documents |
| Upload: | darlene-mclaughlin |
| View: | 217 times |
| Download: | 1 times |

Midterm ReviewPU515 – Applied BiostatisticsDana Colbert-Wheeler, MHA, MCHES

First things first…
• How are you all feeling about the course thus far?
• What specific things are you struggling with, and what have you mastered at this point?
• Reminder: please make sure you are reviewing the examples in your textbook/workbook!
PU515 Midterm Review
• The midterm consisted of 8 questions
• Calculations
• True/False
• The total points for the exam was 100 points.
• The midterm covered Chapters 1-5, but focused mostly on probability
PU515 Midterm Review
• As you will see from this review and from your Units 6-9 assignments, the key to solving these problems is thorough review of the textbook/workbook.
• For the midterm, in particular, Table 5-10 provides a Summary of Key Formulas. This is what you need to address every problem! • Every chapter from has this summary – find it!
PU 515 Midterm Review
• Question #1: Glucose levels in patients free of diabetes are assumed to follow a normal distribution with a mean of 120 and a standard deviation of 16. • In other words, patients who do not have diabetes
generally have an average glucose level of 120, but this level can vary. Since the standard deviation is 16, it can be as low as 104, and as high as 136.
PU515 Midterm Review
• A.) What proportion of patients has glucose levels exceeding 115?
• In other words, of the total # of patients, how many of them have glucose levels higher than 115?
• So what should be our first step here? How do we know where to begin?
• We need to find the appropriate formula for this problem. • Remember the scenario. It stated that glucose levels followed a
normal distribution, so we need to use that formula (see section 5.6.2)
PU515 Midterm Review
• Since 120 is the mean, and 115 is the level we have been given (which is lower than the mean), we subtract by 115 from 120 and then divide that value by the standard deviation, which is 16. • 115 – 120 / 16 = -0.3125.
• We then find the z value of -0.3125 using the table in the back of your textbook. The z value is 0.3783. • Since Table 1 gives us the probability that z < 0.378, we need to
subtract it from 1 1-.03783 = 0.6217• Here’s the summary calculation:
P(X > 115) = P(Z > 115-120/16) = P(Z > -0.31) = 1-0.3783 = 0.6217
PU515 Midterm Review
• B.) If a patient has a glucose level of 140, what percentile is this? • In other words, if the patient’s glucose exceeds the mean of
120, what percentile do they fall in? • Note: since the mean represents the 50% percentile, you know that this
answer must be greater than 50% given that 140 is higher than the mean of 120.
• Since the mean is 120, and we have been given a value or 140 (which is higher than the mean) we take 140 and subtract 120, and then divide that value by the standard deviation, which is 16.• 140 – 120 / 16 = 1.25.
PU515 Midterm Review
• We then find the z value of 1.25 using the table in the back of your textbook. • The z value is 0.8944.
• Here’s the summary calculation:P(X < 140) = P(Z < 140-120/16) =
P(Z < 1.25) = 0.8944, 89th percentile
PU515 Midterm Review
• C.) What is the probability that the mean glucose level exceeds 115 in a sample of 12 patients? • In other words, what is the possibility of having an average glucose level
of 115 in a group of 12 patients?• Note: this question is different from a and b. This is referencing a
sample patient population so we need to use a different formula • See Table 5-10, p. 88
• In this case, we need to use the formula for the Central Limit Theorem – this is the last formula in Table 5-10.
• So how do we complete this problem?• Here’s the summary calculation:
P(X > 115) = P(Z > 115-120/16 divided by sq12) = P(Z > -1.08) = 1-0.1401 = 0.8599
PU515 Midterm Review
• Question #2: The following are body mass index (BMI) scores measured in 12 patients who are free of diabetes and participating in a study of risk factors for obesity. Body mass index is measured as the ratio of weight in kilograms to the height in meters squared.
• 25 27 31 33 26 28 38 41 24 32 35 40
PU515 Midterm Review
• A.) Compute the mean BMI.
• So what do we do?
• You need to take all 12 BMIs and add them up. This will give you a value of 380. Then, divide that value by 12 since we have 12 patients. • 25+27+31+33+26+28+38+41+24+32+35+40/12
• This will give you a final mean of 31.66 or 31.7.
PU515 Midterm Review
• B.) Compute the standard deviation of BMI. • In other words, calculate the value of patients who fall
above or below the mean.
• To perform this calculation, you need to know/use the formula for standard deviation. Once you plug in the values, you should end up with a final answer of 5.9
• See p. 47 (Chapter 4)
PU515 Midterm Review
• C.) Compute the median BMI using the following data:
• 24, 25, 26, 27, 28, 31, 32, 33, 35, 38, 40, 41
• To calculate the median, you need to locate the middle value. In this case, we don’t have a single middle value, we have two: 31 and 32. As a result, we need to add the two values together and divide them by 2.
• 31 + 31 / 2 = 31.5
PU515 Midterm Review
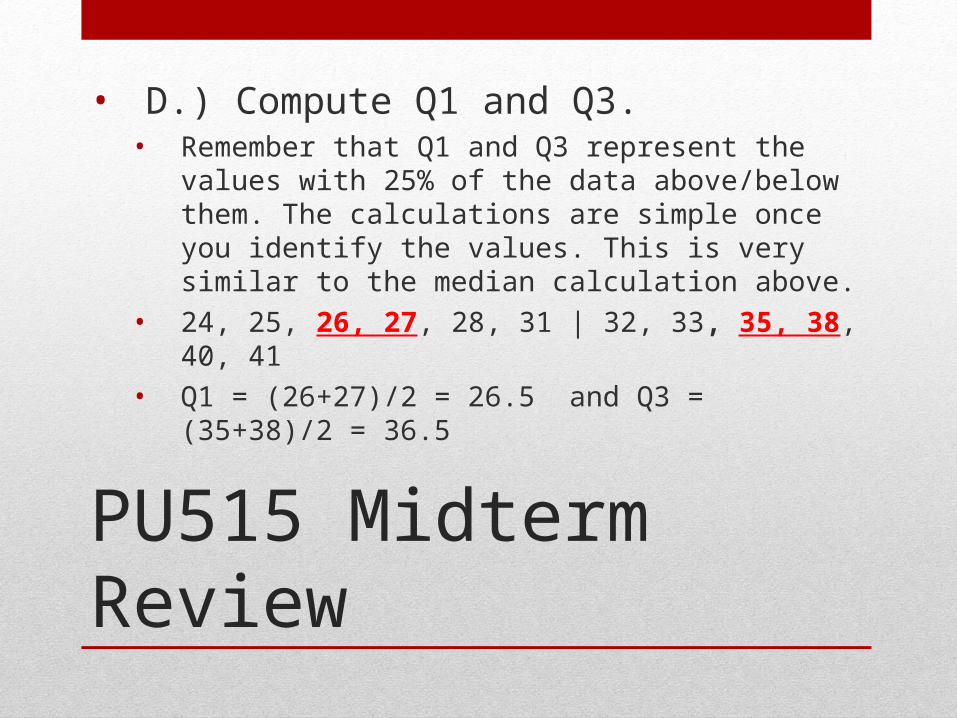
• D.) Compute Q1 and Q3. • Remember that Q1 and Q3 represent the values
with 25% of the data above/below them. The calculations are simple once you identify the values. This is very similar to the median calculation above.
• 24, 25, 26, 27, 28, 31 | 32, 33, 35, 38, 40, 41
• Q1 = (26+27)/2 = 26.5 and Q3 = (35+38)/2 = 36.5
PU515 Midterm Review
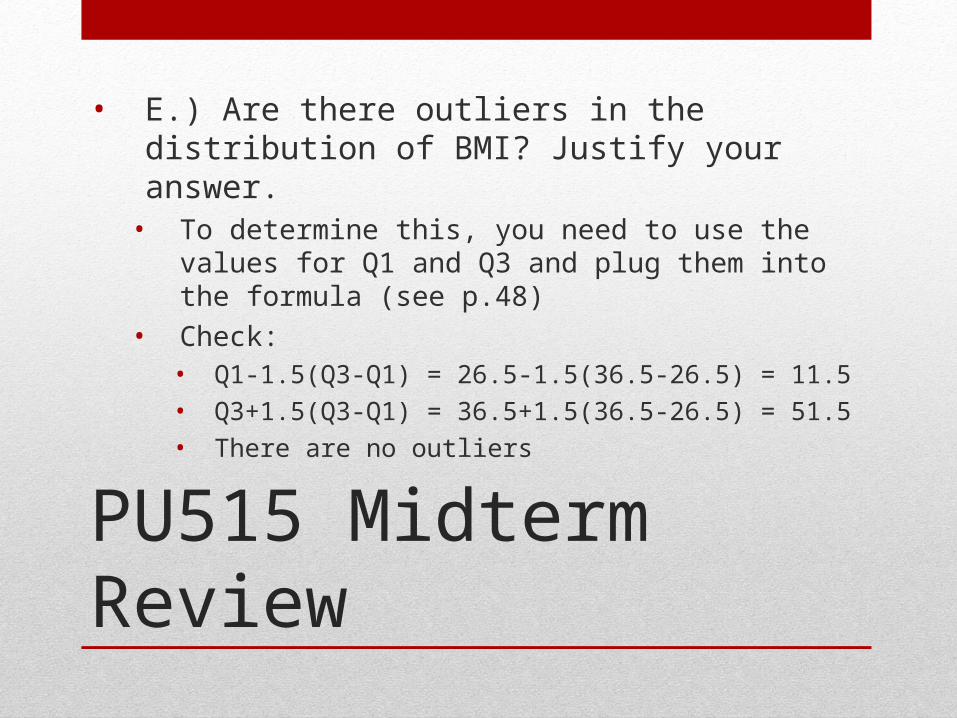
• E.) Are there outliers in the distribution of BMI? Justify your answer.
• To determine this, you need to use the values for Q1 and Q3 and plug them into the formula (see p.48)
• Check: • Q1-1.5(Q3-Q1) = 26.5-1.5(36.5-26.5) = 11.5
• Q3+1.5(Q3-Q1) = 36.5+1.5(36.5-26.5) = 51.5
• There are no outliers
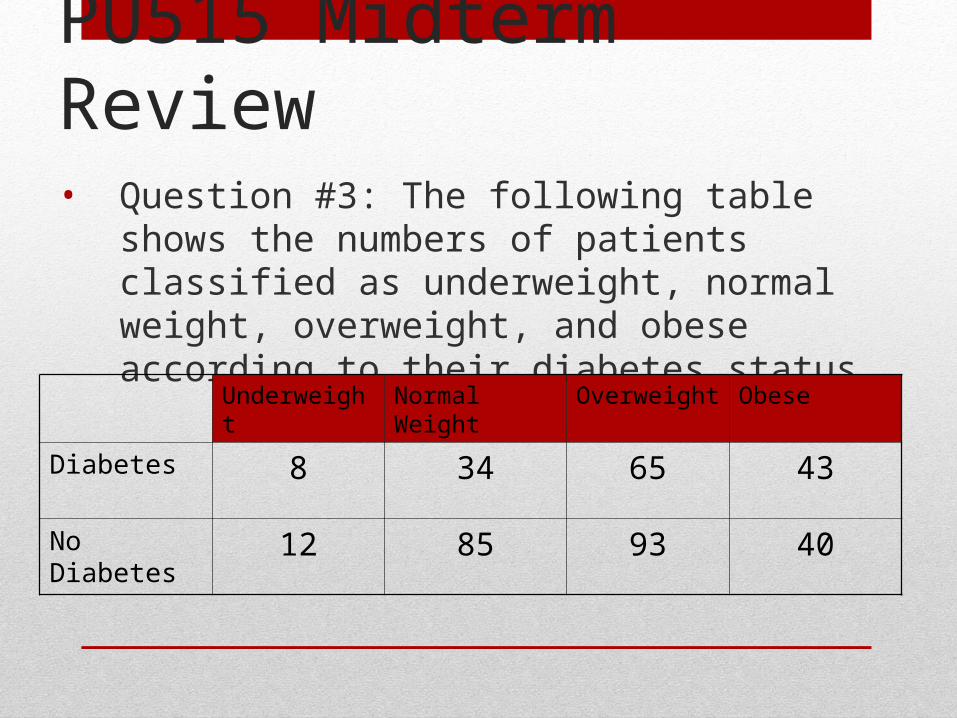
PU515 Midterm Review• Question #3: The following table shows the
numbers of patients classified as underweight, normal weight, overweight, and obese according to their diabetes status.
Underweight Normal Weight Overweight Obese
Diabetes 8 34 65 43
No Diabetes 12 85 93 40
PU515 Midterm Review
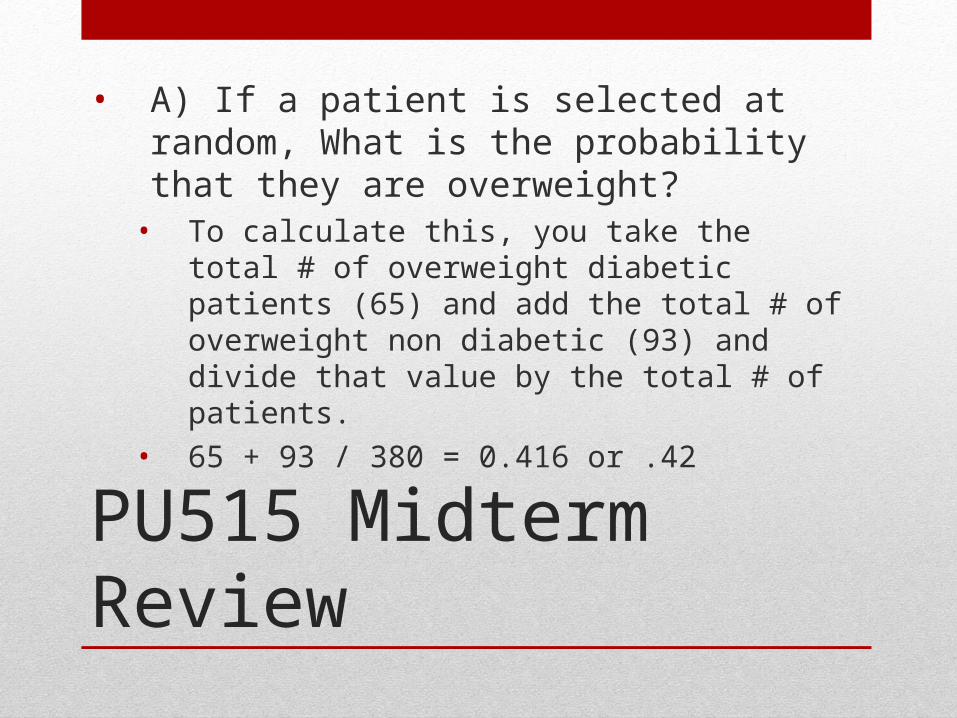
• A) If a patient is selected at random, What is the probability that they are overweight?
• To calculate this, you take the total # of overweight diabetic patients (65) and add the total # of overweight non diabetic (93) and divide that value by the total # of patients.
• 65 + 93 / 380 = 0.416 or .42
PU515 Midterm Review
• B.) If a patient is selected at random, What is the probability that they are obese and diabetic?
• To calculate this, you take the total # of obese diabetic patients (43) and divide that by 380.
• 43/380 = 0.11
PU515 Midterm Review
• C.) If a patient is selected at random, What proportion of the diabetics are obese? • Note: this is not asking for probability, this is asking of
the 380 total patients, what proportion of the diabetics is obese?
• To calculate this, we take the total # of obese diabetics (43) and divide that by the total # of diabetics (150)
• 43/150 = 0.29
PU515 Midterm Review
• D.) If a patient is selected at random, What proportion of normal weight patients are not diabetic?
• To calculate this, we take the number of non diabetic patients (85) and divide that by # of normal weight patients (119).
• 85/119 = 0.71
PU515 Midterm Review
• E.) If a patient is selected at random, What proportion of patients is normal weight or underweight?
• Note: this is not two separate answers! Many of you did this on the exam. There should be one final answer.
• To calculate this, we take the # of normal weight patients (119) and add that to the # of underweight patients (20), then we divide that by the # of patients
• 119 + 20 / 380 = 0.37
PU515 Midterm Review
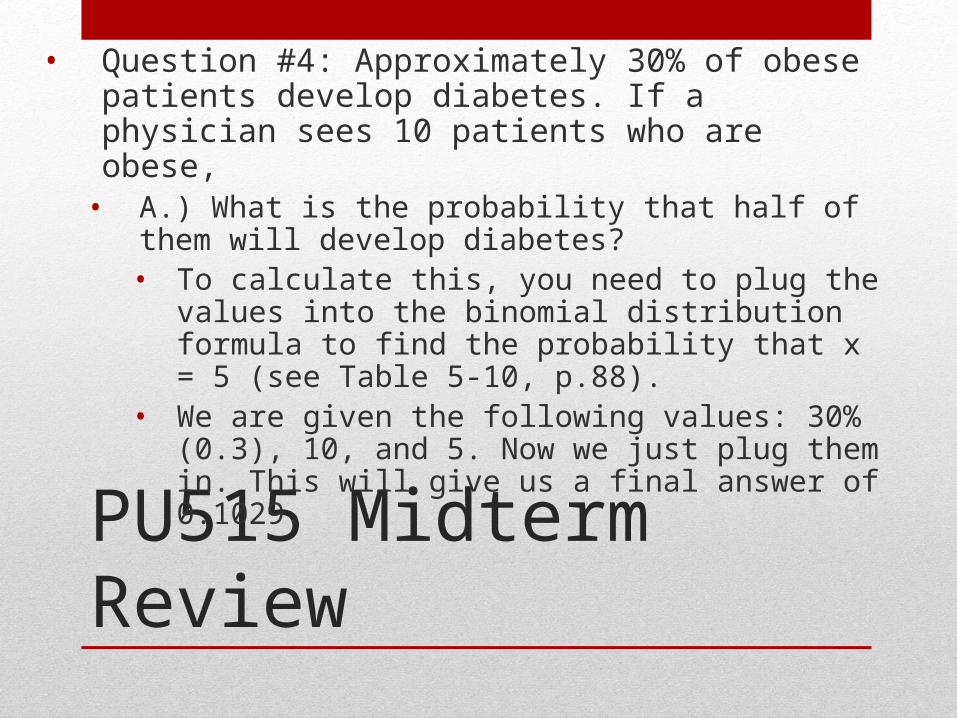
• Question #4: Approximately 30% of obese patients develop diabetes. If a physician sees 10 patients who are obese,
• A.) What is the probability that half of them will develop diabetes? • To calculate this, you need to plug the values into the
binomial distribution formula to find the probability that x = 5 (see Table 5-10, p.88).
• We are given the following values: 30% (0.3), 10, and 5. Now we just plug them in. This will give us a final answer of 0.1029.
PU515 Midterm Review
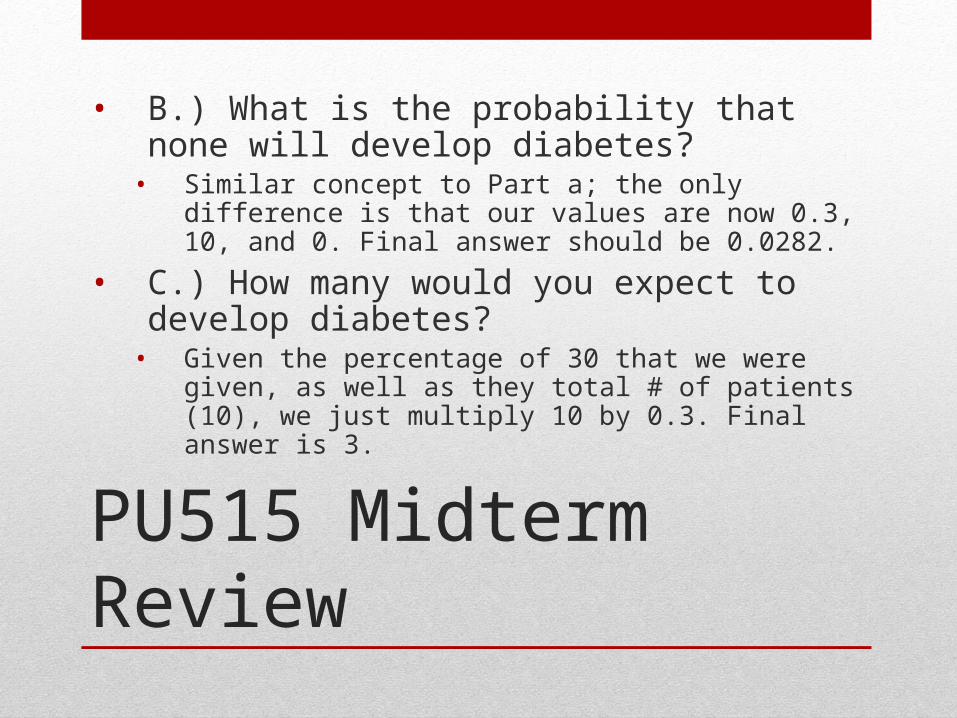
• B.) What is the probability that none will develop diabetes?
• Similar concept to Part a; the only difference is that our values are now 0.3, 10, and 0. Final answer should be 0.0282.
• C.) How many would you expect to develop diabetes?
• Given the percentage of 30 that we were given, as well as they total # of patients (10), we just multiply 10 by 0.3. Final answer is 3.
PU515 Midterm Review
• Question #5: A new non-invasive screening test is proposed that is claimed to be able to identify patients with impaired glucose tolerance based on a batter of questions related to health behaviors. The new test is given to 75 patients. Based on each patient’s responses to the questions they are classified as positive or negative for impaired glucose tolerance. Each patient also submits a blood sample and their glucose tolerance status is determined.
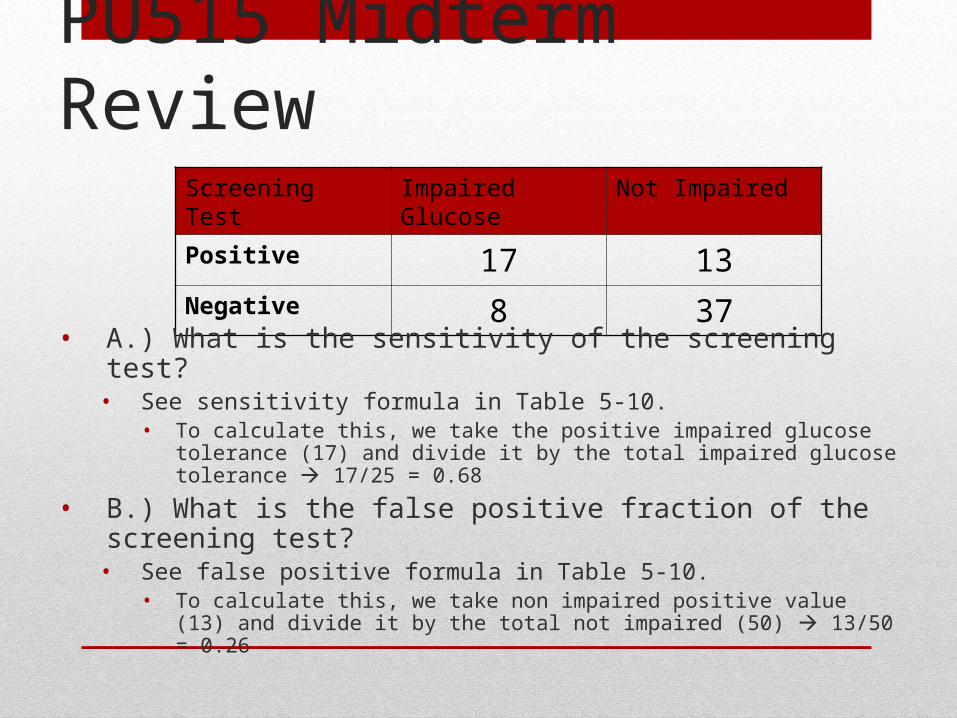
PU515 Midterm ReviewScreening Test Impaired Glucose Not Impaired
Positive 17 13Negative 8 37
• A.) What is the sensitivity of the screening test?• See sensitivity formula in Table 5-10.
• To calculate this, we take the positive impaired glucose tolerance (17) and divide it by the total impaired glucose tolerance 17/25 = 0.68
• B.) What is the false positive fraction of the screening test?• See false positive formula in Table 5-10.
• To calculate this, we take non impaired positive value (13) and divide it by the total not impaired (50) 13/50 = 0.26
PU515 Midterm Review
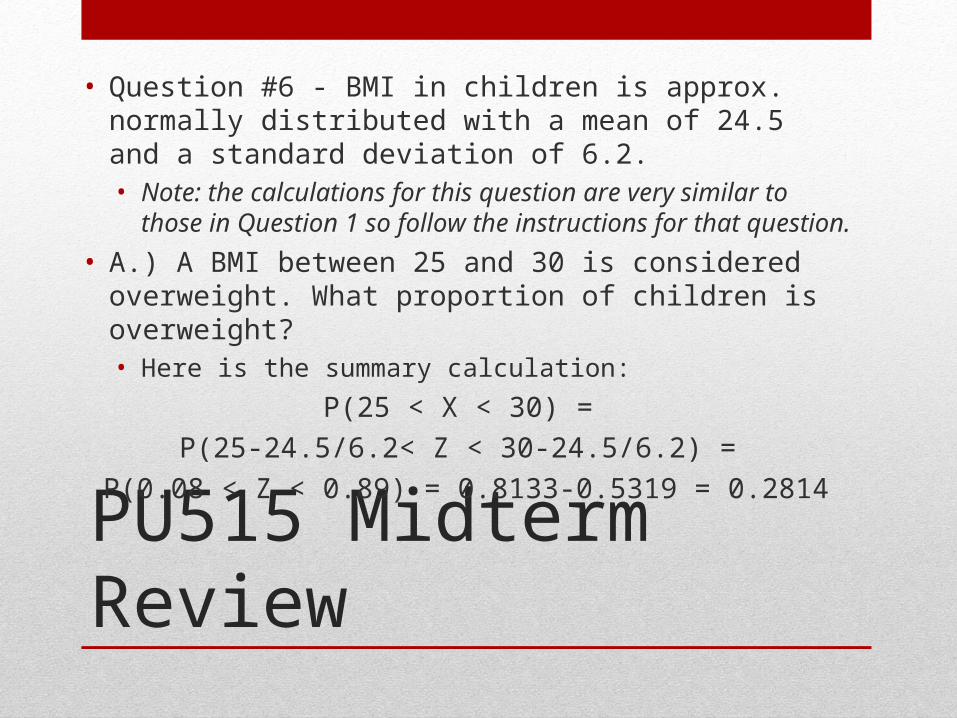
• Question #6 - BMI in children is approx. normally distributed with a mean of 24.5 and a standard deviation of 6.2. • Note: the calculations for this question are very similar to those
in Question 1 so follow the instructions for that question.
• A.) A BMI between 25 and 30 is considered overweight. What proportion of children is overweight? • Here is the summary calculation:
P(25 < X < 30) =
P(25-24.5/6.2< Z < 30-24.5/6.2) =
P(0.08 < Z < 0.89) = 0.8133-0.5319 = 0.2814
PU515 Midterm Review
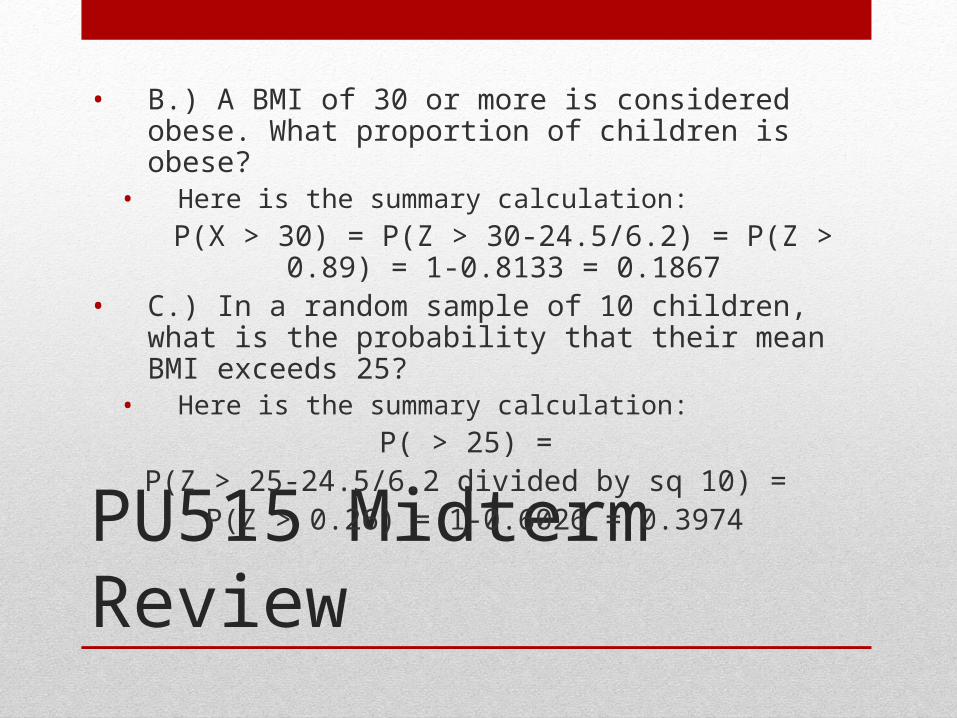
• B.) A BMI of 30 or more is considered obese. What proportion of children is obese?
• Here is the summary calculation:
P(X > 30) = P(Z > 30-24.5/6.2) = P(Z > 0.89) = 1-0.8133 = 0.1867
• C.) In a random sample of 10 children, what is the probability that their mean BMI exceeds 25?
• Here is the summary calculation:
P( > 25) = P(Z > 25-24.5/6.2 divided by sq 10) =
P(Z > 0.26) = 1-0.6026 = 0.3974
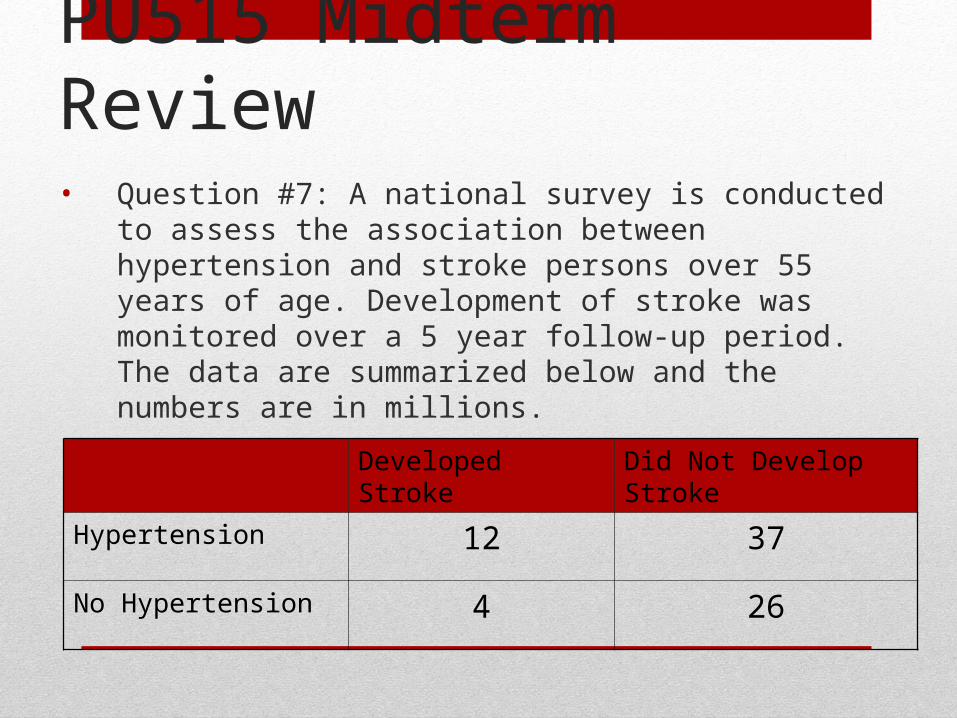
PU515 Midterm Review• Question #7: A national survey is conducted to assess the
association between hypertension and stroke persons over 55 years of age. Development of stroke was monitored over a 5 year follow-up period. The data are summarized below and the numbers are in millions.
Developed Stroke Did Not Develop Stroke
Hypertension 12 37
No Hypertension 4 26
PU515 Midterm Review
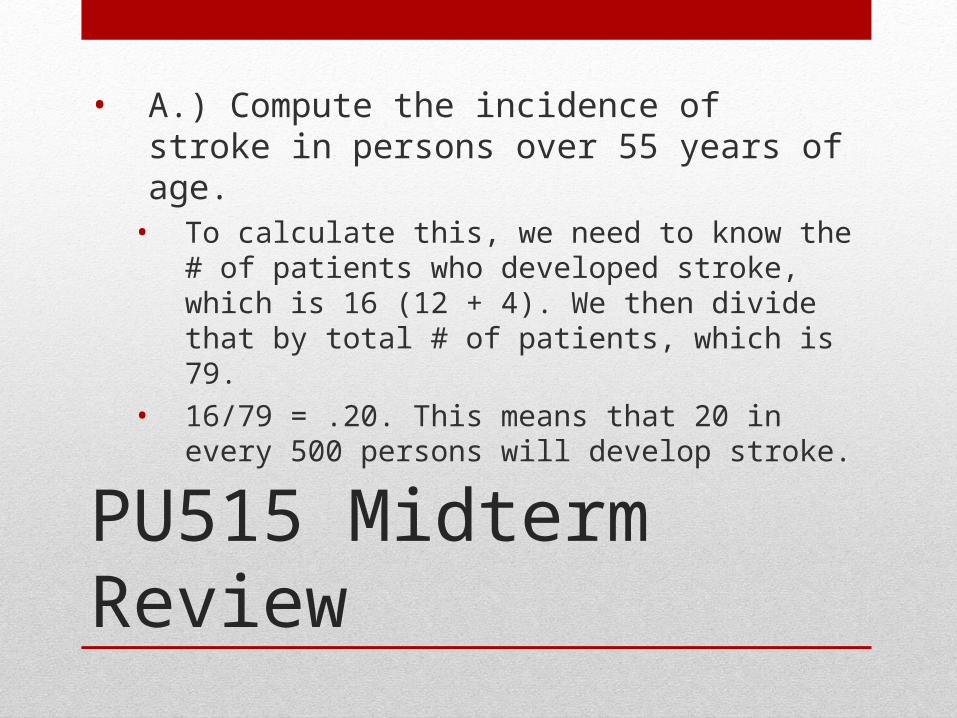
• A.) Compute the incidence of stroke in persons over 55 years of age.
• To calculate this, we need to know the # of patients who developed stroke, which is 16 (12 + 4). We then divide that by total # of patients, which is 79.
• 16/79 = .20. This means that 20 in every 500 persons will develop stroke.
PU515 Midterm Review
• B.) Compute the relative risk of stroke comparing hypertensive to non-hypertensive persons • To calculate this, we need the formula for relative risk
(see Summary of Key Formulas on Table 3-7, p. 26).
• RR = PP exposed/PP unexposed
• Now, let’s plug in our data…
PU515 Midterm Review
• We know that 12 hypertensive patients developed stroke, and there are a total of 49 hypertensive patients. So, we take 12/49 = 0.24.
• Next, we do the same calculation for non-hypertensive patients. So, we divide 4/30 because we know that 4 of the 30 non-hypertensive patients developed stroke. 4/30 = 0.13.
• We then divide these two values: 0.24/1.33 = 1.85.
PU515 Midterm Review
• C.) Compute the odds ratio of stroke comparing hypertensive to non-hypertensive persons.
• To calculate this, we need the formula for odds ratio (see Summary of Key Formulas on Table 3-7, p. 26).
• Now, let’s plug in our data…
PU515 Midterm Review
• We know that 12 of the hypertensive patients developed stroke, while 37 did not• 12/37 = 0.32
• We know that 4 of the non-hypertensive patients developed stroke, while 26 did not• 4/26 = 0.15
• To get the final answer, we divide these two values: 0.32/0.15 = 2.13
PU515 Midterm Review
• Question #8: True/False Questions• If there are outliers, then the mean will be greater than
the median. • False. See Chap 4, p. 47.
• The 90th percentile of the standard normal distribution is 1.645.
• False. The 95th % of the standard normal dist. is 1.645. • The mean is the 50th percentile of any normal
distribution. • True, but this is only the case with normal distributions.
• The mean is a better measure of location when there are no outliers.
• True. See Chap 4, p. 46.

Wrapping it up…
• Any final questions? Was this helpful to you? I hope so
• We will have one more seminar to review for our final exam. Please note, however, that the purpose of this seminar is not to present new material; it is to review the Unit 6 and 7 assignments since your final exam will be primarily based on this material. • Final Exam: due at the end of Unit 9
• Tuesday, May 1st @ 11:59pm


