30
TDWI BEST PRACTICES REPORT FIRST QUARTER 2008 By Wayne W. Eckerson and Richard P. Sherman STRATEGIES FOR MANAGING SPREADMARTS Migrating to a Managed BI Environment Co-sponsored by

TDWI besT pracTIces reporT first quarter 2008
By Wayne W. Eckerson and Richard P. Sherman
StrategieS for Managing SpreadMartS Migrating to a Managed BI Environment
Co-sponsored by

www.tdwi.org 1
Research Methodology and Demographics . . . . . . . . . . . . . . . . . . . . . . . . . . 3
What is a Spreadmart? . . . . . . . . . . . . . . . . . . . . . . . . . . . . . . . . . . . . . . . . . . . 4
Dangers of Spreadmarts . . . . . . . . . . . . . . . . . . . . . . . . . . . . . . . . . . . . . . . . 5
Not All Bad? . . . . . . . . . . . . . . . . . . . . . . . . . . . . . . . . . . . . . . . . . . . . . . . . . . 6
Remedies . . . . . . . . . . . . . . . . . . . . . . . . . . . . . . . . . . . . . . . . . . . . . . . . . . . . .7
The Evolution of Spreadmarts . . . . . . . . . . . . . . . . . . . . . . . . . . . . . . . . . . . . . . 8
Where Spreadmarts Lurk . . . . . . . . . . . . . . . . . . . . . . . . . . . . . . . . . . . . . . . . 8
The Rationale for Spreadmarts . . . . . . . . . . . . . . . . . . . . . . . . . . . . . . . . . . . 9
Spreadmart Perceptions . . . . . . . . . . . . . . . . . . . . . . . . . . . . . . . . . . . . . . . . .12
Spreadmarts’ Benefits and Liabilities . . . . . . . . . . . . . . . . . . . . . . . . . . . . . . 13
Benefits . . . . . . . . . . . . . . . . . . . . . . . . . . . . . . . . . . . . . . . . . . . . . . . . . . . . 13
Liabilities . . . . . . . . . . . . . . . . . . . . . . . . . . . . . . . . . . . . . . . . . . . . . . . . . . . . .14
Architectural Approaches to Spreadmarts . . . . . . . . . . . . . . . . . . . . . . . . . . 16
Not All Spreadmarts Are Alike . . . . . . . . . . . . . . . . . . . . . . . . . . . . . . . . . . 18
Renovating Spreadmarts . . . . . . . . . . . . . . . . . . . . . . . . . . . . . . . . . . . . . . . 19
Segmenting Office Integration Technology . . . . . . . . . . . . . . . . . . . . . . . . . 20
Recommendations . . . . . . . . . . . . . . . . . . . . . . . . . . . . . . . . . . . . . . . . . . . . . . 25
Conclusion . . . . . . . . . . . . . . . . . . . . . . . . . . . . . . . . . . . . . . . . . . . . . . . . . . . . . .27
Table of Contents
StrategieS for Managing SpreadMartSMigrating to a Managed BI Environment
By Wayne W. Eckerson and Richard P. Sherman
first quarter 2008TDWI besT pracTIces reporT

2 TDWI research
stratEgIEs for ManagIng sprE adMarts
About the AuthorsWAYNE W. ECKERSON is the director of TDWI Research. Eckerson is an industry analyst and educator who has covered data warehousing and business intelligence since 1995. Eckerson is the author of many in-depth, groundbreaking reports, a columnist for several business technology magazines, and a noted speaker and consultant. He is the author of Performance Dashboards: Measuring, Monitoring, and Managing Your Business (John Wiley & Sons, 2005) and the creator of TDWI’s BI Maturity Model and Benchmarking Assessment service. He can be reached at [email protected].
RICHARD P. SHERMAN is the founder of Athena IT Solutions, a Boston-area firm offering data warehousing and business intelligence consulting and training. Sherman has over 20 years of experience in data warehousing and decision support systems. He is an expert instructor and speaker at industry conferences and seminars and teaches at Northeastern University’s graduate school of engineering. He has a monthly column in DM Review and has been quoted in financial and industry publications. Sherman writes for two blogs: The Data Doghouse and Informatica’s Enterprise Data Management blog. He can be reached at [email protected].
About TDWITDWI, a division of 1105 Media, Inc., is the premier provider of in-depth, high-quality education and research in the business intelligence and data warehousing industry. Starting in 1995 with a single conference, TDWI is now a comprehensive resource for industry information and professional development opportunities. TDWI sponsors and promotes quarterly World Conferences, regional seminars, onsite courses, a worldwide Membership program, business intelligence certification, resourceful publications, industry news, an in-depth research program, and a comprehensive Web site: www.tdwi.org.
About TDWI ResearchTDWI Research provides research and advice for BI professionals worldwide. TDWI Research focuses exclusively on BI/DW issues and teams up with industry practitioners to deliver both broad and deep understanding of the business and technical issues surrounding the deployment of business intelligence and data warehousing solutions. TDWI Research offers reports, commentary, and inquiry services via a worldwide Membership program and provides custom research, benchmarking, and strategic planning services to user and vendor organizations.
AcknowledgmentsTDWI would like to thank many people who contributed to this report. First, we appreciate the many users who responded to our survey, as well as those who responded to our requests for phone interviews. We would also like to recognize TDWI’s account and production team: Jennifer Agee, Bill Grimmer, Denelle Hanlon, Deirdre Hoffman, and Susan Stoddard.
SponsorsActuate, Cognos, Microsoft, MicroStrategy, Pentaho, SAP, Unisys, and XLCubed sponsored the research for this report.
©2008 by 1105 Media, Inc . All rights reserved . Printed in the United States . TDWI is a trademark of 1105 Media, Inc . Other product and company names mentioned herein may be trademarks and/or registered trademarks of their respective companies . TDWI is a division of 1105 Media, Inc ., based in Chatsworth, CA .

www.tdwi.org 3
Research Methodology
Research MethodologyFocus. This report is designed for business and technical executives who need to understand the pros and cons of spreadmarts and learn best practices for managing, renovating, or replacing them. The report defines spreadmarts, explains their benefits to business users and liabilities to the enterprise, and discusses ways to deal with them.
Methodology. The research for this report is based on a survey that TDWI conducted in the fall of 2007 as well as interviews with BI practitioners, consultants, industry analysts, and report sponsors. TDWI contacted BI professionals in its database and 1105 Media’s database. (TDWI is a business unit of 1105 Media, Inc.) The survey was also promoted on the Data Doghouse blog. The survey received 204 responses.
Respondent Profile. A majority of the survey respondents are technically oriented: 60% are IT professionals; 17% are BI consultants. However, business sponsors, drivers, or users accounted for 21% of respondents.
Company Profile. Most of the respondents work in organizations that support the entire enterprise (60%) with the remainder working in divisional or departmental groups. Nearly a third (35%) work at companies with revenues of less than $500 million, while a nearly equal number (30%) work at companies earning between $500 million and $5 billion in revenues. The rest work at companies with more than $5 billion in revenues (27%) or don’t know the revenue of their firms (8%). Most respondents are based in North America (70%) or Europe (13%) and work in a range of industries, but the largest percentages are in financial services (15%), insurance (8%), manufacturing (9%), and software/Internet (8%). Consultants were asked to fill out the survey with their most recent client in mind.
Position
Demographics
Role
* The “other” category consists of industries with less than 4% of respondents.
Industry
Revenues
Based on 204 survey respondents.
4 TDWI research
stratEgIEs for ManagIng sprE adMarts
What Is a Spreadmart?Business users are empowered by knowledge—and knowledge comes, in part, from having access to accurate and timely information. It is generally up to the information technology (IT) department to supply this information. But it doesn’t always work out that way.
Definition of a Spreadmart. TDWI used the following definition of a spreadmart in the survey it conducted as part of this report:
A spreadmart is a reporting or analysis system running on a desktop database (e.g., spreadsheet, Access database, or dashboard) that is created and maintained by an individual or group that performs all the tasks normally done by a data mart or data warehouse, such as extracting, transforming, and formatting data as well as defining metrics, submitting queries, and formatting and publishing reports to others. Also known as data shadow systems, human data warehouses, or IT shadow systems.
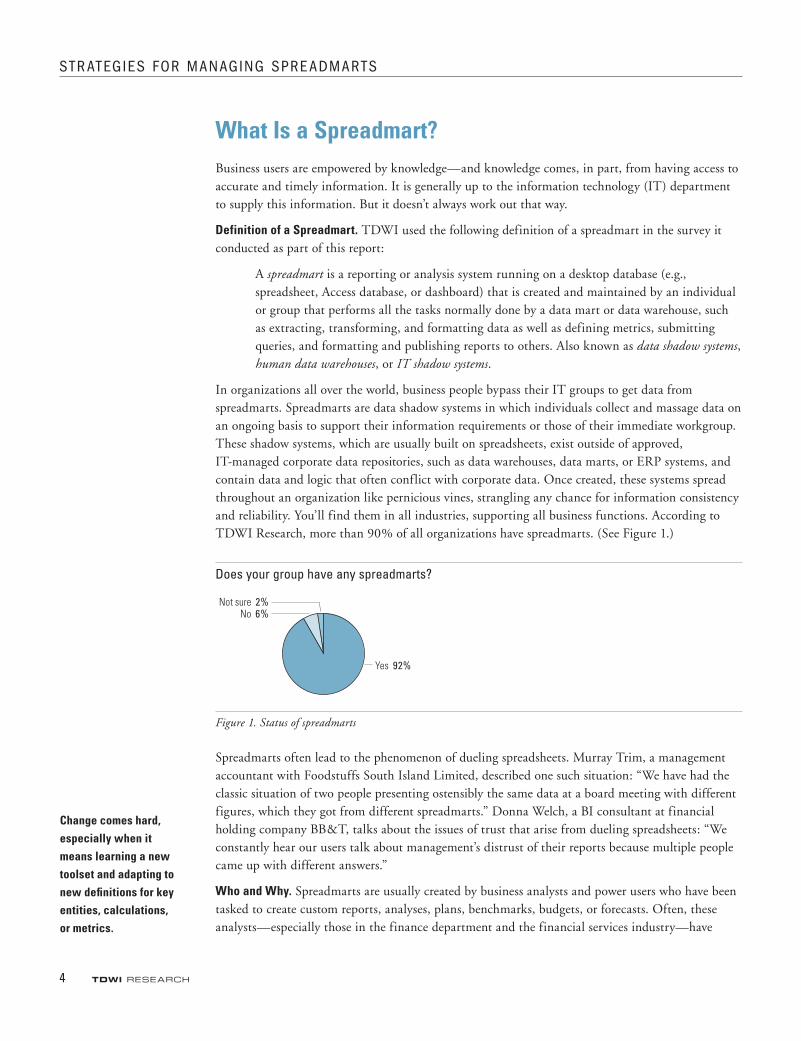
In organizations all over the world, business people bypass their IT groups to get data from spreadmarts. Spreadmarts are data shadow systems in which individuals collect and massage data on an ongoing basis to support their information requirements or those of their immediate workgroup. These shadow systems, which are usually built on spreadsheets, exist outside of approved, IT-managed corporate data repositories, such as data warehouses, data marts, or ERP systems, and contain data and logic that often conflict with corporate data. Once created, these systems spread throughout an organization like pernicious vines, strangling any chance for information consistency and reliability. You’ll find them in all industries, supporting all business functions. According to TDWI Research, more than 90% of all organizations have spreadmarts. (See Figure 1.)
Does your group have any spreadmarts?
Figure 1. Status of spreadmarts
Spreadmarts often lead to the phenomenon of dueling spreadsheets. Murray Trim, a management accountant with Foodstuffs South Island Limited, described one such situation: “We have had the classic situation of two people presenting ostensibly the same data at a board meeting with different figures, which they got from different spreadmarts.” Donna Welch, a BI consultant at financial holding company BB&T, talks about the issues of trust that arise from dueling spreadsheets: “We constantly hear our users talk about management’s distrust of their reports because multiple people came up with different answers.”
Who and Why. Spreadmarts are usually created by business analysts and power users who have been tasked to create custom reports, analyses, plans, benchmarks, budgets, or forecasts. Often, these analysts—especially those in the finance department and the financial services industry—have
Change comes hard, especially when it means learning a new toolset and adapting to new definitions for key entities, calculations, or metrics.

www.tdwi.org 5
What Is a Spreadmart?
become proficient with Microsoft Excel or Microsoft Access and prefer to use those tools to create reports and analyses. As a result, most are reluctant to adopt a new corporate reporting “standard,” which they believe will limit their effectiveness. Change comes hard, especially when it means learning a new toolset and adapting to new definitions for key entities, calculations, or metrics. Executives perpetuate the problem because they don’t want to pay hundreds of thousands of dollars or more to build a robust data infrastructure and deploy enterprise reporting and analysis tools. Instead, spreadmarts proliferate.
Dangers of Spreadmarts Inconsistent Views. The problem with spreadmarts is that their creators use different data sources, calculations, calendars, data conversions, naming conventions, and filters to generate reports and analyses based on their view of the business. The marketing department views customers and sales one way, while the finance department views them another way. The way the business operates in Germany is different from the way it operates in Brazil. Business units sell the same products with different names, packaging, pricing, and partner channels. When each group manages its own data and processes, it’s nearly impossible to deliver a consistent, enterprise view of customers, products, sales, profits, and so on. These parochial silos of data undermine cross-departmental and business unit synergies and economies of scale.
Excessive Time. In addition, business analysts spend two days a week—or almost half their time—creating spreadmarts, costing organizations $780,000 a year! (See page 16.) Instead of analyzing data, these high-priced employees act like surrogate information systems professionals, gathering, massaging, and integrating data. Many executives have initiated BI projects simply to offload these time-consuming data management tasks from analysts.
Increased Risk. In addition, spreadmarts are precarious information systems. Because they are created by business users, not information management professionals, they often lack systems rigor. The problems are numerous:
• Usersoftenenterdataintospreadmartsbyhand,whichleadstoerrorsthatoftengoundetected.
• Fewspreadmartsscalebeyondasmallworkgroup.
• Usersmaycreatepoorlyconstructedqueries,resultinginincorrectdata.
• Spreadmartsmaygeneratesystemanddataerrorswhentheyarelinkedtoupstreamsystemsor files that change without notice.
• Usersembedlogicincomplexmacrosandhiddenworksheetsthatfewpeopleunderstandbut nevertheless copy when creating new applications, potentially leading to unreliable data.
• Thereisnoaudittrailthattrackswhochangedwhatdataorwhentoensureadequatecontrol and compliance.
In short, spreadmarts expose organizations to significant risk. Business people may make decisions based on faulty data, establish plans using assumptions based on incorrect analyses, and increase the possibility of fraud and theft of key corporate data assets. (See the sidebar “Spreadmart Nightmares,” next page.)
Business analysts spend two days a week creating spreadmarts, costing organizations $780,000 a year.

6 TDWI research
stratEgIEs for ManagIng sprE adMarts
Spreadmart Nightmares
Lack of controls around the use of spreadsheets wreaks havoc on organizations every day, costing money and credibility. For instance, thefts of laptops containing spreadsheets with credit card numbers in them, such as those at the Department of Justice and Ameriprise Financial, have created tremendous problems for those organizations. The European Spreadsheet Risks Interest Group (www.eusprig.org) tracks publicly reported incidents where improper use of spreadsheets has created problems. Here are a few of their findings:
•Aproblemwithinaspreadsheetusedtomanageacitybudgetcreateda$5milliondeficit. In identifying the problem, the finance director found additional errors.
•AsubsidiaryofRichmond,VA–basedDominionResourceshikedconsumergaspricesbetween$200millionand$1billionduetoaclericalerrorinaspreadsheetfile.
•Aleadingnationalmortgagecompanywrotedown$2.4billioninmortgagesduetoachange control error in a spreadsheet.
Not All Bad?No Alternative. Despite these problems, there is often no acceptable alternative to spreadmarts. For example, the data that people need to do their jobs might not exist in a data warehouse or data mart, so individuals need to source, enter, and combine the data themselves to get the information. The organization’s BI tools may not support the types of complex analysis, forecasting, or modeling that business analysts need to perform, or they may not display data in the format that executives desire. Some organizations may not have an IT staff or a data management infrastructure, which leaves users to fend entirely for themselves with whatever tools are available.
As such, spreadmarts often fill a business requirement for information that IT cannot support in a timely, cost-effective manner. Spreadmarts give business people a short-term fix for information that they need to close a deal, develop a new plan, monitor a key process, manage a budget, fulfill a customer requirement, and so on. Ultimately, spreadmarts are a palpable instantiation of a business requirement. IT needs to embrace what the business is communicating in practice, if not in words, and take the appropriate action. Thus, spreadmarts should not be an entirely pejorative term.
Cheap, Quick, Easy. Moreover, since spreadmarts are based on readily available desktop tools, they are cheap and quick to build. Within a day or two, a savvy business analyst can prototype, if not complete, an application that is 100% tailored to the task at hand. Although the spreadmart may not be pretty or “permitted,” it does the job. And it may be better than the alternative—waiting weeks or months for IT to develop an application that often doesn’t quite meet the need and that costs more than executives or managers want to pay.
Nevertheless, there is a high price to pay for these benefits in the long term. Many executives have recognized the dangers of spreadmarts and made significant investments to fix this problem. However, not all have succeeded. In fact, most struggle to deliver a robust data delivery environment that weans users and groups off spreadmarts and delivers a single version of truth.
Ultimately, spreadmarts are a palpable instantiation of a business requirement.

www.tdwi.org 7
What Is a Spreadmart?
RemediesManaged BI Environment. The problem with spreadmarts is not the technology used to create them. Spreadsheets and other desktop-oriented tools are an important part of any organization’s technology portfolio. The problem arises when individuals use these tools as data management systems to collect, transform, and house corporate data for decision making, planning and process integration, and monitoring. When this happens, spreadmarts proliferate, undermining data consistency and heightening risk.
The technical remedy for spreadmarts is to manage and store data and logic centrally in a uniform, consistent fashion and then let individuals access this data using their tools of choice. In other words, the presentation layer should be separated from the logic and data. When this is done, business users can still access and manipulate data for reporting and analysis purposes, but they do not create new data or logic for enterprise consumption. At TDWI, we call this a managed business intelligence environment. The goal is to transform spreadmarts into managed spreadsheets. This lets IT do what it does best—collect, integrate, and validate data and rules—and lets business analysts do what they do best—analyze data, identify trends, create plans, and recommend decisions.
BI vendors are starting to offer more robust integration between their platforms and Microsoft Office tools. Today, the best integration occurs between Excel and OLAP databases, where users get all the benefits of Excel without compromising data integrity or consistency, since data and logic are stored centrally. But more needs to be done. (See the section “Segmenting Office Integration Technology” on page 20.)
Change Management. Applying the right mix of technology to address the spreadmart problem is the easy part. The hard part is changing habits, perceptions, behaviors, processes, and systems. People don’t change on their own, especially when they’ve been successful with a certain set of tools and processes for analyzing data and making decisions. Changing a spreadmart-dependent culture usually requires top executives to both communicate the importance of having unified, consistent, enterprise data, and to apply incentives and penalties to drive the right behaviors. Ultimately, change takes time, sometimes a generation or two, but the right organizational levers can speed up the process.
Aligning Business and IT. Another dynamic driving spreadmarts is the lack of communication and trust between business and IT. The business doesn’t adhere to the architectural standards and processes designed to support its long-term interests, while IT doesn’t move fast enough to meet business needs. To reverse this dynamic, both business and IT must recognize each other’s strengths and weaknesses and learn to work together for the common good. IT must learn to develop agile information systems that adapt quickly to changing business conditions and requirements. The business must recognize the importance of building sustainable, scalable solutions. IT must learn about the business and speak its language, while the business must not blame IT for failures when it continually underfunds, overrides, and hamstrings IT so that it cannot possibly serve business needs.
The goal is to transform spreadmarts into managed spreadsheets.
Business and IT must recognize each other’s strengths and weaknesses and learn to work together.

8 TDWI research
stratEgIEs for ManagIng sprE adMarts
The Evolution of Spreadmarts
Where Spreadmarts LurkSpreadmarts are everywhere. They exist in large and small organizations and are used to support every department and almost every imaginable business process. On average, organizations have 837 spreadmarts, although the median number is 30, which means a small number of organizations have a huge number of spreadmarts. Specifically, 17 out of 195 organizations said they have more than 1,000 spreadmarts, four have more than 10,000, and two have 40,000 and 50,000 spreadmarts, respectively.
In reality, few companies know exactly how many spreadmarts they have. When we asked respondents how they count the number of spreadmarts in their organization, a whopping 60% said, “We haven’t counted them.” Another 25% said, “We count them as we come across them.” Perhaps the organizations that said they have tens of thousands of spreadmarts are not anomalies, but are more honest than the rest! (See Figure 2.)
How do you count the number of spreadmarts in your group’s environment?
Figure 2. Respondents could select more than one response.
Finance generates the most spreadmarts by a wide margin, followed by marketing, operations, and sales (see Figure 3). Finance departments are particularly vulnerable to spreadmarts because they must create complex financial reports for internal and external reporting as well as develop detailed financial plans, budgets, and forecasts on an ad hoc basis. As a result, they are savvy users of spreadsheets, which excel at this kind of analysis.
Few companies know exactly how many spreadmarts they have.

www.tdwi.org 9
The Evolution of Spreadmarts
Rank the top five departments that generate spreadmarts.
Figure 3. Finance generates the most spreadmarts, followed by marketing, operations, and sales.
Not surprisingly, spreadmarts are used mostly to handle budgeting, planning, and forecasting functions, followed by financial and operational reporting and finally financial, customer, and product analysis. (See Figure 4.)
What business processes utilize spreadmarts in your group?
Figure 4. Spreadmarts are used mostly to handle budgeting, planning, and forecasting functions.
The Rationale for Spreadmarts Local Control. There are many reasons why organizations proliferate spreadmarts. Survey respondents ranked the desire for a “high degree of local autonomy or control over the data and reporting” as the top motivator of spreadmarts. (See Figure 5.) Business users simply want to represent the business in reports the way they see it at the local level; they do not want to be forced to map their business practices into metrics and processes that don’t conform to the way their business actually works.
RANK 1
RANK 2
RANK 3
RANK 4
RANK 5
What is the top driver of spreadmarts? The desire for local control over data and reports.

10 TDWI research
stratEgIEs for ManagIng sprE adMarts
Rank the top five reasons why spreadmarts exist in your group.
Figure 5. There are many reasons why organizations proliferate spreadmarts.
A Quick Fix. The next highest driver of spreadmarts is a “quick fix to integrating data.” This shows that users often create spreadmarts because no system is capable of pulling together data to perform an analysis. It also suggests that users understand that their spreadmarts are a stopgap measure before a more formal solution can be implemented. For example, a director of data resource management at an energy utility said, “A new analyst in our procurement department has put together a very sophisticated spreadmart to track contract renewals. As soon as we can assign resources, we plan to migrate this application to our enterprise architecture.”
Lack of Agility. The third most prevalent driver of spreadmarts is the “inability of the BI team to move quickly.” Spreadmarts often fill a gap in the services provided by the BI team or IT departments. Business people may not want to get the information this way, but they don’t see any alternative. Of course, business analysts may not want to invest the time to learn a new BI tool or data warehousing environment when they are already familiar with Excel or Access and can work much more quickly and effectively in those environments.
Low Cost. Another top reason for spreadmarts is their low cost. Excel comes bundled with most corporate desktops. Besides its reporting and analysis capabilities, Excel can import data from a variety of files and query remote databases. Users can then insert logic into Excel in the form of macros to automate various calculations and formatting tasks. You don’t have to be an IT professional trained in database management and SQL to create a sophisticated report in Excel. While Excel is the most popular tool for building spreadmarts, business analysts also use Microsoft Access, PowerPoint, and SAS statistical tools. (See Figure 6.)
RANK 1
RANK 2
RANK 3
RANK 4
RANK 5
Spreadmarts often fill a gap in the services provided by the BI team.

www.tdwi.org 11
The Evolution of Spreadmarts
Tools for Building Spreadmarts
Figure 6. Percentage of respondents who selected “always” when asked to describe the frequency with which they use each of the above tools to build spreadmarts. Percentages do not equal 100 because users could select “always,” “usually,” “sometimes,” “seldom,” or “never.”
Habits. Another top driver of spreadmarts is habit: “That’s the way it’s always been done.” Habits die hard, especially when it comes to the way people gather and use information and make decisions. If they’ve used Excel effectively to make decisions, why should they change? Conversely, sometimes there is no other option. For example, small and midsize (SMB) businesses have historically relied on spreadmarts primarily due to cost and resource constraints. Spreadmarts represent business people making do with what they have.
Interestingly, turf control—or the ability to spin numbers in one’s favor to upper management—ranked only in the middle of the pack. While spreadmarts do provide exceptionally good cover for middle managers who want to protect their positions and reputations, it appears that control, expediency, and cost are greater factors.
It’s also interesting that the lack of suitable analysis and reporting tools ranks further down the list. Most organizations have deployed other tools besides Excel and Access, but spreadmart users are not interested in using them. In fact, a quarter of all respondents (26%) said that their organizations have “set standards for BI tools and enforced them.” (See Table 1.) So, even in the most draconian of corporate environments, users still find cause to use spreadmarts. As we’ve seen, some of these may be interim solutions, but many undoubtedly mirror the BI systems already deployed.
To what degree has your group standardized on a set of BI tools?
Median # of Spreadmarts
High—We’ve set standards and enforced usage. 26% 22
Moderate—We’ve set standards but many non-standard BI tools are being used.
48% 30
Low—We have yet to standardize or enforce usage. 26% 17 .5
Table 1. Users always find cause to use spreadmarts, even when BI tools are standardized and usage is enforced.
Standardization. Those organizations that have a “high” degree of BI standardization still have a median of 22 spreadmarts, only slightly fewer than the 30 spreadmarts in organizations with a “moderate” degree of standardization. Interestingly, fully half (50%) of organizations with a moderate degree of standardization admit to not counting their spreadmarts, while among organizations with high standardization, only 19% have not counted their spreadmarts. This is a significant difference. Ironically, organizations with a “low” degree of standardization have the lowest median number of spreadmarts (17.5), and only 31% haven’t counted them. The proper
BI standardization not only reduces the number of spreadmarts, but also increases awareness of them.
12 TDWI research
stratEgIEs for ManagIng sprE adMarts
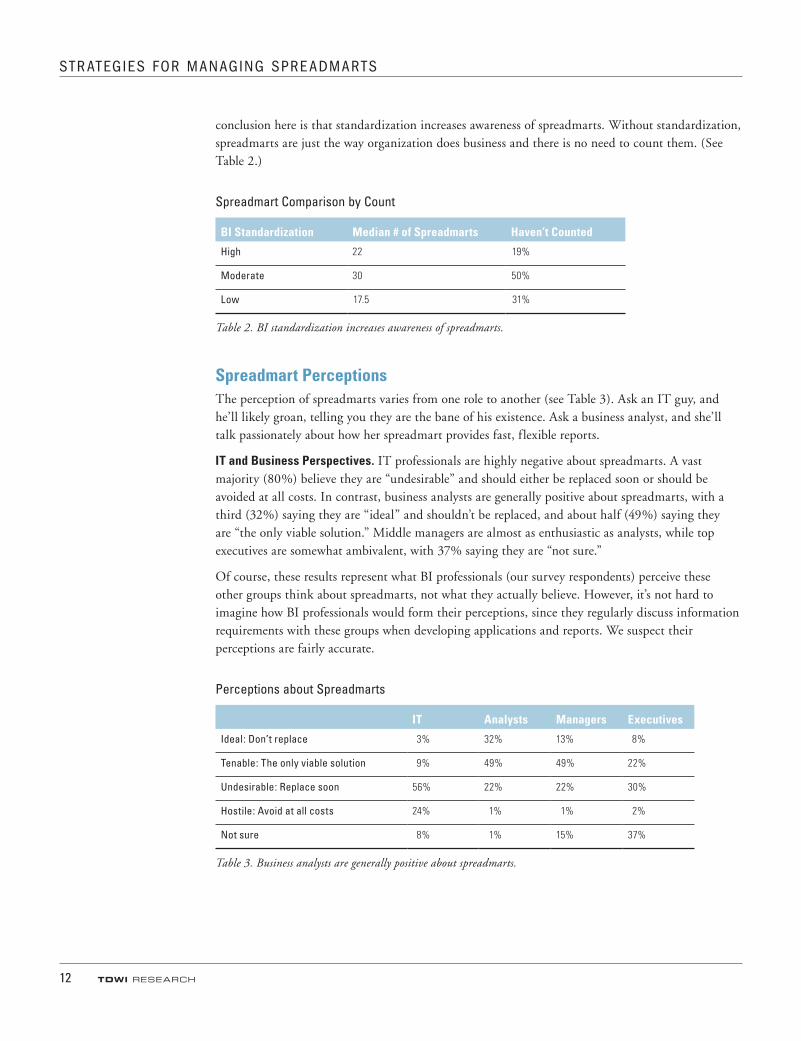
conclusion here is that standardization increases awareness of spreadmarts. Without standardization, spreadmarts are just the way organization does business and there is no need to count them. (See Table 2.)
Spreadmart Comparison by Count
BI Standardization Median # of Spreadmarts Haven’t Counted
High 22 19%
Moderate 30 50%
Low 17 .5 31%
Table 2. BI standardization increases awareness of spreadmarts.
Spreadmart Perceptions The perception of spreadmarts varies from one role to another (see Table 3). Ask an IT guy, and he’ll likely groan, telling you they are the bane of his existence. Ask a business analyst, and she’ll talk passionately about how her spreadmart provides fast, flexible reports.
IT and Business Perspectives. IT professionals are highly negative about spreadmarts. A vast majority (80%) believe they are “undesirable” and should either be replaced soon or should be avoided at all costs. In contrast, business analysts are generally positive about spreadmarts, with a third (32%) saying they are “ideal” and shouldn’t be replaced, and about half (49%) saying they are “the only viable solution.” Middle managers are almost as enthusiastic as analysts, while top executives are somewhat ambivalent, with 37% saying they are “not sure.”
Of course, these results represent what BI professionals (our survey respondents) perceive these other groups think about spreadmarts, not what they actually believe. However, it’s not hard to imagine how BI professionals would form their perceptions, since they regularly discuss information requirements with these groups when developing applications and reports. We suspect their perceptions are fairly accurate.
Perceptions about Spreadmarts
IT Analysts Managers Executives
Ideal: Don’t replace 3% 32% 13% 8%
Tenable: The only viable solution 9% 49% 49% 22%
Undesirable: Replace soon 56% 22% 22% 30%
Hostile: Avoid at all costs 24% 1% 1% 2%
Not sure 8% 1% 15% 37%
Table 3. Business analysts are generally positive about spreadmarts.
www.tdwi.org 13
Spreadmarts’ Benefits and Liabilities
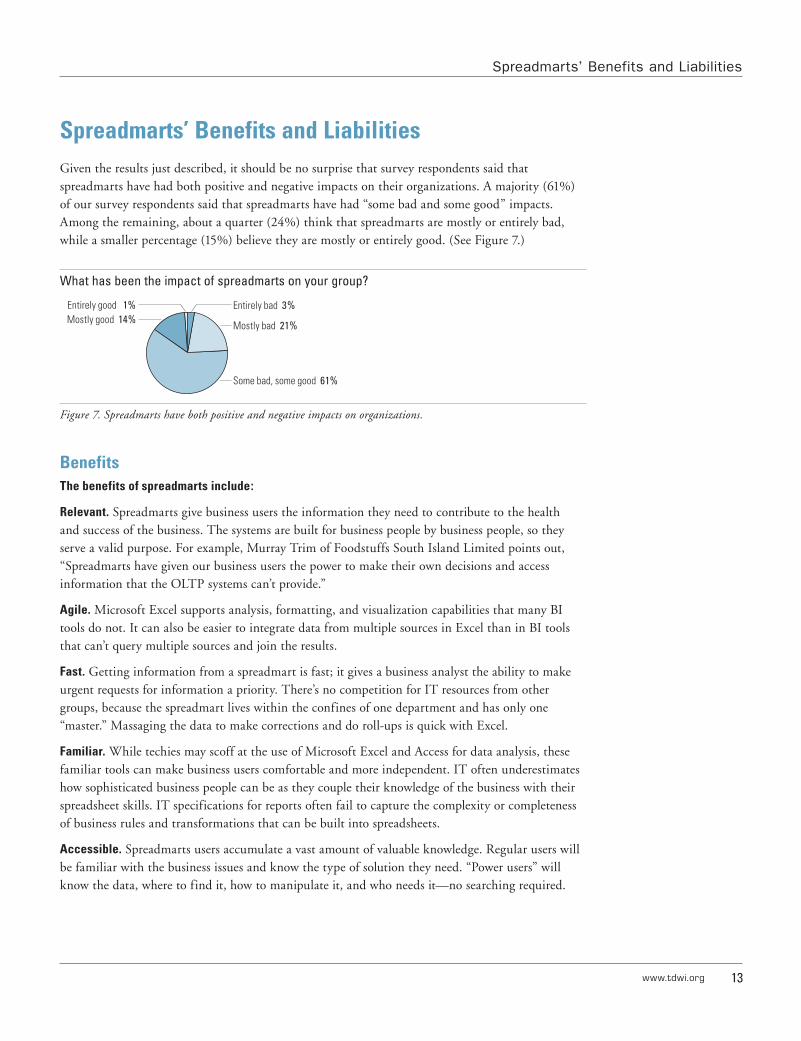
Spreadmarts’ Benefits and LiabilitiesGiven the results just described, it should be no surprise that survey respondents said that spreadmarts have had both positive and negative impacts on their organizations. A majority (61%) of our survey respondents said that spreadmarts have had “some bad and some good” impacts. Among the remaining, about a quarter (24%) think that spreadmarts are mostly or entirely bad, while a smaller percentage (15%) believe they are mostly or entirely good. (See Figure 7.)
What has been the impact of spreadmarts on your group?
Figure 7. Spreadmarts have both positive and negative impacts on organizations.
BenefitsThe benefits of spreadmarts include:
Relevant. Spreadmarts give business users the information they need to contribute to the health and success of the business. The systems are built for business people by business people, so they serve a valid purpose. For example, Murray Trim of Foodstuffs South Island Limited points out, “Spreadmarts have given our business users the power to make their own decisions and access information that the OLTP systems can’t provide.”
Agile. Microsoft Excel supports analysis, formatting, and visualization capabilities that many BI tools do not. It can also be easier to integrate data from multiple sources in Excel than in BI tools that can’t query multiple sources and join the results.
Fast. Getting information from a spreadmart is fast; it gives a business analyst the ability to make urgent requests for information a priority. There’s no competition for IT resources from other groups, because the spreadmart lives within the confines of one department and has only one “master.” Massaging the data to make corrections and do roll-ups is quick with Excel.
Familiar. While techies may scoff at the use of Microsoft Excel and Access for data analysis, these familiar tools can make business users comfortable and more independent. IT often underestimates how sophisticated business people can be as they couple their knowledge of the business with their spreadsheet skills. IT specifications for reports often fail to capture the complexity or completeness of business rules and transformations that can be built into spreadsheets.
Accessible. Spreadmarts users accumulate a vast amount of valuable knowledge. Regular users will be familiar with the business issues and know the type of solution they need. “Power users” will know the data, where to find it, how to manipulate it, and who needs it—no searching required.
14 TDWI research
stratEgIEs for ManagIng sprE adMarts
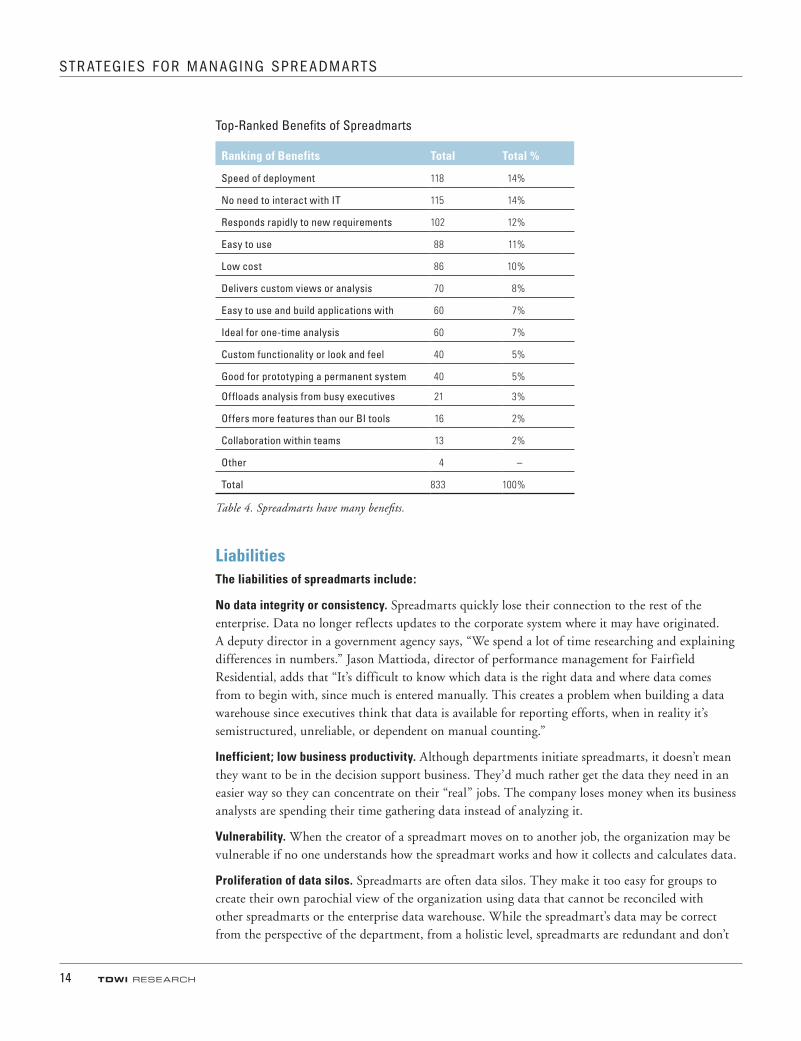
Top-Ranked Benefits of Spreadmarts
Ranking of Benefits Total Total %
Speed of deployment 118 14%
No need to interact with IT 115 14%
Responds rapidly to new requirements 102 12%
Easy to use 88 11%
Low cost 86 10%
Delivers custom views or analysis 70 8%
Easy to use and build applications with 60 7%
Ideal for one-time analysis 60 7%
Custom functionality or look and feel 40 5%
Good for prototyping a permanent system 40 5%
Offloads analysis from busy executives 21 3%
Offers more features than our BI tools 16 2%
Collaboration within teams 13 2%
Other 4 –
Total 833 100%
Table 4. Spreadmarts have many benefits.
Liabilities The liabilities of spreadmarts include:
No data integrity or consistency. Spreadmarts quickly lose their connection to the rest of the enterprise. Data no longer reflects updates to the corporate system where it may have originated. A deputy director in a government agency says, “We spend a lot of time researching and explaining differences in numbers.” Jason Mattioda, director of performance management for Fairfield Residential, adds that “It’s difficult to know which data is the right data and where data comes from to begin with, since much is entered manually. This creates a problem when building a data warehouse since executives think that data is available for reporting efforts, when in reality it’s semistructured, unreliable, or dependent on manual counting.”
Inefficient; low business productivity. Although departments initiate spreadmarts, it doesn’t mean they want to be in the decision support business. They’d much rather get the data they need in an easier way so they can concentrate on their “real” jobs. The company loses money when its business analysts are spending their time gathering data instead of analyzing it.
Vulnerability. When the creator of a spreadmart moves on to another job, the organization may be vulnerable if no one understands how the spreadmart works and how it collects and calculates data.
Proliferation of data silos. Spreadmarts are often data silos. They make it too easy for groups to create their own parochial view of the organization using data that cannot be reconciled with other spreadmarts or the enterprise data warehouse. While the spreadmart’s data may be correct from the perspective of the department, from a holistic level, spreadmarts are redundant and don’t

www.tdwi.org 15
Spreadmarts’ Benefits and Liabilities
adhere to standards. Alan Atkinson, IT manager, marketing and integration systems of Constellation Brands, says: “As a business we are creating disparate, siloed data sources that fall outside the control of an information management organization. Validation and audit functionality is missing, authentication is severely limited, and standard best practices around data backup and security access are compromised.”
Inability to audit or trace data. When you’re working with critical business data, you need to know where it came from—its source systems, what systems processed it, how it was manipulated, and how it was changed. Says one VP IT senior audit manager, “From an internal audit perspective, spreadmarts create significant exposure for an organization that relies on them for financial reporting.”
No scalability. Spreadmarts are limited by how large and complicated a one-dimensional spreadsheet can grow. Attempting to grow through linked formula and Visual Basic for Applications just leads to overly complex spreadsheet models. Unless you want to add more spreadmarts—and more silos—your growth is stymied.
Uninform decision making. Costly mistakes arise from decisions that are based on poor data. A deputy director told us about his experience: “The creator of a spreadmart made an incorrect assumption about the average amount of each transaction based on personal past experience. Since funding requests were based on the flawed assumption, the department ran out of funding. It endured significant political fallout from having to rush through an emergency funding increase.”
Too easy to use. Because Excel is so easy to use, it’s also easy to build unmanageable reports with complex formulas and links. Finding the balance between using a familiar tool—Excel—and a more powerful BI tool is not always easy.
The Top-Ranked Liabilities of Spreadmarts
Ranking of Liabilities Total Total %
Creates redundant systems, duplicate data 143 16%
Lack of reliability, availability, or scalability 120 14%
No audit trail to validate data or key decisions 109 12%
Introduces data errors or transformation logic 101 11%
Decisions made on incorrect data 93 10%
Wastes time of high-paid analysts 67 8%
Lack of repeatable report designs 64 7%
Creates security and privacy concerns 63 7%
Reduces the value of BI/DW investments 52 6%
Security or compliance issues 47 5%
Used to protect turf or “spin” results 32 4%
Other 2 –
Totals 893 100%
Table 5. Spreadmarts have many liabilities.

16 TDWI research
stratEgIEs for ManagIng sprE adMarts
Costs. While analysts often justify the use of spreadmarts because they don’t need to purchase a BI tool or hire a consultant to build them, there are many hidden costs. The biggest cost is the time it takes business analysts to create spreadmarts. Rather than analyzing data and making recommendations, analysts can spend an inordinate amount of time simply collecting, massaging, and formatting data. These are tasks that IT can and should be doing, allowing highly paid analysts to focus on what they were hired to do: analyze data and offer insights to the organization.
Our research shows that, on average, analysts spend 2.5 days per week creating and maintaining spreadmarts. (The median number is two days per week.) Thus, almost half of an analyst’s week is spent doing non-value-added activities that in many cases could be done by IT.
We also asked our respondents to estimate the average salary of their analysts, which they pegged at $69,000 on average ($65,000 median). As mentioned earlier, the median number of spreadmarts per organization is 30, according to the respondents. Doing the math using median numbers, organizations spend $780,000 a year in analyst wages to create and maintain spreadmarts ($65,000 x 2/5 x 30). That is more than it costs to build one data mart, according to TDWI Research.1 If we used averages instead of median numbers, the figure would be significantly higher. Remember, most organizations don’t count the number of spreadmarts they have, and we think those that do cite low numbers.
Architectural Approaches to SpreadmartsRecognizing that you have a spreadmart problem is the first step. Most of the people we surveyed know their organizations have spreadmarts, but they don’t know what to do about them.
The survey presented respondents with nine different approaches to addressing the spreadmart issue. (See Table 6.)
What strategies have you employed to remedy the problems caused by spreadmarts, and how effective were they?
Employed? VE? NVE?
We leave them alone 71% 9% 58%
Provide a more robust BI/DW solution 63% 24% 21%
Create a set of standard reports for decision making 58% 18% 22%
Provide BI tools that tightly integrate with Excel/Office 53% 29% 21%
Stop providing IT support for spreadmarts 41% 6% 55%
Show executives how spreadmarts undermine compliance 34% 16% 40%
Create policies for the proper use of spreadsheets 18% 13% 50%
Let IT manage the spreadmart centrally 13% 13% 63%
Have executives issue a mandate against spreadmarts 13% 6% 64%
Table 6. VE = very effective; NVE = not very effective. Respondents could select more than one response.
Analysts spend two days per week creating and maintaining spreadmarts, costing organizations $780,000 a year.
1. See Wayne Eckerson, In Search of a Single Version of Truth: Strategies for Consolidating Analytic Silos, TDWI Research report, 2004.

www.tdwi.org 17
Architectural Approaches to Spreadmarts
Ironically, the most common approach that organizations use is simply to leave the spreadmarts alone. But as with everything else in life, ignoring a problem does not make it go away, and often makes it worse. When asked how effective this approach was, a majority (58%) said “not very effective.”
Replace with BI Tools. The next most popular approach is to “provide a more robust BI/DW solution,” employed by almost two-thirds of respondents (63%). This approach was considered “very effective” by 24% of respondents. BI software has progressed from best-in-class niche products to BI platforms that provide integrated reporting, analysis, visualization, and dashboarding capabilities within a single, integrated architecture. In addition, many BI vendors now offer planning, budgeting, and consolidation applications to supplement their BI offerings.
We recommend caution with these BI replacement approaches. First, don’t assume that business users will find the BI tools easy to use. Second, don’t assume that business users will see the benefit of these systems if their spreadmarts are answering their business questions today. Get business users (not just power users) involved in the selection and implementation of BI tools, provide ongoing training, and market the benefits. “If it ain’t broke, don’t fix it”—if the business users are not committed to using the BI tools, walk away from the project and look for other spreadmarts the business perceives as a problem.
Create a Standard Set Of Reports. Almost as many companies (58%) assumed that creating a standard set of reports using their standard BI tools would eliminate the need for spreadmarts as those that implemented new BI tools (63%). Organizations assumed that these reports would become their systems of record for decision making. Only 18% found this approach very effective. The most likely reasons for the shortcoming were, first, that no set of reports will effectively cover every management decision, so there was a gap in what was provided. Second, since this approach burdened IT with a queue of reports to develop, the business faced two of the primary reasons spreadmarts were created initially: the IT group did not understand what the business needed, and the IT group was not responsive to business needs.
Excel Integration. The only approach respondents rated more effective than adopting BI tools was “providing BI tools that integrate with Excel/Office” (29%). For a spreadmart user, the next best thing to Excel is Excel that integrates with the corporate BI standard. This approach was used by slightly more than half of the respondents (53%). However, Office integration technology can also provide users more fuel to proliferate spreadmarts if it enables users to save data locally and disseminate the results to users. Some BI vendors—and ironically, Microsoft is one of them—now provide a thin-client Excel solution where administrators can deny users the ability to download or manipulate data. (See the section “Segmenting Office Integration Technology” on page 20.)
Some experts claim that power users use BI tools mainly as a personalized extract tool to dump data into Excel, where they perform their real work. According to our survey, that’s not the case. Only a small percentage (7%) of spreadmarts obtain data this way. More than half of spreadmarts (51%) use manual data entry or manual data import. (See Figure 8.) It follows that a major way to drain the life out of spreadmarts is to begin collecting the data they use in a data warehouse and create standard reports that run against that data. Of course, if there are no operational systems capturing this data, then a spreadmart is the only alternative.

18 TDWI research
stratEgIEs for ManagIng sprE adMarts
What is the predominant way that that data is entered into your group’s spreadmarts?
Figure 8. More than half of spreadmarts use manual data entry or manual data import.
Dictatorships Don’t Work. It is not surprising that the two least successful approaches to addressing spreadmarts are for either business executives or for IT to use strong-arm tactics to try to eliminate spreadmarts. Each approach was very effective only 6% of the time. This is actually even less effective than leaving the spreadmarts alone. The problem is that most executive mandates are hollow, according to off-the-record comments to the effect that executives talk the talk but don’t walk the walk. As soon as executives issue the no-spreadmart mandate, they then send analysts scurrying on a data fire drill that requires spreadmarts. The second heavy-handed approach is to have IT stop providing support for spreadmarts, but since the business builds and maintains the spreadmarts, this only inflames the problem and causes the business to create even more spreadmarts! The other end of the dictatorship spectrum is for IT to take over managing spreadmarts centrally. This is very effective only 13% of the time, but fortunately, is not tried very often.
Sometimes dictatorships do work. Reassigning the creators of spreadmarts to other activities is certainly effective, if an executive has the clout to carry this out and offers a suitable BI/DW replacement system. For example, the director of operations at a major national bank reassigned 58 people who were creating ad hoc performance reports with a set of standard reports created using a standard BI platform, saving $300 million a year and dramatically improving the bank’s quality and efficiency in industry benchmarks. This may be the dream of those who are hostile to spreadmarts, but the survey illustrates that this is a rare occurrence.
Gentler approaches are not very effective, either. New policies for the proper use of spreadsheets generally fall on deaf ears; they are very effective only 12% of the time. The problem isn’t that business people do not know how to use the spreadsheets, but that they think they have no alternative.
Multiple Solutions. Given the low percentage of respondents who can vouch for the effectiveness of any of the approaches listed in Figure 14, it’s not surprising that managing the proliferation of spreadmarts is such a difficult task. It is more of a change management issue than a technological one. While it’s important to bring new technologies to bear, such as BI tools that integrate with Excel, it’s critical to figure out which levers to push and pull to change people’s habits and perceptions. No single approach is effective on its own; therefore, organizations must apply multiple approaches.
Not All Spreadmarts Are AlikeToo often, business executives or IT groups treat spreadmarts as an evil plague, but as our survey shows, spreadmarts have both benefits and liabilities. Rather than taking the stance that all spreadmarts should be eliminated or replaced, a more constructive approach is to examine each

www.tdwi.org 19
Architectural Approaches to Spreadmarts
spreadmart and determine whether it is appropriate for its task. There are three main types of spreadmarts:
• One-offreports. Business people use spreadsheets to filter and transform data, create graphs, and format them into reports that they present to their management, customers, suppliers, or partners. With this type of spreadmart, people are using data they already have and the power of Excel to present it. There’s no business justification—or even time—for IT to get involved.
• Adhocanalysis. Business analysts create spreadmarts to perform exploratory, ad hoc analysis for which they don’t have a standard report. For instance, they may want to explore how new business conditions might affect product sales or perform what-if scenarios for potential business changes. They use the spreadmart to probe around, not even sure what they’re looking for, and they often bring in supplemental data that may not be available in the data warehouse. This exploration can also be time-sensitive and urgent.
• Businesssystems. Most spreadmarts start out as one-off reports or ad hoc analysis, then morph into full-fledged business systems to support ongoing processes like budgeting, planning, and forecasting. It’s usually not the goal to create such a system, but after a power user creates the first one, she’s asked by the business to keep producing the report until, eventually, it becomes an application itself. This type of spreadmart is called a “data shadow system.”
One-off reports and ad hoc reports may be done best by business people using spreadmarts. Maybe power users and IT could create these reports using BI tools, but if the business users are getting what they want, then it’s best to leave these spreadmarts alone. On the other hand, data shadow systems are really business applications that are begging to be renovated or replaced.
Renovating SpreadmartsThe key to renovating a spreadmart is to split it into its data integration and analytical processes, and then work to understand each. This requires reverse-engineering spreadsheets’ macros/links, Access database queries, SAS code, and any other processes used to integrate or analyze data.
The most significant liability of spreadmarts is data inconsistency and data quality. As our study reveals, more than half of the data used by spreadmarts is input manually or imported. Only 10% use ETL processes. Once you understand the complete data integration process, you can determine how best to renovate it. For instance, the IT group may decide to use an enterprise information integration (EII) tool to support a spreadmart that pulls small to moderate amounts of data from several sources with moderate transformation. However, a more complex data environment may warrant implementing an ETL tool to populate the spreadmart. Or, the IT team may decide to use a lighter-weight approach, using less expensive extract, load, and transform (ELT) tools, which often come bundled into database management systems and cost less than ETL tools (but may have less functionality).
On the analytical side, IT should first examine its standard BI software suite to determine if it can meet business needs. A mix of existing BI tools and Excel offers a quick fix to renovating the spreadmart front-end. Other options, though, that may better match business requirements with a potentially lower total cost of ownership include corporate performance management (CPM) toolkits, BI/DW appliances, Excel-based OLAP, or on-demand (or software-as-a-service [SaaS]) BI
The key to renovating a spreadmart is to reverse-engineeritsdataintegration and analytical processes.
20 TDWI research
applications. The analytic portion of the renovated spreadmart is what the business directly uses. Any BI application that you build or buy has to balance business/IT priorities, processes, and standards.
For many companies that have successfully renovated their spreadmarts, it has taken a couple of attempts to satisfy business needs. Often these companies use a replacement strategy with an application or tool that they feel the business will readily embrace. This approach usually gets a lukewarm reception. Enlightened enterprises then take the next step of truly reengineering the solution, separating data integration and business intelligence processes.
For example, three companies, in the diverse industries of retail, healthcare, and publishing, initially tried to replace their budgeting, planning, or forecasting spreadmarts with CPM solutions. All encountered low business acceptance because the CPM applications they purchased did not match the methods and processes the business was using with the spreadmarts. It did not matter how terrific the new tools were; the data and business logic in the new systems did not match their business processes. All three of these companies went back to the drawing board and reverse-engineered the spreadmarts they were trying to replace. Once IT understood what the spreadmarts did from a data and business perspective, they were able to create the appropriate data integration processes to get the right data and customize the BI applications to use the right business rules. Business acceptance and usage soared with the renovated systems.
In other cases, enterprises that have renovated spreadmarts have relied on a combination of Office integration for the BI front-end and new ETL tools for the back-end data integration. For example, an insurance company and healthcare provider both used spreadmarts to perform national account management analysis and reviews with their business customers. Both companies employed dozens of spreadsheets and Access databases to gather, transform, and analyze account data. They presented and reviewed this data with their customers. Although the account reviews were of great business value to their customers, these companies were able to perform only a limited number of reviews annually because they took too long and were error-prone. The reviews required a lot of manual reconciliation, further increasing the time required. Both companies reverse-engineered their spreadmarts and then renovated them by developing the appropriate data integration and BI components.
Segmenting Office Integration Technology When vendors first began selling business intelligence tools back in the 1990s, most assumed that their desktop tools would become the reporting and analysis component within an “extended” Microsoft Office suite. While some customers did conform to expectations, most continued to use Microsoft Office, especially Excel, to support their reporting and analysis needs. In fact, most BI vendors have recognized that a large portion of customers are using their BI tools simply to extract data from corporate servers and dump them into Excel, Word, or PowerPoint, where they perform their “real work.”
Starting in the early 2000s, BI vendors decided to embrace Microsoft Office instead of resisting it. They added one-button exports to simplify the process of dumping raw data from queries or reports into Microsoft Office applications, especially Excel. They then created add-ins that made it possible for users to view, interact, and refresh BI reports from within Excel, PowerPoint, Word, or Outlook.
Renovation often works better than replacement.
stratEgIEs for ManagIng sprE adMarts

www.tdwi.org 21
Segmenting Office Integration Technology
To appeal to power users, they also turned Excel into a full-fledged client of OLAP and relational databases, using the BI server as a query and metadata engine.
The quadrant chart below shows the range of technologies available today for integrating Microsoft Office and BI tools. (See Figure 9.) The chart shows which technologies are appropriate for casual users—those who generally consume reports created by others—and which are appropriate for power users—those who produce reports and analyses. It also segments the technologies by the degree to which they support a managed BI environment, where data and rules are managed centrally rather than on the desktop. A managed BI environment minimizes the potential for users to create spreadmarts and wreak havoc on data consistency.
Range of Office Integration Technologies
Figure 9. A managed BI environment minimizes the potential for users to create spreadmarts and wreak havoc on data consistency.
Let’s outline each approach in the chart above for integrating BI and Microsoft Office. We’ll illustrate each approach, where appropriate, with examples of products offered by our report sponsors.
1. Manual Data Entry. Traditionally, users key data into Excel or other Office applications, where it can be manipulated and displayed. Obviously, hand-keying data can create errors and consumes a considerable amount of time. While manual data entry sounds like a primitive way to populate Office applications with data, many companies still rely on this approach and, as a result, are vulnerable to violating new compliance and disclosure regulations and making decisions on inaccurate data. Unfortunately, most budgets, plans, and scorecards are maintained in spreadsheets that are manually updated by end users.
2. Import/Export. Most BI tools enable users to export report data into a CSV file, which users can then import into Excel or other Office documents. This approach takes multiple steps and requires users to reformat and save the data in the native Office file format. Today, most BI tools let users export the raw data from a report directly into Excel, streamlining the process and saving time.
Server-drivenManaged BI environment
Casual users
Power users
Desktop-drivenSpreadmart-vulnerable
Manual data entry
Import/ export
ODBC/OLE DB access
Browser access to live reports
Office add-in to live reports
Excel add-in to BI servers

22 TDWI research
stratEgIEs for ManagIng sprE adMarts
These exports can be executed on demand or scheduled. On the other end, Excel and other Office applications enable users to import data directly from various file and database formats, including Access, XML, Web, Visio, and so on.
3. ODBC/OLE DB Access. Power users can leverage native Excel query features to query external databases such as Access, Excel, Visio, dBase, and other relational and OLAP databases as long as the user has the appropriate drivers installed and connection strings defined. Obviously, this provides greater flexibility for the users to get exactly the data they want from nearly any data source, but it also requires technical expertise to navigate those sources directly in their native formats across a network.
4. Browser Access to Live Reports. This option gives users access to live, spreadsheet-based reports via a Web browser. Organizations then have ultimate control over the data exposed to users via spreadsheets, since the data, application logic, and security permissions are maintained on the server. This option provides a highly managed BI environment, but circumscribes the Office functionality users can apply to report data.
In this approach, the report author creates the spreadsheet report on a desktop and publishes it to the server, where authorized users can view it within a browser using dynamic HTML (DHTML). The author specifies who can view the report and what they can do with it (view, refresh, interact, e-mail, save, or republish). Authors can even restrict access to individual parts of the report, such as worksheets, rows, and columns, based on user profiles.
Microsoft’s new Excel Services, which is part of Microsoft Office SharePoint Server 2007, takes this approach. Microsoft introduced thin-client Excel to enable organizations to prevent the proliferation of spreadmarts. This approach enables users to consume data in a familiar Excel interface and share spreadsheets without ever saving a spreadsheet to a local desktop. With permission, individuals can alter or snapshot the spreadsheet and e-mail it to others who are authorized to view the spreadsheet and data. The recipients can open the spreadsheet and continue to interact with it in its latest form with the latest data.
SAP’s Business Explorer (BEx) Web Analyzer product gives users browser-based access to Excel-like reports created in BEx desktop, which is an Excel add-in for accessing data via the SAP NetWeaver BI server. Web users can save reports to their desktop and view them using SAP’s BEx Excel add-in.
5.OfficeAdd-intoLiveReports. Rather than providing highly controlled, thin-client access to predefined reports, this approach lets users access the report directly within an Office application, giving them access to the complete functionality offered by Excel, Word, PowerPoint, or Outlook. This type of add-in, which requires a client-side install, is designed for casual users who want to automate the importation of existing reports into an Office application.
From within an Office application of their choice (i.e., Excel, PowerPoint, Word, or Outlook), users can select which BI report or part of a BI report they want to import and click a button to create the report. They can also schedule report creation on a regular basis. The add-in maintains a “live” link to the report on the server, so that users can refresh the report and get the most up-to-date data. The add-in also maintains security profiles so that users can see only the report or component parts they are authorized to view.
Most leading BI vendors now support these types of Office add-ins to live reports, but each offers a slightly different set of features and functionality. For example, MicroStrategy released

www.tdwi.org 23
Segmenting Office Integration Technology
MicroStrategy Office in 2004, which transforms MicroStrategy reports into formatted documents within Excel, Word, or PowerPoint. The product, which is priced separately, is designed to automate the creation of scheduled reports that are tailored to each individual or role. Cognos Go! Office works much the same way, but is bundled into the Cognos 8 BI platform. It also lets users import individual report elements—such as charts or tables—instead of the entire report. In addition, SAP and Microsoft have teamed up to create Duet, which enables Office users to access and analyze data contained in SAP enterprise applications.
Actuate Corporation’s e.Spreadsheet takes a slightly different tack that leverages Actuate’s heritage as a production reporting vendor. Rather than providing access to existing BI reports, Actuate e.Spreadsheet creates new, high-volume reports exclusively for delivery in Excel. Report authors use the Actuate e.Spreadsheet Designer to create parameterized, spreadsheet-based reports that are maintained on the server. Users log in to the server, click on a link, and receive a report tailored to their roles and permissions.
6.ExcelAdd-intoBIServers. This final approach provides users with the greatest degree of flexibility while still managing data and logic centrally. Here, power users employ Excel as a front end to a BI server that generates queries against back-end data sources, maintains metadata, and delivers query results to Excel for rendering. Products in this segment walk a tightrope: they must balance the need to manage data and logic centrally without compromising the full-fledged Excel functionality demanded by power users. As you can imagine, most BI vendors are eager to offer this type of functionality.
For example, XLCubed was founded five years ago to balance the twin requirements for Excel functionality and centralized data management, and it sets the bar high. It preserves all Excel cells as query formulas on its server so that users can move, add, change, and reformat cells without breaking connections to the server or overwriting changes when data is refreshed. XLCubed currently runs against Microsoft Analysis Services and Applix TM1, and is embedding cell-based visualization technology to make it easier for Excel users to identify trends in dense tables. [Note: Applix TM1 was rebranded Cognos TM1 in late 2007. Cognos has since been acquired by IBM.]
Cognos shipped Cognos 8 BI Analysis for Excel in September 2007, turning Excel into a client of the Cognos 8 BI platform, which manages queries against both multidimensional and dimensionally modeled relational data sources, a unique feature among rich-client add-ins. Excel users can explore data using formula-based queries so they can create flexible and reusable worksheets. Cognos recommends Cognos 8 BI Analysis for Excel for advanced business analysts, and its Query and Analysis Studios for all others who need to explore and analyze data.
Like Cognos, Microsoft Excel 2007 can access a variety of data sources, although it bypasses a BI server and runs directly against the source systems using the appropriate drivers and connection string. Excel 2007 incorporates many new visualization and ease-of-use features for analyzing data, and it offers tighter integration with Microsoft Analysis Services. For example, Excel 2007 exposes detailed member properties in Analysis Services when users hover their mouse over a member within SQL Server’s Unified Dimensional Model. Users also are no longer required to use pivot tables to access Analysis Services; they can type in their own formulas, add new columns, and refresh the dataset without losing their additions.
In addition, SAP’s Business Explorer (BEx) tool is an Excel add-in that lets users issue queries against SAP’s NetWeaver BI, manipulate the results, and save the report back to the server. BEx

24 TDWI research
stratEgIEs for ManagIng sprE adMarts
runs against OLAP data sources using OLE DB and MDX queries. With NetWeaver 2007, which SAP released in June 2007, BEx lets Excel users convert each cell in a table to a query formula on the server that retains metadata about the cell. Users can then change the report—add or move columns, apply new calculations, and reformat layouts—and refresh the original report without overwriting the revisions.
Finally, Pentaho Spreadsheet Services, from open source BI vendor Pentaho, provide a rich Excel add-in to the Pentaho Analysis Services server, which is the Mondrian open source OLAP database. Pentaho Spreadsheet Services use Excel PivotTable Services to access Mondrian via the OLE DB API.
Services. Microsoft’s intent with Office 2007 is to make it a robust client platform for BI that works with its various server environments: SQL Server 2005 to house data and provide BI and data integration services; PerformancePoint to support planning, forecasting, scorecarding, and analytic services; and SharePoint Server 2007 to let users publish and collaborate on BI reports.
Integrating these numerous environments and ensuring adequate scalability and reliability often requires some outside expertise. One of the leading providers of Microsoft solutions is Unisys, a $5.7 billion IT services and solutions provider specializing in the public sector, financial services, transportation, and supply chain industries. Currently, Unisys has 2,000 Microsoft-trained delivery professionals worldwide and is a leading provider of Microsoft Office SharePoint Server consulting services. Mark Stanoch, a business development director on the Unisys Microsoft Alliance team, said that he expects Excel 2007 to be a key driver for sales of Unisys ES7000 servers. “Excel 2007 is driving server sales rather than desktop sales because of Microsoft’s new architecture and emphasis on managing reporting and analysis centrally.”
Questions to Ask about Microsoft Office Add-Ins When selecting or using a Microsoft Office add-in from a BI vendor, consider the following. Does the add-in:
•SupportallMicrosoftOfficeapplications,orjustExcel?DoesitprovideaconsistentexperienceacrossallOfficeapplications?Importpredefinedreportsorletusersquerysourcesystemsdirectly?
•TransferaquerywithinOfficetothevendor’sreportingoranalysistoolforfurtherexplorationorformatting?
•Requireaclient-sideinstall?DoesituseWebservicestodownloadsoftwareupgradesautomatically?
•Translatereportcharts,tables,formulas,andformatsintonativeOfficeformat?Orsimplydumprawdataortranslatechartsintoimages?
•Applyrole-basedsecuritytoOffice-basedreportsandmaintainsecuritywhenusersexchangethesereportswitheachotherviae-mail?
•Letusersmodifythereportbyaddingcolumns,calculations,andformats?Canusersrefreshtheirrevisedreportwithup-to-datedatawithoutoverwritingtheirchanges?
•ComebundledwithinaBIplatformorsuiteorpricedseparately?

www.tdwi.org 25
Recommendations
Recommendations Our survey showed that spreadmarts are found across all industries and all sizes of companies. You cannot “take ’em out back and shoot ’em,” nor can you ignore them. There is no silver bullet technology that magically eliminates the liabilities and costs of spreadmarts without hard work and cooperation within an enterprise. Here are a few recommendations for preserving the business value of spreadmarts while eliminating their liabilities and costs.
Align Business and ITThis should be a no-brainer, but too often business and IT talk at each other rather than with each other. The key ingredients to successful collaboration between business and IT:
• Communicateandconvince the business that spreadmarts need to be fixed. Unless your senior executives believe there is a problem with the proliferation of spreadmarts, you’ll never get the green light to do anything about them.
• Enlistbusinessexecutivesponsorship(funding)andcommitment(resources). Executives need to talk the talk and walk the walk, meaning that their staff has to be given the time to fix the problems and not recreate new spreadmarts every time there is a fire drill.
• Getthebusinessinvolved. Encourage them to explain what should go into their renovations and how to deploy their replacements.
Assess the State of Your SpreadmartsDetermine the size and scope of your spreadmarts before deciding what to do with them. Chances are good that there are more spreadmarts than you have the time, resources, or will to replace, so you need to set up a program for spreadmart renovation based on your prioritization.
The best practices to renovate spreadsheets are:
• Inventoryspreadmarts. IT needs to work with the business to inventory the spreadmarts, jointly assess their value, understand what business processes are supported, and identify the key components to renovate or replace.
• Listentowhatthespreadmartsaresaying. Spreadmarts were built for the business by business people, and as such, contain the transformation and rules needed by the business. IT needs to leverage the inherent business value of spreadmarts while replacing or renovating them to take advantage of better design techniques and more appropriate tools.
• Don’tboiltheocean. Not all spreadmarts are created equal, so don’t treat them equally. Here’s a general rule of thumb for figuring out what to do with various types of spreadmarts:
•Ifthere’slittlebusinessvalue,eliminate.
•Ifonlyafewbusinessusersmakeuseofit,thenleaveit;it’snotworththeeffort.
•Ifit’susedforone-offreportingoradhoc,exploratoryanalysis,leaveit.
•Ifthereissignificantbusinessvalueormanybusinessusers,thentargetthespreadmart for renovation or replacement.

26 TDWI research
stratEgIEs for ManagIng sprE adMarts
RequireGovernanceEstablishing governance processes with joint business and IT collaboration is essential to support your spreadmart renovation program.
DataGovernance. Establishing a data governance process is essential to reach agreement on the spreadmart renovation’s data definitions, transformations, and business rules. The business needs to drive this process and resolve conflicts.
SpreadmartGovernance. Set up a spreadmart governance process to manage the processes, policies, standards, organization, and technologies used for analytics while ensuring the availability, accessibility, quality, consistency, auditability, and security of data. It is a balancing act that both business and IT must perform.
Spreadmart RenovationAs our survey shows, there is no single technical approach that is very effective most of the time. To renovate most of your spreadmarts, you need to use a combination of alternatives—a combination that fits your business and technology circumstances. You also need a solution that fits the needs of the business, not a solution that asks the business to change to accommodate the solution.
Your approach needs to provide:
• Consistent,comprehensive,accurate,andtimelydata
• Flexibilitytoaugmentorsupplementdatathatisnotinyourdatawarehouse
• Minimalneedforbusinesspeopletogatherandintegratedataontheirown
• Anadaptablearchitecturethatenablesrapidapplicationdevelopment
• Easy-to-use,flexibletoolsforabusinessusertoreportonandanalyzedata(andremember,Microsoft Excel is going to be part of your BI portfolio)
• Abilitytopublishreports,allowsubscriptions,providealerts,andenableworkflows
• Increasedresponsivenessandunderstandingofbusinessneedsandprocesses
• Self-serving(asfarasisfeasible)reportingandanalytics,balancingresponsivenesstobusiness needs and data integrity
Use caution with your renovation program:
• Don’tthrowoutthebabywiththebathwater. Just because you are replacing or renovating a spreadmart doesn’t mean you need to get rid of Excel. Spreadsheets are not the problem; the problem is the way they are used. Many business people will choose Excel over even powerful BI tools, and IT needs to accommodate them.
• Getinfrontofthebusiness. The business often builds spreadmarts because they need to get a job done now. That happens even though almost all of our respondents have a standard BI tool and DW in place. Consequently, IT must adopt new, agile development approaches and create an adaptable architecture that meets business needs in a timely manner. This is a tall order, but it must be done; otherwise, spreadmarts will return with a vengeance.
www.tdwi.org 27
Conclusion
ConclusionSpreadsheets are here to stay. Business users have them, are familiar with them, and will use them to do their jobs for years to come. Memo to IT: Deal with it! But just because spreadsheets are here does not mean we have to succumb to the Wild West mentality. After all, a business needs consistent, correct, and timely data if it hopes to make the best decisions to grow and improve profitability. If business people are hunting and gathering data rather than analyzing it and making decisions, then the business will suffer. If every business meeting involves debating whose numbers are correct, then companies can never make intelligent, informed business decisions. Likewise, the business has to get data and make decisions now, and cannot afford to wait for the ultimate IT solution.
Our recommendations center on the key mandate that whatever solution you choose has to involve a pragmatic balancing of business and IT priorities that yields the greatest business value. The organizational and program best practices transcend whatever technologies you incorporate into your solutions.

Rese aRch co-sponsoR
MicroStrategy, a global leader in business intelligence technology, provides reporting, analysis, and monitoring software that enables leading organizations to make better business decisions every day. MicroStrategy empowers business users to make informed decisions by providing timely, relevant, and accurate answers to their business questions.
Designed to support the most demanding business intelligence applications, MicroStrategy is ideal for enterprise-wide BI standardization. Companies choose MicroStrategy for its advanced technical capabilities, sophisticated analytics, and superior data and user scalability. Leading companies and government organizations worldwide have chosen MicroStrategy as their enterprise business intelligence standard.
MicroStrategy is built from a single architectural foundation, making it the most integrated and efficient BI architecture available. With an intuitive Web interface, MicroStrategy enables business users to seamlessly access enterprise data for enhanced decision making. MicroStrategy engineers its software for reliability, scalability, security, and ease of administration.
Learn more about MicroStrategy at www.microstrategy.com.
www.microstrategy.com
1201 Monster Road SW
Suite 250
Renton, WA 98057
T 425.277.9126
F 425.687.2842
www.tdwi.org
TDWI Research provides research and advice for BI professionals
worldwide. TDWI Research focuses exclusively on BI/DW issues
and teams up with industry practitioners to deliver both broad
and deep understanding of the business and technical issues
surrounding the deployment of business intelligence and data
warehousing solutions. TDWI Research offers reports, commentary,
and inquiry services via a worldwide Membership program and
provides custom research, benchmarking, and strategic planning
services to user and vendor organizations.
TDWI research


