Water Power Technologies Office eere.energy.gov 1 Mike Reed, Program Lead September 23, 2013 U.S. Hydropower Market Report 2017 Update (April) Rocío Uría-Martínez Megan Johnson Patrick O’Connor Oak Ridge National Laboratory
Transcript
Water Power Technologies Office eere.energy.gov1
Mike Reed, Program Lead
September 23, 2013
U.S. Hydropower Market Report
2017 Update (April)
Rocío Uría-Martínez
Megan Johnson
Patrick O’Connor
Oak Ridge National Laboratory
Water Power Technologies Office eere.energy.gov2
Introduction
These slides provide updates to some of the key metrics included in the 2014 Hydropower Market Report, which was published in April 2015. The Hydropower Market Report aims to fill the existing gap regarding publicly available, comprehensive information on the U.S. hydropower fleet and the industry that supports it and develops new projects.
The updated content shown here covers the following topics:
• Installed capacity and generation trends
• Investment on rehabilitations and upgrades to existing hydropower fleet
• Dec 31, 2016 snapshots of the hydropower and pumped storage hydropower project development pipeline
• Hydraulic turbine import and export trends
The last year of data shown in each of the plots will be 2015 or 2016 depending on the calendar of data releases followed by the agencies and commercial providers used as sources.
This work has been funded by the Water Power Technologies Office, Office of Energy Efficiency and Renewable Energy of the U.S. Department of Energy under Contract No. DE-AC05-00OR22725. Any remaining errors in this document are the sole responsibility of the authors.
– 7 projects with capacity greater than 0.1 MW obtained “qualifying conduit” determination from FERC.
– Bureau of Reclamation issued 2 preliminary leases of power privilege.
• The number of issued preliminary permits in 2016 was almost double the one in 2015; number of issued licenses and exemptions were very similar to the previous year.
• At least 17 projects (93 MW) were under construction at the end of 2016.
• At least 9 projects (225 MW) reached commercial operation in 2016.– Most of the new capacity (211 MW) is located at
3 NPD projects developed by American Municipal Power in the Ohio River.
Sources: FERC, Reclamation LOPP database, HydroWorld, and web searches
Note: Map only includes projects with a capacity greater than 0.1 MW.
See Technical Notes for details about the authorization stages
Water Power Technologies Office eere.energy.gov7
More than 90% of the projects proposed as of the end of 2016
would add power to conduits or non-powered dams
• Non-Powered Dam (NPD) projects account for 64% of
projects and 52% of proposed capacity.
– USACE owns 88 of the 156 dams for which
development is being pursued.
• An MOU signed by FERC and USACE in July 2016
aims to improve efficiency in the permitting process
for projects at USACE NPDs requiring dam safety
(Section 408) and water quality (Section 404) permits
from USACE in addition to a FERC license
– Most of the rest of the dams are owned by other
federal agencies or non-federal public entities; only
7 are privately-owned dams.
• 87% of planned NSD capacity corresponds to two
projects in Alaska: Susitna (600 MW) and Snow River
(700 MW).
– Alaska government cancelled state funding for the Susitna
project in June 2016 but the developer (Alaska Energy
Authority) has continued work on its license application.
• 74 projects were at the Issued Authorization stage; if all of
them moved forward, significant construction would take
place in upcoming years for certain combinations of
regions and project types (e.g., 28 conduit projects in the
Southwest; 17 NPD projects in the Midwest)
Sources: FERC, Reclamation LOPP database, HydroWorld, and web searches
Note: Plot only includes projects with a capacity greater than 0.1 MW.
See Technical Notes for details about the authorization stages
Water Power Technologies Office eere.energy.gov8
Most projects in the development pipeline as of the end of 2016
are small and pursued by private developers, but there are
differences across project types.
Developer type
• NPD projects tend to be developed by
private entities, NSD projects are distributed
equally between public and private
developers, and conduit projects are most
often pursued by public entities.
Project sizes
• 77% of projects belong in the Small category
(<=10 MW).
• Only 2 projects are Large (>100 MW); both
are NSDs in Alaska with public entities as
developers.
• Median project sizes:
– 5.2 MW for NPDs
– 6 MW for NSDs
– 0.5 MW for conduits
Note: The Susitna (600MW)
and Snow River (700MW)
projects are outliers in terms
of size and were not included
in the histogram.
Sources: FERC, Reclamation LOPP database, HydroWorld, and web searches
Note: Map only includes projects with a capacity greater than 0.1 MW.
See Technical Notes for details about the authorization stages
Water Power Technologies Office eere.energy.gov9
Most pumped storage hydropower projects remain at the
feasibility analysis stage; in 2016, one new license was issued
and one authorized project was abandoned.• There were 38 projects in the development pipeline
at the end of 2016.– 32 of them were at early development stages in which
feasibility studies are being performed.
– In January 2017, there was an uptick in preliminary permit applications with 21 new applications; most of them in Pennsylvania by a single developer.
– The regional distribution of projects under consideration has changed with respect to the previous year: number of projects has decreased in the Southeast and increased in the Northeast.
• Four projects have pending license applications (Mineville, NY; Swan Lake, OR; Parker Knoll, UT; Lake Powell, UT).– The license application for Parker Knoll was submitted
in 2011, the one for Lake Powell in 2016, and the other two in 2015.
• Two projects have a FERC license authorization but have not started construction.– Gordon Butte (MT) was authorized in December 2016.
– In March 2016, FERC approved a request by the developers of the Eagle Mountain project (CA) to extend the deadline to commence construction by two years (until June 2018).
• In February 2016, the Sacramento Municipal Utility District (SMUD) announced it would not pursue the licensed Iowa Hill project citing increased cost and financial risk estimates.– In October, FERC approved SMUD’s request to
remove the Iowa Hill authorization from its Upper American River project license.
Sources: FERC, HydroWorld, and web searches
See Technical Notes for details about the authorization stages
Water Power Technologies Office eere.energy.gov10
U.S. international trade of hydraulic turbines and parts has
slowed down in recent years and the list of top source and
destination countries is experiencing some changes
• Hydraulic turbines and turbine parts are the only hydropower equipment component for which international transactions can be tracked from USITC data.
• During 2016, USITC published final data for 2015 and provisional 2016 data.– Total export value remained stable at ~$60
million in 2015-2016 after pronounced decline in 2012-2014.
– Import values have fluctuated significantly year to year after the peak reached in 2013.
• 54% of U.S. exports in 2012-2015 have gone to Canada or Mexico; an additional 13% went to Central or South America.
• 53 % of U.S. imports in 2012-2015 also came from the Americas (primarily Canada and Brazil); however, China was the top exporter of hydraulic turbines and parts to the United States for the first time in 2015.
Source: USITC Interactive Tariff and Trade Data
See Technical Notes for country selection criterion
Water Power Technologies Office eere.energy.gov11
Key takeaways
• U.S. hydropower rehabilitation and upgrade (R&U) projects with a total estimated value of $1.2 billion started in 2016.
– Estimated value of R&U project starts has averaged $850 million/year in 2007-2016.
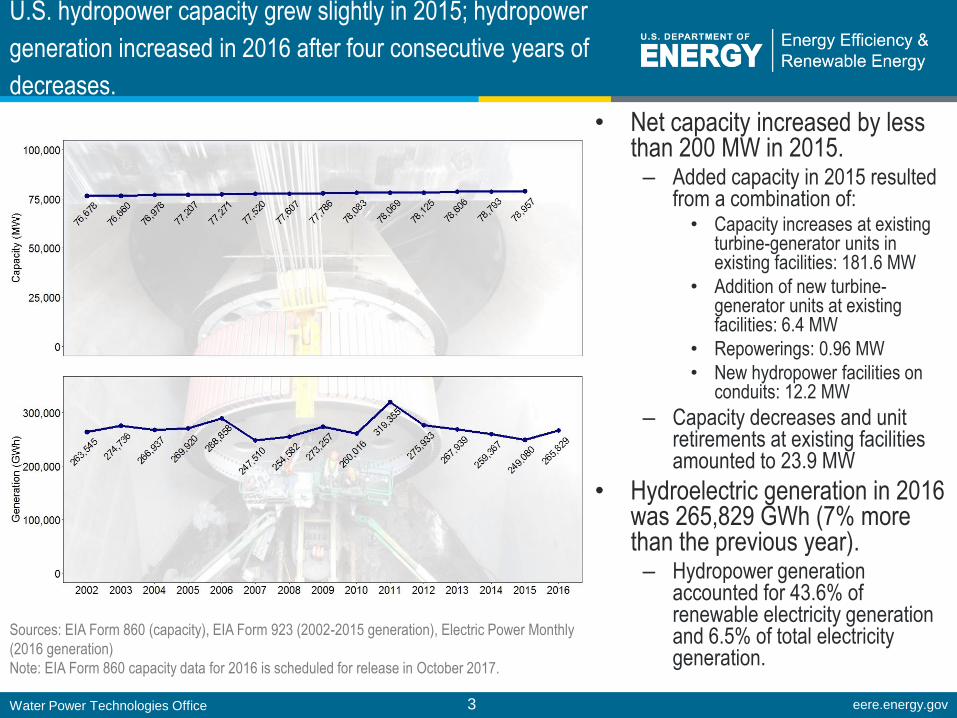
• Installed U.S. hydropower capacity increased by ~200 MW in 2015 with most of the increase originating in capacity
increases at existing facilities.
• U.S. hydropower generation increased in 2016 after four consecutive years of decreases due to a reduction in
severity and reach of drought conditions in the West.
• 242 hydropower projects were at some stage of the development process in the United States at the end of 2016.
– 64% of the projects would add power to non-powered dams and more than half of the dams proposed to be powered are
owned by USACE.
– The only two large (>100 MW) projects in the pipeline are proposed new stream-reach developments in Alaska.
• 38 pumped storage hydropower projects were at some stage of the development process in the United States at the
end of 2016.
– 32 projects are at the earliest stage of project development which has a very high attrition rate, 4 projects have pending
licenses, and 2 projects have issued licenses.
– No construction starts have taken place in 2016.
• More than half of U.S. hydraulic turbine and turbine part exports in 2012-2015 have gone to Canada and Mexico; in 3
of the last 4 years, China and Canada have been the two top exporters of hydraulic turbines and turbine parts to the
United States.
• Federal production and investment tax credits are no longer available for hydropower projects starting construction
after December 31, 2016.
Water Power Technologies Office eere.energy.gov12
Technical Notes
Slide 5:
• The full value of each project is assigned to the project start year. The grey portions of the bars in slide 5 correspond to projects that have not yet
been completed as of December 2016.
• Minimum total investment value of projects tracked by Industrial Info Resources (IIR) is $1 million.
• Additional refurbishment and upgrade project types are being tracked in the December 2016 snapshot relative to those shown in the December 2015
snapshot published in May 2016. Additional tracked project categories explain the higher total investment value reported for some of the years.
• Updates to project value or completion date can also results in changes in the total estimated value for a given year from one snapshot to the next.
• The value of refurbishment and upgrade projects started before 2007 is not reported due to the finding that IIR PECWeb Dashboard queries produce
incomplete results for projects completed earlier than that year.
Slides 6-9:
Project authorization stages:
• Pending Permit includes projects pending a preliminary lease in the LOPP process and projects pending issuance of a preliminary permit.
• Issued Permit includes projects that have received a preliminary lease in the LOPP process and projects that have obtained a FERC preliminary
permit. Projects in the Issued Permit stage have very high attrition rates.
• Pending Application includes projects that have applied for an original FERC license, a FERC exemption, or have requested FERC to be considered a
“qualifying conduit” hydropower facility.
• Issued Authorization includes projects that have been issued an original FERC license or a FERC exemption, projects that have been approved by
FERC for “qualifying conduit” hydropower status, or projects that have a final lease contract under the LOPP process.
Slide 10:
• The 8 individual countries shown in the plot correspond to the 8 countries with the largest total trade flows (imports or exports) over 1996-2016.
For further inquiries about the content of these slides, please contact the authors: Rocío Uría-Martínez ([email protected]), Megan M. Johnson