13
Mike Webster Director, CTE
| Date post: | 25-Dec-2015 |
| Category: |
Documents |
| Upload: | edmund-underwood |
| View: | 221 times |
| Download: | 2 times |

Mike WebsterDirector, CTE

Why Am I Here?
49 43
5 19
3
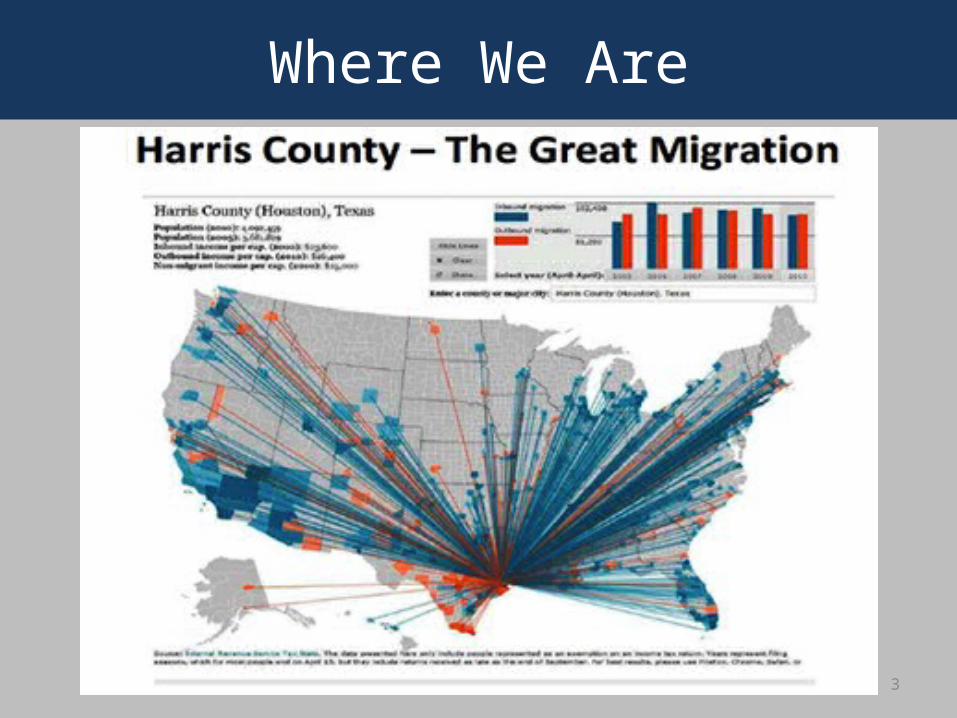
Where We Are

Labor Market Demand:
Occupational Title % Growth
Annual Avg. Job
Openings Hrly WagePrimary, Secondary, & Special Education School Teachers 46.7% 7,365Registered Nurses 38.2% 2,470 34.43Engineers 23.0% 2,245Postsecondary Teachers 22.8% 1,180 naAccountants & Auditors 24.2% 1,155 31.18Welders, Cutters, Solderers, and Brazers 26.7% 830 17.93Licensed Practical & Licensed Vocational Nurses 29.6% 820 21.28Industrial Machinery Mechanics 41.5% 710 23.23Electricians 19.7% 655 21.43Doctors and Dentists 26.5% 645Plumbers, Pipefitters, & Steamfitters 21.0% 520 23.60Machinists 25.3% 520 18.95Computer Systems Analysts 22.7% 455 40.12Service Unit Operators, Oil, Gas, & Mining 35.9% 375 18.58
Where We Are
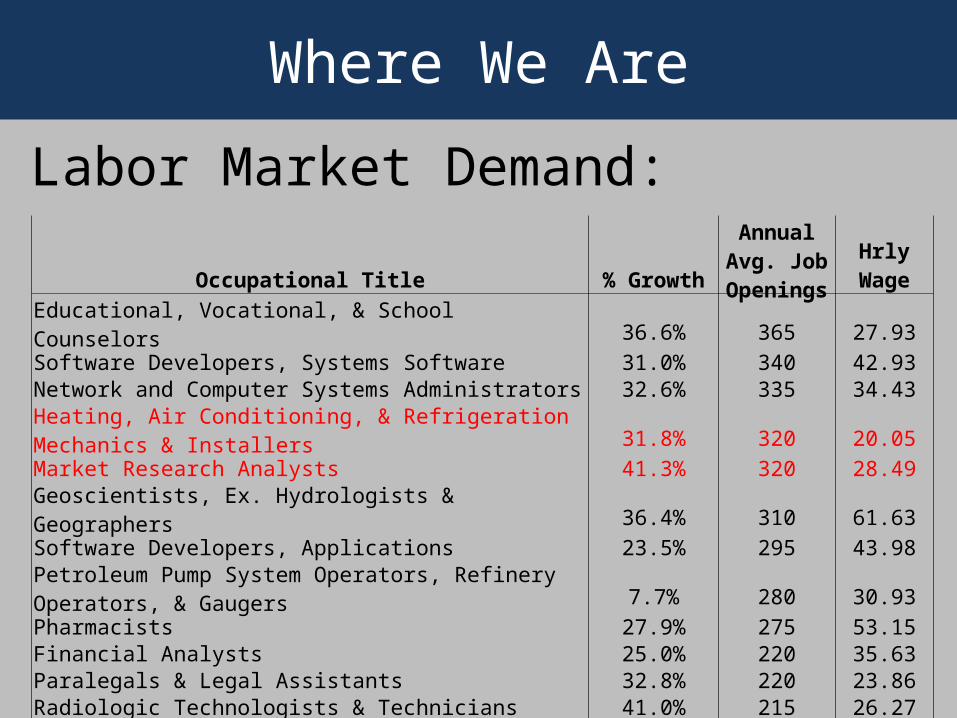
Labor Market Demand:
Occupational Title % Growth
Annual Avg. Job
Openings Hrly WageEducational, Vocational, & School Counselors 36.6% 365 27.93Software Developers, Systems Software 31.0% 340 42.93Network and Computer Systems Administrators 32.6% 335 34.43Heating, Air Conditioning, & Refrigeration Mechanics & Installers 31.8% 320 20.05Market Research Analysts 41.3% 320 28.49Geoscientists, Ex. Hydrologists & Geographers 36.4% 310 61.63Software Developers, Applications 23.5% 295 43.98Petroleum Pump System Operators, Refinery Operators, & Gaugers 7.7% 280 30.93Pharmacists 27.9% 275 53.15Financial Analysts 25.0% 220 35.63Paralegals & Legal Assistants 32.8% 220 23.86Radiologic Technologists & Technicians 41.0% 215 26.27Mobile Heavy Equipment Mechanics, Except Engines 30.7% 205 17.60
Where We Are

Labor Market Demand:
Occupational Title % Growth
Annual Avg. Job
Openings Hrly WageElectrical Power-Line Installers and Repairers 31.8% 205 24.72Medical Records & Health Information Technicians 31.1% 200 17.64Chemical Plant and System Operators 4.0% 195 32.92Cost Estimators 28.7% 185 31.53Geological & Petroleum Technicians 34.2% 160 22.79Speech-Language Pathologists 37.4% 160 29.94Respiratory Therapists 42.4% 160 26.54Medical & Clinical Laboratory Technologists 24.1% 145 26.89Electrical and Electronics Engineering Technicians 14.2% 140 29.89Physical Therapists 36.1% 140 39.38Occupational Therapists 37.6% 105 36.28Boilermakers 15.6% 70 22.40
Where We Are

Longitudinal Graduation Rates:
Where We Are
CTE HISD0
10
20
30
40
50
60
70
80
90
100
87.2
70
90.9
74.3
90.2
78.5
90.4
78.8
4-Year Graduation Rates
Class of 2009 Class of 2010 Class of 2011 Class of 2012
Perc
enta
ge
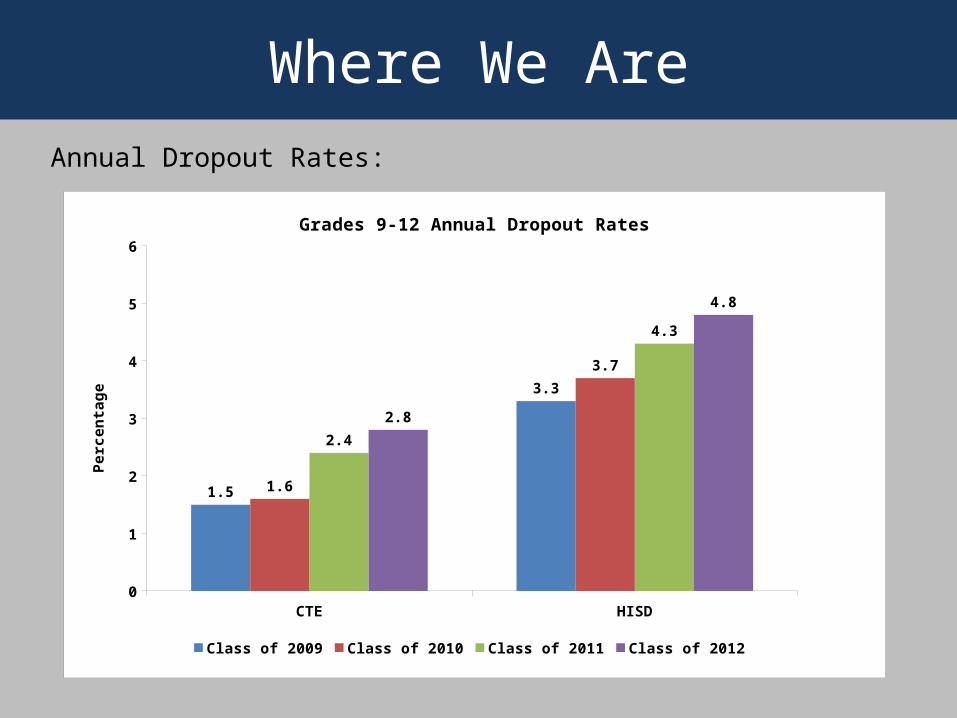
Annual Dropout Rates:
Where We Are
CTE HISD0
1
2
3
4
5
6
1.5
3.3
1.6
3.7
2.4
4.3
2.8
4.8
Grades 9-12 Annual Dropout Rates
Class of 2009 Class of 2010 Class of 2011 Class of 2012
Perc
enta
ge

Where We Are Headed

Roadmap to Career Readiness
Exploration: Dedicated career exploration course at the middle school level offering high level planning for life after middle and high school: • 7th Grade (preferable) offering to prepare students for high
school choice options• Paired with High School CTE Course for .5 or 1.0 high
school credit• Imbedded use of TEKS, Naviance, Texas Workforce
Commission resources and data and integrated curriculum• Future planning targeting school choice calendar and
options• Field experiences provided by local industry partners

Personal Graduation PlanRequirements: Principal designates a counselor or administrator to review PGP options, including the endorsements and distinguished level of achievement, with EACH student entering grade nine together with the student’s parent or guardian
Each student entering 9th grade must indicate in writing an Endorsement choice
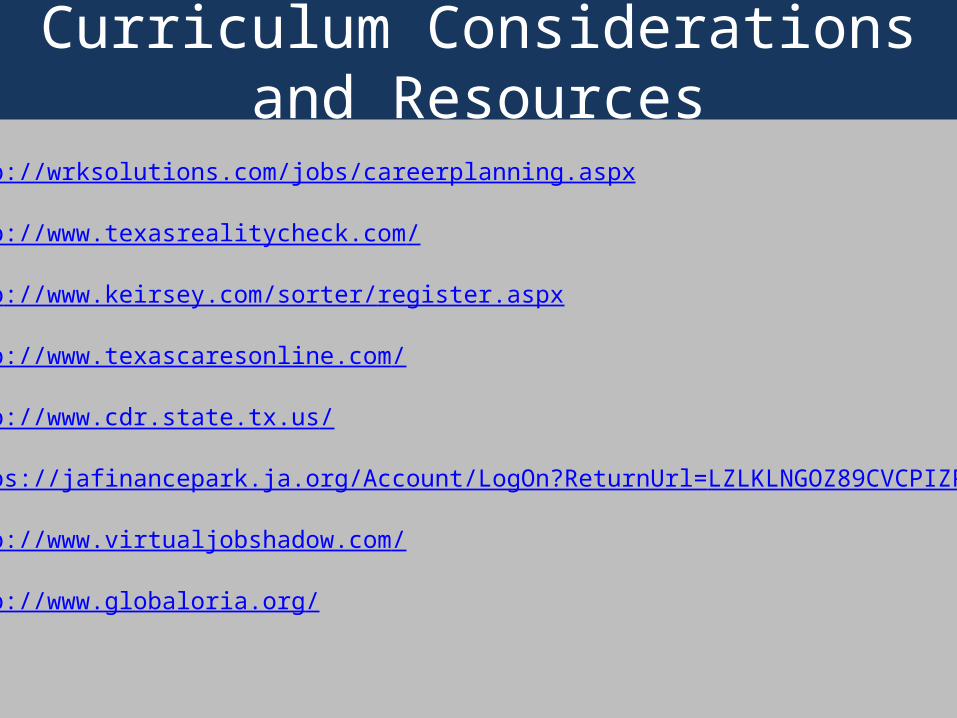
Curriculum Considerations and Resources
http://wrksolutions.com/jobs/careerplanning.aspx
http://www.texasrealitycheck.com/
http://www.keirsey.com/sorter/register.aspx
http://www.texascaresonline.com/
http://www.cdr.state.tx.us/
https://jafinancepark.ja.org/Account/LogOn?ReturnUrl=LZLKLNGOZ89CVCPIZP2S
http://www.virtualjobshadow.com/
http://www.globaloria.org/