Page 1
Milk Production and Marketing in Organized Smallholder Dairy Value Chains:
A Case Study of Dairy Development Programme Schemes in Zimbabwe
By
Tafireyi Chamboko
Department of Agricultural Economics and Extension
Faculty of Agriculture
University of Zimbabwe
A Thesis Submitted in Fulfillment of the Requirements for the Degree of Doctor of
Philosophy in Agriculture, Department of Agricultural Economics and Extension, Faculty of
Agriculture, University of Zimbabwe
June 2019
Page 2
ii
Dedication
This Thesis is dedicated to my mother, the late Kupurai Respina Chamboko. I pray to God
that her soul rests in eternal peace.
Page 3
iii
Acknowledgements
There are a number of people who assisted in various ways to make this study possible.
Unfortunately, space does not allow to thank all of them individually. Firstly, I would like to
thank my main supervisor, Dr. Emmanuel Mwakiwa for his academic guidance and
encouragement throughout the course of study. I also want to thank my associate supervisors
Professors Prisca Mugabe and Mandivamba Rukuni. Professor Rukuni provided insightful
ideas and comments in earlier stages of the research. My thanks also go to my initial
supervisors Professor N.T. Ngongoni and Augustine Zvinavashe during the early stages of the
study before the changes in the supervisory team.
My thanks also go to the Department of Livestock and Veterinary Services, in particular the
Division of Livestock Production and Development which facilitated data collection in the
smallholder dairy schemes through introductions in the specific areas. The International
Livestock Research Institute (ILRI) Southern Africa Regional office in Zimbabwe is
acknowledged for providing relevant literature. My research assistants Hazel Sethaunyane in
Chikwaka, Mirandah Jena in Nharira-Lancashire, Mathew Madzimbamuto in Marirangwe
and Manuel Mujaji in Rusitu in Chipinge provided support in data collection in the survey
areas and maintaining rapport with the communities in the survey sites. I would also like to
thank all the participating smallholder dairy producers in the respective schemes for providing
the data during the interviews.
I would also like to thank all my colleagues in the Department of Agricultural Economics and
Extension for providing insightful comments during the course of the study. Finally, I would
like to acknowledge the support and encouragement throughout the study from my wife Gloria
Miriam Changundega, and my children Chiratidzo Respina, Kudakwashe Leo Tafireyi and
Tanyaradzwa Michelle.
This study would not have been possible without financial support. A PhD thesis grant from
the Africa Economic Research Consortium (AERC) based in Nairobi, Kenya is greatly
acknowledged.
Page 4
iv
Milk Production and Marketing in Organized Smallholder Dairy Value Chains: A Case
Study of Dairy Development Programme Schemes in Zimbabwe
Abstract
At the attainment of Zimbabwe’s independence, the government of Zimbabwe established the
smallholder dairy development programme to encourage smallholder farmers to participate in
organized value chains. Although now more than three decades since the government
established this programme, smallholder contribution to formal markets remains very low at
5%. The objectives of this study were to (1) analyze the trends in smallholder milk production
and marketing including the effect of policies since the introduction of the smallholder dairy
development programme in 1983 (2) determine the main factors influencing milk production
in the smallholder dairy value chain (3) analyze the factors affecting milk market participation
(4) determine ex-ante the potential effect of introducing an animal production and forage
centre (APFC), and (5) assess the role of farmers’ cooperatives in the commercialization of
milk in the smallholder dairy value chain. Four dairy schemes were purposively selected and
185 farmers selected through simple random sampling were interviewed using a pretested
structured questionnaire. The analysis of variance results indicate that policies had an effect
on national and smallholder milk production. The results indicate that the Milk Collection
Centre (MCC) is the main market for milk produced in the organized smallholder dairy value
chains. Multiple linear regression analysis showed independent variables that were significant
in influencing milk production were household size, age and dairy farming experience of the
head of household, number of milking cows, and cost of concentrates. The first-stage
Heckman model showed determinants of milk market participation to be total number of dairy
cows owned, educational level and age of household head, household size, access to
information and extension services, and agro-ecological region. The second-stage Heckman
model indicates the determinants of volume of milk sales to the MCC to be the total number
of dairy cows owned, distance to the MCC, age of household head, land holding size, access
to extension services and agro-ecological region. Ex-ante benefit cost analysis of the APFC
indicate that such a centre would be profitable with a benefit cost ratio of 5.4:1. Farmers’
organization through the milk collection centres was found to be essential in making farmers’
access to information and lucrative milk markets. The Tobit model indicates access to
information, distance to the MCC and producer price of milk paid by the MCC were the major
determinants of the commercialization of milk sold to the MCC. The study recommends that
policies to improve milk production should include interventions that target the provision of
appropriate and adequate training in milk production. Policy interventions also need to target
increasing the number of dairy cows for smallholder dairy producers, targeting young and
educated farmers located in high potential agro-ecological regions I and II, and ensuring
market access. These should be provided with adequate and appropriate information and
extension packages in order to enhance milk market participation and volume of sales. The
APFC is a new concept for the smallholder organized dairy value chains, and policy
interventions should be directed at piloting the concept in order to assess its feasibility and
contribution to milk production. Establishing sub-centre MCC within easy reach of farmers
would enhance commercialization of the milk if favourable market and price policies are
developed and implemented.
Keywords: dairy development, organized, smallholder, value chains
Page 5
v
Table of Contents
Dedication ................................................................................................................................. ii
Acknowledgements ................................................................................................................ iii
Abstract .................................................................................................................................... iv
List of Tables ............................................................................................................................ x
List of Figures ....................................................................................................................... xiii
List of Appendices ................................................................................................................. xiv
List of Abbreviations and Acronyms ................................................................................... xv
CHAPTER ONE: INTRODUCTION .................................................................................... 1
1.1 Introduction ........................................................................................................................ 1
1.2 Background ........................................................................................................................ 2
1.3 Statement of the Problem .................................................................................................. 7
1.4 Research Focus ................................................................................................................... 8
1.4.1 Objectives of the Study .......................................................................................... 8
1.4.2 Research Questions ................................................................................................ 9
1.4.3 Study Hypotheses ............................................................................................... 9
1.5 Justification ...................................................................................................................... 10
1.6 Organisation of the Study ............................................................................................... 11
CHAPTER TWO: LITERATURE REVIEW ..................................................................... 13
2.1 Introduction ...................................................................................................................... 13
2.2 Value Chains and Value Chain Analysis ....................................................................... 13
2.3 Empirical Studies on Smallholder Dairy Production and Marketing ........................ 17
2.3.1 Factors Influencing Dairy Production ............................................................... 18
2.3.2 Feed Resources and Smallholder Dairy Production ......................................... 21
2.3.3 Factors Affecting Milk Marketing Participation and Volume of Sales .......... 26
2.3.4 Farmers’ Organization and Commercialization of Smallholder Dairying .... 34
2.4 Dairy Value Chain in Zimbabwe .................................................................................... 38
2.5 Conceptual Framework for this Study .......................................................................... 42
2.6 Summary of Insights from the Literature ..................................................................... 44
CHAPTER THREE: RESEARCH METHODS ................................................................. 48
3.1 Introduction ...................................................................................................................... 48
3.2 Data Sources ..................................................................................................................... 48
Page 6
vi
3.3 Selection of Study Sites .................................................................................................... 49
3.4 Location and Description of Study Sites ........................................................................ 50
3.4.1 Chikwaka Smallholder Dairy Scheme ............................................................... 50
3.4.2 Nharira-Lancashire Smallholder Dairy Scheme............................................... 51
3.4.3 Marirangwe Smallholder Dairy Scheme ........................................................... 51
3.4.4 Rusitu Smallholder Dairy Scheme ..................................................................... 51
3.5 Primary Data Collection Methods and Tools ................................................................ 52
3.6 Secondary Sources of Data and Types of Data Collected ............................................ 52
3.7 Sampling Procedures ....................................................................................................... 53
3.8 Limitations of Data Collection Methods Used............................................................... 53
3.9 Analytical Framework ..................................................................................................... 54
3.10 Analysis and Econometric Models used in the Study ................................................. 57
3.11 Data Entry and Analysis ............................................................................................... 67
3.12 Study Contribution to the Body of Knowledge ........................................................... 68
CHAPTER FOUR: A REVIEW OF SMALLHOLDER DAIRY DEVELOPMENT IN
ZIMBABWE 1983 TO 2013: THE EFFECT OF POLICIES ................................... 70
4.1 Introduction ................................................................................................................... 70
4.2 Review of the Developments in Milk Production in Zimbabwe .................................. 70
4.2.1 Large Scale Commercial Dairying ..................................................................... 71
4.2.2 Why smallholder dairying after independence? ............................................... 72
4.2.3 Evolution of Smallholder Dairying .................................................................... 73
4.2.4 The First Communal Farming Area Dairy Scheme ......................................... 73
4.2.5 The First Small Scale Commercial Farming Area Dairy Scheme ................... 75
4.2.6 Major Policies during the Period 1980 to 2013 ................................................. 76
4.3 Analysis of Milk Intake ................................................................................................... 78
4.3.1 Trends in National Milk Intake .......................................................................... 78
4.3.2 Effect of Policies on National Milk Intake ......................................................... 79
4.3.3 Trends in Smallholder Milk Intake .................................................................... 80
4.3.4 Effect of Policies on Smallholder Milk Intake ................................................... 81
4.4 Effects of Polices on Milk Intake of Selected Smallholder Dairy Schemes ................ 82
4.5 Discussion.......................................................................................................................... 84
4.5.1 Effect of Policies on National Milk Intake ......................................................... 84
4.5.2 Effect of Policies in the Different Policy Periods on Smallholder Milk Intake86
4.6 Constraints to Smallholder Dairy Development ........................................................... 88
4.7 Potential for Smallholder Dairy Development .............................................................. 90
Page 7
vii
4.8 Summary ........................................................................................................................... 95
CHAPTER FIVE: FACTORS INFLUENCING MILK PRODUCTION IN THE
SMALLHOLDER DAIRY VALUE CHAIN.............................................................. 97
5.1 Introduction ...................................................................................................................... 97
5.2 The Structure of the Smallholder Dairy Value Chain in the Four Study Sites.......... 97
5.2.1 Description of the Semi-Formal Smallholder Dairy Value Chain (Chikwaka
and Nharira-Lancashire study sites) ........................................................................... 98
5.2.2 Description of formal smallholder dairy value chain (Marirangwe and Rusitu
study sites).................................................................................................................... 100
5.3 Characteristics of Smallholder Dairy Producers in the Schemes Studied................ 101
5.3.1 Characterization of the Smallholder dairy schemes ....................................... 101
5.3.2 Household Demographics .................................................................................. 102
5.3.3 Occupation and Agricultural Training of Head of Household ...................... 104
5.4 General Livestock Ownership and Investments in Dairy Infrastructure and
Equipment ............................................................................................................................ 105
5.4.1 General Livestock and Dairy Cattle Ownership ............................................. 106
5.4.2 Dairy Infrastructure and Investments ............................................................. 106
5.5 Dairy Herd Composition ............................................................................................... 107
5.6 Types of Breeds .............................................................................................................. 108
5.7 Access to Artificial Insemination (AI) and Cost.......................................................... 109
5.8 Reproductive Performance Parameters of Dairy Cattle in the Study Sites ............. 110
5.8.1 Reproductive Performance of Mashona Breeds ............................................. 110
5.8.2 Reproductive Performance of Pure Breeds ..................................................... 111
5.8.3 Reproductive Performance of Cross Breeds ................................................... 112
5.9 Milk Production in the Smallholder Dairy Schemes .................................................. 114
5.10 Access to credit by smallholder dairy farmers for the period 2011 to 2015 ........... 114
5.11 Access to Dairy Extension Services ............................................................................ 118
5.12 Analysis of Factors Influencing Milk Production in the Smallholder Dairy Value
Chain ..................................................................................................................................... 120
5.12.1 Multiple Regression Analysis Model Diagnostics ......................................... 120
5.12.2 Multiple Regression Analysis Results ............................................................ 123
5.13 Discussion...................................................................................................................... 124
5.13.1 Characteristics of Smallholder Dairy Producers in the Study Sites ........... 124
5.13.2 Factors Influencing Milk Production in the Smallholder Dairy Value
Chain ............................................................................................................................ 132
5.14 Summary ....................................................................................................................... 134
Page 8
viii
CHAPTER SIX: DETERMINANTS OF MARKET PARTICIPATION AND
VOLUME OF MILK SOLD TO MILK COLLECTION CENTRES ................... 136
6.1 Introduction .................................................................................................................... 136
6.2 Milk Marketing Outlets in the Smallholder Dairy Schemes ...................................... 137
6.2.1 Milk Marketing Outlets Used by Farmers ...................................................... 137
6.2.2 Quantity of Milk Sold and Prices ..................................................................... 137
6.2.3 Reasons for Selling to the Specific Market Outlets......................................... 138
6.2.4 Reasons for not Delivering Milk to the Milk Collection Centre .................... 140
6.3 Sources of Agricultural and Market Information ...................................................... 140
6.3.1 Major Source of Agricultural Information ..................................................... 141
6.3.2 Source of Information on Market Prices of Milk and Milk Products .......... 141
6.3.3 Use of Mobile Phones for Dairy Enterprise Information ............................... 142
6.4 Major Constraints in Transporting Milk to the Market ............................................ 143
6.5 Summary of Socio-Economic and Demographic Characteristics of Milk Market
Participants and Non-Participants ..................................................................................... 144
6.6 Factors Affecting Milk Market Participation and Volume of Milk Sales to the MCC
of the Smallholder Dairy Value Chain ............................................................................... 145
6.6.1 Results of the First-Stage Heckman Model ..................................................... 146
6.6.2 Results of the Second-Stage Heckman Model ................................................. 146
6.7 Discussion........................................................................................................................ 147
6.7.1 Milk Marketing Outlets ..................................................................................... 148
6.7.2 Agricultural Information .................................................................................. 149
6.7.3 Constraints in Transporting Milk to the Market............................................ 150
6.7.4 Socio-economic Characteristics of Milk Market Participants and Non-
Participants .................................................................................................................. 150
6.7.5 Determinants of Milk Market Participation and Volume of Sales to the MCC
of the Smallholder Dairy Value Chain ...................................................................... 153
6.8 Summary ......................................................................................................................... 161
CHAPTER SEVEN: ANALYSIS OF ANIMAL PRODUCTION AND FORAGE
CENTRE INTERVENTION IN THE SMALLHOLDER DAIRY VALUE
CHAIN ......................................................................................................................... 163
7.1 Introduction .................................................................................................................... 163
7.2 Feed Resources in Smallholder Dairy Schemes .......................................................... 164
7.2.1 Types of Feeding Systems used for Dairy Cattle............................................. 164
7.2.2 Sources of Dairy Feed ........................................................................................ 165
7.2.3 Types of Grazing Used....................................................................................... 165
Page 9
ix
7.2.4 Types of Feeds .................................................................................................... 166
7.2.5 Improved Pastures ............................................................................................. 167
7.2.6 Fodder Production ............................................................................................. 168
7.3 Costs of Production and Viability of Dairy Production ............................................. 172
7.4 Animal Production and Forage Centre........................................................................ 174
7.4.1 Farmer Perceptions on the Animal Production and Forage Centre ............. 174
7.4.2 Willingness to Pay for Construction and Services of the Animal Production
and Forage Centre ...................................................................................................... 176
7.4.3 Advantages of the APFC to the Dairy Enterprise and other Services the
Centre should provide ................................................................................................ 180
7.5 Main Characteristics for Smallholder Dairy Schemes Supplying the Semi-formal
and Formal Value Chains ................................................................................................... 182
7.6 Ex-ante Analysis of the Benefits and Costs of the Animal Production and Forage
Centre .................................................................................................................................... 185
7.7 Discussion........................................................................................................................ 187
7.7.1 Feed Resources in Smallholder Dairy Schemes .............................................. 187
7.7.2 Cost of Production and Viability of Dairy Production ................................... 192
7.7.3 Animal Production and Forage Centre............................................................ 194
7.8 Summary ......................................................................................................................... 198
CHAPTER EIGHT: ROLE OF FARMER ORGANISATION IN THE
SMALLHOLDER DAIRY VALUE CHAIN..................................................................... 200
8.1 Introduction .................................................................................................................... 200
8.2 Major Reasons for Membership of Milk Collection Centres..................................... 200
8.3 Services Provided by the Milk Marketing Cooperatives through the MCC ............ 204
8.4 Access to Services Provided by the Milk Marketing Cooperative over the Years... 205
8.5 Ranking of Production Constraints ............................................................................. 206
8.6 Ranking of Marketing Constraints .............................................................................. 210
8.7 Determinants of Milk Commercialization through the MCC of the Smallholder
Dairy Value Chain ............................................................................................................... 213
8.8 Role of Farmer Cooperatives in the Dairy Value Chain ............................................ 215
8.9 Summary ......................................................................................................................... 217
CHAPTER NINE: CONCLUSIONS AND RECOMMENDATIONS ............................ 220
9.1 Conclusions ..................................................................................................................... 220
9.1.1 Factors Influencing Milk Production in the Dairy Value Chain ................... 220
9.1.2 Determinants of Milk Marketing Participation and Volume of Sales in the
Smallholder Dairy Value Chain ................................................................................ 220
Page 10
x
9.1.3 Animal Production and Forage Centre............................................................ 221
9.1.4 Role of Farmers’ Organization through Milk Marketing Cooperatives in the
Smallholder Dairy Value Chain ................................................................................ 222
9.2 Recommendations .......................................................................................................... 222
9.3 Areas for Further Study ................................................................................................ 224
References ............................................................................................................................. 226
List of Tables
Table 3.1: Characteristics of smallholder dairy schemes selected for the study, 2015 ........... 50
Table 3.2: Analytical framework of the study ......................................................................... 55
Table 3.3: Description of variables used in the model and expected sign ............................... 60
Table 3.4: Description of dependent and independent variables used in Heckman two-step
selection model ........................................................................................................................ 63
Table 3.5: Description of variables used in the Tobit model ................................................... 67
Table 4.1: Summary examples of empirical research studies highlighting the fodder/feed
constraint in smallholder dairy schemes .................................................................................. 93
Table 5.1: Characteristics of smallholder dairy producers by study site, 2015 ..................... 102
Table 5.2: Household demographic characteristics by study site, 2015 ................................ 104
Table 5.3: Occupation and agricultural training of household head by study site, 2015 ....... 105
Table 5.4: General livestock ownership by study site, 2015 ................................................. 106
Table 5.5: Farmers’ investments in dairy infrastructure by study site, 2015 ......................... 107
Table 5.6: Composition of the dairy herd by study site, 2015 ............................................... 108
Table 5.7: Main types of cow breeds milked by study site, 2015 .......................................... 109
Table 5.8: Access to artificial insemination services and cost by study site, 2015 .............. 110
Table 5.9: Mashona breed average lactation length, calving, weaning, mortalities and
purchases by study site, 2015................................................................................................. 111
Table 5.10: Pure bred average lactation length, calving, weaning, mortalities and purchases
by study site, 2015 ................................................................................................................ 112
Table 5.11: Cross bred average lactation length, calving, weaning, mortalities and purchases
by study site, 2015 ................................................................................................................. 113
Table 5.12: Milk production by study site, 2015 ................................................................... 114
Page 11
xi
Table 5.13: Percentage of farmers accessing credit facilities by study site, 2015 ................. 115
Table 5.14: Credit obtained during the period 2011 to 2015 by study site, 2015 ................. 116
Table 5.15: Use of credit obtained during the period 2011 to 2015 by smallholder dairy
farmers, 2015 ......................................................................................................................... 117
Table 5.16: Reasons some smallholder dairy farmers did not access credit during the period
2011 to 2015, 2015 ................................................................................................................ 118
Table 5.17: Access to extension services by study site, 2015 ............................................... 119
Table 5.18: Characteristics of smallholder dairy producers delivering milk to semi-formal
and formal dairy value chains ................................................................................................ 120
Table 5.19: Link tests results of the model ............................................................................ 121
Table 5.20: Collinearity diagnostics ...................................................................................... 122
Table 5.21: Multiple linear regression of factors influencing milk production ..................... 124
Table 6.1: Farmers selling milk to the MCC and other market outlets by study site, 2015 .. 137
Table 6.2: Quantity of milk sold and prices by study site, 2015 ........................................... 138
Table 6.3: Reasons for selling to the MCC by study site, 2015............................................. 139
Table 6.4: Reasons for not delivering milk to the MCC by study site, 2015......................... 140
Table 6.5: Major source of agricultural information by study site, 2015 .............................. 141
Table 6.6: Source of information on market prices of milk and milk products by study site,
2015........................................................................................................................................ 142
Table 6.7: Cellphone ownership and type of information received by study site, 2015........ 143
Table 6.8: Major constraints in transporting milk to the market by study site, 2015 ............ 144
Table 6.9: Socio-economic and demographic characteristics of milk market participants and
non-participants...................................................................................................................... 145
Table 6.10: Estimated parameters of the binary probit model for factors determining market
participation ........................................................................................................................... 146
Table 6.11: Results of second stage Heckman selection of factors affecting volume of sales
to the MCC ............................................................................................................................. 147
Table 7.1: Percentage reporting type of feeding system used for dairy cattle by study site,
2015........................................................................................................................................ 164
Table 7.2: Percentage of farmers reporting source of dairy feed by study site, 2015 ........... 165
Table 7.3: Percentage of farmers reporting type of grazing used for dairy animals by study
site, 2015 ................................................................................................................................ 166
Page 12
xii
Table 7.4: Percentage of farmers reporting type of feeds used for dairy animals by study
site, 2015 ................................................................................................................................ 167
Table 7.5: Planted pastures by study site, 2015 ..................................................................... 168
Table 7.6: Fodder production by study site, 2015 ................................................................. 169
Table 7.7: Quantity of maize grain and fodder crops harvested by study site, 2015 ............. 170
Table 7.8: Quantity of fodder crops harvested and fed as green material (kg) by study site,
2015........................................................................................................................................ 171
Table 7.9: Quantity processed into fodder (kg) by study site, 2015 ...................................... 171
Table 7.10: Cost of production and income for milk production by study site (USD) .......... 173
Table 7.11: Costs of milk production as percent of total variable costs by study site, 2015 174
Table 7.12: Farmers willing to buy feed and fodder from the animal production and forage
centre by study site, 2015....................................................................................................... 175
Table 7.13: Willingness to construct and responsibility for construction of animal
production and forage centre by study site ............................................................................ 178
Table 7.14: Amount farmers are willing to contribute for the construction of the animal
production and forage centre by study site ............................................................................ 179
Table 7.15: Willingness to pay for AI services provided by the animal production and forage
centre by study site................................................................................................................. 180
Table 7.16: Farmers perceptions of advantages such a centre would provide to the dairy
enterprise by study site, 2015................................................................................................ 181
Table 7.17: Farmers perceptions of other services to be provided by the animal production
and forage centre if established by study site, 2015 .............................................................. 182
Table 7.18: Feed characteristics of semi-formal and formal value chains, 2015 ................. 184
Table 7.19: Comparison of Benefit Cost ratios of the APFC Scenarios, with and without the
APFC, 2015............................................................................................................................ 187
Table 8.1: Reasons for being a member of the MCC by study site, 2015 ............................. 202
Table 8.2: Percentage of farmers reporting services provided by the milk marketing
cooperatives through the MCC by study site, 2015 ............................................................... 205
Table 8.3: Farmer perceptions on whether membership of the farmer cooperative improved
access to services by study site, 2015 .................................................................................... 206
Table 8.4: Ranking of production constraints in all the study sites, 2015 ............................. 208
Table 8.5: Ranking of marketing constraints in all the study sites, 2015 .............................. 211
Page 13
xiii
List of Figures
Figure 2.1: Flow diagram of the smallholder value chain and the location of the animal
production and forage centre at the milk collection centre ...................................................... 43
Figure 4.1:Zimbabwe national milk intake from 1980 to 2012 ............................................... 79
Figure 4.2: Mean (±95% CL) national milk intake (million litres) for different policy periods
interactive bars. Numbers in bars are subgroups in descending order based on multiple
comparison tests ....................................................................................................................... 80
Figure 4.3: Smallholder milk intake (million litres) 1988 - 2012 ............................................ 81
Figure 4.4: Mean (±95% CL) smallholder milk intake in litres for different policy periods .. 82
interactive bars. Numbers in bars are subgroups based on multiple comparison tests. ........... 82
Figure 4.5: Mean (±95% CL) Rusitu dairy scheme milk intake in litres for different policy . 83
periods interactive bars. Numbers in bars are subgroups based on multiple comparison tests.
.................................................................................................................................................. 83
Figure 4.6: Mean (±95% CL) Marirangwe dairy scheme milk intake in litres for different ... 83
policy periods interactive bars. Numbers in bars are subgroups based on multiple ................ 83
comparison tests. ...................................................................................................................... 83
Figure 5.1: Diagrammatic presentation of the semi-formal smallholder dairy value chain
(Chikwaka and Nharira-Lancashire smallholder dairy schemes) ............................................ 99
Figure 5.2: Diagrammatic presentation of the formal smallholder dairy value chain
(Marirangwe and Rusitu smallholder dairy schemes) ........................................................... 101
Figure 5.3: Kernel density estimate ....................................................................................... 123
Figure 7.1: Reasons for prioritizing cows in milk for feeding with feed from the centre
(n=185) ................................................................................................................................... 176
Page 14
xiv
List of Appendices
Appendices ............................................................................................................................ 241
Annex 1: Information on smallholder dairy development schemes ...................................... 241
Table 1: The Distribution of Dairy Development Programme Smallholder Dairy Projects .. 241
Table 2: Grouping of Smallholder Dairy Projects According to Performance/Status ........... 242
Table 3: Smallholder Dairy Scheme Members, Current and Potential, Zimbabwe 2015 ...... 243
Annex 2: Questionnaires and Interview Guides .................................................................... 243
Questionnaire 1: Household Questionnaire ........................................................................... 243
Interview Guide 1: Focus Group Discussion Guide .............................................................. 256
Interview Guide 2: Key Informant Interviews Guide Milk Collection Centre ...................... 258
Interview Guide 3: Key Informant Guide Stakeholders ........................................................ 262
Item 4: Letter to facilitate data collection .............................................................................. 266
Annex 3: Benefit-Cost Analysis of Animal Production and Forage Centre .......................... 267
Table 1: Parameters used with and without animal production and forage centre benefit-cost
analysis ................................................................................................................................... 267
Table 2: Benefit and Cost Streams of the Present Value of Costs and Benefits .................... 267
Table 3: Cost of setting up the hypothetical APFC ............................................................... 268
Table 4: Sensitivity Analysis of the Present Value of Costs and Benefits ............................ 268
Annex 4: Publications ............................................................................................................ 269
Paper 1: T Chamboko and E Mwakiwa. 2016. A review of smallholder dairy development in
Zimbabwe 1983 to 2013: the effect of policies. LRRD 28 (6) .............................................. 269
Paper 2: T. Chamboko, E. Mwakiwa and P.H. Mugabe. 2017. Determinants of Milk Market
Participation and Volume of Sales to Milk Collection Centres of the Smallholder Dairy
Value Chain in Zimbabwe ..................................................................................................... 284
Paper 3: Ex-ante benefit-cost analysis of an animal production and forage centre for a
smallholder dairy value chain in Zimbabwe .......................................................................... 300
Page 15
xv
List of Abbreviations and Acronyms
Agritex Department of Agricultural Technical and Extension Services
AI Artificial Insemination
AMA Agricultural Marketing Authority
ANOVA Analysis of Variance
ARDA Agricultural and Rural Development Authority
APFC Animal Production and Forage Centre
BCR Benefit Cost Ratio
CBS Competitive Brand Shapers
CsPro Census and Survey Processing Programme
DDP Dairy Development Programme
DMB Dairy Marketing Board
DVS Department of Veterinary Services
DZL Dairibord Zimbabwe Limited
EEC European Economic Community
ESAP Economic Structural Adjustment Programme
FTLRR Fast Track Land Reform and Redistribution programme
FV Future Value
EU European Union
FGD Focus Group Discussion
GDP Gross Domestic Product
GoZ Government of Zimbabwe
Ha Hectare
ICT Information and Communication Technologies
LMAC Livestock and Meat Advisory Council
LSC Large scale commercial farmers
Page 16
xvi
LPD Division of Livestock Production and Development
MAMID Ministry of Agriculture, Mechanization and Irrigation
Development
MC Milk collection centre
NADF National Association of Dairy Farmers
NDC National Dairy Cooperative
NGO Non-Governmental Organization
NORAD Norwegian Agency for Development Cooperation
NOK Norwegian Krone
NR Natural region
Kg Kilograms
Km Kilometers
ODA Overseas Development Association
PSIP Public Sector Investment Programme
PV Present Value
SD Standard Deviation
SH Smallholder
SNV Netherlands Development Organisation
SPSS Statistical Package for Social Sciences
UHT Ultra high temperature
USADF United States African Development Fund
USAID United States Agency for International Development
USD United States Dollar
VIF Variance Inflation Factor
ZADF Zimbabwe Association of Dairy Farmers
ZDIT Zimbabwe Dairy Industry Trust
ZimStats Zimbabwe Statistical Agency
ZWD Zimbabwe Dollar
Page 17
1
CHAPTER ONE: INTRODUCTION
1.1 Introduction
The agricultural sector in Zimbabwe supports the livelihoods of approximately 70% of the
population, and contributes approximately 18% of GDP (ZimStats, 2013). It contributes more
than 60% of inputs to the manufacturing sector (RBZ, 2016). The dairy subsector is an important
component of the agricultural sector, with dairy produce contributing about 3% of the value of
agricultural production at 2012 prices (ZimStats, 2013). Most of the contribution of the dairy
subsector comes from large scale commercial farms. In the smallholder areas, in addition to
income from the sale of milk, dairying contributes to poverty reduction and the food security for
rural households.
Dairying is a specialized activity which has traditionally developed around the major urban
centres in Zimbabwe. Most of the large scale dairy farms are found within the peri-urban areas
of the major cities such as Harare, Gweru, Mutare, and Bulawayo. This is mainly because the
urban areas provide the main consumption centres for the dairy products and have access to cold
chain facilities, with the rural areas getting the residual supply from the urban centres. Milk
processing plants are mainly located in the main urban centres to cater for the needs of the urban
population. As a result, consumption of milk and milk products has mainly been focused on
these areas. Although statistics are no longer available, it was previously estimated that urban
milk consumption was approximately 68 litres per capita compared to 19 litres per capita in the
rural areas (Mutukumira et al., 1996). With the development of rural service centres or growth
points after the country’s independence in 1980, and the evolution of smallholder dairying, the
structure of the dairy industry in Zimbabwe has largely remained unchanged, with the dairy
value chains focused on supplying the major urban centres. The rural growth points provide
potential for the growth of the dairy industry, but this potential has largely remained untapped.
Page 18
2
Trends in national milk production have largely determined the consumption patterns of milk in
both the rural and urban areas. According to MAMID (2014), national milk production has
steadily declined from a peak of 260 million litres in 1991 to 54 million litres in 2014.
According to FAOSTAT (2018) per capita milk consumption in Zimbabwe, in 2013 was
reported to be 26 kg per year compared to regional countries such as South Africa with 36 kg
per year. The Poverty, Income, Consumption and Expenditure Survey of 2011-2012 showed that
the levels of consumption of animal protein in Zimbabwe are very low. An average person in
Zimbabwe was reported to consume less than 22 litres of milk per annum against a world average
of 105 litres. The consumption levels are particularly low in rural areas where the majority of
the population resides. The Government over the years has implemented a number of policies,
some supportive of dairy production, while others have had the opposite effect. One of the major
policies was to broaden the milk supply base through the creation of the smallholder dairy
development programme that offered opportunities and allowed participation of smallholder
farmers in dairy production and marketing.
1.2 Background
Dairying, like many other agricultural enterprises in pre-independent Zimbabwe, was
predominantly a large scale commercial farmer activity (Dube, 2008). Small scale commercial,
resettled and communal farmers produced milk for mainly subsistence purposes. This dualism
in the economy characterized agricultural commodity production and marketing, whereby large
scale commercial farmers dominated the formal markets, while small scale commercial, resettled
and communal farmers produced for subsistence purposes. The dual nature of the economy
persisted into post-independent Zimbabwe. After independence, the government of Zimbabwe
sought to bring these disadvantaged subsectors into the mainstream economy through efforts to
improve their productivity and participation in formal markets. This was in line with the
Page 19
3
government’s pursuit of the objective of growth with equity adopted soon after independence.
The new government stressed its commitment to improving conditions in communal and other
groups by encouraging farmers to increase their participation in the market (Muir-Leresche,
2006).
Farmers’ participation in the market was facilitated through several instruments such as
production and marketing incentives. State control of the provision of subsidized inputs and
maintenance of a single channel marketing system for the major agricultural commodities in the
first decade of independence also facilitated participation. Throughout the 1980s, government
maintained a highly centralized agricultural marketing and control system (Muir-Leresche and
Muchopa, 2006). This centralized marketing and control was effected through marketing boards.
The Dairy Marketing Board (DMB) had monopoly in domestic and external trade of all dairy
products. The 1990s saw the introduction of structural adjustment programmes that sought to
liberalize marketing of agricultural commodities, including dairy. The DMB was initially
commercialized in 1993 and then fully privatized in 1996 (Muir-Leresche and Muchopa, 2006).
The government then removed price controls and allowed private companies and cooperatives
to enter the milk industry and compete with the DMB. The liberalization of markets opened
opportunities for wider participation by communal farmers in urban markets and a movement
from the hub and spoke system that predominated (Muir-Leresche and Muchopa, 2006). The
liberalization created opportunities for farmers to participate in emerging value chains including
dairy that were previously dominated by large scale commercial farmers. However, there are
other factors that limited participation in value chains like dairy. These included the capital
intensive nature of the dairy value chain. For smallholder dairy farmers, this was mainly to be
achieved through the smallholder Dairy Development Programme (DDP).
Page 20
4
Within the context of the smallholder DDP, it may be necessary to define a smallholder farmer.
This is necessary given the current agrarian structure post the fast track land reform and
distribution programme implemented from the year 2000. The large scale commercial, small
scale commercial, old resettlement and communal were the main farming systems based on
tenure in the first two decades of independence. The fast track land reform and redistribution
programme in the 2000s resulted in two additional forms of farming systems, the A1 and A2
models. The A1 model is basically similar to the communal, while the A2 model resembles the
large scale farming system. Dube (2006) defines smallholder dairy farmer as any farmer in the
small scale commercial, resettlement or communal area with interest and capacity to undertake
market oriented dairy production. In this study, smallholder dairy farmer refers to market
oriented dairy farmers located in the small scale commercial, old resettlement and communal
areas, particularly where there have been dairy schemes meant to mobilize the milk for marketing
within the context of DDP.
The DDP was started by government in 1983 with the mandate to spearhead the development of
organized smallholder dairy value chains in communal, small-scale commercial, and
resettlement areas. The objective of the programme was to improve the incomes and living
standards of rural communities. This was to be achieved using milk as a tool for development
(DDP, 2010).
The main thrust of the DDP was to develop dairy value chain marketing infrastructure through
setting up milk collection centres (MCC) and to train and advise smallholder dairy farmers. The
programme sought to improve the dairy value chain within the existing farms and socio-
economic systems of the smallholder farming systems. Pilot DDP schemes and MCC were
established at Marirangwe Small Scale Commercial Area in 1983 and Chikwaka Communal
Area in 1985, respectively. Over the years, the number of schemes has grown to the total of 28
Page 21
5
located throughout the country. About four of the diary schemes supply milk to private
processors, while the rest process the milk into various products sold to the local communities
(DDP, 2007). This implies that four of the smallholder dairy schemes are linked to the modern
high value chains that supply the main urban and export markets, while the rest are linked to
informal and semi-formal value chains that primarily supply local markets.
As part of the development of the smallholder dairy schemes, farmers were required to organize
and constitute themselves into formal bodies for purposes of being accountable to their group
members, Dairy Board and to Government (DMB, 1988). Farmers initially organized themselves
as farmer associations. The associations were to be registered with the Dairy Marketing Board
(DMB) as a single producer (DMB, 1988). However, in order to access funding from donors and
financial institutions required that the farmers organized themselves along business lines. As a
result, the associations transformed to form farmer organized and managed milk marketing
cooperatives. The role of the marketing cooperatives are to collect the milk produced by
individual farmers in the dairy scheme for delivery to processors, or participate in the processing
of the milk at the milk collection centre and selling the products to consumers. The milk
marketing cooperatives are managed by a management committee selected by member farmers.
Some of the schemes have been financially weaned off in terms of management of operations
by DDP and are now managed fully by farmer organized milk marketing cooperatives. There
are some schemes that are financially self-sustaining, while others still rely on DDP for financial
assistance. DDP in turn has received most of the funding for its activities from the government
and donors. However, given the limited government financial resources and competition from
other projects and programmes, the DDP has received less funding from government through
the public sector investment programme (Munangi, 2010). Donors on the other hand have
reduced or scaled down funding for smallholder dairy. Although the DDP has over the years
Page 22
6
received funding from various donors such as the European Union, Africa Now, Norwegian
Agency for Development Cooperation (NORAD) and others, some of the schemes have failed
to be financially sustainable without donor or government support yet there are requests to DDP
for more schemes to be formed nationwide. The failure of the schemes to financially sustain
themselves raises major questions on the sustainability of the dairy value chains developed
within the context of the smallholder farming system.
The study focuses on the production and marketing components of the organized smallholder
dairy value chains in Zimbabwe. It will contribute to the formulation of new economic models
of smallholder dairy development given advances in new farming techniques and technologies
to enhance the contribution of the subsector to national economic development. The study
investigates scenarios for smallholder dairy production and marketing through simulation
modeling. In particular, the concept of animal production and forage research centres (Titterton
and Maasdorp, (1997), as cited by Ngongoni (2012)), and its potential contribution to organized
smallholder dairy value chains will be assessed, but with modifications. The animal production
and forage centre will cater for two constraints that have been identified as limiting smallholder
dairy; feed resources and management (Ngongoni et al., 2006; Cain et al., 2007;
Chinogaramombe et al., 2008; Kabirizi et al., 2009). The objective of the centre will be to
improve management of smallholder dairy production in terms of nutrition and animal
management, respectively. The concept will be introduced at the milk collection centre. The
objective of the forage section of the centre will be to develop a centre where forage is produced
and conserved under management. An ex-ante assessment and evaluation of the model will be
performed and if proved viable, will constitute a new model for smallholder dairy development
in Zimbabwe and the whole of the Southern Africa region.
Page 23
7
1.3 Statement of the Problem
In Zimbabwe milk mainly moves from producers to consumers through various value chains that
vary depending on production system. Generally, the large scale commercial farmers participate
in the more modern and lucrative value chains that link producers with urban markets, while
smallholder farmers participate in informal and semi-formal value chains that primarily serve
local markets. In order to correct this dualism in the dairy industry, and promote the growth with
equity objective, the new post-independence government established the smallholder dairy
development programme in 1983 (Government of Zimbabwe, 1987). This was meant to
encourage smallholder black producers to participate in the formal value chains that were
previously dominated by white large scale commercial farmers. However, it is now 31 years
since the establishment of the first smallholder dairy scheme, but smallholder dairy value chains
have failed to make significant impact and only contribute 5% of the milk entering the formal
value chains. This is in contrast to countries like Kenya where 80% of the milk entering formal
markets comes from smallholder farmers (Moll et al., 2007).
Khombe and Sibanda (2006) contend that most of the initial research in smallholder dairy
focused on gaining an understanding of constraints and potential opportunities since smallholder
dairying was a new production system. Over the years feed has been identified as one of the
most important constraints limiting smallholder dairy production (Hanyani-Mlambo et al., 1998;
Mupeta, 2000; Francis and Sibanda, 2001; Ngongoni et al., 2006; Chinogaramombe et al., 2008).
Hanyani-Mlambo et al., (1998) performed one of the few studies on the socio-economic aspects
of smallholder dairying in Zimbabwe. The study used gross margin analysis at farm level to
show that smallholder dairying was hardly economically viable. However, Mupeta (2000) study
showed the opposite that smallholder dairy was economically viable. The studies showed the
effects of problems arising from limited markets, narrow product base, recurrent droughts and
stringent economic reforms. One can infer that the effect of these identified constraints has been
the low participation of smallholder farmers in the formal value chains for milk and dairy
Page 24
8
products. Jaffee et al., (2011) recognizes the importance of production costs as one, but not the
only element influencing the participation of small scale producers in value chains to high value
markets. In the context of the value chains, it is important to therefore consider the range of
services and activities that are required to bring a service or product from initial conception to
sell in formal markets whether these are local, national, regional or international. The value chain
approach can therefore play a significant role in characterizing complex networks, relationships
and incentives that exist in a livestock system (Singh and Meena, 2012).
The failure of smallholder dairy production and marketing in Zimbabwe to make any meaningful
contribution to national milk output is the main motivation of this study. Given current trends
on hygiene and quality issues in food and the environment in local, regional and international
markets, there are concerns that smallholder farmers may be excluded from participation in the
globalised value chains. There is therefore need for a comprehensive and detailed study on
organized smallholder dairy value chains in Zimbabwe in order to understand why this sector
has failed to make significant impact and meaningful contribution to milk entering the organized
value chains.
1.4 Research Focus
This section gives the focus of the research in terms of objectives, research questions, and
hypotheses.
1.4.1 Objectives of the Study
The overall objective of the study was to determine factors influencing milk production and
marketing in the organized smallholder dairy value chains.
The specific objectives were to:
1. Analyze the trends in smallholder milk production and marketing including the effect of
policies since the introduction of the smallholder dairy development programme in 1983;
Page 25
9
2. Determine the main factors influencing milk production in the smallholder dairy value
chain;
3. Analyze the factors affecting milk market participation in the smallholder dairy value
chain;
4. Determine ex-ante the potential effect of introducing an animal production and forage
centre in the smallholder dairy value chain; and
5. Assess the role of farmers’ cooperatives in the commercialization of milk in the
smallholder dairy value chain.
1.4.2 Research Questions
The study answers the following research questions:
1. What are the trends and the effect of policies in smallholder milk production and
marketing since the introduction of the smallholder dairy programme in 1983?
2. What are the main factors influencing milk production in the smallholder dairy value
chain?
3. What are the factors affecting milk market participation?
4. What is the ex-ante potential effect in the value chain of introducing an animal production
and forage centre in the smallholder dairy value chain?
5. What is the role of farmers’ organization through milk marketing cooperatives in the
smallholder dairy value chain?
1.4.3 Study Hypotheses
The following hypotheses guide the study:
1. Household socio-economic factors such as age, sex, dairy farming experience and
agricultural training of the head of household, distance to the milk collection centre, total
size of arable land available to the household, cost of concentrates, household size,
Page 26
10
number of milking cows and the type of value chain the farmer is supplying do not
influence milk production in the smallholder dairy value chain;
2. Socio-economic factors such as total number of dairy cows owned by the household,
distance to the milk collection centre, educational level, age and sex of the head of
household, household size, dairy farming experience, size of land holding of the
household, access to information and extension, income from other sources, occupation
of the farmer, agricultural training of the head of household and the agro-ecological
region location of the smallholder dairy scheme do not affect milk marketing
participation and volume of sales to the milk collection centres of the smallholder dairy
value chain;
3. The animal production and forage centre is not a profitable intervention to milk
marketing cooperatives in the smallholder dairy value chain; and
4. Commercialization of milk sold through milk collection centres is not influenced by
participation in activities of farmers’ organization through the milk marketing
cooperatives, access to credit, producer price of milk, access to information and access
to markets by smallholder farmers through the farmer milk marketing cooperatives.
1.5 Justification
Demand for milk and milk products in Zimbabwe are estimated at 120 million litres per annum
(National Association of Dairy Farmers, 2011). About 50% of this is met through local
production, with smallholder farmers contributing about 5% (DDP, 2010). The country is
currently importing milk to meet the growing demand for milk and milk products, yet the
potential exists to increase production and marketing from the smallholder sector. In Kenya, for
example, more than 600,000 smallholder farmers with one and three cows produce 80% of
Kenya’s milk (New Agriculturist, 2004). This shows that other countries in sub-Saharan Africa
that share the same historical background with Zimbabwe have managed to develop smallholder
Page 27
11
dairy alongside large scale dairying. This therefore calls for a comprehensive value chain
analysis/study to gain an understanding of why the smallholder dairy value chain has failed to
grow. Abdulai and Birachi (2008) noted that in sub-Saharan Africa, structural adjustments
programs have resulted in reduced levels of intervention by the state in food markets to improve
efficiency and marketing services. However, they noted that smallholder farmers still find it
difficult to participate in markets because of a range of constraints and barriers that reduce
incentives for participation. These constraints include accessibility of markets, access to
improved genetics, inputs and others, to mention but a few.
This study is important to many of the stakeholders who have an interest in the smallholder dairy
value chain. These include the smallholder farmers, government, processors and all support
services including input suppliers, finance, extension and training. The study is particularly
important to smallholder farmers as the results can facilitate improvements that are necessary
for enhanced market participation and increased volumes supplied to the market. The study is
important to government as the results would give an indication of the policies that can be
enacted to enhance participation of smallholder farmers in the dairy value chain. The study is
important to processors as it can give an indication in terms of the support the private sector can
give in order to improve milk intake from the smallholder farmers.
1.6 Organisation of the Study
This study is organized into nine chapters. Chapter One introduces the study and presents the
statement of the problem, objectives and hypotheses of the study. Chapter Two reviews the
literature on value chains and empirical studies on production and marketing, while Chapter
Three outlines the research methods. Chapter Four outlines the development of smallholder dairy
during the period 1983 to 2013 and assesses the effects of policies during the period. Chapter
Five presents the results and discussion of factors influencing milk production within the context
Page 28
12
of the overall smallholder dairy value chain. Chapter Six presents results and discussion of
factors affecting milk marketing participation and volume of milk sales to the Milk Collection
Centres (MCC) of the smallholder dairy value chain, while Chapter seven presents results and
discussion of the proposed animal production and forage centre in terms of willingness to pay
for the construction of the centre and services provided by the centre and assesses the benefit
cost of such a centre. Chapter Eight highlights the role of the farmer milk marketing cooperatives
in the smallholder (SH) dairy value chain, farmer perceptions of production and marketing
constraints and the contribution of the cooperatives to milk marketing. Chapter Nine summarises
the main results of the study, conclusions and recommendations.
Page 29
13
CHAPTER TWO: LITERATURE REVIEW
2.1 Introduction
The literature review firstly deals with the definitions of value chains and describe what value
chain analysis encompasses. This gives an understanding of the context of value chain in which
milk production and marketing in organized smallholder dairy value chains has been studied.
This is followed by empirical studies of milk production and marketing that have been performed
around the world, studies from Africa and the sub-region and lastly the literature on Zimbabwe.
2.2 Value Chains and Value Chain Analysis
According to Weber and Labaste (2010) chains composed of companies (or individuals) that
interact to supply goods and services are variously referred to as productive chains, value chains,
filieres, marketing chains, supply chains or distribution chains. These concepts are said to vary
in their focus on specific products or target markets or in the activity that is emphasized and the
way they have been applied. Although there may be some differences in the concepts such as
supply and value chains, it is important to note that what these have in common is that they seek
to capture and describe the complex interaction needed to deliver value to end users (Weber and
Labaste, 2010). The livestock value chain has been described as the full range of activities
required to bring a product (e.g. live animals, meat, milk, eggs, leather, fiber, manure) to final
consumers passing through the various phases of production, processing, and delivery (The
Donor Committee on Enterprise Development , 2007) . The Donor Committee on Enterprise
Development (2007) further adds that value chain can also be defined as a market focused
collaboration among different stakeholders who produce and market value-added products.
Kitaw et al. (2012) describe a market chain as referring to the system that consists of actors,
organizations, relations, functions and product, cash and value flows that make possible the
transfer of goods and services from the producer to the final consumer. The value chain concept
was first introduced by Porter (1985) in the book “Competitive Advantage: Creating and
Page 30
14
Sustaining Superior Performance”. Since then, the concept has been applied in diverse fields,
including agriculture. Value chains therefore invariably include direct actors who are
commercially involved in the chain (producers, traders, retailers, consumers) and indirect actors
who provide services or support the functioning of the chain. The value chain can either be
simple when producers sell directly to consumers and complex when actors play roles in buying,
processing and selling to the end user (Kitaw et al., 20102).
According to Bellu (2013), depending on the scope of the study the focus of the study can be
activities or on the agents since the term value chain refers both to a set of interdependent
activities and to a group of vertically linked economic agents. This study focusses on the
activities of producers, within the context of the organized value chains the producers participate
in. A value chain includes all the economic activities undertaken between the production and
consumption phases such as processing, delivery, wholesaling and retailing, starting with the
production of the primary commodity and ending with the consumption of the final product
(Bellu, 2013). According to Kitaw et al., (2012) farmers may choose to supply a specific segment
and produce the crop or animal product that is tailored to that segment. It is within this context
that smallholder dairy producers may also produce milk to supply specific segments of the value
chain, or depending on circumstances, may participate in organized value chains that supply
specific segments of the value chain.
Value chain analysis, on the other hand, examines the full range of activities required to bring a
product or service from its conception to its end use, the firms that perform these activities in a
vertical chain and the final consumers (The Donor Committee on Enterprise Development,
2007). According to Porter (1985) value chain analysis describes the activities within and around
an organization and relates them to an analysis of the competitive strength of the organization.
Therefore, it evaluates which value each particular activity adds to the organization products or
Page 31
15
services (Porter 1985). Porter (1985) further distinguishes between primary and support services.
Kaplinsky and Morris (2000) state that in its simplest level, value chain analysis plots the flow
of goods and services up and down the chain , and between different chains. The value chain
analysis framework has therefore been used by governments and donors to devise intervention
strategies that benefit the whole value chain. According to Weber and Labaste (2010) value chain
analysis can shed light on the size of the firms participating in each link, how they are
participating or could participate in the chain, and opportunities to facilitate or improve those
linkages. Weber and Labaste (2010) further note that value chain analysis is particularly critical
in agriculture where governments and aid agencies are confronted with challenge of including
small farmers in modern value chains so that they can benefit from globalization of markets.
Bellu (2013) indicates that value chain analysis is the assessment of a portion of an economic
system where upstream agents in production and distribution processes are linked to downstream
partners by technical, economic, territorial, institutional and social relationships.
This study considers the value chain framework within the context of how smallholder farmers
can benefit from participating in the chains. IFAD (2010) notes that value chain analysis is
essential for markets, their relationships, the participation of different actors and the critical
constraints that limit the growth of livestock production and consequently the competitiveness
of smallholder farmers. According to Bellu (2013) the effects of policies targeting specific
production processes extend their primary impacts in the economic system according to the same
path as the main inputs and outputs. In smallholder dairy, policies can be targeted at production
and marketing processes, which are key to smallholder participation in various value chains.
Bellu (2013) further notes that analyzing impacts of policy options through value chains provides
decision makers and other stakeholders with anticipated evidence on likely changes directly
induced by policies. In this study, it is therefore critical to analyse the determinants of
smallholder participation in organized value chains in order to understand the constraints and
Page 32
16
opportunities that exist, and identify interventions in order to upgrade the value chains so that
they can significantly benefit smallholder farmers. According to Rich et al., (2009) the value
chain approach provides basic understanding needed in designing and implementing appropriate
development programs to support smallholder market participation.
Kaplinsky and Morris (2000) highlight that in order to perform value chain analysis it is
important to identify the entry points. These points of entry can vary depending on primary area
of research interest. If the primary area of research interest is the agricultural producers, then the
point of entry can be the farm, and the value chain mapping can be performed forwards to
processors, buyers and their customers and backwards to inputs suppliers. Kaplinsky and Morris
(2000) also highlight that the key elements of value chain analysis are the barriers to entry and
rent, governance and the different types of value chains. In terms of the different types of value
chains they distinguish between buyer-driven chains and producer-driven chains. GTZ (2008)
groups the different methods comprising value chain analysis into three basic tasks of value
chain mapping, quantifying and describing value chains in detail and economic analysis of value
chains and benchmarking. According to GTZ (2008) the most important essential method and
core of any analysis is value chain mapping. Building on a value chain map, additional analysis
may become necessary, depending on the information needs. This study focuses on milk
production and marketing within the context of organized value chains in Zimbabwe. The
literature review on value chains and value chains analysis therefore provide the framework of
the various issues that the study needs to take into consideration. According to McDemott et al.,
(2010b) value chains are a useful way of holistically assessing the potential market opportunities
that exist for smallholders as well as highlighting the various technical, economic and
institutional constraints that public policy may need to address.
Page 33
17
Kitaw et al., (2012) describe the value chain as consisting of producers at one end, that is, the
farmers who grow the crops and raise the animals. At the other end are consumers who eat, drink
and wear the final products. In the middle are many individuals and firms each performing one
small step in the chain; transporting, processing, storing, selling, buying, packaging, checking,
monitoring and making decisions. Kitaw et al., (2012) further indicate that the value chains
include a range of services needed to maintain its function including technical support
(extension), business enabling and financial services, innovation and communication, and
information brokering. Kaplinsky and Morris (2000) point out that value chains are complex,
particularly in the middle tiers because individual firms may feed into a variety of chains. They
indicate which chain(s) are to be the subjects of enquiry therefore very much depends on the
point of entry for the research inquiry. Further, the point of entry defines which links and which
activities in the chain are to be the subjects of special enquiry. This context is important in the
consideration of empirical studies. Following on these observations, the literature on smallholder
dairying is dominated by studies on participation in the market. This is important because
without participation in the market, smallholder farmers cannot benefit from the organized value
chains. Participation is also important as there are concerns about the exclusion of smallholder
farmers from the value chains. According to Mendoza and Thelen (2008) there are concerns that
smallholder producers are often excluded from participation in value chains since they usually
lack access to credit, make limited investments in their human capital (including skills and
entrepreneurship training) and are isolated by distance from the market. It is because of these
observations therefore, that most of the studies on smallholder dairy production and marketing
have focused on various parts of the links of smallholder farmers in the value chains.
2.3 Empirical Studies on Smallholder Dairy Production and Marketing
This section presents the literature review on smallholder dairy production, in terms of factors
influencing milk production in organized smallholder dairy value chains. Empirical studies are
Page 34
18
also reviewed on factors affecting milk market participation and volume of sales, feed resources
and smallholder dairy production, and farmer organization and commercialization of
smallholder dairy.
2.3.1 Factors Influencing Dairy Production
Throughout the world, a number of studies have been performed focusing on several aspects of
the smallholder dairy value chain. The following section gives studies that focused on production
aspects particularly from Asia and Latin America. Some of the studies assessing constraints to
production used participatory methodologies. Gomez et al. (2007) performed a study with the
objective of characterizing a group of smallholder dairy producers in central Peru to determine
the most limiting factors affecting animal productivity. They used participatory rural appraisal
methodologies and collected information on biological and socio-economic factors. The study
results showed that observed inappropriate nutrition, animal health and reproduction in the study
sites were the major factors affecting productivity. The study also observed that the feeding
programme for lactating and growing cows using forage that was exchanged for labour and
purchased concentrates did not theoretically or practically meet the needs of the cows.
Shamsuddin et al., (2007) also used participatory rural appraisal tools such as social mapping,
semi-structured interviews, activity profiles, seasonal calendar, pie charts, mobility diagram,
matrix ranking, preference ranking and scoring, systems analysis and focus group discussions.
These were used to assess the resources, challenges and prospects for dairy enterprises. The
results showed that fodder availability increased milk production and decreased incidences of
disease. Friesian crossbred cows were ranked best as dairy cattle and utilization of veterinary
and artificial insemination (AI) services were ranked highly. The studies by Gomez et al., (2007)
and Shamsuddin et al., (2007) while appropriate in the study of smallholder dairy enterprises
only offered qualitative information in the identification of the constraints. They did not include
quantitative analysis of the factors influencing dairy production.
Page 35
19
Quantitative analysis is necessary to identify factors influencing milk production in smallholder
dairy value chains. Unlike the large scale commercial farms where the major determinant of milk
production is the profitability of the enterprise, production in the smallholder farms is influenced
by various socio-economic factors that affect production decisions. In a study in Bangladesh,
Sultana et al., (2016) used general linear model to understand the socio-economic determinants
of milk production. The socio-economic predictors included in the model were the age of the
household head, farming experience, training and off-farm income. The general linear model
results showed that age of the farmer, off-farm income and training had a negative influence,
whereas farming experience had a positive impact on milk production (Sultana et al., 2016).
Wanjala et al., (2014) performed a study to assess variables influencing milk production in
Butula and Butere districts in Western Kenya. They used multiple regression analysis to assess
the value chain predictors of milk production on smallholder dairy farms using data collected
from a sample of 400 smallholder dairy farms. The results show that the most important
predictors explaining the variations in milk production were fodder, dairy meal, research
technologies, credit, group membership, artificial insemination and policy. They conclude that
the results obtained suggest that multiple regression analysis may provide a rigorous and
quantitative tool in selecting important variables ex ante in an upgrading strategy since it goes a
step further beyond the current qualitative approaches. Tanwar et al., (2015) used multiple linear
regression and the results showed that concentrate and green fodder were the main significant
variables which were affecting the returns from milk.
Birthal et al., (2016) collected survey data from 612 households in Punjab state in India to
evaluate farmers’ choice of dairy value chains and their financing mechanisms. The determinants
on farmers’ choice of value chains and their impact on farm performance were assessed using a
multinomial treatment effect model. The results of the first stage multinomial treatment effects
Page 36
20
model indicated the coefficient of herd size was positive, indicating that relative to those engaged
in direct sales to consumers, the probability of associating with formal value chains was higher
for large dairy farmers. The results also showed that farmers with smaller herds tend to sell milk
to consumers than formal buyers. Households with larger landholdings also had relatively higher
probability of being associated with formal value chains. The findings implied that modern value
chains – cooperative, multinational corporations and private domestic processors tend to source
milk from those who have a larger endowment of land, as well as animals, or resources-rich
farmers (Birthal et al., 2016). While this study did not directly measure the determinants of milk
production to supply specific value chains, the analysis implies choice of value chain was
indirectly based on volumes of milk produced since formal value chains were associated with
resource-rich farmers. Farmers with larger herd sizes had higher probability of associating with
formal value chains, which implies a higher milk production from the cow herd size. The number
of milking cows therefore can be considered a factor that affects milk production and choice of
value chain in this case.
Mumba et al., (2012) performed an econometric analysis of socio-economic factors affecting the
profitability of smallholder dairy in Zambia. They used multiple regression analysis with data
from a cross sectional survey of 157 farmers. The findings indicated that the level of education,
dairy cow herd size and distance to the market significantly affected profitability of smallholder
dairying in Zambia. Although this study focused on determinants of profitability, the profitability
is a function of the level of production and the costs of production incurred by farmers. The
factors affecting profitability can also affect the production of the enterprise. Kabirizi et al.
(2009) performed a study in Uganda to assess the profitability of improved forage technologies
and factors affecting use of improved forage technologies among smallholder farmers in Soroti
district. The study was performed through participatory on farm trials. The study used regression
analysis and the results indicated that the number of cows kept, input costs, age of household
Page 37
21
head, and distance to market were key factors influencing profitability levels obtained by farmers
using improved forage technologies and those not using improved forage technologies. The
results also showed that profitability and improved cattle breeds had complimentary effects on
the decision to use improved technologies. While this study was not specifically meant to assess
the factors that affect milk production, it shows some of the factors that influence milk
production in smallholder dairy such as improved cattle breeds, the costs of inputs, access to
improved forages and socio-economic characteristics of households such as the age of household
head.
The various studies reviewed indicate a number of socio-economic factors that can affect milk
production in the smallholder dairy value chains, although they used different analytical
approaches. Following on Wanjala et al., (2014), this study hypothesizes that the main factors
influencing milk production in the smallholder dairy value chain are the characteristics of the
head of household (such as age, agricultural training and experience), size of landholding owned
by the household, number of milking cows, access to markets (as indicated by the distance to
market), and the type of value chain supplied by the farmer (formal or semi-formal value chain).
2.3.2 Feed Resources and Smallholder Dairy Production
Alejandrino et al., (1999) in a study to identify constraints to productivity at the smallholder
level in the Philippines used survey data collected for dairy cattle production gathered in two
sites. Crossbred cows were monitored for milk production, feed intake and availability,
reproduction and health status. The results showed that a long calving interval (CI=>400 days)
was the major constraint to productivity on smallholder farms. The study also highlighted the
importance of estrus detection, good breeding management, and use of a strategic nutritional
supplementation particularly during stressful periods in the cow’s reproductive life. Suzuki et
al., (2006) described the productivity and socio-economic profile of dairy farmers in northern
Page 38
22
Vietnam taking into account regional differences in rural smallholder communities which had
been targeted by a government dairy development policy through a questionnaire field survey.
They used two stage clusters sampling in order to select households for the study. The analysis
performed mainly focused on descriptive statistics to explain the differences between the three
farming household groups. The results indicated that there were differences in relation to basic
management practices such as effective utilization of agricultural byproducts for feeding and
hygiene practices.
These studies (Alejandrino et al., 1999; Suzuki et al., 2006) illustrate the major constraints cited
as having a strong effect on smallholder dairy. Feed resources or feeding regimes are cited as
one of the major constraints. The question that arises in the context of smallholder dairy value
chain is how feed and forage resources can be made available to farmers in order to improve the
viability of smallholder dairy. In a study to assess the critical factors affecting the viability of
small scale dairy in the Punjab region of Pakistan Cain et al., (2007) showed the effect of
widening access to credit on uptake of new technology and poor livestock management. This
was done using linear programming to investigate the profitability of alleviating these
constraints. The results showed the synergies between using better, well managed dairy
livestock, increasing uptake of simple technological improvements and widening access to
credit. In Australia Chapman et al., (2010) used farm system simulation modeling to study dairy
systems that rely on pasture to supply between 50 to 70% of total herd feed requirements
annually. They concluded that agronomic research for the Southern Australia industry should
focus on low cost ways of supplying grazeable feed in summer, since current forage species for
this time of the year are limited.
Feed is one of the most important components of smallholder dairy production. Access and
availability of year round feed is critical for the success of the dairy enterprise, and determining
Page 39
23
the viability of smallholder dairying. According to Devendra (2001) the major constraints to
dairy production includes choice of species, breeds and availability of animals, feed resources
and improved feeding systems, improved breeding, reproduction and animal health care,
organized marketing and market outlets. The FAO (2017a) indicates that smallholder dairy
production can vary significantly according to the location, agro-ecological zone and socio-
economic conditions. These factors determine production and whether dairying can be viable for
smallholder dairy producers.
Mburu et al., (2007) performed a cost benefit analysis of smallholder dairy cattle in different
agro-ecological zones in the Kenyan highlands. The study was carried out in three agro-
ecological zones and the survey showed that the dairy enterprise was the most important income
generating activity in 96% of the households in the Kenyan highlands. A one way analysis of
variance performed showed there were no significant differences between the arithmetic means
of the costs of production for the three agro-ecological zones. However, the arithmetic means of
unit profit were significantly different between the lower and upper highlands, and this was
attributed to milk prices offered by traders. Hussain et al., (2014) performed a study on the
economics of major breeds of dairy cows in Pakistan, in which shares of different feed resources
in total feeding were determined and cost benefit analysis of milk production by ecological zone
was conducted. Concentrate feeding was the main cost item for cow milk production in irrigated
areas of Sindh, and constituted more than half (54%) of the total feeding cost per annum while
in the Azad Jammu Kashmir wheat straw was the major cost item constituting 51 to 58% of
feeding costs per annum. Cow milk production was a profitable farming activity in the irrigated
areas of Sindh and the mountainous Azad Jammu Kashmir with benefit cost ratios of 1.5 and
1.4, respectively. Somda et al., (2005) study in the Gambia also showed that milk production
was viable, but constraints to increased productivity included lack of improved technology at
farm level and weak institutional support. A study by Mdoe and Wiggins (1997) in Tanzania
Page 40
24
used a herd model and carried out a benefit cost analysis of dairying. The study showed that
there was no difference in returns gained by larger scale farmers who had grade cattle and
managed them intensively compared to those who were using less intensive systems with
potential stock. According to Chamberlain and Wilkinson (2002) milk production is determined
by the genetic potential of the cow, her nutrition and her state of health. Chamberlain and
Wilkinson (2002) further highlight that of these three factors, nutrition is the most important: it
is within the direct control of the farmer, it has profound influence on production in the health
animal, it is easy to change and it represents the largest single variable cost.
The studies reviewed show that although smallholder dairying is viable and profitable, feed
resources remain one of the most important constraints constituting more than 50% of the total
cost of producing milk. Improved forage technologies are one way to improve the nutritional
status and milk production in smallholder areas. Studies have been performed to assess the
profitability of improved forage technologies (Kabirizi et al., 20090. Gwiriri et al., (2016) study
in Zimbabwe concluded that use of forages can be a cost effective feed level intervention to
optimize income in small scale dairy by reducing the cost of producing a litre of milk. Kavana
and Msangi (2005) performed a study to evaluate the potential feed resources in smallholder
dairying in eastern zone of Tanzania. The results indicated that pasture and forage plants
available could support milk production at a level of five to six litres per cow per day. However,
it was envisaged that seasonal decrease in milk production was caused by the low availability of
forage (< 30kg/cow/day) during scarcity periods. Kavana and Msangi (2005) recommended that
there was need to develop supplementary feeding strategies to increase smallholder milk
production and consequently reduce the gap between actual and potential milk produced by
crossbred dairy cows.
Page 41
25
The question that arises in the context of smallholder dairy value chains is how feed and forage
resources can be made available to farmers in order to improve milk production and the viability
of smallholder dairy. The concept of animal production and forage centre has been suggested
(Titterton and Maasdorp, 1997; Ngongoni, Personal Communication, 2012). According to
Devendra (2001) improved feeding systems that ensure optimum performance, efficient and low
cost milk production need to consider the following components: feed availability and feeding
systems; seasonality of production; basal roughage resource; access to these feeds; and extent of
use of feed resource from the farm. Devendra (2001) indicates that the principal aim should
therefore be to address improved breeding and nutrition in which the objective is maximum use
of available feed resources, notably crop residues and low quality roughages, and also maximize
use of leguminous forages as supplements. While it might be difficult to get an improved system
that caters for all the components suggested by Devendra (2001), the animal production and
forage centre includes a forage section that specifically aims to provide improved forages to
smallholder dairy farmers. A study by Mugabe et al., (2016) shows that bagged silage had the
potential to last for at least a year without deterioration in quality, and farmers showed a
willingness to buy the bagged silage if available in the market. The forage section of the animal
production and forage centre can therefore make the silage available to farmers throughout the
year in order to increase milk production in the smallholder dairy sector.
The animal production section of the animal production and forage centre can also explore ways
of improving breeds through improved use of artificial insemination technologies in smallholder
dairying. McDermott et al., (2010a) report that combining genetic and feed improvement has led
to productivity gains of up to 300% in smallholder systems in sub-Saharan Africa. Bebe et al.,
(2008) also report that interventions on feeding and breeding have to be packaged together
holistically if intensification is to enhance productivity. The concept of the animal production
and forage centre integrates the provision of improved breeding services through the animal
Page 42
26
production section and improved feeding and forages through the forage section of the centre.
An appropriate institutional setting has to be identified to provide these services. According to
McDemott et al., (2010b) improved input supply linkage to knowledge, financial and market
services, and integrating these services into the initial assembly and distribution services has
been important in the development of smallholder dairy sector in South Asia, East Africa and
Latin America. The original models under which these services have been provided have varied
from cooperatives through to contract farming arrangements with multinational companies
(McDermott et al., 2010b). There is therefore potential to integrate the animal production and
forage centre with farmer oganisations in Southern Africa in order to realize the benefits of
improved breeding and forage resources in smallholder dairying.
This study therefore hypothesizes introducing an animal production and forage centre to be
located near to primary producers at the milk collection centre. This centre will commercially
produce forage for sale to farmers under the forage section. The animal production and forage
centre overall is expected to improve profitability of the smallholder dairy through making
available improved feed and forage, extension and artificial insemination services.
2.3.3 Factors Affecting Milk Marketing Participation and Volume of Sales
Studies on smallholder dairy marketing highlight the importance of various marketing channels
used by farmers and factors influencing the choice of market outlet. Sharma et al., (2009) studied
the dairy industry in India in response to structural transformations that were taking place in the
Indian dairy sector mainly in the processing segment. They examined determinants of market
channel choices based on a survey of households. Data were analyzed using a two stage
multinomial logit model employed to investigate determinants and effects of market choice of
milk producers. Results of this study showed that while modern marketing channels have
emerged in the Indian dairy sector, the traditional sector is still dominant. The dominance of the
Page 43
27
traditional channel was explained as an indication of very competitive and cost-effective
traditional market in linking producers and consumers. The results of the first stage showed
household socio-economic variables (herd size, age, and education) were important determinants
of marketing choice in the case of the modern private sector. In addition, marketing infrastructure
such as roads, provision of veterinary services, distance from milk collection centre and price
risks were found to have a significant effect on famers’ marketing choices. The second stage
results of the Heckman model showed that education, membership of producer associations,
cooperatives, provision of veterinary services and herd size had significant impact on
cooperative marketing channel farmers’ income while in the case of the modern private sector,
education and price risk had significant impact on income. However, the results also showed
that small dairy farmers and the poor were mostly excluded from organized modern private
sector channels.
In another study in India, Birthal et al., (2008) generated information through field surveys in
the western state of Rajasthan. The study was an empirical assessment of benefit and costs of
contract farming and vertical coordination in the agri-food supply chain in smallholder dairy
farms. Birthal et al., (2008) used a standard treatment effects model in the study. In the first step,
a logit model was estimated to identify the factors that influence a producer’s decision whether
to participate or not in contract farming. Producers’ experience, educational attainment,
endowments of land, dairy stock, and access to non-farm income sources were considered to be
important factors influencing the decision to participate in contract farming. In the second step,
a standard effects model was estimated using predicted probabilities from the logit model as an
instrumental variable, with profit per unit of output as the dependent variable. Besides
participation in contract farming, it was also expected that education, as well as the ratios of
fixed capital per animal and labor availability per animal could be important determinants of
farm profits. The results showed contract farming was found to be more profitable than
Page 44
28
independent production, and that the major benefits came from reduction in marketing and
transaction costs, which were otherwise much higher in the open markets.
In another study in India, Staal et al., (2006) used a two-step analysis to explain milk market
participation and conditioned on participation, milk market choice and their determinants in
Gujarati. These steps included a simple probit model to assess market participation, followed by
the application of McFadden choice model using conditional (fixed-effects) logit. This was
performed to analyze data from a survey of households who reported selling milk to one of three
market channels which were individual customers, private traders and dairy cooperatives or
processors. The results of the probit analysis showed that variables that were positively
associated with the choice to sell milk were households who were non-tribal and were located in
a Bharatiya Agro Industries Foundation supported village, better agro climate, numbers of
buffalos and availability of milk collection centres locally. Variables not statistically significant
were sex of household head, human capital, household composition and land size. The results of
conditional (fixed-effects) logit which evaluated famers’ choice of milk marketing channel
indicated that farmers were less likely to select private traders when there was an option of selling
to individual customers. They also found that households were less likely to select the
cooperative or private processor channel compared to the individual customer channel, though
this was not statistically significant. The higher the number of adults in the household, the more
likely that private trader channel and cooperative/private processor channel would be selected
than individual customers. These results indicate some of the factors that may need consideration
in analyzing why farmers sell to organized value chains. Variables such as land size, agro climate
and availability of milk collection centres would be taken into account in this study.
An important issue that needs consideration in smallholder dairying is that of transaction costs.
According to Fabe et al., (2009) transaction costs are another factor for the integration of small
Page 45
29
scale farmers to value chains. These have the ability to limit access to markets for smallholder
farmers beyond locally available markets. Fabe et al., (2009) highlight that specialization and
fragmentation of production and processing activities imply that transaction costs will gain more
and more importance as part of the total costs of companies. Thus considering transaction costs
is essential to get a better understanding of value chains activities and international operations.
In Africa, a number of transaction cost studies have been performed but these have invariably
focused on market channel choices and participation in the markets.
Staal et al., (1997) used data from a survey of dairy cooperatives in Kenya and of dairy producers
in Ethiopia to document the importance of transaction costs. In the markets studied, different
producers faced different levels of transaction costs, depending on assets and information levels,
season and location. They responded to these deferential transaction costs by different sales
strategies. The model used regressed a given market outlet price against farm characteristics such
as dummy variables for season and location of farm, continuous variables for farm size, annual
rental value for land operated by the producer, and daily hours typically required for milk
delivery from the farm. Other variables included transaction characteristics such as typical
cash cost of marketing milk to this outlet, average daily milk sales to this type, and a dummy
typical cash cost of marketing milk to this outlet, average daily milk sales to this type, and a
dummy variable whether this outlet is a regular consumer of the farmer. Besides the daily cash
cost of milk marketing and daily hours of milk delivery variables that tended to be collinear and
were therefore dropped from the analysis, almost all other coefficients were statistically
significant at 10% or better. The study concluded that the size of the dairy operation and its
proximity to urban markets influence the products and market channels used by producers to
market dairy products.
Page 46
30
Holloway et al., (1999) explored the impact of household level transaction costs and the choice
of production technique on the decision of farmers to sell liquid milk to marketing cooperatives
using a sample of observations from the Ethiopian Highlands. Data were collected through
surveys, and the sample was stratified by whether household owned crossbred cows, participated
in the group activities, and their distance to the group or other local market where dairy products
could be sold. Covariates representing factors affecting production, consumption and marketable
surplus were assessed in order to determine the extent to which they influence the milk marketing
decision. The set of factors the study focused on were a modern production practice (cross bred
cow use), a traditional production practice (indigenous cow use), three intellectual capital
forming variables (experience, education, extension) and the provision of infrastructure (as
measured by time taken to transport milk to market). They computed estimates from a Tobit
specification of marketable surplus and used the estimates to draw policy conclusions. They
concluded that policy relevant variables having greatest impact on participation in fluid markets
are cow numbers, time taken to transport milk to the milk group, and visits by an extension agent.
Holloway et al., (2004) in a further article presents a revised Tobit procedure for mitigating bias
in the presence of non-zero censoring with an application to milk-market participation in the
Ethiopian highlands. The study concludes by questioning the conventional practice of assuming
zero to be the true point of censoring in Tobit regression. It further concludes that in devising
policy prescriptions, restricting the true point of censoring to zero may significantly overstate
the resources that are required for production. Although these studies analyzed the participation
of smallholder farmers in the milk market, they were not necessarily performed within the
context of organized value chains. This is an important aspect of this current study.
The Tobit model has also been used in other studies of market participation (Somda et al.,
(2005); Bellemare and Barrett, 2006). Somda et al., (2005) used the Tobit model study
transaction costs and the marketable surplus of milk in smallholder dairy farming systems of the
Page 47
31
Gambia. The factors affecting the amount of milk sold in the model included the farm’s
household socio-economic and demographic characteristics and regarding access to market that
had an implication for the transaction costs. The results indicated that the number of local cows,
access to market at the farm gate, and the distance to the nearest city increased the likelihood of
market participation by producers and the marketing of surplus of dairy products. The Tobit
model has mainly been used to study the marketed surplus which probably assumes that the
major goal of the household is first to meet its consumption requirements and sell the surplus. In
the case of the Zimbabwean smallholder dairy, the dairy schemes were set up specifically to
commercialize milk production. The major goal of the households’ participating in the organized
value chains is therefore to benefit from commercial milk production. A number of studies,
though not focusing specifically on milk, have provided evidence of smallholder market
participation and the role of transaction costs, and interventions that can facilitate smallholder
market participation (Key et al., 2000; Hollway et al., 2000; Barett, 2008).
A number of studies have also used the multinomial logit regression model to analyse factors
influencing choice of dairy market outlet by smallholder farmers, and multivariate regression
models to assess the level of market participation (Bardhan et al., 2012; Sharma, 2015; Mutura
et al., 2015). Others have also used the logit model (Kumar et al., 2011). Bardhan et al., (2012)
used multivariate regression model to study market participation behavior of smallholder dairy
farmers in Uttarakland. The results showed that milk production and extension contact were the
two most important variables favourably influencing intensity of market participation, while
distance to market negatively influenced likelihood of producers’ market participation. Sharma
(2015) used multinomial logit model to study determinants of small milk producers’
participation in organized value chains in India. The results indicated that small producers are
not excluded from cooperatives but are excluded from the modern private sector. Mutura et al.,
(2015) used multinomial logit regression to analyse determinants of market channel choice
Page 48
32
among smallholder farmers in lower central Kenya. The results indicated that level of education,
milk output, access to information and transaction costs influenced the choice of marketing
channel. There was also a positive relationship between choice of farm gate market over
cooperative societies and farmers’ training.
Abdulai and Birachi (2008) analyzed data collected from a survey of market participants in
Kenya. They used a multinomial logit model to estimate how the market agents’ choice of a
coordination mechanism can be predicted by the milk and marketing characteristics. The
empirical results from the estimation showed that the transaction costs component play a major
role in market agent’s choice of coordination mechanism in the fresh milk supply chain. In
particular, the results indicated longer distances to buyers and longer periods to sell milk
significantly favored the use of verbal and written contracts in producer transactions. The
findings suggested that state interventions that contribute to improvement in both physical and
economic infrastructure would be important in reducing transaction costs and facilitating trade
in the country. The studies reviewed indicate variables that need to be taken into account when
analyzing choice of market outlets and intensity of market participation. However, the structure
of the dairy value chains are different from those found in Zimbabwe. Smallholder dairy
producers in Zimbabwe mainly participate in organized dairy value chains through the
smallholder dairy schemes that were set up under the government supported dairy development
programme. Milk in these value chains is either processed at the milk collection centre or
delivered to main urban area based established processors. In terms of the farmers participating
in these value chains, there is limited choice of market outlet unless the farmer participates in
informal markets.
There are a number of studies that have used the Heckman two stage model to analyse factors
affecting milk market participation and volume of sales for milk, milk value addition and volume
Page 49
33
of milk value added ( Nga et al., 2012; Demissie, 2014; Kuma et al., 2014; Mamo et al., 2014;
Balirwa et al., 2016). Nga et al., (2012) used Heckman two stage model to analyze the situation
of milk production and marketing in Phu Dong, northern Vietnam. The results indicated that age
of the head of household, educational level, experience in dairy production, distance from milk
market and number of milking cows were significant in explaining the probability of the
household participating in milk markets. Factors that were significant in affecting milk sales
volume were number of milking cows, educational level of the head of household, and non-dairy
source of financial income. Kuma et al., (2014) study included 12 variables comprising
characteristics of the head of household (age, sex, educational level, dairy farming experience),
household characteristics (household size, number of children under six years), access to market
information and extension services, milk output, milk cow ownership, distance to the nearest
urban centre, and landholding size. Out of the 12 explanatory variables, the factors that
significantly explained probability of milk market participation were the age of the household
head, milk yield per day, milk cow ownership, and dairy farming experience and landholding
size. Factors that significantly explained volume of milk supply in the second stage selection
model were household size, milk yield per day and dairy farming experience (Kuma et al., 2014).
In Mamo et al., (2014) study, characteristics of the head of household (gender, age, educational
level), distance to market, number of local milking cows and quantity of milk production
positively affected the probability of participation in milk value addition in the first stage
Heckman model. In the second step, sex of the head of household, income from non-dairy source,
distance to market, number of local milking cows and quantity of annual milk production
affected the value of milk value added positively, whereas number of children less than six years
of age and number of crossbred milking cows had a negative influence. Studies by Demissie et
al., (204) and Balirwa et al., (2016) also included characteristics of the household head (such as
age, sex, educational level) and variables such as number of milking cows, distance to market,
Page 50
34
number of children and landholding size, among others in the analysis of factors affecting milk
market participation and volume of sales.
The studies reviewed in this section indicate the various analytical approaches that have been
used to study market participation and volume of sales. These include logit models, multinomial
logit regression models and Heckman two stage models, among others. The Heckman model,
compared to studies that used the multinomial logit models, would be more appropriate for use
in this study. This is mainly because of the nature of the smallholder dairy value chain in
Zimbabwe where participation in organized value chains is mainly through the milk collection
centres in the smallholder dairy schemes. The Heckman model is also more appropriate because
it takes into account limitations of the other models than can be used to study participation and
volume of sales. In the first stage of the Heckman model, the analysis uses the binary probit
(participation) equations which captures factors affecting participation decisions. The first stage
is also used to construct a selectivity term known as the inverse Mills ratio which is then added
to the second stage outcome equation that identifies factors that affect volume of sales to
markets. The inverse Mills ratio variable is used for controlling bias due to sample selection.
2.3.4 Farmers’ Organization and Commercialization of Smallholder Dairying
Farmer organization may take different forms. According to Stockbridge et al., (2003) these may
include farmer groups, farmer associations, federations, unions or in some cases agricultural
cooperatives owned and controlled by members. These operate at various levels depending on
the nature and purpose of the farmer organization. Stockbridge et al., (2003) define a farmer
organization as an organization that requires its membership to meet certain formal criteria, such
as payment of regular membership fees and participation in certain activities. The definition
stresses the importance of membership, and the function of the farmer organization is to provide
services to its members, which are the key incentives for farmers to become members. According
to the FAO (2017b), milk producers can organize themselves into producer groups or
Page 51
35
organizations to increase profitability, efficiency and strengthening of their capacity on milk
collection, transport, processing and marketing.
Theoretically, agricultural cooperatives are based on the economic theories (bargaining power,
economies of scale and transaction economics) and institutional theory. According to Bijman
(2018) farmers organize themselves in collective action in order to build up countervailing power
to solve their weak bargaining position. Cooperatives give farmers better bargaining position
and can also generate benefits by organizing processing activities on behalf of farmers. Besides
processing, economies of scale can also be gained in research and development, and in
marketing. In terms of transaction cost economics, the cooperative is often presented as an
organizational solution in situations of high transaction costs (Bijman, 2018). Bijman (2018)
also highlight that in terms of institutional theory, microeconomic theories are built on the
assumption of rationality and organization like cooperatives are mechanisms to enhance the
efficiency of economic activities, in this case the production, processing and marketing of milk.
Farmers join a marketing cooperative to gain more control in marketing their products so they
can increase the price they receive for their products, reduce the costs of marketing for their
products, for obtaining agricultural inputs such as seed and fertilizer, and make the market for
their goods more secure (Tsehay, cited by Gobena, 2016).
Agricultural cooperatives have been one way farmers have organized themselves in the
smallholder dairy value chains in order to participate effectively and improve market access in
dairy production and marketing. According to Stockbridge et al., (2003) acting collectively
smallholder farmers may be in a better position to reduce transaction costs of accessing inputs,
obtain the necessary market information, secure access to new technologies, and tap into high
value markets, allowing them to compete with large farmers and agribusiness. This means that
through farmer organizations such as cooperatives, farmers can participate more effectively in
Page 52
36
dairy value chains. Markelova et al., (2009) indicate that value chain actors (including farmers)
require certain conditions and services from other enterprises and support organizations to
effectively participate in the market. This support can be provided through farmer cooperatives.
Farmer organization through cooperatives have also been used as a way of commercialization of
milk production and marketing, particularly in East Africa. Negassa (2009) performed a survey
in Arsi Zone, Ethiopia to generate data to assess opportunities, constraints and challenges of
collective action in commercialization of smallholder dairy production and prospects of scaling
up. The study concluded that membership of milk marketing cooperatives was the key
determinant to sell and for the quantities of milk and butter sold by dairy producers. In terms of
commercialization, it may be important to note that there are problems of the measurement of
commercialization in smallholder agriculture. Jaleta et al., (2009) discuss the issues of
smallholder commercialization in terms of processes, determinants and impact. Generally, they
argue that although there are various indicators and indexes that have been developed, there is
no well accepted and comprehensive definition that could give a multidimensional view to
smallholder commercialization concept so that one can easily judge to what extent a given farm
household is commercialized in its overall production, marketing and consumption decisions
(Jaleta et al., 2009). Besides problems in conceptualization, studies have been performed to
assess the commercialization of smallholder agriculture making use of various indices such as
the household commercialization index, among others.
Bardhan et al., (2012) performed a study to identify factors determining choice of market
channel and what degree the market choice influenced the level of commercialization. The study
used a multivariate regression model and showed that given the right institutional incentives and
market infrastructure, marginal and small scale landholders are capable of scaling up milk
production and hence commercialize their dairy enterprises. Studies by Nkwasibwe et al., (2015)
Page 53
37
and Willy and Gemechu (2016) used Tobit regression models to assess the efficiency of the dairy
value chain in Uganda and determinants of participation and financial profitability of
smallholder dairy in Ethiopia, respectively. Nkwasibwe et al., (2015) study showed that the most
significant determinants of formal marketing choice and the total milk proportions sold to formal
channel were household size, total volume of milk produced, payment period, source of
information, milk selling price and distance to the milk collection centres. A study by Willy and
Gemechu (2016) showed that households’ market participation was affected by household
demographic and socio-economic characteristics and transaction costs. Willy and Gemechu
(2016) noted that with the aim of reducing transactions cost, adequate marketing link should be
established between the rural producer and urban consumer through institutional arrangements
such as dairy cooperatives. A study by Chagwiza et al., (2016) assessed the impact of
cooperative membership among dairy producers in Selale, Ethiopia. The study used propensity
score matching technique and the empirical analysis showed that cooperatives were strong in
facilitating technological transformations and commercialization but weak in offering better
prices. The study concluded that cooperatives can be efficient business institutions to foster rural
development and food security. Although it was not a dairy study, Martey et al., (2012) analysed
factors influencing intensity of commercialization by farm households in maize and cassava
using the Tobit regression analysis in Ghana. The study, which used the household
commercialization index, observed that output price, farm size, household with access to
extension services and distance to market and market information determined the extent of
commercialization.
The various studies reviewed indicate that farmer organization through cooperatives can be an
important element in commercialization of smallholder dairy in organized value chains.
Markelova et al., (2009) indicated that most successful farmer organization marketed high value
agricultural products in situations where farmers faced high transaction costs. The study showed
Page 54
38
that there were greater incentives for collective action to obtain access to transport, equipment,
cold chains, technical expertise and market knowledge to enable smallholders to market
perishable horticultural and livestock products. This shows that farmer organization through
cooperatives enables reduction in transaction costs enabling smallholder farmers to effectively
participate and commercialize. Holloway et al., (1999) indicate that producer marketing
cooperatives that effectively reduce transaction costs may enhance participation. Sonan et al.,
(2012) concluded that if groups are able to increase the volume of milk collection, there exists
potential for an improved and well-functioning market that will enable smallholder dairy farmers
to derive greater benefits from their marketing activities.
Most of the studies reviewed in this section have used the Tobit model to assess the degree of
commercialization, although other analytical techniques have been used as well. This study will
use the Tobit model to assess the role of farmer organization in the commercialization of milk
in the smallholder dairy value chains in Zimbabwe. This study hypothesizes that
commercialization of milk sold through the milk collection centres is not influenced by
participation in activities of farmer milk marketing cooperatives, access to credit, producer price,
access to information and access to markets by smallholder farmers through the farmer organized
milk marketing cooperatives.
2.4 Dairy Value Chain in Zimbabwe
The major players in the dairy industry in Zimbabwe are input suppliers, producers, processors,
retailers and consumers. According to Sukume and Maleni (2012) the dairy industry is becoming
more vertically integrated with many dairy producers emerging as processors and retailers after
the 2008 severe food shortages caused by price controls, foreign exchange shortages and
drought. The Ministry of Agriculture, Mechanization and Irrigation Development (MAMID)
(2014) reports that milk production in 2014 was 54 million litres per annum against a national
Page 55
39
requirement of 120 million litres per annum. This milk production comes from both large scale
commercial and smallholder farmers. Sukume and Maleni (2012) report that estimates by Dairy
Services are that there are 233 large scale milk producers with an average of 100 dairy cattle, 44
of which are in milk at any given time. This implies there are a total of 23,000 dairy cattle in the
large scale commercial farms with an estimated 10,200 milking cows. LMAC (2012) estimated
that the number of large scale commercial producers was reduced from 314 in the year 2000 to
135 in the year 2011 as a result of the fast track reform and redistribution programme which
entailed compulsory acquisition of large scale farms. It is estimated that 77% of the large scale
farms produce milk to supply to six major processors in the country (Sukume Maleni, 2012).
The rest process milk on farm and sell directly to retailers and institutional buyers.
There are about 3,000 registered smallholder producers (communal, small scale commercial and
resettlement farmers) with an average of three dairy cattle half of which are in milk at any given
time (Sukume and Maleni, 2012). According to the DDP (2007) the 3,000 smallholder dairy
producers are organized as associations. Sukume and Maleni (2012) also report that the
Zimbabwe Association of Dairy farmers estimate that about 900 of the smallholder dairy
producers deliver milk to 28 milk collection centers throughout the country. The rest of the
producers supply milk directly to neighbors and local markets and do not supply milk to the six
processing companies. In addition, there are an estimated 10,000 non-commercial farmers that
have cows to supply food for the household, many of which also distribute surplus milk to
neighbors.
At the national level, the supply of milk reached a peak of 260 million litres per annum in 1992,
of which 240 million litres were consumed locally in the form of fresh milk and dairy products
(USAID, 2010). The number of dairy animals at peak production was estimated at 200,000
(DZL, 2009). According to LMAC (2012) the number of female dairy cattle were reduced from
Page 56
40
70,000 in the year 2000 to about 23,000 in the year 2011. Reasons given for the decline from
peak production in the 1990s and the subsequent decline in the 2000s include the effects of
hyperinflation during the period 2000 to 2008, which led to the introduction of multicurrency in
2009. During this period, farmers were forced to barter milk for stock feeds. The fast track land
reform and redistribution programme also had an effect on milk production as some of the
producers whose farms had been acquired by the government sent their animals for slaughter.
This, coupled with droughts, resulted in overall reduction in milk production in the country.
Rukuni (2006) highlights some of the prime movers that were responsible for increased
production and marketing for crops in the first decade of independence. These included
investments and improvements in new technology, performance of institutions such as
marketing, credit, research and extension. In dairying, most of these investments were directed
at the large scale commercial farms, with little investments at the smallholder level. In order to
encourage smallholder farmers to enter into dairying, government created the dairy development
programme. The dairy development programme was started by the government in 1983 with the
mandate to spearhead smallholder dairy development in Zimbabwe’s communal, small scale
commercial and resettlement areas in a bid to raise the living standard of rural people through
increased incomes, provision of nutritious food (milk), improved people health and skills
development (DDP, 2007). One of the most important infrastructural developments undertaken
by the dairy development programme in the smallholder dairy schemes was the milk collection
centres. The centres provided milk bulking, cooling and marketing services. The milk collection
centres are run by farmer-organized milk marketing cooperatives. According to the DDDP
(2007), there were a total of 28 rural dairy projects in Zimbabwe, of which four delivered fresh
milk to Dairibord Zimbabwe Limited (DZL) and 22 processed the milk into Amasi (cultured
milk), yoghurts, and naturally sour milk. In this study, smallholder dairy schemes that process
milk at the milk collection centre are regarded as participating in the semi-formal value chain
Page 57
41
while those that deliver the milk to established processors such as DZL (which is the successor
of the government owned Dairy Marketing Board) are regarded as participating on the formal
value chain. The semi-formal and formal value chains constitute the organized value chains
through which smallholder farmers in Zimbabwe can participate in milk production and
marketing.
Dairy production and marketing is affected by a number of factors at the micro-economic level,
including research, extension, inputs and other socio-economic factors. In terms of research,
prior to independence, most of the dairy research and development was targeted at large scale
commercial farmers (Sibanda and Khombe, 2006). Research into smallholder dairy only
commenced in support of government projects and programmes after independence (Mupeta,
2000). Sibanda and Khombe (2006) notes that since smallholder dairy was a new production
system introduced after independence, most of the research initially focused on gaining an
understanding of constraints and potential opportunities. Ngongoni et al., (2006) contend that
the major factors affecting dairy production in the smallholder sector were low levels of nutrition
and management practices responsible for the poor milk yields performance, low calving
intervals, late age at first calving and long intervals. Shortage of feed and transport are the major
constraints faced by smallholder dairy producers in the semi-arid areas (Chinogaramombe et al.,
2008). Francis and Sibanda (2001) and Ngongoni et al. (2006) highlight problems identified as
limiting dairy production. They further contend that age of calving of heifers, low productivity
due to inadequate availability and poor quality of feeds, expensive commercial feeds, heavy tick
infestation and high incidence of tick-borne diseases, excessive calf mortality and inadequate
knowledge on appropriate livestock management practices further limited dairy production.
Mupeta (2000) also documented the constraints facing smallholder production, with particular
reference to feed resources.
Page 58
42
Muriuki and Thorpe (2002) indicated that in Eastern and Southern Africa, with the exception of
Zimbabwe and South Africa, most of the dairy in all countries is dominated by smallholder
farmers. The FAO (2017a) indicates that organized small scale dairy systems with improved
productivity and access to markets can compete successfully with large scale, specialized, capital
intensive high technology dairies. This study therefore focusses on milk production and
marketing in organized smallholder dairy value chains under the dairy development programme
schemes.
2.5 Conceptual Framework for this Study
In this study, milk production and marketing is studied in the context of organized smallholder
dairy value chains under the Dairy Development Programme (DDP) smallholder dairy schemes.
The small commercialized milk output from the smallholder farmers (estimated at 5%) that
enters the formal value chains is hypothesized to be limited by a number of constraints inherent
in parts of the links of the smallholder value chains particularly at the farm and milk collection
centre levels. The entry points for this research are the farm and milk collection centre levels of
the value chain and the primary area of research interest are the smallholder dairy producers.
Since feed has been identified as one of the main factors limiting milk production, this study
hypothesizes that introducing a value chain intervention of an animal production and forage
centre at the milk collection centre will enable farmers to access feed and improved breeding
services. This improves milk production and the economic viability of smallholder dairy value
chain at the production stage and therefore leads to improved commercialized output. Figure 2.1
presents the flow diagram of the conceptual framework.
Page 59
43
Source: Author Compilation (2014)
Figure 2.1: Flow diagram of the smallholder value chain and the location of the animal
production and forage centre at the milk collection centre
The flow diagram shows that milk is produced by smallholder farmers and delivered to the milk
collection centre. Some of the milk may be sold informally direct to consumers such as neighbors
and other consumers in the production areas. Some of the milk collection centres process the
milk to produce various products, mainly fermented milk, yoghurts, and dairy beverages (semi-
formal value chain). These products are sold to consumers at the milk collection centre, and also
wholesaled from the milk collection centre to retailers at rural service centres and nearby urban
areas. Some of the milk collection centres bulk the milk from producers for delivery to
established urban based processors (formal value chain) which processes the milk into produce
Page 60
44
various products such as Ultra High Temperature (UHT) milk, cheeses, dairy beverages,
yoghurts and other dairy related products. The urban based processors mainly supply the
products to predominantly urban consumers, through wholesalers and retailing direct to
consumers. At the production and marketing stages, the flow diagram shows the socio-economic
factors that influence production and affect market participation of households.
As shown in Figure 2.1, the proposed hypothetical value chain intervention of an animal
production and forage centre will be located at the milk collection centre site. This will be
responsible for commercially producing forage and feed for selling to farmers. This is expected
to result in a reduction of costs related to access to forage and feed. As a result, producers would
be able to access high quality forage and feed and increase milk production which they can
deliver to the milk collection centre. The milk collection centre on the other hand, would work
closely with the animal production and forage centre and deduct the money owed by producers
to the animal production and forage centre when producers deliver milk to the centre. Farmers
are organized through milk marketing cooperatives at the milk collection centers which are run
by a management committee elected by members.
2.6 Summary of Insights from the Literature
The literature review has defined and discussed the concepts of value chain and value chain
analysis to provide the framework and context in which organized value chains in Zimbabwe are
studied. Smallholder value chains in Zimbabwe are organized under the smallholder dairy
schemes set up under the Dairy Development Programme (DDP). In this study the smallholder
dairy value chains are categorized as semi-formal (where milk is processed at the milk collection
centre) and formal (where milk is delivered to established processors in the main urban centres)
which constitute the overall smallholder organized value chains for commercial market oriented
milk production and marketing. This study follows on the observations of Kaplinsky and Morris
Page 61
45
(2010). Kaplinsky and Morris (2010) indicate that which value chain or chains are to be subjects
of enquiry very much depends on the point of entry of the research enquiry. Kaplinsky and
Morris (2010) further highlight that the point of entry defines which links and activities in the
chain are to be subjects of special enquiry. This study considers the weak links in the organized
smallholder dairy value chains to be on the producers in terms of their production and marketing
activities and marketing of milk at the milk collection centres and this is the focus of the research
for this study. These weak links have been defined on the basis of the low output and volume
delivered to markets (5%) from the smallholder dairy schemes. These are the entry points of the
research and are the subjects of the research enquiry. The study therefore focusses on milk
production in the organized smallholder dairy value chains, market participation and volume of
milk sales to milk collection centres, which are an important institution in the smallholder dairy
value chains.
In order to identify analytical models appropriate to study determinants of milk production,
participation in the market and volume of sales, a number of studies were reviewed. The
reviewed literature on factors influencing milk production indicates the studies have mainly used
general linear and multiple regression models. Given that in smallholder areas, unlike in large
scale commercial production where the major determinant of production is the profitability of
the enterprise, socio-economic factors are important in the decision making processes of
households. The multiple linear regression model was thus considered appropriate to assess
factors influencing milk production in the overall smallholder organized value chains.
The reviewed literature on market participation and volume of sales is mainly dominated by
selectivity models. The literature reviewed indicates the empirical studies have used logit
models, multinomial logit models, multivariate regression analysis, Tobit models and the
Heckman two stage models, among others. The Heckman two stage model was considered
Page 62
46
appropriate for this study from the selectivity models. In the selectivity models, the decision to
participate in the market can be seen as a sequential two stage decision making process due to
the influence of various types of transaction costs on household market participation. In this
study, the milk collection centre, which is run by farmer organized milk marketing cooperatives
forms an important infrastructural set up to provide bulking, cooling, transportation, and in some
dairy schemes processing of the milk in the smallholder dairy value chains. The milk collection
centre is assumed to reduce transaction costs and facilitate smallholder production and market
participation in the value chains. Participation in production and marketing in the organized
value chains is therefore assessed on the basis relating to the milk collection centre since a farmer
needs to be a member of the farmer organized milk marketing cooperative to participate and
benefit from the milk produced individually and marketed collectively through the milk
collection centre.
The second stage of the selectivity model posits that conditional on the decision to enter into the
market, households then make continuous decisions on the level of participation in the market,
for example, how much to milk to sell. In this study, this would represent how much milk to sell
to the milk collection centre. The Heckman model was found appropriate for this study as it uses
the standard probit model to analyse household discrete decision to enter into the market in the
first stage. The second stage then uses a censored regression with correction for selection bias to
model the effects of variables influencing the level of market participation in terms of quantities
of milk sold. This is different from some of the models which are appropriate for modelling
choice of market outlets for farmers, which is not appropriate in the context of organized
smallholder dairy value chains in Zimbabwe.
The literature reviewed on feed resources and other constraints indicates the need to come up
with interventions that provide solutions to feed resources and improved breeding that are critical
Page 63
47
constraints to smallholder dairying. McDemott et al., (2010b) indicates that combining genetic
and feed improvement has led to productivity gains of up to 300% in smallholder systems in
sub-Saharan Africa. Within the context of the value chain framework, this study proposes
introducing a hypothetical and evaluates ex ante the value chain intervention of an animal
production and forage centre that can benefit all farmers and can lead to upgrading of the whole
chain in terms of production and marketing. The intervention targets the weak links in the chain,
that is, the low volumes produced and marketed by smallholder farmers in Zimbabwe. The value
chain intervention would be assessed on the basis of benefit cost analysis and bio-economic
modeling.
The literature reviewed on farmer organization indicates the importance and role cooperatives
can play in smallholder dairy commercialization in organized value chains. Most of the studies
on commercialization have used the Tobit model to assess the intensity or degree of
commercialization using various indictors or indexes of commercialization (Martey et al., 2012;
Willy and Gemechu, 2016). The Tobit model was also considered appropriate to assess the
degree of milk commercialization through the milk collection centres of organized value chains
in Zimbabwe. The Tobit model is considered appropriate compared to other analytical
techniques because of its key aspect in the use of latent quantities of marketable surplus of non-
participating households (Willy and Gemechu, 2016). The dependent variables takes on positive
and zero values. The sales quantities in the model therefore are left censored at zero, and the
Tobit model is also known as a censored model (Gujarati, 2004). The model was used to assess
the degree of commercialization of milk in the organized smallholder dairy value chains through
the milk collection centre run by the farmer organized milk marketing cooperatives.
Page 64
48
CHAPTER THREE: RESEARCH METHODS
3.1 Introduction
This chapter describes the data sources, selection of study sites, and the location and description
of study survey sites. Primary data collection methods, sampling procedures and a brief
discussion of the limitations of data collection methods used are covered in the chapter. The
chapter also presents the analytical framework, models to be used in data analysis, data entry
and analysis, and the contribution of the study to the body of knowledge.
3.2 Data Sources
The sources of data were both secondary and primary. Secondary sources included the
Zimbabwe National Statistics Agency (ZimStats), Ministry of Agriculture Economics and
Markets Department, Farmer Unions, Dairy processors such as Dairibord Zimbabwe limited
(DZL), Kefalos and the Milk Collection Centres (MCC) under the smallholder dairy
development programme. Secondary data were also collected from Dairy Services which
regulates the dairy industry, Zimbabwe Association of Dairy Farmers (ZADF), and the
Zimbabwe Dairy Industry Trust (ZDIT).
Primary sources of data included interviews with key informants, focus group discussions and a
household survey of farmers participating in commercial milk production under the Dairy
Development Programme (DDP). Key informant interviews mainly targeted the major
stakeholders in the dairy industry and these included private processors, government institutions,
and experienced farmers from the target smallholder dairy schemes. One focus group discussion
per smallholder dairy scheme was held with representatives of smallholder dairy farmers.
Page 65
49
3.3 Selection of Study Sites
The locations of the study sites were four smallholder DDP dairy schemes of Chikwaka, Nharira-
Lancashire, Marirangwe and Rusitu. These schemes were purposively selected on the basis of
the type of production system (communal farming area, resettlement area, and small scale
commercial farming area), agro-ecological location, and performance in terms of average daily
milk delivered to the Milk Collection Centre (MCC), and linkages to formal modern processors
or processing of the milk at the MCC. According to Munangi (2010), the smallholder dairy
schemes across the country can be ranked based on performance in terms of milk production and
the status of the project. On the basis of performance or status, the schemes can be grouped into
four (Annex 1, Table 2). According to DDP (2013), Wedza, Sadza, Shurugwi, Guruve, Dowa,
Kanyongo and Umzingwane smallholder dairy schemes remained constrained in their dairy
activities and membership leading to low milk production. Mount Darwin, Murombedzi and
Mhondoro schemes were closed due to low milk production although Mhondoro was making
efforts to resume production (DDP, 2013). It was on the basis of the above criteria and taking
into account the status of some of the schemes that the four smallholder dairy schemes were
purposively selected.
In summary, the four smallholder dairy schemes under the DDP were purposively selected on
the basis of whether there was milk collection centre processing (semi-formal value chain),
linkages with established urban based processors (formal value chain), agro-ecological region
location of the scheme, and performance in terms of daily deliveries of milk to the milk collection
centre. Two schemes participating in the semi-formal value chain selected were Chikwaka and
Nharira-Lancashire, and two supplying the formal value chain were Marirangwe and Rusitu. The
characteristics of the selected study sites are summarized in Table 3.1.
Page 66
50
Table 3.1: Characteristics of smallholder dairy schemes selected for the study, 2015
Smallholder Dairy
Scheme
Chikwaka Nharira-
Lancashire
Marirangwe Rusitu
Value Chain Participates
in semi-
formal
Participates
in semi-
formal
Supplies
Formal
value chain
Supplies Formal value
chain
Milk Processing Milk
collection
centre
processing
Milk
collection
centre
processing
Delivered to
processors
(based in the
capital city
of Harare)
Delivered to Dairibord
Zimbabwe limited
(privatised company of
the former state run
Dairy Marketing
Board)
Agro-ecological
location of the
scheme or natural
region (NR)
NR II NR III NR II NR I
Farming system Communal Encompasses
both
Communal
and Small
scale
commercial
Small scale
commercial
Old resettlement area
Total milk
deliveries to milk
collection centre
Average
200
litres/day
Average 200
litres/day
Average 400
litres/day
Average 600 litres/day
Source: Author Compilation based on literature
3.4 Location and Description of Study Sites
The following section gives the location and description of the study sites.
3.4.1 Chikwaka Smallholder Dairy Scheme
Chikwaka smallholder dairy scheme is located about 50 km to the East of the capital city, Harare.
Chikwaka smallholder dairy scheme is located in a communal farming area and was the first to
be established by the government in 1983. The scheme is located in Mashonaland East province
in Goromonzi district. The scheme is in the category of schemes delivering less than 200 litres
milk per day to the MCC. It lies in agro-ecological region II which is considered suitable for
dairy production and receives 700 to 1050 mm rainfall per annum.
Page 67
51
3.4.2 Nharira-Lancashire Smallholder Dairy Scheme
Nharira-Lancashire is located about 172 km to the south of the capital city, Harare. The scheme
encompasses both communal and small scale commercial production systems and is located in
Chikomba district in Mashonaland East province. It lies in agro-ecological III which receives
500 to 700 mm rainfall per annum. The area is subject to mid-season droughts. The main farming
systems found in the area, in conformity with the natural conditioning factors are based on
livestock production, assisted by the production of fodder crops and cash crops.
3.4.3 Marirangwe Smallholder Dairy Scheme
Marirangwe smallholder dairy scheme was established in 1984 and is located in a small scale
commercial farming area about 50 km to the south of the capital city Harare, in Seke District of
Mashonaland East province. The scheme produces more than 200 litres of milk per day. It is
located in agro-ecological region II and receives between 700 to 1000 mm of rainfall per annum
which is mainly confined to the summer months. The region is suitable for intensive systems of
farming based on crops and livestock production.
3.4.4 Rusitu Smallholder Dairy Scheme
Rusitu smallholder dairy scheme was established in 1990 and is located in Eastern part of
Zimbabwe in Manicaland province, Chipinge district and is approximately 485 km from the
capital city of Harare. The scheme is located in an old resettlement area. The farmers were
resettled after independence in 1980 under the government’s old resettlement programme which
was different from the fast track land resettlement programme implemented after the year 2000.
The scheme produces more than 600 litres of milk per day. The scheme falls in agro-ecological
region I, which is a specialized and diversified farming region. The rainfall in this region is high
(more than 1000 mm per annum in areas lying below 1700m altitude and 900mm per annum at
greater altitudes). The area normally gets some precipitation in all months of the year. The
Page 68
52
temperatures in this region are comparatively low and the rainfall is highly effective enabling
afforestation, fruit and intensive livestock production to be practiced. Plantation crops such as
tea, coffee, and macadamia nuts are grown in this region.
3.5 Primary Data Collection Methods and Tools
The study used two main methods to collect primary data. The first method was a pre-tested
structured questionnaire to collect primary data at the household level. The second method was
key informant interviews targeted at the smallholder dairy scheme leadership, MCC staff and
extension personnel at the District and scheme level using a pre-tested semi-structured
questionnaire.
The questionnaire used to collect primary data in the survey was a single visit, once-off
questionnaire designed to last approximately one hour administered by a trained enumerator.
The questionnaire consisted of both pre-coded and open ended questions. This was
complemented by key informant interviews conducted by the researcher to get an overall picture
and views on smallholder dairy production and marketing (The detailed questionnaires are given
in Annex 2).
3.6 Secondary Sources of Data and Types of Data Collected
Secondary data were collected on the following variables:
i. Time series data on quantities produced and quantities marketed from smallholder
dairy schemes since 1983;
ii. Government policies towards the smallholder dairy sector since the introduction of
the smallholder dairy development programme (DDP) in 1983;
iii. Raw milk prices paid to farmers since 1983;
iv. Credit facilities and finance available for smallholder dairy farmers over the years
from 1983;
Page 69
53
v. Projects supporting smallholder dairy since the introduction of the programme in
1983;
vi. Prices and supply of inputs to smallholder dairy schemes;
vii. Prices of dairy equipment; and
viii. Constraints and opportunities.
3.7 Sampling Procedures
The target population for the study were all smallholder dairy farmers under the DDP dairy
schemes in the target study sites. The lists of all members of the smallholder dairy schemes were
obtained from the MCC. The list included producers who were delivering milk at the time of the
study and those who were not delivering milk at the time of the study. The list for each respective
smallholder dairy scheme formed the sampling frame for the sample survey for that dairy
scheme. The sampling frames were comprised of 125 producers in Nharira-Lancashire, 65
producers in Chikwaka, 35 in Marirangwe and 245 in Rusitu. The aim in the survey was to
interview at least 50 producers from each smallholder dairy scheme within the limits of the
available research resources. Simple random sampling was used to select the sample of
smallholder dairy producers included in the study. In Marirangwe, the sample of farmers
included in the study were all the producers in the sampling frame since the sampling frame for
the smallholder dairy scheme was less than 50. The total number of households interviewed in
the four smallholder dairy schemes was therefore 185 farmers. This sample provides a cross
section of farmers in order to understand the organized smallholder dairy value chains under
different farming systems, agro-ecological potentials and scheme performance levels.
3.8 Limitations of Data Collection Methods Used
Limitations in data collection methods used in the survey include enumerator bias, recall
problems and subjectivity of some of the questions and types of data collected. The main possible
Page 70
54
sources of this bias are the differences in the ability of enumerators. This affects interpretation
of questions by enumerators and inconsistencies in interviewing. However, attempts were made
to keep this to a minimum so as to have consistency in the data collected. This was done through
rigorous training sessions to ensure the enumerator understood all aspects in the questionnaire
before actual implementation. The enumerators also administered a minimum of three
questionnaires in the presence of the Principal Researcher in order to ensure data consistency.
A single visit survey also encounters problems of recall. Since dairying is a daily activity and
most of the farmers do not keep records, recall problems were encountered on dairy herd
structure, cost of production and quantities of milk sold and consumed by the household. In order
to get accurate data where recall was a problem, different probing strategies were used. For
example, instead of only relying on the head of household, other household members directly
involved in the activity were questioned directly where they were better placed to provide the
data. If the farmer had records, data were cross checked against the records particularly for sales
and costs of production. Overall, the limitations of the data collection do not invalidate the
results.
3.9 Analytical Framework
Table 3.2 shows the analytical framework of the study.
Page 71
55
Table 3.2: Analytical framework of the study Hypotheses Data requirements Methods of analyses
Household socio-economic factors such as age, sex, dairy farming
experience and agricultural training of the household head, distance to
the MCC, total size of arable land available to the household, cost of
concentrates, household size, number of milking cows and the type of
value chain the farmer is supplying do not influence milk production in
the smallholder dairy value chain.
Age, sex, agricultural training and , dairy farming experience of the
head of household, total size of arable land available to the
household, cost of concentrates, and number of milking cows. Data
on total milk production (consumed and sold by the household)
Descriptive statistics to
summarize data.
Multiple linear regression
analysis.
Socio-economic factors such as total number of dairy cows owned by the
household, distance to the milk collection centre, educational level, age
and sex of the head of household, household size, dairy farming
experience, size of land holding of the household, access to information
and extension, income from other sources, occupation of the farmer,
agricultural training of the head of household and the agro-ecological
region location of the smallholder dairy scheme do not affect milk market
participation and volume of sales to the milk collection centres of the
smallholder dairy value chain.
Total number of dairy cows owned by the household, distance to
the milk collection centre, educational level, age and sex of the head
of household, household size, dairy farming experience, size of land
holding of the household, access to information and extension,
income from other sources, occupation of the farmer, agricultural
training of the head of household and the agro-ecological region
location of the smallholder dairy scheme of the household.
Type of market outlet used
Quantity of milk produced and consumed by the household.
Descriptive statistics
Heckman two stage
regression model
Page 72
56
Quantity of milk sold.
The animal production and forage centre is not a profitable intervention
to milk marketing cooperatives in the smallholder dairy value chain.
Costs of setting up the forage and animal production centre such as
housing and offices, storerooms infrastructure, basic equipment for
AI, and cost of staff for the centre.
Current costs of production for farmers in terms cost of labour,
dipping, veterinary drugs and medicines, concentrates, pasture
production and transport.
Descriptive statistics
Benefit cost analysis
Commercialization of milk sold through milk collection centres is not
influenced by participation in activities of farmer milk marketing
cooperatives, access to credit, producer price of milk, access to
information and access to markets by smallholder farmers through the
farmer milk marketing cooperatives.
Participation in farmer marketing cooperative activities, access to
credit, access to information, distance to the market, and price of
milk paid to farmers.
Descriptive statistics
Tobit model
Page 73
57
3.10 Analysis and Econometric Models used in the Study
1. In order to answer the first objective of the study which is to analyze the trends in smallholder
milk production and marketing including the effect of policies since the introduction of the
smallholder dairy development programme (DDP) in 1983, the study initially presents an overall
trend analysis of national milk intake (large and small farmers) and for the smallholder intake
levels. In addition to the trend analysis of national milk intake, analysis of group differences was
performed for the period 1980 to 2013, and this was done within the context of the policy
framework periods in order to assess the effects of the policies on milk production intake. The
major policies were classified into four distinct periods. The period 1980 to 1990 was classified
as the single channel marketing period in which the DMB held monopoly in the purchase,
processing, distribution, and trade in dairy products. The period 1990 to 1999 was classified as
the period when the government implemented the economic structural adjustment programme
(ESAP) that led to the privatization of the DMB in 1993, and the participation of other private
players. In the year 2000 government implemented the fast track land reform and redistribution
programme that was accompanied by contraction of the economy, eventually leading to
hyperinflation during the years 2007 to 2008. The dairy sub-sector remained deregulated during
this period. The last class period is from 2009 to 2013 when the government introduced the
multiple currency systems or dollarization. Statistics on volumes of milk delivered to markets
(milk intake) for the period 1980 to 2013 were collected from secondary sources. The analysis
used one way analysis of variance (ANOVA) and interactive bar graphs to analyse the average
volumes of milk delivered during the different policy periods. A one way analysis of variance is
a statistical method used to compare the means of more than two sets of data to see if they are
statistically different from each other. If the ANOVA was significant, multiple comparison tests
using the Tukey post-hoc multiple comparison tests were performed to check for significant
differences between policy periods, and to show which policy periods differed significantly from
each other in influencing milk production. The ANOVA methodology was used for analysis of
Page 74
58
the milk production at the national level, smallholder level and for selected smallholder dairy
schemes. Due to differential data availability, there was limited analysis in terms of policy
periods for smallholder milk production and some of the schemes analyzed.
It is important in the interpretation of results to take into account the advantages and limitations
of ANOVA. The main advantages of ANOVA is that it can control the overall Type I error rate
and also because it is a parametric test that is more powerful if normality assumptions hold true.
The main limitations of ANOVA are mainly related to its main assumptions which include
homogeneity of variances, normality and independence of observations.
2. The second objective was to determine the main factors influencing milk production in the
smallholder dairy value chain. Following on Wanjala et al., (2014), the hypothesis associated
with this objective was that household socio-economic factors such as age, sex, agricultural
training and dairy farming experience of the head of household, distance to the MCC, total size
of arable land available to the household, cost of concentrates, household size, number of milking
cows and the type of value chain the farmer is supplying do not influence milk production and
was tested using multiple linear regression model.
The multiple linear regression model was stated as follows:
𝑌 = 𝛽0 + 𝛽1Χ1 + 𝛽2Χ2 + 𝛽3Χ3 + 𝛽4Χ4 + 𝛽5Χ5 + 𝛽6Χ6 + 𝛽7Χ7 + 𝛽8Χ8 + 𝛽9Χ9 +
𝛽10Χ10 + 𝜇 (1)
Where Y – Quantity of milk produced per month (litres)
0 - Intercept (constant)
𝛽1 𝑡𝑜 𝛽10 - Regression coefficients
Page 75
59
1X – Distance to the MCC
2X – Age of the head of household
3X – Dairy farming experience
4X – Agricultural training
5X – Total size of arable land available to the household
6X – Cost of concentrates
7X – Sex of the household head
8X – Household size
Χ9 – Number of milking cows
Χ10 - Type of value chain the farmer is supplying
µ - error term
The description of the variables, values and the expected sign are given in Table 3.3.
Page 76
60
Table 3.3: Description of variables used in the model and expected sign
Variable Description Values,
Expected sign
Distance to the MCC Distance of the farmers homestead to the
MCC
km, -
Age of the head of
household
Age of the head of household Years, -
Dairy farming experience Dairy farming experience of the head of
household
Years, +
Agricultural training Agricultural training of the household head
(Dummy, 1=Some training in agriculture,
0=Otherwise)
+
Total size of arable land Total size of arable land available to the
household
Ha, +
Cost of concentrates feed Cost of concentrate feed, $/kg $/kg, -/+
Sex Sex of the head of household (Dummy,
1=male, 0=female)
+
Household size Number of household members staying with
the head of household
+
Number of milking cows Number of milking cows owned by the
household
+
Type of value chain
supplied by the farmer
Value chain supplied by the farmer
(Dummy, 1=formal value chain, 0 = semi-
formal value chain)
+
Dependent variable –
milk production
Quantity of milk produced in litres litres
Diagnostics tests were performed to assess the assumptions of multiple linear regression
analysis. Kolmogorov-Smirnov test was performed to assess if the dependent variable was
normally distributed. The kernel density estimate was then used to assess the normality of the
distribution. The Breusch-Pagan/Cook-Weiseberg test was used to test for heteroskedasticity.
The link test was performed to assess the specification of the model. Tolerance and variance
inflation factor were used to assess multicollinearity.
Page 77
61
3. The third objective of the study was to analyze the factors affecting milk market participation
and the hypothesis associated with this objective was on market participation and volume of
sales. The Heckman two-step selection econometric models were used to analyse the hypothesis
of the determinants of milk market participation and volume of sales to the milk collection
centre. The specification of the econometric models used to analyze market participation and
volume of sales in this study followed literature on empirical studies of selectivity models
(Goetz, 1992; Key et al., 2000; Holloway et al., 2004; Bellemare and Barrett, 2006). The
Heckman two-step is part of the selectivity models which specify that the decision to participate
in milk markets can be seen as a sequential two-stage decision making process. In the first stage,
households are considered to make a discrete choice on whether to participate or not to
participate in milk markets (that is, whether to deliver milk to the milk collection centre or not).
In the second stage, conditional on their decision to participate, households then make
continuous decisions on volume of milk sales to the milk collection centre. In the first stage, the
standard probit model which follows random utility model and specified as Wooldridge (2002)
is used:
y* = z’α + ε1 (2)
y = 1, if y* > 0
y = 0 if y* ≤ 0.
Where, y* is a latent (unobservable) variable representing the household discrete decision to
participate or not participate in the milk market. Z’ is a vector of independent variables that are
hypothesized to affect the household decision to participate in milk market. α is a vector of
parameters to be estimated which measures the effects of the explanatory variables on
household’s decision. ε1 is normally distributed disturbance with mean (0) and standard deviation
of Ϭ1 and captures all unmeasured variables. Y is a dependent variable which takes on the value
of 1 if a household participates in milk market and 0 otherwise. Conditional on milk market
Page 78
62
participation, variables affecting the volume of milk sales to the milk collection centre were then
modeled using the second-stage Heckman selection model (Heckman, 1979). The Heckman
selection equation is specified as follows:
Zi* = wi α + ε2 (3)
Zi = zi* if zi* > 0
Zi = 0 if zi* ≤ 0
Where Zi* is the latent variable representing optimal volume of milk sales to the milk collection
centre, which is observed if zi* > 0 and unobserved otherwise. Zi is the observed volume of milk
sold to the market, Wi is the vector of covariates for unit i for selection equation which is a subset
of z’, α is the vector of coefficients for selection equation and ε2 is the random disturbance for
unit i for selection equation. One of the problems with the two equations (1) and (2) is that the
two-stage decision making processes are not separable due to unmeasured household variables
affecting both discrete and continuous decisions thereby leading to errors of the equations. If the
two errors are correlated, the estimated parameter values on variables affecting volume of milk
sales would be biased (Wooldridge, 2002). Thus the model that corrects selectivity while
estimating volume of milk sales needs to be specified. For this purpose, in the first-step, Mills
ratio is created using probability values obtained from the first-stage probit regression of milk
market participation. Then in the second-step, the Mills ratio is then included as one of the
independent variables in volume of milk sales regression. Thus volume of milk sales equation
with correction for sample selection bias becomes:
V = wα + λ[ϕ (wiα)
Ф(wiα)] + ε3 (4)
Where, ф (.)/Ф (.) is the Mills ratio, λ is the coefficient on the Mills ratio, ф denotes standard
normal probability density function, Ф denotes the standard cumulative distribution function and
ε3 is normally distributed disturbance term with zero mean and standard deviation of Ϭ3, and ε3
Page 79
63
is not correlated with ε1 and ε2 and other independent variables. Under the null hypothesis of no
sample selection bias, λ is not significantly different from zero. In this study, V is volume of
milk sales in litres.
The independent variables were identified based on economic theories and empirical studies as
follows (Table 3.4).
Table 3.4: Description of dependent and independent variables used in Heckman two-step
selection model
Variable Description Values, Expected Sign
Age Age of household head in years Number of years, ±
Educational level Educational level of head of household Number of years in
school, +
Sex Sex of household head (Dummy: 1=male;
0=female)
+
Household size Number of household members Number, +
Distance to market Distance to the milk collection centre km, -
Access to
extension
Access to extension services in the dairy
schemes (Dummy: 1=yes; 0=no)
+
Access to
information
Access to dairy enterprise information
(Dummy: 1=yes; 0=no)
+
Dairy farming
experience
Dairy farming experience of the head of
household
Number of years, +
Total land holding
of the household
Total size of land holding of the household Hectares, +
Total number of
dairy cows
Total number of dairy cows owned by the
household
Number, +
Income from other
sources
Income from other sources USD, +
Farmer occupation Occupation of the farmer (Dummy:
1=fulltime farmer; 0=otherwise)
+
Agricultural
training
Agricultural training of the head of
household (Dummy: 1=Received some
training in agriculture; 0=otherwise)
+
Agro-ecological or
natural region
Agro-ecological location of the smallholder
dairy scheme of the household (Dummy:
1=Natural region I or II; 0=otherwise)
±
Milk sold Volume of milk sales to the milk collection
centre
Litres/month
Market
Participation
Farmers producing and selling milk to the
milk collection centre (Dummy: 1=yes;
0=no)
Page 80
64
4. The fourth objective was to determine ex-ante the potential effect of introducing an animal
production and forage centre in the smallholder dairy value chain. The hypothesis was that the
animal production and forage centre is not a profitable intervention to milk marketing
cooperatives in the smallholder dairy value chain was tested using a benefit cost analysis and
bio-economic modeling. The main scenarios assessed was the baseline scenario, which was the
current situation and milk production levels by smallholder farmers. Data for the baseline
scenario came from the survey. The baseline scenario was compared to the hypothesized
intervention of the animal production and forage centre that was to be introduced at the milk
collection centre of the smallholder dairy value chain. The intervention of the animal production
and forage centre was expected to offer additional benefits to farmers through increased milk
yields if it is finally operationalized. Farmers participating in the animal production and forage
centre are expected to optimally feed their animals (as per expert research recommendations) in
order to realize optimum milk yields and benefits from smallholder dairying. The centre will be
expected to produce bagged and ensiled forage that is then sold to farmers at the lowest cost
possible. The centre will be manned by qualified personnel, trained up-to diploma level. The
animal production section of the centre will also be manned by qualified personnel to provide
correct synchronization of the animals on heat and artificial insemination for the benefits to be
realized. Repayment of forage purchased by farmers will be through deductions factored into the
milk sold to the milk collection centre. In terms of marketing, milk will be sold in the rural areas,
with the surplus processed into sour milk depending on the requirements of the community. The
upgrading of feed and animal management is likely to improve viability for smallholder farmers,
constituting a new model for smallholder dairy development.
The benefit-cost methodology (Gittinger, 1992) was used to assess the investment in the animal
production and forage centre. The hypothesized animal production and forage centre was
Page 81
65
assessed (ex-ante) on basis of the cost and benefits of putting up such a centre and discounting
the costs and benefits over a ten year period. The present worth of the benefits and costs were
calculated using the following formula:
𝑃𝑉 =𝐹𝑉
(1+𝑖)𝑛 (5)
Where PV = present value, FV = future value, i = interest rate, and n = number of years.
The benefit cost ratio (BCR) was calculated using the following formula:
𝐵𝐶𝑅 = ∑
𝐵𝑡
(1+𝑖)𝑡𝑡=𝑛𝑡=1
∑𝐶𝑡
(1+𝑖)𝑡𝑡=𝑛𝑡=1
(6)
Where Bt = benefit in each year;
Ct = cost in each year;
t = 1, 2,………, n;
n = number of years; and
i = interest (discount) rate.
Scenarios assessed were the “with” the animal production and forage centre and the “without”
animal production and forage centre (which is the baseline). In addition, the cost of production
of the smallholder dairy enterprise was calculated and gross margin analysis performed. The
gross margin is simply the gross output of the enterprise less the variable costs and was used to
indicate the economic viability of the dairy enterprise. If the benefit cost ratio is more than one,
then animal production and forage centre is considered to be profitable to the milk marketing
cooperatives of the smallholder dairy value chain. It is important to note and take into account
the advantages and limitations of the benefit cost methodology. The main advantages are
comparability, transparency and ignorance revelation. The main disadvantages of the
methodology include the potential inaccuracies in identifying and quantifying costs and benefits,
increased subjectivity for intangible costs and benefits, and inaccurate calculations of present
value resulting in misleading analyses.
Page 82
66
5. The fifth objective was to assess the role of farmers’ cooperatives in the commercialization of
milk in the smallholder dairy value chain. The hypothesis was that commercialization of milk
through the MCC is not influenced by participation in activities of farmer milk marketing
cooperatives, access to credit, access to information, distance to the market (representing access
to markets through the farmer marketing cooperatives), and the price of milk delivered to the
MCC and was tested using the Tobit model. The key aspect of using the Tobit model is use of
latent quantities of the commercialized milk output of non-participating households. Smallholder
dairy producers in this study are divided into two groups, those who actually sell milk to the
MCC, on which information is available on the regressand (commercialized milk output) and
the regressors, and another group where information is only available on the regressors’, but not
the regressand. The regressand or dependent variable takes on positive and zero values. When a
zero value is observed, it is assumed the household in question, rather than possessing an excess
of the marketable product (commercialized milk in this case), actually has the demand for the
commodity (that is negative supply) Laper et al., (2002), cited in Willy and Gemechu, (2016).
Hence the quantity sold (commercialized milk output) is left censored at 0 and the Tobit model
is also known as a censored regression model. According to Gujarati (2004) statistically the
Tobit model can be expressed as:
Y𝑖 = 𝛽1 + 𝛽2𝑋2 + 𝜇𝑖 (7)
if Right Hand Side (RHS) > 0, or = 0, otherwise.
The model used in this study is expressed as follows:
𝑌 = 𝛽1 + 𝛽2Χ1 + 𝛽3Χ2 + 𝛽4Χ3 + 𝛽5Χ4 + 𝛽6Χ5 + 𝜇 (8)
Where Y – commercialization index (expressed as percentage of quantity sold divided by total
quantity produced multiplied by 100).
ꞵ2 to ꞵ5, - regression coefficients
Page 83
67
X1 – participation in milk marketing cooperative activities.
X2– access to credit.
X3 – access to information.
X4 – distance to the MCC (representing access to market)
X5 – Price of milk delivered to the MCC
µ - error term.
The independent variables were identified based on economic theories and empirical studies as
follows (Table 3.5).
Table 3.5: Description of variables used in the Tobit model
Variable Description Values, Expected
sign
Participation in milk marketing
cooperative activities
Whether farmer participates in
activities or not (Dummy
1=participates, 0=otherwise)
+
Access to credit Dummy (1=access, 0=otherwise) +
Access to information Access to information from the
MCC through the mobile phone,
Dummy (1=yes, 0=no)
+
Distance to MCC Distance to MCC representing
access to market
km, ±
Price of milk Continuous variable USD, +
Commercialization index Commercialized output of the milk
produced
3.11 Data Entry and Analysis
After completion of data collection, data cleaning was performed by the researcher. Open ended
questions were post coded before data entry. Data were entered using the Census and Survey
Processing Programme (CSPro) version 6.1. The main advantage of using CSPro in data entry
is that the data entry forms can be designed to look like the questionnaire used in the survey, and
Page 84
68
range checks and data entry options to minimize data entry errors can be specified. Data were
transferred to and analysed using Statistical Package for the Social Sciences (SPSS) version 16
and STATA. Preliminary data analyses and cleaning was performed using SPSS. The SPSS data
files were saved as STATA files. This was done to facilitate analysis of data that could not be
performed in SPSS such as Tobit analysis. Descriptive statistics were used to summarize the data
while regressions were used to assess relationships between dependent and independent
variables. Microsoft Excel was used to perform benefit cost analysis and simulations for the ex-
ante assessment of the animal production and forage centre.
3.12 Study Contribution to the Body of Knowledge
According to Wanjala et al. (2015), there is limited information regarding empirical evidence
for selecting interventions based on quantitative information and demonstration of what the
impact of such interventions would be in value chain upgrading. This study therefore contributes
to the body of knowledge on value chain analysis in smallholder dairies and how value chains
can be upgraded for the benefit of smallholder farmers in order to significantly contribute to
formal chains for the enhancement of smallholder incomes.
This study hypothesizes introducing a value chain intervention of an animal production and
forage centre. The study performed an ex-ante analysis of the impact of this on the profitability
of the intervention to the farmer milk marketing cooperatives. The ex-ante assessment and
evaluation of the model was performed and if proved economically viable, will constitute a new
model for smallholder dairy development in Zimbabwe and the whole of the Southern African
region.
There is a paucity of literature on smallholder dairy in Southern Africa. The study also
contributes to knowledge and literature through the comprehensive analysis on the effect of
Page 85
69
policies on the performance of the dairy sector since independence. In addition, the study also
contributes to micro-level policies that are needed to boost milk production and increase
commercialization by smallholder farmers who are now the main drivers of dairying in
Zimbabwe post the Fast Track Land Reform and Redistribution (FTLRR) programme
implemented from the year 2000. According to Ogutu et al., (2014) information asymmetry has
traditionally constrained smallholder farmers’ access to markets and consequently limiting their
adoption of modern technologies and farm productivity. Improved smallholder farmers’ access
to markets via the recent information and communication technologies platforms has the
potential to reverse this scenario (Ogutu et al., 2014). The study also shows the role of
information and communication technologies (ICT) in terms of the use of mobile phones in the
provision of information in smallholder farming.
In this study, smallholder is defined to include small scale commercial, communal and old
resettlement areas, which have different land tenure systems giving farmers differential access
and rights to the land. According to the Commission of Inquiry into Appropriate Agricultural
Land Tenure Systems (1994) small scale commercial farms have freehold tenure, while in the
communal the land is state owned under traditional rights to the land while in the old resettlement
the state owns the land with farmers granted rights through a permit issued by the Minister
responsible for agriculture. This study contributes to the understanding of the relationships
between milk production and tenure systems in Zimbabwe in the context of smallholder
agriculture.
The study further contributes to the literature on the role of farmer organization in general and
milk marketing in particular. The study shows the role and contribution of farmers’ organization
to commercialization of smallholder agriculture.
Page 86
70
CHAPTER FOUR: A REVIEW OF SMALLHOLDER DAIRY DEVELOPMENT IN
ZIMBABWE 1983 TO 2013: THE EFFECT OF POLICIES1
4.1 Introduction
This chapter reviews dairy development in Zimbabwe from 1983 to 2013 in order to answer the
first objective of the study which is to analyze trends in smallholder milk production and
marketing including the effect of policies since the introduction of the smallholder dairy
development programme in 1983. The chapter reviews literature and analyses of published,
unpublished reports and documents, and statistics in order to assess the effect of policies and
identify constraints in the smallholder dairy value chain. The policy periods were grouped, with
the first group being the “single market channel” covering the years 1980 to 1989; the second
group being the “ESAP era” covering the years 1990 to 1999; the third group being the “Land
Reform era” covering the years 2000 to 2008; and finally the fourth group was the “Dollarization
era” covering 2009 to 2013. This chapter therefore examines smallholder dairy development
within the context of the policy frameworks since 1980, analysis of trends and comparative
analysis of smallholder within the context of national milk intake and trends.
4.2 Review of the Developments in Milk Production in Zimbabwe
Dairying in Zimbabwe has long been the preserve of Large Scale Commercial (LSC) farmers.
At independence in 1980, LSC farmers supplied all the milk entering the formal marketing
channels. Although milk was also produced in the communal areas, this was mainly for
subsistence purposes (Chavhunduka, 1982). The major distinction between the LSC farms and
the smallholder farms that comprises communal, small scale commercial and resettlement areas
was that large scale commercial farmers mainly kept exotic dairy breeds which produce better
1 This Chapter is based on a paper published in Livestock Research for Rural Development (LRRD) by
Chamboko T and Mwakiwa E. 2016. A review of smallholder dairy development in Zimbabwe 1983 to 2013: the
effect of policies. Livestock Research for Rural Development. Volume 28, Article #113. Available at
http://www.lrrd.org/lrrd28/6/cham28113.html. (Full Paper in Annex 4, Paper 1).
Page 87
71
milk yields compared to smallholder farms where indigenous breeds with low milk yields were
kept (Chavhunduka, 1982).
4.2.1 Large Scale Commercial Dairying
Large scale commercial dairy farming in Zimbabwe dates back to 1910 when the colonial
government took steps to stimulate dairying as an enterprise (Muzuva, 1989; Mupeta, 2000).
The government at that time put in place extension and training in milk production for the
farmers2. Over the years milk production expanded and the first milk processing plant was
established in Gweru in 1912. Milk was then mainly handled by producer cooperatives. In 1947,
the government introduced the Milk Subsidy Committee to enable consumers to access milk.
However, by 1949, the producer cooperatives were facing financial difficulties. The financial
difficulties facing the cooperatives led to disruptions in the handling and distribution of milk and
milk products and seasonal shortages. As a result, white urban consumers gave pressure to the
colonial government to improve on availability of milk. The white urban consumers also queried
the introduction of the Milk Subsidy Committee since consumers could not get the milk. This
forced the colonial government, under pressure from the predominantly white farming
electorate, to set up a Milk Marketing Committee. The main purpose of the committee was to
purchase milk directly from producers for resell to distributors. The government in 1952, in order
to improve on the availability of milk and milk products to consumers, set up the Dairy
Marketing Board (DMB) to purchase all milk and dairy products, process, distribute and import,
as well as to construct and operate milk processing plants (Muzuva, 1989).
According to Muzuva (1989) milk supply and demand problems in the 1960s period necessitated
the government to set up a Commission of Inquiry into the dairy industry. The commission in
its 1961 report concluded that the post war economic climate in the country necessitated the
2 Most of the materials in this section is drawn from Muzuva (1989).
Page 88
72
official policy to stimulate milk production. Government was also forced to come up with
alternative marketing strategies since the supply in the 1960s was growing faster than demand.
One of the strategies was to stimulate milk consumption by the urban black population.
Skimmed milk derived from butter manufactured for the urban white consumers was therefore
used to produce lacto (dairy “sawa”) for provision to welfare schemes for black children
attending nursery schools. In addition, a network of depots was set up in the high density areas
where predominantly the black population resided. These measures resulted in a high off take of
milk and milk products.
At independence in 1980, the new majority government administration inherited the milk and
milk products production and marketing that was dominated by white large scale commercial
farms and marketed through the DMB. However, the government faced a situation similar to the
colonial government post second world war situation of improved purchasing power and
increased access to milk by outlying areas (Muzuva, 1989). In order to accommodate the increase
in domestic milk sales, exports sales were interrupted. It should be noted, however, that the
increased demand was based on uneconomically low consumer prices due to the subsidies policy
that was maintained by the government in early years of independence (Muir-Leresche and
Muchopa, 2006).
4.2.2 Why smallholder dairying after independence?
The Government of Zimbabwe adopted the growth with equity objective at independence in
1980 (Zimbabwe Government, 1981). In order to fulfill this objective, the Government of
Zimbabwe in 1980 embarked on a programme to support and promote the participation of
previously disadvantaged groups in formal markets (Muir, 1994). Previously, dairy production
and marketing was dominated by LSC farmers with little participation of communal and small
scale commercial farmers. A 1982 commission of Enquiry into the Agricultural Industry
Page 89
73
indicated that milk production in the communal areas was mainly for subsistence purposes, and
exotic breeds were not kept and the yields were very low (Chavhunduka, 1982).
4.2.3 Evolution of Smallholder Dairying
The analysis of smallholder dairying cannot be separated from the development of the Dairy
Development Programme (DDP). The DDP started as the Peasant Sector Development
Programme (PSDP) in 1983 under the DMB following a directive from the government on all
parastatals to promote the participation of indigenous Zimbabweans in sectors which had
previously been dominated by white large scale commercial interests (DDP, 1997). This created
an opportunity for DMB to establish strong linkages between the board and its primary producers
in order to add value to the primary milk product. DMB also saw this as an opportunity to expand
the raw milk production supply base and secure increased supplies due to demand increase for
milk in both rural and urban areas after independence. The increased demand in both the rural
and urban areas was not matched by an increase in the production base. The production base
inherited at independence comprised of approximately 500 LSC dairy producers which was no
longer able to cope with the increased national milk demand.
4.2.4 The First Communal Farming Area Dairy Scheme
Following the government directive, DMB initiated a feasibility study to consider the potential
for a milk collection scheme in Chikwaka in 1983 (DMB, 1988). Chikwaka was selected because
of its proximity to the capital city of Harare, and its location in agro-ecological region IIa which
receives 800 to 1000 mm of rainfall per annum and was therefore considered suitable for
intensive systems of crop and livestock production. Although the initial objective was to produce
milk only, several other constraints that hindered the attainment of this objective were identified.
The major constraints identified were (1) lack of properly managed and controlled grazing (2)
the cattle dips were too far (3) water shortages (4) poor sanitary facilities (5) lack of knowledge
Page 90
74
of dairying and (6) low milk yields produced by indigenous stock. The constraints needed to be
overcome before smallholder dairying could be introduced to the communal area.
A planning committee encompassing all government departments and different groups and
associations was formed to coordinate and plan the activities in order to overcome these
constraints. A socio-economic study performed in the area showed that smallholder dairying
could not be considered in isolation, but as an integral part of the farming systems pertaining to
many communal areas of Zimbabwe. The DMB, as a result, was forced to collaborate and work
with other Ministries, agencies and farmer associations in developing smallholder dairy
production and marketing. The DMB as the lead institution appointed a project officer and three
liaison officers to work with farmers and maintain and links with the board. The Rural District
Council donated a 10 hectare plot for the construction of the milk collection centre and for
establishing a demonstration plot for training services to farmers. Other donors also intervened,
and the European Economic Community (EEC) funded the Kawoyo grazing scheme with
farmers contributing labour to the project. The Dutch Embassy provided building materials for
the construction of a dip tank, while DMB sourced and sold building materials at cost price for
the construction of latrines. The DMB also purchased a rig in order to help the community drill
boreholes. On the 22nd December 1987, a total of 13 farmers altogether brought a total of 136
litres of milk to the collection centre (DMB, 1988). The Chikwaka milk collection centre became
a reality and thus became the first to be established in a communal area as part of a broad based
development programme centred on milk production (DDP 1995). The centre was then
registered by Dairy Services as a producer-retailer in line with changes to accommodate the
smallholder areas.
Page 91
75
4.2.5 The First Small Scale Commercial Farming Area Dairy Scheme
The DMB’s second pilot study to establish another smallholder dairy scheme was undertaken in
Marirangwe small scale commercial farms. This was in response to a group of farmers from
Marirangwe who had approached the Board in mid-1983 to express their interest in entering the
commercial dairy industry. Following on this expression of interest, a decision was then made
to perform a study to assess the technical capacity of the farmers in the area. The organizational
aspects of the milk collection centre that was to be eventually established were left to the
community. The study was then facilitated by the Department of Agricultural Technical and
Extension Services (Agritex) at both local and provincial levels. According to DMB (1984), the
list of farmers’ submitted by the local extension worker indicated a total of 21 farmers were
interested to participate in the milk production and marketing project.
Following on the completion of the assessment of the community resource base and profile, the
DMB concluded that a smallholder dairy project had a good chance of success. There were
several factors considered in the assessment that were in favour of such a smallholder dairy
scheme (DMB 1988). Firstly, farmers from Marirangwe had previously expressed interest in
dairying before Zimbabwe’s war of liberation. Secondly, farmers in the area were aware of the
potential benefits such a scheme would bring to the community. Farmers needed to earn an
income from one of their major assets (cattle). Thirdly, farmers in the small scale commercial
farming area were sufficiently motivated to form committees to run the scheme and appoint the
necessary staff. Fourthly, Agritex reported that 75% of farmers in the area were receptive and
could easily adopt new ideas and lastly, the farming area was close to some of the big LSC dairy
producers who were prepared to offer advice, bull service and possibly heifers (or crossbreds)
for sale to the new smallholder dairy schemes producers.
Page 92
76
However, before the milk collection scheme could be established, it was realized there were
factors that militated against the successful establishment of the scheme. These included training
and extension services for farmers, the types of milking sheds to be constructed, issues to do
with dairy herd improvement and transport for those farmers who were fairly distant from the
milk collection centre (maximum of 10 km). The Dairy Act and Regulations that were enacted
during the colonial era were another major constraint in the implementation of the project in
Marirangwe (DMB 1984). According to DMB (1984) the cost of constructing the type of milking
facility that was prescribed in the Dairy Act was not feasible nor essential for smallholder
farmers. The DMB therefore recommended that possible changes to the Act could be requested
after using Marirangwe as an experimental project. This would enable the research team to assess
problems likely to be encountered and changes to the Act that could be safely requested. Some
of the requirements of the Dairy Act were finally waived in order to enable smallholder farmers
to participate in milk production and marketing. During the early implementation of Marirangwe
smallholder dairy project, the research team collected crucial experience based data on
smallholder milk quality, optimal milk carrying distances, appropriate milk testing procedures,
sterilizing equipment, frequency of milk collection, seasonality of milk supply and others. This
enabled the Marirangwe milk collection centre to be established and it was envisaged the scheme
would be handed over to farmers after two years. The milk collection centre (MCC) initially
catered for the local community’s fresh milk requirements and the surplus was marketed at the
DMB Harare Dairy.
4.2.6 Major Policies during the Period 1980 to 2013
The 1980 to 2013 period has seen the Zimbabwean economy undergoing major policy shifts.
The first ten years (1980 to 1990) were characterized by a single channel marketing system under
which statutory parastatal organizations operated for most of the major agricultural commodities,
including dairy (Muir, 1994). The statutory parastatal organization responsible for dairy was the
Page 93
77
Dairy Marketing Board (DMB), formed in 1952. The DMB had monopoly in the purchase,
processing, distribution and external trade of all dairy products. Government administered
producer prices, and also set both wholesale and retail prices. Prices were established pan-
territorially, and pan-seasonally. However, milk producer prices were not set pan-seasonally as
these were adjusted to take into account changes in farmer feeding costs. According to Chidzero
(1994), the major policy thrust in the first decade of independence was to bring about social
transformation which would positively redress the socio-economic imbalances which existed
prior to independence. Government therefore introduced or reinforced price controls as part of
the principle of growth with equity. However, one of the implications of these price controls was
the continued subsidization of marketing boards. As a result the government between 1980 and
1990 paid the DMB an average of about USD4 million per annum (ZWD34 million at 1994
exchange rates) in direct consumer subsidies (Muir, 1994).
The problems with the subsidies in the first decade of independence was that they were not
targeted at particular groups of people, and therefore did not benefit the intended beneficiaries.
The price controls at the same time also discouraged investors. Government in 1990 then
launched the Economic Structural Adjustment Programme (ESAP) which was aimed at
stimulating investment and economic activity. The policy reforms envisaged under ESAP
entailed moving away from a highly regulated to an economy where market forces were expected
to play a greater role within the context of government objectives (Chidzero, 1994). As part of
the reforms, the DMB was initially commercialized and later privatized in 1993, and the
company turned from losses to profits in the same year. However, although the company
achieved profits, this was achieved against low producer prices which were reflected in the
steady decline in the LSC herd from 115,000 in 1993 to 82,000 head in 1999 (Muir, 1994).
The fast track land redistribution programme was launched in the year 2000. This period was
characterised by massive land occupations and economic decline and crisis (Moyo, 2006). The
key elements of the fast track land reform and redistribution programme were speeding up of
Page 94
78
identification and compulsory acquisition of land for resettlement, accelerating planning and
demarcation of acquired land and settler emplacement on the land, and providing basic
infrastructure and farmer support services. The effects of the fast track land redistribution
programme, coupled with droughts, resulted in dairy animals being sent for slaughter. Overall
production in all sectors of the economy declined during the period 2000 to 2008, including the
dairy industry. During this period, dairy farmers were forced by the economic situation to barter
milk for stock feeds. The introduction of the government of national unity in 2009, coupled with
the introduction of the multicurrency regime enabled the economy to slowly rebuild.
4.3 Analysis of Milk Intake
4.3.1 Trends in National Milk Intake
The trends for national milk production shows that milk production steadily increased in the
period 1980 to 1990, reaching a peak in 1991, and steadily declined from 1991 up to 2009, when
it started slowly going up (Figure 4.1). The peak production period was achieved in 1991 at 260
million litres. Since then, milk production has steadily declined, reaching as low as 37 million
litres in 2009. Although the decline started during the period the government implemented the
ESAP in the early 1990s, the fast track land reform and redistribution programme also led to
further decline in dairy production in terms of milk production, number of producers and the
total dairy herd (Figure 4.1).
Page 95
79
Figure 4.1:Zimbabwe national milk intake from 1980 to 2012
Source: Dairy Services (2012)
4.3.2 Effect of Policies on National Milk Intake
Analysis of Variance (ANOVA) results of national milk intake on policy periods shows that
policy periods had significant effects on milk production (p<0.1; F3, 28 =24.10; at 1%; and N=31).
This shows that the policies had an effect on national milk intake. The multiple comparison using
Tukey post hoc multiple comparison tests show that there were significant differences in national
milk intake between the single channel market period and ESAP, and between ESAP and the
land reform and dollarization periods. These results are summarized in Figure 4.2 and show the
interactive bar graphs and the results of the multiple comparison tests.
0
50
100
150
200
250
300
19
80
19
82
19
84
19
86
19
88
19
90
19
92
19
94
19
96
19
98
20
00
20
02
20
04
20
06
20
08
20
10
20
12
Mill
ion
litr
es
Years
Page 96
80
Figure 4.2: Mean (±95% CL) national milk intake (million litres) for different policy periods
interactive bars. Numbers in bars are subgroups in descending order based on multiple comparison
tests Source: Dairy Services (2012)
4.3.3 Trends in Smallholder Milk Intake
The trends in smallholder milk intake show that it reached a peak in the year 1995 with about
3.6 million litres, and steadily declined up to the year 2000, when about 1.4 million litres of milk
were produced. From 2000 onwards, milk intake fluctuated and dropped significantly in 2008
when about 78 thousand litres were produced possibly due to economic challenges faced by
farmers and the effects hyperinflation in the economy. The trend started showing a steady
upwards movement from the year 2009 with the introduction of the multi-currency system or
dollarization (Figure 4.3).
Page 97
81
Figure 4.3: Smallholder milk intake (million litres) 1988 - 2012
Source: DDP (2012)
4.3.4 Effect of Policies on Smallholder Milk Intake
The ANOVA produced the following results (p< 0.1; F 3, 21 = 9.47 at 1%; N=24). These results
show that policies had an effect on smallholder total milk intake. Multiple comparison using the
Tukey post-hoc multiple comparison tests also show a significant difference between the single
channel market period and ESAP, ESAP and land reform period, and ESAP and dollarization,
while there were no significant differences between the policy periods land reform and single
channel market. There were also no significant differences between the policy periods
dollarization and single market and dollarization and land reform. These results are summarized
in Figure 4.4.
0.00
0.50
1.00
1.50
2.00
2.50
3.00
3.50
4.00
Mill
ion
litr
es
Years
Page 98
82
Figure 4.4: Mean (±95% CL) smallholder milk intake in litres for different policy periods
interactive bars. Numbers in bars are subgroups based on multiple comparison tests.
Source: DDP (2012)
4.4 Effects of Polices on Milk Intake of Selected Smallholder Dairy Schemes
In order to understand the effects of the policy frameworks periods on smallholder dairy scheme
level milk intake, interactive bar graphs and ANOVA were performed for two smallholder dairy
schemes of Rusitu and Marirangwe for which data were available. These schemes form some
part of the early development of organized smallholder dairying in the resettlement and small
scale commercial areas, respectively. The results are shown in Figures 4.5 and 4.6 respectively.
Page 99
83
Figure 4.5: Mean (±95% CL) Rusitu dairy scheme milk intake in litres for different policy
periods interactive bars. Numbers in bars are subgroups based on multiple comparison tests.
Source: DDP (2012)
Figure 4.6: Mean (±95% CL) Marirangwe dairy scheme milk intake in litres for different
policy periods interactive bars. Numbers in bars are subgroups based on multiple
comparison tests.
Source: DDP (2012)
Page 100
84
ANOVA results for Rusitu (p=0.05; F 3,19 = 3.128; N=22) and Marirangwe (p=0.08; F 3,18 = 2.65;
N = 22) smallholder dairy schemes indicate that there were no significant differences in the
policy periods at 1%. Multiple comparison using the Tukey multiple comparison tests for both
Rusitu and Marirangwe show that there were no significant differences in the four policy periods
of single channel market, ESAP, land reform and dollarization.
4.5 Discussion
4.5.1 Effect of Policies on National Milk Intake
These results explain some of the major policies and investments that have gone into dairy
production over the period. Although the analysis assumes that policies implemented by
government were the major drivers of milk production and the trends observed, it is important
to note that there are possibly other factors that were not controlled for that can contribute to the
observed trends in milk production. During the period 1980 to 1990, the Government of
Zimbabwe (GoZ) in February 1983 through an agreement with Norway received a donation of
bulk milk tanks, which led to the creation of the bulk milk collection scheme. The aim was to
modernize and stimulate milk production from the LSC producers (AMA, 1987). According to
the AMA (1987) the bulk milk collection scheme signaled a significant investment in the dairy
sub-sector and played a major role in encouraging new farmers to enter the industry. By the end
of June 1987, a total of 318 tanks were operational and 70% of milk intake was collected through
the bulk milk collection scheme. Due to the success of the scheme, a further agreement was
signed between the GoZ and Norway in 1987. The agreement was for the supply of an additional
200 milk collection tanks. With the supply of the additional 200 farm tanks, it was expected that
95% of the milk would be handled through the bulk tank milk collection scheme. Large Scale
Commercial farmers participating in the bulk milk scheme leased the bulk farm tanks from the
DMB and paid rental charges. The rentals income generated from the scheme was channeled to
developing the smallholder dairy industry (in small scale commercial and communal farming
areas), and the rentals were supposed to be over a 15 year period. The bulk milk tanks rentals
Page 101
85
were instrumental in financing the early development of the smallholder dairy schemes and were
supposed to generate USD 2.3 million (ZWD$12.6 million at 1992 exchange rates) over the 15
year period (NORAD, 1992). Cumulatively, for the period 1984 to 1991, USD0.7 million (Z$3.4
million at 1991 exchange rates) of counterpart funds had been used to finance the development
of smallholder dairy, with USD0.9 million (ZWD$4.6 million) from Norwegian Agency for
Development Cooperation (NORAD), government USD185, 882 (ZWD$948,000), other donors
USD29, 803 (Z$152,000) and farmers USD135, 490 (Z$ 691,000).
According to the AMA (1987), the improvements in the dairy industry led the DMB in the
1986/87 season purchasing 224 million litres of milk from producers which exerted severe
pressure on the DMB’s handling capacity. This could possibly explain that the policies such as
the bulk milk collection scheme were having a positive impact on milk production. During this
period, DMB had monopoly in milk trading and the prices were controlled by government. This
possibly indicates the price incentives that were implemented by government to stimulate milk
production. The AMA (1987) also reported that while the urban markets were well supplied with
milk, there was an estimated shortage of milk in rural areas of about 145 million litres per annum.
This prompted government to task the then Dairy Coordinating Committee within the Ministry
of Lands, Agriculture and Rural Resettlement to develop a strategy for the dairy industry which
incorporated the peasant sector (smallholders) as part of the productive base. The smallholder
sector then had only two operational schemes of Marirangwe in the small scale commercial and
Chikwaka in the communal farming areas. This led to further developments in the smallholder
dairy development programme and by 1987; there were several other smallholder dairy projects
at various stages of development. These were located at Nharira, Tsonzo, Lancashire, Guruve,
Zvimba, and Chitomborwizi. Each project involved research, pasture and forage management
on a demonstration plot aimed at improving dairy production, installation of milking sheds and
milk collection centres (AMA, 1988).
Page 102
86
During the ESAP period, a number of dairy producers and cooperatives were registered and these
competed directly with the privatized Dairibord Zimbabwe Limited (DZL). However, overall
milk production continued to decline as efforts were continued to build the smallholder dairy
sector. During the fast track land reform and land redistribution programme that started in 2000,
the number of registered large scale commercial dairy producers were reduced from 314 in 2000
to 135 in 2011 (LMAC, 2012). The numbers of female dairy cattle were reduced from about
70,000 in 2000 to about 23,000 in 2011. This is in contrast to the number of dairy animals at
peak milk production, which was estimated at 200,000 (DZL, 2009). According to USAID
(2007), during the period 2000 to 2008 when the country was experiencing economic problems,
GDP in constant prices over the five years to 2006 contracted at an annual rate of 5.8%, which
was among the world’s worst performance. This decline in the economy continued to the year
2008, which was characterized by hyperinflation.
4.5.2 Effect of Policies in the Different Policy Periods on Smallholder Milk Intake
These results show the effects of policy on dairy production during the 1980 to 2013 period in
the smallholder areas. Since the results show that there were no significant differences, this
indicates that there may be other factors other than policies that affect milk production at the
smallholder dairy scheme level. According to Dube (2008) it is important to note that in the
smallholder areas, milk intake does not reflect production as approximately 30 to 40% of milk
produced by farmers is assumed retained for home consumption and calf rearing needs.
Smallholder dairy only started in 1983 with financing from funds generated from the bulk milk
tank collection scheme introduced in the same year, hence the birth of the DDP. The DDP acted
as the implementing body of the smallholder dairy development projects in communal,
resettlement, and small scale commercial farming areas (AMA 1988). The role of the DDP since
its formation has been to facilitate the infrastructural development and training needs of the
farmers. In April 1989, the DDP was transferred from the DMB to the Agricultural and Rural
Page 103
87
Development Authority (ARDA). According to the DDP Phase II strategy (July 1988 to October
2003), the transfer of the DDP was necessitated by the redefinition of the mandates of parastatals
in preparation for the Economic Structural Adjustment Programme (ESAP), which was launched
in 1990. The transfer to ARDA, which is a development organization was necessitated since
DMB was regarded a milk processing organization. ULG Consultants (1994a) cited the
concentration of DMB on the commercial side of its operations as necessitating the transfer.
Also, the fact that ARDA had been operating the Rusitu small scale dairy resettlement scheme
since 1983 with assistance from the Overseas Development Association (ODA) made it a
suitable home for DDP. DDP (1989) further proposed the integration of Rusitu into DDP because
both schemes dealt with smallholder milk production. The integration of Rusitu brought the
number of dairy schemes under ARDA to 10. In addition there was Nyarungu Training Centre
dairy scheme which catered specifically for the training needs of smallholder farmers.
When DDP was transferred to ARDA, there were successful negotiations which led to NORAD
directly funding DDP to the tune of NOK 25 million (about USD1.2 million at 1998 exchange
rates) for the period 1990 to 1997. According to ULG Consultants (1994b), the development
model used by DDP had been tried and tested in other countries and adapted to the Zimbabwe
situation. The model used has the following characteristics:
(1) At the request of the local community, DDP moves into an area to assess the potential
for milk production and the interest of the community to come together as a group to
produce and sell milk;
(2) DDP then uses the team approach to organize participants into a group, then mobilizes
the input supplies (including finance and dairy animals), services and milk collecting
infrastructure required to produce and market milk surplus to domestic needs through the
group milk collection centre (which is usually a bulk milk tank and feed store in a small
building);
Page 104
88
(3) The support also includes assistance to manage the group, to construct milking sheds, to
rent a bulk milk tank from the National Dairy Cooperative (NDC) and if appropriate to
acquire other processing equipment;
(4) The Ministry of Agriculture Dairy Services licensing has also been modified to
accommodate such small scale groups treating the group as one producer-retailer;
(5) Each member producer has to have a small milking shed or parlour, or access to a shed
or parlour for milking the cows. The required milking parlour specifications have also
been modified by Dairy Services to accommodate smallholder dairying.
According to ULG (1994b), members have a say in how the group is organized. DDP usually
would first encourage members to form an association, which would give the group legal status.
DDP, with assistance from Agritex would then train the members in milk production and farm
management, and provide extension services during the start-up phase. Initially, members would
start with indigenous cows, progressing to crosses and pure breeds as they gain management
experience.
The development model used by ARDA has largely been followed, although there were no new
dairy schemes established during the period 2000 to 2008. There are currently a total of 20
smallholder dairy schemes countrywide (excluding Nyarungu Training Centre dairy scheme).
An additional eight potential dairy schemes have been identified but these are not yet operational
because there has been no infrastructural development for the dairy schemes.
4.6 Constraints to Smallholder Dairy Development
Having considered the effects of policies on smallholder milk intake, it is thus necessary to assess
the empirical research performed in the smallholder areas to understand some of the constraints
hindering the development of this sector. The DDP (1989) indicates that although the key to the
dairy programme is appropriate technical skills and the establishment of a milk marketing
Page 105
89
infrastructure (especially the multi-purpose milk centres for handling milk, etc.), the DDP is a
broad based programme designed to develop people through the initiation of a development
process rather than purely the development of cows. This broad based approach could possibly
explain why there have been various factors constraining the development of smallholder
dairying in Zimbabwe. This is mainly because the main focus of DDP is not 100% dairy
development, but focusing on a multifaceted development programme. The development
projects that have been piloted by the DDP in all the provinces are supposed to be centres
realizing the potential for sustainable multifaceted development programmes (DDP 1989). The
DDP (2007) reports that the main challenges facing smallholder dairy development include the
following:
(1) Inadequate funding;
(2) Inadequate feed availability on the farm which is the most limiting factor to increased
milk production;
(3) High costs of inputs (feed and drugs) relative to producer prices;
(4) High animal mortalities;
(5) Ineffective marketing strategies of dairy products;
(6) Lack of dairy husbandry skills and business/entrepreneurial skills which are important in
dairy projects;
(7) Shortage of appropriate dairy breeds; and
(8) Limited involvement of women and youth.
Despite the constraints, a number of schemes have been developed over the years. These have
been supported both by government and the donors. In one of the mid-term evaluation of Africa
Now’s commercial cultured milk production, there was an indication that on average, three cows
were being milked by smallholder farmers (Jordan, 2002). These produced 10.3 litres in the
morning while an average of 6.2 litres were produced during the evening, giving a total
production of 16.5 litres and an average production of 5.5 litres a day per cow being milked.
Page 106
90
Jordan (2002) concluded that most small scale farmers did not consider dairying as a business
although young farmers in schemes such as Marirangwe had the potential to approach this as a
business. Holness et al., (2008) also conducted an impact assessment and report for Africa Now’s
DDP supported projects for the period 2006 to 2008. They concluded that the potential for milk
production is large throughout the country. However, Holness et al. (2008) also noted that the
main reason for the low milk production was lack of feed on a 12 month basis particularly
insufficient quantities and quality of fodder. This clearly demonstrates the need to come up with
alternative and innovative strategies for providing feed and fodder that is accessible to farmers.
4.7 Potential for Smallholder Dairy Development
The potential for smallholder dairy development lies in overcoming the constraints identified.
Since the programme started in 1983, research was also initiated by universities and other
research institutions. Mupeta (2000) contend that research into smallholder dairy only
commenced in support of government projects and programmes after independence. Sibanda
and Khombe (2006) notes that since smallholder dairy was a new production system introduced
after independence, most of the research initially focused on gaining an understanding of
constraints and potential opportunities. Prior to independence, most of the dairy research and
development was targeted at large scale commercial farmers (Sibanda and Khombe, 2006).
Rukuni (2006) highlights some of the prime movers that were responsible for increased
production and marketing for crops in the first decade of independence. These included
investments and improvements in new technology, performance of institutions such as
marketing, credit, research and extension. In dairying, most of these investments were directed
at the large scale commercial farms, with little investments at the smallholder level.
Most of the research initially carried out in Zimbabwe was in response to the challenges
experienced as dairy development progressed (Sibanda and Khombe, 2006). There were issues
Page 107
91
related to both production and marketing. The main production issue centres on fodder
production. This issue in turn also affected the nutrition of the dairy cows. The DDP (1998/99)
questioned whether after 17 years of assistance farmers were sufficiently empowered to take
over the operations of the schemes. This was because the analysis of DDP as they moved from
the Phase I projects to Phase II projects showed that there was a decline in milk production from
the schemes where DDP had left the management in the hands of the community, with minimal
supervision. The analysis showed that the decline was attributed to the following reasons:
(1) Reduction in the number of active farmers as a result of high dry cow percentage due to
fertility problems as a result of low nutrition;
(2) Insufficient feed resources produced and conserved by farmers;
(3) Exorbitant prices of commercial feeds;
(4) Productive stock too old as the rate of replacement was low and the absence of proper
culling procedures due to lack of replacement heifers;
(5) Cost of purchasing heifers from commercial dairies was prohibitive;
(6) Calf management practices was still an area of concern as generally calf mortality was
high resulting in reduced replacement stock from the existing herd;
(7) Farmers did not have sufficient know-how to process and market all produce, as the
initial thrust was on boosting production without putting the necessary instruments for
processing in place. As a result, most projects could not process and sell all milk giving
rise to low pay out rates. This dampened farmer morale and most farmers started to side
market.
The DDP 1998/99 Annual report highlighted there seemed to be an over reliance in the
smallholder dairy schemes on grazing and brought-in feeds, a position that was considered not
profitable and unsustainable. The DDP Report (1998/99) also assessed and situation of Gokwe
smallholder dairy scheme which was financially stable due the high adoption of fodder
production which increased productivity and benefits of low cost feeds to farmers. The position
Page 108
92
of home produced fodder is also supported in another report (ULG Consultants 1994b). ULG
Consultants (1994b) concluded that one of the key success factors of smallholder dairying was
for the programme to encourage milk production in areas where it was economically viable,
based largely on home produced fodder and easy access to remunerative markets.
Empirical research conducted by Ngongoni et al. (2006) show that the major factors affecting
dairy production in the smallholder sector were low levels of nutrition and management practices
responsible for the poor milk yields performance, low calving intervals, late age at first calving
and long intervals. Shortage of feed and transport are cited as the major constraints faced by
smallholder dairy farmers in the semi-arid areas (Chinogaramombe et al., 2008). Francis and
Sibanda (2001) and Ngongoni et al. (2006) highlight problems identified as limiting dairy
production. They further contend that age of calving of heifers, low productivity due to
inadequate availability and poor quality of feeds, expensive commercial feeds, heavy tick
infestation and high incidence of tick-borne diseases, excessive calf mortality and inadequate
knowledge on appropriate livestock management practices further limited dairy production.
Mupeta (2000) also documented the constraints facing smallholder production, with particular
reference to feed resources. Mutukumira et al. (1996) study showed that only 14% of the
households in the smallholder dairy schemes grew more than one hectare of fodder and these
were located mostly in the small scale commercial farming areas and Rusitu resettlement
scheme. Over 63% of the households grew less than 0.4 hectares with 43% growing less than
0.2 hectares in the communal areas (Ngongoni et al., 2006). Francis and Sibanda (2001) carried
out a participatory action research in Nharira-Lancashire and concluded that the poor
reproductive performance, low productivity and inadequate availability and poor quality of feed,
inadequate knowledge on appropriate management of cattle, high cost of commercially produced
feeds, high mortalities, high incidence of tick borne diseases, and excessive calf mortalities were
the major problems facing smallholder dairy farming in integrated crop-livestock systems.
Page 109
93
Masama et al., (2005) also conducted a study in order to develop an inventory of feed resources
available on farm, with the main purpose to eventually develop relatively cheaper home-made
feeds for dairy cows. Their results showed that farmers kept feeds of poor nutritional quality and
inadequate amounts to feed the dairy cows throughout the year. The research findings
highlighted the need for innovative, cheaper feed resource management systems that are
developed to ensure sustainable viability of smallholder dairying (Masama et al., 2005). Table
4.1 summarises some of these studies.
Table 4.1: Summary examples of empirical research studies highlighting the
fodder/feed constraint in smallholder dairy schemes
Year Authors Findings
1996 Mutukumira et al. Only 14% of the households in smallholder dairy
schemes grow more than one hectare of fodder.
2001 Francis and Sibanda Inadequate availability and poor quality of feed
identified as one of the major problems facing
smallholder dairy.
2005 Masama et al. Results showed that farmers kept inadequate amounts
of poor nutritional quality for feeding dairy cows year
round.
2006 Ngongoni et al. Major factors affecting dairy production include low
levels of nutrition and management practices
responsible for the poor milk yields.
2008 Chinogaramombe et al. Shortage of feed and transport cited as the major
constraints in semi-arid areas.
Source: Author Compilation (2014)
There were many marketing issues that also evolved as the smallholder dairy programme was
implemented. In the early schemes such as Chikwaka, a number of marketing options were
initially tried. The options included use of mobile vendors selling milk on bicycles and use of
donkey carts (Chikwaka Dairy Committee, 1987). A review of these options in 1992 showed
Page 110
94
that although bicycle vendors were able to cover a radius of 13km, there were problems in the
recruitment of the vendors where initial preference was given to members’ children, constant
breakdown of the bicycles due to improper handling and the rough roads, customers unable to
buy due to lack of money and cash shortages on the part of vendors in relation to the milk taken.
The vendors were paid on commission and this depended on the volume of milk at the centre,
condition of bicycles, season and the buying power of consumers. The donkey carts, on the other
hand, were found to be unsuitable due to the rather slow movement from village to village and
the distance covered was limited (10km). The slow movement also meant prolonged delivery
time resulting in some of the milk turning bad. People also felt the continual opening of the milk
cans contaminated the milk from the furs of the donkeys and dust. This necessitated the opening
of sub-centres where milk could be sold to the community with one for Chikwaka being opened
at Juru Growth point. The main problems at the sub centre were that the market was
unpredictable, milk was not delivered on time and there was no provision for containers for
selling the milk to passers-by buyers/consumers. Marirangwe initially focused on supplying the
local market. Rugube (1988) reports that the small quantities of milk produced did not justify
the delivery of the milk to Harare dairy. Therefore, the milk was mainly marketed locally to
schools, local business centres and nearby communal areas. It is reported that interestingly,
people from Harare also drove to buy milk from Marirangwe. However, by the mid-1985, the
immediate local market was saturated and the association tried to hire a private transporter to
carry the milk to Harare dairy, which proved to be too expensive. The association then negotiated
for a much bigger tank for cooling the milk and later selling to the market. The DDP (1991/92)
indicates that although 49% of the milk from the five schemes marketing milk at the time
(Marirangwe, Chikwaka, Nharira, Honde Valley and Tsonzo) was sold to the DMB, the main
reason for selling to DMB was the less hustles farmers encountered compared to local marketing.
However, it is also reported that the returns were higher with locally marketed milk compared
to DMB (DDP, 1991/92 Annual Report).
Page 111
95
Hanyani-Mlambo et al. (1998) performed one of the few studies on the socio-economic aspects
of smallholder dairying in Zimbabwe. The study used gross margin analysis at farm level to
show that smallholder dairying was hardly economically viable. Mupeta (2000) study, however,
showed the opposite. A number of other studies (Francis and Sibanda 2001; Zvinorova et al.,
2012) have also shown smallholder dairy production to be economically viable. The viability of
smallholder dairy therefore is influenced by a number of factors. The study by Hanyani-Mlambo
et al., (1998) showed identified constraints to production as labour bottlenecks, inadequate feed
and production inefficiencies, among others. Zvinorova et al. (2012) also indicated that milk
production was influenced by access to resources and markets. The studies by Hanyani-Mlambo
et al., (1998) and Zvinorova et al., (2012) show the effects of problems arising from limited
markets, narrow product base, recurrent droughts and stringent economic reforms. One can infer
that the effect of these identified problems has been the low participation of smallholder farmers
in the production and markets for dairy products. Muriuki and Thorpe (2002) indicated that in
Eastern and Southern Africa, with the exception of Zimbabwe and South Africa, most of the
dairy in all countries is dominated by smallholder farmers. This shows the need for a detailed
study in the smallholder dairy farming areas in order to understand why this subsector has failed
to have a significant impact on national milk production yet government and donors have been
putting resources to support smallholder dairy.
4.8 Summary
The key finding from this analysis is that milk production has been decreasing over time.
Although during the ESAP period, national milk production increased, it decreased during the
subsequent periods due to unwholesome package dedicated to its development and inconsistence
in policies. There is therefore need to implement policies that support dairy development and
provide conducive environment for its development. In addition there is need to capacitate both
Page 112
96
the LSC and smallholder farmers in order for them to increase dairy production. This could be
achieved through dairy production incentives. Although there are now a total of 20 smallholder
dairy schemes countrywide, some are currently not functional due to a number of constraints.
This calls into question the DDP’s smallholder dairy development model. The DDP’s
smallholder development model is broad based, suitable for multifaceted rural development and
may therefore not be suitable for effective targeting dairy development in the short to medium
term. While research has been carried out which indicates the need for farm feed resources as
one of the key elements for the success of smallholder dairy, coupled with an effective marketing
strategy for dairy products, smallholder dairy has not made a significant impact in terms of its
contribution to national milk intake, and therefore contribution to the national economy due to
constraints in accessing resources. There is need therefore, to reassess the development of
smallholder dairying and value chain development in order to unpack the potential contribution
of this subsector to the national economy.
Page 113
97
CHAPTER FIVE: FACTORS INFLUENCING MILK PRODUCTION IN THE
SMALLHOLDER DAIRY VALUE CHAIN
5.1 Introduction
Chapter Four reviewed the development of smallholder dairy in Zimbabwe for the period 1983
to 2013. The Chapter basically traces how organized smallholder dairy developed in Zimbabwe
under the Dairy Development Programme. In order to understand factors influencing milk
production in the smallholder dairy value chains, this chapter first describes the distinction
between the semi-formal and formal value chains in the context of the four smallholder dairy
schemes studied. The chapter then presents results of descriptive statistics of characteristics of
smallholder dairy producers in the four dairy schemes studied, the general ownership of
livestock, investments in dairy infrastructure and equipment, the dairy herd composition and the
main types of dairy breeds kept by farmers. The chapter also presents results on access to services
such as Artificial Insemination (AI) and the cost of such services, access to credit and extension
services, reproductive performance parameters of dairy cattle in the smallholder dairy schemes
as reported by farmers in the survey and milk production in the four schemes studied. The chapter
concludes with the presentation of and discussion of the results of the multiple regression
analysis of factors influencing milk production in the smallholder dairy value chain.
5.2 The Structure of the Smallholder Dairy Value Chain in the Four Study Sites
In order to understand the value chains in the four smallholder dairy schemes studied, this section
describes the smallholder dairy value chains of the four study sites based on interviews with
farmers and key informants. The dominant value chains studied are defined as the semi-formal
value chain and the formal value chain. The distinction between the two value chains is that the
semi-formal value chain supplies milk and dairy products predominantly to consumers in the
emerging rural service and growth centres, local community and low income groups in nearby
urban centres, while the formal value chains supplies milk to urban based processors that produce
a variety of dairy products to supply consumers predominantly in the urban centres of the
Page 114
98
country. The quality considerations of the two value chains are different, with the semi-formal
value chain being less stringent in terms of milk quality and value addition processes compared
to the formal value chains. Chikwaka and Nharira-Lancashire process the milk locally at the
dairy processing unit located at the MCC, to supply largely the semi-formal value chain while
for Marirangwe and Rusitu, the milk is delivered or collected by processors based in urban
centres for further processing to supply the formal dairy value chain. The semi-formal and the
formal value chains constitute the overall smallholder dairy value chains in the smallholder dairy
schemes in the country. The two value chains are described below.
5.2.1 Description of the Semi-Formal Smallholder Dairy Value Chain (Chikwaka and
Nharira-Lancashire study sites)
As already indicated, Chikwaka and Nharira-Lancashire smallholder dairy schemes that process
the milk at the MCC are considered to be the semi-formal value chains in this study. Chikwaka
smallholder dairy was registered with the Ministry of Small and Medium Enterprises as a Dairy
Cooperative in 2014. Previously, the smallholder dairy scheme operated as a farmer association
from its inception in 1983. The dairy scheme has a main centre MCC located near Juru growth
point, and a satellite MCC at Murewa 44, and some farmers located in Mwanza Ward which is
more than 10 km from the MCC. The market channels for the milk are relatively short. The milk
delivered by members is processed at the MCC. The centre processes the milk to produce mainly
yoghurt and Amasi (fermented milk). The products are mainly sold directly to consumers in the
local community, at Juru growth point, Shamva rural service centre, Mutoko growth point, and
Norton on the outskirts of the capital city, Harare. The scheme has benefited from a number of
donor funded projects previously, and was at the time of the research a recipient of a USD100,
000.00 grant from the United States African Development Fund (USADF). The scheme had
applied part of the funds to purchase a tri-cycle that is used to make product deliveries to
consumers in the growth points.
Page 115
99
Similar to Chikwaka the market channels for milk originating from Nharira-Lancashire is
relatively short. The milk delivered to the MCC comes from member farmers in the small scale
commercial area of Lancashire and Nharira communal area. The farmers mainly from the
communal area deliver milk to the main MCC on foot or using bicycles (distances of ±5km),
while the milk from some of the small scale commercial farming areas is collected using a truck
from the MCC (distances of ±10km). Farmers from the small scale commercial farms mainly
bulk the milk through sub-centre MCC from where it is collected to the main MCC for
processing. Nharira-Lancashire smallholder dairy scheme processes the milk delivered by
members at the MCC. The centre mainly produces yoghurt and Amasi. Some of the milk is sold
as raw milk. However, due to packaging constraints, individual customers intending to buy raw
milk need to bring their own containers. The products are mainly sold to the local community
(villagers, Nharira rural service centre and sales to local boarding schools), at Murambinda
growth point, Chivhu and Masvingo urban centres. The semi-formal smallholder dairy value
chain is presented diagrammatically in Figure 5.1.
Figure 5.1: Diagrammatic presentation of the semi-formal smallholder dairy value chain
(Chikwaka and Nharira-Lancashire smallholder dairy schemes)
Source: Author Compilation Based on Key Informant Interviews (2015)
Page 116
100
5.2.2 Description of formal smallholder dairy value chain (Marirangwe and Rusitu study
sites)
As alluded to earlier on, Marirangwe and Rusitu smallholder dairy schemes in this study are
considered as representing the formal value chains. According to key informants, milk is
delivered to Marirangwe MCC from the surrounding small scale commercial farms and from
some farmers located in the nearby communal area of Mhondoro who are into dairying. There
is no MCC processing. Until January 2015, Marirangwe smallholder dairy used to deliver the
milk to Kefalos, a private milk processor which is located about 12 km from the Marirangwe
MCC. Kefalos is one of the major dairy processors in the country, specializing in producing
mainly cheese and yoghurts for the formal markets in the country. At the time of the study, the
MCC was no longer delivering milk to Kefalos and key informants indicated this was mainly
due to the lower volumes of milk produced. The MCC was now mainly supplying milk to
processors from Harare who mainly collected the milk from the centre. The main buyers were
Milk Zim, which is a processor based in Harare. Two farmers who are producing milk on
medium to large scale basis from the Marirangwe smallholder dairy supplied directly to
processors in Harare. The two mainly supplied Competitive Brand Shapers (CBS) located in the
capital Harare. At Rusitu smallholder dairy scheme, the milk produced is collected by Dairibord
Zimbabwe Limited (DZL), a private company which is the successor of the former state owned
Dairy Marketing Board (DMB). DZL produces a variety of products, including Ultra high
temperature (UHT) milk, cheese, yoghurts and dairy related beverages for sale to consumers
predominantly in the urban areas of the country. Figure 5.2 gives a diagrammatic presentation
of the formal smallholder dairy value chain.
Page 117
101
Figure 5.2: Diagrammatic presentation of the formal smallholder dairy value chain (Marirangwe
and Rusitu smallholder dairy schemes)
Source: Author Compilation Based on Key Informant Interviews (2015)
5.3 Characteristics of Smallholder Dairy Producers in the Schemes Studied
This section presents the characterization of the smallholder dairy schemes, household
demographics, occupation and agricultural training of the head of household.
5.3.1 Characterization of the Smallholder dairy schemes
The total number of households interviewed in the four organized smallholder dairy schemes
was 185. In terms of the classification of settlement, Chikwaka smallholder dairy scheme is
located in a communal area, while Nharira-Lancashire smallholder dairy scheme encompasses a
communal area and small scale commercial farming area, Marirangwe smallholder dairy scheme
is located in a small scale commercial farming area, while Rusitu is in an old resettlement area.
Most of the smallholder dairy producers in the schemes had paid their membership fees and were
members of the dairy scheme (almost 100% in all the four schemes). The majority (about 74%)
in all the schemes were males, with 76% and 58% in Chikwaka and Nharira-Lancashire
Page 118
102
respectively compared to about 83% in Marirangwe and 82% in Rusitu. Most of the heads of
households were married (about 77% in all the four schemes), with 74% in Chikwaka and 70%
in Nharira-Lancashire compared with 80% in Marirangwe and 86% in Rusitu (Table 5.1).
Table 5.1: Characteristics of smallholder dairy producers by study site, 2015
Characteristic Chikwaka Nharira-
Lancashire
Marirangwe Rusitu Total
Total number of households
interviewed
n=50 n=50 n=35 n=50 N=185
Classification of settlement of
households interviewed (%):
Small Scale Commercial 0 48.0 88.6 0 29.7
Old Resettlement 0 0 0 100 27.0
Communal Area 100 52.0 2.9 0 41.6
New Resettlement 0 0 8.6 0 1.6
Registered Member of Dairy
Scheme: Registered and paid joining
fees (%)
100 100 97.1 100 99.5
Gender of household head (%):
Males 76.0 58.0 82.9 82.0 74.1
Females 24.0 42.0 17.1 18.0 25.9
Marital Status of household
Head (%):
Married 74.0 70.0 80.0 86.0 77.3
Single 0 4.0 5.7 2.0 2.7
Widowed 26.0 22.0 14.3 12.0 8.9
Divorced 0 2.0 0 0 0.5
Separated 0 2.0 0 0 0.5
Note: hh - household
Source: Smallholder Dairy Survey (2015)
5.3.2 Household Demographics
Table 5.2 summarises the household demographics in the four smallholder dairy schemes
studied. The household demographics show that the average age of the household head was about
61 years in Chikwaka, Nharira-Lancashire (57 years), Marirangwe (54 years), Rusitu (55 years)
and the aggregate average for the four schemes was about 57 years (Table 5.2). Most of the head
of household had spent an average of about 9 years in school in the four study sites, with heads
in Chikwaka and Nharira-Lancashire having spent an average of about 8 and 9 years respectively
Page 119
103
while Marirangwe had the highest number of years of formal education of the head of household
at about 11 years and Rusitu at about 8 years. Heads of household have been involved in
smallholder dairying for varying numbers of years, with Chikwaka (16 years), Nharira-
Lancashire (16 years), Marirangwe (9 years) and Rusitu (23 years). The aggregate average of
dairying experience for the four schemes is about 17 years. The average age reflects the year the
smallholder dairy scheme was started although for Marirangwe, this indicates that the farmers
are now dominantly a new generation compared to the original participants when the scheme
was established in 1983. The average number of household members staying with the household
head was generally about 6 members in the four schemes, with an average of about 3 children
below the age of 18 years. Each household had access to an average of about 8 hectares arable
land, although the average was higher in Marirangwe (about 27 ha) since this is a small scale
commercial area compared to Chikwaka (about 2 ha) which is a communal area. The aggregate
average distance to the Milk Collection Centre (MCC) from the farmer’s homestead was about
5 km in the four study sites, with about 5 km in Chikwaka, about 9 km in Nharira-Lancashire,
and about 4 km and 2 km in Marirangwe and Rusitu, respectively (Table 5.2).
Page 120
104
Table 5.2: Household demographic characteristics by study site, 2015 Chikwaka Nharira-
Lancashire
Marirangwe Rusitu Total
n=50 n=50 n=35 n=50 n=185
Mean Mean Mean Mean Mean
Hh head age (years) 60.8 (12.4) 56.7 (13.8) 54.2 (17.1) 55.3 (11.1) 57.0 (13.5)
Formal education for hh
head (years)
7.5 (3.1) 9.2 (3.6) 11.4 (3.7) 8.3 (3.5) 8.8 (3.7)
Period dairying (years) 16.1 (11.2) 16.3 (9.6) 9.1 (8.8) 23.0 (8.1) 16.8 (10.6)
Hh sizea 5.5 (2.5) 5.9 (3.0) 5.7 (2.8) 7.5 (4.1) 6.2 (3.3)
Adults (>18 years)
staying with the hh head
3.2 (1.5) 4.1 (1.8) 3.1 (1.5) 3.9 (1.9) 3.6 (1.7)
Children (<18 years)
staying with the hh head
2.3 (1.8) 1.8 (1.8) 2.6 (2.4) 3.7 (3.0) 2.6 (2.4)
Total arable land owned
by the hh (Ha)
2.1 (1.3) 1.5 (1.6) 27.2 (28.1) 3.9 (0.5) 7.5 (15.9)
Homestead to MCC
distance (km)
5.2 (4.2) 9.3 (8.6) 4.4 (3.2) 2.4 (1.6) 5.4 (5.8)
Note: hh – household
Numbers in brackets are standard deviations
aThis was defined as the number of members staying with the hh head
Source: Smallholder Dairy Survey (2015)
5.3.3 Occupation and Agricultural Training of Head of Household
The nature of employment of the head of household is important as it determines whether the
head is able to devote full time into the dairy enterprise on the farm. The survey results show
that 81% of farmers in the four study sites are full time farmers, with 80% and 76% in Chikwaka
and Nharira-Lancashire respectively and about 77% and 90% in Marirangwe and Rusitu
respectively (Table 5.3). Very few farmers (about 10%) in all the four study sites are employed
off farm. In terms of agricultural training of the head of household, the results show that about
44% in the four study sites do not have any training in agriculture, with the highest percentage
in Chikwaka (68%), followed by Marirangwe (about 54%), Nharira-Lancashire (32%) and
Page 121
105
Rusitu (26%). A number of farmers have also received training in agriculture through the Master
Farmer Training programme, which is a programme of improved farming methods and livestock
husbandry run by the local extension service Department of Agricultural Technical and
Extension Services (Agritex). About 48% of farmers in Nharira-Lancashire are Master Farmer
trained, 66% in Rusitu, 30% in Chikwaka and about 14% in Marirangwe. In all the four study
sites, about 42% of the farmers in the survey indicated they are Master Farmer trained (Table
5.3).
Table 5.3: Occupation and agricultural training of household head by study site, 2015
Chikwaka Nharira-
Lancashire
Marirangwe Rusitu Total
n=50 n=50 n=35 n=50 N=185
Occupation (%):
Full-time farmer
80.0
76.0
76.5
90.0
81.0
Employed off-farm 6.0 10.0 14.7 10.0 9.8
Pensioner 8.0 10.0 2.9 0 5.4
Other 6.0 4.0 5.8 0 3.7
Missing 0 0 2.9 0 0.5
Agricultural training of
household head (%)
None 68.0 32.0 54.3 26.0 44.3
Master Farmer 30.0 48.0 14.3 66.0 41.6
Agricultural Certificate 0 14.0 20.0 2.0 8.1
Diploma 0 4.0 0 4.0 2.2
Degree 0 2.0 8.6 2.0 2.7
Other 2.0 0 2.9 0 1.0
Source: Smallholder Dairy Survey (2015)
5.4 General Livestock Ownership and Investments in Dairy Infrastructure and Equipment
This section presents general livestock and dairy cattle ownership, and the dairy infrastructure
and investments by smallholder dairy farmers.
Page 122
106
5.4.1 General Livestock and Dairy Cattle Ownership
The main types of livestock owned by farmers were dairy cattle, beef cattle, sheep and goats.
The average number of cattle owned by households were about 3 dairy animals in Chikwaka,
about 2 dairy animals in Nharira-Lancashire, about 9 dairy cattle in Marirangwe, and about 6
dairy cattle in Rusitu (Table 5.4). The aggregate average number owned in the four study sites
was 4 dairy cattle per household. Farmers owned more beef cattle compared to dairy, with the
aggregate average for the four survey sites at about 8 beef cattle per household (Table 5.4).
Table 5.4: General livestock ownership by study site, 2015
Chikwaka Nharira-
Lancashire
Marirangwe Rusitu Total
Mean Mean Mean Mean Mean
Dairy cattle 2.5 (2.2) 2.3 (3.6) 8.5 (15.3) 5.7 (3.9) 4.4 (7.6)
Beef cattle 3.7 (3.6) 18.8 (11.7) 9.8 (12) 1 (2.7) 8.2 (10.9)
Sheep 0 (0.4) 0.4 (1.6) 1.4 (4.1) 0 (0.4) 0.4 (2.0)
Goats 2.4 (4.4) 4 (4.8) 4.2 (6.8) 2.4 (4.1) 3.2 (5.0)
Note: The numbers in brackets are standard deviations
Source: Smallholder dairy survey (2015)
5.4.2 Dairy Infrastructure and Investments
Smallholder dairy farmers in the survey were requested to indicate their investments on the farms
in terms of cattle handling facilities, facilities used for milking, utensils used for milking and the
type of milking used on farm. In the four study sites, about 61% of the farmers had invested in
calf pens, while 62% had cattle handling facilities, 63% had invested in paddocking their grazing
lands, while about 91% had a cattle kraal on the farm (Table 5.5). About 48% of the farmers in
the four study sites had water and feeding facilities on farm, 45% had a hay shed and about 47%
had a silage pit.
In terms of facilities used for milking, about 90% of the farmers in the four study sites had
invested in milking parlours, while about 6% used the cattle kraal for milking, with very few
(about 3%) of the farmers milking their cattle under the tree, where there are no basic milking
Page 123
107
parlour facilities. The majority of farmers in the four study sites (about 82%) used stainless steel
buckets for milking, while about 48% used milking cans for delivering milk to the MCC. Most
of the farmers (about 97%) in the four study sites used hand milking with the remaining few
having access to milking machines (Table 5.5).
Table 5.5: Farmers’ investments in dairy infrastructure by study site, 2015
Chikwaka Nharira-
Lancashire
Marirangwe Rusitu Total
n=50 n=50 n=35 n=50 N=185
Infrastructure
% of producers who have:
Calf Pens 20.0 92.0 80.0 56.0 60.5
Cattle handling
facilities
48.0 86.0 68.6 48.0 62.2
Paddocks 64.0 82.0 60.0 44.0 62.7
Cattle Kraal 90.0 100.0 91.4 84.0 91.4
Water and feeding
facilities
38.0 82.0 40.0 30.0 48.1
Hay Shed 60.0 76.0 17.1 20.0 45.4
Silage Pit 60.0 58.0 28.6 34.0 46.5
Facilities used for milking
% of producers using:
Milking Parlour 92.0 98.0 74.3 92.0 90.3
Milking in Cattle Kraal 4.0 0 20.0 4.0 5.9
Milking Under tree 2.0 2.0 2.9 4.0 2.7
Missing 2.0 0 2.9 0 1.1
Utensils used for milking
% of producers using:
Stainless steel bucket 74.0 74.0 85.7 94.0 81.6
Plastic bucket 4.0 20.0 8.6 6.0 9.7
Using Can for
delivering milk
8.0 40.0 88.6 68.0 48.1
Type of milking used
% of producers using:
Hand milking 96.0 98.0 94.3 98.0 96.8
Machine milking 4.0 2.0 2.9 2.0 2.7
Source: Smallholder Dairy Survey (2015)
5.5 Dairy Herd Composition
Table 5.6 gives the results of the composition of the dairy herd in terms of cows in milk, dry
cows, calves and bulls. The aggregate average number of milking cows at the time of the survey
Page 124
108
was about 2 cows per household in all the four survey sites, with about one cow in Chikwaka,
two cows in Nharira-Lancashire and Rusitu, and about 4 cows in Marirangwe study site. Very
few households in the survey kept dairy bulls. The aggregate average number of dry cows and
heifers in the four study sites were also about 2 per household, while the number of calves was
about one per household surveyed (Table 5.6).
Table 5.6: Composition of the dairy herd by study site, 2015
Chikwaka Nharira-
Lancashire
Marirangwe Rusitu Total
n=50 n=50 n=35 n=50 N=185
Cows in milk 1.0 (0.8) 2.2 (2.4) 3.6 (4.6) 2.0 (1.2) 2.0 (2.7)
Dry Cows 1.5 (1.4) 4.1 (2.7) 2.1 (2.6) 1.1 (1.2) 2.2 (2.3)
Heifers 1.5 (1.4) 3.1 (2.7) 2.0 (3.1) 1.4 (1.0) 2.0 (2.2)
Dairy Steers 0.2 (0.4) 3.5 (4.2) 1.2 (2.9) 1.0 (1.3) 1.4 (2.9)
Male Calves 0.2 (0.8) 1.3 (1.8) 1.7 (3.2) 1.0 (0.9) 1.0 (1.9)
Female Calves 0.1 (0.4) 1.3 (1.5) 1.3 (1.6) 0.8 (1.1) 0.8 (1.3)
Dairy Bulls 0.1 (0.2) 0.6 (0.8) 0.3 (0.7) 0.1 (0.3) 0.3 (0.6)
Note: Numbers in brackets are standard deviations
Source: Smallholder Dairy Survey (2015)
5.6 Types of Breeds
The main type of dairy cattle breeds kept by farmers were cross breds (reported by about 71%
of farmers in all the four study sites), Mashona breeds (about 17% of farmers in the four study
sites), Red Dane (about 5% of farmers reporting), Jersey (about 3% of farmers reporting)
Friesian (6% of farmers reporting) and Holstein (about 8% of farmers reporting) (Table 5.7).
Page 125
109
Table 5.7: Main types of cow breeds milked by study site, 2015
Chikwaka Nharira-
Lancashire
Marirangwe Rusitu Total
n=23 n=33 n=30 n=46 N=132
Type of breed (%):
Crossbred 78.3 54.5 53.3 89.1 70.5
Mashona breed 26.1 30.3 13.3 4.3 16.7
Red Dane purebred 4.3 9.1 3.3 2.2 4.5
Jersey purebred 0 3.0 6.7 2.2 3.0
Friesian purebred 0 24.2 0 0 6.1
Holstein purebred 0 3.0 30.0 2.2 8.3
Other 0 6.1 0 0 1.5
Source: Smallholder dairy survey (2015)
5.7 Access to Artificial Insemination (AI) and Cost
Artificial insemination (AI) services have been introduced in the smallholder dairy schemes
mainly as a way to improve the productivity of the dairy herd. The majority (about 78% in the
four survey sites) of smallholder farmers were able to access AI services. The major source of
AI services in the four smallholder dairy schemes studied was the Milk Collection Centre (MCC)
(reported by about 85% of farmers in all the four survey sites). The other source of AI services
(reported by about 1% of farmers surveyed) were local veterinary extension workers, the Dairy
Development Programme (DDP)’s Nyarungu Training Centre in Harare, Zimbabwe Association
of Dairy Farmers (ZADF), Livestock Trust of Zimbabwe and private AI technicians operating
in some of the smallholder dairy schemes. In Rusitu, the other main significant provider of AI
services is the Division of Livestock Production and Development (LPD) (about 54% of the
Page 126
110
farmers reporting) (Table 5.8). The cost of AI varied, but it ranged from USD5 to USD80. The
aggregate average for the four study sites is about USD13 (Table 5.8).
Table 5.8: Access to artificial insemination services and cost by study site, 2015
Chikwaka Nharira-
Lancashire
Marirangwe Rusitu Total
n=50 n=50 n=35 n=50 N=185
Access to AI services (%
Yes)
92.0 58.0 80.0 82.0 77.8
% Reporting Source of AI
as:
MCC 97.8 96.6 96.4 53.7 84.7
Local Veterinary extension
workers
0.0 0.0 0.0 2.4 0.7
Dairy Development
Programme Nyarungu
Training Centre
0.0 3.4 0.0 0.0 0.7
ZADF 0.0 3.4 0.0 0.0 0.7
Livestock Trust of
Zimbabwe
0.0 3.4 0.0 0.0 0.7
Private AI Technician 2.2 0.0 3.6 0.0 1.4
DLPD 0.0 0.0 0.0 53.7 15.3
Cost of AI services (USD)
Mean (SD) 15.33
(2.21)
6.38 (4.20) 21.25
(11.83)
7.78
(2.91)
12.53
(8.08)
Minimum 15.00 5.00 10.00 5.00 5.00
Maximum 30.00 20.00 80.00 20.00 80.00
Note: Some farmers access AI services from more than one source
Source: Smallholder dairy survey (2015)
5.8 Reproductive Performance Parameters of Dairy Cattle in the Study Sites
5.8.1 Reproductive Performance of Mashona Breeds
Although the Mashona cattle breed is an indigenous breed mainly kept for beef, in the
smallholder dairy herd, the breed forms an important part of the milking herd. The reproductive
performance of Mashona as reported by farmers in the survey shows that the average lactation
length was 218 days in the four study sites, with an average age at first calving of about 40
months, a calving interval of 43 months and a calf weaning age of 229 days (Table 5.9). A small
number of farmers reported mortalities in the Mashona dairy cattle herd in the four study sites,
and the average mortality of adult cattle reported was about one animal per household. Very few
Page 127
111
households reported buying dairy cattle in 2014, and the average for the farmers reporting was
one animal per household (Table 5.9).
Table 5.9: Mashona breed average lactation length, calving, weaning, mortalities and
purchases by study site, 2015
Mashona breed Chikwaka Nharira-
Lancashire
Marirangwe Rusitu Total
Average
lactation length
(days)
n 13 33 2 2 50
Mean (SD) 179 (26) 236 (47) 180 (0) 215
(49)
218
(47)
Age at first
calving
(months)
n 14 34 2 2 52
Mean (SD) 44.6 (9) 38.2 (10) 33.0 (4.2) 36.0
(0)
39.6
(9.8)
Average calving
interval
(months)
n 14 25 2 2 43
Mean (SD) 19.1 (6.4) 17.2 (1.7) 21.5 (12.0) 12.0
(0)
17.8
(4.6)
Average calf
weaning age
(days)
n 16 37 3 2 58
Mean (SD) 235
(117.8)
215 (96.1) 393 (295) 188.5
(249.6)
229.0
(123.5)
Adult
mortalities in
2014
n 4 7 1 - 12
Mean (SD) 1 (0) 1.7 (1.3) 1 (-) - 1.4
(1.0)
Calf mortalities
in 2014
n 7 9 1 - 17
Mean (SD) 1.6 (0.8) 2.2 (1.0) 2 (-) - 1.9
(0.9)
Number
Purchased in
2014
n - 4 1 - 5
Mean (SD) - 1.3 (0.5) 1 (-) - 1.2
(0.4)
Note: n – number reporting; SD – Standard deviation
Source: Smallholder dairy survey (2015)
5.8.2 Reproductive Performance of Pure Breeds
The average lactation length for pure breeds for farmers reporting was 292 days in the four study
sites (300 days in Chikwaka, 227 days in Nharira-Lancashire, 343 days in Marirangwe and 352
Page 128
112
days in Rusitu), with an average age at first calving of 36 months, an average calving interval of
17 months, and an average weaning age of about 142 days (Table 5.10).
Table 5.10: Pure bred average lactation length, calving, weaning, mortalities and
purchases by study site, 2015
Pure breed Chikwaka Nharira-
Lancashire
Marirangwe Rusitu Total
Average
lactation length
(days)
n 1 9 3 7 20
Mean (SD) 300 (-) 227 (343) 352 (38) 352
(61.9)
292 (83)
Age at first
calving
(months)
n 1 9 2 4 16
Mean (SD) 27 (-) 40.4
(10.7)
24 (-) 34.3
(10.6)
36
(11.0)
Average
calving interval
(months)
n - 6 1 4 11
Mean (SD) - 17.2 (1.6) 12.0 (-) 18 (4.9) 17.0
(3.4)
Average calf
weaning age
(days)
n 1 10 2 6 19
Mean (SD) 90 (-) 168 (65.1) 120 (84.9) 115
(51.7)
142.1
(64.0)
Adult
mortalities in
2014
n 1 1 1 2 5
Mean (SD) 0 1 1 1 0.8 (0.4)
Calf mortalities
in 2014
n 2 - 1 4 7
Mean (SD) 2.5 (2.1) - 2.0 (-) 1.3
(0.5)
1.7 (1.1)
Number
Purchased in
2014
n 2 2 - 2 6
Mean (SD) 2 (2.8) 1 (-) - 1 (-) 1.3 (1.4)
Note: n – number reporting; SD – Standard deviation
Source: Smallholder dairy survey (2015)
5.8.3 Reproductive Performance of Cross Breeds
Most of the farmers in the study sites milked cross breds compared to Mashona and pure breds.
The aggregate average lactation period for cross breeds reported by farmers in the survey was
about 316 days in Chikwaka, 246 days in Nharira-Lancashire, 235 days in Marirangwe, 292
Page 129
113
days in Rusitu and an average of 275 in the four study sites. Age at first calving reported was
about 34 months, an average calving interval of about 17 months with an average weaning age
of about 167 days (Table 5.11). The mortalities reported were about two calves per household
reported in the four study sites, and about one animal per household reporting for adult cattle.
Dairy cattle purchases were about two animals per household (Table 5.11).
Table 5.11: Cross bred average lactation length, calving, weaning, mortalities and
purchases by study site, 2015
Cross breed Chikwaka Nharira-
Lancashire
Marirangwe Rusitu Total
Average
lactation length
(days)
n 34 32 28 37 131
Mean
(SD)
316.7
(62.9)
246.1
(51.9)
234.5 (68.0) 292.8
(35.3)
275 (64.0)
Age at first
calving (months)
n 14 27 21 37 99
Mean
(SD)
35.6
(10.3)
37.7 (7.7) 32.7 (7.8) 31.8
(5.6)
34.1 (7.8)
Average calving
interval
(months)
n 29 24 9 38 100
Mean
(SD)
18.0 (4.3) 17.7 (3.3) 25.3 (21.2) 13.4
(5.1)
16.9 (8.1)
Average calf
weaning age
(days)
n 39 33 21 38 131
Mean
(SD)
182.4
(82.6)
218.7
(113.8)
156.1 (95.9) 110.5
(52.0)
166.5
(95.2)
Adult mortalities
in 2014
n 18 9 11 3 41
Mean
(SD)
1.1 (0.8) 1.8 (1.3) 1.5 (1.1) 1.3
(0.6)
1.4 (1.0)
Calf mortalities
in 2014
n 14 9 11 9 43
Mean
(SD)
1.1 (0.5) 2.7 (1.7) 2.5 (1.5) 1.4
(0.5)
1.9 (1.3)
Number
Purchased in
2014
n 2 7 18 1 28
Mean
(SD)
0 1.4 (0.5) 2.4 (2.6) 2 (-) 2 (2.2)
Note: n – number reporting; SD – Standard deviation
Source: Smallholder dairy survey (2015)
Page 130
114
5.9 Milk Production in the Smallholder Dairy Schemes
The average total milk production per day reported by farmers was about 5 litres in Chikwaka,
about 17 litres in Nharira-Lancashire, 33 litres in Marirangwe, about 18 litres in Rusitu, with an
average of 17 litres across the four study sites. The average amount of milk allocated for
household consumption was about one litre in Chikwaka, 3 litres in Nharira-Lancashire, about
one litre in Marirangwe and Rusitu respectively and about 2 litres in the four study sites (Table
5.12).
Table 5.12: Milk production by study site, 2015 Chikwaka Nharira-
Lancashire
Marirangwe Rusitu Total
Average milk
output in litres
(total for the dairy
herd per day)
n 50 50 33 49 182
Mean
(SD)
5.4 (5.6) 16.9
(9.98)
32.8 (63.9) 18.4
(12.2)
17.0
(29.7)
Average milk
allocated to
household
consumption per
day in litres
n 50 50 33 49 182
Mean
(SD)
0.9 (1.1) 3 (3.4) 1.3 (0.8) 1.3 (0.9) 1.6
(2.1)
Average amount
sold per day in
litres
n 49 50 33 49 181
Mean
(SD)
4.5 (5.0) 13.96
(8.7)
31.4 (63.6) 16.5
(11.8)
15.3
(29.4)
Note: n – number reporting; SD – Standard deviation
Source: Smallholder dairy survey (2015)
5.10 Access to credit by smallholder dairy farmers for the period 2011 to 2015
Smallholder dairy farmers in the four schemes studied were asked whether they had obtained
credit for the dairy enterprise during the period 2011 to 2015, sources of credit, amount of credit
obtained and the major uses of the credit accessed. About 59% of the farmers had accessed
credit in the five years between 2011 and 2015, with 96% in Chikwaka, 44% in Nharira-
Lancashire compared to about 57% in Marirangwe and 38% in Rusitu (Table 5.13). The major
Page 131
115
sources of the credit over the five year period were local microfinance institutions, Non-
Governmental Organisations (NGOs) operating in the area, and the farmer cooperative
responsible for running the MCC, although the number of farmers accessing credit in the four
smallholder dairy schemes was very low (Table 5.13).
Table 5.13: Percentage of farmers accessing credit facilities by study site, 2015
Chikwaka Nharira-
Lancashire
Marirangwe Rusitu Total
Farmers reporting 50 50 35 50 185
Obtained credit for dairy
enterprise in last five years:
% Yes 96.0 44.0 57.1 38.0 58.9
Source of credit 2015:
NGO operating in the area 0.0 0.0 0.0 2.0 0.5
Farmers’ cooperative 0.0 2.0 17.1 0.0 3.8
Source of credit 2014:
Local microfinance institutions 0.0 0.0 0.0 6.0 1.6
NGO operating in the area 0.0 0.0 0.0 2.0 0.5
Farmers’ cooperative 0.0 8.0 14.3 2.0 5.4
Source of credit 2013:
Local microfinance institutions 0.0 2.0 0.0 4.0 1.6
NGO operating in the area 0.0 0.0 0.0 8.0 2.2
Farmers’ cooperative 26.0 16.0 8.6 2.0 13.5
Source of credit 2012:
Local microfinance institutions 2.0 0.0 0.0 0.0 0.5
NGO operating in the area 0.0 0.0 0.0 4.0 1.1
Farmers’ cooperative 56.0 6.0 2.9 0.0 17.3
Source of credit 2011:
Local microfinance institutions 2.0 0.0 0.0 2.0 1.1
NGO operating in the area 0.0 2.0 0.0 14.0 4.3
Farmers’ cooperative 54.0 12.0 8.6 2.0 20.0
Source: Smallholder dairy survey (2015)
Over the five year period, the results show that in Chikwaka, the average credit accessed ranged
from about USD1000.00 to about USD 1600.00 while in Nharira-Lancashire the range was from
USD 1100.00 to USD 1300.00. In Marirangwe the average credit ranged from USD 900.00 to
USD 1600.00 compared to Rusitu where the range was from USD 1000.00 to USD 2000.00
(Table 5.14).
Page 132
116
Table 5.14: Credit obtained during the period 2011 to 2015 by study site, 2015
Name of Dairy
Scheme
2015 2014 2013 2012 2011
Chikwaka n - - 13 29 28
Mean
(SD)
- - 1562.31
(630.77)
1506.90
(482.86)
1022.14
(161.41)
Nharira-
Lancashire
n 1 4 9 3 7
Mean
(SD)
50 (-) 1262.50
(689.56)
1107.22
(612.95)
1283.33
(292.97)
1277.14
(999.41)
Marirangwe n 6 4 3 1 3
Mean
(SD)
1200.00
(167.33)
1025.00
(427.20)
1616.67
(1717.80)
1600 (-) 900.00
(1264.58)
Rusitu n 1 5 7 2 9
Mean
(SD)
1000 (-) 1660.00
(134.16)
2114.29
(1435.77)
1100.00
(141.42)
1055.56
(166.67)
Total n 8 13 32 35 47
Mean
(SD)
1031.25
(426.73)
1342.31
(498.27)
1560.16
(984.65)
1467.14
9458.72)
1058.72
(403.94)
Note: n is the number of farmers reporting obtaining credit
Source: Smallholder dairy survey (2015)
The major uses of the credit over the five year period were mainly to buy dairy animals, buying
concentrates and veterinary medicines and drugs (Table 5.15). The number of farmers accessing
credit is generally lower in 2015 compared to those accessing credit in 2011 (Table 5.15).
Page 133
117
Table 5.15: Use of credit obtained during the period 2011 to 2015 by smallholder
dairy farmers, 2015
Chikwaka Nharira-
Lancashire
Marirangwe Rusitu Total
n=50 n=50 n=35 n=50 N=185
Use in 2015
% Buy dairy
animals
0.0 2.0 17.1 2.0 4.3
% Buy concentrates 0.0 0.0 2.9 0.0 0.5
Use in 2014
% Buy dairy
animals
0.0 8.0 14.3 10.0 7.6
% Buy concentrates 0.0 0.0 2.9 0.0 0.5
Use in 2013
% Buy dairy
animals
24.0 14.0 8.6 14.0 15.7
% Buy concentrates 0.0 2.0 2.9 0.0 1.1
% Buy veterinary
drugs
2.0 2.0 0.0 0.0 1.1
Use in 2012
% Buy dairy
animals
54.0 6.0 2.9 4.0 17.8
% Buy concentrates 0.0 0.0 2.9 0.0 0.5
% Buy fertilisers 2.0 0.0 0.0 0.0 0.5
Use in 2011
% Buy dairy
animals
52.0 14.0 8.6 18.0 24.3
% Buy fertilisers 2.0 0.0 0.0 0.0 0.5
Source: Smallholder dairy survey (2015)
Farmers who were not able to access credit were asked to indicate the main reasons they have
not been able to access credit. The main reasons were that some of the farmers were not willing
to take credit (about 31% of the farmers reporting in the four study sites), with no farmers in
Chikwaka indicating this as a reason, but 50% of the farmers in Nharira-Lancashire indicating
this as a reason. In Marirangwe, about 27% indicated this reason, while about 17% gave this as
the reason in Rusitu. About 21% of the farmers in the four study sites indicated they were not
offered any credit (mainly in Nharira-Lancashire and Rusitu) or they failed to raise the deposit
(mainly in Rusitu) (Table 5.16). About 16% of the farmers (mainly in Marirangwe and Rusitu)
indicated they did not apply for the loans during the period (Table 5.16).
Page 134
118
Table 5.16: Reasons some smallholder dairy farmers did not access credit during
the period 2011 to 2015, 2015
Chikwaka Nharira-
Lancashire
Marirangwe Rusitu Total
n 1 26 11 30 68
Reason (%):
Not offered 0.0 50.0 0.0 3.3 20.6
No security for the credit 0.0 0.0 9.1 0.0 1.5
Not willing (not interested in
loans)
0.0 50.0 27.3 16.7 30.9
Did not apply 0.0 0.0 45.5 20.0 16.2
No access to credit facility 100.0 0.0 9.1 13.3 8.8
There was no money when
applied to revolving fund
0.0 0.0 9.1 0.0 1.5
Failed to raise the deposit 0.0 0.0 0.0 46.7 20.6
Note: n – number reporting
Source: Smallholder dairy survey (2015)
5.11 Access to Dairy Extension Services
The questionnaire included questions asking farmers whether there was an extension officer
operating in the smallholder dairy area and the number of times the extension officer visited the
smallholder dairy farms. The responses show that in both Chikwaka and Nharira-Lancashire,
100% of the respondents indicated there was an extension officer in the area, while in
Marirangwe (about 91%) and Rusitu (96%) responded positively, with an average of the four
study sites of about 98% (Table 5.17). The average number of visits to the farm for the four study
sites was about 12 times per annum (Chikwaka average of 5 times per annum, Nharira-
Lancashire average of about 19 times, five times for Marirangwe and about 15 times for Rusitu)
(Table 5.17).
Page 135
119
Table 5.17: Access to extension services by study site, 2015
Chikwaka Nharira-
Lancashire
Marirangwe Rusitu Total
Farmers reporting 50 50 35 50 185
Have an extension officer operating
in the area
% Yes 100.0 100.0 94.1 96.0 97.8
Number of times visit to the farm
in a year:
Mean 5.0 18.6 5.1 15.4 11.5
Standard Deviation 7.2 13.1 6.1 19.2 14.2
Minimum 0.0 0.0 0.0 0.0 0.0
Maximum 24.0 48.0 24.0 70.0 70.0
Source: Smallholder dairy survey (2015)
5.11 Summary of Characteristics of the Smallholder Dairy Producers Delivering Milk to
Semi-formal and Formal Value Chains
The results of the characteristics of the smallholder dairy producers delivering milk to semi-
formal and formal value chains show that most of the heads of households in all the dairy
schemes studied were males (74%), with about 55% having received some form of training in
agriculture, owning an average of 7.5 ha total arable land, with the average household age of 57
years and have practiced dairying farming for an average of about 17 years (Table 5.18).
Comparison of the mean characteristics (t-test) of farmers delivering to semi-formal and formal
value chains show that total size of arable land, age of the household head in years, distance to
the nearest MCC, number of cows in milk, milk production and the cost of concentrates were
statistically significant at the 5% level. The chi-square test of the cross-tabulation of value chain
and sex of household head (% males) and percent received agricultural training were statistically
significant at 5% and 10%, respectively (Table 5.18).
Page 136
120
Table 5.18: Characteristics of smallholder dairy producers delivering milk to semi-
formal and formal dairy value chains
Mean value of variables
Characteristic Semi-formal
value chain
Formal
value
chain
Total t-value
Number of farmers interviewed n=100 n=85 N=185
Total size of arable land (Ha) 1.8 13.5 7.5 -5.03**
Age of head of household (years) 58.7 54.8 57.0 1.94**
Number of years in dairying
(years)
16.2 17.5 16.8 -0.82
Distance to nearest MCC (km) 7.2 3.2 5.4 5.31**
Mean number of cows in milk 1.4 2.7 2.0 -3.20**
Household size 6.8 5.7 6.2 2.24**
Mean volume of milk production
per household per month (litres)
333.9 725.9 510.5 -2.76**
Mean number of extension visits
to the farm per annum
11.8 11.3 11.5 0.82
Mean cost of concentrates per
month (USD)
23.15 67.05 46.28 -3.06**
Chi-square
value
Sex of head of household
% Males 67.0 82.4 74.1 5.64**
% Received some training in
agriculture
49.0 61.2 54.6 2.75*
**, *, Statistical significance at 5% and 10% respectively
Source: Smallholder dairy survey (2015)
5.12 Analysis of Factors Influencing Milk Production in the Smallholder Dairy Value
Chain
In order to understand the socio-economic factors influencing milk production by farmers in the
overall smallholder dairy value chain which consists of farmers supplying the semi-formal value
chains (Chikwaka and Nharira-Lancashire) and those supplying the formal value chains
(Marirangwe and Rusitu), multiple regression analysis was performed.
5.12.1 Multiple Regression Analysis Model Diagnostics
The following section gives the model diagnostics to assess whether there were any violations
of the assumptions of the multiple linear regression model in terms of specification of the model,
tests for multicollinearity, tests for heteroscedasticity, and normality tests.
Page 137
121
5.12.1.1 Specification of the model
The link test was used to assess the specification of the model. The test is based on the idea that
if a regression model is properly specified, one should not be able to find any additional
independent variables that are significant except by chance (Stata, 2017). Link test creates two
variables, the variable of prediction _hat, and the variable of squared prediction _hatsq. The
model is then refit using the two variables as predictors. The _hat should be significant since it
is predicted value. On the other hand, _hatsq should not be significant because if the model is
specified correctly, the squared predictions should not have much explanatory power. That is,
the expectation is that _hatsq is not a significant predictor if the model is specified correctly. The
results show that the test for squared (_hatsq) was not significant (Table 5.19).
Table 5.19: Link tests results of the model
MilkPdnLg10 Coeff Std Err T P > /t/ [95% Conf. Interval]
_hat 2.095 0.900 2.330 0.022 0.308 3.881
_hatsq -0.177 0.144 -1.230 0.223 -0.462 0.109
_cons -1.653 1.381 -1.200 0.234 -4.394 1.088
Source: Smallholder dairy survey (2015)
5.12.1.2 Assessment of Multicollinearity
Multicollinearity diagnostics were performed in order to validate the model’s ability to produce
accurate predictions. Tolerance and Variance Inflation Factor (VIF) were used to assess
multicollinearity. O’brien (2007), however, cautions on the rules of thumb regarding the use of
variance inflation factors. The results show that the tolerance of the variables was more than 0.1,
while the VIF was less than 10, indicating that there was no evidence of multicollinearity in the
variables included in the model (Table 5.20).
Page 138
122
Table 5.20: Collinearity diagnostics
Variable Tolerance (T) Variance Inflation Factor
(VIF)
Distance to nearest MCC 0.67 1.50
Age of household head 0.62 1.62
Sex of household head 0.84 1.19
Household size 0.90 1.11
Dairy farm experience 0.50 2.02
Total size of arable land 0.40 2.49
Agricultural training of household head 0.80 1.24
Concentrate costs per month 0.28 3.52
Number of milking cows 0.31 3.19
Value chain 0.56 1.78
Source: Smallholder dairy survey (2015)
5.12.1.3 Tests for Heteroscedasticity
The Breusch-Pagan/Cook-Weisberg test for heteroscedasticity was used. The Ho was that of
constant variance. The results showed that Chi2 (1) = 0.63, and the Prob > Chi2 = 0.4266. Since
the p-value > 0.05, we do not reject Ho, which implies homoscedasticity (constant variance).
5.12.1.4 Tests for Normality
The dependent variable in the multiple regression analysis was milk production per month. The
variable was tested for normality using the Kolmogorov-Smirnov test and the results indicated
the variable was not normally distributed (p < 0.05). The skewness statistics indicated the data
were positively skewed with a skewness statistic greater than one. The variable was transformed
using log 10 transformation and again tested for normality. The Kolmogorov-Smirnov test
indicated the transformed variable was normal (p > 0.05). A kernel density estimate was used to
produce a kernel density plot with the normal option requesting that a normal density be overlaid
on the plot (Figure 5.1).
Page 139
123
Figure 5.3: Kernel density estimate
Overall, there seems to be a minor and trivial deviation from normality. We can accept that the
residuals are close to a normal distribution.
5.12.2 Multiple Regression Analysis Results
The regression model was then used to test the hypothesis that the level of milk production and
socio-economic factors are related. The regression model was estimated by Ordinary Least
Squares (OLS). The ANOVA results show that the regression model was statistically significant,
F10, 90 = 7.11, p < 0.001. R2 was 0.44, and the adjusted R2 was 0.379, indicating the limited fit of
the model explaining only 38% of the variation in milk production by the independent variables
included in the model (Table 5.21).
The independent variables that were significant in the model were household size, dairy farming
experience of the head of household, age of the head of household, number of milking cows, and
the cost of concentrates per month. Variables that were not significant were distance of the farm
to the MCC (representing access to markets), agricultural training of the head of household, total
size of landholding, sex of the head of household, and the value chain supplied by the farmer.
0
.5
1
1.5
D
ensity
1.5 2 2.5 3 3.5 4 Milk production per month
Kernel density estimate
Normal density
kernel = epanechnikov, bandwidth = 0.0957
Page 140
124
Table 5.21: Multiple linear regression of factors influencing milk production
Predictor Coeff Std Err. t P > | t |
Constant 2.379 0.155 15.38 0.000
Distance to the nearest MCC (km) 0.003 0.005 0.64 0.523
Age of household head (years) -0.004 0.002 -1.85 0.068
Dairy farming experience of household
head (years)
0.008 0.003 2.26 0.026
Agricultural training of head of household 0.079 0.059 1.33 0.187
Total size of arable land (Ha) 0.004 0.003 1.25 0.216
Concentrate costs per month (USD) 0.001 0.000 1.83 0.070
Sex of head of household 0.958 0.066 1.46 0.149
Household size 0.018 0.078 2.28 0.025
Number of milking cows 0.028 0.015 1.86 0.066
Value Chain -0.027 0.068 -0.39 0.695
R2 = 0.441
Adjusted R2 = 0.379 Standard Error of the Estimate = 0.25474
F (10, 91) = 7.11, p < 0.001
Source: Smallholder dairy survey (2015)
5.13 Discussion
This section gives a discussion of the results. Discussion initially focusses on the general
characteristics of smallholder producers in the schemes studied and then factors influencing
milk production in the smallholder dairy value chain.
5.13.1 Characteristics of Smallholder Dairy Producers in the Study Sites
The discussion in this section covers dairy scheme characteristics and household demographics,
dairy livestock ownership, dairy infrastructure and equipment (silage and hay makers). Dairy
herd composition, breeds and access to AI are also discussed in this section, including
performance parameters of dairy cattle in the smallholder dairy schemes studied. The section
Page 141
125
also discusses milk production, access to credit and extension, and summarises the discussion
on characteristics of farmers delivering milk to semi-formal and the formal dairy value chains.
5.13.1.1 Smallholder Dairy Scheme Characteristics and Household Demographics
The four smallholder dairy schemes studied represent the overall smallholder dairy value chain
within the context of the semi-formal value chain (represented by Chikwaka and Nharira-
Lancashire) and formal value chain (Marirangwe and Rusitu). The characteristics of the
smallholder dairy producers are considered within the context that all the smallholder dairy
schemes in Zimbabwe were initiated and supported by the Dairy Development Programme
(DDP) in the initial stages before they were handed over to farmers. The DDP was mainly funded
by government through the public sector investment programme (PSIP). Key informants
interviewed indicated that although the DDP personnel have been submitting bids to the PSIP,
the most recent funding received from the government for the DDP was in 2007. As a result,
DDP is no longer able to support the smallholder dairy schemes, who are now run by farmer
management committees.
The characteristics of smallholder dairy producers show that in terms of sex of household head,
males dominate in the four schemes studied. This is not surprising as participation in smallholder
dairy entails a steady flow of income to the household. According to ZimStats (2012) males tend
to dominate in household enterprises that entail generation of cash income. The results show that
most of the heads of household were married, with less than a tenth being widowed. The marital
status indicates that females participate indirectly in the dairy enterprise. The household
demographics show that generally compared to Chikwaka and Nharira-Lancashire, the average
age of the head of household in Marirangwe and Rusitu was generally lower. Marirangwe and
Rusitu smallholder dairy schemes were established by the government in the first decade of
independence in 1980. This could possibly be an indication that in Marirangwe, the smallholder
dairying is now being run by a new generation of farmers compared to the original participants
in the mid-1980s. The average smallholder dairy farming experience indicates that on average,
Page 142
126
household heads in Chikwaka and Nharira-Lancashire have been in dairying for an average of
16 years, while those in Marirangwe the average is 9 years. According to DMB, (1984),
Marirangwe smallholder dairy scheme was established in the mid-1980s, an indication that there
is a new generation of farmers which has taken over from the original participants, whereas in
Rusitu the average number of years is 23, an indication that predominantly these were the
farmers who were resettled by the government in the mid-1980s. The experience and age of the
respondents can be regarded as an indicator of whether the smallholder dairy farmers can adapt
to new ideas and are able to improve the management of the smallholder dairy in order to
maximize income. The more market oriented younger farmers are more inclined to participate
in formal value chains where the possible returns are higher compared to the semi-formal value
chains. Sharma (2015) study on determinants of small milk producers participation in organized
value chains showed that the age of the household head was negatively related to participation
of dairy farmers in modern channels and was statistically significant in the private dairy
channels. The study showed that a one year increase in age was predicted to raise the probability
of being in the traditional channel.
Participation in formal value chains can also possibly be explained by the number of years of
formal education. Marirangwe had the highest average number of years of formal education for
the head of household (11 years) compared to Chikwaka (8 years). Eleven years indicates that
most of the farmers in Marirangwe would have attained secondary level education (seven years
for primary education and four years of secondary level up to form 4), while eight years indicate
completion of primary level education and one year of secondary education. Therefore, farmers’
participating in the formal value chain are better educated compared to farmers participating in
the semi-formal value chains. Sharma (2015) reports that education and age are indicators of
management capabilities.
The occupation and agricultural training of the household head shows that most of the farmers
are into farming on full-time basis, with very few employed off-farm. This should generally
Page 143
127
enable smallholder dairy farmers to concentrate and put 100% efforts in their dairy enterprises.
Key informant interviews, however, indicate that smallholder dairy farmers have many
enterprises and are therefore not able to put their efforts on the dairy enterprise alone. The results
of agricultural training of the head of household show that a higher percentage of farmers in
Chikwaka and Nharira-Lancashire have trained as master farmers compared to Marirangwe and
Rusitu. The master farmer scheme was more prominent in the first two decades of independence
up to the year 2000. Post year 2000, the training has been affected by resource constraints as has
the rest of the economy.
The average distance to the MCC was within the 5 to 10 km range in Chikwaka and Nharira
Lancashire, while this was less than 5 km in Marirangwe and Rusitu for the farmers interviewed.
According to key informant interviews, due to the distance in Nharira-Lancashire, for example,
farmers deliver milk to the MCC once per day instead of twice per day compared to Marirangwe
and Rusitu. This is mainly due to the distance travelled to the MCC and the low volumes that
are produced for the second milking.
5.13.1.2 Dairy Livestock Ownership, Dairy Infrastructure and Equipment
The results show that generally smallholder dairy schemes that are predominantly located in
Communal Areas (Chikwaka and Nharira-Lancashire) have a lower average number of dairy
cattle compared to those in the small scale commercial and resettlement areas (Marirangwe and
Rusitu, respectively). This explains the higher volumes of milk produced in Marirangwe and
Rusitu compared to Chikwaka and Nharira-Lancashire and why the farmers participate in semi-
formal and formal value chains respectively. In terms of dairy infrastructure and investments,
the results indicate that the majority (90%) in the four study sites had invested in milking
parlours. As already mentioned, the development of smallholder dairy schemes was initially
done by the DDP. In order for farmers to participate in the smallholder dairy schemes, they were
Page 144
128
supposed to invest in minimal infrastructure that enabled them to deliver milk to the MCC. As a
result, most of the farmers invested in basic infrastructure and equipment required. What is
interesting is that although grazing in the Communal Areas is communally owned, while arable
land is individually owned, farmers in Chikwaka and Nharira-Lancashire have equally set aside
land for paddocks for the dairy enterprise (64% and 82%, respectively). This compares with
Marirangwe and Rusitu where farmers have different land tenure systems. In Marirangwe, the
land tenure system is freehold, while farmers in Rusitu resettlement have a permit issued by the
Minister of Agriculture. The land tenure system has implications on investment that farmers can
make to improve their dairy enterprise.
5.13.1.3 Dairy Herd Composition, Breeds and Access to AI services
The results of the dairy herd composition show that generally on average, farmers in the three
study sites of Chikwaka and Nharira-Lancashire and Rusitu owned two milking cows, compared
to four milking cows in Marirangwe. It is important to note that Marirangwe is located nearer to
one of the largest large scale commercial dairy farmers who normally supplies dairy cattle to
various programmes under the government or donor funded projects. Smallholder dairy farmers
in Marirangwe therefore have better access to purchase dairy cattle compared to the other three
study sites.
Generally, the main types of breeds milked in the smallholder dairy schemes studied are cross
breds, with very few farmers owning pure breeds. The indigenous Mashona breed is equally
important for the dairy enterprise, although it is largely a beef breed. Interviews with key
informants indicates that government has introduced a smallholder dairy revitalization
programme that is run by the Zimbabwe Dairy Industry Trust (ZDIT). The aim of the
programme is to improve smallholder dairying through improved feeding, access to improved
genetics (introducing AI in the schemes), access to finance and improved management of the
smallholder dairying. ZDIT is the Apex body for the industry and is composed of government,
processors, producers and other stakeholders such as Retailers Association of Zimbabwe.
Page 145
129
Although producers are supposed to be represented on ZDIT by the Smallholder Dairy Farmers
Association, the association was largely defunct and not active at the time of the study. ZDIT
has been making AI available to smallholder dairy schemes at subsidized rates through the MCC.
The results of the survey indicate that the majority of the farmers (more than three quarters in
the four study sites) positively responded that they were able to access AI services through the
MCC. The cost of the AI reported by farmers indicates the subsidy. Key informants indicated
the market cost of AI per straw was USD40 compared to the average of USD13 reported in the
study survey. This programme was recently introduced and therefore the impact is still to be
realized in the smallholder dairy schemes studied.
5.13.1.4 Farmer Perceptions of Performance Parameters of Dairy Cattle in the Study Sites
The performance parameters were measured indirectly through interviews with farmers as the
questions were included in the questionnaire. The performance parameters are reported for pure
breeds, Mashona and cross breeds. The main types of pure breeds reported by farmers were
Holstein, Red Dane, Jersey and Friesian although these were reported by very few farmers in the
study sites. The main types of dairy breeds milked were cross breeds, and the lactation length in
the four study sites were 275 days, with an average age at first calving of 34 months. These
figures compare favourably with those reported by Ngongoni et al. (2006). Ngongoni et al.
(2006) reported lactation length of 269 (±24.8) and age at first calving of 36.3 (±1.97) for cross
breeds in the smallholder dairy schemes studied. According to Ngongoni et al. (2006), this was
considered to be one of the factors affecting milk production in smallholder dairying. The
variation in the figures reported can be attributed to the fact that very few smallholder dairy
farmers keep records. As a result, relying on memory recall is not as accurate compared to
recording. However, the figures give an indication of the performance parameters according to
farmers’ perception in the smallholder dairy herd.
Page 146
130
5.13.1.5 Milk Production, Access to Credit and Extension
The quantities of milk produced by farmers were measured through a question included in the
questionnaire which required farmers to give estimates of the total quantities of milk produced,
allocated to household consumption and the quantities sold. Milk production generally shows
that there was higher production (total milk produced, allocated to household consumption and
sales) in Marirangwe and Rusitu study sites compared to Chikwaka and Nharira-Lancashire
study sites. This possibly explains why the dairy schemes participated in different value chains.
The results show that more farmers were able to access credit in the period before 2015. Key
informant interviews indicated that farmers were accessing credit through a donor funded project
run by Land O Lakes (LoL). The facility required the farmer to pay USD300 for a dairy animal
that was priced at USD1000. The animals purchased through the facility were in-calf, and
farmers were given a 30-day grace period, and paid USD60 monthly thereafter. The facility was
accessible to members of the smallholder dairy schemes, and as part of the application members
had to prove that they had feed, milking parlour and water for the dairy animals. Some of the
members benefited two to three times during the period 2011 to 2013, depending on whether
they had cleared their debt. The last batch of the animals under the project was delivered in
December 2013. The money repaid by farmers was supposed to go into a revolving fund that
could eventually be self-sustaining. However, key informants indicated that the revolving funds
were not performing well in some of the smallholder dairy schemes and faced a number of
constraints. This is one of the main problems that have been faced in donor funded projects
where farmers in some cases fail to repay the loans, leading to sustainability issues in the
revolving funds. One can infer that although most of these smallholder dairy schemes have been
supported by various donors since they were set up by the DDP, some are still struggling due to
this dependency syndrome among farmers. The smallholder dairy schemes should be created
with a clear market orientation of the participants in order to sustainably engage in milk
production.
Page 147
131
Extension services in the smallholder dairy schemes are generally provided by the Division of
Livestock Production and Development (LPD), and complimented in some cases by extension
provided through donor funded projects. The availability of extension in the schemes is shown
by the percentage of farmers responding positively to whether there is an extension officer in
their area (almost all the farmers indicating access in the four schemes). The average visits by
the extension staff to the farms varied, ranging from five times per year in Chikwaka to 19 times
per year in Nharira-Lancashire. Although extension seems available, there have been questions
on the effectiveness of the extension service provided. Previous studies (for example, SNV
(2012)) have indicated that most of the extension staff are not adequately trained to provide
support required in the dairy enterprise.
5.13.1.6 Characteristics of Dairy Farmers Delivering to Semi-formal and Formal Value
Chains
Milk produced in two of the smallholder dairy schemes studied (Chikwaka and Nharira-
Lancashire) enters the semi-formal smallholder dairy value chain, while two of the schemes
(Marirangwe and Rusitu) supply the formal smallholder dairy value chain. These two value
chains largely constitute the overall smallholder dairy value chain in Zimbabwe. The analysis
shows that there are significant differences in mean characteristics of farmers delivering to the
semi-formal and formal value chains. In addition, farmers participating in the formal value chain
are generally younger compared to those participating in the semi-formal value chain. The land
holding size is also generally higher for farmers delivering milk to the formal value chain. The
average distance to the milk collection centre, which was used as a proxy for market access, was
also statistically significant, an indication that farms delivering to formal value chains had better
market access compared to those delivering to semi-formal value chains.
The semi-formal value chain mainly caters for the lower segment of the consumer market and
Page 148
132
the milk is processed at the MCC. The main products sold are raw milk, fermented milk (Amasi)
and yoghurts. These are mainly sold to the local community in the MCC area where the milk is
processed, and to nearby growth points (emerging rural service centres in the communal areas)
and local boarding schools. The formal value chains targets the higher income end of the
consumer market. Milk is delivered to processors based in the urban areas and processed into
various products such as cheese, fresh milk and dairy beverages. The target consumers for these
products are mainly the urban based consumer segment. The urban based consumers compared
to the rural based consumers are generally regarded as having better incomes than consumers in
the communal areas. Although these two smallholder value chains contribute to the national
milk production, their contribution and impact on milk production since the formation of the
smallholder dairy schemes by the government has been limited. This is despite the fact that
research was also initiated in order to support smallholder dairying (Sibanda and Khombe, 2006).
The first smallholder dairy scheme was formed by the government in 1983 (DMB, 1988).
Therefore, it is important to try and assess why the overall smallholder dairy value chain has not
significantly contributed to the national milk production. The four schemes were therefore
selected to represent the dynamics in the smallholder dairy value chain and to understand the
determinants of milk production that enters the overall smallholder dairy value chain.
5.13.2 Factors Influencing Milk Production in the Smallholder Dairy Value Chain
The predictor variables included in the model in this study were identified based on theory and
literature on empirical studies (for example, Wanjala et al., 2015; Sultana et al., 2016). Sultana
et al. (2016) used general linear model to understand the socio-economic determinants of milk
production, which showed that age of the farm owner, off-farm income and training had a
negative influence, while farming experience had a positive impact on milk production in
Bangladesh (Sultana et al., 2016).
The results of this study indicate that the multiple regression analysis model explained about
38% of the variation in milk production by the independent variables included. This means that
Page 149
133
62% of the variation in milk production is explained by other factors not included in the model.
It is important to note that although the R2 was low, statistically significant p-values continue to
identify relationships and the coefficients have the same interpretation. In other words,
interpreting a regression coefficient that is statistically significant does not change based on the
R2 value. The independent variables that were significant in the model were household size,
dairy farming experience of the head of household, age of the head of household, number of
milking cows and the cost of concentrates per month.
The coefficient for household size was positive and significant at 5%, indicating that milk
production increases with an increase in the household size of the producer. Dairying is an
intensive enterprise and smallholder dairy producers mainly rely on family labour, in particular
those who are not able to afford hired labour. Dairy farming experience of the head of household
was positive and significant at 5%, an indication that more experienced farmers can properly
manage their smallholder dairy enterprises for higher milk production compared to less
experienced farmers.
As expected the number of milking cows was positive and significant at 10%. These results are
consistent with Zamykal et al., (2007) study which showed the number of cows owned by the
producer was a significant predictor of milk production. Age of the head of household was
negative and significant at 10%. This results are consistent with the findings of Sultana et al.
(2016) who found the coefficient of age was negative and significant, indicating that milk yield
decreased with increasing age of the farmers.
The cost of concentrates was positive and significant at 5%, indicating the effect of concentrate
feed on smallholder milk production. Tanwar et al., (2015) also found that concentrate was one
of the main significant variable affecting returns from milk. Addisu et al., (2012) study in
Ethiopia showed that feeding of concentrate for dairy cattle was more prominent in high quality
Page 150
134
market sites compared to medium and low market quality sites, which indicated the level of feed
intensification as the market quality improved.
Sex of the head of the household was positive and not significant. Sultana et al. (2016) observed
that gender of the household head had no significant impact on milk production in Bangladesh.
Mumba et al. (2012) equally found that gender had no significant effect on the profitability of
the smallholder dairy enterprise in Zambia. Chinogaramombe et al. (2008) also found no
relationship between gender of the head of household and milk production in the semi-arid areas
of Zimbabwe.
This study shows quantitatively the use of multiple linear regression to determine factors
influencing milk production in Zimbabwe, which is in contrast to previous studies such as
Chinogaramombe et al. (2008) and Ngongoni et al. (2006) that have relied on descriptive
statistics. The study therefore shows main determinants of milk production in the smallholder
dairy value chain in Zimbabwe to be the household size (representing family labour available
for the dairy enterprise), dairy farming experience of the head of household (important for
management and decision making), age of the head of household (important for management of
the dairy enterprise), number of milking cows, and the cost of concentrates (indicating the cost
of brought-in concentrate feed).
5.14 Summary
This chapter has presented the description of the smallholder dairy value chain (which consists
largely of the semi-formal and formal value chains), descriptive statistics for characterizing these
value chains in terms of the smallholder dairy schemes studied, and discussion of these
characteristics and factors influencing milk production within the context of the smallholder
dairy value chain.
Page 151
135
This study shows quantitatively the use of multiple linear regression to determine factors
influencing milk production in Zimbabwe. Since household size, dairy farming experience, age
of the household head, number of milking cows and cost of concentrates were significant, we
therefore reject the null hypothesis that these factors do not influence milk production in the
smallholder dairy value chain. The study shows the main determinants of milk production in the
smallholder dairy value chain in Zimbabwe to be the household size (representing family labour
available for the dairy enterprise), dairy farming experience of the head of household (important
for management and decision making), age of the head of household (important for management
of the dairy enterprise), number of milking cows and the cost of concentrates (indicating the cost
of brought-in concentrate feed).
Page 152
136
CHAPTER SIX: DETERMINANTS OF MARKET PARTICIPATION AND VOLUME
OF MILK SOLD TO MILK COLLECTION CENTRES3
6.1 Introduction
Chapter Five presented the structure of the smallholder dairy value chains, and summarized
characteristics of the smallholder dairy producers in the schemes studied, and factors influencing
milk production in the overall smallholder dairy value chain. This chapter presents results of the
milk marketing outlets used by farmers in the smallholder dairy schemes studied, the quantity of
milk sold and prices, reasons for selling milk to the specific market outlets and reasons for not
selling milk to the MCC for those farmers not selling. The chapter also includes the major
sources of agricultural information for smallholder dairy producers, access to and use of mobile
technology in agricultural and dairy enterprise information. Results of constraints to transporting
milk to the MCC are included. The chapter includes a classification and results of socio-
economic and demographic characteristics of market participants and non-participants, and an
assessment of the factors affecting milk market participation and volume of milk sales to the
MCC of the smallholder dairy value chain. The MCC is an important component of the
smallholder dairy value chain as some of the scheme process the milk on site at the MCC and
participate in the semi-formal value chain while others deliver to processors and participate in
the formal value chain. A discussion of the results and conclusions drawn from the results
concludes the chapter.
3 Part of the results of this Chapter were published in a Paper titled “Determinants of Milk Market Participation
and Volume of Sales to Milk Collection Centres of the Smallholder Dairy Value Chain in Zimbabwe” in 2017 by
T. Chamboko, E. Mwakiwa and P.H. Mugabe. Journal of Agricultural Science Published by the Canadian Center
of Science and Education, Volume 9, Number 10, pp 156-167, 2017. (Full Paper in Annex 4, Paper 2).
Page 153
137
6.2 Milk Marketing Outlets in the Smallholder Dairy Schemes
This section presents results of the milk marketing outlets used by farmers, quantity of milk
sold and prices. The results of the reasons for selling milk to specific market outlets and
reasons for not delivering milk to the MCC are also included in this section.
6.2.1 Milk Marketing Outlets Used by Farmers
Although the total number of farmers interviewed was 185, not all farmers were producing
milk for sale. In the four schemes studied 87% of farmers were producing milk for sale. The
majority of farmers mainly sold milk to the MCC (54% in Chikwaka, 100% in Nharira-
Lancashire, 91% in Marirangwe and 98% in Rusitu) and about 85% in the four study sites.
Very few farmers used alternative market outlets with about 3% of farmers in Marirangwe
delivering the milk direct to processors, and 2% and 3% in Chikwaka and Marirangwe,
respectively selling the milk to local individuals (Table 6.1).
Table 6.1: Farmers selling milk to the MCC and other market outlets by study site,
2015
Chikwaka Nharira-
Lancashire
Marirangwe Rusitu Total
Number of farmers
interviewed
n=50 n=50 n=35 n=50 N=185
Are you producing milk for
sale?
% Yes 58.0 100.0 94.3 98.0 87.0
% Selling milk to the following
outlets:
Milk Collection Centre 54.0 100.0 91.4 98.0 85.4
Direct to Processor 0.0 0.0 2.9 0.0 0.5
Local individuals 2.0 0.0 2.9 0.0 1.1
Not specified 0.0 0.0 0.0 2.0 0.5
Source: Smallholder dairy survey (2015)
6.2.2 Quantity of Milk Sold and Prices
The quantity of milk sold per day to the MCC varied, with farmers in Chikwaka selling an
average of about 7 litres per day, about 14 litres per day in Nharira-Lancashire, 20 litres per day
in Marirangwe, about 12 litres per day in Rusitu and an average of about 14 litres per day in the
four study sites. The average prices of milk were USD0.40 per litre in Chikwaka, USD0.50 per
litre in Nharira-Lancashire, USD0.52 per litre in two study sites of Marirangwe and Rusitu, and
Page 154
138
an average of the four study sites of USD0.49 per litre (Table 6.2). The few farmers who were
selling to local individuals and direct to urban based processors achieved a price of USD1.00 per
litre (Table 6.2).
Table 6.2: Quantity of milk sold and prices by study site, 2015
Chikwaka Nharira-
Lancashire
Marirangwe Rusitu Total
n=50 n=50 n=35 n=50 N=185
Quantity of milk sold per
day to the MCC (litres)
Number of farmers
reporting
25 50 32 49 156
Mean (SD) 6.5 (4.5) 13.9 (8.8) 20.4 (24.0) 12.3
(9.9)
13.5
(13.8)
Quantity sold to local
individuals
(litres)
Number of farmers
reporting
1 0 1 0 2
Mean (SD) 8.0 0.0 2.0 0.0 5.0 (4.2)
Quantity sold direct to
Urban based Processor
(litres)
Number of farmers
reporting
0 0 1 0 1
Mean (SD) 0.0 0.0 320.0 0.0 320.0
Prices of milk (USD/litre)
paid by:
MCC (USD/litre)
Number of farmers
reporting
24 50 32 49 155
Mean (SD) 0.40
(0.01)
0.50 (0.0) 0.52 (0.02) 0.52
(0.45)
0.49
(0.50)
Local individuals (litres)
Number of farmers
reporting
1 0 1 0 2
Mean (SD) 1.00 0.00 1.00 0.00 1.00
Urban based Processor
(litres)
Number of farmers
reporting
0 0 1 0 1
Mean (SD) 0.00 0.00 0.58 0.00 0.58
Source: Smallholder dairy survey (2015)
6.2.3 Reasons for Selling to the Specific Market Outlets
The questionnaire included a follow up question on the reasons why farmers sold milk to
particular market outlets. Since the MCC was the main market outlet used by farmers, the main
Page 155
139
reasons were some farmers felt they had an obligation as members of the MCC to sell milk to
the MCC (33% of the farmers reporting), some indicated the MCC was nearest market outlet
(about 25% of farmers reporting) and in Nharira-Lancashire and Marirangwe, farmers indicated
that they sell to the MCC because they can get immediate cash (22% and about 36%,
respectively). In Marirangwe about 36% of farmers reporting indicated the MCC was close to
the production site, while in Nharira-Lancashire 30% indicated that the MCC offers a guaranteed
income from the milk sales (Table 6.3).
Table 6.3: Reasons for selling to the MCC by study site, 2015
Chikwaka Nharira-
Lancashire
Marirangwe Rusitu Total
Number of farmers
interviewed
n=50 n=50 n=35 n=50 N=185
Number of farmers
reporting
48 50 31 49 178
Membership obligation n 44 15 0 0 59
% 91.7 30.0 0.0 0.0 33.1
Nearest MCC n 0 8 7 30 45
% 0.0 16.0 22.6 61.2 25.3
Can get immediate cash n 0 11 11 0 22
% 0.0 22.0 35.5 0.0 12.4
Offer better price n 1 4 2 6 13
% 2.1 8.0 6.5 12.2 7.3
Close to production site n 0 0 11 0 11
% 0.0 0.0 35.5 0.0 6.2
Guaranteed income n 1 15 0 0 16
% 2.1 30.0 0.0 0.0 9.0
Want the MCC to remain
active and serve the local
community
n 0 5 1 0 6
% 0.0 10.0 3.2 0.0 3.4
Source of income n 0 5 0 0 5
% 0.0 10.0 0.0 0.0 2.8
Only buyer (no other place
to sell)
n 0 2 0 4 6
% 0.0 4.0 0.0 8.2 3.4
Others reasons n 0.0 1 2 9 12
% 0.0 2.0 6.5 19.3 6.7
Note: n = number of farmers reporting
Source: Smallholder dairy survey (2015)
Page 156
140
6.2.4 Reasons for not Delivering Milk to the Milk Collection Centre
The questionnaire included a question on further inquiry on households not delivering milk to
the MCC at the time of the study. The main reason frequently reported by the few households
reporting is that they did not have cows to milk (52% of households in Chikwaka, 2% of
households in Nharira-Lancashire and about 3% in Marirangwe), with about 15% in the four
study sites. The second most frequently reported reason was that of low milk produced by
indigenous breeds (about 5% in the four study sites), while the third reason was that farmers’
cows were dry at the time of the study (about 5% in the four study sites) (Table 6.4).
Table 6.4: Reasons for not delivering milk to the MCC by study site, 2015
Chikwaka Nharira-
Lancashire
Marirangwe Rusitu Total
n=50 n=50 n=35 n=50 N=185
Number of farmers reporting 33 17 3 2 55
% of farmers reporting
indicating:
Sell the milk locally 3.0 0.0 0.0 0.0 1.8
No cows to milk 78.8 5.9 33.3 0.0 50.9
All dairy cattle died 3.0 0.0 0.0 100 5.5
Low milk produced by
indigenous breeds
2.1 35.3 0.0 0.0 18.2
All milk consumed by
the household
6.1 5.9 33.3 0.0 7.3
Transport problems 0.0 11.8 0.0 0.0 3.6
Dry cows 0.0 52.9 0.0 0.0 16.4
High volumes produced
for one to deliver to
MCC, so deliver direct
to processor
0.0 0.0 33.3 0.0 1.8
Note: This was a multiple response question, with some households giving more than one
reason.
Source: Smallholder dairy survey (2015)
6.3 Sources of Agricultural and Market Information
This section presents results on the major sources of agricultural information, sources of
information on market prices of milk and milk products and the use of mobile phones in
providing information for the dairy enterprise.
Page 157
141
6.3.1 Major Source of Agricultural Information
General agricultural information is important in enabling dairy producers to make decisions
regarding their enterprise. The major source of agricultural information reported by producers in
the study sites were the local extension worker (82% of farmers reporting in Chikwaka, 100%
in Nharira-Lancashire, 60% in Marirangwe and 90% in Rusitu). The other significant sources of
agricultural information reported were the MCC (16% of farmers in Chikwaka and about 31%
in Marirangwe) (Table 6.5).
Table 6.5: Major source of agricultural information by study site, 2015
Chikwaka Nharira-Lancashire Marirangwe Rusitu Total
n=50 n=50 n=35 n=50 N=185
% source is from:
Local extension officer
82
100
60
90
84.9
Local NGO 2 0 0 6 2.2
Radio 0 0 2.9 0 0.5
MCC 16 0 31.4 4 11.4
Missing 0 0 5.7 0 1.1
Source: Smallholder dairy survey (2015)
6.3.2 Source of Information on Market Prices of Milk and Milk Products
Information on the price of milk and milk products enable producers in the smallholder dairy
schemes to make decisions on markets and which market outlets to target. The major source of
information on prices of milk and milk products was the MCC reported by about 91% of farmers
in the four study sites (98% of farmers reporting in Chikwaka, 92% in Nharira-Lancashire, about
86% in Marirangwe and 86% in Rusitu). The local extension officer was reported by about four
percent of farmers in the four study sites as a source of information on market prices of milk and
milk products (Table 6.6).
Page 158
142
Table 6.6: Source of information on market prices of milk and milk products by study
site, 2015
Chikwaka Nharira-
Lancashire
Marirangwe Rusitu Total
Percentage of source n=50 n=50 n=35 n=50 N=185
% source is from:
From MCC
98
92
85.7
86
90.8
Local extension officer 2 0 2.9 10 3.8
Radio 0 0 2.9 2 1.1
Meetings with Researchers 0 4 0 0 1.1
Own research on competitors 0 4 0 0 1.1
Internet 0 0 2.9 0 0.5
ZADF 0 0 0 2 0.5
Missing 0 0 5.7 0 1.1
Total 100 100 100.1 100 100
Source: Smallholder dairy survey (2015)
6.3.3 Use of Mobile Phones for Dairy Enterprise Information
Mobile phones are increasingly becoming an important technology in the dissemination of
agricultural information. Farmers were asked to indicate whether there was any member of the
household who owned a mobile phone, and whether they used the mobile phone to get
information for the dairy enterprise. The responses indicated 66% of households in Chikwaka,
98% in Nharira-Lancashire, 97% in Marirangwe and 92% in Rusitu had at least one household
member who owned a mobile phone. Thirty six percent of households in Chikwaka, 98% in
Nharira-Lancashire, 91% in Marirangwe and 60% in Rusitu indicated they used the mobile
phone to get information on the dairy enterprise. The main types of information that farmers
obtained using the mobile phones were information on meetings and trainings (about 30% of
farmers reporting in the four study sites), milk prices (about 28% of farmers reporting in the four
study sites), sources of inputs and MCC activities (about 15% in the four study sites
respectively), and the prices of inputs (about 14% of farmers reporting in the four study sites)
(Table 6.7).
Page 159
143
Table 6.7: Cellphone ownership and type of information received by study site, 2015
Chikwak
a
Nharira-
Lancashire
Marirangw
e
Rusit
u
Total
n=50 n=50 n=35 n=50 N=185
Ownership of cellphone %
Yes
66.0 98.0 97.1 92.0 87.6
Use of cellphone for dairy
enterprise information?
%
Yes
36.0 98.0 91.4 60.0 69.7
Type of information received:
Milk prices N 2 10 14 17 43
% 12.5 15.4 35.9 47.2 27.6
Prices of inputs n 0 7 7 7 21
% 0.0 10.8 17.9 19.4 13.5
Sources of inputs n 1 4 15 4 24
% 6.3 6.2 38.5 11.1 15.4
Dairy management
information
n 1 1 1 1 4
% 6.3 1.5 2.6 2.8 2.6
MCC activities n 9 2 0 4 15
% 56.3 3.1 0.0 11.1 9.6
Meetings and trainings n 1 41 2 2 46
% 6.3 63.1 5.1 5.6 29.5
Other n 0 0 0 2 2
% 0.0 0.0 0.0 5.6 1.3
Total n 16 65 39 36 156
Note: n = number of farmers reporting
Source: Smallholder dairy survey (2015)
6.4 Major Constraints in Transporting Milk to the Market
The questionnaire included a question on the major constraints smallholder dairy farmers faced
in transporting milk to the market. The results show that about 30% of farmers reporting in the
four study sites indicated they did not face any constraints. Lack of suitable transport was the
major constraint reported by about 30% of farmers in the four study sites (26% in Chikwaka,
66% in Nharira-Lancashire, about 9% in Marirangwe, and 14% in Rusitu), followed by long
distance to the market reported by about 16% of farmers in the four study sites (20% in
Chikwaka, 16% in Nharira-Lancashire, about 6% in Marirangwe, and 18% in Rusitu), and poor
roads which were reported by about 15% of farmers in the four study sites (Table 6.8).
Page 160
144
Table 6.8: Major constraints in transporting milk to the market by study site, 2015
Chikwaka Nharira-Lancashire Marirangwe Rusitu Total
n=50 n=50 n=35 n=50 N=185
% citing:
None (no constraints)
24.0
4.0
37.1
56.0
29.7
Lack of suitable transport 26.0 66.0 8.6 14.0 30.3
Long distance to market 20.0 16.0 5.7 18.0 15.7
Poor roads 8.0 8.0 37.1 12.0 14.6
High transport costs 14.0 4.0 5.7 0.0 5.9
Other 8.0 0.0 0.0 0.0 2.1
Missing 0.0 2.0 5.7 0.0 1.6
Source: Smallholder dairy survey (2015)
6.5 Summary of Socio-Economic and Demographic Characteristics of Milk Market
Participants and Non-Participants4
The households in the four schemes were grouped on the basis of those who were selling milk
to the MCC at the time of the study and those who did not. Farmers selling milk to the MCC and
other market outlets were classified as market participants while those not selling were classified
as non-market participants. The characteristics of households show that average age of the
household head was about 57 years for market participants and about 60 years for non-market
participants. The independent samples t-test for age was not significant between the two groups.
The independent t-test for educational level of the household head, number of extension visits
to the farm, total size of land holding of the household, size of household in terms of average
number of household members, income from other sources, total number of dairy cows owned
by the household and the volume of milk sales to the MCC were significant at the 5% level of
significance between participants and non-participants. The Chi-square test for categorical
variables shows that only access to information and agro-ecological region were statistically
significant between market participants and non-market participants (Table 6.9).
4 Results Published in Journal of Agricultural Science Published by the Canadian Center of Science and
Education, Volume 9, Number 10, pp 156-167. 2017.
Page 161
145
Table 6.9: Socio-economic and demographic characteristics of milk market
participants and non-participants
Mean value of market participants and non-
market participants
Variables Market
Participant
Non-
Participant
t-value
Number of households n=161 n=24
Age of household head (years) 56.60 60.30 -1.249
Educational level (number of years in
school)
8.98 7.50 2.172*
Distance to MCC (km) 5.30 6.20 0.872
Number of extension visits to the farm 12.50 3.60 4.794*
Dairy farming experience (years) 16.80 16.30 0.216
Total size of arable land (Ha) 8.30 2.10 4.492*
Household size 6.30 5.30 2.031*
Total number of dairy cows owned 4.60 1.40 6.946*
Income from other sources 3248.00 1656.00 1.986*
Milk sold per month (litres) 515.17 0.00 7.114*
Chi-square
value
Sex of head of household
% Males 73.90 73.90 0.000
Access to extension services
% Yes 96.90 100.00 0.734
Access to information
% Yes 75.80 26.10 23.469*
Farmer occupation
% full time 81.9 78.3 1.74
Agricultural training
% received some training in agriculture 55.3 47.8 0.451
Agro-ecological region
% in NR I and II 68.9 100 9.808*
Note: * Statistical significance at 5%
Source: Smallholder dairy survey (2015)
6.6 Factors Affecting Milk Market Participation and Volume of Milk Sales to the MCC of
the Smallholder Dairy Value Chain5
This section presents results of factors affecting milk market participation and volume of milk
sales to the MCC of the smallholder value chain from the analysis using the first and second
stages of the Heckman two-step model.
5 Results Published in Journal of Agricultural Science Published by the Canadian Center of Science and
Education, Volume 9, Number 10, pp 156-167. 2017.
Page 162
146
6.6.1 Results of the First-Stage Heckman Model
In order to understand the determinants of milk market participation and volume of sales to the
MCC of the organized smallholder dairy value chains, the Heckman two-step model was used.
The results of the first stage of the Heckman two-step model show that of the 14 variables
included in the model, seven variables explained the probability of milk market participation,
These were total number of dairy cows owned by the household (TotCows), educational level of
the head of household (Educhh), age of the head of household (Agehh), size of household
(hhsize), access to information (AccInfo), access to extension services (AccExt), and the agro-
ecological natural region (NRDSch) location of the smallholder dairy schemes of the household.
The variables were positive and significant (Table 6.10).
Table 6.10: Estimated parameters of the binary probit model for factors determining
market participation
Variable Coefficient Standard Error z P>|z|
TotCows 0.0063 0.0032 1.97 0.049*
DistkmMCC 0.0016 0.0016 1.02 0.308
Educhh 0.0149 0.0025 5.48 0.000**
Agehh 0.0037 0.0007 5.53 0.000**
Sexhh 0.0114 0.0176 0.65 0.516
hhsize 0.0072 0.0024 3.02 0.003**
Dexp 0.0005 0.0010 0.47 0.641
Landho -0.0007 0.0005 -1.28 0.202
AccInfo 0.0491 0.1827 2.69 0.007**
AccExt 0.4656 0.0452 10.31 0.000**
IncOthSou 0.0000 0.0000 0.37 0.711
FarOcc 0.1681 0.0204 0.82 0.411
AgriTr 0.0184 0.0158 1.16 0.245
NRDSch 0.0640 0.0206 3.10 0.002**
Dependent variable=Market participation through delivering milk to the MCC
Number of observations =144
Censored observations = 17, Uncensored observations = 127
Wald Chi2 = 16181.68, Prob > Chi2 = 0.0000
**, * Statistical significance at 1% and 5%, respectively.
Source: Smallholder dairy survey (2015)
6.6.2 Results of the Second-Stage Heckman Model
The results of the second-stage Heckman selection estimation model for volume of milk sales to
the MCC of the smallholder dairy value chain show that out of the 14 variables six variables
Page 163
147
significantly affected the volume of milk sales to the MCC. Total number of dairy cows owned
by the household (TotCows), access to extension (AccExt) and landholding size of the household
(Landho) were positive and significant, while distance to the MCC (DistkmMCC), age of the
household head (Agehh), and agro-ecological region (NRDSch) location of the smallholder dairy
scheme of the household were negative and significant (Table 6.11).
Table 6.11: Results of second stage Heckman selection of factors affecting
volume of sales to the MCC
Variable Coefficient Standard Error z P>|z|
TotCows 0.4693 0.1636 2.87 0.004**
DistkmMCC -0.1873 0.0649 -2.89 0.004**
Educhh -0.0836 0.0890 -0.94 0.348
Agehh -0.0604 0.0268 -2.25 0.024*
Sexhh 0.2836 0.5302 0.53 0.593
hhsize 0.0618 0.0841 0.73 0.463
Dexp -0.0262 0.0278 -0.94 0.346
Landho 0.5578 0.2414 2.31 0.021*
AccInfo 0.6216 0.4763 1.31 0.192
AccExt 6.0513 2.1499 2.81 0.005**
IncOthSou 0.0003 0.0002 1.30 0.193
FarOcc 0.6840 0.6979 0.98 0.327
AgriTr -0.6652 0.5535 -1.20 0.229
NRDSch -3.4258 1.5765 -2.17 0.030*
Lambda 0.0791 0.0369 2.14 0.032*
Dependent variable=Volume of milk sales to the MCC per month in litres
Number of observations =144
Censored observations = 17, Uncensored observations = 127
Wald Chi2 = 2024.26, Prob > Chi2 = 0.0000, Rho = 1.00000
Sigma = 0.07962107
**, * Statistical significance at 1% and 5%, respectively.
Source: Smallholder dairy survey (2015)
6.7 Discussion
This section first discusses the results of the characteristics of the smallholder dairy value chain
in terms of milk marketing outlets used by farmers, agricultural information, constraints in
transporting milk and socio-economic characteristics for milk market participants and non-
participants. The section then discusses the determinants of milk market participation and
volume of sales to the MCC of the organized smallholder dairy value chains. The hypothesis of
the study was that total number of dairy cows owned by the household, distance to the milk
Page 164
148
collection centre, educational level, age and sex of the head of household, household size, dairy
farming experience, size of land holding of the household, access to information and extension,
income from other sources, occupation of the farmer, agricultural training of the head of
household and the agro-ecological region location of the smallholder dairy scheme do not affect
market participation and volume of sales to the MCC. The hypothesis was tested using the
Heckman two-step model.
6.7.1 Milk Marketing Outlets
The survey results indicate that the majority of producers who participated in markets sold milk
to the MCC (more than three quarters of farmers reporting). The MCC is an important
component of the smallholder dairy schemes since the formation of the smallholder dairy
development programme by the government in 1983. The MCC acts as the main collection point
and the bulking up point of the milk for collective marketing of the milk and dairy products in
the smallholder dairy schemes. The smallholder dairy schemes that supply the semi-formal value
chain process the milk on site at the MCC, and the products are partly sold at the MCC directly
to consumers. These MCC in some of the smallholder dairy schemes started as farmer
associations but most have now registered as cooperatives in order to access financing and other
NGOs and government programmes that support cooperatives in the country. Very few farmers
participated in alternative market outlets such as selling milk at the farm gate to other local
individual farmers. The reasons advanced for selling milk to the MCC clearly support the notion
of the MCC as the main market outlet, as some farmers felt it obligatory to supply milk to the
MCC due their membership which entitles them to participate in MCC activities. Only one
farmer in Marirangwe smallholder dairy scheme delivered milk directly to processors in the
capital city of Harare, an indication that with increased volumes, smallholder farmers may
effectively participate in formal value chains that offer higher prices compared to the semi-
formal value chains.
Page 165
149
The quantity of milk sold varied by MCC, but was generally higher for the schemes delivering
milk to the formal value chains (Marirangwe and Rusitu) compared to Chikwaka and Nharira-
Lancashire which participate in the semi-formal value chain. This indicates that as the level of
milk production increases, smallholder dairy producers require access to stable markets that offer
better returns. This indicates the importance of access to markets if smallholder dairy producers
are to increase milk production and hence sales to the MCC of the smallholder dairy value chain.
6.7.2 Agricultural Information
Farmers in the smallholder dairy schemes studied accessed agricultural information from the
local agricultural extension officers, the MCC and through use of mobile phones. The local
extension officer is the major source of agricultural information (more than three quarters of
farmers in the four study sites), an indication of the availability of extension services in the
smallholder dairy schemes studied. The extension services are provided mainly by the Livestock
Services and Production Department (LPD), which is responsible for livestock extension. Given
the current challenges affecting government departments, the effectiveness of the extension
services, however, is limited. Key informants interviews indicated that lack of resources was one
of the major limitations of the local extension services. Besides the local extension service, the
MCC plays an important role in providing information on milk prices and prices of milk
products. This is particularly so for MCC where there is on site processing of milk at the MCC
for selling directly to consumers. The use of mobile phones in accessing dairy enterprise
information is spreading as farmers embrace the technology in order to keep updated with trends
and information provision for the dairy enterprise. The majority of smallholder dairy producers
had access to mobile phones (about 88% with at least one member of the household owning a
mobile phone) and used the phones to access dairy enterprise information (about 70% in the four
study sites). This indicates that smallholder dairy producers are adaptable to changing trends in
technology use, which offers potential delivery avenues of information and related extension
messages for the benefit of farmers.
Page 166
150
6.7.3 Constraints in Transporting Milk to the Market
Lack of suitable transport was the major challenge in delivering milk to the MCC. This indicates
that smallholder dairy producers lack appropriate mechanisms to transport milk to the MCC, an
indication that this could possibly be one of the main reasons for low milk deliveries to the MCC.
Key informant interviews in some of the smallholder dairy schemes indicated farmers did not
deliver milk in the afternoon due to lack of transport. The milk is then diverted to home
consumption. This limitation is exacerbated by the distance to the MCC, which was reported as
the second major constraint. Distance to the MCC basically indicates access to the market, as
the MCC is the main sales outlet for smallholder dairy producers. Holness et al. (2008) report
that distance from the milk centres ranged from one to 20km, with 60 percent being over 5km.
This presented problems and all the farmers only delivered milk once a day. Smallholder dairy
producers with limited access to markets are not able to fully participate in milk markets.
6.7.4 Socio-economic Characteristics of Milk Market Participants and Non-Participants
The results show that out of the 185 farmers interviewed, 87% were milk market participants as
they sold milk to the MCC and other market outlets, while the remaining households did not
participate in the market. The MCC forms an important stage of the smallholder dairy value
chain. At two of the schemes studied (Chikwaka and Nharira-Lancashire), milk is processed on
site at the MCC and the dairy products are sold directly to consumers in the local area or nearby
growth points and urban areas (regarded as the semi-formal value chain). Part of the milk is sold
as raw milk to the local community or as fermented milk (Amasi). At Marirangwe and Rusitu,
the milk is collected by processors based in urban areas (regarded as the formal value chain).
The urban based processors produce a number of products that are sold mainly to urban based
consumers. Therefore participating in the semi-formal or formal value chain offers potentially
better incomes for smallholder dairy producers, compared to alternative markets where the
volumes sold are limited by the low incomes of consumers.
Page 167
151
For those farmers who were not selling milk to the MCC, further inquiry was made regarding
the reasons. The main reason given for not selling any milk to the MCC was that farmers did not
have any cows to milk, indicating the importance of milking cows in dairy market participation.
The socio-economic characteristics of milk market participants and non-participants show that
although it was not significant, the age of the head of household was slightly lower (57 years for
market participants) compared to non-market participants (60 years). The mean educational level
of the household head in terms of number of years in school for market participants was
marginally higher (9 years) compared to non-market participants (8 years). The t-statistic value
indicated the mean difference in educational level was statistically significant and positive at 5%
level. This indicates the importance of education in understanding dairying and decision making
of smallholder dairy producers in terms of market orientation. The results are consistent with the
findings of Kuma et al. (2014).
The mean distance to the MCC was 5.3 km for milk market participants compared to non-market
participants (6.2 km), although this was not statistically significant. The results of dairy farming
experience for the head of household also indicate the mean was not statistically different
between participants and non-participants. The size of landholding of the household results show
that milk market participants had a significantly larger mean landholding (8.3 Ha) compared to
non-market participants (2.1 Ha), indicating the relationship between dairy market participation
and size of landholding in Zimbabwe.
Households who participated in milk markets had marginally larger household sizes (about 6
household members) compared to 5 household members for non-market participants, and the t-
statistic showed the variable was significant at 5%. Dairying is a labour intensive enterprise and
most of the households in the smallholder dairy schemes depend on family labour. The results
of mean household size indicates that the size of household influences market participation due
to the availability of family labour for performing the various activities of the dairy enterprise.
Page 168
152
The average total number of dairy cows owned by the households for milk market participants
were about 5 cows compared to one cow for non-market participants, the result of this variable
was significant at 1%. The quantity of milk sold per month in litres was 515 litres, indicating
that milk production is the most important variable affecting milk market participation. Milk
market participants had higher incomes (USD3248) compared to non-milk market participants
(USD1656) and this was significant at 5%. Milk market participants had higher incomes from
other sources per annum (USD3248) compared to non-milk participants (USD1656) and this
was significant at 5%. Income from other sources such as crop production enables smallholder
dairy producers to access resources to invest in the dairy enterprise, such as acquiring dairy cows
of improved breeds. This therefore indicates the influence of other sources of income in milk
market participation.
Sex of the household indicates that about three quarters of the heads of households were males
for both milk and non-milk market participants and the Chi-square test was not significant.
Access to extension services shows that almost all milk market participants and non-milk
participants respectively had access to extension services and the Chi-square value indicates the
difference was also not significant.
Access to information was measured on the basis of whether one of the household members
owned a mobile phone, and whether the mobile phone was used to access dairy enterprise
information. About three quarters of the milk market participants indicated positively to owning
a mobile phone compared to about 26% of milk market non-participants and the variable was
significant. The results indicate the influence of access to information on milk market
participation.
The last two categorical variables assessed were occupation of the household head and agro-
ecological region location of the smallholder dairy scheme of the household. Occupation of the
head of household was classified into full-time farmers, or otherwise if the farmer was not full-
Page 169
153
time on the farm. Full-time farmers were resident at the farm, while others were employed off
farm or were involved in other activities that limited them from farming on a full time basis.
About 82% of milk market participants were full time farmers compared to 78% for non-milk
market participants, although the Chi-square test indicates this was not significant. In terms of
agro-ecological location of the smallholder dairy scheme of the household, about 70% of milk
market participants and all milk market non-participants (100%) were located in NR I and II,
and the Chi-square indicates this variable was significant. In Zimbabwe, the natural region
location of the smallholder dairy scheme of the household determines the amount of rainfall that
is received and therefore the potential for agricultural and livestock production. NR I and II are
considered as the regions with the highest potential for intensive production of both crops and
livestock, compared to NR III to V where the rainfall is limited and the regions are suitable for
semi-intensive and extensive crop and livestock production (Muir-Leresche, 2006).
6.7.5 Determinants of Milk Market Participation and Volume of Sales to the MCC of the
Smallholder Dairy Value Chain6
This section discusses factors that determine milk market participation and volume of sales to
the MCC of the smallholder dairy value chain. The discussion initially focuses on the first stage
of the Heckman participation model and then the second stage Heckman selection model.
6.7.5.1 First-Stage Heckman Participation Model
The first stage Heckman two-step model (binary probit model) results show that out of the 14
explanatory variables, seven determine the probability of milk market participation. These are
total number of dairy cows owned by the household, educational level of the head of household,
age of the household head, household size, access to information and extension services, and
natural region location of the smallholder dairy scheme.
6 Results Published in Journal of Agricultural Science Published by the Canadian Center of Science and
Education, Volume 9, Number 10, pp 156-167. 2017.
Page 170
154
As expected, the total number of dairy cows owned by the household had positive relationship
with milk participation decision and was statistically significant at 5% probability level. The
positive and significant relationship indicates that the greater the number of dairy cows owned
by the household, the better is the milk production and the more likely the household will make
milk market participation decisions. These results are consistent with the findings of Kuma et
al., (2014). The educational level of the head of household was positive and had significant
impact on milk market participation at 1%. The positive and significant relationship between the
two variables indicates the educational level of the head of household as an important variable
affecting households’ milk market participation. Age had positive and significant impact on milk
market participation at 1%. The positive and significant relationship indicates that age, which
can be used as a proxy for experience, shows that old aged farmers acquire experience over the
years and hence positively influences market participation. These results coincide with the
findings of Kuma et al., (2014) and Mamo et al., (2014) in Ethiopia.
Household size and milk market participation relationship was positive and significant at 1%.
The results are in conformity with the findings of Demissie et al., (2014) in Ethiopia. The
positive and significant relationship indicates that dairy is a labour intensive enterprise. Large
family sizes in smallholder dairy enterprise indicates availability of labour for smallholder dairy
production which increases milk market participation. Access to information and milk market
participation decision are positively related and significant at 1%. This indicates that access to
information increases milk market participation and leads to understanding of the workings of
the market, information on prices, and other market information that improves decision making
of the smallholder dairy producer. Access to extension services and milk market participation
decisions indicates a positive and significant relationship at 1%. This indicates that access to
extension services provides farmers with information on technologies that are necessary to
improve management of the dairy enterprise and hence improved milk production and enhanced
market participation decisions.
Page 171
155
Agro-ecological region location of the smallholder dairy scheme of the households and milk
market participation decisions relationship was positive and significant at 1%. This indicates that
agro-ecological region location of the scheme of the household enhances milk market
participation decisions since smallholder dairy schemes located in high potential regions of NR
I and II are able to access feeds and Stover from crop production due to the high rainfall received
in these regions. Households can also grow improved forage and fodder crops that can be used
for supplementary feeding of the dairy animals, compared to smallholder dairy schemes located
in NR III to V. Masama et al., (2005) study of Nharira-Lancashire which is located in NR III of
Zimbabwe found that farmers kept inadequate amounts of feeds of poor nutritional quality for
feeding the dairy cows year round. Chinogaramombe et al., (2008) also found that feed shortages
was one of the major constraints for smallholder dairy production for the semi-arid regions of
Zimbabwe which are mainly located in NR III, IV and V.
The milk market participation model also show that sex, dairy farming experience, and
agricultural training of the head of household, distance to the market, land holding size, farmer
occupation and income from other sources were not significant. In terms of dairy farming
experience and landholding size, these results are contrary to the findings of Kuma et al., (2014)
in Ethiopia. Kuma et al., (2014) found these two variables to be negatively related to milk market
participation, which was contrary to the initial expectations. The explanation advanced (Kuma
et al., 2014) in the case of dairy farming experience in Ethiopia was that households with many
years dairy farming experience owned local cows and lived in areas where the demand for milk
was low. The farmers were also more engaged in marketing milk products rather than milk. In
Zimbabwe, this could possibly be explained by the fact that dairy farmers have not adopted dairy
farming as a specialized enterprise and are therefore not commercially oriented. Key informants
interview indicates that farmers practicing dairy are also into many other cropping and livestock
enterprises and therefore do not give dairying the management attention it requires as a
specialized enterprise.
Page 172
156
In terms of landholding size, Kuma et al., (2014) found a negative and significant effect on
household milk market participation. Their explanation was that the negative relationship
between milk market participation and land holding indicates that market oriented dairy
production does not necessarily require large pieces of land (Kuma et al., 2014). This was mainly
because households producing milk for market had access to purchasing pastures from other
households or from government holdings. Contrary to the situation reported by Kuma et al.,
(2014), in Zimbabwe, farmers have limited access to purchased pastures from other households.
The households have to allocate the available land between competing demands for the
production of food crops, fodder and feed for the smallholder dairy enterprise.
Although the result of income from other sources was not significant in this study, other studies
have found otherwise. Demissie et al., (2014) found that financial income from other sources
had negative effect on cow milk market participation and the relationship was significant.
Demissie et al., (2014) explanation was that this indicated that any financial income decreases
milk market participation for the smallholder producer household as a result of fixed transaction
costs.
The determinants of farmers’ participation in the milk market can be summarized as the number
of dairy cows owned by the household and household size which represent availability of
resources; while educational level, access to information and extension service represent
availability of knowledge; age of household head which represent experience; and agro-
ecological region representing the natural and climatic conditions.
6.7.5.2 Second Stage Heckman Selection Model
Heckman’s second stage estimation identifies the significant factors that affect volume of milk
sales using the selection model, which included the inverse Mill’s ratio calculated from the probit
estimation of milk market participation decision. The overall joint goodness of fit for the second
stage is assessed based on Wald Chi-square test. The null hypothesis for the test is that all
Page 173
157
coefficients are jointly zero. In this study, the model Chi-square test (Wald Chi2 = 2024.26; Prob
> Chi2 =0.0000) indicates that the overall goodness of fit for the selection model is statistically
significant at less than 1%. This shows that jointly independent variables included in the model
explained the volume of milk sales.
In the second stage selection model, out of the 14 variables, seven variables were found to be
significant determinants of volume of milk sales to the MCC of the smallholder dairy value
chain, including the inverse Mill’s ratio (LAMBDA). The variables found to be significant are
total number of dairy cows owned by the household, distance to the MCC (representing access
to markets), age of the head of household, land holding size of the household, access to extension
services and agro-ecological region location of the smallholder dairy scheme of the household.
As hypothesized, the total number of dairy cows owned by the household had a positive effect
on volume of milk sales and is significant at the 1% probability level. The model output predicts
that an addition of one dairy cow causes the marketable volume to increase by 0.47 litres per
month. These results are in line with Bedilu et al., (2014). Bedilu et al., (2014) found that number
of milk cows had positive effect on marketed milk volume in Ethiopia. The number of dairy
cows owned by the household is an important policy variable that indicates possible policy
interventions that can be implemented in order to enhance milk market participation and volume
of milk sales in order for the smallholder dairy producers to benefit from the lucrative value
chains. Bardhan et al., (2012) study in India report that the milk output sold depends on farm
and farmer specific variables such as family size, age, education, resource ownership like land
and animal holding. In this study, resource ownership includes total number of dairy animals
owned by the household which are significant in determining volume of sales.
The distance to the MCC, which was used as a proxy for access to milk markets of the
smallholder dairy value chain was negative and significant at 1% probability level. As
hypothesized, distance to the MCC affected milk sales volume negatively. The results are in line
Page 174
158
with Mamo et al., (2014) study in Ethiopia where market distance significantly affected volume
of milk value added. This indicates that as one moves further away from the MCC, the greater
the transportation costs and the losses due to spoilage and less access to information and facilities
offered by the MCC, thereby impacting negatively on volume of sales.
Age of the head of household had negative effect on milk sales volume and was found to be
significant at 5%. This implies that old aged households heads are slow to adapt to changing
market conditions and new technologies, and therefore do not respond quickly to market
incentives to increase milk supply to the market. Conversely, this can possibly indicate that
young aged households are more business minded, are ambitious and entrepreneurial and
therefore make use of improved inputs to increase milk production, thus increasing volume of
sales. The mean age of the household head for milk market participants was lower than that of
non-milk market participants. The average age of the household head for farmers supplying the
MCC of the semi-formal value chain (Chikwaka and Nharira-Lancashire) was generally higher
than the ages of household heads of dairy schemes supplying the MCC of the formal value chain
(Marirangwe and Rusitu). This possibly indicates that old aged households are not as market
oriented compared to young aged households. This implies that in order to increase volume of
sales to the MCC of the smallholder dairy value chain, government policy interventions need to
target young aged households that are more adaptable, ambitious, entrepreneurial, and are more
inclined to quickly understand the dynamics of the milk markets.
Land holding size of the household had a positive and significant effect on milk sales volume at
5%. These results are in line with Bardham et al., (2012) study which indicates that milk output
sold depends on farm and farmer specific variables such as ownership of the land resource. This
indicates that households with large land holdings have better access to grazing for their dairy
cows, and can also grow supplementary fodder crops including better access to crop residues
that can be used as supplementary dairy feed. This improves milk production and hence milk
sales volume supplied to the MCC of the smallholder dairy value chain. The results of the
Page 175
159
descriptive statistics show that generally land holding size was higher for smallholder milk
market participants, and for farms supplying the formal compared to the semi-formal value
chain. This indicates an important policy variable that is relevant to smallholder milk sales
volume, and has important implications for milk supply in Zimbabwe in light of the
implementation of the fast track land reform and redistribution programme that reduced the size
of land holdings of the previously large scale commercial farmers.
Access to extension services had positive and significant (at 1% level) effect on milk sales
volume supplied to the MCC of the smallholder dairy value chain. The change in having access
to extension services of the smallholder dairy producers on milk quantity supplied was about 6.1
litres. These results are contrary to those obtained by Bedilu et al., (2014). Bedilu et al., (2014)
initially hypothesized that access to livestock extension was expected to positively affect sales
of cow milk but the results indicated access to livestock extension service was significant and
negatively affected marketed surplus. In this study, the results indicate that milk sales volume
in the study sites was more responsive to access to extension services. Although in the past the
extension services in Zimbabwe have been quite effective, a study commissioned by the
European Union show that limited resource allocation has limited the effectiveness of extension
delivery in the country (Pazvakavambwa et al., 2010). Extension is important in providing up-
to-date knowledge required to effectively run the dairy enterprise. The policy implications are
that access to adequate and appropriate extension should be one of the priority policy
interventions if government is to increase milk sales volume from the smallholder dairy
producers. This would increase milk production and hence milk sales volume to the MCC of the
smallholder dairy value chain. With the increased production and milk sales volume, smallholder
dairy producers would be more incentivized to participate in the formal value chains, thereby
benefiting from the stable economic benefits from the established markets of the formal value
chains.
Page 176
160
The agro-ecological region location of the smallholder dairy scheme of the household had
negative and significant effect on milk sales volume at 5%. The results indicate that agro-
ecological location of smallholder dairy scheme in areas other than NR I and II had negative
effect on milk sales volume. This is mainly because livestock production in Zimbabwe depends
on native pastures and use of crop residues (Masama et al., 2005). Natural regions I and II are
considered high potential areas due to the high rainfall received (average 1050 mm and 750 mm,
respectively). This enables smallholder producers in these areas to access crop residues from
crop production that can be fed to dairy cows. Masama et al. (2005) found that the herd size
influenced the quantities of supplementary feeds harvested and stored. The policy implications
are that government policy interventions should target smallholder dairy producers in the high
potential natural regions I and II if the milk sales volume is to be increased from the smallholder
dairy schemes. This would enable farmers to eventually participate in the formal value chains
that offer stable and better returns compared to the semi-formal value chains. However, if the
schemes are located in the other natural regions, then there is need to make arrangements to get
supplementary feeding from elsewhere at competitive prices.
According to the model output, the inverse Mill’s ratio or selectivity bias correction factor
(LAMBDA) affected milk sales volume positively at 5% significance level and indicates that in
the Heckman two-step model, the correction for selectivity is significant. This indicates sample
selection bias, that is, the existence of some unobservable household characteristics affecting
likelihood to participate in milk market and thereby affecting milk sales volume.
The determinants of volume of milk sales are thus number of dairy cows and landholding size
of the household representing availability of resources; distance to the milk collection centre
representing market access; access to extension representing knowledge of the farmer, age of
household head representing ambition of the farmer; and agro-ecological region.
Page 177
161
6.8 Summary
The study results indicate that the main market outlet for smallholder dairy producers is the MCC
of the smallholder dairy value chain. The study also shows that there were significant differences
between milk market participants and non-participants in terms of the educational level of the
head of household, total size of landholding, household size, and the total number of dairy cows
owned by the household.
The results of the first step of the Heckman two stage procedure shows that resources
(represented by number of dairy cows, household size), knowledge (represented by educational
level, access to information and extension services) and experience (age of head of household)
and natural climatic conditions (agro-ecological region) significantly determined farmers’
participation in milk markets. The results of the study suggest the following policy implications
and interventions if milk sales volume is to be increased from the smallholder dairy schemes and
hence increased supply of milk to the MCC of the smallholder dairy value chain. In order to
increase milk market participation government policy interventions need to target increasing the
number of dairy cows for smallholder dairy producers. Policy interventions should target
educated, young farmers located in high potential agro-ecological regions I and II. These should
be provided with adequate and appropriate information and extension packages in order to
enhance milk market participation decisions.
The second stage Heckman selection model results indicate the determinants of milk sales
volume to be resources (number of dairy cows and landholding size of the household), market
access (distance to the MCC), knowledge (access to extension), ambition of the farmer (age of
the head of household) and natural climatic conditions (agro-ecological region). Distance to the
MCC, age of the head of household and agro-ecological natural region location of the
smallholder dairy scheme of the household had negative and significant effect on milk sales
Page 178
162
volume. The results indicate that in order to increase milk sales volume to the MCC of the
smallholder dairy value chain, policy interventions targeted at increasing the number of cows
owned by the smallholder dairy producers would have a positive impact. Complimentary policy
interventions need to take into account the landholding size and natural region location of the
smallholder dairy scheme of the household (and access to supplementary feeding at competitive
prices), the provision of adequate and appropriate extension messages targeted at smallholder
dairy producers. Government would also need to implement policy measures that target young
producers, and ensure the MCCs are accessible to the smallholder dairy producers if milk sales
volume is to be increased to supply the MCC of the smallholder dairy value chain. This would
enable smallholder dairy producers to gradually increase supply and move from supplying the
semi-formal to supplying the formal value chains that offer stable and better remunerative
markets in the long run compared to the semi-formal value chains.
Page 179
163
CHAPTER SEVEN: ANALYSIS OF ANIMAL PRODUCTION AND FORAGE CENTRE
INTERVENTION IN THE SMALLHOLDER DAIRY VALUE CHAIN7
7.1 Introduction
Chapter Six presented and summarized the determinants of milk market participation and
volume of sales to MCC of the organized smallholder dairy value chains. As indicated in chapter
six, those schemes that are located in NR I and II are better off than those located in other natural
regions due to access to high quality feeds and supplementary feeding. It was recommended in
the previous chapter that for those schemes located in Natural Regions other than I and II,
farmers need to access supplementary feed at competitive prices. In this chapter, attempt is made
to present a viable alternative to achieve this recommendation. This chapter presents results of
smallholder feed resources and the proposed animal production and forage centre (APFC) within
the context of the semi-formal value chains (as represented by Chikwaka and Nharira-
Lancashire) and the formal value chains (as represented by Marirangwe and Rusitu). The results
are presented for the feed resources in the smallholder dairy schemes studied, types of feeding
systems and sources of dairy feed. Results of questions relating to types of grazing used by
farmers in the smallholder dairy schemes, types of feeds, and availability of improved pastures
and fodder production are presented. The chapter includes an assessment of the proposed animal
production and forage centre in terms of farmers’ willingness to pay for the construction and
services provided by the centre, farmer perceptions of purchase of feed and fodder to be produced
by the centre and assessment of the responsibility to construct such a centre. The cost of
production of smallholder dairy and an ex ante benefit-cost assessment and analysis of the animal
production and forage centre is presented, including a bio-economic modelling of the centre.
Discussion of the results and a chapter summary concludes this chapter.
7 Part of the results in this Chapter have been published in a paper “ Ex-ante benefit cost analysis of an animal
production and forage centre for a smallholder dairy value chain in Zimbabwe” by Chamboko T., Mwakiwa E.,
and P. H. Mugabe in 2018. RUFORUM Working Document Series (ISSN 1607-9345) No. 14 (3) 229-236.
Available from http://repository.ruforum.org. Fifth Ruforum Biennial Conference 17-21 October 2016, Cape
Town, South Africa. (Full Paper in Annex 4, Paper 3).
Page 180
164
7.2 Feed Resources in Smallholder Dairy Schemes
This section presents the results of types of feeding systems used for dairy cattle, sources of
dairy feed and the types of grazing used. The various types of feed, improved pastures planted
by farmers and fodder production are also presented.
7.2.1 Types of Feeding Systems used for Dairy Cattle
One of the questions in the questionnaire requested farmers to specify the type of feeding system
farmers used for the dairy enterprise. The majority of farmers (about 48% in the four study sites)
indicated they used both stall feeding and grazing of the dairy animals. This was reported by
40% and 76% of farmers reporting in Chikwaka, and Nharira-Lancashire compared to 60% and
20% in Marirangwe and Rusitu, respectively. Grazing (about 39% of the farmers reporting in
the four study sites) of the animals in either communal land or paddocks in the case of small
scale commercial farms was the second main type of feeding of the dairy animals reported by
56% of the farmers reporting in Chikwaka, 6% of the farmers reporting in Nharira-Lancashire,
about 31% of the farmers reporting in Marirangwe and 60% in Rusitu. The other types of feeding
systems reported were stall feeding only (about 5% of the farmers reporting in the four study
sites), and only reported in Nharira-Lancashire (8% of farmers reporting) and Rusitu (10% of
the farmers reporting), zero grazing only (reported in Nharira-Lancashire by 8% of the farmers
reporting), and semi-zero grazing (reported by 6% of the farmers reporting in Rusitu) (Table
7.1).
Table 7.1: Percentage reporting type of feeding system used for dairy cattle by study site,
2015
Chikwaka Nharira-
Lancashire
Marirangwe Rusitu Total
n=50 n=50 n=35 n=50 N=185
% reporting:
Both stall feeding and grazing
40.0
76.0
60.0
20.0
48.1
Grazing 56.0 6.0 31.4 60.0 38.9
Stall feeding 0.0 8.0 0.0 10.0 4.9
Zero grazing 0.0 8.0 0.0 0.0 2.2
Semi-zero grazing 0.0 0.0 0.0 6.0 1.6
Missing 4.0 2.0 8.6 4.0 4.3
Source: Smallholder dairy survey (2015)
Page 181
165
7.2.2 Sources of Dairy Feed
Farmers in the four study sites were asked to indicate their main sources of dairy feed. The main
sources of feed for the dairy animals indicated by farmers were a combination of supplements
and grazing of the dairy animals (reported by about 56% of the farmers in the four study sites),
with farmers in Chikwaka (26%) and Nharira-Lancashire (88%) Marirangwe (about 69%) and
Rusitu (46%). Grazing only as a source of feed was reported by about 29% of the farmers in the
four study sites Supplements only as a source of feed was reported by about 5% of the farmers
surveyed and reporting in the four study sites (Table 7.2).
Table 7.2: Percentage of farmers reporting source of dairy feed by study site, 2015
Chikwaka Nharira-
Lancashire
Marirangwe Rusitu Total
n=50 n=50 n=35 n=50 N=185
% of farmers reporting:
Combination of
supplements and
grazing
26.0 88.0 68.6 46.0 56.2
Grazing 46.0 4.0 28.6 38.0 29.2
Supplements 6.0 6.0 0.0 6.0 4.9
Own Silage 2.0 0.0 0.0 2.0 1.1
Stover 4.0 0.0 0.0 0.0 1.1
Hay 2.0 0.0 0.0 0.0 0.5
Poultry waste mixed
with maize, hay and
maize Stover
2.0 0.0 0.0 0.0 0.5
Missing 12.0 2.0 2.9 8.0 6.5
Source: Smallholder dairy survey (2015)
7.2.3 Types of Grazing Used
Since the study sites are located in areas with different types of land tenure systems, smallholder
dairy farmers were asked to indicate the type of grazing systems they used for their dairy animals.
The main type of grazing was communal (reported by 34% of farmers in Chikwaka and 50% in
Nharira-Lancashire) compared to about 11% in Marirangwe and 64% in Rusitu and about 42%
in the four study sites. This was to be expected since Chikwaka is located in a communal area,
and Nharira-Lancashire covers partly Nharira communal area and Lancashire small scale
Page 182
166
commercial area. Marirangwe smallholder dairy scheme is located in a small scale commercial
farming area while Rusitu is an old resettlement area. Private grazing, which is mainly composed
of paddocked grazing which is not accessible to other farmers, (was reported by about 39% of
farmers in the four study sites) with 40% of farmers reporting in Chikwaka, 32% in Nharira-
Lancashire, about 86% in Marirangwe and 12% in Rusitu. Access and use of both private and
communal grazing was reported by 18% of farmers reporting in Chikwaka and 4% in Rusitu.
Zero grazing was reported by 5% of farmers in Nharira-Lancashire and Rusitu while 8% of
farmers reported semi-zero grazing in Rusitu, with about 8% of farmers in the four study not
indicating the type of grazing that was accessible to them (Table 7.3).
Table 7.3: Percentage of farmers reporting type of grazing used for dairy
animals by study site, 2015
Chikwaka Nharira-
Lancashire
Marirangwe Rusitu Total
n=50 n=50 n=35 n=50 N=185
% of farmers
reporting:
Communal 34.0 50.0 11.4 64.0 42.2
Private 40.0 32.0 85.7 12.0 38.9
Zero 0.0 10.0 0.0 10.0 5.4
Private and
communal
16.0 4.0 0.0 4.0 6.5
Own paddock and
nearest commercial
farms
2.0 0.0 0.0 0.0 0.5
Semi-zero grazing 0.0 0.0 0.0 8.0 2.2
Missing 8.0 4.0 2.9 2.0 4.3
Source: Smallholder dairy survey (2015)
7.2.4 Types of Feeds
Farmers were asked to indicate the type of feed for the dairy enterprise in terms of whether they
used brought-in concentrates, home-made rations, both brought in concentrates and home-made
rations or others. The majority of farmers in the four study sites (about 50%), with 26% in
Chikwaka, Nharira-Lancashire (86%) compared to Marirangwe (about 49%) and Rusitu (40%)
used both brought-in concentrates and home-made rations. Brought in concentrates use was
Page 183
167
reported by 54% of farmers in Chikwaka and 6% in Nharira-Lancashire compared to
Marirangwe (20%) and Rusitu (42%) with about 31% of farmers reporting in the four study sites.
Home-made rations were reported by about 6% of farmers in the four study sites, with 4%
reporting in Chikwaka and Nharira-Lancashire respectively compared to about 11% in
Marirangwe and 6% in Rusitu (Table 7.4).
Table 7.4: Percentage of farmers reporting type of feeds used for dairy animals by
study site, 2015
Chikwaka Nharira-
Lancashire
Marirangwe Rusitu Total
n=50 n=50 n=35 n=50 N=185
% of farmers reporting:
Both brought-in
concentrates and home-
made rations
26.0 86.0 48.6 40.0 50.3
Brought-in concentrates 54.0 6.0 20.0 42.0 31.4
Home-made rations 4.0 4.0 11.4 6.0 5.9
Communal grazing 0.0 4.0 11.4 0.0 3.2
Missing 16.0 0.0 8.6 12.0 9.2
Source: Smallholder dairy survey (2015)
7.2.5 Improved Pastures
In order to assess whether farmers have over the years been planting improved pastures, farmers
were asked to indicate whether they have planted improved pastures, the type of pastures and
the area under cultivated pastures in the 2014/2015 season. Of the 185 farmers interviewed in
the four study sites, about 38% indicated they have cultivated improved pastures, with 28% in
Chikwaka, 54% in Nharira-Lancashire, about 17% in Marirangwe and 46% in Rusitu (Table
7.5). The three most frequently reported were Star grass (about 37% of the farmers reporting in
the four study sites), Bana grass (Pennisetum purpureum) (about 36%) and Napier (Pennisetum
purpureum) (about 25% in the four study sites). Others included Giant Rhodes grass (Chloris
gayana) (9% of farmers reporting in the four study sites), Siratro (Macroptilium atropurpureum)
(about 8%) and Leucaena (Lecaena leucocephala) (6%) (Table 7.5). The average area of the
cultivated pastures varied but ranged from 0.2 Ha in Chikwaka, 0.4 Ha in Nharira-Lancashire,
Page 184
168
1.2 Ha in Rusitu to 1.8 Ha in Marirangwe, with an average of the four study sites of about 1 Ha
(Table 7.5).
Table 7.5: Planted pastures by study site, 2015
Chikwaka Nharira-
Lancashire
Marirangwe Rusitu Total
n=50 n=50 n=35 n=50 N=185
Do you have planted
pastures
n 14.0 27.0 6.0 23.0 71.0
% Yes 28.0 54.0 17.1 46.0 38.4
Types of cultivated pastures a
(multiple response, based on cases)
Bana grass n 5.0 9.0 0.0 10.0 24.0
% 33.3 34.6 0.0 47.6 35.8
Star grass n 3.0 11.0 2.0 9.0 25.0
% 20.0 42.3 40.0 42.9 37.3
Kikuyu n 0.0 0.0 1.0 0.0 1.0
% 0.0 0.0 20.0 0.0 1.5
Leucaena n 0.0 3.0 1.0 0.0 4.0
% 0.0 11.5 20.0 0.0 6.0
Napier fodder n 1.0 5.0 0.0 11.0 17.0
% 6.7 19.2 0.0 52.4 25.4
Giant Rhodes n 0.0 4.0 0.0 2.0 6.0
% 0.0 15.4 0.0 9.5 9.0
Siratro n 2.0 1.0 2.0 0.0 5.0
% 13.3 3.8 40.0 0.0 7.5
Napier and Leucaena n 1.0 0.0 0.0 0.0 1.0
% 6.7 0.0 0.0 0.0 1.5
Bana and Star grass n 2.0 0.0 0.0 0.0 2.0
% 13.3 0.0 0.0 0.0 3.0
Leucaena, Star grass
and Sesbania (forage
trees)
n 1.0 0.0 0.0 0.0 1.0
% 6.7 0.0 0.0 0.0 1.5
Area planted to
pastures (Ha) Mean
0.2 0.42 1.8 1.2 0.91
Note: Totals are based on respondents a Group
n – number of farmers reporting
Source: Smallholder dairy survey (2015)
7.2.6 Fodder Production
In order to assess fodder production on the smallholder dairy schemes studied, farmers were
asked in terms of area planted to fodder crops, quantity harvested, quantity fed as green material
and the quantity processed into fodder. The results show that the average area planted to maize
grain was about 1.5 Ha in the four study sites, ranging from about 0.4 Ha in Chikwaka to about
Page 185
169
2.6 Ha in Marirangwe. The average area planted to maize silage was about 1 Ha in the four study
sites and an average of 0.4 Ha planted to legume crops (Table 7.6).
Table 7.6: Fodder production by study site, 2015
Chikwaka Nharira-
Lancashire
Marirangwe Rusitu Total
n=50 n=50 n=35 n=50 N=185
Area planted
maize grain
n 35 6 28 20 89
Mean 0.44 1.93 2.57 1.50 1.45
SD 0.29 1.18 1.70 0.74 1.39
Area planted
maize silage
n 14 33 6 9 62
Mean 0.34 1.17 1.82 0.73 0.98
SD 0.24 1.05 2.55 0.33 1.15
Area planted
sorghum
silage
n 1 1
Mean 0.20 0.20
SD
Area planted
legume crops
n 29 7 2 11 49
Mean 0.27 0.47 1.75 0.38 0.39
SD 0.29 0.33 1.77 0.37 0.49
Area planted
other crops
n 8 4 12
Mean 0.17 1.18 0.51
SD 0.15 0.62 0.61
n – number reporting
Note: SD – Standard deviation
Source: Smallholder dairy survey (2015)
The quantity of fodder crops harvested varied and the average quantity of maize grain harvested
as measured in 50kg bags was about 37 bags in the four study sites, an average of 157 bags maize
silage in the four study sites, and about 11 bags of legume crops in the four study sites (Table
7.7).
Page 186
170
Table 7.7: Quantity of maize grain and fodder crops harvested by study site, 2015
Chikwaka Nharira-
Lancashire
Marirangwe Rusitu Total
n=50 n=50 n=35 n=50 N=185
Maize grain
(50 kg bags)
n 35.00 6.00 28.00 20.00 89.00
Mean 10.19 18.50 63.75 49.90 36.52
SD 8.17 10.07 73.04 31.02 49.50
Maize silage
(50 kg bags)
n 3.00 27.00 5.00 6.00 41.00
Mean 67.00 88.63 472.80 244.17 156.66
SD 115.18 105.49 742.45 120.18 286.70
Sorghum
silage (50 kg
bags)
n 1.00 1.00
Mean 20.00 20.00
SD
Legume crops
(50 kg bags)
n 30.00 7.00 12.00 49.00
Mean 7.73 25.29 12.00 11.28
SD 18.49 37.20 11.27 21.10
Other crops
(50 kg bags)
n 5.00 1.00 4.00 10.00
Mean 1.80 80.00 114.00 54.00
SD 1.64 135.00 96.55
Note: n – number reporting
SD – Standard deviation
Source: Smallholder dairy survey (2015)
The quantity of fodder crops harvested and fed as green material varied and the average quantity
of maize silage fed was 240 kg in the four study sites and about 405 kg was legume crops (Table
7.8).
Page 187
171
Table 7.8: Quantity of fodder crops harvested and fed as green material (kg) by study
site, 2015
Chikwaka Nharira-
Lancashire
Marirangwe Rusitu Total
n=50 n=50 n=35 n=50 N=185
Maize
grain
n 1.00 4.00 5.00
Mean 0.00 300.00 240.00
SD 294.39 288.10
Maize
silage
n 1.00 2.00 3.00
Mean 280.00 230.00 240.00
SD 296.98 212.84
Legume
crops
n 2.00 2.00 2.00 6.00
Mean 39.00 1,000.25 175.00 404.75
SD 50.91 1,413.86 35.35 785.52
Note: n – number reporting
SD – Standard deviation
Source: Smallholder dairy survey (2015)
The main crops that were processed into feed production were maize grain (an average of 740
kg in the four study sites), maize silage (an average of 4085 kg) and legume crops (about 345
kg) in the four study sites (Table 7.9).
Table 7.9: Quantity processed into fodder (kg) by study site, 2015
Chikwaka Nharira-
Lancashire
Marirangwe Rusitu Total
n=50 n=50 n=35 n=50 N=185
Maize
grain
n 28.00 4.00 2.00 14.00 48.00
Mean 463.93 2,262.50 260.00 928.57 740.83
SD 395.02 3,171.59 339.41 787.58 1,081.11
Maize
silage
n 8.00 33.00 6.00 47.00
Mean 1,413.75 4,007.88 8,075.00 4,085.53
SD 1,315.65 5,101.38 6,925.59 5,186.75
Legume
crops
n 26.00 5.00 10.00 41.00
Mean 181.54 709.10 582.00 343.55
SD 218.37 1,297.78 524.63 555.10
Other
crops
n 7.00 2.00 9.00
Mean 142.86 2,050.00 566.67
SD 67.26 2,757.72 1,288.89
Note: n – number reporting
SD – Standard deviation
Source: Smallholder dairy survey (2015)
Page 188
172
7.3 Costs of Production and Viability of Dairy Production
In order to assess the performance of the dairy enterprise, farmers were requested to report the
annual costs of production of the dairy enterprise. The main input costs farmers were requested
to estimate included dipping, feed resources in terms of silage, imputed home produced grains,
hay, supplements and concentrates, disease control, labour, machinery and maintenance of
fences, transport and energy costs where this was applicable. A gross margin analysis of the
dairy enterprise was performed. The results show that smallholder dairying on the four schemes
studied was viable, as indicated by the gross margin per litre of milk produced which was
USD0.23/litre in Chikwaka, USD0.22 in Nharira-Lancashire, USD0.15 in Marirangwe,
USD0.36 in Rusitu, with an average of all the four study sites of USD0.25 per litre (Table 7.10).
Page 189
173
Table 7.10: Cost of production and income for milk production by study site (USD)
Chikwaka Nharira-
Lancashire
Marirangwe Rusitu Total
Cost Item n=50 n=50 n=35 n=50 N=185
Mean (SD) cost per
annum (USD)
Dipping 28.97
(15.73)
118.56
(76.34)
304.00
(420.07)
58.64
(58.22)
105.02
(189.93)
Feed costs 110.41
(125.91)
578.58
(382.73)
1955.40
(4683.55)
652.76
(492.33)
803.79
(212.73)
Veterinary drugs
and medicines
22.19
(15.78)
98.32
(98.19)
182.52
(400.89)
62.77
(128.78)
76.14
(163.97)
Artificial
insemination and
Bulls
maintenance
75.20
(112.94)
22.04
(21.27)
46.88 (17.72) 54.86
(96.14)
42.20
(68.63)
Labour Costs 307.20
(289.64)
732.22
(803.41)
1695.45
(1592.30)
614.05
(344.46)
861.31
(1073.48)
Miscellaneous
costs
73.00
(129.54)
256.50
(643.63)
528.00
(505.29)
392.50
(690.32)
242.48
(514.34)
Total Variable
Costs
283.41
(303.39)
1177.96
(1198.56)
3619.49
(6442.70)
994.78
(903.87)
1289.84
(2905.74)
Mean (SD) costs and
returns per month (USD)
Total Variable
Costs per month
23.62
(25.29)
98.16
(99.88)
301.62
(536.89)
82.90
(75.32)
107.49
(242.15)
Milk production
per month (litres)
160.5
(167.5)
507.3
(299.4)
983.2
(1917.7)
552.7
(367.5)
510.5
(890.5)
Price (USD/litre) 0.39 (0.01) 0.50 (0.00) 0.52 (0.02) 0.52 (0.04) 0.49
(0.05)
Gross Income per
month
59.38
(71.13)
253.65
(149.72)
344.25
(365.00)
290.24
(195.95)
236.36
(231.11)
Gross Margin per
month
42.86
(67.08)
159.13
(182.56)
149.79
(267.15)
206.61
(158.03)
146.94
(184.15)
Gross Income per
litre
0.40 (0.01) 0.50 (0.00) 0.52 (0.02) 0.52 (0.05) 0.50
(0.05)
TVC per litre 0.16 (0.19) 0.28 (0.41) 0.37 (0.22) 0.16 (0.13) 0.23
(0.28)
Gross Margin per
litre
0.23 (0.20) 0.22 (0.41) 0.15 (0.23) 0.36 (0.13) 0.25
(0.29)
Note: The numbers in brackets are standard deviations
Source: Smallholder dairy survey (2015)
The results show that the main variable cost items are the cost of feed which contributed about
48% of total variable costs in the four study sites, followed by labour costs with about 31%, and
dipping costs at about 8% of total variable costs (Table 7.11).
Page 190
174
Table 7.11: Costs of milk production as percent of total variable costs by study site, 2015
Variable cost item Chikwaka Nharira-
Lancashire
Marirangwe Rusitu Total
Feed costs 14.7 48.1 48.2 54.9 47.7
Labour 48.2 22.8 36.8 25.2 31.2
Dipping 9.5 9.9 7.2 5.8 7.7
Veterinary drugs and
medicines
6.8 7.5 2.7 4.5 4.6
AI and Bull maintenance 5.9 1.0 0.4 1.6 1.1
Miscellaneous 14.9 10.7 4.7 8.1 7.6
Total 100.0 100.0 100.0 100.0 100.0
Source: Smallholder dairy survey (2015)
7.4 Animal Production and Forage Centre
In order to assess farmers’ views on the proposed animal production and forage centre (APFC),
a number of questions were asked in the questionnaire relating to this topic. The animal
production and forage centre is proposed to be established next to the MCC and dedicated to
providing the dairy enterprise with support services for the farmers in the smallholder dairy
schemes. Such a centre currently does not exist in the smallholder dairy schemes studied but
follows on the concept of animal production and forage research centres (Titterton and
Maasdorp, 1997, as communicated by Ngongoni, 2012), but with modifications.
7.4.1 Farmer Perceptions on the Animal Production and Forage Centre
This section presents farmer perceptions on the animal production and forage centre (APFC) in
terms of willingness to purchase feed and fodder to be supplied by the centre and the types of
animals prioritized for feeding with the feed sourced from the centre.
7.4.1.1 Willingness to Purchase Feed and Fodder from the APFC
Provision of feed and fodder to smallholder dairy farmers is one of the main proposed services
for the APFC. In order to assess whether the centre would be able to sustainably provide these
services to smallholder dairy farmers, questions were asked whether farmers would be in a
Page 191
175
position to purchase feed and fodder supplied from the APFC if it was established. The results
show that the majority of farmers across the four study sites (91%) would be willing to purchase
feed supplied by the centre, with 94% in Chikwaka and 100% in Nharira-Lancashire responding
positively, compared to about 77% and 88% responding positively in Marirangwe and Rusitu
respectively. In terms of fodder, about 78% in the four study sites responded positively, with
Chikwaka having 48%, Nharira-Lancashire (98%), Marirangwe (77%) and Rusitu (90%) (Table
7.12).
Table 7.12: Farmers willing to buy feed and fodder from the animal production and
forage centre by study site, 2015
Chikwaka Nharira-
Lancashire
Marirangwe Rusitu Total
n=50 n=50 n=35 n=50 N=185
Willing to buy feed % Yes 94 100 77.1 88 90.8
Willing to buy
fodder
% Yes 48 98 77.1 90 78.4
Source: Smallholder dairy survey (2015)
7.4.1.2 Types of Animals Prioritized for Feeding and Reasons
Farmers were asked what types of animals they would prioritize for feeding with feed obtained
from the APFC if it was established at the MCC. The results show that 92% of farmers in all the
four dairy schemes would prioritize feeding milking cows for increased milk production, while
less than 10% indicated they would prioritize milking cows to maintain good body condition for
good milk production. Other reasons given by farmers included the fact that farmers would then
be able to milk twice per day instead of once per day and improved feed management (Figure
7.1).
Page 192
176
Figure 7.1: Reasons for prioritizing cows in milk for feeding with feed from the centre (n=185)
Source: Smallholder dairy survey (2015)
7.4.2 Willingness to Pay for Construction and Services of the Animal Production and
Forage Centre
In order to assess whether smallholder dairy farmers would be willing to participate in the
construction of the APFC, questions were asked in terms of who farmers felt should be
responsible for constructing such a centre, whether farmers were prepared to construct the centre
on their own without outside assistance and how much they would be prepared to contribute
financially.
7.4.2.1 Responsibility for Construction and Willingness to Pay
In response to the question on whether farmers were prepared to construct such a centre on their
own, about 78% of the farmers in the four study sites indicated positively, with 78% in
Chikwaka, Nharira-Lancashire (98%), Marirangwe (about 66%), and Rusitu (68%) (Table 7.13).
In terms of who should be responsible for constructing such a centre, the majority of farmers
reporting indicated this should be done by the community with the assistance of government
(about 42% of farmers reporting in the four study sites), or by the community (30% of farmers
reporting in the four study sites). In Marirangwe and Rusitu, a higher percentage of farmers
0
10
20
30
40
50
60
70
80
90
100
Increased milk production To maintain good bodycondition for good milk
production
Others
Page 193
177
(about 54% and 72%, respectively) indicated the community with assistance of government
should construct such a centre compared to the percentage of farmers reporting in Chikwaka and
Nharira-Lancashire (44% and 56%, respectively) that the community should build such a centre.
Very few farmers interviewed were of the opinion that construction should be done by
government alone (about 11% in the four study sites) or donors alone (about 10% of farmers
reporting in the four study sites) (Table 7.13). In Marirangwe and Rusitu (20% and 16%,
respectively) reported that government should build such a centre compared to Chikwaka and
Nharira-Lancashire (4% and 6%, respectively) reporting that government alone should build
such a centre. In terms of indication that donors alone should build such a centre, it is important
to note that there were no farmers in Marirangwe indicating donors should build such a centre
(Table 7.13).
Page 194
178
Table 7.13: Willingness to construct and responsibility for construction of animal
production and forage centre by study site
Chikwaka Nharira-
Lancashire
Marirangwe Rusitu Total
n=50 n=50 n=35 n=50 N=185
Are farmers
willing to
construct such a
centre?
% Yes 78 98 65.7 68 78.4
Who should
construct?
Government % 4 6 20 16 10.8
Community % 44 56 11.4 4 30.3
Community
with
assistance
from
Government
% 20 26 54.3 72 42.2
Donors % 20 10 0 8 10.3
Everyone,
Government,
Community,
Donors
% 4 0 0 0 1.1
Farmers with
assistance of
Donors
% 4 0 0 0 1.1
Government and
Donors
% 2 0 0 0 0.5
The Cooperative % 2 0 0 0 0.5
Source: Smallholder dairy survey (2015)
The question on how much farmers would be willing to pay for the construction of an APFC
was asked within the context of an estimate where farmers were asked to indicate how much
they would be willing to contribute given that construction of such a centre would require a
contribution of USD 2000 per household and benefiting 100 member farmers in the smallholder
Page 195
179
dairy scheme. The results show that farmers in Chikwaka and Nharira-Lancashire reported an
average willingness to contribute of about USD164 and USD266, respectively compared to
about USD181 and USD65 for Marirangwe and Rusitu respectively. The average for the four
study sites was about USD1678 (Table 7.14).
Table 7.14: Amount farmers are willing to contribute for the construction of the
animal production and forage centre by study site
Chikwaka Nharira-Lancashire Marirangwe Rusitu Total
n=50 n=50 n=35 n=50 N=185
Amount in USD
Mean 163.87 265.51 180.67 64.64 166.86
SD 275.88 206.2 225.91 282.49 261.1
n 46 49 30 50 175
Minimum 0 0 0 0 0
Maximum 1000 1000 1000 2000 2000
Median 50 200 100 10 50
Source: Smallholder dairy survey (2015)
7.4.2.2 Willingness to Pay for AI Services
One of the main services proposed to be provided by the APFC is access to AI services in order
to improve the genetics in the smallholder dairy herd. Farmers were asked whether they would
be in a position to pay for the services if the AI was to be provided by the APFC established at
the MCC. One hundred percent of farmers in Chikwaka and 92% of farmers in Nharira-
Lancashire indicated they would be willing to pay for the services compared to about 83% in
Marirangwe and 98% in Rusitu. Overall, about 94% of the farmers in the four study sites
indicated they would be willing to pay for the services (Table 7.15). The average amount farmers
would be willing to pay for the services was USD11 for Chikwaka and USD9 for Nharira-
Lancashire compared to USD13 for Marirangwe and USD7 for Rusitu, and an average of the
four study sites of USD 9 (Table 7.15).
8 In order not to complicate the calculation of the willingness to pay by farmers, a simple average of the values
reported by farmers was used. Breidert et al., (2006) discuss the advantages and limitations of using this method
in their article on the review of methods for measuring willingness-to-pay.
Page 196
180
Table 7.15: Willingness to pay for AI services provided by the animal production and
forage centre by study site
Chikwaka Nharira-
Lancashire
Marirangwe Rusitu Total
n=50 n=50 n=35 n=50 N=185
Willingness to pay for
AI:
% Yes 100.0 92.0 82.9 98.0 94.1
Amount willing to
pay (USD):
Mean (SD) 11.22
(8.10)
8.63 (8.31) 12.52
(11.87)
6.69
(3.30)
9.45 (8.18)
Minimum 3.00 0.00 5.00 0.00 0.00
Maximum 50.00 40.00 70.00 15.00 70.00
Source: Smallholder dairy survey (2015)
7.4.3 Advantages of the APFC to the Dairy Enterprise and other Services the Centre
should provide
Two questions were asked on farmers perceptions of the advantages an APFC would provide to
the dairy enterprise and what other services in terms of the farmers’ views on other services they
felt should be provided by the centre if it was established. In response to the first question, the
results show that majority of farmers’ perceptions were that such a centre would provide them
with ready access to feed and fodder (41% in the four smallholder dairy schemes), would provide
cost savings on feed and fodder (about 37% in all the four schemes) and would enable savings
on feed transportation costs (9%) (Table 7.16)
Page 197
181
Table 7.16: Farmers perceptions of advantages such a centre would provide to the dairy
enterprise by study site, 2015
Study site Chikwaka Nharira-
Lancashir
e
Marirangwe Rusitu Total
Number of farmers interviewed n=50 n=50 n=35 n=50 N=185
% reporting:
Ready access to feed and fodder 42.0% 4.0% 25.7% 88.0% 41.1%
Cost savings on feed and fodder 38.0% 56.0% 54.3% 6.0% 37.3%
Save on feed transportation costs 0.0% 34.0% 0.0% 0.0% 9.2%
Cost savings and ready access to
feed and fodder
10.0% 2.0% 2.9% 4.0% 4.9%
Farmers do not have land to grow
fodder on their own
0.0% 2.0% 0.0% 0.0% 0.5%
Knowledge, advice and training 2.0% 0.0% 0.0% 0.0% 0.5%
Access to credit 2.0% 0.0% 0.0% 0.0% 0.5%
Marketing our products and
employment creation
4.0% 0.0% 0.0% 0.0% 1.1%
Boost production 0.0% 2.0% 0.0% 0.0% 0.5%
Benefit small producers 0.0% 0.0% 2.9% 0.0% 0.5%
Missing 2.0% 0.0% 14.3% 2.0% 3.8%
Total 100.0% 100.0% 100.0% 100.0
%
100.0
%
Source: Smallholder dairy survey (2015)
In terms of other services that farmers perceived should be provided by the centre, the results
show that most of the farmers indicated veterinary drugs and other dairy equipment and utensils
(about 36% of the farmers in the four study sites), provision of agricultural and veterinary inputs
(about 11% of farmers), and training services, particularly dairying as a business and monitoring
of livestock (about 10% of farmers in the four study sites) (Table 7.17).
Page 198
182
Table 7.17: Farmers perceptions of other services to be provided by the animal
production and forage centre if established by study site, 2015
Chikwaka Nharira-
Lancashire
Marirangwe Rusitu Total
n=50 n=50 n=35 n=50 N=185
Veterinary drugs, equipment
and utensils
32.0% 70.0% 8.6% 26.0% 36.2%
Agricultural and veterinary
inputs
12.0% 0.0% 2.9% 26.0% 10.8%
Training services 10.0% 4.0% 31.4% 0.0% 9.7%
Increase production of feed 0.0% 20.0% 0.0% 6.0% 7.0%
Mollases and hay 0.0% 0.0% 0.0% 20.0% 5.4%
Cattle procurement for
farmers
12.0% 0.0% 0.0% 2.0% 3.8%
Provision of loans 6.0% 2.0% 0.0% 4.0% 3.2%
AI services 6.0% 2.0% 0.0% 0.0% 2.2%
Cooperative management 6.0% 0.0% 2.9% 0.0 2.2%
Milk quality services 2.0% 0.0% 0.0% 0.0% 0.5%
Milk transportation to the
MCC
4.0% 2.0% 0.0% 0.0% 1.6%
Milk processing 0.0% 0.0% 2.9% 2.0% 1.1%
Missing 10.0% 0.0% 51.4% 14.0% 16.2%
Total 100.0% 100.0% 100.0% 100.0% 100.0%
Source: Smallholder dairy survey (2015)
7.5 Main Characteristics for Smallholder Dairy Schemes Supplying the Semi-formal and
Formal Value Chains
In order to assess whether there were differences in the main characteristics reported for the
smallholder dairy schemes supplying the semi-formal value chain (Chikwaka and Nharira-
Lancashire) and those supplying the formal value chain (Marirangwe and Rusitu), categorical
variables were recoded. Cross tabulations of the recoded variables and value chains were then
performed including the chi-square test. The independent samples t-test was used to assess
differences for continuous variables.
Type of feeding systems were recoded into two categories, those who used combination of both
stall feeding and grazing, and category for the other types of feeding reported such as zero
grazing and semi-zero grazing. Source of dairy feed was recoded into two categories for farmers
Page 199
183
reporting a combination of supplements and grazing, and category for other sources of feed.
Types of grazing were recoded into three categories for farmers reporting use of communal
grazing, private grazing and farmers using a combination of these types or other grazing systems,
while types of feeds were recoded into those using predominantly both brought-in feeds and
home-made rations and farmers reporting other combinations of feed types.
The results of the chi-square test for categorical variables show that the type of feeding system
used by farmers was significantly different between smallholder dairy schemes supplying the
semi-formal value chain and those supplying the formal value chain. The results show that
smallholder dairy schemes supplying the semi-formal value chain mainly used a combination of
stall feeding and grazing (58% of respondents), while those supplying the formal value chain
used mainly other types (about 64% of respondents) such as grazing, zero-grazing or semi-zero
grazing. Other significant variables were types of feeds used by farmers, farmers’ willingness to
buy feed and fodder produced by the APFC and farmers’ willingness to construct the APFC
(Table 7.18).
The t-test results show that the area planted to improved pastures and the gross income were
significantly different for smallholder dairy schemes supplying the semi-formal and formal value
chains (Table 7.18)
Page 200
184
Table 7.18: Feed characteristics of semi-formal and formal value chains, 2015 Characteristic Semi-formal Formal Value
Chain
Total Chi-Square
Value
Number of farmers n=100 n=85 N=185
Type of feeding system
% Both stall feeding and grazing 58.0 36.5 48.1 8.531**
% Other 42.0 63.5 51.9
Source of dairy feed
% Combination of supplements and
grazing
57.0 55.3 56.2 0.54
% Other 43.0 44.7 43.8
Types of grazing used
% Communal 42.0 42.4 42.2 1.57
% Private 36.0 42.4 38.9
% Other 22.0 15.3 18.9
Types of feeds
% Both brought-in concentrates and
home-made rations
56.0 43.5 50.3 2.858*
% Other 44.0 56.5 49.7
Improved pastures
% Yes 41.0 34.0 37.8 0.925
Willingness to buy feed
% Yes 97.0 83.5 90.8 9.991**
Willingness to buy fodder
% Yes 73.0 84.7 78.4 3.715*
Willingness to pay for AI
% Yes 96.0 91.8 94.1 1.474
Who should construct APFC?
% Community with Government
assistance
73.0 71.8 72.4 0.035
% Other 27.0 78.2 27.6
Are farmers willing to construct?
% Yes 88.0 67.1 78.4 11.89**
t-value
Area planted to improved pastures:
Mean (SD)
0.41 (0.43) 1.30 (0.92) 0.91 (0.86) -4.167**
Area planted to maize silage 0.92 (0.96) 1.17 (1.64) 0.98 (1.15) -0.550
TVC per litre 0.23 (0.35) 0.23 (0.19) 0.23 (0.28) -0.081
Gross Income per litre 0.47 (0.05) 0.52 (0.04) 0.50 (0.05) -7.108**
Gross Margin per litre 0.22 (0.36) 0.28 (0.20) 0.25 (0.29) -1.239
Feed as % of TVC 34.06 (30.98) 45.29 (34.26) 39.22 (32.92) -2.339**
Labour as % of TVC 16.50 (28.22) 25.51 (30.88) 20.64 (29.73) -2.071**
Note: **, * Significant at 5% and 10% respectively
SD – Standard deviation, TVC – Total Variable Costs
Source: Smallholder dairy survey (2015)
Page 201
185
7.6 Ex-ante Analysis of the Benefits and Costs of the Animal Production and Forage
Centre9
The ex-ante analysis of the benefit and cost of the APFC was performed to test the hypothesis
that the proposed intervention of an APFC would not be profitable to milk marketing
cooperatives in the smallholder dairy value chain. The APFC was modelled on the basis of
parameters. The parameters for with and without the centre were based on the results of the
survey and assumptions of the potential of milk production based on the breeds currently used
by smallholder farmers (Annex 3, Table 1). These include parameters such as average lactation
length, milk production, and the quantities sold, and the results of the costs of production and
gross margin analysis. The APFC was assessed on the basis of the potential membership of the
milk marketing cooperatives of 100 farmers, who would be producing milk and selling to the
milk marketing cooperative. Estimates of constructing the basic buildings required for such a
centre were obtained from the Ministry of Public Construction and National Housing in
Zimbabwe (Personal Communication; Muzhanye, 2015). The estimated cost of such a centre
was set at USD200, 000 for the basic buildings to be constructed next to the current MCC run
by the milk marketing cooperatives (see Annex 3, Table 3). The estimated costs were based on
utilizing local materials in order to reduce the cost of construction (by about 25%) compared to
using urban based materials. Recurrent expenditure costs for such a centre would include salaries
and operational costs for the staff to be able to fully run the centre professionally.
The main additional benefits expected from APFC include farmers accessing improved feed
resources and forage technologies that have been shown through research to improve milk yields
9 Published in a paper “ Ex-ante benefit cost analysis of an animal production and forage centre for a smallholder
dairy value chain in Zimbabwe” by Chamboko T., Mwakiwa E., and P. Mugabe in 2018. RUFORUM Working
Document Series (ISSN 1607-9345) No. 14 (3) 229-236. Available from http://repository.ruforum.org. Fifth
Ruforum Biennial Conference 17-21 October 2016, Cape Town, South Africa.
Page 202
186
in smallholder dairy systems, and the subsequent increase in milk deliveries to the MCC. It was
also projected that since farmers would have access to artificial insemination, the number of
milking cows would also increase as farmers benefit from access to improved genetics through
artificial insemination. The main additional costs to the milk marketing cooperatives would
include the cost of constructing such a centre and investments required to operationalize such a
centre and the recurrent expenditure while the additional costs to the farmers would be the extra
feeding costs in order to achieve the milk yields. The benefits and costs were discounted over a
10 year period, at 15% discount rate and the benefit cost ratios were assessed. According to
Gittinger (1992) the general rule is to choose a period of time that will be roughly comparable
to the economic life of the project. Gittinger (1992) further notes that few agricultural project
analyses need to be carried out beyond twenty five years. Taking this background information
into account, in this study the analyses was carried out over a period of 10 years. Scenarios
developed in order to assess the profitability of the APFC through the benefit cost analysis were
the baseline scenario which is the current situation, without the APFC and the scenario with
APFC assuming an increase in milk production from the average recorded in the survey of about
8litres/cow/day to 20litres/cow/day in milk production and realization of the benefits of the AI
through an increased number of cows milked (the detailed 10 year benefit cost projections are
shown in Annex 3, Table 2) .
The results of the benefit cost ratios of the discounted benefits and costs over the 10 year period
show that the baseline scenario without the APFC benefit cost ratio was 2.2, while the benefit
cost ratio of the scenario with the APFC about was 5.4, an indication that the intervention of the
APFC is profitable in the smallholder dairy value chain (Table 7.19). A sensitivity analysis
performed is given in Annex 3, Table 4.
Page 203
187
Table 7.19: Comparison of Benefit Cost ratios of the APFC Scenarios, with and
without the APFC, 2015
Scenario Benefit-Cost Ratio
1. Baseline Scenario (current costs and benefits, without APFC) 2.2
2. With APFC - Increase in milk production 5.4
Source: Calculations based on Smallholder dairy survey (2015)
7.7 Discussion
This section presents the discussion of results on the feed resources in the smallholder dairy
schemes, cost of production and viability of dairy production and the proposed animal
production and forage centre.
7.7.1 Feed Resources in Smallholder Dairy Schemes
This section discusses the types of feeding systems used for dairy cattle, sources of dairy feed
and types of grazing used according to land tenure systems. The various types of feed,
improved pastures and fodder crops, and fodder production are also discussed.
7.7.1.1 Types of feeding systems used for Dairy cattle
The results show the dominance and reliance of smallholder dairy farmers on natural grazing for
their dairy cattle. Stall feeding, zero grazing and semi-zero grazing were used by a very few
farmers, indicating the level of intensification of smallholder dairy production in Zimbabwe. If
this type of production system was to be classified on the basis of the classification proposed by
Devendra (2001), one would be inclined to classify the production system as a cooperative dairy
production system since the MCC are run by cooperatives. According to Devendra (2001),
cooperative dairy production systems are characterized by smallholder dairy units of between
40-250 smallholder farmers, and the cooperative are focal points to provide services to farmers
as well as promote organised collection, handling and sale of milk to consumers. This is what
typically happens in the semi-formal value chains in this study, whereby the cooperatives
Page 204
188
organizes processing and sale of milk and milk products to consumers, or in the formal value
chain whereby the cooperative that runs the MCC organize the collection of milk to be delivered
to urban based processors.
7.7.1.2 Sources of Dairy Feed
According to Chamberlain and Wilkinson (2002), grass and other forage crops are, and will
remain the foundation of any dairy cow feed. They further indicate that forages alone are
insufficient to high yielding cows and usually require supplementing with feeds high in energy,
protein and other nutrients. The results in this study show that most of the farmers used a
combination of supplements and natural grazing as their source of dairy feed (about 56%) while
a significant proportion (about 29%) relied on natural grazing only in summer as their main
source of dairy feed. This has implications on milk production in the smallholder dairy schemes.
Ngongoni et al., (2006) report that the quality of concentrate feed used and the frequency of
feeding depends on the farmers’ ability to buy concentrates. Ngongoni et al., (2006) also reported
that although households fed concentrates during milking time, most did not measure the
quantities given, and the few that measured indicated feeding 2-3 kg per day. The results in this
study indicate that significant proportion of farmers are not able to access supplementary feeds,
and have therefore to rely on grazing. This possibly explains why milk production has remained
low in the smallholder dairy schemes.
7.7.1.3 Types of Grazing used According to Land Tenure Systems
The study sites are located in areas with different types of land tenure systems and therefore in
line with the tenure in the particular location of the smallholder dairy scheme, farmers in
communal areas indicated access to communal grazing while farmers in the small scale
commercial indicated access to private grazing. This is mainly because the tenure system in the
communal areas is communal, while in the small scale commercial and resettlement areas, the
Page 205
189
tenure system is freehold or leasehold, and permits issued by the Ministry of Lands and
Agriculture, respectively. It is important to note that about 40% of farmers in the predominantly
communal smallholder dairy scheme of Chikwaka indicated accessing private grazing for their
dairy cattle. This indicates that farmers in communal areas have invested in fencing part of their
lands allocated for crop production for use of their dairy cattle. This gives the dairy cattle
exclusive access to grazing without competition from other livestock in the communal areas.
Previous studies (Ngongoni et al., 2006) report grazing constraints in smallholder dairy schemes
located in communal areas due to overgrazing.
Muir-Leresche (2006) indicates that small scale commercial sector was established by the
colonial settler government as an option for black Zimbabwean investment in land. The sector
is characterized by individually owned and self -contained farms with no shared grazing, usually
operated as family trusts. Since the farms have no shared grazing, this type of tenure gives an
incentive to the smallholder dairy producers to make investments in production of improved
pastures and silage making. As a result, Marirangwe smallholder dairy scheme, which is located
in a small scale commercial farming area, reported a higher average milk production compared
to Chikwaka which is located in a communal area.
7.7.1.4 Types of Feeds
The majority of smallholder dairy farmers indicated they mainly used both bought-in
concentrates and home-made rations. The concentrates are purchased by farmers either through
credit arrangements with the MCC or bought from nearby urban centres or rural service centres
if they are not available at the MCC. Key informant interviews indicate that in some of the
smallholder dairy schemes farmers access concentrates through revolving funds that have been
established by the cooperatives running the MCC. The seed money for the revolving funds is
usually from previous donor funded projects or programme grants. Under such arrangements,
Page 206
190
the cooperatives purchase the concentrates in bulk for on lending to dairy producers. The farmers
repay for the concentrates through deductions effected on the payout from the milk sales through
the MCC. At Nharira-Lancashire smallholder dairy scheme, one of the commercial suppliers of
concentrates has put up a container for storing and selling concentrates to farmers at the MCC.
This improves availability and accessibility of the feed to smallholder dairy farmers in the value
chain. It should be noted, however, that previous studies have reported that farmers were not
able to feed concentrates regularly because it was expensive and was not readily available in the
area (Ngongoni et al., 2006). Although concentrates were available in some of the smallholder
dairy schemes in this study, it should be noted that they were not available in some of the
smallholder dairy schemes and therefore farmers faced increased expenditure to procure
concentrates from nearby urban or rural service centres. As a result, home-made rations become
increasingly important for the dairy enterprise. Masama et al. (2005) indicate that on-farm mixed
supplementary feeds offer a cheaper alternative to bought-in concentrates.
7.7.1.5 Improved Pastures and Fodder Crops
The results show that some of the smallholder farmers have invested in improved pastures and
fodder crops for their dairy cattle. The main fodder crops were Napier (Pennisetum purpureum)
and Bana grass (Pennisetum purpureum), while pasture legumes such as siratro (Macroptilium
atropurpureum) were also grown. The main pastures planted include Star grass (about 37% of
the farmers reporting in all then four study sites), Bana grass (Pennisetum purpureum) (about
36% of farmers reporting) and Napier fodder (Pennisetum purpureum) (about 25%). The areas
allocated to the production of improved pastures are small (average of 0.91 Ha in the four study
sites). In crop-livestock systems, the improved pastures compete with food crops in terms of land
allocation. Ngongoni et al. (2006) reported that land to grow fodder for cattle in communal areas
was inadequate as very few farmers in communal areas grew less than 0.4 Ha of fodder crops,
since priority for available land was given to food crops. In the small scale commercial and
Page 207
191
resettlement areas, very few farmers also grew more than 1 Ha of fodder crops. In this study,
results showed that the average area for fodder was more than 1 Ha in Marirangwe and Rusitu,
which are located in small scale commercial and resettlement areas, respectively. In Chikwaka
and Nharira-Lancashire, the average area was 0.42 Ha or less. The results indicate that
smallholder dairy schemes that supply the formal value chain are the ones that grow, an average
of more than one hectare of fodder, while those supplying the semi-formal value chain allocate
a small area to fodder crops, particularly in communal areas. The results indicate that the areas
planted to improved pastures and maize silage were significantly different between the
smallholder dairy schemes supplying the semi-formal value chain and those supplying the formal
value chain. The land available in communal areas is limited, while grazing is communally
owned. This imposes a constraint on communal households in terms of producing improved
pastures and fodder crops. This calls for innovative approaches to enable households located in
the communal areas to access improved fodder for their livestock. On such proposed approach
is through the Animal Production and Forage Centre (APFC).
7.7.1.6 Fodder Production
In Zimbabwe, the smallholder dairy production system is part of the crop-livestock system. As
part of the crop-livestock system, some of the major sources of feed for the dairy herd are crop
residues, and the production of specialist silage crops for the dairy enterprise. The results in this
study show that farmers grow maize, which is also a staple food grain crop in the country.
Besides maize grain, farmers also grew maize silage. According to Chamberlain and Wilkinson
(2002), maize silage is the most important conserved forage for dairy cows in many areas of the
world. The main objective in silage making is to conserve nutrients as efficiently as possible for
the winter period or for buffer feeding in times of inadequate herbage or pasture quality
(Chamberlain and Wilkinson, 2002). It is significant to note that smallholder farmers in the study
also produced maize silage, which was grown on an average of about 1 Ha in the four study sites.
Page 208
192
Results presented in Chapter Five show that in response to the question on whether the farmer
had a silage pit, about 47% of the farmers indicated they had a silage pit. Masama et al. (2005)
reported in a study in Nharira-Lancashire smallholder dairy scheme that farmers kept inadequate
amounts of feed, of poor nutritional quality for feeding the dairy cows year round. This study
was a cross-sectional survey and therefore it was not possible to analyse the quality of the maize
silage used by farmers. Farmers, however, reported feeding their dairy cows with fodder from
both maize and legume crops. Part of the fodder was fed as green material while part of crop
were ensiled for use during the year. Ngongoni et al. (2006) reported that although farmers are
able to make silage, the methods to make good quality silage were lacking. This possibly
explains why milk production has remained low in the smallholder dairy schemes, due to
inadequate feeding regimes. Mupeta (2000) identified and reported that poor nutrition in the
smallholder dairy herd is one of the major constraints. Although the results show that smallholder
farmers also access concentrates and make silage for their animals, questions arise as to the
quality and adequacy of the feeding regimes of smallholder dairy cows. Due to the inadequacy
particularly of feeds in the smallholder, it has been reported that exotic breeds under such an
environment will perform below optimal levels (Ngongoni et al., 2006). As a result, one can
possibly partly attribute the continued low milk yields in the smallholder dairy to inadequate
levels and quantities of dairy feeds and supplements. This therefore calls for innovative ways to
improve the quality and quantity of feeds available to the dairy herd. This study proposes the
intervention of the APFC as part of the solution to improve the feed available and management
of the smallholder dairy herd.
7.7.2 Cost of Production and Viability of Dairy Production
The results of the gross margin analysis indicate that overall, smallholder milk production is
viable in the four study sites. Although some previous studies have indicated that smallholder
dairy production is not viable (Hanyani-Mlambo et al., 1998; Mupeta, 2000; Mugweni and
Page 209
193
Muponda, 2015), this should be understood in the context in which the studies were carried out.
Zimbabwe has gone through periods of macro-economic problems from the year 2000 when the
fast track land reform and redistribution programme was implemented by the government up to
the year 2008 when the hyper-inflationary environment forced the introduction of the multi-
currency period from the year 2009. Studies have been carried out in other countries that indicate
that smallholder dairy production provides farmers with a stable generation of income from milk
sales, and the results indicate that it is generally viable, although the viability in some cases
varies with the agro-ecological regions (Somda et al., 2005; Mburu et al., 2007; Hussain et al.,
2014). In Zimbabwe Zvinorova et al. (2012) found that variations in gross margins were
associated with heterogeneity of farmers in resource endowments, allocation of resources and
management, and that improved technologies had positive effects on gross margins.
Analysis of the main variable cost items indicates that feed costs were the main variable cost
item accounting for about 48% of the total variable costs, followed by labour which accounted
for 31%. This indicates the importance of feeding in dairy enterprises. Results from other
countries indicate similar proportions. Hussain et al. (2014) study in Pakistan shows that
concentrate feeding was the main cost item for cow milk production in the integrated areas of
Sindh and constituted half (54%) of the total feeding costs per annum.
The results of this study indicate that for both the smallholder dairy schemes supplying the semi-
formal and the formal value chains, smallholder dairy production was a viable activity. The gross
income was significantly different for smallholder dairy schemes supplying the semi-formal
value chain and those supplying the formal value chain, indicating the higher milk quantities
produced in smallholder dairy schemes supplying the formal value chains. However, the total
variable costs and the gross margin per litre were not significantly different for the smallholder
dairy supplying the two value chains. Comparison of the percentage of feed and labour costs
Page 210
194
variable items as a proportion of total variable costs indicates these were significantly different
in the smallholder dairy schemes supplying the semi-formal value chain and those supplying the
formal value chain. The results indicate smallholder dairy schemes supplying the formal value
chain spent more on feed as percent of total variable costs (about 45%) compared to schemes
supplying the semi-formal value chain (about 34%), and about 25% and 17% on labour as a
percent of total variable costs, respectively.
7.7.3 Animal Production and Forage Centre
Many smallholder dairy schemes in Africa face sustainability constraints due to shortages of
feed resources and poor productivity. Extension supported APFCs constructed alongside the
MCC are a possible solution to these constraints. The concept of animal production and forage
research centres follows on the suggestions of Titterton and Maasdorp (1997), as communicated
by Ngongoni (2012), but in this study the centre will be proposed with modifications. The
proposed animal production and forage centre will cater for two constraints that have been
identified as limiting smallholder dairy; feed resources and management (Cain et al., 2007;
Chinogaramombe et al., 2008; Kabirizi et al., 2009). The objective of the centre will be to
improve management of smallholder dairy production in terms of nutritional and animal
management, respectively. The objective of the forage section of the centre will be to develop a
centre where quality forage is produced and conserved under management. The bagged and
ensilaged forage is then sold to farmers at lowest cost possible. Mugabe et al., (2016) show that
bagged silage had the potential to last for at least a year, and farmers can mitigate reported
challenges of accessing silage in certain times of the year by making and storing bagged silage.
The study (Mugabe et al, 2016) also showed that 96% of the farmers indicated they would
welcome bagged silage if brought onto the market. The APFC would therefore mitigate one of
the most limiting factors in smallholder dairy production, given the farmers’ willingness to pay
for the services. The centre would be manned by qualified personnel, trained up to diploma level.
Page 211
195
The animal production section of the centre would also be manned by qualified personnel to
provide correct synchronization of the animals on heat and artificial insemination for the benefits
to be realized. McDermott et al., (2010b) report that combining genetic and feed improvement
has led to productivity gains of up to 300% in smallholder systems in sub-Saharan Africa. Bebe
et al., (2008) indicate that interventions on feeding and breeding have to be packaged together
holistically if intensification is to enhance productivity. This would be the expected outcomes of
the APFC to provide feed and quality forage resources through the forage section and
improvement in genetics through artificial insemination in the animal section of the APFC. Since
farmers have indicated willingness to pay for the services provided by the centre, this means
such a centre can be sustainable without outside financial support. However, there is need for
initial investment financing to put up the centre as most of the smallholder communities lack the
capacity in terms of the required initial capital outlay. Repayment of forage purchased by farmers
will be through deductions factored into the milk sold to the milk collection centre. In terms of
marketing, milk will be sold in the rural areas, with the surplus processed into sour milk
depending on the requirements of the community. The smallholder dairy schemes can also be
linked to dairy value chains that supply the urban markets due to increased production.
Since the proposed APFC would be constructed alongside the MCC, a question was asked on
how much farmers would be willing to pay on the basis such a centre would serve 100 farmers
delivering milk to the MCC. The 100 farmers was an estimate of the average potential milk
producers in the operational smallholder dairy schemes in the country obtained from the DDP
(Annex 1, Table 3). On the basis of the potential milk producers, and the total estimate, this
would require each producer to contribute USD2, 000.00 per household. It was on this basis that
farmers were asked in the survey that if the APFC was to be built next to the MCC and requires
each member to pay USD2, 000.00, how much each farmer was willing to pay. The results,
however, show that the average for the four study sites indicate farmers would be prepared to
Page 212
196
contribute about USD167 per household, which is 8% of the estimated amount required. Since
smallholder dairy farmers on their own would not be able to initially raise the required funding,
options that can be considered include an interest free loan, a government grant in order to
construct the basic infrastructure required for such a centre. The majority (more than three
quarters) of the farmers indicated they would be willing to contribute, an indication that most
farmers are prepared to contribute to the APFC as they perceive this would benefit their
smallholder dairy enterprises. The perceived advantages such a centre would bring to the dairy
enterprise indicate that access to feed, fodder and cost savings on accessing feed and fodder is
the main advantage farmers’ perceive would emanate from such a centre. This indicates that
farmers realize their main constraint to improve productivity, and are therefore willing to pay in
order to improve the productivity of the smallholder dairy herd.
The study findings also indicate that a greater proportion of the farmers willing to construct such
a centre are in the smallholder dairy schemes supplying the semi-formal value chain (88%)
compared to the formal value chain (67%). This is an indication that farmers in the smallholder
dairy schemes supplying the semi-formal value chain are the worst affected in terms of access
to feeding of their animals throughout the year and would require a reliable supply of feed
throughout the year. This can be provided by the proposed APFC. In Zimbabwe the rainy period
lasts for 3 to 4 months which is followed by 8 to 9 months dry weather which results in a harsh
nutritional environment as producers are limited in the type of high quality forage they can grow.
The APFC proposed can participate in the production of high quality forage crops that can be
supplied to farmers throughout the year under professional management. Research in Zimbabwe
and other countries has shown that there are improved forage technologies that can be grown
which have been shown to improve milk yields in the dairy enterprise. In Zimbabwe, a study by
Gwiriri et al. (2016) showed that lablab based supplements can complement or even substitute
commercial supplements in smallholder dairy feeding systems. Kabirizi et al. (2009) study in
Page 213
197
Uganda assessed the effect of improved forage technologies (maize-cowpeas or lablab, sorghum-
lablab or cow-pea intercrop, Chloris gayana-Desmodium intortum and siratro mixture, Napier
grass-Desmodium intortum mixture) on the dairy cattle enterprise. This was compared to the
local feeding methods of Napier grass fodder and crop residues. The results (Kabirizi et al.,
2009) indicated that farmers using improved forage technologies had significantly larger gross
margins per season with lower cost of production than those using sole Napier grass feeding
system. The improved forage technologies are recommended for the APFC as they offer
alternative feeds that can improve milk production in the smallholder dairy value chains.
The study findings show that the proposed APFC is profitable to milk marketing cooperatives
running the MCC in the smallholder dairy value chain as shown by the benefit-cost ratio.
Providing full time extension support to smallholder farmers is expected to result in increased
milk yields achieved by smallholder farmers. Most of the smallholder farmers currently milk
cross bred cows. Access to artificial insemination will lead to improved breeds of cows that have
potential to improve milk yields to levels comparable to those achieved by their large scale
commercial farmer counterparts, provided farmers have access to appropriate feed resources and
improved breeds. Ngongoni et al., (2006) highlighted that milk yield from exotic cows found in
the smallholder sector were below the potential breed averages of those found in the large scale
commercial farms. Therefore, with access to feed and improved management provided for
through the proposed centre, it is expected that this potential can be improved. It was therefore
assumed in the bio-economic modeling that milk yields would increase by more than 50% from
the average milk yields recorded in the survey. This will increase the potential milk yield closer
to the milk yields achieved by large scale commercial farmers reported by Ngongoni et al.,
(2006). It is expected this would lead to sustained increase in milk production from the
smallholder dairy herd. The upgrading of feed and animal management as provided for in the
animal production and forage centre has been shown to be profitable and viable and this therefore
Page 214
198
constitutes a new model for smallholder dairy development in Zimbabwe and the whole of the
southern Africa region. While study findings of the benefit cost indicates such profitability, it
should be noted that this is from a theoretical perspective and implementation of such an
intervention would need to be piloted, monitored and evaluated to assess the practical challenges,
benefits and costs such a centre would bring to the smallholder dairy schemes. Overall, the APFC
potentially offers a possible solution to the productivity constraints faced by smallholder dairy
producers.
7.8 Summary
This Chapter has presented the major feed resources available in the smallholder dairy schemes
studied. The results show that most of the smallholder dairy farmers rely on both stall feeding
and grazing of their dairy animals. In terms of grazing, communal and private grazing is used by
farmers located in dairy schemes in the communal and small scale commercial and resettlement
area farms, respectively. It is important to note that some farmers in smallholder dairy schemes
located in communal areas have also invested in fencing of certain portions of their arable lands
and thus creating paddocks for their animals, which becomes exclusive private grazing for their
dairy animals. Smallholder farmers also use bought-in concentrates and home-made rations for
the dairy cows, and some have also planted improved pastures and fodder crops to improve the
availability of feed and fodder for their dairy herd.
The results show that smallholder dairying is a viable enterprise. The main costs of production
is feed, accounting for about 48% of the total variable costs of production. The benefit cost
analysis of the proposed APFC indicate such a centre would be profitable in the smallholder
dairy value chain with benefit cost ratio of 5.4:1. We therefore reject the null hypothesis that the
APFC is not profitable to milk marketing cooperatives. The results indicate profitability from a
theoretical perspective as this concept has not been practically tested, and therefore practical
Page 215
199
implementation of the intervention would have to be monitored and evaluated to assess
challenges, benefits and costs such a centre would bring to the cooperatives running the MCC
of the smallholder dairy value chain.
Page 216
200
CHAPTER EIGHT: ROLE OF FARMER ORGANISATION IN THE SMALLHOLDER
DAIRY VALUE CHAIN
8.1 Introduction
Chapter Seven presented results of the proposed value chain intervention of the APFC and an
assessment of its viability in the smallholder dairy value chain. This chapter presents results of
the role of farmers’ organization in marketing as given by the MCC which are run by milk
marketing cooperatives with membership of the smallholder dairy farmers in the respective dairy
schemes studied. The results are reported for the semi-formal value chains (as represented by
Chikwaka and Nharira-Lancashire study sites) and the formal value chains (represented by
Marirangwe and Rusitu study sites). The chapter initially presents results of farmer reported
reasons for being members of the MCC, the services provided by the MCC, and farmer
perceptions on whether membership of the MCC has improved farmers’ access to services. This
chapter also includes farmers ranking of production and marketing constraints, and factors
influencing the commercialization of milk through the MCC run by the milk marketing
cooperatives in the smallholder dairy value chain.
8.2 Major Reasons for Membership of Milk Collection Centres
The smallholder dairy schemes in Zimbabwe were initially run and supported by the Dairy
Development Programme (DDP). However, the DDP is no longer active in the dairy schemes
and the schemes are now run by a farmers’ management committee that reports to the general
membership of the cooperatives. The farmer cooperatives are responsible for the management
of the MCC and all activities relating to the MCC. Farmers were asked the main reasons why
they are members of the MCC. Some of the farmers gave more than one reason (multiple
response) in terms of why they are members of the MCC. The main reason (given by about 27%
of farmers reporting in the four study sites) is that farmers want a secure market for their milk.
Page 217
201
This reason was given by about 21% of farmers in Chikwaka and about 31% of farmers in
Nharira-Lancashire compared to about 42% of farmers reporting in Marirangwe and about 22%
in Rusitu. The second most frequently reported reason is to get education and training (about
20% of farmers reporting in the four study sites) , and reported by 11% in Chikwaka, about 23%
in Nharira-Lancashire and Marirangwe (about 24%) and Rusitu (about 20%) (Table 8.1). These
services are normally provided to farmers through government supported training and education
programmes, and sometimes donor supported programmes. The government provides extension
services to livestock producers through the Division of Livestock Production and Development
(LPD) under the Ministry of Agriculture, Mechanization and Irrigation Development (MAMID).
In most of the smallholder dairy schemes, the LPD has an extension worker who provides
services to the dairy scheme. The provision of extension services has, however, been affected by
the financial limitations of the government (Pazvakavambwa et al., 2010). The extension
services provided by the government are sometimes complemented by services provided through
donor supported programmes (SNV, 2012). The impact of these services over the years have
been mixed, although the main objective has been to enhance the participation of smallholder
farmers in formal markets and value chains through their contribution to milk volumes supplied
to markets (SNV, 2012). These reasons therefore have been the driving force of why farmers
become members of the MCC.
The third most frequently reported reason (about 16% of farmers reporting in the four study
sites) is to have access to extension services. This was reported by about 6% of farmers in
Chikwaka and about 18% of farmers reporting in Nharira-Lancashire compared to about 5% and
20% in Marirangwe and Rusitu respectively. The fourth and fifth reasons (reported by about
12% in the four study sites) were to get dairy inputs timely and at a fair price, and to get access
to credit, respectively (Table 8.1).
Page 218
202
Table 8.1: Reasons for being a member of the MCC by study site, 2015
Reason Chikwaka Nharira-
Lancashire
Marirangwe Rusitu Total
% reporting:
To get secure market for
the milk
20.8 31.2 41.8 22.1 27.3
To get education and
training
11.1 23.4 23 19.8 20.2
To get access to extension
services
5.6 18.2 4.5 20.3 15.5
To get dairy inputs timely
and at fair price
8.3 5.2 14.9 18 12.4
To get access to credit 4.2 5.2 13.4 19.4 12.2
Source of income (income
generating project)
12.5 14.9 1.5 0 6.5
Source of sustainable
livelihoods
22.2 0 0 0 3.1
Other miscellaneous
reasons
15.4 1.4 0 0.5 3
Grand Total Multiple
Responses Recorded
n 72 154 67 217 510
% of Total % 14.1 30.2 13.1 42.5 100
Note: n – number of farmers reporting
Source: Smallholder dairy survey (2015)
The other miscellaneous reasons reported by farmers (Table 8.1) included farmers indicating
that the smallholder dairy is a business opportunity, in order to be provided with dairy cattle, the
smallholder dairy offers employment and that it guarantees payment.
The main reasons for membership of the MCC indicates the role the MCC plays in the
smallholder dairy schemes. The MCC provides the market for the milk from the producers as
evidenced by the responses. According to the DDP Phase II Strategy (1998-2003) document, the
initial focus for dairy development in the country included setting up the MCC for the
mobilization of milk for the then statutory monopoly Dairy Marketing Board (DMB). Following
liberalization in the 1990s and the break-up of the DMB monopoly, smallholder producers could
Page 219
203
market the milk to entities other than the DMB. The MCCs were then encouraged and equipped
to process the milk they were receiving from farmers. The two main products produced were
pasteurized and cultured milk. As a result, some of the MCC moved into milk processing, while
some remained delivering milk to the privatized Dairibord Zimbabwe Limited (DZL), the
successor to the DMB. The MCC thus retained its central role in providing access to markets to
the smallholder dairy producers, whether the milk was processed on site at the MCC or delivered
to processors.
Over the years, most of the farmers’ perceptions were that membership of the MCC had
improved their access to these services. This is mainly because if one is not a member, they are
not able to access services provided by the milk marketing cooperatives through the MCC. The
joining and subscription fees that enable continued access to the services provided by the
cooperatives through the MCC paid by members varied by scheme. At Chikwaka and
Marirangwe dairy schemes, the joining fees are USD50, with monthly subscriptions of USD5,
while at Nharira-Lancashire the joining fees are USD250 with monthly subscriptions of USD5,
and for Rusitu the joining fee is USD20 and monthly subscriptions of USD1 for those delivering
milk to the MCC. The main services provided include the provision of inputs, marketing,
extension, education and training and access to technology. In terms of input provision, some of
the cooperatives arrange for the group purchase of the inputs which are then sold to members at
the MCC on credit. According to key informants, some of the credit facilities are revolving funds
that started as grants through donor supported programmes. In one of the smallholder dairy
schemes, Nharira-Lancashire, one of the commercial stock-feed companies has located a
container at the MCC which facilitates the storage and sale of the inputs to farmers. This is a
commercial arrangement that facilitates easy access to dairy inputs for farmers in the respective
dairy scheme. Farmers are able to purchase the inputs when they deliver their milk to the MCC,
or can make credit facility arrangement through the MCC. Such arrangements need to be
Page 220
204
supported as they facilitate the development of the value chain and integration of smallholder
producers into formal value chains. These type of arrangements have potential for facilitating
the sustainability of the smallholder dairy schemes as they do not rely on government or donor
support but on the increased volumes of milk produced and sold through the MCC.
8.3 Services Provided by the Milk Marketing Cooperatives through the MCC
The questionnaire included a question that asked farmers in terms of services they have obtained
from the MCC run by the cooperatives. This was a multiple response question as some farmers
gave more than one response. The top five services most frequently reported by farmers are the
marketing of milk (about 98% in the four study sites with 100% reporting in Chikwaka, Nharira-
Lancashire, and Rusitu, and about 89% in Marirangwe), provision of training (reported by about
90% of farmers reporting in the four study sites, and 100% for the other three sites with the
exception of Marirangwe that reported 47%) (Table 8.2). The third most frequently reported
service is the availability of concentrates feeds at the MCC (about 90% of farmers reporting in
the four study sites). Availability of concentrates at the MCC was reported by 100% of farmers
in Chikwaka and Nharira-Lancashire compared to about 54% and 94% for Marirangwe and
Rusitu respectively. The fourth frequently reported service was improvement in milk quality
(about 87% of farmers reporting in the four study sites), with 88% reporting in Chikwaka, and
100% reporting in Marirangwe while about 46% reported in Marirangwe and 100% in Rusitu.
The fifth frequently reported service was extension services (about 85% of farmers reporting in
the four study sites), with 92% in Chikwaka, 100% in Nharira Lancashire compared to about
34% in Marirangwe and 100% in Rusitu (Table 8.2). The other services reported were provision
of dairy cows (80% in the four study sites), provision of veterinary inputs (about 77%), provision
of AI services (74%), access to credit (69%) and provision of bull services (about 57% in the
four study sites) (Table 8.2).
Page 221
205
Table 8.2: Percentage of farmers reporting services provided by the milk marketing
cooperatives through the MCC by study site, 2015
% Yes to:
Chikwaka
(n=50)
Nharira-
Lancashire
(n=50)
Marirangwe
(n=35)
Rusitu
(n=50)
Total
(n=185)
Marketing of milk 100 100 88.6 100 97.8
Provision of training 100 100 47.1 100 90.2
Concentrate feed availability at
the MCC
100 100 54.3 94 89.7
Improvement in milk quality 88 100 45.7 100 86.5
Extension services 92 100 34.3 100 85.4
Provision of cows 94 76 51.4 90 80
Provision of veterinary inputs 78 90 40 88 76.8
Provision of AI services 66 72 57.1 96 74.1
Access to credit 76 58 42 92 69.2
Provision of bull services 54 78 8.6 72 56.8
Other services 4 0 0 0 1.1
Source: Smallholder dairy survey (2015)
In the schemes supplying the semi-formal value chain (Chikwaka and Nharira-Lancashire) and
the formal value chain (Marirangwe and Rusitu), the majority of farmers indicated obtaining
services through the MCC, which indicates the central role of the MCC in the development of
smallholder dairy value chain. Farmer organization through milk marketing cooperatives
provide the main service of milk markets through the MCC. In the semi-formal value chain, the
milk is processed on-site at the MCC, and the management committee of the cooperative ensures
the milk and milk products have a market in order to enable them to pay the member producers.
The milk and milk products for the semi-formal value chain are predominantly sold to consumers
in the local area. In the formal value chain, the milk is delivered to processors based in the urban
areas, and the management committee is responsible for negotiating prices with processors that
should ensure the viability of the dairy producers and the MCC. Typically, the smallholder dairy
producers are paid twice monthly (mid-month and at the end of the month). This is the
arrangement that was found in all the four schemes studied.
8.4 Access to Services Provided by the Milk Marketing Cooperative over the Years
Farmers were also asked to give their perceptions as to whether their membership of the
smallholder dairy MCC has improved their access to services over the years. The majority of
Page 222
206
farmers reported that membership of the MCC has improved their access to services over the
years. The top five services frequently indicated by farmers were access to dairy inputs (about
92% of farmers reporting in the four study sites), access to information on milk handling and
good farm management practices (88%), improved dairy production (87.6%), access to feed and
concentrates (87%), education and training (87%) and access to extension services (86.5%)
(Table 8.3).
Table 8.3: Farmer perceptions on whether membership of the farmer cooperative
improved access to services by study site, 2015
Chikwaka Nharira-
Lancashire
Marirangwe Rusitu Total
n=50 n=50 n=35 n=50 n=185
% Yes improved access to:
Inputs 92.0 100.0 80.0 92.0 91.9
Good milk handling and farm
management practices information
98.0 98.0 42.9 100.0 88.1
Improved dairy production 90.0 100.0 51.4 98.0 87.6
Feed and concentrates 92.0 98.0 51.4 96.0 87.0
Education and training 96.0 100.0 37.1 100.0 87.0
Extension 96.0 100.0 37.1 98.0 86.5
AI 70.0 88.0 62.9 96.0 80.5
Modern marketing facilities 94.0 98.0 17.1 90.0 79.5
Improved dairy technology 74.0 100.0 17.1 98.0 76.8
Credit for dairy 78.0 64.0 31.4 98.0 70.8
Milk markets that offer higher
prices
48.0 86.0 42.9 94.0 69.7
Other 12.0 0.0 0.0 0.0 3.2
Source: Smallholder dairy survey (2015)
Generally, smallholder dairy producers indicated the central role farmer organization through
the milk marketing cooperatives plays in enabling access to markets, dairy inputs such as
concentrates, veterinary drugs and medicines, artificial insemination, extension, education and
training. Farmers perceive membership of the milk marketing cooperative has over the years
generally improved their access to these services, although a number of constraints still remain.
8.5 Ranking of Production Constraints
In order to understand farmers’ perceptions on production constraints, the questionnaire included
a question that requested farmers to rank the five most important constraints in production with
Page 223
207
(1=most important constraint). The average ranking of the constraints from one to five shows
that the most frequently ranked constraint with the highest overall percentage of farmers
reporting was poor breeds (about 80% of the farmers reporting), followed by lack of access to
credit (41%) and inadequate feed (about 40% of farmers reporting). Prevalence of diseases and
inadequate water supply in the smallholder dairy schemes were ranked equally (fourth) on
average at about 38% of the farmers reporting. The fifth ranked average constraint in terms of
farmers reporting was high input costs (about 37% of the farmers reporting). The results of the
ranking of production constraints are given in Table 8.4.
Page 224
208
Table 8.4: Ranking of production constraints in all the study sites, 2015
Production constraint Most
Important
Second
most
important
Third
most
important
Fourth
most
important
Fifth most
important
Total
Total number of
farmers reporting:
177 157 146 122 102 177
% of farmers
reporting:
Poor breeds
79.7 83.4 85.6 86.9 88.2 79.7
Poor access to credit 41.8 47.1 48.6 52.5 56.9 41.2
Inadequate feed 40.1 44.6 46.6 46.7 50 39.5
Prevalence of
diseases
39 43.3 45.9 43.4 39.2 38.4
Inadequate water
supply
39 43.9 46.6 50 56.9 38.4
High inputs costs 37.3 41.4 43.2 49.2 51 36.7
Challenges in dairy
cattle procurement
28.2 32.5 34.2 37.7 40.2 28.2
Poor feed quality 19.2 22.3 22.6 27.9 30.4 19.2
Lack of grazing
land
18.1 19.1 20.5 22.1 23.5 18.1
Lack of fencing
materials
2.8 3.2 3.4 3.3 2.9 2.8
Insufficient labour 2.3 2.5 2.7 0.8 2 2.3
Lack of good
cooperative
leadership
(management)
2.3 2.5 1.4 0.8 0 2.3
Low herd size
1.7 1.9 1.4 1.6 2 1.7
High calf mortality 1.1 1.3 1.4 1.6 2 1.1
Transport problems
0.6 0.6 0.7 0.8 1 0.6
Lack of capital
0.6 0.6 0.7 0.8 1 0.6
Lack of irrigation
facilities
for pastures
0.6 0.6 0 0 0 0.6
Note: Percentages based on respondents
Source: Smallholder dairy survey (2015)
Although farmers indicated one of the services they have obtained from the MCC was the
provision of dairy cows, the majority of farmers still ranked the major production constraint as
that of poor dairy breeds. This could possibly be an indication that the breeds that were provided
to producers were not suitable and adapted to conditions in the smallholder dairy schemes, or
farmers were possibly not able to properly manage the breeds provided. Dairy cows provided
through government and donor supported programmes were mainly sourced from large scale
commercial dairy farmers in the country. Due to the implementation of the fast track land reform
Page 225
209
and resettlement programme, the number of large scale dairy farmers in the country has
decreased (Dairy Services, 2016). As a result, there are problems in sourcing dairy animals that
are suitable for various agro-ecological regions where the smallholder dairy schemes are located.
Dairy processors such as Dairibord Zimbabwe Limited (DZL) and Nestle have as a result, turned
to imports of dairy animals from South Africa in order to improve the dairy herd (The Financial
Gazette, 2014). Key informants interviews also indicate the Zimbabwe Dairy Industry Trust
(ZDIT) has as a result, been promoting the use of AI methods in the smallholder dairy schemes
as a way of improving the breeds. Sexed semen which is more appropriate since it ensures that
the needed calves of the required sex are produced, is much more expensive and unaffordable to
many smallholder dairy producers. This possibly explains why smallholder dairy producers
indicated poor breeds as their major constraint, yet appropriate milk breeds is one of the most
important factors that enable producers to participate more effectively in smallholder dairying
and contribute improved milk volumes that enter the semi-formal and formal value chains.
Tebug et al., (2012) study of smallholder dairy production in northern Malawi indicated that the
most important constraints to smallholder dairy farming which were ranked in descending order
were the unreliable supply of improved animal genetics, poor animal health, and shortage of
feed, and poor milk prices. This indicates the importance of improved breeds as a constraint in
smallholder dairy production systems.
The second ranked production constraint was lack of access to credit. Although some of the
smallholder dairy schemes provided inputs credit and purchase of dairy cows as part of revolving
funds, some of the member producers could not access the services. For example, in order to
qualify for credit for buying a dairy cow, some of the schemes required the producer to raise a
deposit. Some of the producers could not raise the deposit and therefore were not able to access
the credit.
Page 226
210
The third ranked production constraint was inadequate feed. Feed is one of the most important
inputs for the dairy enterprise. This ranking by smallholder dairy producers therefore indicates
the importance farmers attach to the availability and adequacy of feed for the dairy enterprise.
Studies by Chinogaramombe et al., (2008) and Ngongoni et al., (2006) reported constraints
facing smallholder dairy producers in accessing adequate feed for the dairy enterprise. This
indicates a possible intervention that can be implemented in the smallholder dairy schemes.
Prevalence of diseases and inadequate water supply were ranked as the fourth production
constraint. Although government provides disease prevention and control for diseases with
public good characteristics, individual farmers have to finance prevention and control of diseases
with a strong private good component. Government veterinary services for the control of
diseases are provided for through the Department of Veterinary Services (DVS) in the MAMID.
The fifth ranked production constraints was high input costs. These costs include the costs of
concentrates feed, veterinary drugs and medicines. Although farmers indicated the MCC has
over the years improved their access to these services, key informant interviews indicate most
of the essential inputs are not always available at the MCC when producers require them.
Producers would then need to make individual arrangements to purchase the inputs from the
nearest urban centres, hence the high costs incurred by farmers.
8.6 Ranking of Marketing Constraints
Farmers were also asked to rank the five most important constraints they have observed in the
marketing of milk in the smallholder dairy scheme where one equals the most important
constraint. The average ranking of the constraints from one to five shows that the number one
constraint with the highest overall average percentage of farmers reporting was low producer
prices (about 91% of farmers reporting). The second was long distance to the MCC from the
Page 227
211
farmers homestead (about 42% of farmers reporting), while the third was constraints relating to
issues of the quality of milk produced (40% of farmers reporting). The fourth constraint was
lack of access to adequate markets (about 37% of farmers reporting) while the fifth constraint
ranked on average was high transport costs (about 34% of farmers reporting) (Table 8.5).
Table 8.5: Ranking of marketing constraints in all the study sites, 2015
Marketing constraint Most
Impo
rtant
Second
most
important
Third
most
important
Fourth
most
importa
nt
Fifth
most
importa
nt
Total
Number of farmers
reporting
171 134 107 71 51 172
% of farmers reporting:
Low producer prices 90.6 94 97.2 98.6 98 90.7
Long distance to MCC
from farmer's homestead
44.4 56 65.4 64.8 64.7 44.2
Issues relating to milk
quality
39.8 52.2 54.2 69 74.5 40.1
Lack of access to adequate
markets
36.8 44.8 53.3 64.8 70.6 36.6
High transport costs 34.5 42.5 49.5 53.5 54.9 34.3
Inadequate infrastructure
development
31 39.6 44.9 60.6 68.6 30.8
Inadequate information
24.6 32.1 39.3 53.5 58.8 25.0
Low volumes produced 2.3 3 2.8 2.8 2 2.3
Centre expenses too high 1.8 1.5 1.9 0 2 1.7
Quality of packaging by
MCC
1.2 1.5 1.9 1.4 2 1.2
Lack of better transport of
milk to MCC
0.6 0.7 0.9 0 0 0.6
Milk rejected and returned
by DZL
0.6 0.7 0 0 0 0.6
Power cuts
0.6 0.7 0 0 0 0.6
Distance to MCC
0.6 0.7 0.9 0 0 0.6
Perceived poor milk
testing for quality by DZL
0.6 0.7 0.9 1.4 2 0.6
Late payments
0.6 0 0 0 0 0.6
Percentages and totals are based on respondents
Source: Smallholder dairy survey (2015)
The ranking of marketing constraints indicates that low producer prices and long distance to the
MCC from the farmers’ homestead were the top two constraints. Nkya et al., (2007) reported
that smallholder dairy farmers in the eastern coastal region of Tanzania ranked perceived
constraints as follows in descending order of importance: low milk price and marketing; feed
Page 228
212
shortage in the dry season; poor management; low animal productivity; poor reproductive
performance and diseases. This indicates the importance of price as a constraint in smallholder
dairy production systems. In this study, in terms of the final producer prices paid to farmers,
these are determined at the smallholder dairy scheme level, depending on the value chain the
scheme participates in. The procedure is that in the semi-formal value chain (Chikwaka and
Nharira-Lancashire) that process the milk at the MCC, the prices paid to farmers depend on the
prices achieved in the various market outlets where the milk and milk products are sold. The
prices in the markets outlets are averaged, and the MCC monthly running costs are then deducted
from the average prices. The balance determines the price paid to producers. For the schemes
that supply the formal value chain, the average price paid by the processor is taken into account
and the MCC running costs are deducted from the average price paid by the processor. The
balance determines the final producer paid to farmers. Farmers in all the four smallholder dairy
schemes studied are typically paid twice per month. What is critical in the determination of
producer prices paid to farmers is the level of MCC running costs and the level of milk intake
from producers. The level of MCC running costs are a function of the MCC infrastructure
running and maintenance costs, the level of staffing, electricity, management and other costs
necessary for the smooth running of the MCC. The efficiency of how the MCC is run and the
capacity of the management committee to oversee the day to day running of the MCC is therefore
critical in determining overall profitability of the schemes and subsequently the producers.
The second constraint of long distance to the MCC from the farmers’ homestead indicates
accessibility to markets, since the MCC is the main entry point for the milk that enters the value
chain. This needs to be considered together with the fourth and fifth constraints reported by
farmers; that of lack of access to markets and high transport costs. This indicates that although
farmers have previously reported that the MCC has been able to improve access to markets, these
as currently structured are not adequate as farmers perceive they still have limited market access
Page 229
213
and are incurring high transport costs. Although key informants in some schemes such as Rusitu
and Nharira-Lancashire indicated the presence of sub-centre MCC that bulk the milk for delivery
to the main MCC, this indicates that farmers’ perceptions are that these are not adequate to meet
the requirements of farmers. There is need therefore to investigate and determine the optimal
location of the MCC and sub-centre MCCs that adequately incentivizes smallholder dairy
producers to participate in milk production and marketing, which improves the overall volumes
delivered to the MCC.
The fifth marketing constraint reported by farmers related to issues of milk quality. This indicates
gaps in the education and training of farmers in order to improve the management and hygiene
issues and improve the quality of milk delivered to the MCC. Milk quality is critical for both
semi-formal and formal value chains. Key informant interviews indicate that in the semi-formal
value chains, milk and milk products are sometimes returned after deteriorating in quality in the
target market outlets. In the schemes that deliver to the formal value chain, processors pay
farmers a quality premium on the milk delivered, which benefits all producers in the smallholder
dairy scheme if all are able to deliver quality milk.
8.7 Determinants of Milk Commercialization through the MCC of the Smallholder Dairy
Value Chain
In order to test the hypothesis that commercialization of milk sold through the MCC is not
influenced by participation in activities of farmer milk marketing cooperatives, access to credit,
producer price of milk, access to information and access to markets by smallholder farmers
through the farmer milk marketing cooperatives, the Tobit regression model was used. The
dependent variable used in the model was the commercialization index which was calculated as
the quantity of milk sold per month divided by the total milk produced by the household per
month multiplied by 100 (ComIndex). The explanatory variables were participation in activities
Page 230
214
of farmer milk marketing cooperatives (PartAss), access to credit (AccCred), milk producer price
(MilkPrice), access to information (AccInfo) and access to markets (DistKmMCC). Participation
in cooperative activities was measured as a dichotomous variable (1=yes, 0=no) where the yes
indicated the farmer actively participated in cooperative activities through being a registered
member who had paid joining fees, access to credit was measured in terms of whether the farmers
had accessed credit in the last five years (1=yes, 0=no), and access to information was a dummy
(where 1=access) to the information from the MCC which was provided through mobile phones
and zero otherwise. Distance to the MCC was used as a proxy for market access and was
measured in kilometers from the farmers’ homestead to the MCC. The results show that
participation in milk marketing cooperative activities and access to credit were not significant,
while distance to the MCC was negative and significant, and access to information and prices
were positive and significant at the 5% level. The results indicate that if the distance to the MCC
was to be increased by one unit, the commercialization index would decrease by -0.00823 points
while holding all other variables constant. Similarly, if the producer price was to be increased
by one point, the commercialization index would increase by 2.64717 points while holding all
other variables constant. Since the producer price is the study in positive and significant, this
means we reject the hypothesis that prices do not influence commercialization of milk sold
through MCC. The results of the Tobit regression analysis are given in Table (8.6).
Page 231
215
Table 8.6: Results of Tobit regression analysis for factors determining
commercialization
ComIndex Coeff. Std Err. t P>|t|
PartAss -0.1246074 0.2951017 -0.42 0.673
AccCred -0.025767 0.0490506 -0.53 0.600
AccInfo 0.1554808 0.0523489 2.97 0.003
DistKmMCC -0.00823 0.0037812 -2.18 0.031
MilkPrice 2.64717 0.4659552 5.68 0.000
_cons -0.4708702 0.3659343 -1.29 0.200
/sigma 0.2922894 0.0173647
Log likelihood = -60.277692
Number of obs = 180
LR chi2 (4) = 68.21
Prob > chi2 = 0.0000
Pseudo R2 = 0.3613
Obs. Summary 24 left censored observations at ComIndex <= 0
156 uncensored observations
0 right - censored observations
Source: Smallholder dairy survey (2015)
8.8 Role of Farmer Cooperatives in the Dairy Value Chain
This study used the commercialization index to assess the degree of milk commercialization
through the MCC of the smallholder dairy value chain. According to Jaleta et al. (2009), one of
the most common approaches to measure the degree of commercialization at a household level
is to use the proportion of sales from the total value of agricultural production. This is the
approach used in this study, but it considered the degree of commercialization at the household
level as the proportion of milk sold from the total household milk production. The
commercialization index was then used as the dependent variable in the Tobit model. The Tobit
model indicated that access to information, distance to the MCC from the farmers’ homestead
and producer price of milk paid by the MCC were the major determinants of the
commercialization of the milk sold to the MCC. Access to information was positive and
significant at the 5% level, indicating the importance of information provided through the MCC
run by the cooperatives in smallholder milk commercialization. The information is provided
through mobile phones, and hence one can infer that the information was timely and relevant to
the decision making of the smallholder dairy producer. Studies in other countries have also
indicated the significance of information for smallholder dairy farmers provided through the
Page 232
216
MCC (Nkwasibwe et al., 2015). Omiti et al., (2009) also observed the use of market information
generated by certain market channels increased output sales of farmers in the market. Since the
MCC is the main entry point for milk in the value chain, the MCC are better placed to provide
up to date information on prices and other dairy related information relevant to the needs of
farmers.
The Tobit model regression shows the relationship between the commercialization index and
distance to the MCC from the farmers’ homestead was negative and significant at the 5% level.
This shows that distance to the MCC is critical in order for farmers to deliver the perishable milk
commodity before it is spoiled. The MCCs that are run by the cooperatives provide the cooling
facilities through bulk milk tanks located at the MCC. In the semi-formal value chain schemes,
this provides temporary storage before the milk is processed and the products are sold through
various market outlets. In the smallholder dairy schemes supplying the formal value chain, this
provides temporary storage until the milk is collected by urban based processors.
Distance to the MCC is also a major determinant of the transportation costs incurred by farmers,
hence its central role in incentivizing or dis-incentivizing smallholder dairy producers to
participate in milk markets and as a determinant of the quantities commercialized. Key informant
interviews also indicated that farmers located further away from the MCC deliver milk once per
day, instead of twice per day for producers located nearer to the MCC. Sharma et al., (2009)
study in India also indicated that in order to reduce transportation costs, farmers preferred selling
milk to market outlets that were nearer to them. Omiti et al. (2009) study in Kenya also reported
that distance to the point of sale was the major constraint to increasing milk market participation.
In this study, the finding on distance also ties with farmers’ ranking of constraints in marketing,
whereby the distance to the MCC from the farmers’ homestead was ranked second on the farmer
perceived constraints to dairy marketing. The results indicate that the distance the farmer has to
Page 233
217
travel to deliver milk is a major determinant of the level of commercialization of milk from the
smallholder dairy schemes and the smallholder dairy value chain.
The third significant predictor of commercialization of milk delivered to the MCC was the
producer price paid by the MCCs run by the cooperatives. The producer price of milk was
positive and significant at the 5% level. Prices provide the incentives for producers to
commercialize a higher proportion of the milk produced. The prices paid to producers in the
smallholder dairy schemes studied are determined by the management committee of the
Cooperative that runs the MCC. In the smallholder dairy schemes where milk is processed on
site at the MCC (to supply the semi-formal value chain), the prices paid to producers are
dependent on the average product prices realized for processed milk and milk products sales in
the various consumer market outlets less the MCC running costs. For smallholder dairy schemes
that deliver to urban processors (to supply the formal value chain), the average prices paid by
processors less the MCC running costs determine the prices paid to producers. The prices are
generally higher for schemes supplying the formal value chain compared to the semi-formal
value chain. Farmers are paid twice per month, that is, mid-month and at the end of the month.
Nkwasibwe et al., (2015) used Tobit regression in a study in Uganda and the results also showed
that price was the major determinant of the proportion of milk sales for milk sold to the formal
market. In this study, the issue of price also ties with farmer perceptions and ranking of marketing
constraints whereby low producer prices were ranked as the most important marketing constraint
in smallholder dairy marketing. This is mainly because prices provide the major incentive for
producers to participate in the market and also the proportion of the milk produced that is
commercialized.
8.9 Summary
This chapter has presented the role of farmers’ organization as given by the milk marketing
cooperatives that run the MCCs in commercialization of smallholder farmer production.
Page 234
218
Members indicated that the main reasons for the membership of the cooperatives that run the
MCCs are that they require a secure market for the milk, access to education and training
programmes availed through the MCC, access to extension services, inputs and credit facilities.
In terms of services farmers have obtained from the MCCs, farmers indicated the top five
services obtained (in terms of responses from farmers reporting) were marketing of milk,
provision of training, availability of concentrate feeds, improvement in milk quality and
extension services. Farmers also indicated they perceived their membership of the MCC have
improved their access to the services over the years. Although farmers perceive this
improvement in access to services, their ranking of production and marketing constraints indicate
farmers’ perceptions of the main limitations that need to be addressed to improve production and
marketing of milk in the smallholder dairy schemes. The top five ranked production constraints
(in terms of average total ranking by farmers reporting) were poor breeds, inadequate feed, lack
of access to credit, prevalence of diseases and inadequate water supply, and high input costs.
The top five marketing constraints ranked by farmers were low producer prices, long distance
from the farmers homestead to the MCC, issues relating to quality of milk, access to adequate
markets and high transport costs. The ranking of the production and marketing costs indicate
priority interventions in the smallholder dairy value chain that can be targeted for
implementation to improve smallholder dairy production and marketing in the smallholder dairy
value chain.
The Tobit regression model indicated that the main determinants of the commercialization of
milk sales through the MCC run by the cooperatives were access to information, distance of the
MCC from the farmers’ homestead and the price paid to farmers for milk delivered to the MCC.
The regression confirms some of the constraints reported by farmers, particularly the first ranked
marketing constraint of low producer prices, which is one of the main determinants of the
commercialization index in the Tobit model.
Page 235
219
The major conclusions of this chapter therefore are that although the MCCs run by the
cooperatives have played an important role and are central in providing markets for milk in the
smallholder dairy value chain, farmers still consider them inadequate to meet fully the
requirements of producers. This is indicated by farmers’ perceptions that although the MCC have
generally improved access to services such as provision of markets, education and training,
extension, inputs and credit, constraints still remain particularly with respect to breeds and access
to markets and prices, the top ranked production and marketing constraints, respectively. These
constraints reflect the top priorities of producers, which if resolved would lead to improvement
in production and marketing of milk in the smallholder dairy value chain. In terms of the
determinants of commercialization, the main conclusion from this analysis is that in order to
improve the role of the MCC in milk marketing, policy interventions have to be targeted and
prioritized at improving market access. Establishing sub-centre MCC within easy reach of
farmers would enhance smallholder farmers’ access to markets and hence participation and
commercialization of the milk output from the smallholder dairy value chain.
Page 236
220
CHAPTER NINE: CONCLUSIONS AND RECOMMENDATIONS
9.1 Conclusions
This section provides conclusions of the study with respect to the overall objective and specific
objectives of the study. The overall objective of the study was to determine factors influencing
milk production and marketing in organized smallholder dairy value chains. The study
conclusions are provided for the specific objectives which were to (1) determine the main factors
influencing milk production in the smallholder dairy value chain (2) analyze the factors affecting
milk market participation in the smallholder dairy value chain (3) determine ex-ante the potential
effect of introducing an animal production and forage centre in the smallholder dairy value chain;
and (4) assess the role of farmers’ cooperatives in the commercialization of milk in the
smallholder dairy value chain.
9.1.1 Factors Influencing Milk Production in the Dairy Value Chain
This study shows quantitatively the use of multiple linear regression to determine factors
influencing milk production in Zimbabwe. The study shows main determinants of milk
production in the organized smallholder dairy value chains in Zimbabwe to be the household
size (representing family labour available for the dairy enterprise), dairy farming experience of
the head of household (important for management and decision making), age of the head of
household, number of milking cows, and the cost of concentrates (indicating the cost of brought-
in concentrate feed).
9.1.2 Determinants of Milk Marketing Participation and Volume of Sales in the
Smallholder Dairy Value Chain
The major conclusions of the study with respect to market participation are that the determinants
of farmers’ participation in the milk markets are resources (dairy cows and household size),
Page 237
221
knowledge (educational level, access to information and extension), experience (age of
household head) and natural climatic conditions (agro-ecological region).
The study also concludes that the major determinants of volume of milk sales are availability of
resources (dairy cows and landholding size of the household), market access (distance to the
MCC), ambition of the farmer (age of the household head) and natural climatic (agro-ecological
region location of the smallholder dairy scheme of the household).
9.1.3 Animal Production and Forage Centre
The major conclusions to be drawn from this chapter are that in terms of feeding systems
smallholder dairy farmers rely on both stall feeding and grazing of their dairy animals. In terms
of grazing, communal and private grazing is used by farmers located in dairy schemes in the
communal and small scale commercial and resettlement area farms, respectively. It is important
to note that some farmers in smallholder dairy schemes located in communal areas have also
invested in paddocks through fencing of part of their land allocated for cropping, which becomes
exclusive private grazing for their dairy animals. This shows the importance of property rights
as an essential element in milk production. Smallholder farmers also used bought-in concentrates
and home-made rations for the dairy cows, and some have also planted improved pastures and
fodder crops to improve the availability of feed and fodder for their dairy herd.
The results show that smallholder dairying is a viable enterprise. The main cost of production is
feed, accounting for nearly fifty percent of the total variable costs of production. The benefit cost
analysis of the proposed APFC indicate that such a centre would be profitable in the smallholder
dairy value chain.
Page 238
222
9.1.4 Role of Farmers’ Organization through Milk Marketing Cooperatives in the
Smallholder Dairy Value Chain
The main conclusions are that although farmers’ organization through the MCCs run by the
cooperatives have played an important role and are central in providing markets for milk in the
smallholder dairy value chain, farmers still consider them inadequate to meet fully the
requirements of producers. This is indicated by farmers’ perceptions that although the MCC have
generally improved access to services such as provision of markets, education and training,
extension, inputs and credit, constraints still remain particularly with respect to breeds and access
to markets and prices, the top ranked production and marketing constraints, respectively. These
constraints reflect the top priorities of producers in order to improve production and marketing
of milk in the smallholder dairy value chain. The Tobit model indicated that access to
information, distance to the MCC from the farmers’ homestead and producer price of milk paid
by the MCC were the major determinants of the commercialization of the milk sold to the MCC.
9.2 Recommendations
The study recommends that policy interventions to improve milk production should ensure that
smallholder dairy producers continually receive appropriate and adequate practical experience
in milk production as the cumulative experience over the years is an important factor in
increasing milk production for the smallholder dairy value chain. Policy interventions also need
to target increasing the number of milking cows per household in the organized smallholder
dairy schemes. Interventions should support and ensure that farmers going into smallholder dairy
production have access to sufficient and adequate labour for the dairy enterprise. In addition,
innovative and alternative options to make concentrates feed available to smallholder dairy
producers at affordable prices should be investigated and implemented.
The results of the study suggest the following interventions if milk sales volume and market
participation is to be increased from the smallholder dairy schemes and hence increased supply
Page 239
223
of milk to the MCC of the smallholder dairy value chain. Policy interventions need to target
increasing the number of dairy cows for smallholder dairy producers. Policy interventions should
also target young and educated farmers located in high potential agro-ecological regions I and
II. These should be provided with adequate and appropriate information and extension packages
in order to enhance milk market participation decisions.
The results indicate that in order to increase milk sales volume to the MCC of the smallholder
dairy value chain, policy interventions targeted at increasing the number of cows owned by the
smallholder dairy producers would have a positive impact. Complimentary policy interventions
need to take into account the landholding size. There is also need to implement policy measures
that ensure the MCCs are accessible to the smallholder dairy producers. This would enable
smallholder dairy producers to gradually increase supply and upgrade from supplying the semi-
formal to supplying the formal value chains that offer stable and better remunerative markets in
the long run compared to the semi-formal value chains.
The results of the APFC indicate profitability from a hypothetical and theoretical perspective as
this concept has not been practically tested, and therefore practical implementation of the
intervention would have to be monitored and evaluated to assess challenges, benefits and costs
such a centre would bring to the cooperatives running the MCC of the smallholder dairy value
chain. The APFC is a new concept being recommended for the smallholder dairy value chain in
Zimbabwe. Policy interventions should therefore be directed at piloting the concept in order to
assess its feasibility and contribution to milk production in the smallholder dairy value chain.
In terms of the determinants of commercialization, the main recommendation from this analysis
is that in order to improve the role of the MCC in milk marketing, policy interventions have to
be targeted and prioritized at improving market access. The MCCs play a central role in
Page 240
224
integrating smallholder farmers to lucrative markets that have potential to incentivize farmers to
increase the quantities marketed through the MCCs, if favourable market and price policies are
developed and implemented. Establishing sub-centre MCC within easy reach of farmers would
enhance smallholder farmers’ participation and commercialization of the milk output from the
smallholder dairy value chain.
The main recommendation with regard to constraints is that there is need to develop intervention
policies that are targeted at alleviating the production and marketing constraints as perceived by
producers. Priority policy interventions should focus on the top five production and marketing
constraints as perceived by farmers. The main production constraints to target are:
i. poor breeds;
ii. lack of access to credit;
iii. inadequate feed;
iv. prevalence of diseases and inadequate water supply; and
v. high input costs.
While the main marketing constraints to target are:
i. low producer prices;
ii. long distance to the MCC;
iii. milk quality issues;
iv. access to adequate markets; and
v. high transport costs.
9.3 Areas for Further Study
While this study did not focus on the investigation of appropriate models of institutional
arrangements necessary for the efficient running of the MCC, there may be need for further
studies to determine the levels of infrastructure, staff complement and competencies required in
Page 241
225
the management committee to professionally run the smallholder dairy schemes in order to
optimize producer viability and efficiency of the MCC. Since the level of running costs paid by
each individual producer depends on the total milk delivered by member farmers, there is need
to determine the minimum number of members and milk intake constituting a viable smallholder
dairy scheme. In this way, alternatives may be developed in terms of institutional arrangements
that can contribute to transforming the smallholder value chain necessary to improve volumes
of milk supplied.
Although there are sub-centre MCCs that bulk the milk for delivery to the main MCC, farmer
perceptions of constraints indicate that lack of access to adequate markets still remains one of
the major constraints faced by farmers. There is need therefore to investigate and determine the
optimal location of the MCC and sub-centre MCCs that adequately incentivizes smallholder
dairy producers to participate in milk production and marketing, which improves the overall
volumes delivered to the MCC.
While the study has indicated the profitability of the APFC, there is need for piloting this new
concept recommended by the study. Further studies would be required to assess the contribution
of this value chain intervention to milk production and marketing, and upgrading of the semi-
formal dairy schemes of smallholder dairy value chain.
Page 242
226
References
Addisu, B., Mesfin, B., Kindum M., and Duncan, A. 2012. Production Aspects of
Intensification and Milk Market Study in Amhara Region of Ethiopia. Livestock
Research for Rural Development (LRRD) 24 (9) 2012.
Agricultural Marketing Authority (AMA). 1985. Economic Review of the Agricultural
Industry of Zimbabwe. Harare, Zimbabwe. Agricultural Marketing Authority.
AMA. 1986. Economic Review of the Agricultural Industry of Zimbabwe. Harare, Zimbabwe.
Agricultural Marketing Authority.
AMA .1987. Economic Review of the Agricultural Industry of Zimbabwe. Harare, Zimbabwe.
Agricultural Marketing Authority.
AMA. 1988. Economic Review of the Agricultural Industry of Zimbabwe. Harare, Zimbabwe.
Agricultural Marketing Authority.
Abdulai, A., and Birachi, E. 2008. Choice of Coordination Mechanism in the Kenyan Fresh
Milk Supply Chain. Review of Agricultural Economics 31 (1): 103–121.
Alejandrino, A.L., Asaad, C.O., and Malabayabas, B., De Vera, A.C., Herrera, M.S., Deocaris,
C.C., Ignacio, L.M., and Palo, L.P. 1999. Constraints on Dairy Cattle Productivity at
the
Smallholder Level in the Philippines. Preventive Veterinary Medicine 38: 167–178
pp167-178.
Ayenew, Y.A., Wurzinger, M., Tegegne, A., Zollitsch, W. 2011. Socio Economic
Characteristics of Urban and Peri-urban Dairy Production Systems in the North
Western
Ethiopian Highlands. Tropical Animal Health Production 43: 1145–1152.
Balirwa, E.K., Nalunkuuma, J., and Sserunkuuma, D. 2016. Determinants of Smallholder
Dairy Farmers’ Volume of Milk Sales in Uganda’s Agro-ecological Zones.
International Journal of Applied and Pure Science and Agriculture, Vol 2, Issue 8 pp
97-109.
Bardhan, D., Sharma, M.L., and Saxena, R. 2012. Market Behaviour of Smallholder Dairy
Farmers in Uttarakland: A Disaggregated Analysis. Agricultural Economics Research
Review, Vol 25 (2) pp 243-254.
Barrett, C.B. 2008. Smallholder Market Participation: Concepts and Evidence from Eastern
and Southern Africa. Food Policy 33: 299–317.
Bebe, B.O., Udo, H.M.J., and Thorpe, W. 2008. Characteristics of Feeding and Breeding
Practices for Intensification of Smallholder Dairy Systems in the Kenya Highlands.
Page 243
227
Livestock Research for Rural Development, (20) (2) 2008.
Bellemare, M.F., and Barrett, C.B. 2006. An Ordered Tobit Model of Market Participation:
Evidence from Kenya and Ethiopia. American Journal of Agricultural Economics 88
(2): 324–337.
Bellu, L.G. 2013. Value Chain Analysis for Policy Making, Methodological Guidelines and
Country Cases for a Quantitative Approach, Conceptual and Technical Material.
EASY Pol Series 129. Food and Agriculture Organization, Rome, Italy.
Bijman, J. 2018. Exploring the Sustainability of the Cooperative Model in Dairy: The case of
the Netherlands. Sustainability 10, 2498, doi: 10.3390/SU10072498.
Birthal, P.S., Jha, A.K., Tiongco, M.M., and Narrod. C. 2008. Improving Farm-to-Market
Linkages through Contract Farming: A Case of Smallholder Dairying in India.
Discussion Paper. IFPRI Discussion Paper 00814. IFPRI.
Birthal, P.S., Chand, R., Joshi, P.K., Saxena, R., Rajkowa, P., Khan, Md. T., Khan, M.A. and
Chaudhary, K.R. 2016. Formal versus Informal. Efficiency, Inclusiveness and
Financing of Dairy Value Chains in Imdia. IFRI Discussion Paper 01513, March 2016.
Breidert, C., Hahsler, M., and Reutterer, T. 2006. A Review of Methods for Measuring
Willingness-To-Pay. Innovative Marketing, Vol 2 (4).
Cain, P., Anwar, M., and Rowlinson, P. 2007. Assessing the Critical Factors Affecting the
Viability of Small-scale Dairy Farms in the Punjab Region of Pakistan to Inform
Agricultural Extension Programmes. Agricultural Systems 94: 320–330.
Chagwiza, C., Muradian, R., and Ruben, R. 2016. Cooperative Membership and Dairy
Performance among Smallholders’ in Ethiopia. Food Policy, 59 (2016) 165-173.
Chamberlain, A.T. and Wilkinson, J.M. 2002. Feeding the Dairy Cow. Chalcombe
Publications. Lincoln, UK.
Chamboko, T., and Mwakiwa, E. 2016. A Review of Smallholder Dairy Development in
Zimbabwe 1983 to 2013: The Effect of Policies. Livestock Research for Rural
Development. Vol 28, Article #113. Retrieved June 3, 2016, from
http://www.lrrd.org/lrrd28/6/cham28113.html
Chapman, D.F. Kenny, S.N., Lane, and N. 2010. Pasture and Forage Crop Systems for Non-
Irrigated Dairy Farms in Southern Australia: 3. Estimated Economic Value of
Additional
Home-grown Feed: Estimated Economic Value of Additional Home-Grown Feed.
Agricultural Systems 104: 589–599.
Page 244
228
Chavhunduka, G. L. 1982. Report of the Commission of Inquiry into the Agricultural
Industry. To the President 1982, Harare, Zimbabwe.
Chidzero, B. 1994. Macro-economic Adjustment and Trade Liberalization. In Zimbabwe’s
Agricultural Revolution Eds. Rukuni M and C K Eicher. University of Zimbabwe
Publications, Harare, Zimbabwe.
Chikwaka Kubatana Dairy Association.1987. Milk Reception and Marketing Strategy
Resolved by Chikwaka Dairy Committee, 22/12/87 Meeting Minutes, Zimbabwe.
Chikwaka Kubatana Dairy Association. 1992. Review of Local Milk Marketing Strategies.
March 1992 Meeting Minutes, Zimbabwe.
Chinogaramombe, G. N. C., Muchenje, V., Mapiye, C., Ndlovu. T., Chimonyo, M., and
Musemwa, L. 2008: Challenges for improving smallholder dairy production in the
Semi-arid areas of Zimbabwe. Livestock Research for Rural Development. Vol 20,
Article #34. Retrieved March 26, 2016, from
http://www.lrrd.org/lrrd20/3/chin20034.htm
Commission of Inquiry into Appropriate Agricultural Land Tenure Systems. 1994. Volume
One: Main Report. To his Excellency the President of the Republic of Zimbabwe.
Under the Chairmanship of Professor Mandivamba Rukuni. October 1994. Harare,
Zimbabwe.
Dairy Development Programme (DDP). 1989. Proposal for the Women in Dairy Development
1986/87 – 1990/91. Draft WIDD Plan March 1989. DDP Harare Zimbabwe.
DDP. 1992. NORAD Technical Review Mission. Zimbabwe Dairy Development Programme,
Harare.
DDP. 1990-1998 Completion Report on Phase I 1990 – 1998. Agricultural and Rural
Development Authority. DDP ZIB 017. Harare, Zimbabwe.
DDP. 1991/92 Annual Report .1991/92. Agricultural and Rural Development Authority Dairy
Development Programme. DDP Harare Zimbabwe.
DDP. 1992/93 Annual Report. 1992/93. Dairy Development Programme. DDP, Harare
Zimbabwe.
DDP. 1997. DDP Annual Report. Harare, Zimbabwe.
DDP. 1998/99 Annual Report 1998/99 Agricultural and Rural Development Authority. Dairy
Development Programme. DDP Harare Zimbabwe.
DDP. 1995. In DDP Files 1995 to 2012. Summary History of the Chikwaka Kubatana Milk
Page 245
229
Centre. Harare, Zimbabwe.
DDP. 1999. Heifer Project International Assisted Projects. Chikwaka, Dowa, Honde, Nharira
and Zvimba. Nyarungu Training Centre Harare Zimbabwe.
DDP. 2007. Dairy Development Programme, An Overview DDP 13-04-07. Harare,
Zimbabwe.
DDP Phase II Strategy (July 1998 – October 2003. Final Report Harare Zimbabwe.
DDP. 2010. DDP Position Paper, Dairy Development Programme, Nyarungu Training Centre,
Harare, Zimbabwe.
DDP. 2012. DDP Projects Milk Intake Figures 1990 – 2012. DDP, Harare, Zimbabwe.
DDP.2013. ARDA – DDP Monthly Report, March 2013, DDP. Harare, Zimbabwe.
Dairy Marketing Board (DMB). 1984. Potential for Milk Collection in Marirangwe Small
Scale
Commercial Farming Area, January 1984. Harare, Zimbabwe.
DMB.1988. Monitoring Report for the Chikwaka Kubatana Dairy Project for the Period 1983-
1988. February 1988, Harare, Zimbabwe.
Daribord Zimbabwe Limited (DZL). 2009. Annual Report: Dairibord
Holdings Limited. Harare, Zimbabwe
Dairy Services. 2011. Dairy Statistics for the period 1980 to 2011. Dairy Services of the
Department of Research and Specialist Services, Harare, Zimbabwe.
Dairy Services. 2012. Dairy Stats: 1980-2012. Dairy Services. Harare, Zimbabwe.
Dairy Services. 2016. Smallholder Dairy Data. Dairy Services of the Department of Research
and Specialist Services, Harare, Zimbabwe.
Demissie, B., Komicha, H.H., and Kedir, A. 2014. Factors Affecting Camel and Cow Milk
Marketed Surplus: The Case of Eastern Ethiopia. African Journal of Agricultural
Science and Technology (AJAST), Vol 2, Issue 2 pp 54-58.
Devendra, C. 2001. Smallholder Dairy Production Systems in Developing Countries:
Characteristics, Potential, and Opportunities for Improvement – Review. Asian-Aust. J.
Anim. Sci. Vol. 14, No. 1, pp 104-113.
Dube, D. 2008. Analysis of Programmes to Enhance Milk Production from the Smallholder
Sector: In The Livestock Sector After the Fast Track Land Reforms in Zimbabwe Eds.
Page 246
230
Khombe, C.T. Ndlovu, L. R. Institute for Rural Technologies and National University of
Science and Technology, Bulawayo Zimbabwe.
Eicher, C., Tawonezvi, P., Rukuni, M. 2006. Synthesis. In Zimbabwe’s Agricultural
Revolution Revisited, Rukuni, M., Tawonezvi, P., Eicher, C., with Munyuki-Hungwe M.
and P. Matondi. Zimbabwe: University of Zimbabwe Publications.
Fabe, A., Grote, U., Winter, E. 2009. Value Chain Analysis Methodologies in the Context of
Environment and Trade Research. Discussion Paper Number 429. Gottenfried Leibniz
University Hannover, Institute of Environmental Economics and World Trade.
September
2009.
FAO. 2017a. Smallholders in the Value Chain. Retrieved from:
http://www.fao.org/agriculture/dairy-gateway/the-dairy-chain/smallholders-in-the-value
chain/en/#.WSXeRGh97IU. Accessed 24/05/2017.
FAO. 2017b. Producer Groups/Organizations. Retrieved from:
http://www.fao.org/agriculture/dairy-gateway/the-dairy-chain/producer-
groupsorganizations/en/#.WSXcFWh97IU. Accessed on 24/05/2017.
FAOSTAT. 2018. Food and Agriculture Organization of the United Nations (FAO) Statistics.
Retrieved from http//www.fao.org/faostat/. Accessed 28/2/2018.
Francis, J. and Sibanda, S. 2001. Case Study of the Viability of Smallholder Dairy Farming
in Nharira-Lancashire, Zimbabwe. Asian-Austr. J. Anim. Sci. 14 (8): 1098–1105.
Francis, J and Sibanda, S. 2001. Participatory Action Research Experiences in Smallholder
Dairy Farming in Zimbabwe. Livestock Research for Rural Development 13 (3).
Greene, W.H. 2003. Econometric Analysis. Fifth Edition. Prentice Hall, New Jersey.
Gittinger, J.P. 1992. Economic Analysis of Agricultural Projects. EDI Series in Economic
Development. Economic Development Institute. World Bank. Washington DC., USA.
Gobena, M,M. 2016. Review on the Role of Dairy Cooperative in Market Orineted
Development in Ethiopia. European Journal of Business Management, Vol 8 (31)pp 38-
48.
Goetz, S.J. 1992. A Selectivity Model of Household Food Marketing Behaviour in Sub-
Saharan Africa. American Journal of Agricultural Economics 74 (2): 444–452.
Gomez, C., Fernandez, M., Salazar, I., Saldana, I., and Heredia, M. 2007. Improvement of
Small Dairy Producers in the Central Coast of Peru. Trop Anim Health Prod 39: 611–
618.
Page 247
231
Government of Zimbabwe. 1987. Review of Dairy Development in Zimbabwe. Harare,
Zimbabwe.
GTZ. 2008. Value Links Manual. A Methodology of Value Chain Promotion. Reprint of
Revised Edition, January 2008. GTZ.
Gujarati, D.N. 2004. Basic Econometrics. Fourth Edition. New Delhi: Tata McGraw-Hill
Publishing Company Limited. New Delhi.
Gwiriri, L.C., Manyawu, G.J., Mashanda, P., Chakoma, I., Moyo, S., Chakoma, C.,
Setaunyane, H., Imbayarwo-Chikosi, V., Dube. S., and Maasdorp, B. 2016. The Potential
of Replacing Conventional Dairy Supplements with Forage Legume Based Diets in
Zimbabwe Smallholder Dairy Sector. African Journal of Range and Forage Science. Vol
33, Number 3, pp 155-163.
Hanyani-Malambo, B.T., Sibanda, S., Ostergaard, V. 1998. Socio-Economic Aspects of
Smallholder Dairying in Zimbabwe. Livestock Research for Rural Development 10 (2).
Heckman, J.J. 1979. Sample Selection Bias as a Specification Error. Econometrica, 47 pp 153-
161.
Holloway, G., Barrett, C.B., Ehui, S. 2002. Baye’s Estimates of the Double Hurdle
Model in the Presence of Fixed Costs. Working Paper WP 2002-42. Cornell
University, Ithaca, New York, USA: Cornell University, Department of Applied
Economics and Management.
Holloway, G., Barrett, C.B., Ehui, S. 2005. The Double-Hurdle Model in the Presence of
Fixed Costs. Journal of International Agricultural Trade and Development. 1: 17–28.
Holloway, G., Nicholson, C, Delgado, C. 1999. Agro Industrialization through Institutional
Innovation: Transaction Costs, Cooperatives and Milk Development in the Ethiopian
Highlands. MSSD Working Paper No. 31. Markets and Structural Division, International
Food Policy Research Institute, Washington DC.
Holloway, G., Nicholson, C., Delgado, C., Staal, S., Ehui, S. 2000. How to Make a Milk
Market: a Case Study from the Ethiopian Highlands. Working Paper 28. Socio-
economics and Policy Research Working Paper. Nairobi, Kenya: International Livestock
Research Institute (ILRI).
Holloway, G., Nicholson, C., Delgado, C., Staal, S., Ehui, S. 2000. 2004. “A Revised Tobit
Procedure of Mitigating Bias in the Presence of Non-zero Censoring with an Application
to Milk-market Participation in the Ethiopian Highlands.” Agricultural Economics 31:
97–106.
Holness, D., Mware, N., Mukwengi, P. 2008. An Impact Assessment and Report for the Africa
Page 248
232
Now/Dairy Development Programme Project (2006-2008) on the Dairy Development
Programme in Zimbabwe. Consultant Report. Zimbabwe: Agricanalysis Centre P/L.
Hussain, A., Aujla, K.M., and Hassan, S. 2014. Economics of Cow Milk Production in Sindh
and Azad Jammu and Kashmir. Pakistan Journal of Agricultural Research, Vol 27, No.
1.
Kaplinsky, R. and Morris, M. 2000. A Handbook of Value Chain Research. Prepared for the
International Development Research Centre (IDRC). Ottawa. IDRC.
International Fund for Agricultural Development (IFAD). 2010. Value Chains, Linking
Producers to Markets Livestock, Thematic Papers. Tools for Project Design. Available
at www.ifad.org/lrkm/factsheet/valuechains.pdf. Retrieved on 28/04/2014.
Jaffee, S., Henson, S., Rios, L.D. 2011. Making the Grade: Smallholder Farmers, Emerging
Standards, and Development Assistance Programs. A Research Program Synthesis.
Agricultural and Rural Development. The World Bank. Washington DC.
Jaleta, M., Gebremedhin, B., and Hoekstra, D. 2009. Improving Productivity and Market
Success of Ethiopian Farmers, Improving Market Opportunities. International
Livestock
Research Institute (ILRI), Discussion Paper No. 18. ILRI, Addis Ababa, Ethiopia.
Jordan, A. 2002. Mid Term Evaluation Report On: Africa Now Commercial Cultured Milk
Production (CCMP). Mid Term Evaluation Report CCMP. Zimbabwe: Africa Now.
Harare, Zimbabwe.
Kabirizi, J., Turinawe, A., Ebiyau, G., Kigongo, J., Akwanga, D., and Nangooti, N. 2009.
Impact of Improved Forage Technologies on Profitability of Dairy Enterprise and
Factors Affecting the Utilization of Technologies. In African Crop Science Conference
Proceedings, 9:745–749. Uganda: African Crop Science Society.
Kaitibie, S., Omore, A., Rich, K., Kristjanson, P. 2010. Kenyan Dairy Policy Change:
Influencing Pathways and Economic Impacts. World Development 38 (10): 1494–
1505.
Kavana, P.Y., and Msangi, B.S.J. 2005. On-farm Dairy Cattle Feeding Experience in Eastern
Zone of Tanzania. Livestock Research for Rural Development (LRRD), 17 (6) 2005.
Key, N., Sadoulet, E., De Janvry, A. 2000. Transactions Costs and Agricultural Household
Supply Response. American Journal of Agricultural Economics 82: 245–259.
Kherallah, M. and Kirsten, J. 2002. The New Institutional Economics: Applications for Policy
Research in Developing Countries. Agrekon 31 (1): 110–133.
Page 249
233
Kitaw, G., Ayalew, L., Feyisa, F., and Kebede, G., Getachew, L., Duncan, A.J., and Thorpe,
W. 2012. Liquid Milk and Feed Value Chain Analysis in Wolmera District, Ethiopia.
Holeta Agricultural Research Center and International Livestock Research Institute,
Addis Abba, Ethiopia.
Kuma, B., Baker, D., Getnet, K. and Belay, K.2014. Factors Affecting Milk Marketing
Participation and Volume of Supply in Ethiopia. Asian Journal for Rural
Development, 4: 1- 15.
Kumar, A., Staal, S.J., and Singh, D.K. 2011. Smallholder Dairy Farmers’ Access to Modern
Milk Chains in India. Agricultural Economics Research Review, Vol 24, pp 243-253.
Lapar, M.L., Holloway, G., and Ehui, S. 2002. Policy Options Promoting Market Participation
of Smallholder Livestock Producers: A Case Study from Philippines. Socio-
Economics and Policy Research Working Paper 47, International Livestock Research
Institute, Nairobi. Kenya, pp 1-27.
LMAC (Livestock and Meat Advisory Council). 2012. Livestock and Meat Advisory Council,
2012 Annual Report Harare Zimbabwe.
Markelova, H., Meinzen-Dick., R., Hellin, J., and Dohrn, S. 2009. Collective Action for
Smallholder Market Access. Food Policy, 34 (2009) 1-7.
Mamo, T., Tefera, T., and Byre, N. 2014. Factors Influencing Urban and Peri-Urban Dairy
Producers’ Participation in Milk Value Addition and Volume of Milk Value Added in
Welmera Woreda, West Shewa Zone of Oromia Regional State, Ethiopia.
International Journal of Livestock Production, Vol 5 (9) pp 165-172.
Masama, E., Kusina, N.T., Sibanda, S., Majoni, C. 2005. Farm-grown Feed Resources as
Factors Affecting Smallholder Dairy Production in Zimbabwe. In African Crop
Science Conference Proceedings, 7:555–560. African Crop Science Society.
Martey, E., Al-Hassan, R.M., and Kuwornu, J.K.M. 2012. Commercialization of Smallholder
Agriculture in Ghana: A Tobit Regression Analysis. African Journal of Agricultural
Research, Vol 7 (14) pp 2131-2141. DOI: 10.5897/AJAR11.1743.
Mburu, L.M., Wakhungu, J.W., and Gitu, K.W. 2007. Determinants of Smallholder Dairy
Farmers’ Adoption of Various Milk Marketing Channels in Kenya Highlands.
Livestock Research for Rural Development 19 (9).
Mendoza, R., and Thelen, N. 2008. Innovations to make markets more inclusive for the poor.
Development Policy Review, 26 (4) 427-458.
McDemott, J.J., Staal, S.J., Freeman, H.A., Herrero, M., and Van de Steeg, J.A. 2010a.
Sustaining Intensification of Smallholder Livestock Systems in the Tropics. Livestock
Page 250
234
Science (2010). DOI: 10.1016/j.livsci.2010.02.014.
McDemott, J.J. Rich, K., Gebremedhin, B., and Burrow, H. 2010b. Value Chains and
Innovation. In Stroebel, A., Swanepoel, F., and Moyo, S. The Role of Livestock in
Developing Communities: Enhancing Multi-functionality. UFS and CTA.
Mdoe, N. and Wiggins, S. 1997. Returns to Smallholder Dairying in the Kilimanjaro Region,
Tanzania. Agricultural Economics 17: 75–87.
Ministry of Agriculture Mechanisation and Irrigation Development (MAMID). 2014.
Livestock Development Programme MAMID April 2014 Harare Zimbabwe.
Ministry of Agriculture, Mechanization & Irrigation Development (MAMID). 2013.
Agricultural Statistical Bulletin, 2013. Harare, Zimbabwe
Ministry of Agriculture, Mechanisation and Irrigation Development (MAMID). 2014.
Livestock Development Programme, MAMID, April 2014. Harare, Zimbabwe.
Moll, H.A.J., Staal, S.J., Ibrahim, M.N.M. 2007. Smallholder Dairy Production and Markets:
A Comparison of Production Systems in Zambia Kenya and Sri Lanka. Agricultural
Systems Vol 94 Issue 2 pp 593-603.
Moyo, S. 2006. The Evolution of Zimbabwe’s Land Acquisition: In Zimbabwe’s Agricultural
Revolution Revisited Eds. Rukuni M, Tawonezvi P, Eicher C, with Munyuki -Hungwe
M and Matondi P Zimbabwe University of Zimbabwe Publications, Harare, Zimbabwe.
Mugabe, P.H., Kujenga, K., Chingarande, S.D., Nyelele, C., Magaisa, E. & Sanginga, P.
2012. Land Reform Migration and Forest Resources Management in Chimanimani
District, Zimbabwe. In Hecht, S., Kandel, S., & Morales, A (Eds). Migration, Rural
Livelihoods and Natural Resource Management. IDRC, CRDI, Canada.
Mugabe, P.H., Nyashanu, R., Ncube, S., Imbayarwo-Chikosi, V.E., Siziba, S., and Maasdrop,
B. 2016. Storage Quality and Marketability of Potential of Bagged Silage for
Smallholder Farmers in Zimbabwe. African Journal of Range and Forage Science, 33
(3) pp 173-180. DOI: 10.2989/10220119.2016.123509.
Mugweni, L., and Muponda, G. 2015. Establishing the Economic Viability of Small Scale
Dairy Farming in Zimbabwe. International Journal of Economics, Commerce and
Management. Vol. 3( 8). August 2015. United Kingdom.
Mumba, C., Samui, K.L., Pandey, G.S.and Tembo, G. 2012. Econometric analysis of the
Socio-economic factors affecting the profitability of smallholder dairy farming in
Zambia. Livestock Research for Rural Development. Vol 24(66). Available at:
http://www.lrrd.org/lrrd24/4/mumb24066.htm
Page 251
235
Munangi, W. 2010. Personal Communication. Dairy Development Programme, Nyarungu
Training Centre, Harare, Zimbabwe.
Muir, K. 1994. Agriculture in Zimbabwe. In Zimbabwe’s Agricultural Revolution Eds Rukuni,
M and C K Eicher University of Zimbabwe Publications.
Muir-Leresche, K., Muchopa, C. 2006. “Agricultural Marketing.” In Zimbabwe’s Agricultural
Revolution Revisited, Rukuni, M., Tawonezvi, P., Eicher, C., with Munyuki -Hungwe
M. and P. Matondi. Zimbabwe: University of Zimbabwe Publications.
Mupeta, B. 2000. “Studies on the Potential of Ram Press Sunflower Cake (Helianthus Anus)
as a Source of Protein for Moderate Milk Production in Cross Bred (Bos Taurus and
Bos Indicus) Cows in the Smallholder Dairy Sector of Zimbabwe.” DPhil Thesis,
Harare, Zimbabwe: University of Zimbabwe.
Mupunga, E. G., and Dube, D. M. J. 1993. Smallholder Dairy Development in Resettled and
Communal Areas of Zimbabwe. Agricultural and Rural Development Authority: In
Future of Livestock Industries in East and Southern Africa Eds J A Kategile and S
Mubi. Proceedings of the Workshop held at Kadoma Ranch Hotel Zimbabwe 20-23
July 1992. June 1993 ILCA Addis Ababa, Ethiopia pp227. Accessed on 10/03/2013
http://www.ilri.cgiar.org/InfoServ/Webpub/fulldocs/X5485E/X5485E0Q.HTM.
Muriuki, H.G., Thorpe, W. 2002. Smallholder Dairy Production and Marketing in Eastern and
Southern Africa: A Regional Synthesis. In Smallholder Dairy Production and
Marketing- Opportunities and Constraints, 185–200. Annad, India: NDDB and ILRI.
Mutukumira, A.N., Dube, D.M.J., Mupunga, E.G., and S.B. Feresu. 1996. Smallholder Milk
Production, Milk Handling and Utilization: A Case Study from the Nharira/Lancashire
Area, Zimbabwe. Livestock Research for Rural Development 8 (1).
Mutura, J.K., Nyairo, N., Mwangi, M., and Wambugu, S.K. 2015. Analysis of Determinants of
Market Channel Choice among Smallholder Dairy Farmers in Lower Central Kenya.
International Journal of Innovative Research and Development, Vol 4 (10).
Muzhanye, 2015. Personal Communication. Director, Quantity Surveying, Ministry of Local
Government, Public Works and National Housing. Harare, Zimbabwe.
Muzuva, N.S. 1989. A Research into Farmers Training Needs in Dairy Development
Programme Research Project, University of Zimbabwe, Harare, Zimbabwe.
Negassa, A. 2009. Improving Smallholder Farmers’ Marketed Supply and Access for Dairy
Products in Arsi Zone, Ethiopia. Research Report 21. ILRI (International Livestock
Research Institute), Nairobi, Kenya.
Page 252
236
NewsDay. 2012. Dairibord Revenues Up, August 10, 2012. In Business Companies, NewsDay,
Harare, Zimbabwe.
New Agriculturist. 2004. Kenya’s Dairy Sector: The Potential for Policy Change? New
Agriculturist, sec. Developments. http://www.new-
ag.info/en/developments/devItem.php?a=1319
Nga, B.T., Cuong, T.H., Thu Ha, L.T., and Lebailly, P. 2012. Milk Production and Marketing
in Small Dairy holders in Northern area of Vietnam: A Case Study in Phu Dong.
Published in Vietnam’s Socio-Economic Development, ISSN 0868-359X, A Quarterly
Review, No, September, 2012.
Ngongoni, N.T.N. 2012. Personal Communication. Department of Animal Science, University
of Zimbabwe. Harare, Zimbabwe.
Ngongoni, N. T.N., Mapiye, C., Mwale, M., and Mupeta, B. 2006. Factors Affecting Milk
Production in the Smallholder Dairy Sector of Zimbabwe. Livestock Research for Rural
Development 18.Retrieved March 30, 2013, from
http://www.lrrd.org/lrrd18/5/ngon18072.htm.
Ngongoni, N. T.N., Mapiye, C., Mwale, M., and Mupeta, B. 2007. “Effect of Supplementing a
High-Protein Ram Press Sunflower Cake Concentrate on Smallholder Milk Production
in Zimbabwe.” Trop Anim Health Prod 39: 297–307.
Nkwasibwe, A., Mugisha, J., Elepu, G., and Kaneene, J.B. 2015. Increasing the Efficiency of
the Dairy Value Chain in Uganda: Determinants of Choice of Milk Marketing Channels
by Dairy Farmers in Kiruhura District, Uganda. Livestock Research for Rural
Development, 27 (9).
Nkya, F., Kessy, B.M., Lyimo, Z.C. Msangi, B.S.J., Turuka, F., and Mtenga, K. 2007.
Constraints on Smallholder Market Oriented Dairy Systems in the North Eastern
Coastal
Region of Tanzania. Tropical Animal Health Production 39: 627–636.
O’brien, R.M., 2007. A Caution Regarding Rules of Thumb for Variance Inflation Factor.
Quality and Quantity (2007) 41:673-690. Springer. DOI 10.107/s11135-006-9018-6.
Ogutu, S.O., Okello, J.J. and Otieno, D.K. 2014. Impact of Information and Communication
Technology-Based Market Information Services for Smallholder Farm Input Use and
Productivity: The Case of Kenya. World Development 64 pp 311-321, 2014.
Omiti, J.M. Otieno, D.J., Nyanamba, T.O., and Mccullough, E. 2009. Factors Influencing the
Intensity of Market Participation by Smallholder Farmers: A Case Study of Rural and
Peri-Urban Kenya. Afjare, Vol, 3 No. 1 pp 57-82.
Page 253
237
Pazvakavambwa, S., Sukume, C., and S. Sibanda. 2010. Rehabilitation and Improving
National
Extension Systems. European Delegation in Zimbabwe. Service Contract No. DCI-
FOOD/2009/226-672.
Porter, M.E. 1985. Competitive Advantage: Creating and Sustaining Superior Performance.
New York. The Free Press.
Reserve Bank of Zimbabwe (RBZ). 2016. Monetary Policy Statement by the Governor, RBZ.
January 2016. Harare, Zimbabwe.
Rob van Vuuren, NADF Chief Executive Officer. 2011. National Association of Dairy
Farmers. Harare, Zimbabwe.
Rich, K.M., Baker, D., Negassa, A., and Ross, R. B. 2009. Concepts, Applications and
Extensions of Value Chain Analysis to Livestock Systems in Developing Countries.
Contributed Paper at the International Association of Agricultural Economists
Conference, Beijing, China, August 16-22, 2009.
Rugube, D. 1988. Monitoring Report for the Marirangwe Dairy Project for the Period 1983-
1988, February 1988, Harare, Zimbabwe.
Rukuni, M. 2006. Revisiting Zimbabwe’s Agricultural Revolution: In Zimbabwe’s
Agricultural Revolution Revisited Eds Rukuni, M., Tawonezvi, P., Eicher, C., with
Munyuki-Hungwe, M., and Matondi P. Zimbabwe: University of Zimbabwe
Publications. Harare, Zimbabwe.
Shamsuddin, M., Allam, M.M., Hossein, M.S., Goodger, W.J., Bari, F.Y., Ahmed, T.U.,
Hossain, M.M, and Khan, A.H.M.S.I. 2007. Participatory Rural Appraisal to Identify
Needs and Prospects of Market Oriented Dairy Enterprises in Bangladesh. Trop Anim
Health Prod 39: 567–581.
Sharma, V.P. 2015. Determinants of Small Milk Producers’ Participation in Organized Value
Chains: Evidence from India. Agricultural Economics Research Review, Vol 28 (No. 2)
pp247-261. July–December 2015. DOI: 10.5958/0974-0279.2016.00004.5.
Sharma, V.P., Kumar, K., and Singh, R.V. 2009. Determinants of Small-Scale Farmer
Inclusion in Emerging Modern Agri-food Markets: A Study of the Dairy Industry in
India. Working Paper W.P. 2009-02-01. Research and Publications. Ahmedabad, India:
Indian Institute of Management.
Siamachira, J. 2011. Unlocking Smallholder Farmers’ Potential. The Sunday Mail, April 3.
Harare, Zimbabwe.
Sibanda, S., and Khombe C.T. 2006. Livestock Research and Development. In Zimbabwe’s
Page 254
238
Agricultural Revolution Revisited, Rukuni, M., Tawonezvi, P., Eicher, C. with
Munyuki-
Hungwe, M. and P. Matondi. Zimbabwe: University of Zimbabwe Publications, Harare,
Zimbabwe.
Sinja, J., Njoroge, L., Mbaya, H., Magara, H., Mwangi, E., Baltenweck, I., Romney, D.,
Omore, A. 2006. Milk Access for Smallholders: a Case of Informal Milk Trader Groups
in Kenya. In A Research Workshop on Collective Action and Market Access. Cali,
Colombia.
Singh, K.M. and Meena, M.S. 2012. Livestock Value Chains: Prospects, Challenges and
Policy Implications. In Status of Agricultural Development in Eastern India. Eds.
Bhatt, A.K., Sikka, J.M., Islam, A., Dey, A. pp 493-508.
SNV. 2012. Evaluation of Smallholder Dairy Programmes in Zimbabwe. Final Report.
December 2012. Harare, Zimbabwe.
Somda, J., Kamuanga, M., and Tollens, E. 2005. Characteristics and Economic Viability of
Milk Production in the Smallholder Farming Systems in The Gambia. Agricultural
Systems 85: 42–58.
Somda, J., Tollens, E., and Kamuanga, M. 2005. Transaction Costs and the Marketable
Surplus of Milk in Smallholder Farming Systems of The Gambia. Outlook on
Agriculture 34 (3): 189–195.
Staal, S., Delgado, C., Nicholson, C. 1997. Smallholder Dairying under Transaction Costs in
East Africa. World Development 25 (5): 779–794.
Staal, S.J., Baltenweck, I., Njoroge, L., Patil, B.R., Ibrahim, M.N.M., and Kariuki, E. 2006.
Smallholder Dairy Farmer Access to Alternative Market Channels in Gujarati.
Contributed Paper. 2006 IAAE Conference, Brisbane, Australia.
Stata. 2017. Linktest – Specification for single equation models. Retrieved on 11/10/2017 from
https://www.stata.com/manuals13/rlinktest.pdf
Stockbridge, M., Dorward, A., and Kydd, J. 2003. Farmer Organisation for Market Access:
Learning from Success. Briefing Paper. Wye College, University of London, UK.
Sukume, C, and Maleni D. 2012. Zimbabwe Dairy Competitiveness: A Ciber Assessment.
Report for the Zimbabwe Agricultural Competitiveness Program. USAID. October,
2012.
Sultana, M.N., Uddin, M.M. and Peters, K.J. 2016. Socio-economic Determinants of Milk
Production in Bangladesh: an implication on on-farm water use. Livestock Research for
Rural Development. Vol 28, Article #1. Available at:
Page 255
239
http://www.lrrd.org/lrrd28/1/sult28001.html
Suzuki, K., Kanameda, M., Ogawa, T., Nguyen, T.T., Dang, T.T.S., Luu Q.H., and Pfeiffer,
D.U. 2006. Productivity and Socio-economic Profile of Dairy Cattle Farmers Amongst
Rural Smallholder Communities in Northern Vietnam. Livestock Science 101: 242–250.
Swanson, R. 2009. Reducing Hunger and Poverty in Zambia through Dairy Development.
Final Evaluation of Land O’ Lakes Title II Development Assistance Program,
September 2008. Zambia: USAID.
Tanwar, P.S., Kumar, Y and Sankhala, G. 2015. Production Function of Resource Use
Efficiency of Milk in Different Categories of Member and Non-member Farmers of
Dairy Cooperatives in Jaipur (Rajasthan). Indian J. Dairy Sci. 68 (5) 2015.
Tebug, S.F., Kasulo, V., Chikangwa-Malunga, S., Weidemann, S., Roberts, D.J., and
Chagunda, M.G.G. 2012. Smallholder Dairy Production in Northern Malawi:
Production Practices and Constraints. Tropical Animal Health Production, 44: 55-62.
The Donor Committee on Enterprise Development. 2007. Value Chain Analysis. Available at
www.bds.knowledge.org/dyn/docs/detailold/424/1 Retrieved on 28/04/2014.
The Financial Gazette. 2014. Dairibord Imports More Heifers. The Financial Gazette, June 10,
2014. Retrieved 27/07/2017. Available at http://www.financialgazette.co.zw/dairibord-
imports-more-heifers/
Titterton, M., Maasdorp, B. 1997. Datata Forage and Dairy Centre: Flow Diagram of Project
Activities. As communicated by Ngongoni, 2012, Harare, Zimbabwe.
ULG Consultants. 1994a. Support for the Deregulation of the Dairy Industry – Zimbabwe.
Volume 1 Main Report and Executive Summary Republic of Zimbabwe, Ministry of
Lands, Agriculture and Water Development.
ULG Consultants. 1994b. Support for the Deregulation of the Dairy Industry – Zimbabwe
CNTR/93/2060A Working Paper 4 Smallholder Dairying Zimbabwe.
USAID. 2007. Zimbabwe Economic Performance Assessment: A Benchmark Study Produced
by Nathan Associates for Review by the United States Agency for International
Development September 2007.
USAID. 2010. Zimbabwe Agricultural Sector Market Study. USAID, Prepared for UASID by
Weidemann Associates Inc. June 2010.
Wanjala, S.P.O., Njehia, B.K. and Murithi, F.M. 2015. Important Variables Influencing Milk
Yields on Smallholder Farms in Western Kenya. Asian Journal of Agriculture and
Food
Sciences. Vol 3 Issue 1 February 2015.
Page 256
240
Weber, C.M., and Labaste, P. 2010. Building Competitiveness in Agricultural Value Chains.
A Guide to Value Chains and Applications. The International Bank for Reconstruction
and Development/The World Bank. Washington DC.
Willy, B.T., and Gemechu, A. 2016. Determinants of Market Participation and Financial
Profitability of Smallholder Dairy Farming: The Case of Bako Tibe, West Showa,
Ethiopia. Trends in Agricultural Economics 9 (1-3): 29-44. DOI:
10.3923/tae.2016.29.44.
Wooldridge, J.M. 2002. Econometric Analysis of Cross Section and Panel Data. MIT Press,
Ambridge, MA., ISBN-13: 9780262232197.
Zamykal, D., Steele, M., Kerr, D., and Chaseling, J. 2007. Identifying Significant Contributors
to Milk Production in the Absence of the Herd Size Effect. James Cook University,
Queensland, Australia.
Zvinorova, P.I., Halimani, T.E., Mano, R.T., Ngongoni, N.T. 2012. Viability of Smallholder
Dairying in Wedza, Zimbabwe. Trop Anim Health Prod Dec 5.
Zimbabwe Government. 1981. Growth with Equity: An Economic Policy Statement, Harare
Zimbabwe Government Printer.
ZimStats. 2012. Women and Men in Zimbabwe Report 2012. Zimbabwe National Statistics
Agency, Harare, Zimbabwe.
ZimStats. 2013. Poverty and Poverty Datum Line Analysis in Zimbabwe, 2011/12. April 2013
Harare, Zimbabwe.
Page 257
241
Appendices
Annex 1: Information on smallholder dairy development schemes
Table 1: The Distribution of Dairy Development Programme Smallholder Dairy Projects
Province District Location Dairy Project
Manicaland Mutasa Watsomba Business
Centre
Tsonzo
Chipinge Rusitu Valley Rusitu
Makoni Nyabadza Business Centre Sangano/St Faith
Mutasa Hauna Growth Point Honde Valley
Rusape Dowa Business Centre Dowa
Marange Marange Marange
Mashonaland East Harare South Marirangwe Business
Centre
Marirangwe
Chikomba Nharira Business Centre Nharira-Lancashire
Hwedza Wedza Growth Point Wedza
Chikomba Sadza Growth Point Sadza
Goromonzi Juru Growth Point Chikwaka
Mutoko Kanyongo Business
Centre
Kanyongo
Murewa Murewa 44 Business
Centre
Murewa 44
Mashonaland West Zvimba Murombedzi Growth
Point
Murombedzi
Chegutu Mubaira Growth Point Mhondoro
Mashonaland Central Guruve Guruve Growth Point Guruve
Mt Darwin Mt Darwin Growth Point Mt Darwin
Bindura Nzvimbo Grwoth Point Chiweshe
Midlands Gokwe South Gokwe Growth Point Gokwe
Mvuma Mvuma Takawira
Masvingo Mushagashe Business
Centre
Mushagashe
Matabeland South Umzingwane Mawabeni Business
Centre
Umzingwane
Harare Metropolitan Harare South Harare Nyarungu Training
Centre
Province District Location Dairy Project
Midlands Mavhaire Irrigation
Scheme
Hama-Mavhaire
Shurugwi Tongogara Growth Point Shurugwi
Mashonaland Central Bindura Shamva Growth Point Shamva
Matabeleland South Matopo Gulathi Gulathi
Masvingo Masvingo Nemanwa Growth Point Nemanwa
Mashonaland East Seke Mupfuiranga Coops Chihota
Manicaland Nyanga Nyanga Growth Point Nyanga
Source: Dairy Development Programme
Page 258
242
Table 2: Grouping of Smallholder Dairy Projects According to Performance/Status
Project Scheme Comments/Status
Group 1
Rusitu Phase I and II of the Rusitu dairy project produces 600
litres/day
Sangano Produces 200 to 300 litres/day
Marirangwe Produces 400 litres/day
Nharira-Lancashire
Gokwe
Mushagashe
Group 2
Dowa Produces 160 litres/day
Chikwaka Produces 160 litres/day
Guruve
Mzingwane
Tsonzo
Honde Valley Produces 30 to 40 litres/day
Group 3
Sadza Group 3 inlude projects that have been functional in the
past but in some cases are currently inactive due to various
challenges. Some of the schemes are in the process of
reviving and the amount of milk produced is still
insignificant. In some cases this can be about an average
of 25 litres/day.
Wedza
Shurugwi
Murewa 44
Murombedzi
Mhondoro
Mount Darwin
Group 4
Marange Projects under group 4 include sites that have been
identified and are not yet operational and also projects that
have operated but are currently not functional due to
various challenges.
Mavhaire
Takawira
Gulathi
Shamva
Chiota
Chiweshe
Nemanwa
Nyazvidzi-Gutu
Kanyongo-Mutoko
Source: Dairy Development Programme
Page 259
243
Table 3: Smallholder Dairy Scheme Members, Current and Potential, Zimbabwe 2015
Dairy Project
Current
Producers
Potential
Producers Total
Tsonzo 12 44 56
Rusitu 115 215 330
Sangano 29 63 92
Honde 25 40 65
Dowa 12 60 72
Marirangwe 26 36 62
Nharira-Lancashire 59 180 239
Wedza 21 80 101
Sadza 13 120 133
Chikwaka 33 180 213
Kanyongo (Mutoko) 5 19 24
Murombedzi 14 36 50
Mhondoro 24 49 73
Guruve 12 189 201
Mt Darwin 67 67
Gokwe 36 66 102
Summary Mean Minimum Maximum
Current 29 5 115
Potential 90 19 215
Source: Dairy Development Programme (2015)
Annex 2: Questionnaires and Interview Guides
Questionnaire 1: Household Questionnaire
QUESTIONNAIRE NUMBER ………………………..
UNIVERSITY OF ZIMBABWE, DEPARTMENT OF AGRICULTURAL ECONOMICS
AND EXTENSION – DAIRY VALUE CHAIN STUDY 2015
DAIRY FARMER HOUSEHOLD QUESTIONNAIRE
INTRODUCTION
The data collected in this study will be used only for Academic Studies at the University of
Zimbabwe and all data collected will remain confidential. Data will be aggregated with other
farmers and only averages will be reported without identifying the farmer. The objective of the
study is to determine factors constraining the smallholder dairy value chain from production to
marketing in order to come up with recommendations to improve the contribution of
smallholder producers to milk production and marketing in the country.
A. GENERAL INFORMATION (Ask all farmers)
1. Name of Enumerator
2. Date of Interview
3. Province
Page 260
244
4. District
5. Name of Dairy Scheme
6. Name of Milk Collection Centre
7. Classification of settlement 1=Small Scale Commercial; 2=Old
resettlement; 3=Communal; 4 New
resettlement (A1)
8. Name of Respondent
9. Mobile number of Respondent
(if available)
10. Name of village (if applicable)
B. HOUSEHOLD DEMOGRAPHIC DATA (Ask all farmers)
1. Name of Household Head (HH)
2. Gender of HH Head 1=Male 2=Female
3. Age of HH Head Years________________
4. Marital Status of HH Head 1=Married, 2=Single, 3=Widowed,
4=Divorced 5=Separated 6=Other
(specify)….
5. Number of years in formal
education
Years______________________
6. Occupation of HH Head 1=Full time farmer, 2= Employed off farm,
3=Pensioner, 4=Retrenched, 5=No formal
employment, 6=Other (specify)…………….
7. Agricultural Training of HH
Head
1=Master Farmer, 2=Agric. Certificate
3=Diploma, 4=Degree, 5=None, 6=Other
(specify)……………………………….
8. Number of years in dairying for
HH Head
…………………Years
9. Total number of household
members
Number of hh members__________________
10. Number of adults (>18 years)
staying with the HH Head
Number of
Adults_______________________
11. Number of children (<18 years) in
the household
Number of
children______________________
C1. GENERAL LIVESTOCK OWNERSHIP (Ask all farmers)
1. What numbers of livestock do you currently own?
Page 261
245
Type of Livestock Owned Total Number Owned
1. Dairy cattle
2. Beef cattle (including indigenous
breeds)
3. Sheep
4. Goats
5. Donkeys
C2: DAIRY HERD COMPOSITION (Ask all farmers)
1. What numbers and breeds of dairy cattle do you currently own?
Type of animal Total Number Owned Type of Breed*
Number of Cows in milk
Number of Dry Cows
Number of Heifers
Number of Dairy Steers
Number of Male Calves
Number of Female Calves
Number of Dairy Bulls
*Type of breed: 1=Mashona; 2=Red Dane purebred; 3=Jersey purebred; 4=Friesland purebred;
5=Holstein purebred; 6=Crossbred; 7=Other (specify)………………………..
D. MILK COLLECTION CENTRE (MCC) MEMBERSHIP (Ask all farmers)
1. Please indicate the farmer’s membership status in the following:
1. Are you a registered member (paid joining fees) 1=Yes 2 =No
2. Are you currently producing milk for sale? 1=Yes 2=No
3. Are you an active member delivering milk to the
MCC?
1=Yes 2=No
4. If you are not delivering milk to the MCC, what are
the reasons?
1=sell the milk locally
2=No cattle to milk
3=All the dairy cattle died
4=Low milk produced by
indigenous breeds
5=All milk consumed by the
hh
6= Other (specify)…………..
5. Distance of homestead to the MCC (in km) ………………..km
E. DAIRY INFRASTRUCTURE AND EQUIPMENT (Ask this question even if currently
not delivering milk to the MCC).
1. What type of dairy infrastructure do you have? (Circle as many as appropriate)
1. Dairy cattle facilities (Multiple answers possible)
1=Calf pens 2=Cattle handling
facilities
3=Paddocks 4=Cattle Kraal 5=Watering and
feeding facilities
6=Hay shed 7=Silage pit 8=Other (specify)………………………………….
2.What facilities do you use for milking?
1=Milking parlour 2=Cattle
Kraal
3=Under tree 4=Other
(Specify)…….
Page 262
246
3.What utensils do you use for milking?
1=Stainless
steel bucket
2=Plastic bucket 3=Teapot 4=Can for
delivering
milk
5=Other(specify)….
4. Type of milking used?
2=Hand milking 1=Machine milking
F. DAIRY HERD MILK PRODUCTION (Ask all farmers including those only with
Mashona breeds)
1. What was the average milk produced per day by your dairy cows in 2014?
Average milk production, sold, consumed and yield Milk in litres
Average milk output per day (total for dairy herd in litres)
Average amount of milk allocated to Household consumption per day
(litres)
Average amount of milk sold per day (litres)
Average amount of milk allocated to feeding dairy calves per day (litres)
Average milk yield per cow per day produced by pure breeds (litres)
Average milk yield per cow per day produced by crossbreeds (litres)
Average milk yield per cow per day produced by Mashona breeds (litres)
Average lactation length, age at first calving etc.
Mashona Breeds Pure Breeds Crossbreeds
Average lactation length (days)
Age at first calving (months)
Average calving interval (months)
Average calf weaning age (days)
Calf mortalities in 2014
Adult dairy cattle mortalities in 2014
Number of dairy cattle purchased in 2014
H1. MILK MARKETING TRANSPORT AND TIME (Ask all farmers, if do not sell
circle Do not sell in the last row)
1. Dou you sell milk to the following outlets and what is the mode of transport you use
and the time it takes to deliver milk to the specific market outlet?
Market outlet Do you sell
milk to this
outlet?
Mode of
transport
used*
Cost of the
mode of
transport per
trip ($)
Times it takes to
deliver milk to
this outlet
(minutes)
Milk Collection Centre 1=Yes, 2=No
Local individuals 1=Yes, 2=No
Processor 1=Yes, 2=No
Schools 1=Yes, 2=No
Local Business Service
Centre
1=Yes, 2=No
Local Growth Point 1=Yes, 2=No
Traders 1=Yes, 2=No
Page 263
247
Do not sell 1=Do not
sell
Others (specify)…….
*Mode of transport used codes: 1=On foot; 2=Bicycle; 3=Animal drawn cart; 4=Motor cycle
5=Motor Vehicle 6=Buyer comes to collect at home 7=Other (specify)……..
H2. MILK MARKETING OUTLETS (Ask all farmers)
1.What are the quantities sold to the main market outlets used by the farmer, prices paid and
reasons for selling to the specific outlet?
Market outlet Quantity of milk sold per
day (litres)
Price ($/litre) Reason for selling to
this outlet*
Milk Collection
Centre (MCC)
Local individuals
Processor
Schools
Local Service Centre
Local Growth Point
Traders
Others
(specify)…….
*Reason for selling to this outlet: 1=close to production site 2=offer better price 3=can get
immediate cash 4= nearest milk collection centre 5= others (specify)………
H3. Do you sell other milk products (e.g. fermented milk)? (include milk from indigenous
cattle breeds)
1=Yes 2=No
If Yes, what are the product, quantity, market outlet and prices?
Product Quantity/month (litres) Price ($/litre) Market outlet *
*Market outlet codes: 1 =Neighbors 2=Schools 3=Local Service Centre 4=Local Growth
Point 5=Traders 6=Other (specify)
H4. Other Dairy Income in 2014 (skip if the farmer does not have dairy cattle)
Type of animal sold Number sold in 2014 Average price ($/animal)
Dairy cull cows
Dairy steers sold
Page 264
248
H5. MARKET INFORMATION AND CONSTRAINTS (Ask all farmers)
1. What is the major constraint in transporting your milk to the market?
1= High transport costs 2= Poor roads 3= Long distances to market 4=Lack of suitable
transport 5= Other (specify)……………….
2. What is your major source of agricultural information?
1=Local extension officer 2=Local NGO 3= Radio 4=Milk Collection Centre (MCC) 4= Other
(specify)…..
3. Where do you mainly get information on market prices of milk and milk products?
1= from Milk Collection Centre (MCC) 2= Local extension officer 3=Radio 4 = Television
5=No access to information 6=Other (specify)…
4. Does the household head or any member of the household have a mobile phone?
1=Yes 2=No
5. Do you use the mobile phone to get information for your dairy enterprise?
1=Yes, 2=No
6. What type of information do you get?
1=Milk prices 2=Prices of inputs 3 =Sources of inputs 4=Other (specify)……..
7. What is the cost of cellphone communication for the dairy enterprise per month?
Cost per month $________________________
I. DAIRY PRODUCTION FEEDING (Ask all farmers)
1. What is the size of your arable land in Ha?.............................
2. Which type of feeding system do you use for your dairy cattle?
1=Stall feeding; 2=Grazing; 3=Both 4=Other(specify)….
3. What is your source of dairy feed? (multiple responses possible)
1=Supplements 2=Grazing 3=Combination of supplements and grazing 4=Own Silage 5=Other
(specify)..
4. What types of grazing do you use?
1=Communal; 2=Private; 3=Zero; 4=Other (specify)…
5. If the grazing is private, how big is the grazing area in Ha? (or total farm size for
small scale commercial farms) Ha......................................
6. What type of feed is used for the dairy enterprise?
1= Brought in concentrates 2= Home-made rations 3= Both 4=Other (specify)…..
Page 265
249
7. Please indicate the type of feed given to the following animals.
Type of animal Type of feed Quantity fed per
Cow per day (kg)
Season (or time of
the year)
Cows in milk
Dry cows
Pregnant cows
Calves
8. Do you have planted pastures? 1=Yes; 2=No
9. What are the types of pastures planted?
1=Bana grass 2= Star grass 3=Kikuyu 4= Others (Specify)…………………………….
10. Area under cultivated pastures in 2014/2015 season? Ha…………………..
11. FODDER PRODUCTION (Ask all farmers)
What was the fodder crops produced in 2014?
Crop Area Planted
(ha)
Quantity
Harvested (50kg
bags)
Quantity fed as
green material
(kg)
Quantity
processed into
fodder (kg)
Maize grain
Maize silage
Sorghum silage
Legume crops
Other
(specify)...
J. PRODUCTION COSTS (Ask all farmers)
J1. What are your estimated total costs for your dairy enterprise in 2014 for the following
inputs?
Type of input Quantity Used per year
(indicate units)
Total cost ($/year)
Dipping:
Chemicals
Dipping facility maintenance
(e.g. spray race, dip tank)
Feed:
Silage
Home produced grains
Hay
Supplements
Concentrate Feed
Other feed (specify)…….
Disease Control
Veterinary drugs and medicines
(vaccines etc)
Deworming
Detergents
Page 266
250
Artificial Insemination (AI)
Bulls
Labour
Machinery and maintenance
(where applicable)
Pumps
Transport Costs
Fuel
Maintenance of buildings (e.g.
milking parlous etc)
Maintenance of fences
Energy cost (electricity/generator)
Water
Other Costs (specify)……..
J2. HOME PRODUCED AND PURCHASED DAIRY FEEDS (Ask all farmers)
1.For home produced dairy feeds and fodder, can you estimate the time it takes to do the
following per month?
Type of feed or fodder*
(*specify)
Time required acquiring or gathering feed
or fodder? (Hours per month)
Family
No. of
people
Family
labour
-hours
Hired
No. of
people
Hired labour-
hours
Total Cost
per month
($)
J4. For purchased feed, can you provide the following with regard to labour time
associated with purchase of the feed per month?
Type of
feed*
(specify)
Distance
to place of
purchase
(km)
Time (Hours per month)
No. of
people
(family)
Family
labour
-hours
No. of
people
(hired)
Hired
labour-
hours
Travel
costs
($)
Transportation
of feed costs
($)
Page 267
251
J5. If the feed is purchased with other inputs, please provide the following:
Date of last purchase
Place of purchase
Quantity purchased (kg)
Value of feed ($)
Value of veterinary medicines ($)
Value of other non-dairy related products
purchased during the trip ($)
K. Access to Artificial Insemination (AI) Services
1. Do you have access to Artificial Insemination services in the area? 1=Yes, 2=No
2. If Yes, where do you get artificial insemination services and cost?
Source of Artificial Insemination* Cost
*Source Codes: 1= Milk Collection Centre 2=Local veterinary extension workers 3=from
NGOs operating in the area 4=No access to AI services 5= Other (specify)………..
L. ACCESS TO CREDIT FACILITIES AND EXTENSION SERVICES (Ask all
farmers)
1. Have you obtained credit for your dairy enterprise in last five years? 1=Yes, 2=No
2. If Yes, where was the credit obtained, how much in the last 5 years and what was the
use of the credit?
Year Source of
Credit*
How much obtained
(USD)
Use of the credit
1=Buy dairy animals 2=Buy
concentrates 3=Other (specify)……
2015
2014
2013
2012
2011
*Source of credit Codes: 1=Local microfinance institution 2= Banks 3=NGO Operating in the
area 4=Farmer Association/Cooperative 5=Other (specify)……………
3. If No, give reasons why you have not managed to access
credit……………………………
……………………………………………………………………………………………………
……………………………………………………………………………………………………
……
4.Do you have an extension officer operating in the area? 1=Yes, 2 = No
Page 268
252
5. How many times does he or she visit in a year? Number of times…………………………
M. ANIMAL PRODUCTION AND FORAGE CENTRE (Ask all farmers)
Note: These questions relate to finding out farmers’ views on animal production and
forage if it was to be established next to the Milk Collection Centre and dedicated to
providing dairy enterprise and support services to the farmers in the area [such a centre
is currently not there].
1. If you were able to source your feed from forage centre established at the Milk
Collection Centre, would you be in a position to buy feed for your animals from the
forage centre throughout the year?
1= Yes, 2=No
2. If the forage centre was to produce fodder for sale to farmers throughout the year,
would you be in a position to buy the fodder for your animals?
1= Yes, 2=No
3. What types of animals would you prioritize for feeding from the feed obtained from
such a centre and why?
Type of animal prioritized Reason (specify)
1. Cows in milk
2. Calves
3. Dry cows
4. Heifers
5. Others (specify)……………
4. What types of animals would you prioritize for feeding from the fodder obtained from
such a centre and why?
Type of animal prioritized Reason (specify)
1. Cows in milk
2. Calves
3. Dry cows
4. Heifers
5. Others (specify)……………
5. If an animal production centre was established at the Milk Collection Centre to
provide artificial insemination services, would you be in a position to pay for the
services?
1=Yes, 2=No
6. How much would be willing to pay for artificial insemination services?
Amount willing to pay $__________________________
7. In your view, who should be responsible for constructing such an animal production
and forage centre?
Page 269
253
1= Government 2=Community 3=Community with assistance of government 4=Donors
5=Other (specify)………………………………………
8. Are farmers willing to construct such a centre on their own?
1=Yes 2=No
9. If you are given that construction of such a centre requires each member to
contribute USD2000.00 if it was to benefit 100 farmers, how much would you be
willing to contribute to the construction of such a centre?
1. Amount willing to pay $_____________________________________
2= Not prepared to contribute
10. What advantages would such a centre provide to your dairy enterprise?
1. Cost savings on feed and fodder
2. Ready access to feed and fodder
3. Other (specify)……………………
11. What other services in your view should be provided by such an animal production
and forage centre if it was to be established at the Milk Collection Centre?
(specify)__________________________________________________________________
_________________________________________________________________________
__
N. Role of Farmer Associations/Cooperatives
1. What are the main your main for being a member of the Milk Collection Centre?
(multiple responses possible).
1= To get secure market for the milk
2= To get dairy inputs timely and at a fair price
3=To get access to credit
4=To get access to extension services
5= To get education and training
6=Others (specify)……………………
2. What services have you obtained from the MCC association/cooperative? (multiple
responses possible).
1=Marketing of milk 1 = Yes 2=No
2= Concentrate feed availability at the MCC 1 = Yes 2=No
3=Procurement of cows 1 = Yes 2=No
4=Provision of veterinary inputs 1 = Yes 2=No
5=Extension services 1 = Yes 2=No
7=Provision of AI services 1 = Yes 2=No
8=Provision of bull services 1 = Yes 2=No
8=Access to credit 1 = Yes 2=No
9=Improvement in milk quality 1 = Yes 2=No
10=Provision of training 1 = Yes 2=No
11=Other (specify)……. 1 = Yes 2=No
Page 270
254
3. Has membership of the farmer association/cooperative improved your access to the
following:
1 Access to dairy inputs 1=Yes 2=No
2 Access to extension information 1=Yes 2=No
3 Access to AI 1=Yes 2=No
4 Improved dairy production 1=Yes 2=No
5 Access to feed and concentrates 1=Yes 2=No
6 Access to milk markets that offer higher prices 1=Yes 2=No
7 Linkages to modern marketing facilities 1=Yes 2=No
8 Access to technology 1=Yes 2=No
9 Access to credit for dairy 1=Yes 2=No
10 Access to education and training 1=Yes 2=No
11 Access to information on milk handling and good farm
management practices
1=Yes 2=No
12 Other (specify)……… 1=Yes 2=No
O. MAJOR CROPS GROWN, INCOME SOURCES AND HOUSEHOLD INCOME
(Ask all farmers)
1. What are the major crops grown by the household in 2014/15 and the output
harvested?
Crop Grown* Quantity harvested (Number of 50 kg bags)
*Crop Codes 1=Maize 2=Groundnuts 3=Soyabeans 4=Sorghum 5=Mhunga 6=Rapoko
7=Bambaranuts (nyimo) 8=Cotton 9=Cotton 10=Nyemba 11=Other (specify)
2. What are the major sources of household cash income and what is your estimated cash
income for 2014 from that source?
Income Source Estimated Cash Income for 2014 (USD)
Dairying
Dryland Crop Production
Irrigation farming/Garden Vegetable
Production
Livestock Sales
Off-farm activities
Pension
Remittances/gifts
Formal Employment
Other (Specify)…………………………
P. CONSTRAINTS IN DAIRY PRODUCTION AND MARKETING (Ask all farmers)
P1. Please RANK the FIVE most important constraints you have observed in production
and marketing (1=most important).
Page 271
255
Production
Constraints
Rank
(1=most
important
etc.)
Marketing Constraints Rank
(1=most
important)
1 Poor breeds Long distance to milk collection
centre from my home
2 Low milk yields High transport costs
3 High input costs Low producer prices
4 Lack of grazing land Inadequate market information
5 Inadequate feed Inadequate infrastructural
development
6 Poor feed quality Issues relating to quality of milk
produced
7 Prevalence of diseases Lack of access to adequate
markets
8 Dairy cattle
procurement
9 Lack of access to credit Others (specify)……
10 Inadequate water
supply
11 Others (specify)….
P2. What are your suggestions on improving dairy production and marketing activities?
Suggestions - Improving production Suggestions - improving marketing
1
2
3
4
5
6
Q. Any recommendations on that you may have on dairy production and marketing in
the smallholder areas in general.
____________________________________________________________________________
____________________________________________________________________________
____________________________________________________________________________
____________________________________________________________________________
____________________________________________________________________________
____________________________________________________________________________
___________
END OF QUESTIONNAIRE
*************************THANK YOU FOR YOUR TIME*********************
Page 272
256
Interview Guide 1: Focus Group Discussion Guide
UNIVERSITY OF ZIMBABWE, DEPARTMENT OF AGRICULTURAL ECONOMICS
AND EXTENSION - DAIRY VALUE CHAIN STUDY 2015
FARMERS’ FOCUS GROUP DISCUSSIONS GUIDE – SMALLHOLDER DAIRY
FARMERS
Introduction
The objective of this interview guide to get information relating to the dairy value chain,
specifically focusing on smallholder farmers/farming schemes. Follow up questions of interest
may be asked depending on the nature of the group discussions. These follow-up questions
may not necessarily be in the interview guide.
Name of Scheme
Group Composition: Males
Females
Before starting the discussions, introduce the topic and objectives of the study to the group.
Assure the group that the information will be treated confidentially and the information
collected will be used for academic purposes in order to improve dairy production in the
country.
A. Farm Level Questions
1. What are the group members’ views on dairy production in the area in general?
(Brain storming questions)
2. What are the key factors that enable one to succeed in dairy production at the farm
level?
3. What support is critical for success at the farm level? (Institutional, marketing,
extension)
4. What has been the experience of the group in dairy farming?
(Explore issues of production, productivity, feeding regimes, marketing, viability,
financing)
5. What are the key production constraints at the farm level?
(Ask the group to rank the top five 1=most important) – Use appropriate ranking methods
such as heaping stones.
Table A1: Production constraints and ranking
Production Constraints Rank (1=most important etc.)
1 Poor breeds
2 Low milk yields
3 High input costs
4 Lack of grazing land
5 Inadequate feed
6 Poor feed quality
7 Prevalence of diseases
8 Dairy cattle procurement
Page 273
257
9 Others (specify)….
10
6. What are the possible opportunities for the group in smallholder dairying?
B. Milk Collection Centre Level Questions
1. Where do the majority of the group members market their milk?
2. If the group markets collectively, what have been the major experiences?
3. What are the key factors constraining the Milk Collection Centre?
4. If market to a processor, what have been the main challenges in marketing as a group?
5. What are the key marketing constraints facing smallholder dairy producers? (Ask the
group to rank the first five, 1=most important).
Table B1: Marketing constraints and ranking
Marketing Constraints Rank (1=most important)
1 Long distance to milk collection centre
2 High transport costs
3 Low producer prices
4 Inadequate market information
5 Inadequate infrastructural development
6 Issues relating to quality of milk produced
7 Others (specify)……
8
9
10
6. What are the recommendations for improvement of smallholder dairying?
C. Animal Production and Forage Centre Questions
Feed has been identified as one of the main factors affecting participation of smallholder
farmers in production and marketing.
1. What are your opinions on how the cost of feed/fodder can be lowered to allow more
farmers to participate in smallholder dairy?
2. There have been suggestions of creating an animal production and forage research
centre at the Milk Collection Centre: What are your opinions on such a centre?
3. What do you think can be the contribution of such a centre to the lowering of costs
relating to:
Feed/Fodder
AI/ Productivity improvement
4. Contract farming is one way smallholder farmers can increase participation in
smallholder dairy value chain. In your view, why has there been no meaningful
development of contract farming in smallholder dairy farms?
D. Animal Diseases and Milk Quality Questions
1. What are the main diseases affecting dairy animals in the area?
2. How is the quality of milk produced by the group assessed?
3. What are the major milk quality challenges faced by the group?
4. How can the quality milk produced be improved in the dairy scheme?
Page 274
258
E. General Questions
1. Are there any general comments you may have on smallholder dairying in Zimbabwe?
-END-
Interview Guide 2: Key Informant Interviews Guide Milk Collection Centre
UNIVERSITY OF ZIMBABWE, DEPARTMENT OF AGRICULTURAL ECONOMICS
AND EXTENSION - DAIRY VALUE CHAIN STUDY 2015
KEY INFORMANT INTERVIEW GUIDE – MILK COLLECTION CENTRE (MCC)
Introduction
The objective of this interview guide is to get information relating to the dairy value chain,
specifically focusing on smallholder farmers/farming schemes. Follow up questions of interest
may be asked depending on the nature of the key informant interviews. These questions may
not necessarily be in the interview guide
Name of Milk Collection Centre (MCC)
Name of Key Informant
Position in MCC
Cellphone number
Email address (if applicable)
A. Status of Milk Collection Centre
When was the MCC formed? Year formed_________________
Functionality status of the MCC 1=Fully operational, 2=not functional 3=Very
few farmers delivering milk (few=less than a
third of registered members) 4=Other
(explain)….
What factors explain the current status of
the MCC?
Factors explaining……..
Has production in the last five years been? 1=increasing; 2=decreasing; 3=remained the
same 4=Other (specify)…….
What factors influence the production
trends in the last five years?
What is the current active membership
status of the MCC?
No. of active members_______________
What has been the active membership
trends in the last five years?
1=increasing; 2=decreasing; 3=remained the
same; 4=Other (specify)………
What factors influence such trends Factors____
What support services does the MCC offer
to members?
Services (specify)______________________
What are the institutional arrangements that
support the MCC for the following:
Production
Marketing
Research
Extension
Page 275
259
Credit
Governance
What in your opinion are the key production constraints facing members of the MCC? (Please
rank the first five, 1=most important).
Table A1: Production constraints and ranking
Production Constraints Rank (1=most important etc.)
1 Poor breeds
2 Low milk yields
3 High input costs
4 Lack of grazing land
5 Inadequate feed
6 Poor feed quality
7 Prevalence of diseases
8 Dairy cattle procurement
9 Others (specify)….
10
What are the key marketing constraints facing members of the MCC? (Please rank the first
five, 1=most important).
Table B1: Marketing constraints and ranking
Marketing Constraints Rank (1=most important)
1 Long distance to milk collection centre
2 High transport costs
3 Low producer prices
4 Inadequate market information
5 Inadequate infrastructural development
6 Issues relating to quality of milk produced
7 Others (specify)……
8
9
10
In your view, what opportunities exist for smallholder milk production in the overall dairy
value chain?
____________________________________________________________________________
____________________________________________________________________________
____________________________________________________________________________
____________________________________________________________________________
________
B. Milk Collection, Delivery and Sales
1. How do members deliver milk to the MCC?__________________________
__________________________________________________________________
2. Are there raw milk sales at the MCC? 1=Yes; 2=No,
3. and what are the quantities sold per week and prices?
Quantity of milk sold per week Price
Page 276
260
4. Is the milk processed at the MCC? 1=Yes, 2 =No.
5. If No, where is the milk processed and what is the mode of delivery to the
processor?
Processor Mode of delivery to processor
6. If processed at the MCC, what are the products produced and current prices?
Product Price
C. Viability Issues
1. In your view, what is the viability status of smallholder dairying:
At the MCC
level?________________________________________________________
______________________________________________________________________
_
and the Producer
level?____________________________________________________
______________________________________________________________________
_
2. In your view, how viable is smallholder dairying in general?
______________________________________________________________________
______________________________________________________________________
____
3. What is the break-even milk yield (litres) per cow given current prices paid at the
MCC?
______________________________________________________________________
______________________________________________________________________
____
4. What is the break-even price given current production levels and costs?
______________________________________________________________________
______________________________________________________________________
____
5. What is your overall assessment in terms of why smallholder farmers have failed to
make a significant contribution to the milk output in the country?
______________________________________________________________________
______________________________________________________________________
____
Page 277
261
6. In your opinion, what do you think should be done to increase marketed milk entering
the formal markets from smallholder areas?
______________________________________________________________________
______________________________________________________________________
______________________________________________________________________
______
D. Production Questions
Feed has been identified as one of the main factors affecting participation of smallholder
farmers in production and marketing.
5. What are your opinions on how the cost of feed/fodder can be lowered to allow more
farmers to participate in smallholder dairy?
______________________________________________________________________
______________________________________________________________________
____
6. There have been suggestions of creating an animal production and forage research
centre at the Milk Collection Centre: What are your opinions on such a centre?
______________________________________________________________________
______________________________________________________________________
____
7. What do you think can be the contribution of such a centre to the lowering of costs
relating to:
Feed__________________________________________________________________
__
______________________________________________________________________
______________________________________________________________________
____
Fodder________________________________________________________________
______________________________________________________________________
______________________________________________________________________
______
AI/ Productivity
improvement_______________________________________________
______________________________________________________________________
__
______________________________________________________________________
__
8. Contract farming is one way smallholder farmers can increase participation in
smallholder dairy value chain.
In your view, why has there been no meaningful development of contract farming in
smallholder dairy farms?
______________________________________________________________________
______________________________________________________________________
____
Page 278
262
E. Animal Diseases and Milk Quality Questions
5. What are the main diseases affecting dairy animals in the area?
______________________________________________________________________
______________________________________________________________________
____
6. How is the quality of milk produced by the group assessed?
______________________________________________________________________
______________________________________________________________________
____
7. What are the major milk quality challenges faced by the group?
______________________________________________________________________
______________________________________________________________________
____
8. How can the quality milk produced be improved in the dairy scheme?
______________________________________________________________________
______________________________________________________________________
____
F. General Questions
2. Are there any general comments you may have on smallholder dairying in Zimbabwe?
____________________________________________________________________________
____________________________________________________________________________
________________________________________________________________
Interview Guide 3: Key Informant Guide Stakeholders
UNIVERSITY OF ZIMBABWE, DEPARTMENT OF AGRICULTURAL ECONOMICS
AND EXTENSION - DAIRY VALUE CHAIN STUDY 2015
TARGET KEY INFORMANTS [DDP, ZADF, AGRITEX, DVS, LPD, PROCESSORS-
DZL, KEFALOS, NESTLE, MILKZIM, NGOS ETC.]
Introduction
The objective of this interview guide to get information relating to the dairy value chain,
specifically focusing on smallholder farmers/farming schemes. Follow up questions of interest
may be asked depending on the nature of the key informant interviews. These questions may
not necessarily be in the interview guide
Name of Key Informant
Occupation
Location
Organization
Telephone number
Cellphone number
Email address
A. Overview of the Dairy Value Chain in Zimbabwe
Can you give an outline of your involvement in the dairy value chain?
Page 279
263
What is the current status and trends in dairy production and marketing in Zimbabwe?
Who are the key value chain actors/stakeholders?
What are the roles of each of the actors/stakeholders?
In your view, what opportunities exist for smallholder milk production in the overall dairy
value chain?
Any documents/statistics that may be useful to understand the dairy value chain in Zimbabwe.
B. Status of Smallholder Dairying
What is your specific involvement with smallholder dairy farmers?
What is the current status and trends in smallholder dairy production and marketing?
What in your opinion are the key production constraints facing smallholder dairy producers?
(Please rank the first five, 1=most important).
Table A1: Production constraints and ranking
Production Constraints Rank (1=most important etc.)
1 Poor breeds
2 Low milk yields
3 High input costs
4 Lack of grazing land
5 Inadequate feed
6 Poor feed quality
7 Prevalence of diseases
8 Dairy cattle procurement
9 Others (specify)….
10
What are the key marketing constraints facing smallholder dairy producers? (Please rank the
first five, 1=most important).
Table B1: Marketing constraints and ranking
Marketing Constraints Rank (1=most important)
1 Long distance to milk collection centre
2 High transport costs
3 Low producer prices
4 Inadequate market information
5 Inadequate infrastructural development
6 Issues relating to quality of milk produced
7 Others (specify)……
8
9
10
Who are the key value chain actors/stakeholders in the smallholder dairy value chain?
What are their main roles in smallholder dairy?
What are the institutional arrangements for supporting smallholder dairy – in terms of
production, marketing, research, extension, credit, governance?
What is your overall assessment in terms of why smallholder farmers have failed to make a
significant contribution to the milk output in the country?
In your opinion, what do you think should be done to increase marketed milk entering the
formal markets from smallholder areas?
Page 280
264
C. Production Questions
Feed has been identified as one of the main factors affecting participation of smallholder
farmers in production and marketing.
9. What are your opinions on how the cost of feed/fodder can be lowered to allow more
farmers to participate in smallholder dairy?
______________________________________________________________________
______________________________________________________________________
____
10. There have been suggestions of creating an animal production and forage research
centre at the Milk Collection Centre: What are your opinions on such a centre?
______________________________________________________________________
______________________________________________________________________
____
11. What do you think can be the contribution of such a centre to the lowering of costs
relating to:
Feed/Fodder____________________________________________________________
______________________________________________________________________
___
AI/ Productivity
improvement_______________________________________________
______________________________________________________________________
__
12. Contract farming is one way smallholder farmers can increase participation in
smallholder dairy value chain.
In your view, why has there been no meaningful development of contract farming in
smallholder dairy farms?
______________________________________________________________________
______________________________________________________________________
____
D. Animal Diseases and Milk Quality Questions
1. What are the main diseases affecting dairy animals?
______________________________________________________________________
______________________________________________________________________
___
2. How is the quality of milk produced by smallholder producers assessed?
______________________________________________________________________
______________________________________________________________________
____
3. What are the major milk quality challenges faced by smallholder producers?
______________________________________________________________________
______________________________________________________________________
____
4. How can the quality of milk produced by smallholders be improved?
Page 281
265
______________________________________________________________________
______________________________________________________________________
____
E. General Questions
3. Are there any general comments you may have on smallholder dairying in Zimbabwe?
Page 282
266
Item 4: Letter to facilitate data collection
Page 283
267
Annex 3: Benefit-Cost Analysis of Animal Production and Forage Centre
Table 1: Parameters used with and without animal production and forage
centre benefit-cost analysis
Parameter Without With Number of cows milked 2 4 Lactation length 275 300 Lactation yield per cow per year 2173 6000 Milk sales (litres per year) 4346 24000 Milk price (USD/litre) 0.50 0.50 Total variable costs (USD/year) 1379 5500 Gross Income (USD/year) 2173 12000 Gross Mragin (USD/year) 794 6480 Source: Assumptions and Smallholder dairy survey (2015)
Table 2: Benefit and Cost Streams of the Present Value of Costs and Benefits
Without APFC With APFC
Perio
d
PV of
Costs
($'000
)
PV of
Benefit
s
($'000)
NPV
($'000
)
B/C
Rati
o
PV of
Costs
($'000)
PV of
Benefit
s
($'000)
NPV
($'000)
B/C
Rati
o
Year
0
137.8
9 299.75
161.8
7 630.56
1,200.0
0 569.44
Year
1
119.9
0 260.65
140.7
5 120.00
1,043.4
8 923.48
Year
2
104.2
6 226.65
122.3
9 104.35 907.37 803.02
Year
3 90.66 197.09
106.4
3 90.74 789.02 698.28
Year
4 78.84 171.38 92.55 78.90 686.10 607.20
Year
5 68.55 149.03 80.48 68.61 596.61 528.00
Year
6 59.61 129.59 69.98 59.66 518.79 459.13
Year
7 51.84 112.69 60.85 51.88 451.12 399.25
Year
8 45.07 97.99 52.91 45.11 392.28 347.17
Year
9 39.20 85.21 46.01 39.23 341.11 301.89
Total
Over
10
years
795.8
1
1,730.0
3
934.2
2 2.2
1,289.0
4
6,925.9
0
5,636.8
6 5.4
Source: Smallholder dairy survey (2015)
Page 284
268
Table 3: Cost of setting up the hypothetical APFC
Nominal Costs
Costs of Setting up the APFC Year 0 (USD)
Centre Administrative buidings 140,000.00
Housing ( for 2 officers and 3 support staff) 20,000.00
Forage Centre (10 Ha) for forage production 10,000.00
Storeroom (for silage) 10,000.00
Irrigation infrastructure (for 10 Ha) 10,000.00
Basic furniture and equipment 10,000.00
TOTAL 200,000.00
Recurrent Expenditure USD/annum
Salaries 2 officers 24,000
Salaries 3 support staff 15,000
Allowances 30,000
TOTAL 69,000
Source: Key Informant Interviews and Author Compilation (2015)
Table 4: Sensitivity Analysis of the Present Value of Costs and Benefits
Witho
ut
APFC
50% increase in
cows in milk
50% increase in
milk production
Lactation
length
remains the
same
Period
NPV
($'000)
B/C
Ratio
NPV
($'000)
B/C
Ratio
NPV
($'000)
B/C
Ratio
NPV
($'000
)
B/C
Rati
o
Year 0 161.87 377.08 429.02 505.32
Year 1 140.75 662.61 733.04 836.52
Year 2 122.39 576.18 637.43 727.41
Year 3 106.43 501.03 554.29 632.53
Year 4 92.55 435.68 481.99 550.03
Year 5 80.48 378.85 419.12 478.28
Year 6 69.98 329.43 364.45 415.90
Year 7 60.85 286.46 316.91 361.65
Year 8 52.91 249.10 275.58 314.48
Year 9 46.01 216.61 239.63 273.46
Total Over 10 years 934.22 2.2
4,013.0
3 4.4
4,451.4
6 4.7
5,095.
58 5.1
Source: Smallholder dairy survey (2015)
Page 285
269
Annex 4: Publications
Paper 1: T Chamboko and E Mwakiwa. 2016. A review of smallholder dairy development in
Zimbabwe 1983 to 2013: the effect of policies. LRRD 28 (6)
Livestock Research for Rural
Development 28 (6) 2016
Guide for
preparation of
papers
LRRD Newsletter
Citation
of this
paper
Department of Agricultural Economics and Extension, University of Zimbabwe, P.O. Box MP
167, Mount Pleasant, Harare, Zimbabwe
[email protected]
Abstract
At independence in 1980, large scale commercial farmers supplied all the milk that
entered formal marketing channels. Although milk was produced in the communal areas,
this was mainly for subsistence purposes. In order to encourage the participation of
previously disadvantaged groups in formal markets, government in smallholder dairying
initiated the smallholder dairy development programme. This programme was meant to
promote farmers’ participation in commercial dairy production and marketing and to
achieve the growth with equity objective adopted at independence. The objectives of this
paper are to (1) critically examine the national milk intake trends against major policies
and (2) assess the extent policies affected milk intake and the extent to which each policy
contributed to variations in milk intake at the national, smallholder level and at selected
smallholder dairy schemes. A review of literature and analysis of published, unpublished
reports and documents, and statistics is performed.
Trend analysis results show that policies had an effect on national and smallholder milk
intake. Although milk intake increased during Economic Structural Adjustment
Programme, it decreased in subsequent periods. There is therefore need to capacitate both
the smallholder and large scale farmers in order for them to increase production. This could
be achieved through dairy production incentives. In the smallholder sector, although there
have been efforts by both government and development partners to support smallholder
dairying over the years, this sector have failed to make significant contribution to the
national economy. There is therefore, need to reassess the development model of
smallholder dairy and value chain development in order to unpack the potential
contribution of this sector to the national economy.
Key words: Africa, government, marketing
Introduction
The agricultural sector in Zimbabwe supports the livelihoods of approximately 70% of the
population, and contributes approximately 18% of GDP (ZimStat 2013). In the 1990s, the
agricultural sector was estimated to support about 60% of manufacturing activities. The
dairy subsector is an important component of the agricultural sector, with dairy produce
contributing about 3% of the value of agricultural production at year 2012 prices (ZimStat
2013). Most of the contribution of the dairy subsector comes from large scale commercial
farms. In the smallholder areas, besides income from the sale of milk, dairying contributes
to the food security and poverty reduction for households residing in the rural areas.
Page 286
270
The consumption of milk in both the rural and urban areas has largely followed the trends
in national production. National milk production over the years has steadily declined from
a peak of 260 million litres in 1991 to the current 54 million litres (MAMID 2014). As a
result, per capita milk consumption in Zimbabwe is reported to be 8 litres against peak
levels of 25 litres (NewsDay 2012). These levels of milk consumption are generally low
compared to regional countries such as South Africa (56 litres per capita) and Zambia (10
litres per capita) (NewsDay 2012). The Government over the years has implemented a
number of policies, some supportive of dairy production, while others have had the
opposite effect. One of the major policies was to broaden the milk supply base through the
creation of the smallholder dairy development programme in 1983 that allowed
participation of smallholder farmers.
Other broad policies which were implemented by the Government included: single milk
market channel inherited from the colonial government and implemented just after
independence in 1980; the Economic Structural Adjustment Programme (ESAP) which
commenced in 1991; the Fast Track Land Reform Programme (FTLRP) which commenced
in the year 2000; and the dollarization which was implemented as from the year 2009. These
policies had some effects on the dairy industry just like the other sectors of Zimbabwe’s
economy (USAID 2012). However, the effects of the different policies are not very clear in
terms of the extent to which they affected or influenced the dairy sector in Zimbabwe.
Dairying in Zimbabwe has long been the preserve of Large Scale Commercial (LSC)
farmers. At independence in 1980, LSC farmers supplied all the milk entering the formal
marketing channels. Although milk was also produced in the communal areas, this was
mainly for subsistence purposes (Chavhunduka 1982). The major distinction between the
large scale commercial and the smallholder sector that comprises communal, small scale
commercial and resettlement areas was that LSC farmers mainly kept exotic dairy breeds
which have better milk yields compared to smallholder sector where indigenous breeds with
low milk yields were kept (Chavhunduka 1982). This paper gives an outline of smallholder
dairy development in Zimbabwe for the period 1983 to 2013.
Objectives of the Paper
The Livestock and Meat Advisory Council (2012) reports that processors’ estimate the national
requirement for raw milk in Zimbabwe at 10 million litres per month. The total national raw milk
intake for 2011 was about 5 million litres per month which gives a shortfall of approximately 5
million litres per month. The highest ever raw milk intake was 260 million litres per annum
achieved in 1991. Since then, the national milk intake has been on a downward trend culminating
in the current low milk intake. Smallholder farmers only contribute 5% of the national intake.
While there are various reasons given for this low milk intake, including the impact of policies,
smallholder farmers have not been able to make a significant contribution to the national milk
intake. The objectives of this paper therefore are to (1) critically examine the national milk intake
trends against major policies, and (2) to assess the extent policies affected milk intake and the
extent to which each policy contributed to variations in milk intake at the national, smallholder
level and at selected smallholder dairy schemes.
Materials and methods
A review of literature and analysis of published, unpublished reports and documents, and statistics
was performed in order to assess the effect of policies and identify constraints in the smallholder
dairy subsector. In order to assess the effect of policies on national and smallholder level milk
intake, the major policies were classified into four distinct periods. The period 1980 to 1989 was
Page 287
271
classified as the single channel marketing period in which the Dairy Marketing Board (DMB)
held monopoly in the purchase, distribution, and trade in dairy products. The period 1990 to 1999
was classified as the period when the government implemented the economic structural
adjustment programme (ESAP) that led to the privatization of the DMB in 1993, and the
participation of other private players. The year 2000 saw government implementing the fast track
land redistribution programme that was accompanied by contraction of the economy, eventually
leading to hyperinflation in the years 2007 to 2008. The dairy sector remained deregulated during
this period. The last class period is from 2009 to present when the government introduced the
multiple currency systems or dollarization. The major hypothesis is that milk production intake
depends on the policies that were implemented by government during the respective periods. This
study therefore examines smallholder dairy development within the context of the policy
frameworks since 1980, analysis of trends and comparative analysis of smallholder within the
context of national milk intake and trends.
The study will initially present an overall trend analysis of national milk intake (large and small
farmers) and for the smallholder intake levels and the trend will be discussed accordingly. In
addition to the trend analysis of national milk intake, the group differences will be performed
from 1980 to 2013, within the context of the policy framework periods in order to assess the
effects of the policies on milk production intake. The groups will be based on policy periods
already highlighted – the first group will be the “single market channel” covering the years 1980
to 1989; the second group will be “ESAP era” covering the years 1990 to 1999; the third group
will be the “Land Reform era” covering the years 2000 to 2008; and finally the fourth group
would be the “Dollarization era” covering 2009 to 2013. The average milk intake for these policy
periods will be analyzed in the Statistical Package for the Social Sciences (SPSS) version 16 to
check if there have been any significant differences in milk intake between the policy periods.
The analysis will use one way analysis of variance (ANOVA) and interactive bar graphs. If the
ANOVA is significant, multiple comparison tests using the Tukey post-hoc multiple comparison
test will be performed to check for significant differences between policy periods, and to show
which policy periods differed significantly from each other in influencing milk production. The
ANOVA methodology will be used for analysis of the milk production at national level,
smallholder level and for selected smallholder dairy schemes. Due to differential data availability,
there would be limited analysis in terms of policy periods for smallholder milk production and
some schemes to be analyzed.
Results
Review of Literature on Developments in Milk Production in Zimbabwe
Large Scale Commercial Dairying
Large Scale Commercial dairying in Zimbabwe dates back to 1910 when the colonial government
took steps to stimulate dairy farming (Muzuva 1989; Mupeta 2000). The government put in place
extension and milk production training services. Milk production expanded over the years and
this was mainly handled by producer cooperatives and the first milk processing plant was
established in Gweru in 1912. In 1947, the government introduced the Milk Subsidy Committee
to enable consumers to access milk. However, by 1949, the producer cooperatives were facing
financial difficulties. There were serious disruptions in the handling and distribution of milk and
milk products and serious seasonal shortages. The colonial government came under pressure from
the white urban consumers to improve on availability of milk. The white urban consumers also
questioned the introduction of the Milk Subsidy Committee since consumers could not get the
milk. This forced the government, under pressure from the predominantly white farming
electorate, to set up a Milk Marketing Committee. The purpose of the committee was to directly
Page 288
272
purchase milk from producers and resell to distributors. In order to improve on the availability of
milk and milk products to consumers, the government in 1952 set up the Dairy Marketing Board
(DMB) to purchase all milk and dairy products, process, distribute and import, as well as to erect
and operate milk processing plants (Muzuva 1989).
According to Muzuva (1989) the1960s period was marked by milk supply and demand problems
which necessitated the government to set up a Commission of Inquiry into the dairy industry. The
commission in its 1961 report concluded that the official policy to stimulate milk production was
fundamentally in accord with the post war economic climate in the country. Supply in the 1960s
was growing faster than demand and this forced the government to come up with alternative
marketing strategies. In an effort to stimulate milk consumption by the urban black population,
skimmed milk derived from butter manufactured for the urban white consumers was used to
produce lacto (dairy “sawa”) for provision on welfare schemes for black children attending
nursery schools. In addition, a network of depots was set up in the high density areas where
predominantly the black population resided. These measures resulted in a high off take of milk
and milk products.
At independence in 1980, the new majority government inherited the milk and milk products
production and marketing that was dominated by white LSC farms and marketed through the
DMB. However, the government faced a situation similar to the colonial government post second
world war situation of improved purchasing power and increased access to milk by outlying areas
(Muzuva 1989). Exports had to be interrupted in order to accommodate increase in domestic milk
sales. However, it should be noted that the increased demand was based on uneconomically low
consumer prices due to the policy of subsidies that was maintained by the government in early
years of independence (Muir-Leresche and Muchopa 2006).
Why smallholder dairying after independence?
The Government of Zimbabwe adopted the growth with equity objective at independence in 1980
(Zimbabwe Government 1981). In order to fulfill this objective, the Government of Zimbabwe in
1980 embarked on a programme to promote the participation of previously disadvantaged groups
in formal markets (Muir 1994). Previously, dairying was dominated by LSC farmers with little
participation of small scale commercial and communal farmers in dairying production and
marketing. A commission of Enquiry into the Agricultural Industry in 1982 indicated that milk
production in the communal areas was mainly for subsistence purposes, and exotic breeds were
not kept and the yields were very low (Chavhunduka 1982).
Evolution of Smallholder Dairying
The analysis of smallholder dairying cannot be separated from the development of the Dairy
Development Programme (DDP). This programme started as the Peasant Sector Development
Programme (PSDP) then under the DMB in 1983 following a directive from the government on
all parastatals to promote the participation of indigenous Zimbabweans in sectors which had
previously been dominated by predominantly white large scale commercial interests (DDP 1997).
DMB saw this as an opportunity to create strong linkages between its primary producers in order
to add value to the primary product. DMB also saw this as an opportunity to secure and expand
the raw milk production supply base due to increased demand for milk in both urban and rural
areas after independence. This increased demand was not matched by an increase in the
production base. The main reason was that the production base inherited at independence of
approximately 500 LSC dairy producers was no longer able to cope with the increased national
milk demand.
Page 289
273
The First Communal Farming Area Dairy Scheme
Following on from the government directive, DMB initiated a feasibility study to consider the
potential for a milk collection scheme in Chikwaka in 1983 (DMB 1988). Chikwaka was selected
because of its proximity to Harare the capital city, location in agro-ecological region IIa which
receives 800 to 1000 mm rainfall per annum and was therefore considered suitable for intensive
systems of crop and livestock production. Although the initial objective was for milk production
only, there were several constraints identified that hindered the attainment of this objective. The
major constraints identified were (1) lack of properly controlled and managed grazing (2) cattle
dip was too far (3) water shortages (4) poor sanitary facilities (5) lack of knowledge of dairying
and (6) low milk yield produced by indigenous stock. These constraints needed to be overcome
before milk production could be introduced to the area.
A planning committee encompassing all government departments and different groups and
associations was formed to coordinate and plan the activities in order to overcome these
constraints. The results of a socio-economic study undertaken showed that milk production could
not be considered in isolation but as an integral part of the farming system pertaining to many
communal areas of Zimbabwe. As a result, DMB had to work in collaboration with other
Ministries, agencies and farmer associations in the development of smallholder dairy. The DMB
then appointed a project officer and three liaison officers to cater for both mobilization and link
with the DMB. The Rural District Council donated a 10 hectare plot for construction of the milk
collection centre and establishing a demonstration plot for training. Other donors also intervened,
with the European Economic Commission (EEC) funding the Kawoyo grazing scheme while
farmers contributed labour to the project. The Dutch Embassy provided building materials for the
construction of a dip tank, while DMB sourced and sold cement at cost price for the construction
of latrines and also purchased a rig to help the community to drill boreholes. On the
22nd December 1987, a total of 13 farmers altogether brought 136 litres of milk to the collection
centre (DMB 1988). The Chikwaka milk collection centre thus became the first to be established
in a communal area as part of a broad based development programme centred on milk production
(DDP 1995). The centre was then registered by Dairy Services as a producer-retailer in line with
changes to accommodate the smallholder areas.
The First Small Scale Commercial Farming Area Dairy Scheme
DMB’s second pilot study was undertaken in Marirangwe small scale commercial farming area.
This was mainly because a group of farmers from Marirangwe had approached the Board in mid-
1983 to express their interest in entering the commercial dairy industry. A decision was then made
to undertake a study focusing on the technical capacity of the farmers. Organizational aspects of
the milk collection centre to be eventually established were left to the community. This study was
facilitated by the Department of Agricultural Technical and Extension Services (Agritex) at both
provincial and local levels. According to DMB (1984), the local extension worker submitted a
list of 21 farmers who were interested in a milk collection project.
After assessment of the area in terms of the community profile and resource base, the DMB
concluded that a milk collection scheme had a good chance of success. Several factors considered
in the assessment were in favour of such a scheme (DMB 1988). Firstly, such a scheme had once
been requested before Zimbabwe’s war of liberation. Secondly, farmers were anxious to realize
income from one of their major assets (cattle) and were aware of the potential benefit of the
scheme. Thirdly, farmers were sufficiently motivated to undertake the formation of committees
to run the scheme and appointment of the necessary staff. Fourthly, Agritex reported that 75% of
farmers in the area were receptive to new ideas and lastly, the area was close to some big LSC
Page 290
274
dairy producers who were prepared to offer advice, bull service and possibly heifers (or
crossbreds) for sale to the neighboring community.
However, there were some factors that militated against the successful establishment of the milk
collection scheme. These included training and extension services for farmers, the question of
milking sheds and herd improvement and transport for those farmers who were fairly distant from
the milking centre (maximum of 10 km). The Dairy Act and Regulations that were enacted during
the colonial era were another major constraint in implementing the project in Marirangwe (DMB
1984). According to DMB (1984) it was considered neither feasible nor essential for each farmer
or group of farmers to bear the cost of constructing the type of milking facility that was prescribed
in the Act. The DMB recommended that before possible changes to the Act could be requested,
Marirangwe could be used as an experimental project to enable the research team to assess
problems likely to be encountered and changes to the Act that could be safely requested. Some of
the requirements of the Act were finally waived so that milk that did not necessarily comply with
the Act could be collected from Marirangwe. This was to enable the research team to collect
crucial experience based data on milk quality, optimal carrying distances, appropriate testing
procedures, sterilizing equipment, frequency of collection, seasonality of supply and others. This
enabled the Marirangwe small scale dairy scheme to proceed and it was envisaged there would
be a handover-takeover by farmers after two years. The milk collection centre (MCC) initially
catered for the local community’s fresh milk requirements and the surplus was marketed at the
DMB Harare Diary.
Major Policies during the Period 1980 to 2013
The period 1980 to 2013 has seen Zimbabwean economy undergoing major policy shifts. The
first ten years (1980 to 1989) were characterized by a single channel marketing system under
which statutory organizations operated for most of the major agricultural commodities, including
dairy (Muir 1994). The statutory organization responsible for dairy was the Dairy Marketing
Board (DMB), formed in 1952. The DMB had monopoly in the purchase, processing, distribution
and external trade of all dairy products. Government administered producer prices, and also set
both wholesale and retail prices. Prices were established pan-territorially, and pan seasonally.
However, milk producer prices were not set pan-seasonally as these were adjusted to take into
account changes in farmer feeding costs. According to Chidzero (1994) the major policy thrust in
the first ten years was to bring about social transformation which would positively redress the
socio-economic imbalance which existed prior to independence. Government therefore
introduced or reinforced price controls as part of the principle of growth with equity. However,
one of the implications of these price controls was the continued subsidization of marketing
boards. As a result the government between 1980 and 1990 paid the DMB an average of about
USD4 million (ZWD34 million at 1994 exchange rates) per annum direct consumer subsidies
(Muir 1994).
The problems with the subsidies in the first 10 years of independence was that they were not
targeted to particular groups of people, and therefore did not assist the people they were intended
to assist. The price controls at the same time also discouraged investors. Government in 1990 then
launched the Economic Structural Adjustment Programme (ESAP) which was aimed at
stimulating investment and economic activity. The policy reforms envisaged entailed moving
away from a highly regulated economy to one where market forces were expected to play a greater
role within the context of government objectives (Chidzero 1994). As part of these reforms, the
DMB was initially commercialized and later privatized in 1993, turning from losses to profits in
the same year. However, although the company achieved profits, these were achieved against low
producer prices and these were reflected in the steady decline in the LSC herd from 115,000 in
1993 to 82,000 head in 1999 (Muir 1994).
Page 291
275
The fast track land redistribution programme was launched in the year 2000. This period was
characterised by massive land occupations and economic decline and crisis (Moyo 2006). The
key elements of the fast track were speeding up of identification and compulsory acquisition of
land for resettlement, accelerating planning and demarcation of acquired land and settler
emplacement on the land, and providing basic infrastructure and farmer support services. The
effects of the fast track land redistribution programme, coupled with droughts, resulted in dairy
animals being sent for slaughter. Overall production in all sectors of the economy declined during
the period 2000 to 2008, including the dairy industry. During this period, dairy farmers were
forced to barter milk for stock feeds. The introduction of the government of national unity in
2009, coupled with the introduction of the multicurrency regime enabled the economy to slowly
rebuild.
Trends in National Milk Intake
The trend for national milk production shows that milk production steadily increased in the first
ten years (1980 to 1990), reaching a peak in 1991, and steadily declined from 1991 up to 2009,
when it started slowly going up (Figure 1). The peak production period was achieved in 1991 at
260 million litres. Since then, milk production has steadily declined, reaching a low of 37 million
litres in 2009. Although the decline started during the period the government implemented the
ESAP in the early 1990s, the fast track land redistribution programme also led to further decline
in dairy production in terms of milk production, number of producers and the total dairy herd
(Figure 1).
Figure 1. National milk intake (million litres
Effect of Policies on National Milk Intake
Analysis of Variance (ANOVA) results of national milk intake on policy periods shows that
policy periods had significant effects on milk production (p<0.1; F3, 28 =24.10; at 1%; and N=31).
This shows that the policies had an effect on national milk intake. The multiple comparison using
Tukey post hoc multiple comparison tests show that there was no significant differences in milk
intake during the single channel market period and ESAP, while there were significant differences
in national milk intake between the single channel market period and ESAP, and between the land
Page 292
276
reform and dollarization periods. These results are summarized in Figure 2 showing the
interactive bar graphs and the results of the multiple comparison tests.
Figure 2. Mean (±95% CL) national milk intake (million litres) for different policy periods
interactive.
Numbers in bars are subgroups based on multiple comparison tests.
Trends in Smallholder Milk Intake
The trends in smallholder milk intake show that it reached a peak in the year 1995 with about 3.6
million litres, and steadily declined up to the year 2000, when about 1.4 million litres of milk
were produced. From 2000 onwards, milk intake fluctuated and dropped significantly in 2008
when about 78 thousand litres were produced due economic challenges and hyperinflation. The
trend started showing a steady upwards trend from the year 2009 with the introduction of the
multi-currency system or dollarization (Figure 3).
Figure 3. Smallholder milk intake (million litres) 1988 - 2012
Effect of Policies on Smallholder Milk Intake
Page 293
277
The ANOVA produced the following results (p< 0.1; F 3,21 = 9,47 at 1%; N=24). These results
show that policies had an effect on smallholder total milk intake. Multiple comparison using the
Tukey post-hoc multiple comparison tests also show a significant difference between the single
channel market period and ESAP, ESAP and land reform period, and ESAP and dollarization,
while there were no significant differences between the policy periods land reform and single
channel market, dollarization and single market and dollarization and land reform. These results
are summarized in Figure 4.
Figure 4. Mean (±95% CL) smallholder milk intake in litres for different policy periods
interactive bars.
Numbers in bars are subgroups based on multiple comparison tests
Effects of Polices on Milk Intake of Selected Smallholder Dairy Schemes
In order to understand the effects of the policy frameworks periods on scheme level milk intake,
interactive bar graphs and ANOVA were performed for two smallholder dairy schemes of Rusitu
and Marirangwe. These schemes form some part of the early development of dairying in the
resettlement and small scale commercial areas, respectively. The results are shown in Figures 5
and 6 respectively.
Page 294
278
Figure 5. Mean (±95% CL) Rusitu dairy scheme milk intake in litres for different policy
periods. Interactive bars.
Numbers in bars are subgroups based on multiple comparison tests.
Figure 6. Mean (±95% CL) Marirangwe dairy scheme milk intake in litres for different policy
periods interactive bars.
Numbers in bars are subgroups based on multiple comparison tests
ANOVA results for Rusitu (p=0.05; F 3,19 = 3.128; N=22) and Marirangwe (p=0.08; F 3,18 = =
2.65; N = 22) smallholder dairy schemes indicate that there were no significant differences in the
policy periods at 1%. Multiple comparison using the Tukey multiple comparison tests for both
Rusitu and Marirangwe show that there were no significant differences in the four policy periods
of single channel market, ESAP, land reform and dollarization.
Discussion
Effect of Policies on National Milk Intake
The results of the effects of policies on national milk intake explain some of the major policies
and investments that have gone into dairy production over the period. During the period 1980 to
Page 295
279
1990, Government of Zimbabwe (GoZ) in February 1983 through an agreement with Norway
received a donation of bulk milk tanks, which led to the creation of the bulk milk collection
scheme. The aim was to modernize and stimulate milk production from the LSC producers (AMA
1987). According to the AMA (1987) the bulk milk collection scheme signaled a significant
investment in the existing dairy industry and played a major role in encouraging new farmers to
enter the industry. By the end of June 1987, 318 tanks were operational and 70% of milk intake
was collected through the bulk milk scheme. A further agreement was signed between GoZ and
Norway in 1987 for the supply of an additional 200 farm tanks. It was expected that with the
supply of the additional 200 tanks, 95% of the milk would be handled through the scheme. Large
Scale Commercial farmers participating in the bulk milk scheme would lease the bulk farm tanks
from the DMB and pay rental charges. The rentals money generated from the scheme was
designed for developing the dairy industry in small scale commercial and communal farming
areas, and the rentals were supposed to be over a 15 year period. The bulk milk tanks rentals were
instrumental in financing the early development of the smallholder dairy schemes and were
supposed to generate USD 2.3 million (Z$12.6 million at 1992 exchange rates) over the 15 year
period (DDP 1992). Cumulatively, for the period 1984 to 1991, USD0.7 million (Z$3.4 million
at 1991 exchange rates) of counterpart funds had been used to finance the development of
smallholder dairy, with USD0.9 million (Z$4.6 million) from Norwegian Agency for
Development Cooperation (NORAD), government USD185,882 (Z$948,000), other donors
USD29,803 (Z$152,000) and farmers USD135,490 (Z$ 691,000).
According to the AMA (1987), due to the improvements in the dairy industry the DMB in 1986/87
season purchased 224 million litres of milk from producers which exerted severe pressure on the
DMB’s handling capacity. The AMA (1987) also reports that while the urban market was well
supplied with milk, it was estimated that there was a shortage of milk in rural areas of about 145
million litres per annum. This prompted government to task the then Dairy Coordinating
Committee within the Ministry of Lands, Agriculture and Rural Resettlement to develop a
strategy for the dairy industry which incorporated the peasant sector as part of the productive
base. The peasant sector then had only two operational schemes of Chikwaka in the communal
and Marirangwe in the small scale farming areas. This led to further developments in the
smallholder dairy programme and by 1987; there were several other dairy projects at various
stages of development. These were located at Tsonzo, Nharira, Lancashire, Zvimba, Guruve, and
Chitomborwizi. Each project involved research, pasture and forage management on a
demonstration plot aimed at improving dairy production, installation of milking sheds and milk
collection centres (AMA, 1988).
During the ESAP period, a number of dairy producers and cooperatives were registered and these
competed directly with the privatized Dairibord Zimbabwe Limited (DZL). However, overall
milk production continued to decline as efforts were continued to build the smallholder dairy
sector. During the fast track land reform that started in 2000, the number of registered large scale
commercial dairy producers reduced from 314 in 2000 to 135 in 2011 (LMAC, 2012). The
numbers of female dairy cattle were reduced from about 70,000 in 2000 to about 23,000 in 2011.
According to DZL (2009) the number of dairy animals at peak was estimated at 200,000.
According to USAID (2007), during this period GDP in constant prices over the five years to
2006 contracted at an annual rate of 5.8%, which was among the world’s worst performance. This
decline in economy continued to the year 2008, which was characterized by hyperinflation.
Effect of Policies on Smallholder Milk Intake
The smallholder results explain the effects of policy on dairy production during the period 1980
to 2013 in the smallholder areas. Since the results show that there were no significant differences,
this indicates that they may be other factors other than policies that affect milk production at the
Page 296
280
smallholder dairy scheme level. It is important to note that in the smallholder areas, milk intake
does not reflect production as approximately 30 to 40% of milk produced by farmers is assumed
retained for home consumption and calf rearing needs (Dube 2008). Smallholder dairy only
started in 1983 with financing from funds generated from the bulk milk collection scheme
introduced in the same year, hence the birth of the DDP programme. The DDP acted as the
implementing body of dairy development projects in communal, resettlement, and small scale
commercial farming areas (AMA 1988). The role of the DDP since its formation has been to
facilitate the infrastructural and training needs of the farmers. In April 1989, the DDP was
transferred from the DMB to the Agricultural and Rural Development Authority (ARDA).
According to the DDP Phase II strategy (July 1988 to October 2003), this was necessitated by the
redefinition of the mandates of parastatals in preparation for the Economic Structural Adjustment
programme (ESAP) which was launched in 1990. This necessitated the transfer since DMB was
regarded a milk processing organization, hence the transfer to ARDA which is an agricultural
development organization. ULG Consultants (1994a) cite the concentration of the DMB on the
commercial side of its operations as necessitating the transfer. Also, the fact that ARDA had been
operating the Rusitu small scale dairy resettlement scheme since 1983 with assistance from the
Overseas Development Association (ODA) made it a suitable home for DDP. DDP (1989) further
proposed the integration of DDP and Rusitu because both schemes dealt with milk production by
small scale farmers. The integration of Rusitu brought the number of dairy schemes under ARDA
to 10. In addition there was Nyarungu Training Centre dairy scheme which catered specifically
for the training needs of smallholder farmers.
When DDP was transferred to ARDA, there were successful negotiations which led to NORAD
directly funding DDP to the tune of NOK 25 million (about USD1.2 million at 1998 exchange
rates) for the period 1990 to 1997. According to ULG Consultants (1994b), the development
model used by DDP had been tested and tried in other countries and adapted to the Zimbabwe
situation. The model used has the following characteristics:
(1) DDP moves into an area at the request of the local community to assess the potential for milk
production and the interest of the community to come together as a group to produce and sell
milk;
(2) Using the team approach, DDP then organizes participants into a group, then mobilizes the
input supplies (including finance and dairy animals), services and milk collecting infrastructure
required to produce and market milk surplus to domestic needs through the group milk centre
(which is usually a bulk milk tank and feed store in a small building);
(3) The support also includes assistance to manage the group, to construct milking sheds, to rent
a bulk milk tank from the National Dairy Cooperative (NDC) and if appropriate to acquire other
processing equipment;
(4) The Ministry of Agriculture Dairy Services licensing has also been modified to accommodate
such small scale groups treating the group as one producer-retailer;
(5) Each member producer has to have a small milking shed or parlour, or access to a shed or
parlour for milking the cows. The specifications of the milking parlour required have also been
modified by Dairy Services to accommodate smallholder dairying.
According to ULG (1994b), members have a say in how the group is organized. DDP usually
would first encourage members to form an association, which would give the group legal status.
DDP, with assistance from Agritex would then train the members in milk production and farm
management, and provide extension services during the start-up phase. Initially, members would
Page 297
281
start with indigenous cows, progressing to crosses and pure breeds as they gain management
experience.
The DDP (1989) indicates that although the key to the dairy programme is appropriate technical
skills and the establishment of a milk marketing infrastructure (especially the multi-purpose milk
centres for handling milk, etc.), the DDP is broad based programme designed to develop people
through the initiation of a development process rather than purely the development of cows. This
broad based approach could possibly explain why there have been various factors constraining
the development of smallholder dairy in Zimbabwe. This is mainly because the main focus of
DDP is not 100% dairy development, but focusing on a multifaceted development programme.
The development projects that have been piloted by the DDP in all the provinces are supposed to
form a nucleus identified through government multi-agencies in terms of potential for sustaining
multifaceted development programme (DDP 1989).
The development model used by ARDA has largely been followed, although there were no new
dairy schemes established during the period 2000 to 2008. There are currently a total of 20
smallholder dairy schemes countrywide (excluding Nyarungu Training Centre dairy scheme). An
additional eight potential dairy schemes have been identified but these are not yet operational
because there has been no infrastructural development for the dairy schemes.
Conclusions
The key finding from this study is that milk production has been decreasing over time.
Although during the ESAP period, national milk production increased, it decreased during
the subsequent periods.
There is therefore need to capacitate both the smallholder and large scale farmers in order
for them to increase production.
This could be achieved through dairy production incentives. Although there are now a
total of 20 smallholder dairy schemes countrywide, some are currently not functional due
to a number of constraints. This calls into question the DDP dairy development model.
The DDP development model is broad based, suitable for multifaceted rural development
and may therefore not be suitable for dairy development. Smallholder dairy has therefore
not made a significant impact in terms of its contribution to national milk intake, and
contribution to the national economy.
There is need therefore, to reassess the development of smallholder dairy and value chain
development in order to unpack the potential contribution of this subsector to the national
economy.
Acknowledgements
A PhD thesis grant from the Africa Economic Research Consortium (AERC) based in Nairobi is
greatly acknowledged. However, the views expressed in the paper reflect the authors’ views, and
not of any other person.
References
Page 298
282
AMA 1987 Economic Review of the Agricultural Industry of Zimbabwe Harare Zimbabwe
Agricultural Marketing Authority.
AMA 1988 Economic Review of the Agricultural Industry of Zimbabwe. Harare Zimbabwe
Agricultural Marketing Authority.
Chidzero B 1994 Macro-economic Adjustment and Trade Liberalization.
In Zimbabwe’s Agricultural Revolution. Eds. Rukuni M and C K Eicher. University of Zimbabwe
Publications.
Chavhunduka G L 1982 Report of the Commission of Inquiry into the Agricultural Industry To
the President 1982 Zimbabwe.
Dairy Development Programme (DDP) 1989 Proposal for the Women in Dairy Development
1986/87 – 1990/91 Draft WIDD Plan March 1989 DDP Harare Zimbabwe.
DDP 1992 NORAD Technical Review Mission Zimbabwe Dairy Development Programme
Harare.
DDP 1990-1998 Completion Report on Phase I 1990 – 1998 Agricultural and Rural Development
Authority DDP ZIB 017.
DDP 1991/92 Annual Report 1991/92 Agricultural and Rural Development Authority Dairy
Development Programme DDP Harare Zimbabwe.
DDP 1992/93 Annual Report 1992/93 Dairy Development Programme. DDP Harare Zimbabwe.
DDP 1997 DDP Annual Report Harare Zimbabwe.
DDP 1998/99 Annual Report 1998/99 Agricultural and Rural Development Authority. Dairy
Development Programme. DDP Harare Zimbabwe.
DDP 1995 In DDP Files 1995 to 2012 Summary History of the Chikwaka Kubatana Milk Centre.
DDP 1999 Heifer Project International Assisted Projects Chikwaka Dowa Honde Nharira and
Zvimba Nyarungu Training Centre Harare Zimbabwe.
DDP 2007 Dairy Development Programme An Overview DDP 13-04-07 Harare Zimbabwe.
DDP Phase II Strategy (July 1998 – October 2003) Final Report Harare Zimbabwe.
DDP 2010 DDP Position Paper Dairy Development Programme Nyarungu Training Centre
Harare Zimbabwe.
DDP 2013 ARDA – DDP Monthly Report March 2013 DDP Harare Zimbabwe.
Dube D 2008 Analysis of Programmes to Enhance Milk Production from the Smallholder Sector:
In The Livestock Sector After the Fast Track Land Reforms in Zimbabwe Eds. Khombe CT and
Ndlovu L R Bulawayo Zimbabwe: Institute for Rural Technologies and National University of
Science and Technology.
Page 299
283
Dairy Marketing Board (DMB) 1984 Potential for Milk Collection in Marirangwe Small Scale
Commercial Farming Area January 1984 Harare Zimbabwe.
DMB 1988 Monitoring Report for the Chikwaka Kubatana Dairy Project for the Period 1983-
1988 February 1988 Harare Zimbabwe.
Dairibord Zimbabwe Limited (DZL) 2009 Annual Report Harare Zimbabwe: Dairibord
Holdings Limited.
Government of Zimbabwe 1987 Review of Dairy Development in Zimbabwe Harare
Zimbabwe.
LMAC (Livestock and Meat Advisory Council) 2012 Livestock and Meat Advisory Council
2012 Annual Report Harare Zimbabwe.
MAMID (Ministry of Agriculture Mechanisation and Irrigation Development)
2014 Livestock Development Programme MAMID April 2014 Harare Zimbabwe.
Moyo S 2006 The Evolution of Zimbabwe’s Land Acquisition: In Zimbabwe’s Agricultural
Revolution Revisited Eds Rukuni M, Tawonezvi P, Eicher C, with Munyuki -Hungwe M and
Matondi P Zimbabwe University of Zimbabwe Publications.
Muir K 1994 Agriculture in Zimbabwe In Zimbabwe’s Agricultural Revolution Eds Rukuni M
and C K Eicher University of Zimbabwe Publications.
Muir-Leresche K and Muchopa C 2006 Agricultural Marketing: In Zimbabwe’s Agricultural
Revolution Revisited Eds Rukuni M, Tawonezvi P, Eicher C with Munyuki-Hungwe M and
Matondi P Zimbabwe University of Zimbabwe Publications.
Mupeta B 2000 Studies on the Potential of Ram Press Sunflower Cake (Helianthus Anus) as a
Source of Protein for Moderate Milk Production in Cross Bred (Bos Taurus and Bos Indicus)
Cows in the Smallholder Dairy Sector of Zimbabwe DPhil Thesis Harare Zimbabwe University
of Zimbabwe.
Muzuva N S 1989 A Research into Farmers Training Needs in Dairy Development Programme
Research Project University of Zimbabwe.
NewsDay 2012 Dairibord Revenues Up August 10 2012 In Business Companies NewsDay
Zimbabwe.
ULG Consultants 1994a Support for the Deregulation of the Dairy Industry – Zimbabwe.
Volume 1 Main Report and Executive Summary Republic of Zimbabwe, Ministry of Lands,
Agriculture and Water Development.
ULG Consultants 1994b Support for the Deregulation of the Dairy Industry – Zimbabwe
CNTR/93/2060A Working Paper 4 Smallholder Dairying Zimbabwe.
USAID 2007 Zimbabwe Economic Performance Assessment: A Benchmark Study Produced by
Nathan Associates for Review by the United States Agency for International Development
September 2007.
Page 300
284
USAID 2012 Zimbabwe Agricultural and Rural Livelihood Financial Market Assessment
Produced for Review by USAID Prepared for UASID by Weidemann Associates Inc.
Zimbabwe Government 1981 Growth with Equity: An Economic Policy Statement Harare
Zimbabwe Government Printer.
ZimStat 2013 Poverty and Poverty Datum Line Analysis in Zimbabwe 2011/12 April 2013
Harare Zimbabwe.
Received 30 March 2016; Accepted 28 April 2016; Published 2 June 2016
Go to top
Paper 2: T. Chamboko, E. Mwakiwa and P.H. Mugabe. 2017. Determinants of Milk Market
Participation and Volume of Sales to Milk Collection Centres of the Smallholder Dairy Value
Chain in Zimbabwe
Journal of Agricultural Science; Vol. 9, No. 10; 2017 ISSN 1916-9752 E-ISSN 1916-9760
Published by Canadian Center of Science and Education
Determinants of Milk Market Participation and Volume of Sales to Milk Collection
Centres of the Smallholder Dairy Value Chain in Zimbabwe
Tafireyi Chamboko1, Emmanuel Mwakiwa1 & Prisca H. Mugabe2 1 Department of Agricultural Economics and Extension, University of Zimbabwe, Harare,
Zimbabwe
2 Department of Animal Science, University of Zimbabwe, Harare, Zimbabwe
Correspondence: Tafireyi Chamboko, Department of Agricultural Economics and Extension,
University of Zimbabwe, P.O. Box MP 167, Mount Pleasant, Harare, Zimbabwe. Tel: 263-4-303-
211. E-mail: [email protected]
Received: July 12, 2017
Accepted: August 16,
2017
Online Published: September
15, 2017
doi:10.5539/jas.v9n106 URL: https://doi.org/10.5539/jas.v9n10p156
The research is financed by African Economic Research Consortium (AERC) based in Nairobi,
Kenya. Abstract At the attainment of Zimbabwe’s independence, government of Zimbabwe established the
smallholder dairy development programme to encourage smallholder farmers to participate in
formal milk markets. Although now more than three decades since the government established
this programme, smallholder contribution to the national formal market remains low at 5%. This
study was undertaken to determine factors affecting milk market participation and volume of sales
to milk collection centres of the smallholder dairy value chain. Four smallholder dairy schemes
were purposively selected on the basis of whether the scheme participated in the semi-formal or
formal dairy value chain. A total of 185 farmers were then selected through simple random
Page 301
285
sampling and interviewed using a pretested structured questionnaire. Data were analysed using
descriptive statistics and Heckman two-stage selection econometric models. Results show that
resources (represented by dairy cows, household size), knowledge (educational level, access to
information and extension), experience (household head age) and agro-ecological region
significantly determined farmers’ participation in milk markets. The study also shows the
determinants of milk sales volumes to be resources (number of dairy cows and landholding size);
market access (distance to milk collection centre); ambition of the farmer (age); and natural
climatic conditions (agro- ecological region). Government policy interventions therefore need to
be targeted at increasing the number of dairy cows, taking into account landholding and market
access, targeting educated, young farmers located in agro-ecological regions I and II, providing
them with adequate, appropriate information and extension packages in order to enhance milk
market participation and volume of sales. Keywords: dairy scheme, formal, Heckman two-stage model, semi-formal, southern Africa 1. Introduction At the attainment of Zimbabwe’s independence in 1980, large scale commercial farmers supplied
all the milk that entered the formal markets. Milk produced by smallholder farmers was mainly
for subsistence purposes (Chavhunduka, 1982). The government of Zimbabwe established the
smallholder dairy development programme in 1983 to encourage smallholder farmers to
participate in formal milk markets (Chamboko & Mwakiwa, 2016). By 2016, the smallholder
dairy development programme was credited with facilitating the establishment of about 20
smallholder dairy schemes located in various parts of the country. These schemes have provided
an avenue through which smallholder farmers participate in dairy production and marketing. A
distinct feature of the smallholder dairy schemes are the milk collection centres and sub-centres
that are run by farmer managed marketing cooperatives. The milk collection centres are
responsible for bulking up the milk from the producers and are equipped with cooling facilities.
Through the support of government and donors over the years, some of the milk collection centres
have acquired and established milk processing facilities and are able to process the milk to
produce mainly fermented milk (Amasi) and yoghurts. Smallholder dairy schemes that process
milk at the milk collection centre participate in the semi-formal value chain, whereby the milk
and milk products
jas.ccsenet.org Journal of Agricultural Science Vol. 9, No. 10;
2017
produced are largely sold to consumers within the local community in the rural areas and to nearby
rural service centres or rural growth points. There are also smallholder dairy schemes that do not
process the milk at the milk collection centre but deliver the milk to established urban based
processors. These urban based dairy processors process the milk into various products such as
Ultra-high temperature processing (UHT) milk, cheese, yoghurts, and dairy related beverages
which are predominantly sold to consumers in the urban areas. The milk collection centres of the
smallholder dairy schemes that supply milk to urban based processors participate in the formal
dairy value chain. The smallholder dairy value chain therefore predominantly is comprised of the
semi-formal and the formal dairy value chains. Although it is now more than three decades since the government of Zimbabwe established the
smallholder dairy development programme and subsequent smallholder dairy schemes and milk
collection centres, milk delivered to the milk collection centres has not had significant impact on
national volumes, only contributing 5% of the milk entering the formal markets. This is unlike
other developing countries similar to Zimbabwe such as Kenya, where 80% of the milk entering
Page 302
286
the formal markets comes from smallholder farmers (Moll, Staal, & Ibrahim, 2007). According
to Muriuki and Thorpe (2002), in Eastern and Sothern Africa, with the exception of Zimbabwe
and South Africa, dairy production is dominated by smallholder farmers. A number of studies
have been carried out particularly in Eastern and Northern Africa to understand milk market
participation and volume of supply to markets ( e.g., Demissie, Komicha, & Kedir, 2014 in
Ethiopia; Balirwa, Nalunkuuma, & Sserunkuuma, 2016 in Uganda). These studies indicate
important socio-economic variables that are relevant in informing the development of
interventions to improve market participation and productivity, which ultimately increases
volume of milk sales from smallholder dairy producers. There is, however a paucity of milk
market participation and volume of supply studies that have been performed in Southern Africa.
This study therefore contributes to the literature on milk market participation and volume of
supply studies. The objective of this study therefore is to assess the determinants of milk market
participation and volume of milk sales to the milk collection centres of the smallholder dairy value
chain in Zimbabwe in order to inform the development appropriate interventions that can enhance
smallholder farmers’ milk market participation and improvement in the volume of milk sales. 2. Method 2.1 Description of Study Areas Four smallholder dairy schemes under the dairy development porgramme were purposively
selected on the basis of whether there was milk collection centre processing (to supply the semi-
formal value chain), linkages with established urban based processors (to supply the formal value
chain), farming system (Note 1), agro-ecological or natural region (NR) (Note 2) location of the
scheme, and performance in terms of daily deliveries of milk to the milk collection centre. Two
schemes participating in the semi-formal value chain selected were Chikwaka and Nharira-
Lancashire, and two supplying the formal value chain were Marirangwe and Rusitu smallholder
dairy schemes. The characteristics of the selected study sites are summarized in Table 1.
Table 1. Characteristics of smallholder dairy schemes selected for the study, Zimbabwe 2015
Smallholder Dairy
Scheme Chikwaka
Nharira-
Lancashire Marirangwe Rusitu
Value Chain Participates in Participates in
Supplies
Formal
Supplies Formal value
chain
semi-formal semi-formal value chain
Milk Processing
Milk
collection
Milk
collection
Delivered to
processors
Delivered to
Dairibord Zimbabwe
centre
processing
centre
processing
(based in the
capital city
limited (privatised
company of the
of Harare)
former state run Dairy
Marketing
Board)
Agro-ecological
location of the NR II NR III NR II NR I
scheme or natural
region (NR)
Farming system Communal
Encompasses
both
Small scale
commercial Old resettlement area
Communal
and Small
scale
Page 303
287
commercial
Total milk
deliveries to
Average 200
litres/day
Average 200
litres/day
Average 400
litres/day
Average 600
litres/day
milk collection
centre
jas.ccsenet.org Journal of Agricultural Science Vol. 9, No.
10; 2017
2.2 Sampling Techniques The lists of all members of the smallholder dairy schemes were obtained from the milk
collection centres. The list included producers who were and those who were not delivering
milk at the time of the study. These lists formed the sampling frames for the sample survey.
The samples were selected from lists of 65 producers in Chikwaka, 125 producers in Nharira-
Lancashire, 35 in Marirangwe and 245 in Rusitu. The objective was to interview at least 50
producers from each smallholder dairy scheme within the given time frame and available
research resources. Simple random sampling was used to select the sample of farmers included
in the study. Since the sampling frame for Marirangwe smallholder dairy scheme had less than
50 households, the sample of farmers included in the study were all the producers in the
sampling frame. The total number of households interviewed in the four smallholder dairy
schemes was therefore 185 farmers. This sample provides a cross section of farmers to
represent determinants of market participation and volume of sales to the milk collection
centres of the smallholder dairy value chain under different farming systems, agro-ecological
potentials and varying scheme performance levels. 2.3 Data Collection Methods Quantitative and qualitative data were collected from both primary and secondary sources.
Primary data collected related to milk production and marketing in the smallholder dairy
schemes while secondary data collected included statistics on milk deliveries to the milk
collection centres and processors. The main sources of secondary data included the Zimbabwe
National Statistics Agency (ZimStats), Department of Economics and Markets (from the
Ministry of Agriculture, Mechanisation and Irrigation Development), Farmer Unions, Dairy
processors such as Dairibord Zimbabwe Limited, Kefalos and the milk collection centres under
the smallholder dairy development programme. Secondary data were also collected from Dairy
Services which regulates the dairy industry, Zimbabwe Association of Dairy Farmers, and the
Zimbabwe Dairy Industry Trust. The main source of primary data included key informant interviews, focus group discussions
and a survey of households of member farmers of the milk collection centres under the
smallholder dairy schemes of the dairy development programme. Key informant interviews
targeted the major stakeholders in the dairy industry and these included government
institutions, private processors, milk collection centre staff and experienced farmers from the
target smallholder dairy schemes. One focus group discussion per smallholder dairy scheme
was held with representatives of smallholder dairy farmers. The household survey used a
questionnaire that was pretested in Chikwaka smallholder dairy scheme, one of the study sites.
The questionnaire collected data on household demographic characteristics, socio-economic
data, inputs, milk production and sales, dairy herd data, access to information, extension
services and credit, and milk market participation, among others. The data were collected by
trained enumerators’ during the period August to October 2015.
Page 304
288
2.4 Data Analysis Data entry was performed in Census and Survey Processing (CSPro) version 6.1, and was
exported to and analysed using Statistical Package for the Social Sciences (SPSS) and STATA.
Descriptive statistics were used to summarise household socio-economic and demographic
characteristics. In order to describe the characteristics of households in the four schemes,
producers selling milk to the milk collection centre at the time of the study were considered as
milk market participants and those who did not as non- market participants. The Heckman two-
step selection econometric models were used to analyse the determinants of milk market
participation and volume of sales to the milk collection centre. The specification of the
econometric models used in the study followed literature on empirical studies of selectivity
models (Goetz, 1992; Key, Sadoulet, & De Janvry, 2000; Holloway, Nicholson, Delgado,
Staal, & Ehui, 2004; Bellemare & Barrett, 2006). The Heckman two-step is part of the
selectivity models, in which the decision to participate in milk markets can be seen as a
sequential two -stage decision making process. In the first stage, households make a discrete
choice on whether to participate or not to participate in milk markets (that is, whether to deliver
milk or not to the milk collection centre). In the second stage, conditional on their decision to
participate, households make continuous decisions on volume of milk sales to the milk
collection centre. In the first stage, the standard probit model which follows random utility
model and specified as Wooldridge (2002) is used:
y* = z’α + ε1
y = 1, if y* > 0; y = 0 if y* ≤ 0 (1) Where, y* is a latent (unobservable) variable representing household discrete decision to
participate in milk market or not. z’ is a vector of independent variables hypothesized to affect
household decision to participate in milk market. α is a vector of parameters to be estimated
which measures the effects of the explanatory variables
jas.ccsenet.org Journal of Agricultural Science Vol. 9, No.
10; 2017
on household’s decision. ε1 is normally distributed disturbance with mean (0) and standard
deviation of б1 and captures all unmeasured variables. Y is a dependent variable which takes
on the value 1 if a household participates in milk market and 0 otherwise. Conditional on milk
market participation, variables affecting the volume of milk sales to the milk collection centre
were then modeled using the second-stage Heckman selection model (Heckman, 1979). The
Heckman selection equation is specified as follows:
Zi* = wiα + ε2
Zi = zi* if zi* > 0; Zi = 0 if zi* ≤ 0 (2)
Where, Zi* is the latent variable representing optimal volume of milk sales to the milk
collection centre, which is observed if zi* > 0 and unobserved otherwise. Zi is the observed volume of milk sold to the market, wi is the vector of covariates for unit i for selection equation
which is a subset of z’, α is the vector of coefficients for selection equation and ε2 is the random disturbance for unit i for selection equation. One of the problems with the two Equations (1)
and (2) is that the two-stage decision making processes are not separable due to unmeasured
household variables affecting both discrete and continuous decisions thereby leading to errors of the equations. If the two errors are correlated, the estimated parameter values on variables
affecting volume of milk sales are biased (Wooldridge, 2002). Thus the model that corrects selectivity while estimating volume of milk sales needs to be specified. For this purpose, in
the first-step, Mills ratio is created using probability values obtained from the first-stage probit regression of milk market participation. Then in the second-step, the Mills ratio is then
Page 305
289
included as one of the independent variables in volume of milk sales regression. Thus volume
of milk sales equation with correction for sample selection bias becomes:
V = wα + λ[ф(wiα)/Ф(wiα)] + ε3 (3) Where, ф(.)/Ф(.) is the Mills ratio, λ is the coefficient on the Mills ratio, ф denotes standard normal probability density function, Ф denotes the standard cumulative distribution function and ε3 is normally distributed disturbance term with zero mean and standard deviation of б3, and ε3 is not correlated with ε1 and ε2 and other independent variables. Under the null hypothesis of no sample selection bias, λ is not significantly different from zero. In this study, V is volume of milk sales in litres. The independent variables were identified based on economic theories and empirical studies
as follows (Table 2).
Table 2. Description of dependent and independent variables used in Heckman two-step
selection model
Variable Description
Values, Expected
Sign
Age (Agehh) Age of household head in years
Number of years,
±
Educational level (Educhh) Educational level of head of household
Number of years in
school, +
Sex (Sexhh)
Sex of household head (Dummy: 1 = male;
0 = female) +
Household size (hhsize) Number of household members Number, +
Distance to market
(DistkmMCC) Distance to the milk collection centre Km, -
Access to extension
(AccExt)
Access to extension services in the dairy
schemes +
(Dummy: 1 = yes; 0 = no)
Access to information
(AccInfo)
Access to dairy enterprise information
(Dummy: 1 = yes; 0 = no) +
Dairy farming experience
(Dexp)
Dairy farming experience of the head of
household
Number of years,
+
Total land holding of the
household (Landho) Total size of land holding of the household Hectares, +
Total number of dairy cows
(TotCows)
Total number of dairy cows owned by the
household Number, +
Income from other sources
(InOthSou) Income from other sources USD
Farmer occupation (FarOcc)
Occupation of the farmer (Dummy: 1 =
fulltime farmer; 0 = otherwise) +
Agricultural training
(AgriTr)
Agricultural training of the head of
household +
(Dummy: 1 = Received some training in
agriculture; 0 = otherwise)
Agro-ecological or natural
region (NRDSch)
Agro-ecological location of the smallholder
dairy scheme ±
of the household (Dummy: 1 = Natural
region I or II; 0 = otherwise)
Milk sold
Volume of milk sales to the milk collection
centre Litres/month
Market Participation Farmers producing and selling milk to the
Page 306
290
milk collection centre
(Dummy: 1 = yes; 0 = no)
jas.ccsenet.org Journal of Agricultural Science Vol. 9, No. 10;
2017
3. Results 3.1 Socio-Economic and Demographic Characteristics of Milk Market Participants and Non-
Participants About 87% of the 185 smallholder dairy producers interviewed were classified as
market participants. The characteristics of households show that average age of the
household head was about 57 years for market participants group and about 60 years
for non-market participants group. The independent samples t-test for age was not
significant between the two groups. The independent t-test for educational level of the
household head, number of extension visits to the farm, total size of land holding of the
household, size of household in terms of average number of household members,
income from other sources, total number of dairy cows owned by the household and
the volume of milk sales to the milk collection centre were significant at the 5% level
of significance between participants and non-participants (Table 3). The Chi-square
test for categorical variables shows that only access to information and the agro-
ecological region location of the smallholder dairy scheme of the household were
statistically significant between market participants and non-market participants (Table
3).
Table 3. Socio-economic and demographic characteristics of milk market participants and
non-participants
Variables
Mean value of
variables
Market
Participant Non-Participant t-value
Age of household head (years) 56.60 60.30 -1.249
Educational level (number of years in
school) 8.98 7.50 2.172*
Distance to milk collection centre
(Km) 5.30 6.20 0.872
Number of extension visits to the
farm 12.50 3.60 4.794*
Dairy farming experience (years) 16.80 16.30 0.216
Total size of arable land (Ha) 8.30 2.10 4.492*
Household size 6.30 5.30 2.031*
Total number of dairy cows owned 4.60 1.40 6.946*
Income from other sources 3248.00 1656.00 1.986*
Milk sold per month (litres) 515.17 0.00 7.114*
Chi-square
value
Sex of head of household
Page 307
291
% Males 73.90 73.90 0.000
Access to extension services
% Yes 96.90 100.00 0.734
Access to information
% Yes 75.80 26.10 23.469*
Farmer occupation
% fulltime 81.9 78.3 1.74
Agricultural training
% received some training in
agriculture 55.3 47.8 0.451
Agro-ecological region
% in NR I and II 68.9 100 9.808* Note. * Statistical significance at 5%. 3.2 Results of the Heckman Model The results of the first-stage of the Heckman two-step model show that of the 14
variables included in the model, seven variables explained the probability of milk
market participation. These were total number of dairy cows owned by the household
(TotCows), educational level of the head of household (Educhh), age of the head of
household (Agehh), size of household (hhsize), access to information (AccInfo), access
to extension services (AccExt), and the agro-ecological location of the smallholder
dairy schemes of the household (NRDSch). The variables were positive and significant
(Table 4).
jas.ccsenet.org Journal of Agricultural Science Vol. 9, No. 10;
2017
Table 4. Results of first and second stage Heckman models
Variable
First stage model
Second stage Heckman
selection
Coefficie
nt
Standard
Error z P>|z|
Coefficie
nt
Standard
Error z P>|z|
TotCows 0.0063 0.0032 1.97
0.049*
* 0.4693 0.1636 2.87 0.004*
DistkmMC
C 0.0016 0.0016 1.02 0.308 -0.1873 0.0649
-
2.89 0.004*
Educhh 0.0149 0.0025 5.48 0.000* -0.0836 0.0890
-
0.94 0.348
Agehh 0.0037 0.0007 5.53 0.000* -0.0604 0.0268
-
2.25
0.024*
*
Sexhh 0.0114 0.0176 0.65 0.516 0.2836 0.5302 0.53 0.593
hhsize 0.0072 0.0024 3.02 0.003* 0.0618 0.0841 0.73 0.463
Dexp 0.0005 0.0010 0.47 0.641 -0.0262 0.0278
-
0.94 0.346
LandHo -0.0007 0.0005 -1.28 0.202 0.5578 0.2414 2.31
0.021*
*
AccInfo 0.0491 0.1827 2.69 0.007* 0.6216 0.4763 1.31 0.192
AccExt 0.4656 0.0452 10.3 0.000* 6.0513 2.1499 2.81 0.005*
Page 308
292
1
IncOthSou 0.0000 0.0000 0.37 0.711 0.0003 0.0002 1.30 0.193
FarOcc 0.1681 0.0204 0.82 0.411 0.6840 0.6979 0.98 0.327
AgriTr 0.0184 0.0158 1.16 0.245 -0.6652 0.5535
-
1.20 0.229
NRDSch 0.0640 0.0206 3.10 0.002* -3.4258 1.5765
-
2.17
0.030*
*
Lambda 0.0791 0.0369 2.14
0.032*
* Note. First stage dependent variable = Market participation through delivering milk to the milk
collection centre; Second stage dependent variable = Volume of milk sales to the milk collection
centre per month in litres. Number of observations =144, Censored observations = 17, Uncensored observations = 127. First stage Wald Chi2 = 16 181.68, Prob > Chi2 = 0.0000; Second stage Wald Chi2 = 2024.26,
Prob > Chi2 = 0.0000, Rho = 1.00000, Sigma = 0.079 621. *, ** Statistical significance at 1% and 5%, respectively. The results of the second-stage Heckman selection estimation model for volume of milk sales
to the milk collection centre of the smallholder dairy value chain show that out of the 14
variables six variables significantly affected the volume of milk sales to the milk collection
centre. Total number of dairy cows owned by the household (TotCows), landholding size of the
household (LandHo), and access to extension (AccExt) were positive and significant, while
distance to the milk collection centre (DistkmMCC), age of the household head (Agehh), and
agro-ecological region of the smallholder dairy scheme of the household (NRDSch) were
negative and significant (Table 4). 4. Discussion 4.1 Socio-Economic Characteristics of Milk Market Participants and Non-Participants Milk market participants sold milk to the milk collection centre, while the remaining households
did not participate in the market. The milk collection centre forms an important stage of the
smallholder dairy value chain. At two of the schemes studied (Chikwaka and Nharira-
Lancashire), milk is processed on site at the milk collection centre and the dairy products are
sold directly to consumers in the local area or nearby growth points and urban areas (regarded
as the semi-formal value chain). Part of the milk is sold as raw milk to the local community or
as fermented milk (Amasi). In the milk collection centres supplying the formal value chain
(Marirangwe and Rusitu) the milk is collected by urban based processors who produce a number
of products that are sold mainly to urban based consumers. Therefore participating in the semi-
formal or formal value chain offers potentially better incomes for smallholder dairy producers. The socio-economic characteristics of milk market participants and non-participants show that
the age of the head of household was not significant but was lower for market participants (57
years) compared to non-market participants (60 years). The mean educational level of the
household head in terms of number of years in school for market participants was higher (9
years) compared to non-market participants (8 years). The t-statistic value indicated the mean
difference in educational level was statistically significant and positive at 5% level. This
indicates the importance of education in understanding and decision making of smallholder
dairy producers in terms of market orientation. The results are consistent with the findings of
Kuma, Baker, Getnet and Belay (2014).
jas.ccsenet.org Journal of Agricultural Science Vol. 9, No. 10;
Page 309
293
2017
The mean distance to the milk collection centre was 5.3 Km for milk market participants
compared to non-market participants (6.2 Km), and the t-statistic indicates this was not
statistically significant. The results of dairy farming experience for the head of household also
indicates the mean was not statistically different between participants and non-participants. The
results of the size of landholding of the household show that milk market participants had larger
mean landholding (8.3 Ha) compared to non-market participants (2.1 Ha). The t-statistic results
of this variable were significant at 1% level, indicating the relationship between smallholder
dairy market participation and size of landholding in Zimbabwe. Households who participated in milk markets had larger household sizes (about 6 household
members) compared to 5 household members for non-market participants, and the t-statistic
showed the variable was significant at 5%. Dairying is an intensive enterprise and most of the
households in the smallholder dairy schemes depend on family labour. The results of mean
household size indicates that size of household is an important resource for the dairy enterprise
as it influences market participation due to the availability of labour for performing the various
activities of the dairy enterprise. The total number of dairy cows owned by the household for milk market participants was about
5 cows compared to one cow for non-market participants, and this was significant at 1%. The
quantity of milk sold per month was 515 litres, indicating that milk production is the most
important variable affecting milk market participation. The results of income from other sources
shows that milk market participants had higher incomes (USD3248) compared to non-milk
market participants (USD1656) and this was significant at 5%. Income from other sources such
as crop production enables smallholder dairy producers to access resources to invest in the dairy
enterprise, such as acquiring dairy cows of improved breeds. This therefore indicates the
influence of other sources of income in milk market participation. The results of the sex of head of household indicate about 74% of the heads were males for both
milk market and non-milk market participants, and the Chi-square test was not significant.
Access to extension services results show that about 97% and 100% of milk market participants
and non-milk participants respectively had access to extension services and the Chi-square test
indicates the difference was also not significant. Access to information was measured on the basis of whether one of the household members
owned a mobile phone, and whether the mobile phone was used to access dairy enterprise
information. About 76% of milk market participants indicated positively to accessing
information compared to about 26% of non-milk participants and the variable was significant.
The results indicate the influence of access to information on milk market participation. The last two categorical variables assessed were occupation of the household head and agro-
ecological region location of the smallholder dairy scheme of the household. Occupation of the
head of household was classified into full time farmers, or otherwise if the farmer was not
fulltime on the farm. Fulltime time farmers were resident at the farm while others were
employed off farm or were involved in other activities that limited them from farming on a full
time basis. About 82% of milk market participants were full time farmers compared to 78% for
non-milk market participants, although the Chi-square test indicates this was not significant. In
terms of agro-ecological location of the smallholder dairy scheme of the household, about 70%
of milk market participants were located in NR I and II, and all the non-milk market participants
(100%) were located in NR I and II, and the Chi-square indicates this variable was significant.
In Zimbabwe, the natural region location of the household determines the amount of rainfall
that is received and therefore the potential for agricultural and livestock production. NR I and
Page 310
294
II are considered as the regions with the highest potential for intensive production of both crops
and livestock, compared to NR III to V where the rainfall is limited and the regions are suitable
for semi-intensive and extensive crop and livestock production (Muir-Leresche, 2006). 4.2 Determinants of Milk Market Participation and Volume of Sales 4.2.1 First-Stage Heckman Participation Model Results of the first stage Heckman two-step model (binary probit model) show that out of the
14 explanatory variables, seven were found to determine the probability of milk market
participation. These are total number of dairy cows owned by the household, educational level
of the head of household, age of the household head, household size, access to information and
extension services, and agro-ecological region location of the smallholder dairy scheme of the
household. As expected, the total number of dairy cows owned by the household had positive relationship
with milk participation decision and was statistically significant at 5% probability level. The
positive and significant relationship indicates that the greater the number of dairy cows owned
by the household, the better is the milk
jas.ccsenet.org Journal of Agricultural Science Vol. 9, No. 10;
2017
production and the more likely the household will make milk market participation decisions.
These results are consistent with the findings of Kuma et al. (2014). The educational level of
the head of household was positive and had significant impact on milk market participation at
1%. The positive and significant relationship between the two variables indicates the
educational level of the head of household as an important variable affecting household milk
market participation. This also indicates educated dairy producers have some knowledge of the
importance of market participation decisions. Age had positive and significant impact on milk
market participation at 1%. The positive and significant relationship indicates that age, which
can be used as a proxy for experience, shows that old aged farmers acquire experience over the
years and hence positively influences market participation. These results coincide with the
findings of Kuma et al. (2014) and Mamo, Tefera, and Byre (2014) in Ethiopia. The results show that household size and milk market participation relationship was positive
and significant at 1%. The results are in conformity with the findings of Demissie et al. (2014)
in Ethiopia. The positive and significant relationship indicates that dairy is a labour intensive
enterprise. Large family sizes in smallholder dairy enterprise indicates availability of labour for
smallholder dairy production which increases milk market participation. Access to information
and milk market participation decision are positively related and significant at 1%. This
indicates that access to information increases milk market participation and leads to
understanding of the workings of the market, information on prices, and other market
information that improves decision making of the smallholder dairy producer. Access to
extension services and milk market participation decisions indicates a positive and significant
relationship at 1%. This indicates that access to extension services provides farmers with
information on technologies that are necessary to improve management of the dairy enterprise
and hence improved milk production and enhanced market participation decisions. Agro-ecological region location of the smallholder dairy scheme of the households and milk
market participation decisions relationship was positive and significant at 1%. This indicates
that agro-ecological region location of the scheme of the household enhances milk market
participation decisions since smallholder dairy schemes located in high potential regions of NR
I and II are able to access feeds and stover from crop production due to the high rainfall received
Page 311
295
in these regions. Households can also grow improved fodder crops for supplementary feeding
of their dairy animals, compared to dairy schemes located in NR III to V. Masama, Kusina,
Sibanda, and Majoni (2005) study of Nharira-Lancashire which is located in NR III of
Zimbabwe found that farmers kept inadequate amounts of feeds of poor nutritional quality for
feeding the dairy cows year round. Chinogaramombe et al. (2008) also found that shortages of
feed was one of the major constraints for smallholder dairy production for the semi-arid regions
of Zimbabwe which are mainly located in NR III, IV and V. The results of the milk market participation model also show that distance to the market, sex of
the head of household, dairy farming experience of the head of household, land holding size,
farmer occupation, agricultural training of head of household, and income from other sources
were not significant. In terms of landholding size and dairy farming experience, these results
are contrary to the findings of Kuma et al. (2014) in Ethiopia. Kuma et al. (2014) found these
two variables to be negatively related to milk market participation, which was contrary to their
initial expectations. The explanation advanced (Kuma et al., 2014) in the case of dairy farming
experience in Ethiopia was that households with many years dairy farming experience owned
local cows and lived in areas where the demand for milk was low. The farmers were also more
engaged in marketing milk products rather than milk. In Zimbabwe, this could possibly be
explained by the fact that dairy farmers have not adopted dairy farming as a specialized
enterprise and are therefore not commercially oriented. Key informant interviews indicates that
farmers practicing dairy are also into many other cropping and livestock enterprises and
therefore do not give dairying the management attention it requires as a specialized enterprise. In terms of landholding size, Kuma et al. (2014) found a negative and significant effect on
household milk market participation. Their explanation was that the negative relationship
between milk market participation and land holding indicates that market oriented dairy
production does not necessarily require large pieces of land (Kuma et al., 2014). This was
mainly because households producing milk for market had access to purchasing pastures from
other households or from government holdings. Contrary to the situation reported by Kuma et
al. (2014), in Zimbabwe, farmers do not have access to purchased pastures from other
households. The households have to allocate the available land between competing demands
for the production of food crops, fodder and feed for the smallholder dairy enterprise. Although the results of income from other sources were not significant in this study, other
studies have found otherwise. Demissie et al. (2014) found that financial income from other
sources had negative effect on cow milk market participation in Ethiopia and the relationship
was significant. Demissie et al. (2014) explanation was that
jas.ccsenet.org Journal of Agricultural Science Vol. 9, No. 10;
2017
this indicated that any financial income decreases milk market participation for the smallholder
producer household as a result of fixed transaction costs. The determinants of farmers’ participation in the milk market can be summarized as follows:
dairy cows and household size represent availability of resources; whilst educational level,
access to information and extension service represent availability of knowledge; age of
household head represent experience; and agro-ecological region represent the natural and
climatic conditions. 4.2.2 Second-Stage Heckman Selection Model Heckman’s second stage estimation identifies the significant factors that affect volume of milk
sales using the selection model which included the inverse Mill’s ratio calculated from the
Page 312
296
probit estimation of milk market participation decision. The overall joint goodness of fit for the
second stage is assessed based on Wald Chi-square test. The null hypothesis for the test is that
all coefficients are jointly zero. In this study, the model Wald Chi-square test (Wald Chi2 =
2024.26; Prob > Chi2 = 0.0000) indicates that the overall goodness of fit for the selection model
is statistically significant at less than 1%. This shows that jointly independent variables included
in the model explained the volume of milk sales. In the second stage selection model, out of the 14 variables, seven variables were found to be
significant determinants of volume of milk sales to the milk collection centre of the smallholder
dairy value chain, including the inverse Mill’s ratio (LAMBDA). The variables found to be
significant are total number of dairy cows owned by the household, distance to the milk
collection centre (representing access to markets), age of the head of household, land holding
size of the household, access to extension services and agro-ecological region location of the
smallholder dairy scheme of the household. As hypothesized, the total number of dairy cows owned by the household has positive effect on
volume of milk sales and is significant at the 1% probability level. The model output predicts
that an addition of one dairy cow causes the marketable volume to increase by 0.47 litres per
month. The number of dairy cows owned by the household is an important policy variable that
indicates possible policy interventions that can be implemented to enhance milk market
participation and volume of milk sales for the smallholder dairy producers to benefit from the
lucrative value chains. Bardhan, Sharma, and Saxena (2012) study in India report the milk
output sold depends on farm and farmer specific variables such as family size, age, education,
resource ownership like land and animal holding. In this study, resource ownership includes
total number of dairy animals owned by the household which are significant in determining
volume of sales. The distance to the milk collection centre, which was used as a proxy for access to milk markets
of the smallholder dairy value chain, was negative and significant at 1% probability level. As
hypothesized, distance to the milk collection centre affected milk sales volume negatively. This
indicates that as one moves further away from the milk collection centre, the greater the
transportation costs and the losses due to spoilage and less access to information and facilities
offered by the milk collection centre, thereby impacting negatively on volume of milk sales. Age of the head of household had negative effect on volume of milk sales and was found to be
significant at 5%. This implies that old aged households’ heads are slow to adapt to changing
market conditions and new technologies, and therefore do not respond quickly to market
incentives to increase milk supply to the market. Conversely, this indicates that young aged
household heads are more business minded, are ambitious and entrepreneurial and therefore
make use of improved inputs to increase milk production, thus increasing volume of sales. The
descriptive results show that generally the mean age of the household head for milk market
participants was lower than that of non-milk market participants. This therefore indicates that
old aged households are not as market oriented compared to young aged households. This
implies that to increase the volume of milk sales to the milk collection centres of the smallholder
dairy value chain, government policy interventions need to target young aged households that
are more adaptable, ambitious and entrepreneurial, and are more inclined to quickly understand
the dynamics of the milk markets. Land holding size of the household had a positive and significant effect on milk sales volume
at 5%. This indicates that households with large land holdings have better access to grazing for
their dairy cows, and can also grow supplementary fodder crops including better access to crop
residues that can be used as supplementary dairy feed. This improves milk production and hence
milk sales volume supplied to the milk collection centre of the smallholder dairy value chain.
Page 313
297
The results of the descriptive statistics show that generally land holding size was higher for
smallholder milk market participants. This indicates an important policy variable that is relevant
to smallholder milk sales volume, and has important implications for milk supply in Zimbabwe
in light of the
jas.ccsenet.org Journal of Agricultural Science Vol. 9, No. 10;
2017
implementation of the fast track land reform and redistribution programme that has resulted in
reduced sizes of land holdings of the previously large scale commercial farmers. Access to extension services had positive and significant (at 1% level) effect on milk sales
volume supplied to the milk collection centre of the smallholder dairy value chain. The change
in having access to extension services of the smallholder dairy producers on milk quantity
supplied was about 6.1 litres. The result indicates that milk sales volume in the study areas was
more responsive to access to extension services. Extension is important in providing up-to-date
knowledge required to effectively run the dairy enterprise. The policy implications are that
access to adequate and appropriate extension should be one of the priority policy interventions
if government is to increase milk sales volume from the smallholder dairy producers. This
would increase milk production and hence milk sales volume to the milk collection centres of
the smallholder dairy value chain. The agro-ecological region location of the smallholder dairy scheme of the household had
negative and significant effect on milk sales volume at 5%. The results indicate that agro-
ecological region location of the dairy scheme in areas other than NR I and II have negative
effect on milk sales volume. This is mainly because livestock production in Zimbabwe depends
on native pastures and use of crop residues (Masama et al., 2005). Natural regions I and II are
considered high potential areas due to the high rainfall received (average 1050 mm and 750
mm, respectively). This enables smallholder dairy producers in these areas to access crop
residues from crop production that can be fed to dairy cows. Masama et al. (2005) found that
the herd size influenced the quantities of supplementary feeds harvested and stored. The policy
implications are that government policy interventions should target smallholder dairy producers
in the high potential natural regions I and II if the milk sales volume is to be increased from the
smallholder dairy schemes. According to the model output, the inverse Mill’s ratio or selectivity bias correction factor
(LAMBDA) affected milk sales volume positively at 5% significance level and indicates that
in the Heckman two-step model, the correction for selectivity is significant. This indicates
sample selection bias, and existence of some unobservable household characteristics affecting
likelihood to participate in milk market and thereby affecting milk sales volume. The determinants of volume of milk sales are thus number of dairy cows and landholding size
of the household representing availability of resources; distance to the milk collection centre
representing market access; age of household head representing ambition of the farmer; and
agro-ecological region. 5. Conclusions The study shows that resources (represented by dairy cows, household size), knowledge
(educational level, access to information and extension services) and experience (age of
household head) and natural climatic conditions (agro-ecological region) significantly
determined farmers’ participation in milk markets. The study also shows the determinants of
milk sales volumes to be resources (number of dairy cows and landholding size of the
household); market access (distance to the milk collection centre); ambition of the farmer (age
Page 314
298
of household head); and natural and climatic conditions (agro-ecological region). The results of
the study suggest the following policy implications and interventions if milk market
participation and sales volume are to be increased from the smallholder dairy schemes and
hence increased supply of milk to the milk collection centre of the smallholder dairy value
chain. In order to increase milk market participation, government policy interventions need to
be targeted at increasing the number of dairy cows for smallholder dairy producers. Policy
interventions should also target educated, young aged farmers located in high potential agro -
ecological regions I and II. These should be provided with adequate and appropriate information
and extension packages in order to enhance milk market participation decisions. The results
also indicate that in order to increase milk sales volume to the milk collection centre of the
smallholder dairy value chain, policy interventions targeted at increasing the number of cows
owned by the smallholder dairy producers would have a positive impact. Complimentary policy
interventions need to take into account the landholding size and agro-ecological region location
of the smallholder dairy scheme of the household, the provision of adequate and appropriate
extension messages targeted at smallholder dairy producers. Government would also need to
implement policy measures that target young aged producers, and ensure the milk collection
centres are accessible to the smallholder dairy producers if milk sales volume is to be increased
to supply the milk collection centres of the smallholder dairy value chain. Acknowledgements A PhD thesis grant from the African Economic Research Consortium (AERC) based in Nairobi
is acknowledged. However, the views expressed in the paper reflect the authors’ views, and not
of any other person. The Department of Livestock and Veterinary Services in the Ministry of
Agriculture, Mechanization and Irrigation Development is greatly appreciated for facilitating
data collection with introductions in the respective
jas.ccsenet.org Journal of Agricultural Science Vol. 9, No. 10;
2017
smallholder dairy schemes. The researcher would also like to acknowledge the assistance of
enumerators with field data collection in the respective dairy schemes and the farmers who
participated in the survey. References Balirwa, E. K., Nalunkuuma, J., & Sserunkuuma, D. (2016). Determinants of smallholder dairy
farmers’ volume of milk sales in Uganda’s agro-ecological zones. International Journal of
Applied and Pure Science and Agriculture, 2(8), 97-109. Retrieved from
http://ijapsa.com/published-papers/volume-2/issue-8/determinan ts-of-smallholder-dairy-
farmers-volume-of-milk-sales-in-ugandas-agro-ecological-zones.pdf Bardhan, D., Sharma, M. L., & Saxena, R. (2012). Market participation behaviour of
smallholder farmers in Uttarakhand: A disaggregated analysis. Agricultural Economics
Review, 25(2), 243-254. Bellemare, M. F., & Barrett, C. B. (2006). An ordered Tobit model of market participation:
Evidence from Kenya and Ethiopia. American Journal of Agricultural Economics, 88(2),
324-337. https://doi.org/10.1111/ j.1467-8276.2006.00861.x Chamboko, T., & Mwakiwa, E. (2016). A review of smallholder dairy development in
Zimbabwe 1983 to 2013: The effect of policies. Livestock Research for Rural Development,
28, Article #113. Retrieved June 3, 2016, from
http://www.lrrd.org/lrrd28/6/cham28113.html
Page 315
299
Chavhunduka, G. L. (1982). Report of the commission of inquiry into the agricultural industry.
To the President 1982, Harare, Zimbabwe. Chinogaramombe, G. N. C., Muchenje, V., Mapiye, C., Ndlovu, T., Chimonyo, M., &
Musemwa, L. (2008). Challenges for improving smallholder dairy production in the semi-
arid areas of Zimbabwe. Livestock Research for Rural Development, 20, Article #34.
Retrieved from http://www.lrrd.org/lrrd20/3/ chin20034.htm Demissie, B., Komicha, H. H., & Kedir, A. (2014) . Factors affecting camel and cow milk
marketed surplus: The case of eastern Ethiopia. African Journal of Agricultural Science
and Technology, 2(2), 54-58. Retrieved from
https://www.oceanicjournals.com/ajast/pdf/2014/Feb/XXXXX%20et%20al..pdf Goetz, S. J. (1992). A selectivity model of household food marketing behaviour in Sub-Saharan
Africa. American Journal of Agricultural Economics, 74(2), 444-452.
https://doi.org/10.2307/1242498 Heckman, J. J. (1979). Sample selection bias as a specification error. Econometrica, 47, 153-
161. https://doi.org/10.2307/1912352 Holloway, G., Nicholson, C., Delgado, C., Staal, S., & Ehui, S. (2004). A revised Tobit
procedure of mitigating bias in the presence of non-zero censoring with an application to
milk-market participation in the Ethiopian highlands. Agricultural Economics, 31, 97-106.
https://doi.org/10.1111/j.1574-0862.2004.tb00224.x Key, N., Sadoulet, E., & De Janvry, A. (2000). Transactions Costs and Agricultural Household
Supply Response. American Journal of Agricultural Economics, 82, 245-259.
https://doi.org/10.1111/0002-9092.00022
Kuma, B., Baker, D., Getnet, K., & Belay, K. (2014). Factors affecting milk marketing
participation and volume of supply in Ethiopia. Asian Journal for Rural Development, 4,
1-15. https://doi.org/10.3923/ajrd.2014.1.15 Mamo, T., Tefera, T., & Byre, N. (2014). Factors influencing urban and peri-urban dairy
producers’ participation in milk value addition and volume of milk value added in Welmera
Woreda, West Shewa Zone of Oromia Regional State, Ethiopia. International Journal of
Livestock Production, 5(9), 165-172. https://doi.org/ 10.5897/IJLP2013.0174 Masama, E., Kusina, N. T., Sibanda, S., & Majoni, C. (2005). Farm- grown feed resources as
factors affecting smallholder dairy production in Zimbabwe. African Crop Science
Conference Proceedings, 7, 555-560. Moll, H. A. J., Staal, S. J., & Ibrahim, M. N. M. (2007) . Smallholder dairy production and
markets: A comparison of production systems in Zambia Kenya and Sri Lanka. Agricultural
Systems, 94(2), 593-603. https://doi.org/10.1016/j.agsy.2007.02.005 Muir-Leresche, K. (2016). Agriculture in Zimbabwe. In M. Rukuni, P. Tawonezvi, C. Eicher,
M. Munyuki-Hungwe, & P. Matondi (Eds.), Zimbabwe’s Agricultural Revolution Revisited.
University of Zimbabwe Publications, Harare, Zimbabwe. Muriuki, H. G., & Thorpe, W. (2002) . Smallholder Dairy Production and Marketing in Eastern
and Southern Africa: A Regional Synthesis. Smallholder Dairy Production and
Marketing—Opportunities and Constraints (pp. 185-200). Annad, India: NDDB and ILRI. jas.ccsenet.org Journal of Agricultural Science Vol. 9, No. 10;
2017
Page 316
300
Wooldridge, J. M. (2002). Econometric Analysis of Cross Section and Panel Data (p. 752). MIT
Press, Cambridge, MA.
Notes Note 1. The main types of smallholder farming systems considered were communal where the
type of tenure is communal, small scale commercial with leasehold or freehold tenure and
resettlement where the tenure is a permit (Muir-Leresche, 2006). Note 2. Zimbabwe is divided into five agro-ecological regions or natural regions (NR) on the
basis of rainfall. NR I receives about 1050 mm rainfall per annum, NR II (750-1050 mm), NR
III (500-700 mm), NR IV (450-600 mm) and NR V (less than 500 mm) (Muir-Leresche, 2006).
Copyrights Copyright for this article is retained by the author(s), with first publication rights granted to the
journal. This is an open-access article distributed under the terms and conditions of the Creative
Commons Attribution license (http://creativecommons.org/licenses/by/4.0/).
Paper 3: Ex-ante benefit-cost analysis of an animal production and forage centre for a
smallholder dairy value chain in Zimbabwe Fifth RUFORUM Biennial Regional Conference 17 - 21 October 2016, Cape Town, South Africa
RUFORUM Working Document Series (ISSN 1607-9345) No. 14 (3): 229-236. Available from http://repository.ruforum.org
Research Application Summary
EX-ANTE benefit-cost analysis of an animal production and forage centre for a smallholder dairy value chain in Zimbabwe
Chamboko, T.1, Mwakiwa, E.
1 & Mugabe, P.
2
1Department of Agricultural Economics and Extension, University of Zimbabwe, P. O. Box MP 167,
Mount Pleasant, Harare, Zimbabwe
1Department of Animal Science, University of Zimbabwe, P. O. Box MP 167, Mount Pleasant,
Harare, Zimbabwe
Corresponding author: [email protected]
Abstract
Many smallholder dairy schemes in Africa face sustainability constraints due to shortages of feed
resources and poor productivity. Extension supported dairy animal production and forage centres
constructed alongside the milk collection centres are possible solutions to these constraints. The
objectives of this study were to (1) determine farmers’ willingness to pay for construction and
services provided by the centre, and (2) perform an ex-ante benefit-cost analysis of the centre in
the smallholder dairy value chain. A cross-sectional survey was performed in four smallholder
dairy schemes and a total of 185 smallholder dairy farmers selected by simple random sampling
were interviewed using a pre-tested questionnaire. The results show that 78% of farmers indicated
Page 317
301
they would be willing to construct such a centre on their own, while 94% indicated they would
be willing to pay for artificial insemination services provided by such a centre. The main
advantages of the centre to the dairy enterprise would be ready access to feed, fodder and cost
savings (82% of farmers). About 92% of farmers would prioritize feeding milking cows in order
to increase milk production. Ex-ante benefit cost analysis indicate that such a centre would be
profitable with a benefit: cost ratio of 5.4: 1. The implications of the results is that Governments
should support alternative models of smallholder value chain development that includes
establishing animal production and forage centres in the smallholder dairy value chain in order
to improve milk production and productivity, and the contribution of smallholder dairy to the
national economy.
Key words: Animal production and forage centre, smallholder dairy, value chain, Zimbabwe
Résumé
De nombreux projets de production laitière en Afrique sont confrontés aux contraintes de
durabilité à cause de la pénurie de ressources alimentaires, et de la faible productivité. Les centres
de services de vulgarisation de production et de fourrage d’animaux laitiers situés aux environs
des centres de collecte du lait sont des solutions possibles pour faire face à ces contraintes. Les
objectifs de cette étude étaient (1) de déterminer la volonté des agriculteurs
Chamboko, T. et al.
de payer pour l’installation des centres et des services fournis, et (2) d’effectuer une analyse ex-ante
coûts-avantages du centre dans la chaîne de valeur laitière. Une enquête transversale a été conduite
considérant quatre régimes laitiers des petits exploitants et un total de 185 producteurs laitiers
sélectionnés au hasard ont été interviewés à l’aide d’un questionnaire pré-testé. D’après les résultats,
78% des agriculteurs ont indiqué qu’ils seraient prêts à construire un tel centre par eux-mêmes, tandis
que 94% ont indiqué qu’ils seraient prêts à payer pour les services d’insémination artificielle fournis
par le centre. Les principaux avantages du centre pour l’entreprise laitière seraient l’accès facile aux
aliments et fourrage, et des économies sur les coûts (82% des agriculteurs). Environ 92% des
agriculteurs considéraient l’alimentation des vaches laitières comme une priorité afin d’augmenter la
production de lait. L’analyse ex-ante des coûts-avantages indique qu’un tel centre serait rentable avec
un rapport bénéfice/coût de 5,4: 1. Les résultats devraient amener les gouvernements à soutenir des
modèles alternatifs de développement de la chaîne de valeur des petits exploitants, incluant la
création de centres de production animale et fourragère afin d’améliorer la production et la
productivité du lait et la contribution des petites exploitations laitières à l’économie nationale.
Mots clés: Centre de production animale et fourragère, petite exploitation laitière, chaîne de valeur, Zimbabwe
Background
The agricultural sector in Zimbabwe supports the livelihoods of approximately 70% of the population,
and contributes approximately 18% of GDP (ZimStat, 2013). The dairy subsector is an important
component of the agricultural sector, with dairy produce contributing about 3% of the value of agricultural
production at 2012 prices (ZimStat, 2013). Most of the contribution of the dairy subsector comes from
large scale commercial farms, with smallholder farms contributing 5% of total milk marketed through
formal channels (DDP, 2010). The low contribution of smallholder farms has been attributed particularly
to low productivity and limited access to feed resources during the dry season. In Zimbabwe, studies by
Francis and Sibanda (2001) highlight problems of low productivity due to inadequate availability and
poor quality of feeds and expensive commercial feeds as the main constraints limiting smallholder dairy
Page 318
302
production. Mupeta (2000) documented the constraints facing smallholder production, with particular
reference to feed resources. Mutukumira et al. (1996) study showed that only 14% of the households in
the smallholder dairy schemes grew more than one hectare of fodder. As such, shortage of feed and
transport were cited as the major constraints faced by smallholder dairy farmers in the semi-arid areas
(Chinogaramombe et al., 2008). Masama et al. (2005) conducted a study in order to develop an inventory
of feed resources available on farm. The results of the study showed that farmers kept inadequate amounts
of feeds of poor nutritional quality for feeding dairy cows year-round. The research findings highlighted
the need for innovative, cheaper feed resource management systems that are developed to ensure
sustainable viability of smallholder dairying (Masama et al., 2005). Studies by Gomez et al. (2007) in
Central Peru showed that the feeding programme for lactating and growing females on forage that was
exchanged for labour and purchased concentrates did not theoretically or practically meet the needs of the
cows. Shamsuddin et
Fifth RUFORUM Biennial Regional Conference 17 - 21 October 2016, Cape Town, South Africa
al. (2007) showed that fodder availability increased milk production and decreased incidence of disease.
Studies by Alejandrino et al. (1999) and Suzuki et al. (2006) also cite feed resources or feeding regimes
as the major constraints limiting smallholder dairy. The question that arises in the context of smallholder
dairy value chain is how feed and forage resources can be made available to farmers in order to improve
the viability of smallholder dairy. Kabirizi et al. (2009) performed a study in Uganda to assess the
profitability of improved forage technologies and factors affecting the use of improved forage
technologies among smallholder farmers in Soroti district in eastern Uganda. The results also showed that
profitability and improved cattle breeds had complimentary effects on the decision to use improved
technologies. Gwiriri et al. (2016) study in Zimbabwe concluded that the use of forages can be a cost
effective feed level intervention to optimize income in small-scale dairy by reducing the cost of producing
a litre of milk.
This study focuses on the production constraints and the formulation of new economic models of
smallholder dairy development given advances in new farming techniques and technologies to enhance
the contribution of the subsector to national economic development. The concept of forage and animal
production centres have been received (Titterton and Maasdorp, 1997). The objectives of the study were
to (1) determine farmers’ willingness to pay for construction and services provided by the centre, and (2)
perform an ex-ante benefit-cost analysis of the centre in the smallholder dairy value chain.
Study description
The study sites were four dairy schemes purposively selected on the basis of type of farming system, agro-
ecological natural region (NR) location, and performance in terms of daily deliveries of milk to the milk
collection centre, and linkages to processors. The selected schemes were Chikwaka (NRII, communal
farming system, delivering less than 200 litres per day, milk collection centre processing), Nharira-
Lanchashire (NRIII, communal and small scale commercial farming system, delivering about 200 litres
per day, milk collection centre processing), Marirangwe (NRII, small scale commercial farming system,
delivering about 400 litres per day, linked to private processor), and Rusitu (NRI, resettlement farming
system, delivering about 600 litres per day, linked to private processor). The lists of all members of the
smallholder dairy schemes were obtained from the milk collection centre and these formed the sampling
frames for the survey. Simple random sampling was used to select the sample of farmers included in the
study. The total number of households interviewed in the four smallholder dairy schemes was 185 farmers.
This sample provides a cross section of farmers in order to understand the dairy value chain under different
farming systems, agro-ecological potentials and varying scheme performance levels.
The benefit-cost methodology (Gittinger, 1992) was used to assess the investment in the animal
production and forage centre. The performance of the dairy farmers and viability was assessed on the
basis of gross margin analysis. Two scenarios of with and without the animal production and forage centre,
and the incremental benefits and costs were assessed in the financial ex-ante benefit-cost analysis. The
Page 319
303
feasibility of the centre was also assessed on the basis of farmers’ willingness to pay for the services to
be provided by the centre. The
Chamboko, T. et al.
benefits and costs were discounted over a 10 year period. Estimated costs of constructing such a centre were obtained from the Ministry of Public Construction and National Housing. The major costs of constructing such a centre would be the cost of offices, sheds, staff housing and irrigation infrastructure for 10 hectares of forage crops. It was assumed this would serve 100 smallholder farmers in the dairy scheme.
Research application
The results of the study show that 78% of farmers indicated they would be willing to construct such
a centre on their own, while 94% indicated they would be willing to pay for artificial insemination
services provided by such a centre and 91% would be willing to purchase feed that would be available
through the centre (Fig. 1). About 92% of farmers would prioritize feeding milking cows from the
feed made available through the centre in order to increase milk production (Fig. 2). The farmer
perceived main advantages such a centre would provide to the dairy enterprise would be ready access
to feed, fodder and cost savings (82% of farmers) (Table 1).
The animal production and forage centre was modelled on the basis of parameters. The parameters for
with and without the centre were based on the results of the survey and assumptions of the potential of
milk production based on the breeds currently used by smallholder farmers (Table 2). The total cost of
constructing the animal production and forage centre was estimated at USD200, 000. The cost is based
on use of local materials which brings downs the cost of construction down to about 25% of the cost of
using urban materials. The yearly recurrent expenditure was estimated at USD75, 000. Using a discount
rate of 15% over the 10 year period, the benefit cost-ratio was 5.4:1. The main additional benefits were
the projected milk yields as a result of access to feed resources while the main additional costs were the
extra feeding costs in order to achieve the milk yields, the investment in the centre and the recurrent
expenditure. It was also projected that since
Figure 1. Percent of farmers reporting willingness to construct and pay for services (n=185)
Page 320
304
Fifth RUFORUM Biennial Regional Conference 17 - 21 October 2016, Cape Town, South Africa
Increased
milk
production
To maintain
good body
condition for
good milk
production
Others
Figure 2. Reasons for prioritizing cows in milk for feeding with feed from the centre (n=185)
Table 1. Farmer perceived advantages of animal production and forage centre
Chikwaka Marirangwe Nharira- Rusitu Total
Lancashire
Number of farmers interviewed 50 35 50 50 185
Access to feed, fodder and cost savings 81.7 60.0 93.3 95.9 81.5
Knowledge, advice and training 12.2 2.0 3.3 4.1 5.7
Save on transportation costs 0.0 34.0 0.0 0.0 9.6
Other reasons 6.1 6.0 3.4 0.0 3.2
Page 321
305
Source: Smallholder dairy survey (2015)
Table 2. Parameters used with and without animal production and forage centre benefit-cost analysis
Parameter Without With
Number of cows milked 2 3
Lactation length (days) 275 292
Lactation yield per cow per year 3520 5840
Milk sales (litres per year) 7040 17520
Milk price (USD/litre) 0.5 0.5
Total variable costs of production (USD/year) 3267.10 4847.85
Gross income (USD) 3520 8700
Gross margin (USD/litre) 0.04 0.22
Source: Assumptions and Smallholder dairy survey (2015)
Chamboko, T. et al.
farmers would have access to artificial insemination, the number of milking cows would also increase as farmers benefit from access to improved genetics through artificial insemination.
Discussion
The proposed forage and animal production centre will cater for two constraints that have been
identified as limiting smallholder dairy; feed resources and management (Cain et al., 2007;
Chinogaramombe et al., 2008; Kabirizi et al., 2009). The objective of the centre will be to improve
management of smallholder dairy production in terms of nutritional and animal management,
respectively. The objective of the forage section of the centre will be to develop a centre where forage
is produced and conserved under management. The bagged and ensilaged forage is then sold to
farmers at lowest cost possible. The centre will be manned by qualified personnel, trained up-to
diploma level. The animal production section of the centre will also be manned by qualified personnel
to provide correct synchronization of the animals on heat and artificial insemination for the benefits
Page 322
306
to be realized. Since farmers have indicated willingness to pay for the services provided by the centre,
this means such a centre can be sustainable without outside financial support. However, there is need
for initial investment financing to put up the centre as most of the smallholder communities lack
capacity in terms of the required initial capital outlay. Repayment of forage purchased by farmers
will be through deductions factored into the milk sold to the milk collection centre. In terms of
marketing, milk will be sold in the rural areas, with the surplus processed into sour milk depending
on the requirements of the community. The smallholder dairy schemes can also be linked to dairy
value chains that supply the urban markets due to the increased production.
The results show that the proposed animal production and forage centre is profitable as shown by the
benefit-cost ratio. Providing full time extension support to smallholder farmers is expected to result
in increased milk yields achieved by smallholder farmers. Most of the smallholder farmers currently
milk cross bred cows. Access to artificial insemination will lead to improved breeds of cows and
have the potential to improve milk yield to levels comparable to those achieved by their large scale
commercial counterparts, provided farmers have access to appropriate feed resources and improved
breeds. Ngongoni et al. (2006) highlighted that milk yield from exotic cows found in the smallholder
sector were below the potential breed averages of those found in the large scale commercial.
Therefore, with access to feed and improved management provided for through the proposed centre,
it is expected that this potential can be improved. It was therefore assumed milk yields would increase
by more than 50% from the current average yields of 12.8 litres per cow per day recorded in the
survey. This will increase the potential milk yield closer to the milk yields achieved by large scale
commercial farmers reported by Ngongoni et al. (2006). The upgrading of feed and animal
management as provided for in the animal production and forage centre has been shown to be
profitable and viable and this therefore constitutes a new model for smallholder dairy development
in Zimbabwe and the whole of the Southern Africa region.
Fifth RUFORUM Biennial Regional Conference 17 - 21 October 2016, Cape Town, South Africa
Acknowledgement
A PhD thesis grant to the first author from the Africa Economic Research Consortium
(AERC) based in Nairobi, Kenya is acknowledged. The Department of Livestock and
Veterinary Services, Zimbabwe is acknowledged for facilitating data collection, and the
International Livestock Research Institute (ILRI) Southern Africa regional office in
Zimbabwe for providing relevant literature. The Regional Universities Forum for Capacity
Building in Agriculture (RUFORUM) is acknowledged for the opportunity to share the
research results. This paper is a contribution to the 2016 Fifth African Higher Education
Week and RUFORUM Biennial Conference.
References
Alejandrino, A.L., Asaad, C.O., Malabayabas, B., De Vera, A.C., Herrera, M.S., Deocaris, C.C.,
Ignacio, L.M. and Palo, L.P. 1999. Constraints on dairy cattle productivity at the smallholder
level in the Philippines. Preventive Veterinary Medicine 38: 167–178.
Cain, P., Anwar, M. and Rowlinson, P. 2007. Assessing the critical factors affecting the viability of small-scale dairy farms in the Punjab region of Pakistan to inform agricultural extension programmes. Agricultural Systems 94: 320–330.
Chinogaramombe, G.N.C., Muchenje, V., Mapiye, C., Ndlovu, T., Chimonyo, M. and Musemwa, L. 2008. Challenges for improving smallholder dairy production in the semiarid areas of Zimbabwe. Livestock Research for Rural Development 20:. Retrieved March 26, 2016, from http://www.lrrd.org/lrrd20/3/chin20034.htm
Page 323
307
Dairy Development Programme (DDP). 2010. DDP Position Paper Dairy Development Programme. Nyarungu Training Centre, Harare, Zimbabwe.
Francis, J. and Sibanda, S. 2001. Participatory action research experiences in smallholder dairy farming in Zimbabwe. Livestock Research for Rural Development 13:. Retrieved March 26, 2016, from http://www.lrrd.org/lrrd13/3/fran133.htm
Gittinger, J.P. 1992. Economic Analysis of Agricultural Projects. EDI Series in Economic Development. Economic Development Institute. World Bank. Washington DC., USA.
Gomez, C., Fernandez, M., Salazar, I., Saldana, I. and Heredina, M. 2007. Improvement of small dairy producers in the Central Coast of Peru. Trop Anim Health Prod 39: 611– 618.
Gwiriri, L.C., Manyawu, G.J., Mashanda, P., Chakoma, I., Moyo, S., Chakoma, C., Setaunyane, H.,
Imbayarwo-Chikosi, V. and Maasdorp, B. 2016. The potential of replacing conventional dairy
supplements with forage legume based diets in Zimbabwe’s smallholder dairy sector. African
Journal of Range and Forage Science. (Accepted for Publication May 2016).
Kabirizi, J., Turinawe, A., Ebiyau, G., Kigongo, J., Akwanga, D. and Nangooti, N. 2009. Impact of improved forage technologies on profitability of dairy enterprise and factors affecting the utilization of technologies. African Crop Science Conference Proceedings 9:745–749.
Masama, E., Kusina, N.T., Sibanda, S. and Majoni, C. 2005. Farm-grown feed resources as factors affecting smallholder dairy production in Zimbabwe. African Crop Science Conference Proceedings 7:555–560.
236 Chamboko, T. et al.
Mupeta, B. 2000. Studies on the potential of Ram Press sunflower cake (Helianthus anus) as a source of protein for moderate milk production in cross bred (Bos Taurus and Bos Indicus) cows in the smallholder dairy sector of Zimbabwe. DPhil Thesis, University of Zimbabwe, Harare, Zimbabwe.
Mutukumira, A.N., Dube, D.M.J, Mupunga, E.G. and Feresu, S.B. 1996 Smallholder milk production, milk handling and utilization: A case study from the Nharira/Lancashire area, Zimbabwe. Livestock Research for Rural Development 8 (1).
Ngongoni, N.T., Mapiye, C., Mwale, M. and Mupeta, B. 2006. Factors affecting milk production in the smallholder dairy sector of Zimbabwe. Livestock Research for Rural Development 18. Retrieved March 30, 2013, from http://www.lrrd.org/lrrd18/5/ ngon18072.htm.
Shamsuddin, M., Allam, M.M., Hossein, M.S., Goodger, W.J., Bari, F.Y., Ahmed, T.U., Hossain, M.M. and Khan, A.H.M.S.I. 2007. Participatory rural appraisal to identify needs and prospects of market oriented dairy enterprises in Bangladesh. Trop Anim Health Prod 39: 567–581.
Suzuki, K., Kanameda, M., Ogawa, T., Nguyen, T.T., Dang, T.T.S., Luu Q.H. and Pfeiffer, D.U.
2006. Productivity and socio-economic profile of dairy cattle farmers amongst rural
smallholder communities in Northern Vietnam. Livestock Science 101: 242–250.
Titterton, M. and Maasdorp, B. 1997. Datata Forage and Dairy Centre: Flow diagram of project activities.
ZimStat. 2013. Poverty and poverty Datum Line analysis in Zimbabwe 2011/12. Harare, Zimbabwe.


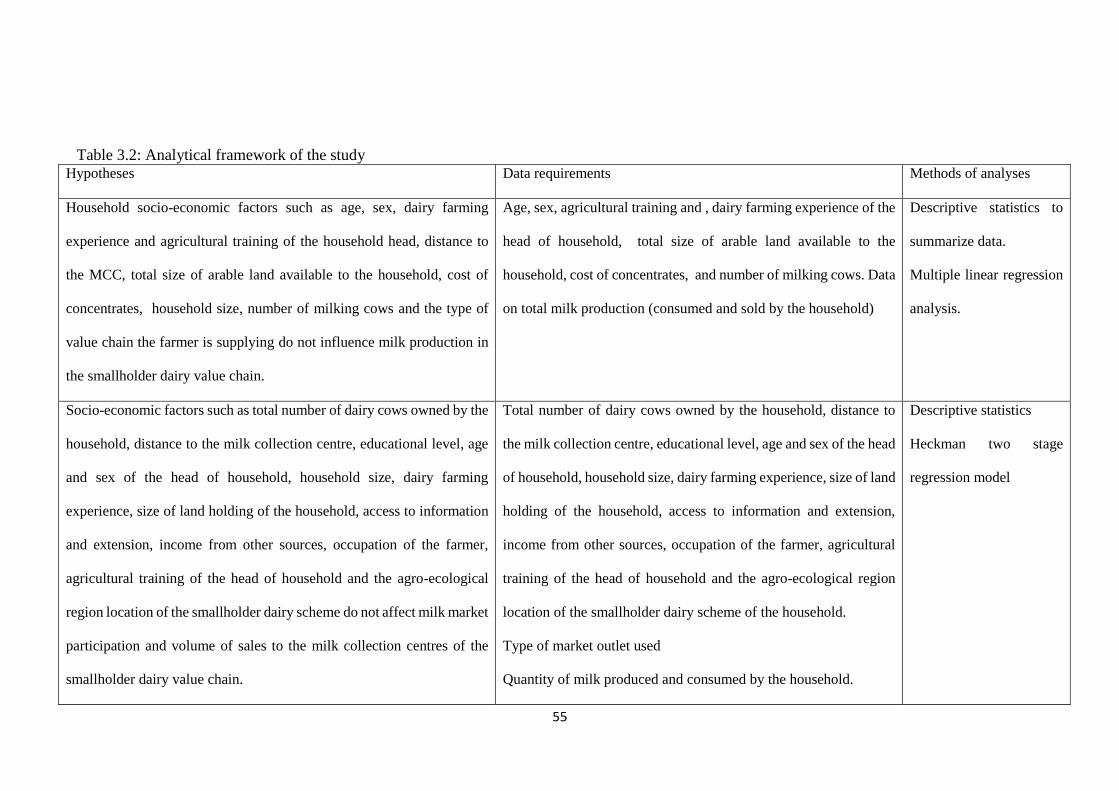


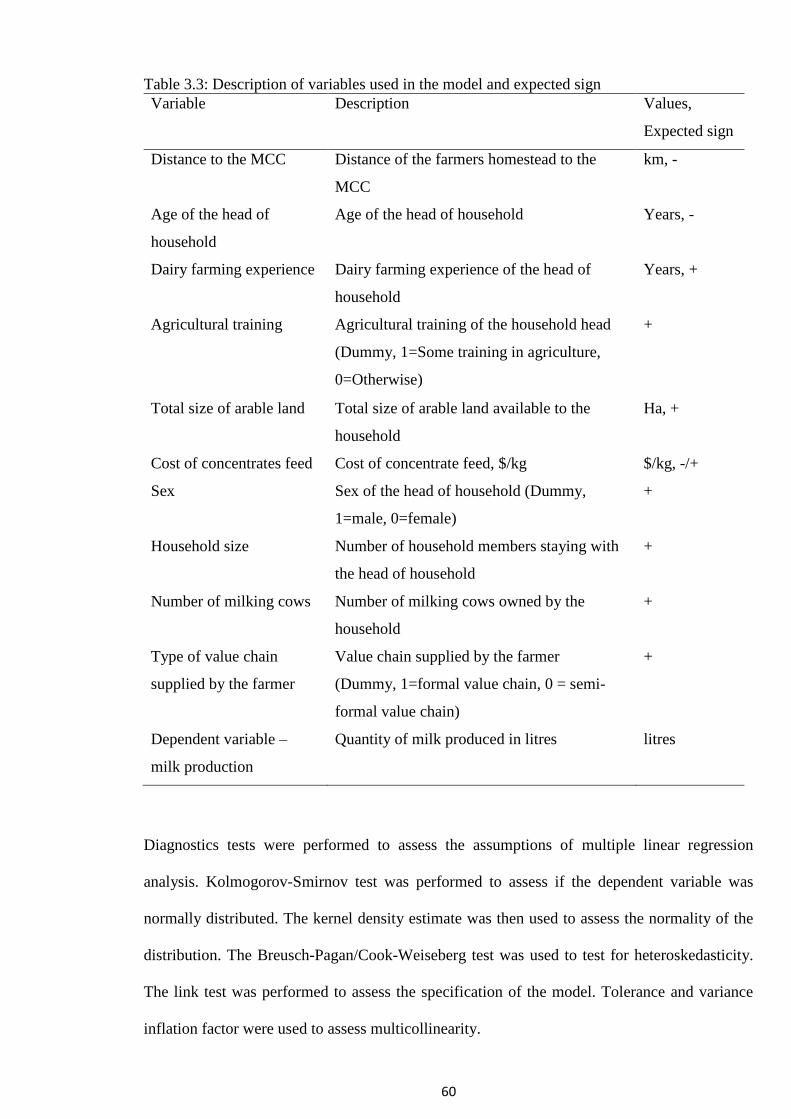


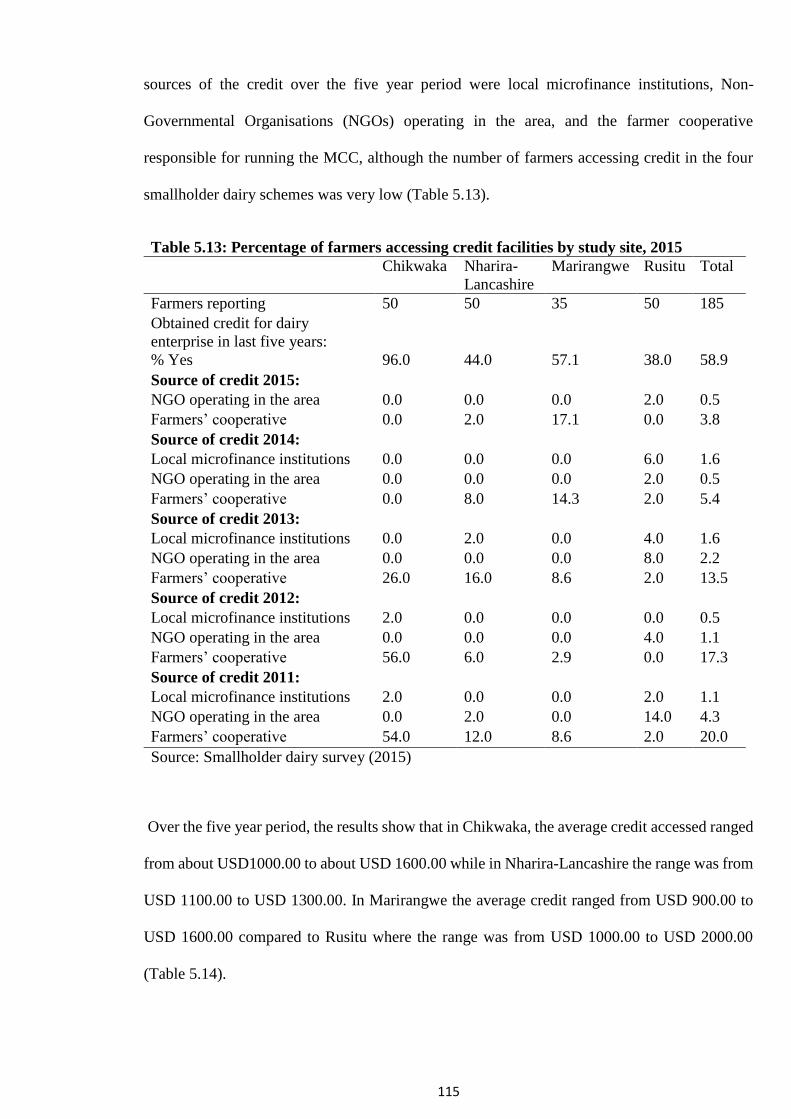


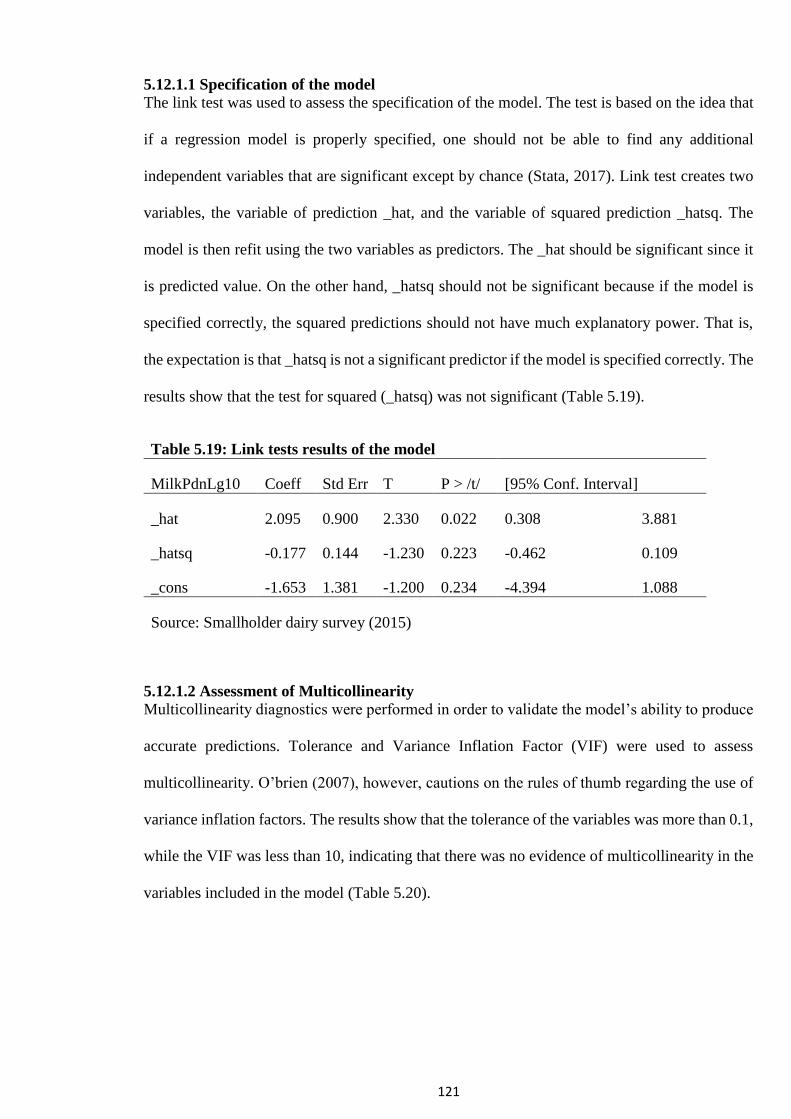
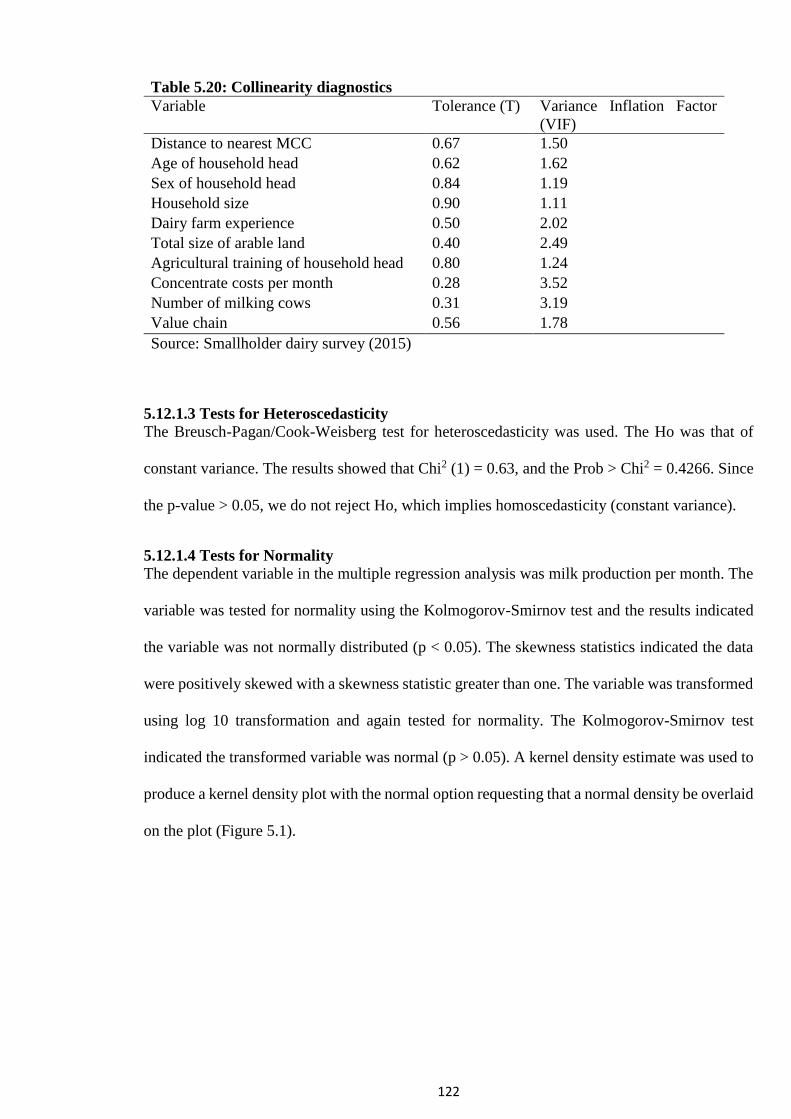

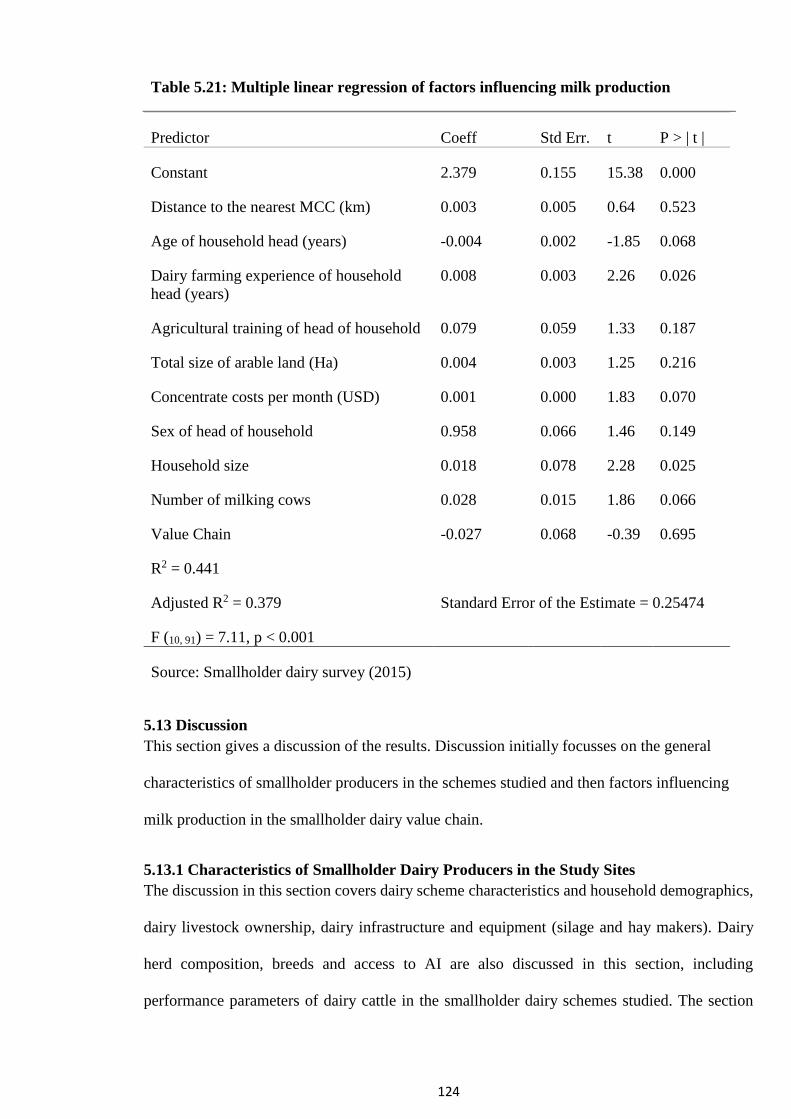


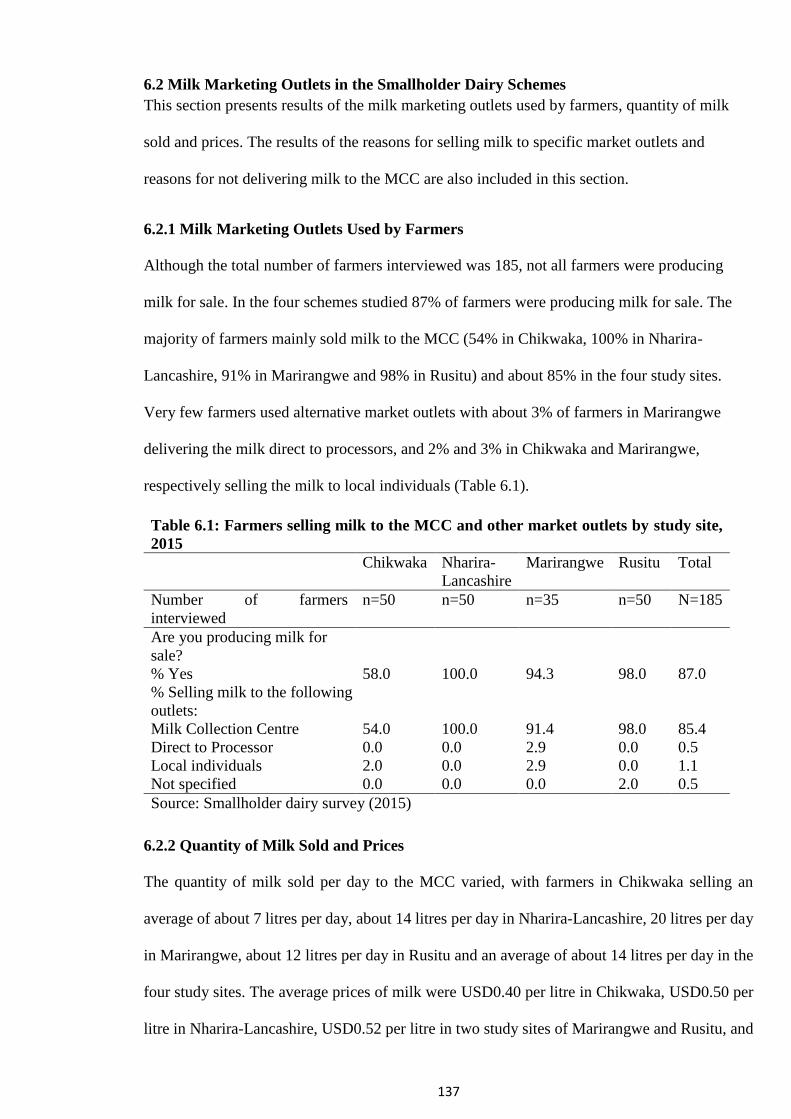


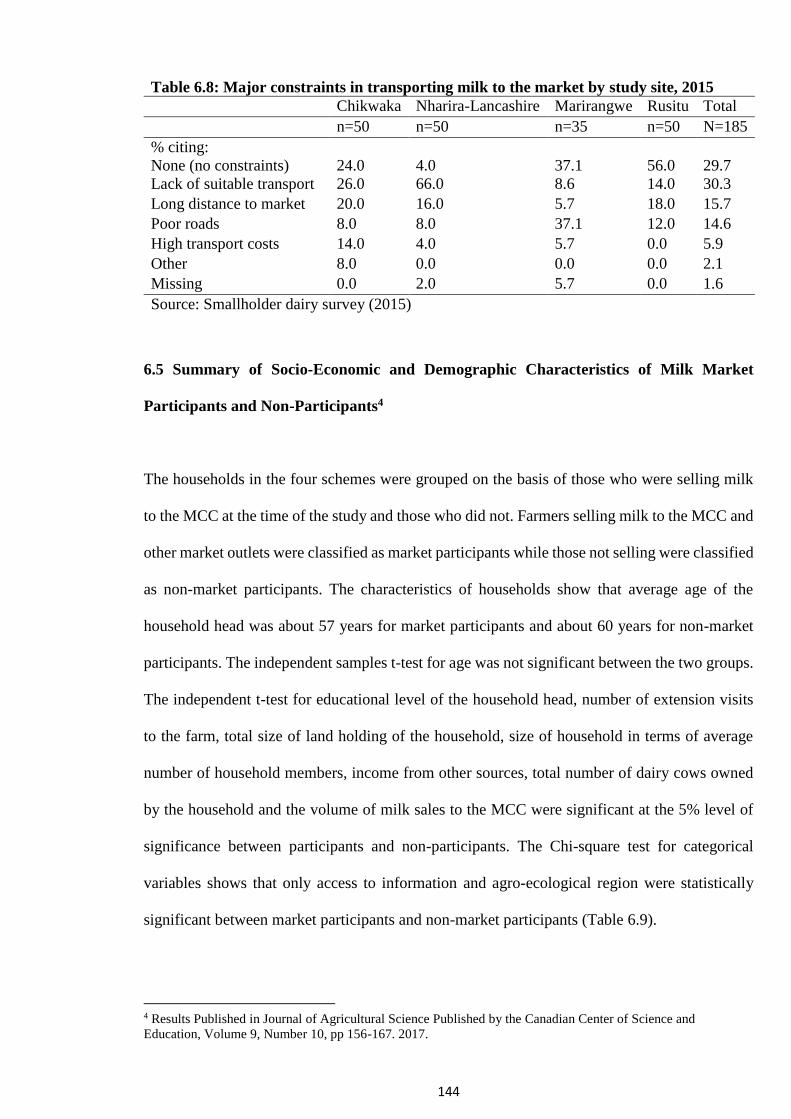


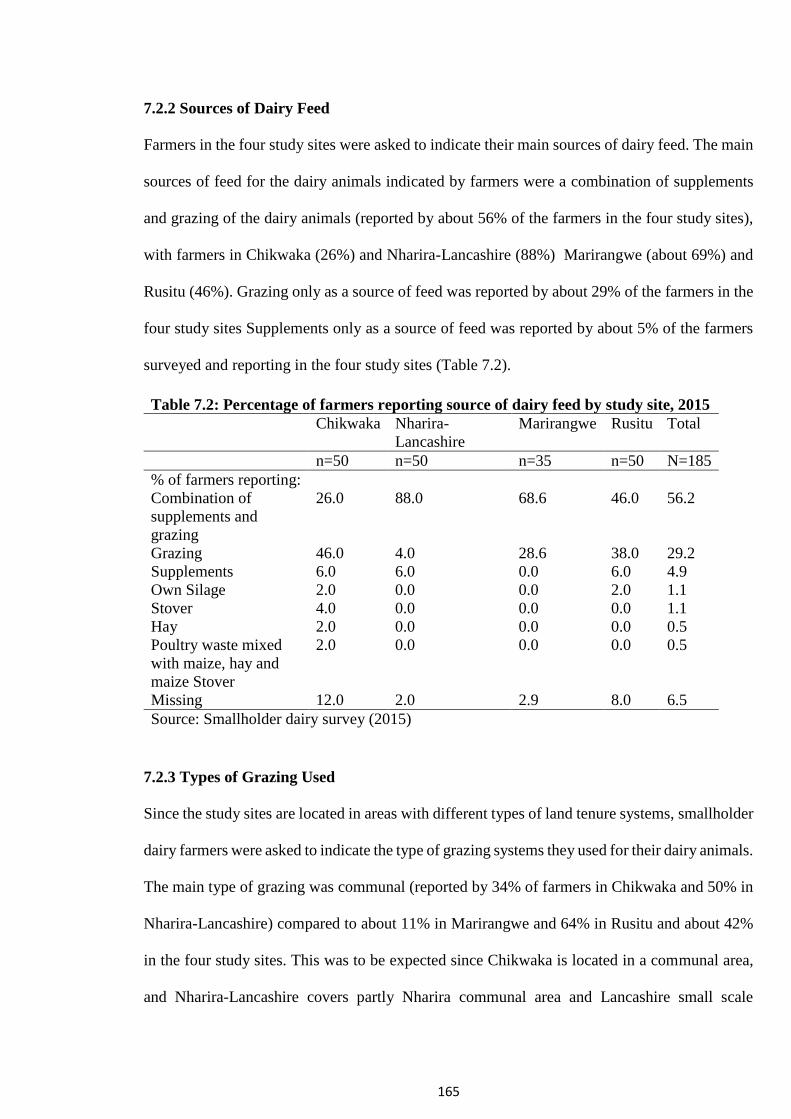


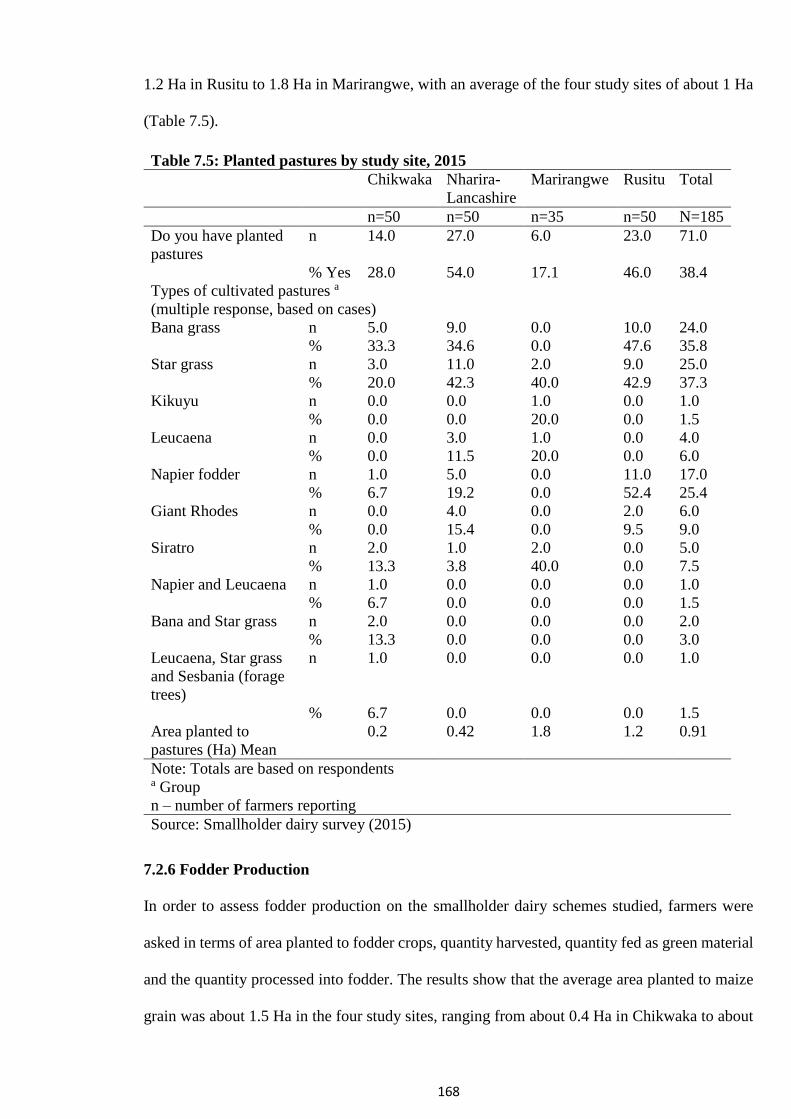

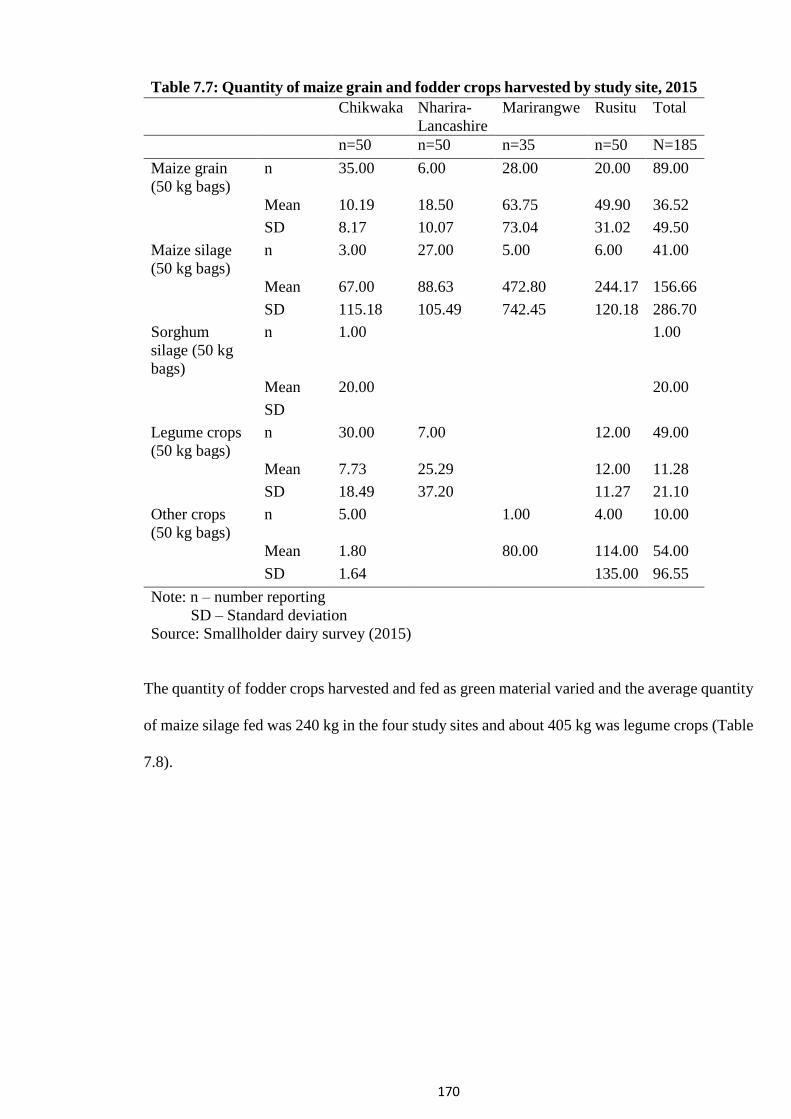


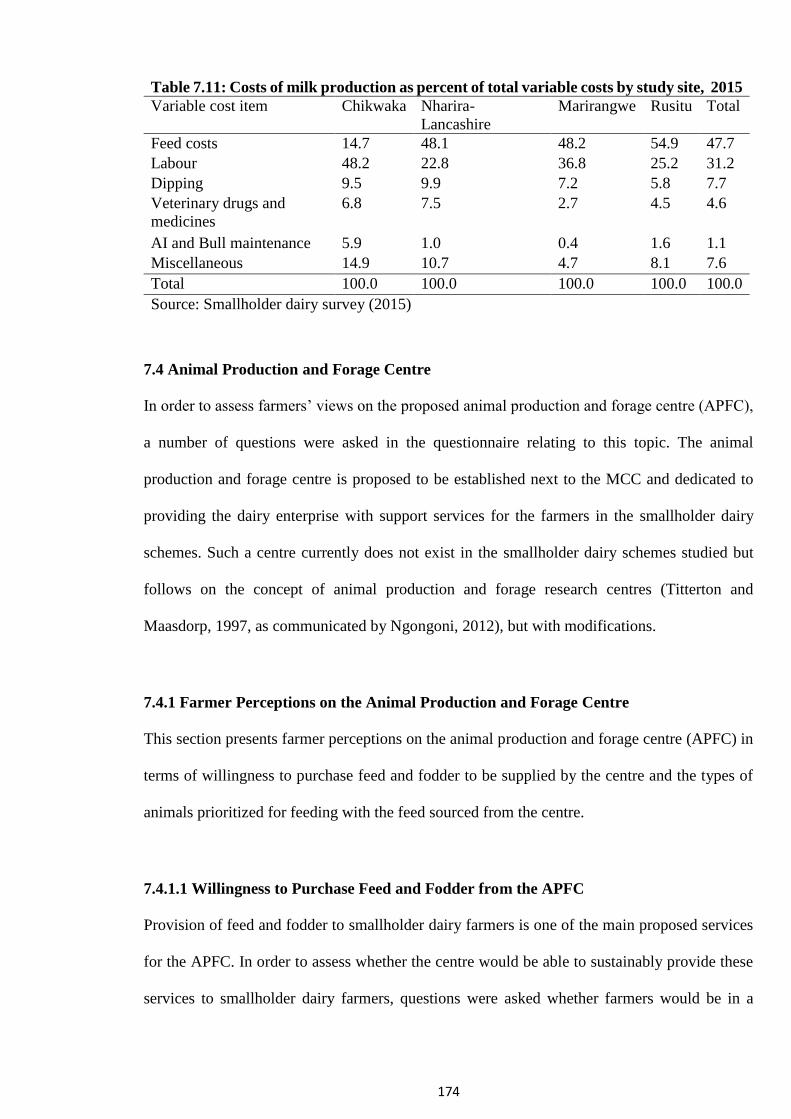


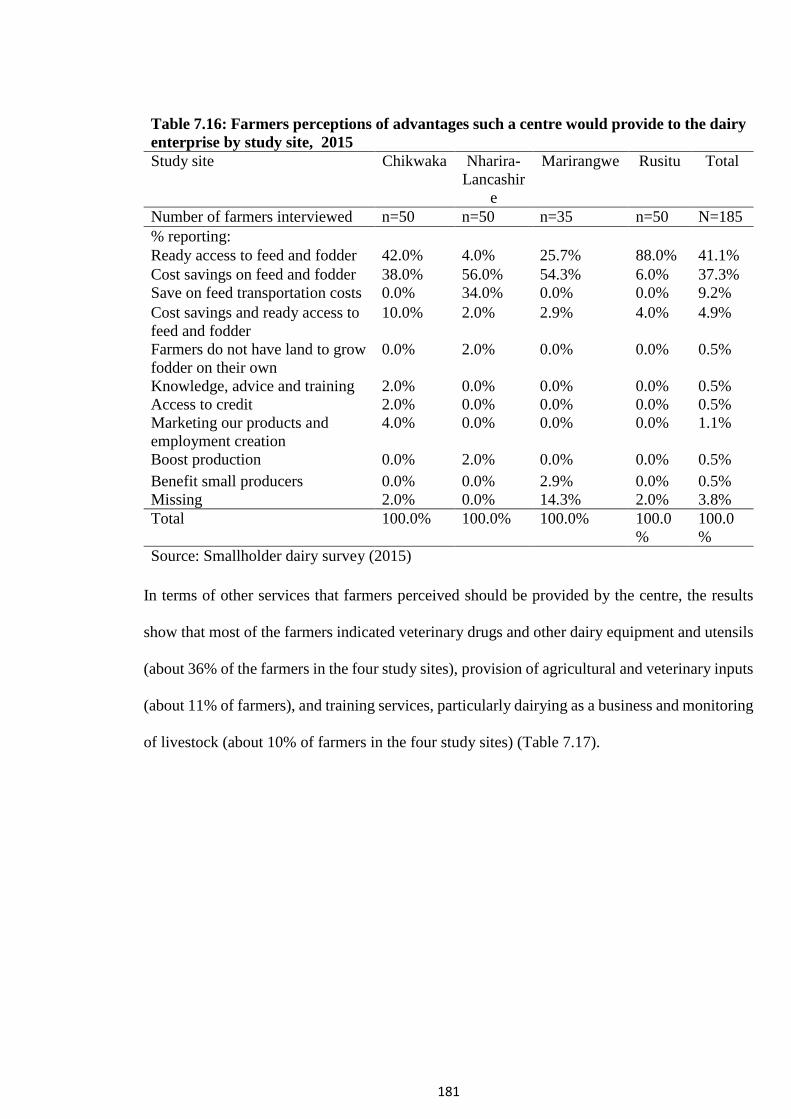


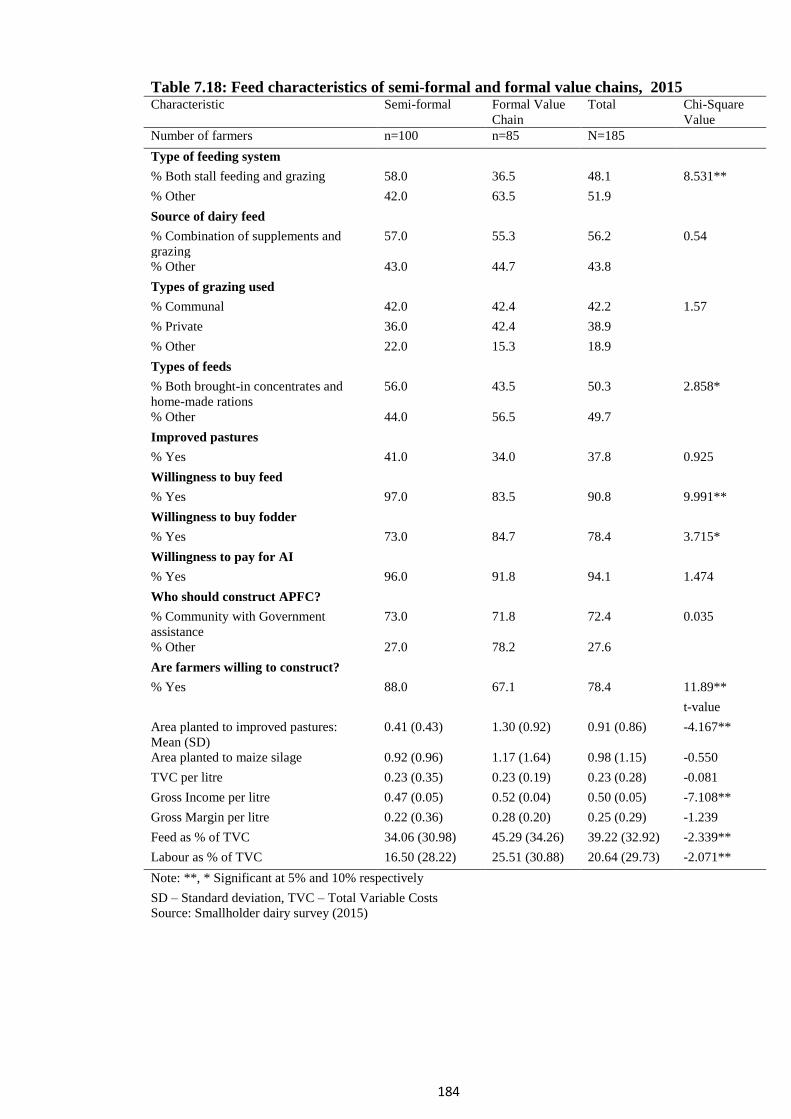


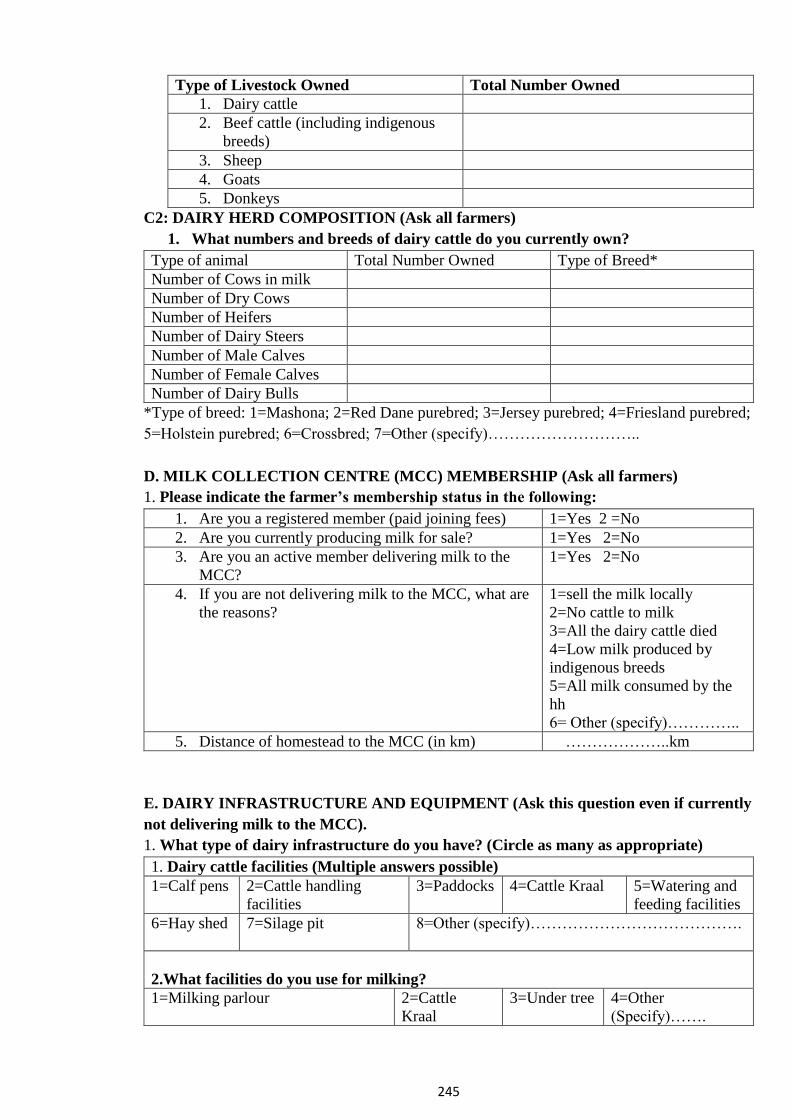


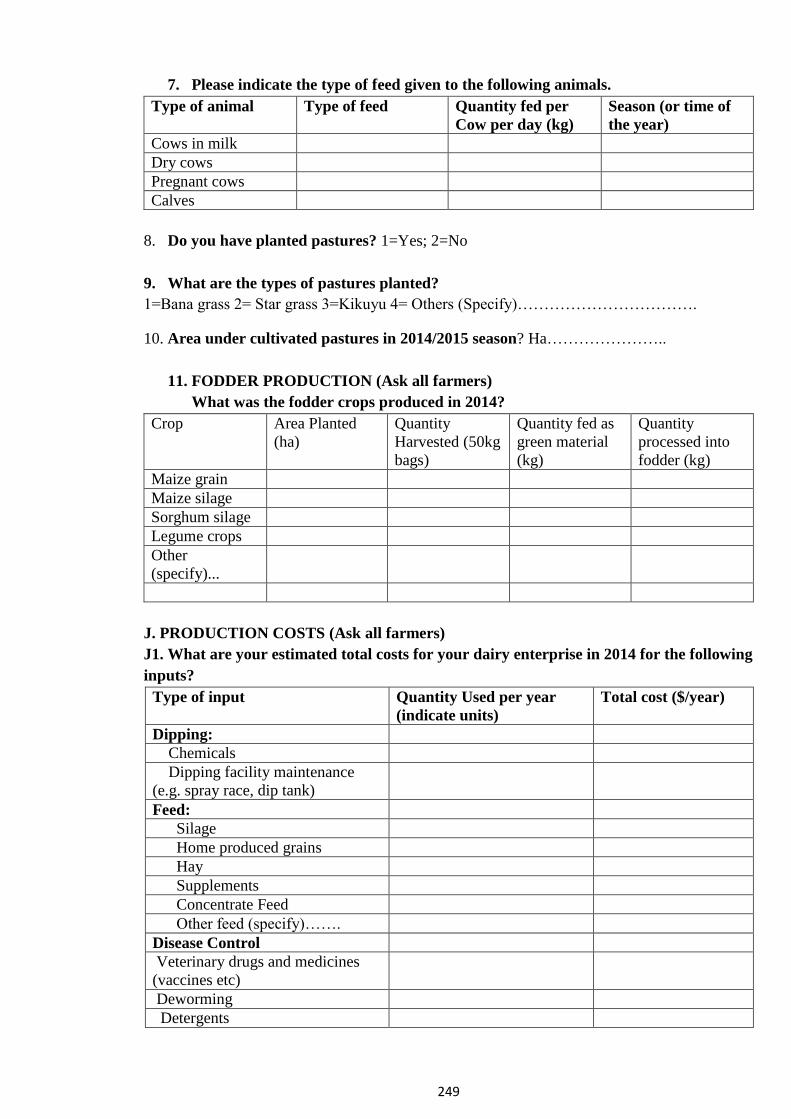


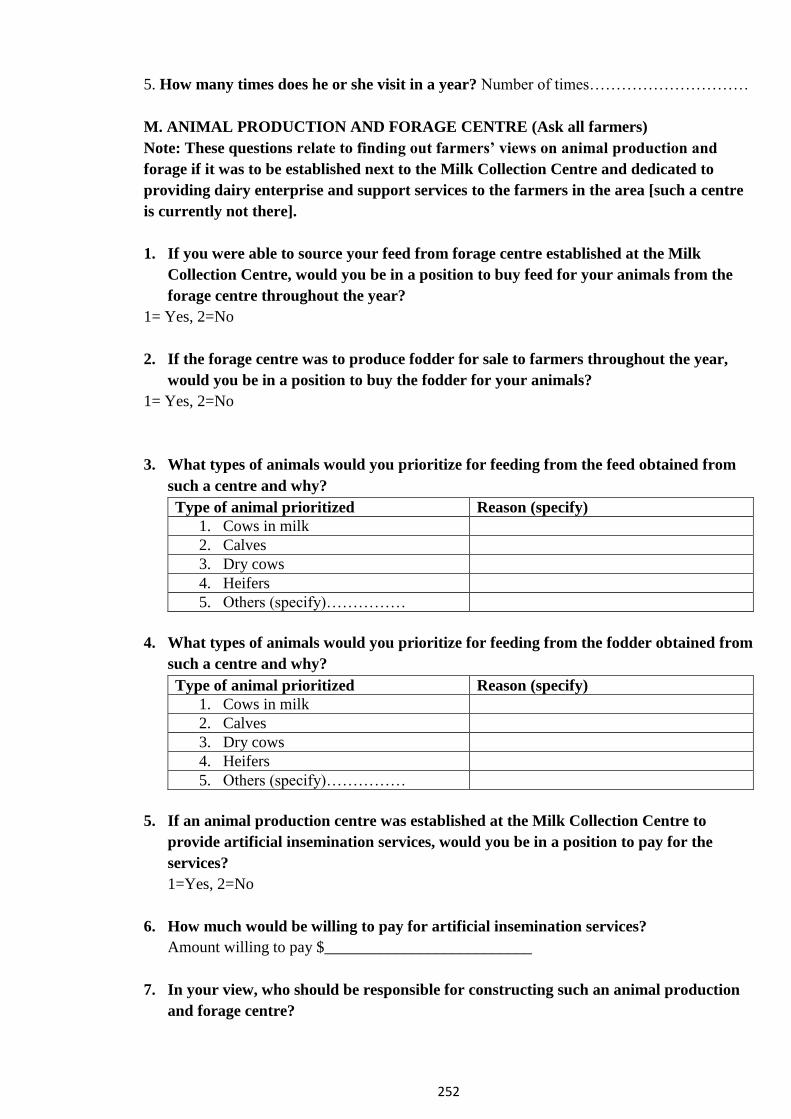


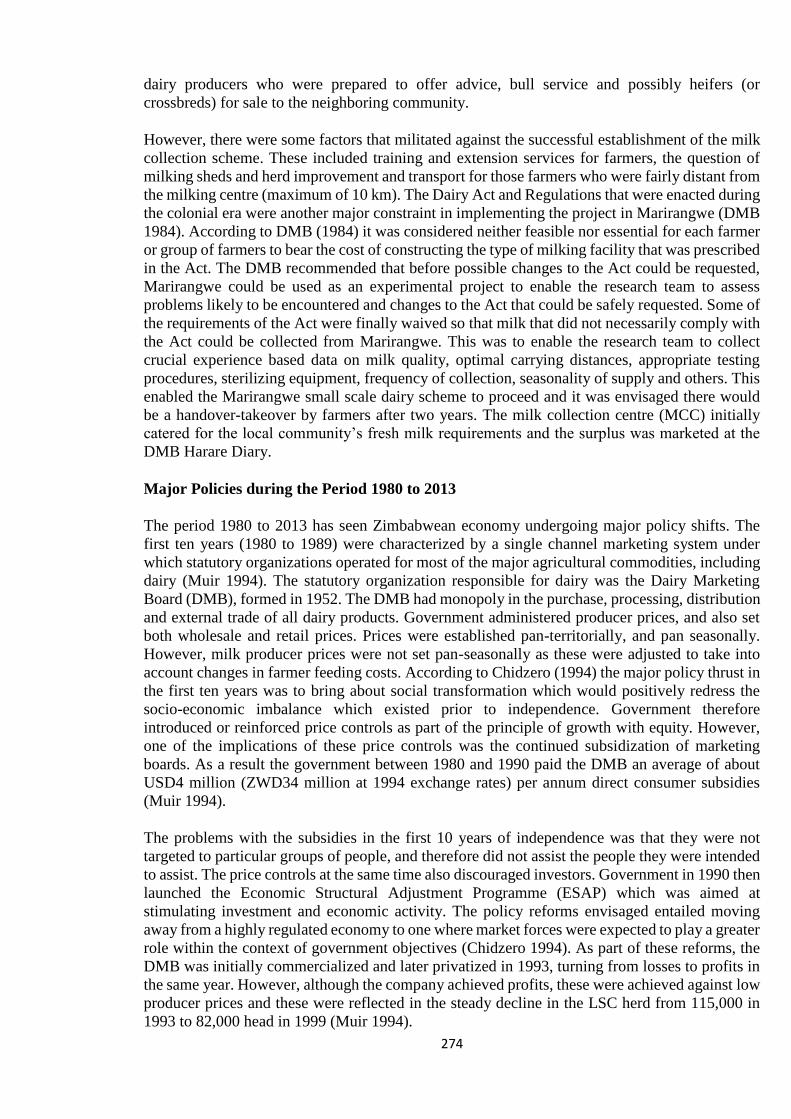


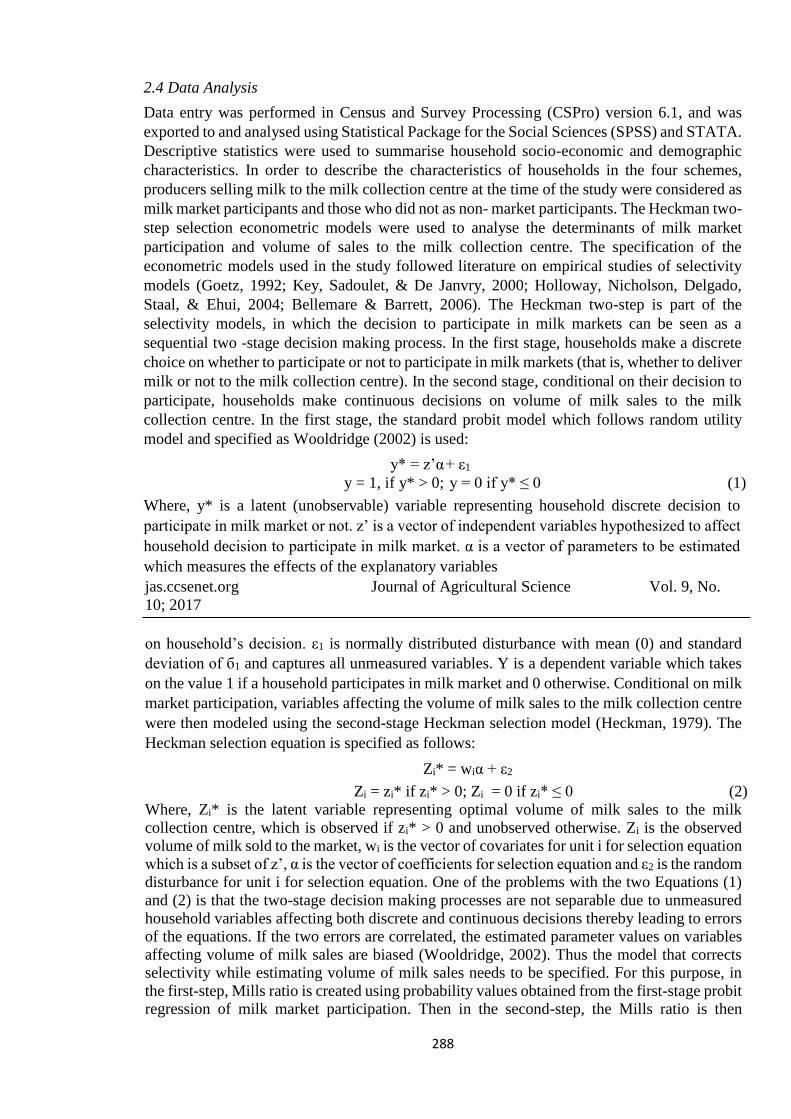

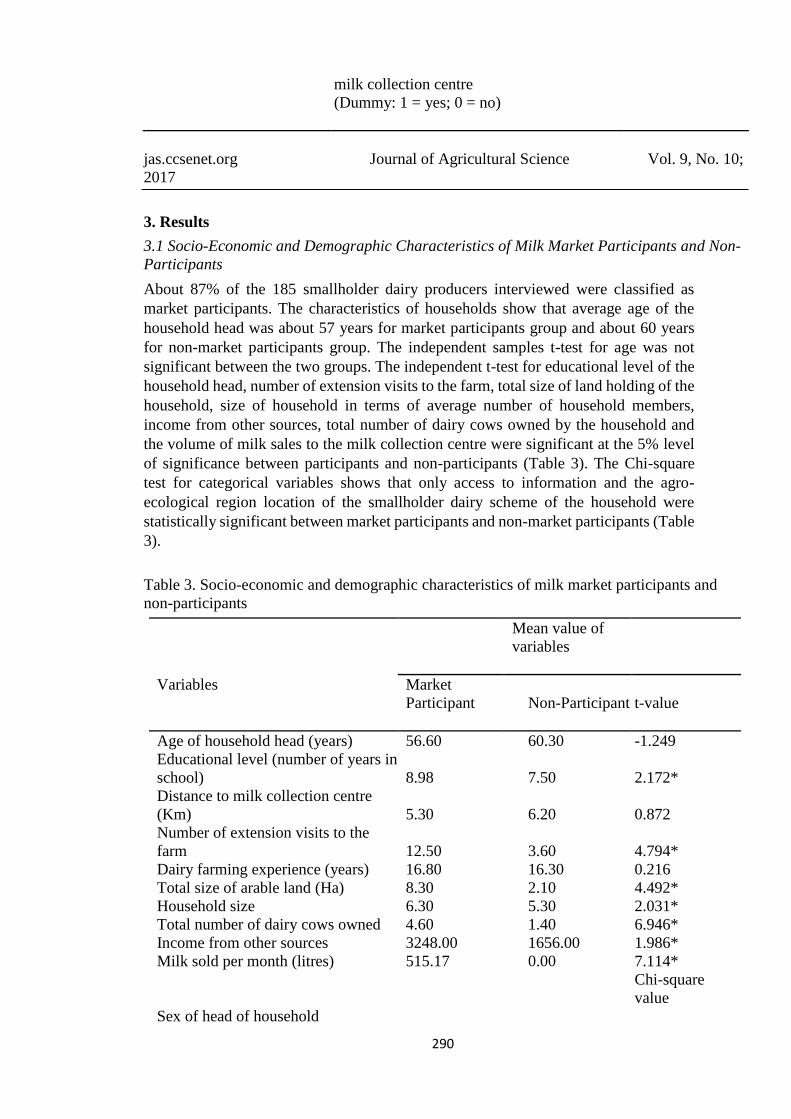


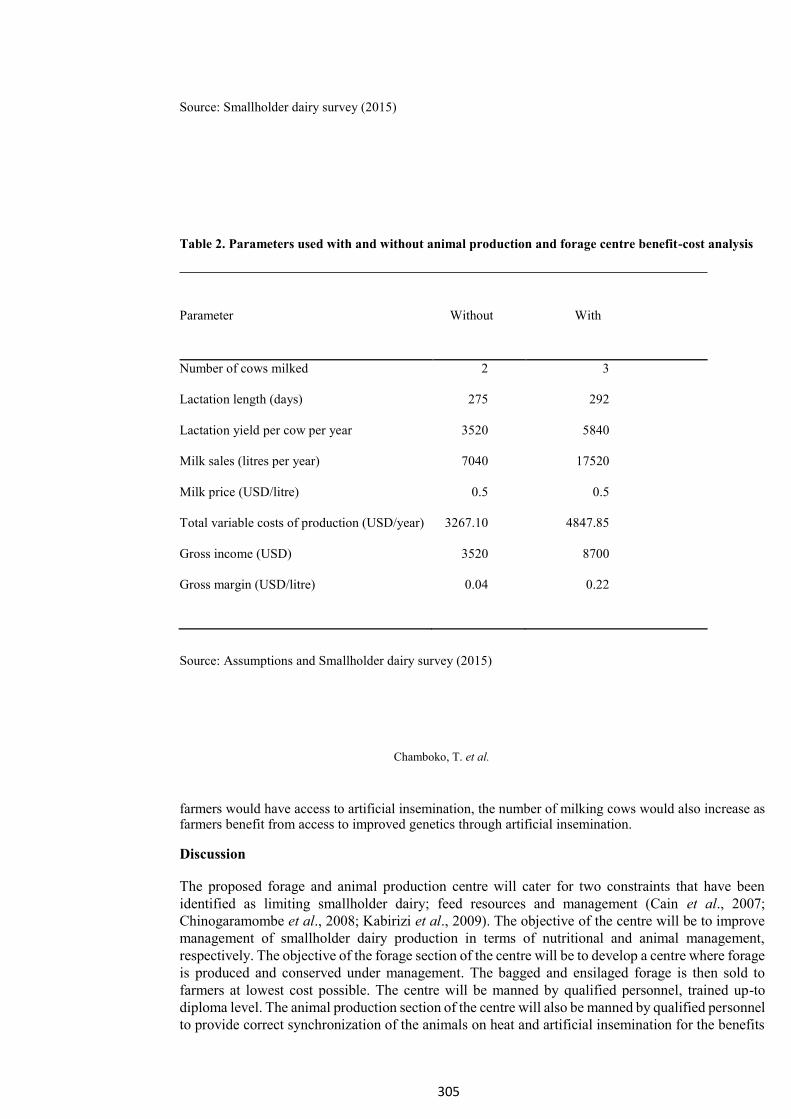


![Biogas Application Options within Milk Dairy Cooperatives ... · PDF filetotal milk production is estimated to 968,000 ton per year [8]. Many beef and dairy cattle farmers are organized](https://static.documents.pub/doc/80x56/5ab8ed277f8b9ad5338d6616/biogas-application-options-within-milk-dairy-cooperatives-milk-production-is.jpg)


