MILLIKEN CLEAN COAL TECHNOLOGY DEMONSTRATION PROJECT UNIT 7 LNCFS LEVEL 3 AND UNIT 2 BASELINE TEST PROGRAM RESULTS FINAL REPORT ZONSOL Inc. 1esearch and Development 1000 Brownsville Road _ibrary, PA 15129-9566 Prepared By Princioal Investiqators lamal B. Mereb tobert M. Statnick Subcontractor Energy Systems Associates 1840 Gateway Three Pittsburgh, PA 15222 Prepared For U.S. Department of Energy 'lliken Clean Coal Technology Demonstration Project DE-FC22-93PC92642 Electric Power Research Institute 3412 Hillview Avenue P.O. 80x 10412 Palo Alto, CA 94303 December 1996 New York State Electric & Gas Corporation Corporate Drive Kirkwood Industrial Park P.O. 80x 5224 Binghamton, NY 13902-5224 Princioal Investiqator Sandy S. Chang New York State Electric & Gas Corporation Corporate Drive Kirkwood Industrial Park P.O. Box 5224 Binghamton, NY 13902-5224 Empire State Electric Energy 1 Research Corporation 1515 Broadway, 43rd Floor New York, NY 10036-5701 CONSOL Inc. Research and Development 4#0 Brownsville Road ffbrary, PA 15129-9566
Electric Power Research Institute 3412 Hillview Avenue P.O. 80x 10412 Palo Alto, CA 94303
December 1996
New York State Electric & Gas Corporation
Corporate Drive Kirkwood Industrial Park P.O. 80x 5224 Binghamton, NY 13902-5224
Princioal Investiqator Sandy S. Chang
New York State Electric & Gas Corporation
Corporate Drive Kirkwood Industrial Park P.O. Box 5224 Binghamton, NY 13902-5224
Empire State Electric Energy 1 Research Corporation
1515 Broadway, 43rd Floor New York, NY 10036-5701
CONSOL Inc. Research and Development
4#0 Brownsville Road ffbrary, PA 15129-9566
DISCLAIMER OF WARRANTIES AND LIMITATION OF LIABILITIES
This report was prepared by the organization(s) named below as an account of work sponsored or cosponsored by NYSEG (New York State Electric & Gas Corporation). Neither NYSEG, nor any of the organization(s) listed below, nor any person acting on behalf of any of them:
(A)
@I
0
Makes any warranty or representation whatsoever, express or implied, (1) with respect to the use of any information, apparatus, method, process or similar item disclosed in this report, including merchantability and fitness for a particular purpose; or (2) that such use does not infringe on or interfere with privately owned rights, including any party’s intellectual property; or (3) that this report is suitable to any particular user’s circumstance; or
Assumes any responsibility for any damages or other liability whatsoever (including any consequential damages, even if NYSEG or any NYSEG representative has been advised of the possibility of such damages) resulting from your selection or use of this report or any information, apparatus, method, process or similar item disclosed in this report.
Reference herein to any specific commercial product, process, or service by trade name, trademark, manufacturer, or otherwise, does not necessarily constitute or imply its endorsement, recommendation, or favoring by the United States government or any agency thereof. The views and opinions of authors expressed herein do not necessarily state or reflect those of the United States government or any agency thereof
ORGANIZATION(S) THAT COFUNDED THIS REPORT:
New York State Electric & Gas Corporation US Department of Energy Corporate Drive, Kirkwood Industrial Park FETC P.O. Box 5224 P.O. Box 10940 Binghamton, NY 13902-5224 Pittsburgh, PA 15 129-9566 Attn: James J. Harvilla Attn: James Watts
Electric Power Research Institute 34 12 Hillview Avenue P.O. Box 10412 Palo Alto, CA 94303 Attn: Richard Rhudy
CONSOL, Inc. Research & Development 4000 Brownsville Road Library, PA 15 129-9566 Attn: Robert Statnick
Empire State Electric Energy Research Corporation
15 15 Broadway, 43rd Floor New York, NY 10036-5701 Attn: Debra Dimeo
NYS Energy Research and Development Authority
Two Rockefeller Plaza Albany, NY 12223 Attn: Joseph H. Sayer
ORDERING INFORMATION For information about ordering this report, contact James J. Hat-villa, Project Manager, New York State Electric & Gas Corporation, Corporate Drive, Kirkwood Industrial Park, P.O. Box 5224, Binghamton, NY 13902-5224, (607) 762-8630.
ACKNOWLEDGEMENTS
The authors wish to acknowledge the contribution of the following personnel: Mr. T. Hohn, Mr. K. Mooney and Mr. D. Stafford of New York State Electric & Gas Corporation; Mr. J. Fish of Pozzolanic International Inc.; Mr. R. M. Meeder of Energy Systems Associates; and Dr. M. F. Abbott, Mr. N. J. DeIuliis, Mr. M. S. DeVito, Mr. D. C. McCoy, Dr. D. G. Nichols, and Mr. D. J. Pazuchanics of CONSOL Inc.
The authors also thank Mr. K. D. Zammit of Electric Power Research Institute and Mr. R. R. Hardman of Southern Company Services Inc. for sharing their experience and knowledge on low-NO, burner retrofit.
TABLE OF CONTENTS
ABSTRACT
Page
Introduction 1
Objective
Discussion Unit 2 Baseline Diagnostic Test Program Unit 1 Post-Retrofit Diagnostic Test Program Long-Term Test Program Validation Test Program Performance Evaluation
SECTION ONE: INTRODUCTION
1.1 Objectives
1.2 Background 1.2.1 Comparison of Milliken Units 1 and 2 NO, Emissions
1.3 Unit 2 Baseline and Unit 1 Post-Retrofit Diagnostic Tests
1.4 Long-Term, Validation and Performance Testing
SECTION TWO: UNIT 2 BASELINE DIAGNOSTIC TESTS
2.1 Experimental Design
2.2 Experimental Plan 2.2.1 Measurements
2.3 Results and Discussion 2.3.1 Experimental Error 2.3.2 Experimental Results 2.3.3 Effects of Fuel Air Flow and Burner Tilt 2.3.4 Effects of Mill Pattern 2.3.5 Effects of Boiler Load and Excess 0, 2.3.6 Variations of NO, Emissions and LO1 2.3.7 Predictive Correlations for NO, Emissions and LOI
2.4 Conclusions
6
8
8
9
10 10
:;
:i 12
:: 13
13
i
TABLE OF CONTENTS (CONT.)
Page
SECTION THREE: UNIT 1 POST-RETROFIT DIAGNOSTIC TESTS
3.1 Experimental Design
3.2 Experimental Plan 32 3.2.1 Measurements 32
3.3 Results and Discussion 3.3.1 Data Evaluation 3.3.2 Experimental Error 3.3.3 Experimental Results 3.3.4 Effects of Combustion Air Distribution and Burner Tilt 3.3.5 Effects of Mill Pattern 3.3.6 Effects of Boiler Load and Excess O2 3.3.7 Variations of NO, Emissions and LO1 3.3.8 Predictive Correlations for NO, Emissions and LO1
3.4 Conclusions 38
SECTION FOUR: LNCFS-3 SYSTEM START-UP, INSTALLATION COSTS AND FUEL DUCT BALANCING TESTS
4.1 LNCFS-3 System Start-Up
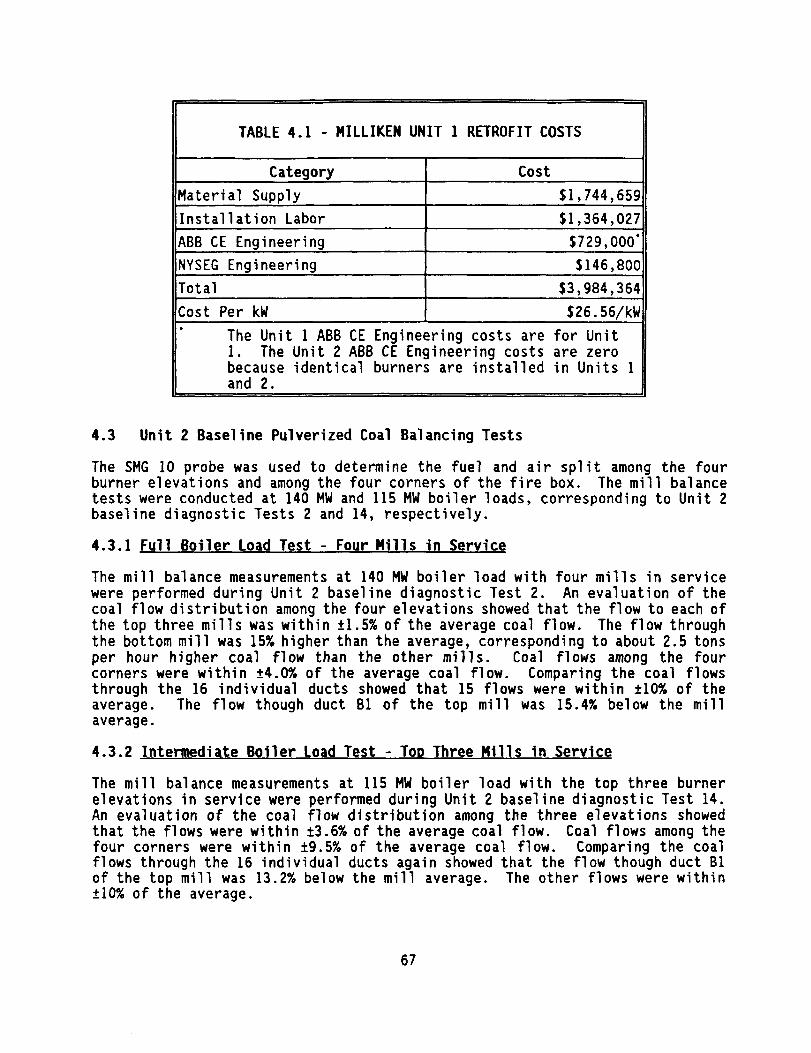
4.2 LNCFS-3 Installation Costs 4.2.1 Capital Costs
4.3 Unit 2 Baseline Pulverized Coal Balancing Tests 4.3.1 Full Boiler Load Test - Four Mills in Service 4.3.2 Intermediate Boiler Load Test -
Top Three Mills in Service
4.4 Unit 1 Post-Retrofit Pulverized Coal Balancing Tests 4.4.1 Full Boiler Load Test - Four Mills in Service
SECTION FIVE: LONG-TEN, VALIDATION AND PERFORMANCE TESTING
5.1 Long-Term Testing 69
5.2 Validation Test Programs 5.2.1 Unit 2 Baseline Validation Test Program 5.2.2 Unit 1 LNCFS-3 Validation Test Program
5.3 LNCFS-3 Performance Evaluation 72 5.3.1 NO, Control 72 5.3.2 Boiler Efficiency 73
31
33
3": 35 35 36
3°F 38
66
67
68 68
:i 70
ii
LIST OF TABLES
1.1 Milliken Pre-Retrofit Unit 2 and
2.1
2.2
2.3
2.4
2.5
2.6
2.7
2.8
3.1
3.2
Post-Retrofit Unit 1 Description
Unit 2 Baseline Tests - Parameter Settings
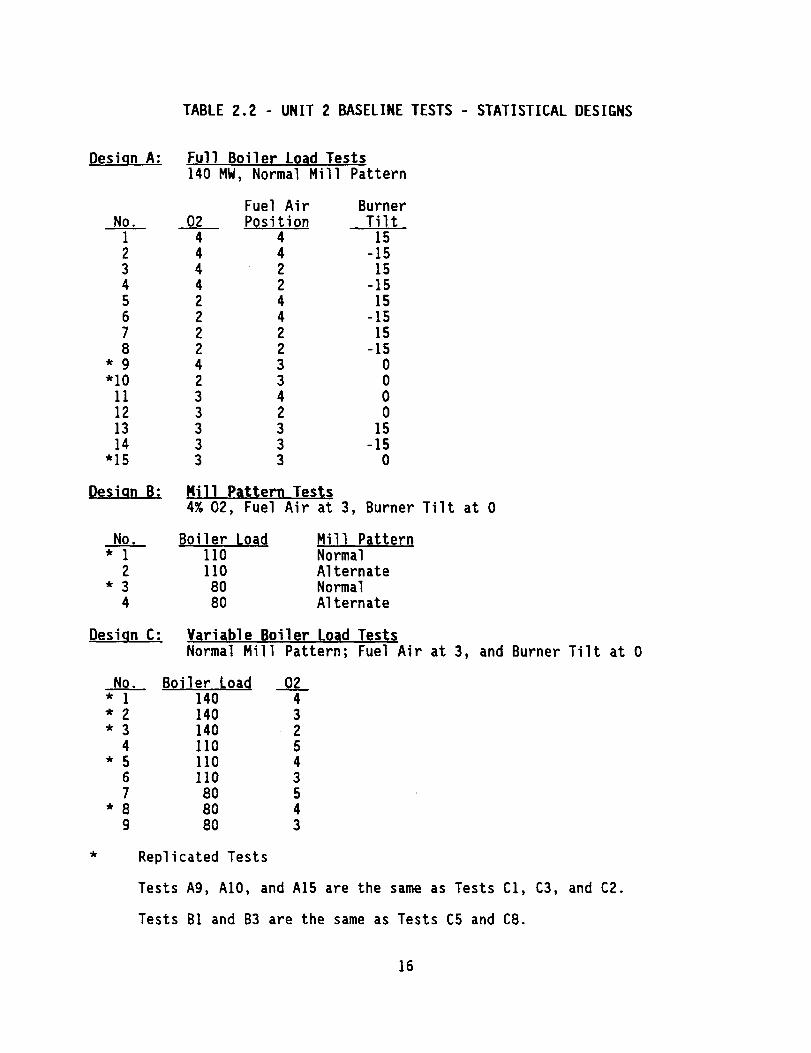
Unit 2 Baseline Tests - Statistical Designs
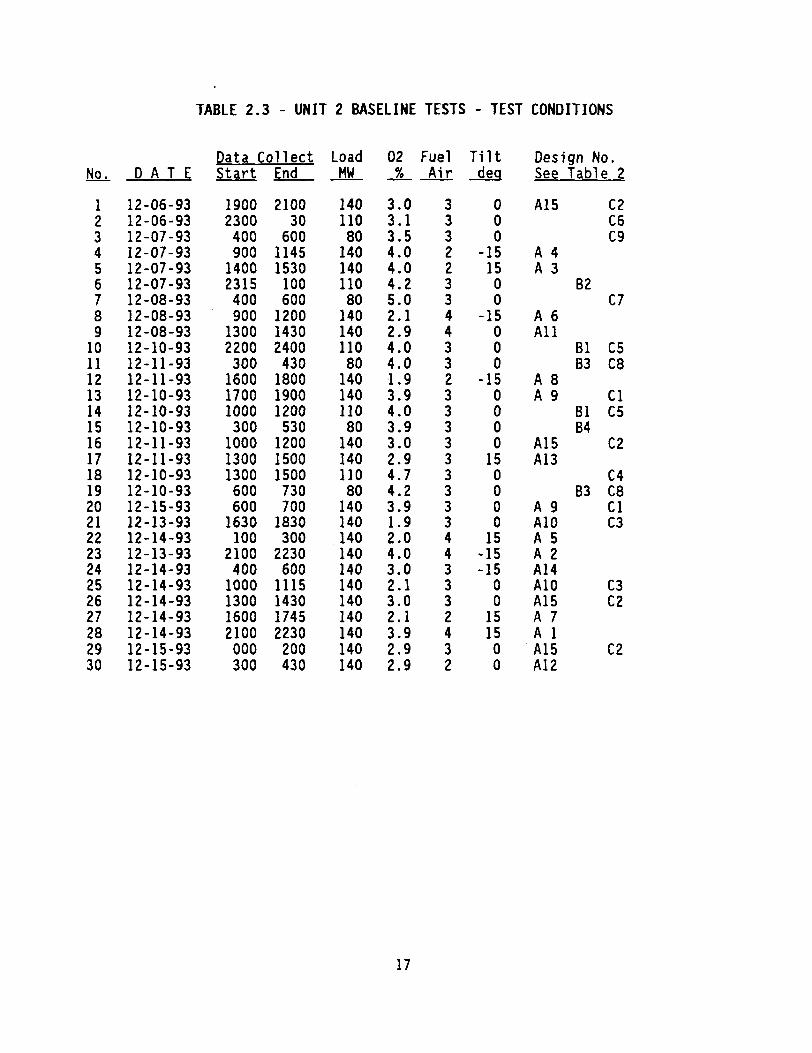
Unit 2 Baseline Tests - Test Conditions
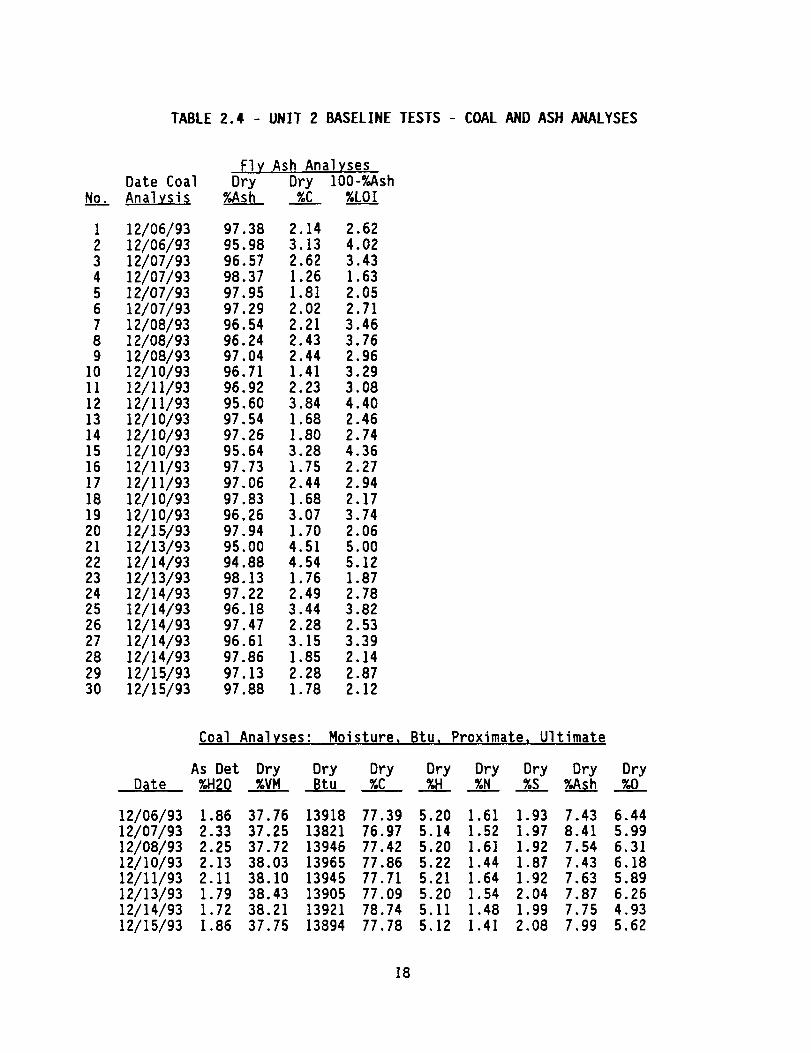
Unit 2 Baseline Tests - Coal and Ash Analyses
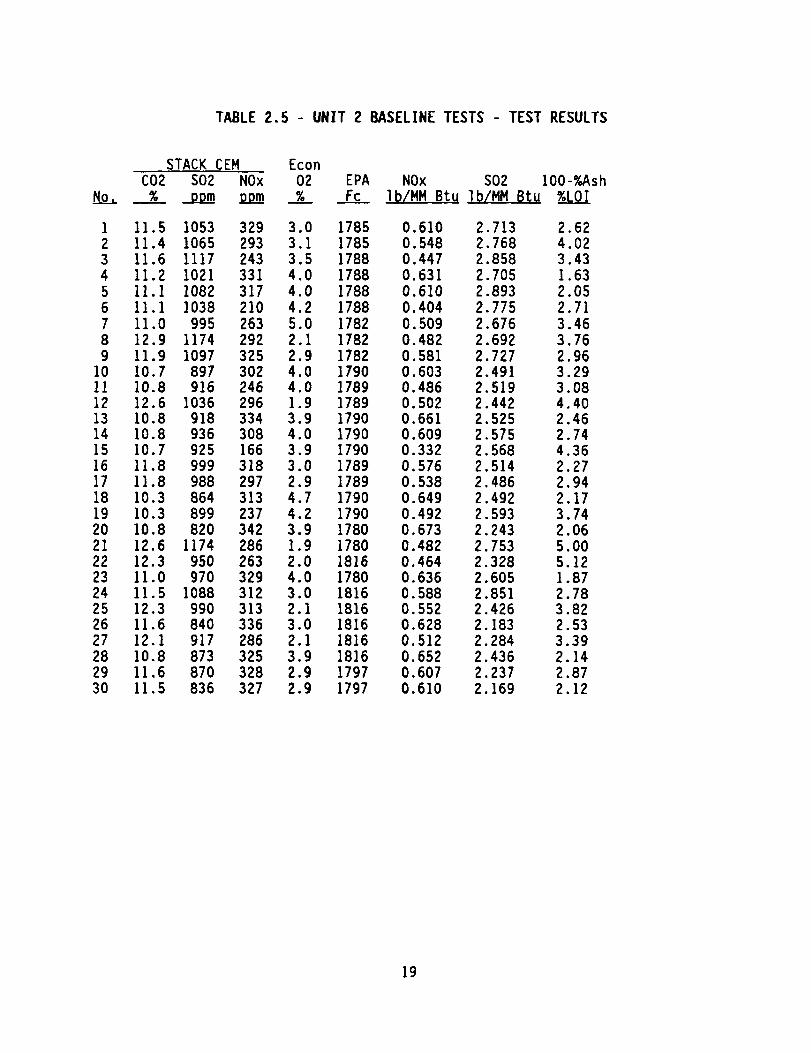
Unit 2 Baseline Tests - Test Results
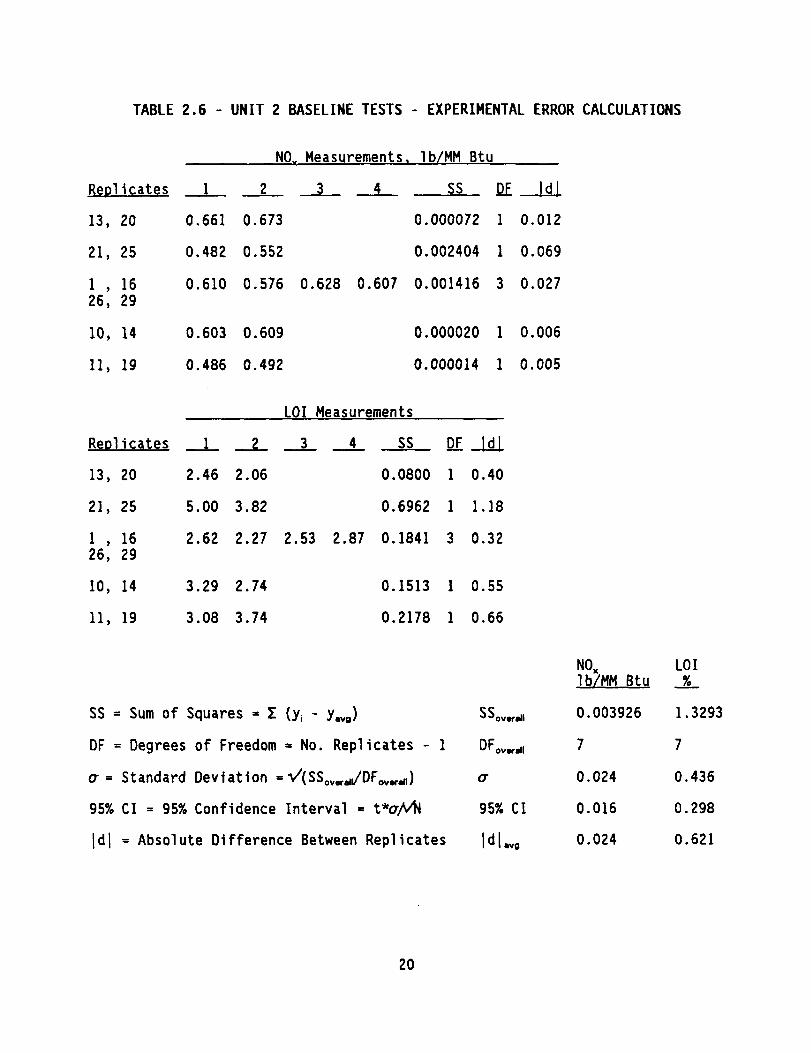
Unit 2 Baseline Tests - Experimental Error Calculations
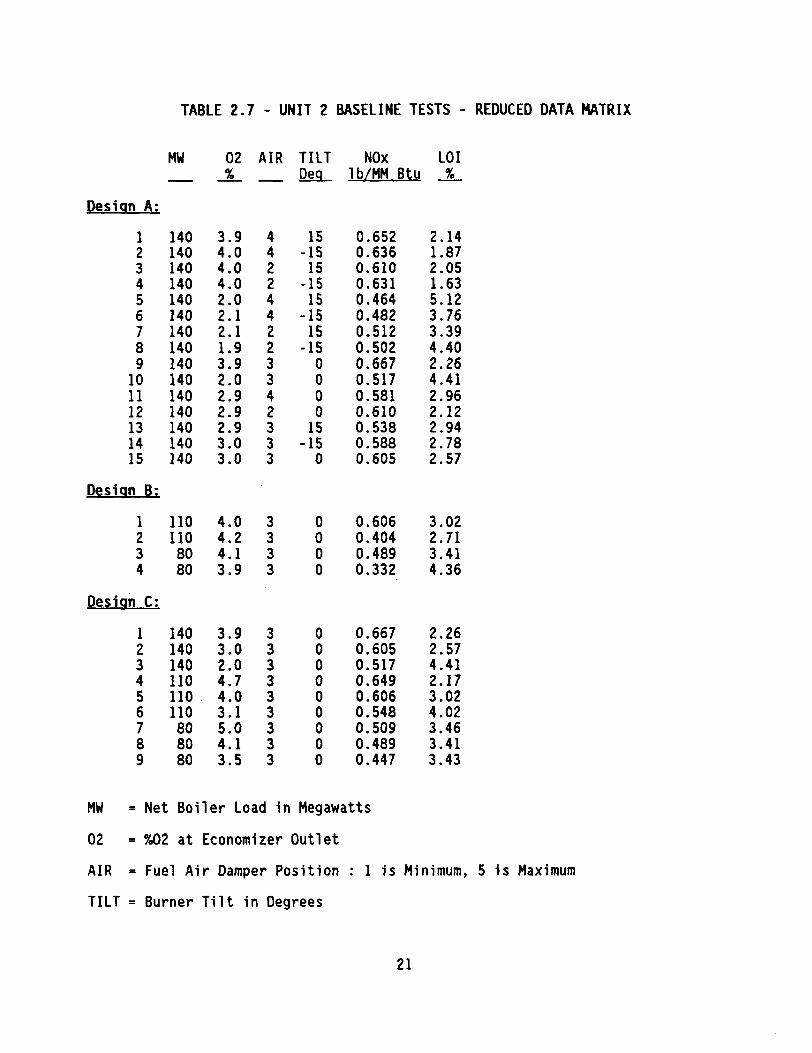
Unit 2 Baseline Tests - Reduced Data Matrix
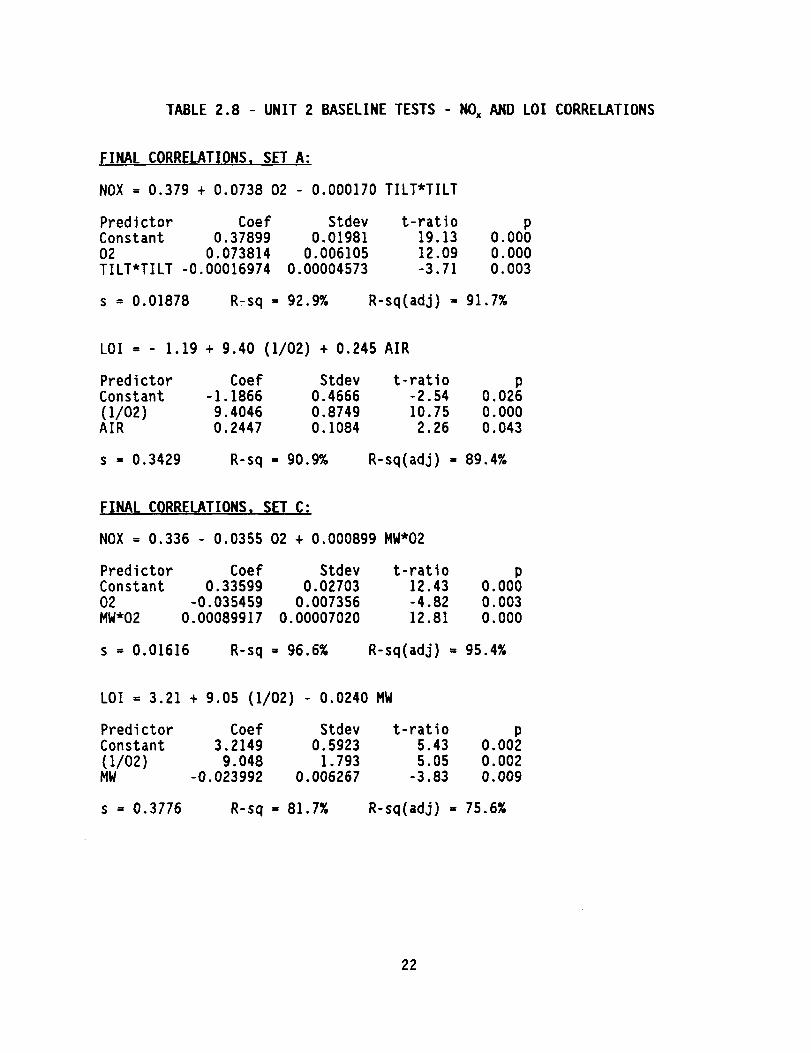
Unit 2 Baseline Tests - NO, and LO1 Correlations
Unit 1 Post-Retrofit Tests - Parameter Settings
Unit 1 Post-Retrofit Tests - Design A, Full Boiler Load Tests 42
3.6 Unit 1 Post-Retrofit Tests - Experimental Test Conditions
3.7 Unit 1 Post-Retrofit Tests - Gas Stratification Data
3.8 Unit 1 Post-Retrofit Tests - Fly Ash Analyses
3.9 Unit 1 Post-Retrofit Tests - Coal Analyses
3.10 Unit 1 Post-Retrofit Tests - Gas Analyses Data
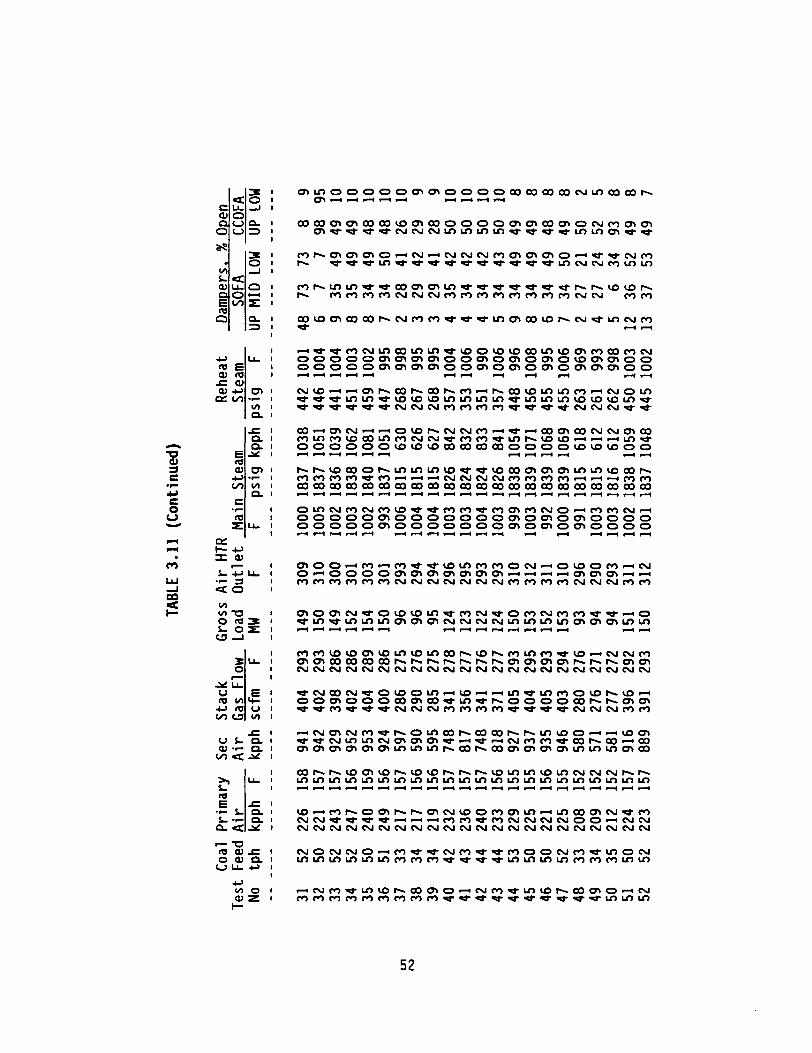
3.11 Unit 1 Post-Retrofit Tests - Test Parameters
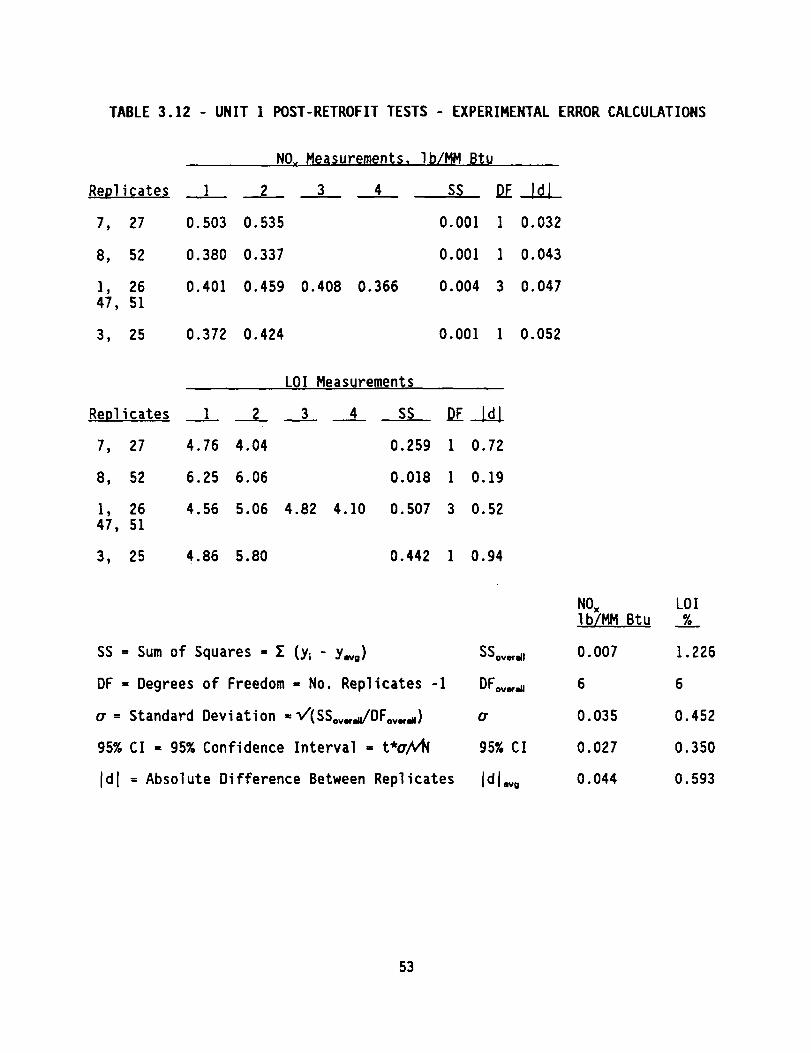
3.12 Unit 1 Post-Retrofit Tests - Experimental Error Calculations
Page
6
15
16
17
18
19
20
21
22
41
44
45
46
47
48
49
50
51
53
iii
LIST OF TABLES (CONT.)
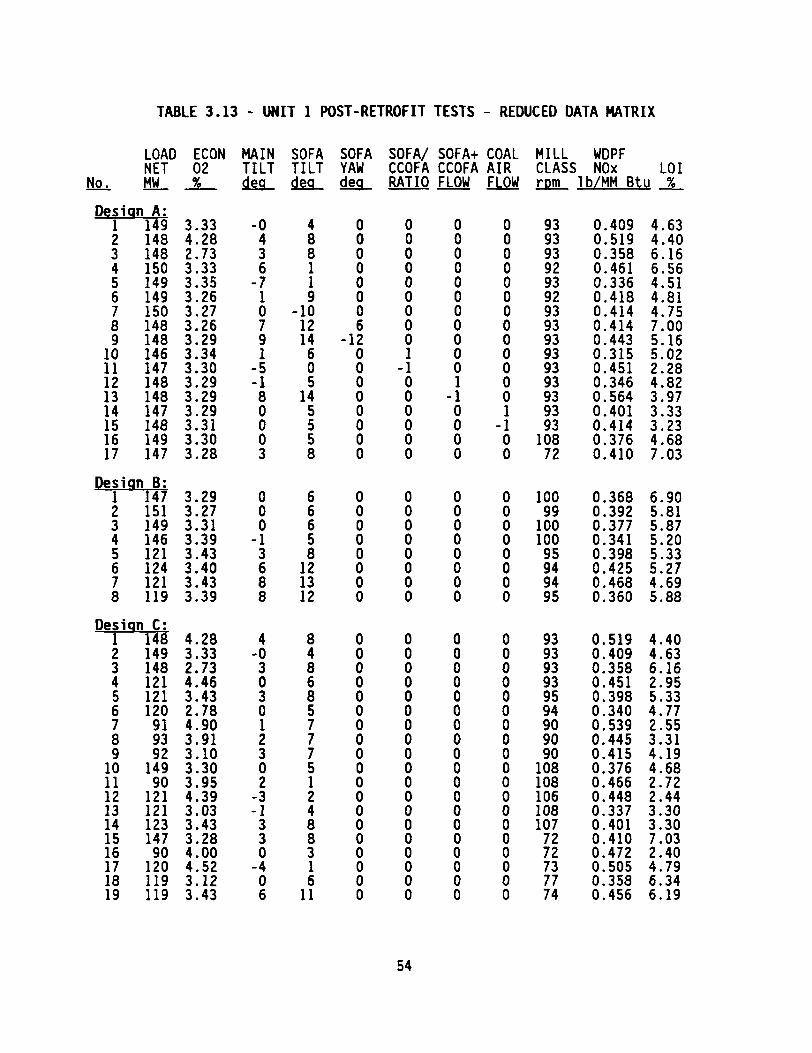
3.13 Unit 1 Post-Retrofit Tests - Reduced Data Matrix
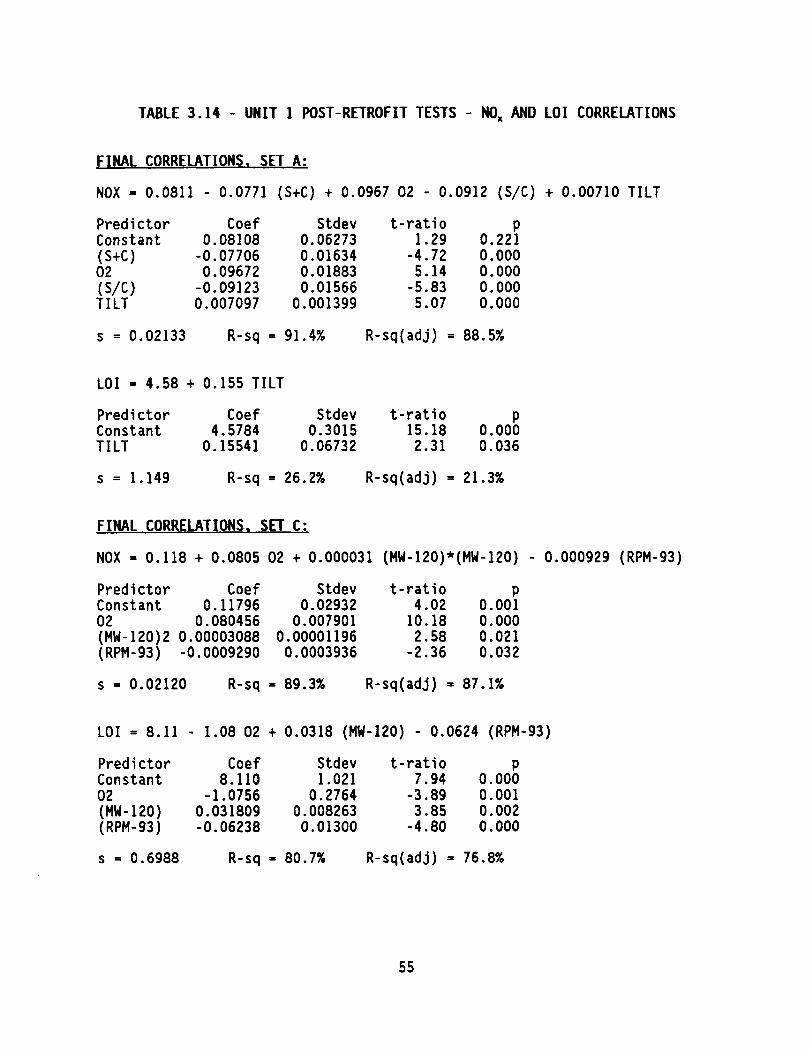
3.14 Unit 1 Post-Retrofit Tests - NO, and LO1 Correlations
4.1 Milliken Unit 1 Retrofit Costs
5.1 Long-Term NO, Emissions
5.2 Unit 2 Baseline Validation Test Results
5.3 Unit 1 LNCFS-3 Validation Test Results
5.4 LNCFS-3 Impact on NO, Emissions
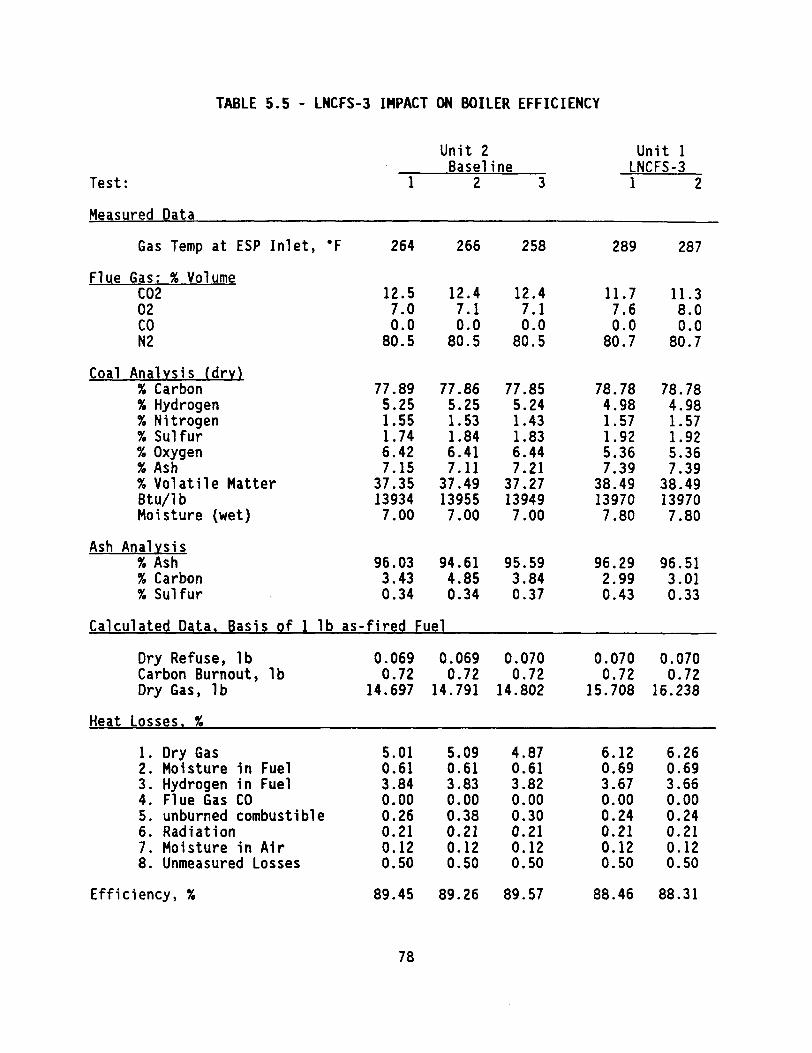
5.5 LNCFS-3 Impact on Boiler Efficiency
Page
54
55
67
74
75
76
77
78
iv
LIST OF FIGURES
Page
23
24
25
2.1
2.2
2.3
2.4
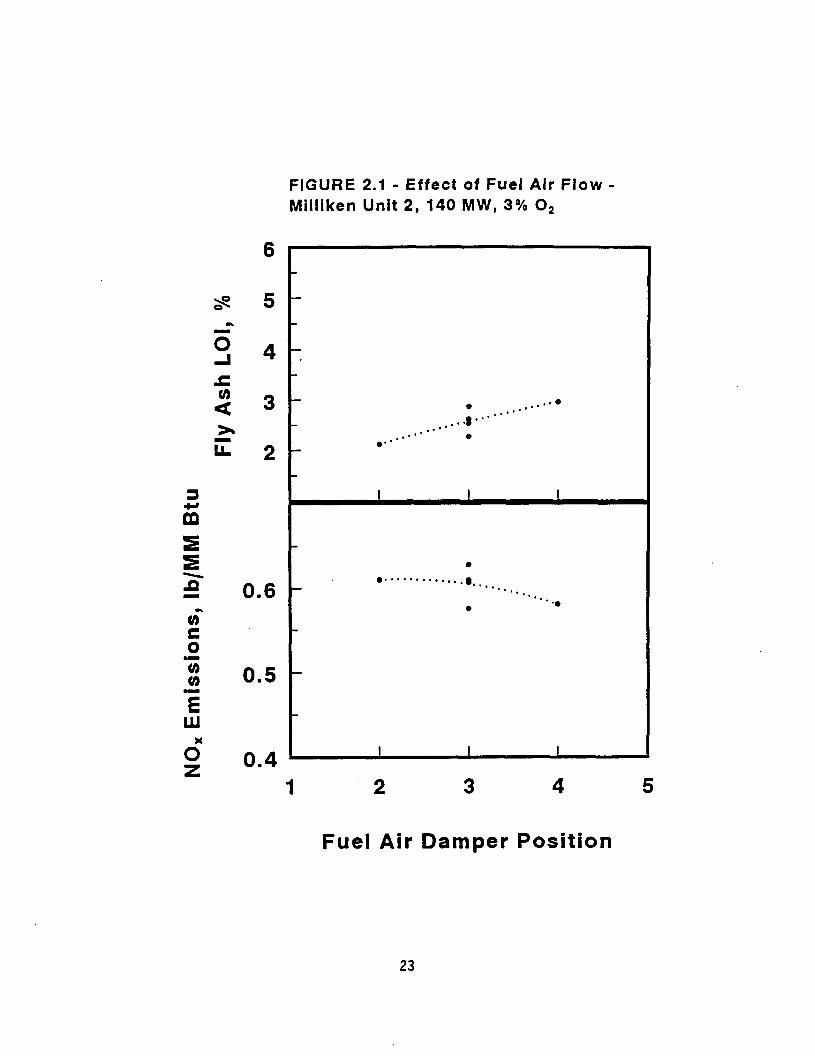
Effect of Fuel Air Flow - Milliken Unit 2, 140 MW, 3% O2
Effect of Burner Tilt - Milliken Unit 2, 140 MW, 3% 0,
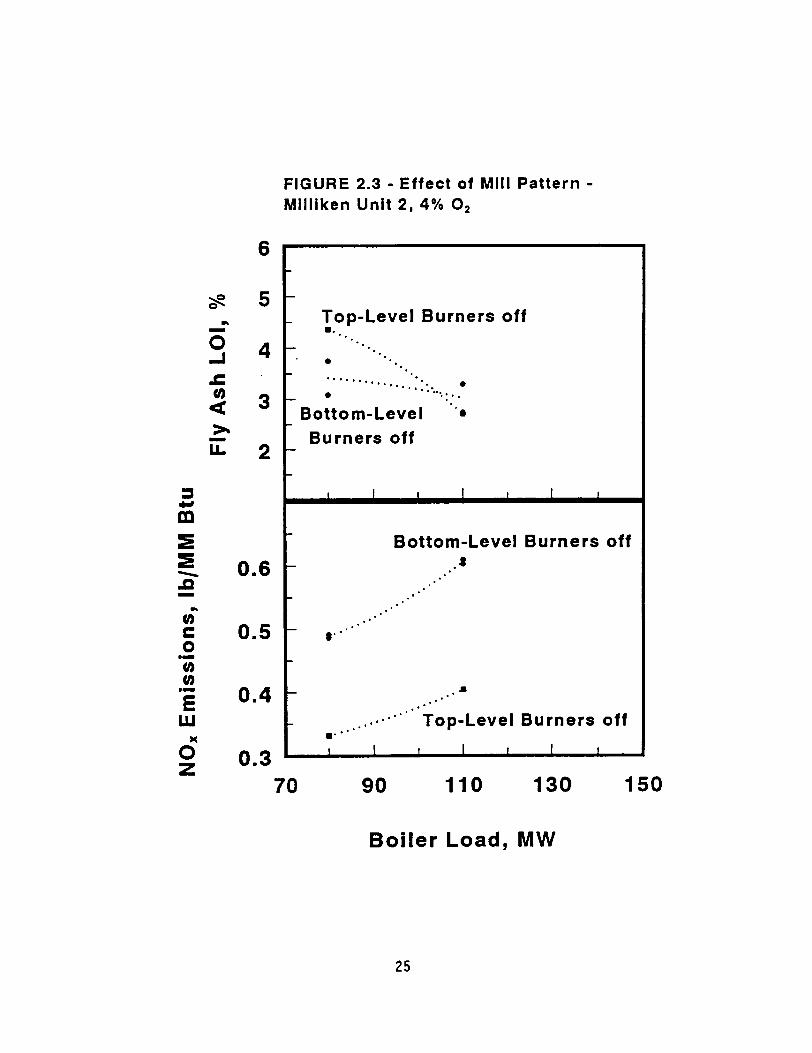
Effect of Mill Pattern - Milliken Unit 2, 4% 0,
Effect of Excess Air - Milliken Unit 2, Parameter: Boiler Load 26
2.5 Effect of Boiler Load - Milliken Unit 2, Parameter: %O, 27
28
29
2.6
2.7
2.8
Effect of Excess Air - Milliken Unit 2, 140 MW
LO1 Variation With NO, - Milliken Unit 2, 140 MW
Predicted vs. Measured NO, Emission, Milliken Unit 2, Dec. 93 Baseline Tests 30
Predicted vs. Measured LOI, Milliken Unit 2, Dec. 93 Baseline Tests
2.9 30
3.1 Effect of Burner Tilt - Milliken Unit 1, Main and SOFA Tilts 56
57 3.2 Effect of SOFA Yaw - Milliken Unit 1, SOFA Yaw
3.3 Effect of Air Distribution - Milliken #l, SOFA/CCOFA Split, Coal Air 58
Effect of Mill Pattern 59 3.4
3.5 Effect of Excess Air - Milliken Unit 1, Parameter: Boiler Load 60
3.6 Effect of Boiler Load - Milliken Unit 1, Parameter: %D, 61
3.7 Effect of Excess Air - Milliken Unit 1, Parameter: Mill rpm 62
3.8 Effect of Coal Fineness, 3.3% 0, - Milliken Unit 1, Parameter: Boiler Load 63
Effect of Coal Fineness, 120 MW - Milliken Unit 1, Parameter: O2
3.9 64
V
LIST OF FIGURES (CONT.)
Page
3.10
3.11
5.1
5.2
5.3
5.4
5.5
5.6
5.7
5.8
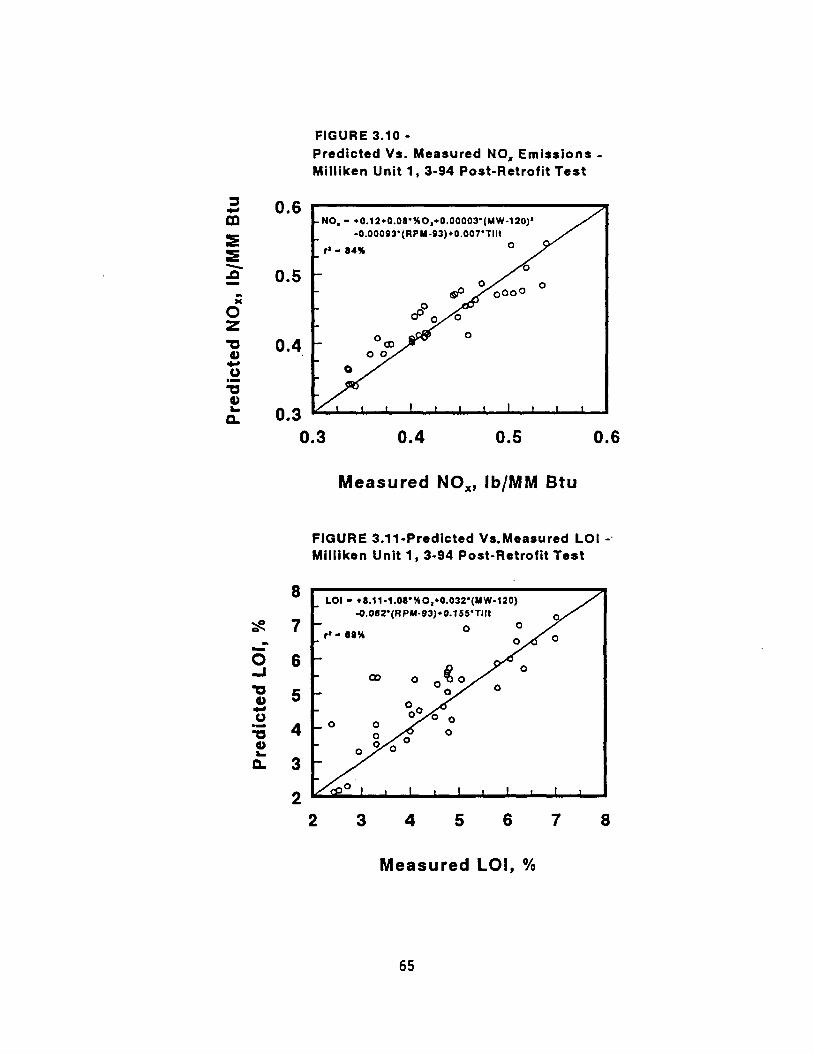
Predicted vs. Measured NO, Emission, Milliken Unit 1, 3-94 Post-Retrofit Test
Predicted vs. Measured LOI, Milliken Unit 1, 3-94 Post-Retrofit Test
Long-Term Gas Emissions
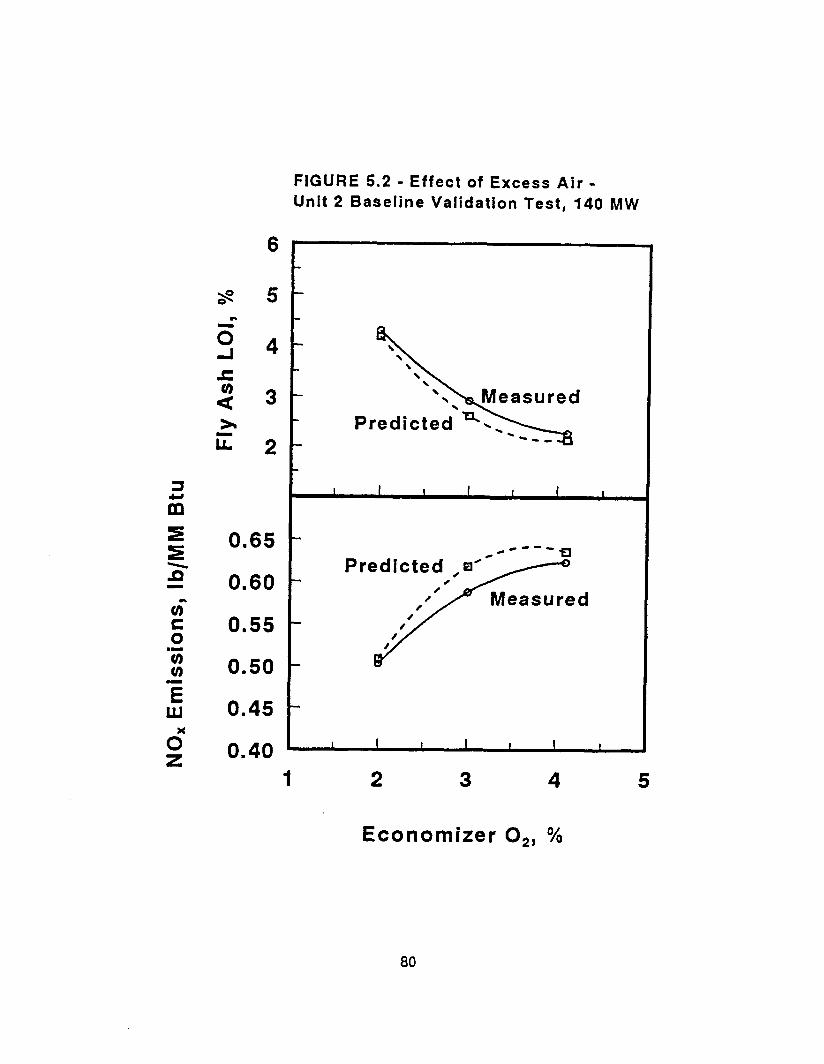
Effect of Excess Air - Unit 2 Baseline Validation Test, 140 MW
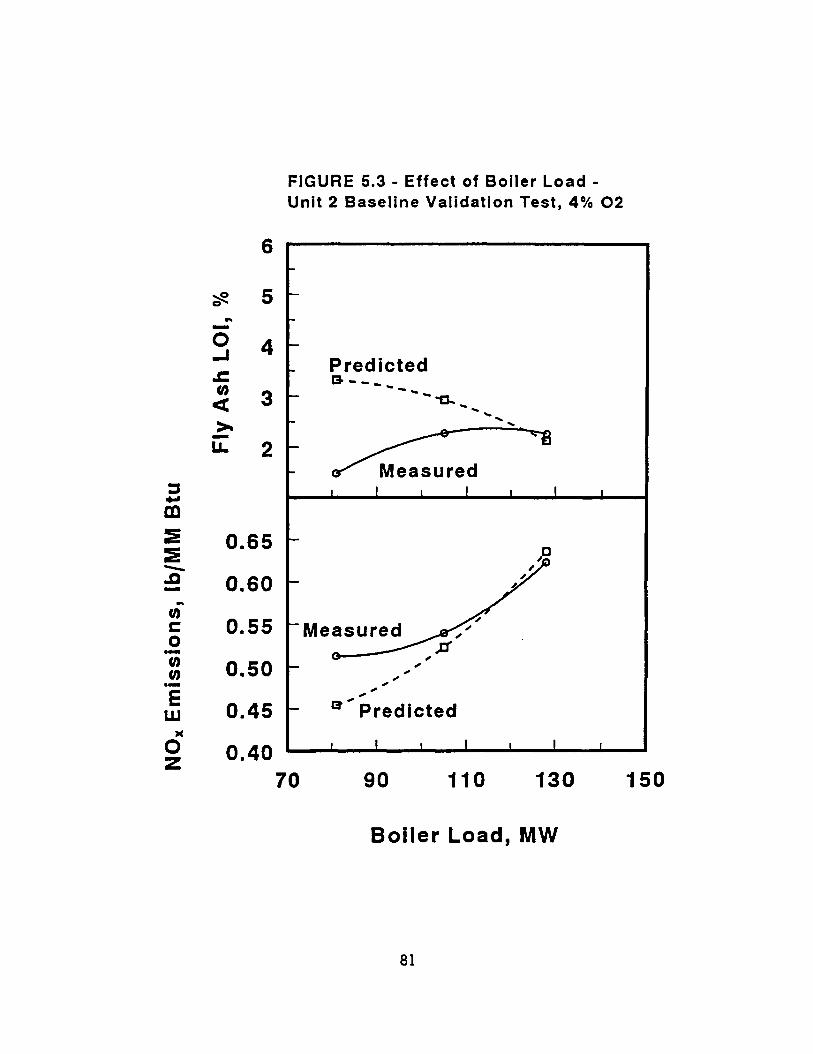
Effect of Boiler Load - Unit 2 Baseline Validation Test, 4% 0,
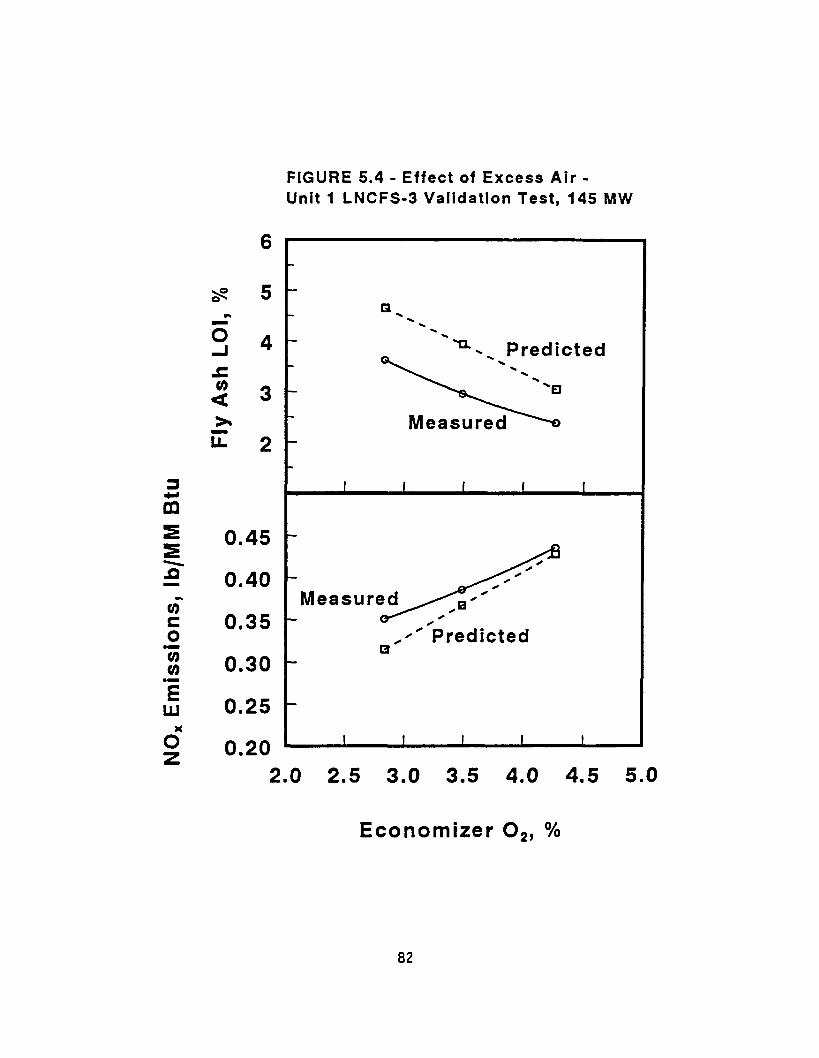
Effect of Excess Air - Unit 1 LNCFS-3 Validation Test, 145 MW
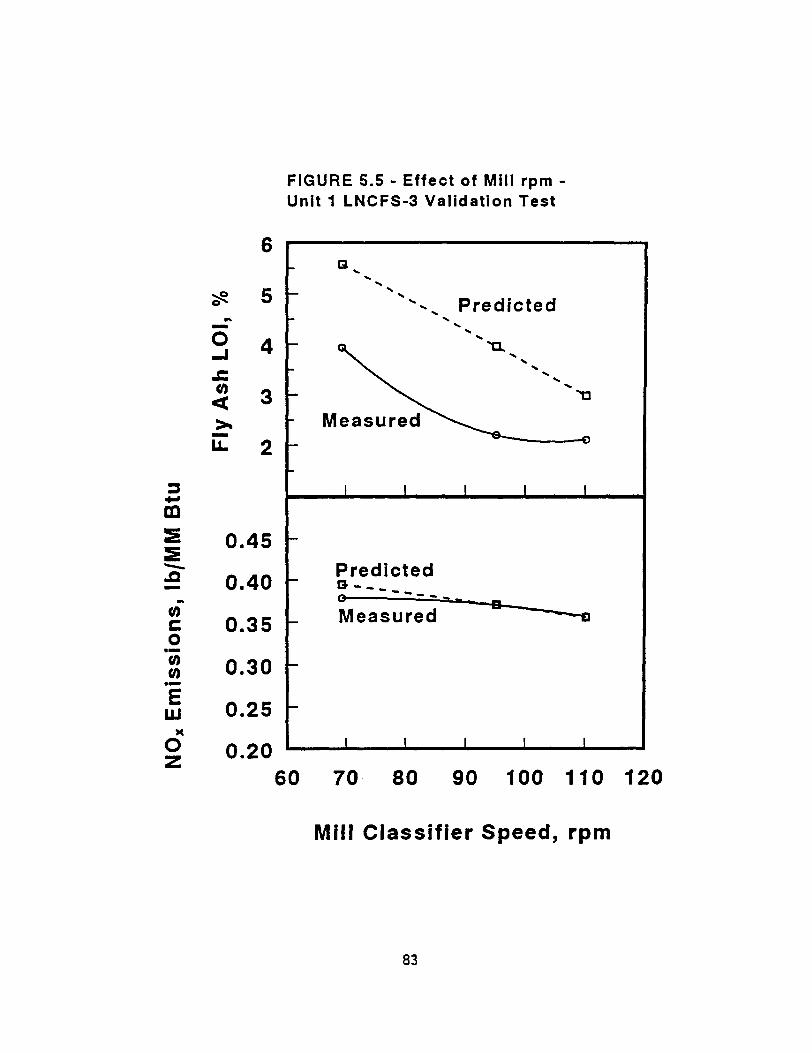
Effect of Mill rpm - Unit 1 LNCFS-3 Validation Test
Effect of Boiler Load - Unit 1 LNCFS-3 Validation Test, 3.5% 0,
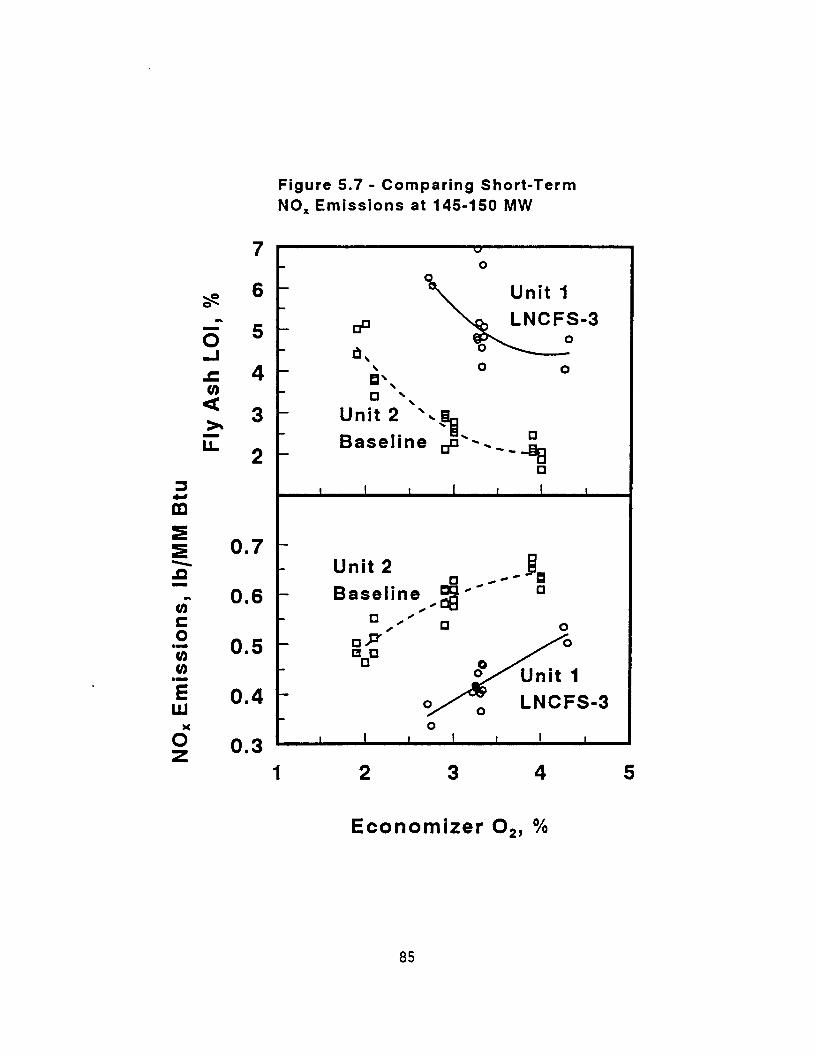
Comparing Short-Term NO, Emissions at 145-150 MW
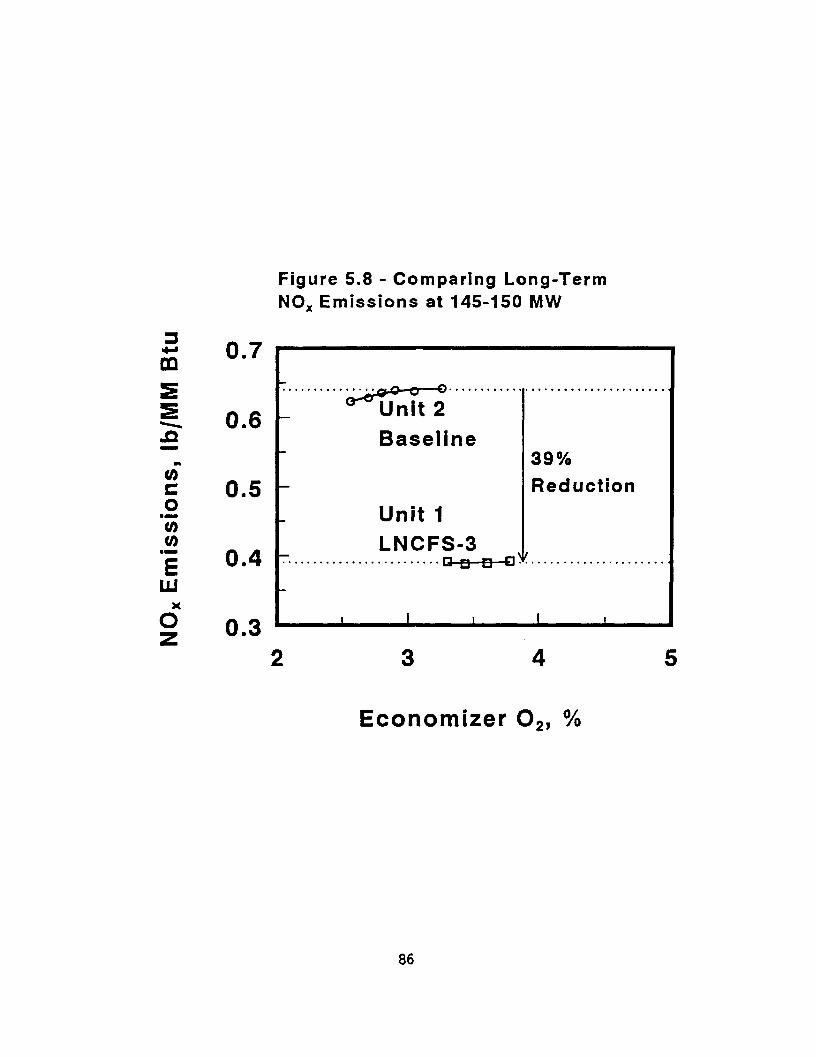
Comparing Long-Term NO, Emissions at 145-150 MW
65
65
79
80
81
82
83
84
85
86
vi
ABB CE
Btu CCOFA CEH CFR
co
co2 EPA ESA
ESP kW
lb LNCFS
LO1 m
m No
NO*
NO, NSPS NYSEG
02 PA
PPm r2
rv scf
so2
SOFA
Wh UARG YDPF
Asea Brown Boveri Combustion Engineering
British Thermal Units
Close-Coupled Over-Fire Air
Continuous Emissions Monitor
Code of Federal Regulations
Carbon Monoxide
Carbon Dioxide
U.S. Environmental Protection Agency
Energy Systems Associates
Electrostatic Precipitator
Kilowatts
Pounds
Low-NO, Concentric Firing System
Loss-on-Ignition
Million
Megawatts
Nitric Oxide
Nitrogen Dioxide
Nitrogen Oxides, NO + NO,
New Source Performance Standard
New York State Electric and Gas Corporation
Oxygen
Primary Air
Parts Per Million
Regression Correlation Coefficient
Revolutions Per Minute
Standard Cubic Feet
Sulfur Dioxide
Separated Over-Fire Air
Tons Per Hour
Utility Air Regulatory Group
Westinghouse Data Acquisition System
vii
ABSTRACT
The effectiveness of Low-NO, Concentric Firing System Level 3 (LNCFS-3) burner retrofit to reduce NO, emissions while maintaining high combustion efficiency and acceptable fly ash loss-on-ignition (LOI) was evaluated in the NYSEG Milliken Units 1 and 2 tangentially-fired boilers, each rated at 150 MW net and burning a high volatile (37X-38% dry), medium sulfur (1.6%-2.0% dry) Pittsburgh Seam coal. The NO, reduction achieved by Unit 1 LNCFS-3 retrofit was assessed based on Unit 2 baseline measurements. Pre-retrofit data showed relatively small differences in NO, emissions between the two units.
Four test programs were conducted on each unit: diagnostic, long-term, validation and performance. The diagnostic tests were short term (2-4 hours), assessing the impact of operating variables on NO, emissions and LOI. The variables included boiler load, excess air, coal air flow, burner tilt and reduced load mill pattern. In LNCFS-3, additional variables were tested, including mill classifier speed and overfire air parameters (flow, tilt and yaw). The long-term (60-70 days) tests estimated the achievable annual NO, emissions. The validation tests re-assessed the impact of the most significant operating variables following long-term testing. These variables were boiler load, excess air and for LNCFS-3 only, mill classifier speed. The performance tests assessed the overall impact of the low-NO, burner retrofit on NO, emissions, fly ash COI, CO emissions and boiler efficiency.
The achievable annual NO, emissions, estimated using long-term measurements, were 0.61 lb/MM Btu for Unit 2 baseline and 0.39 lb/MM Btu for Unit 1 LNCFS-3.
Limited success was achieved in reproducing the diagnostic test results during the validation test programs because of the difficulty in reproducing the diagnostic test conditions. For example, control of overfire air during the LNCFS-3 diagnostic tests was limited, producing full boiler load LO1 above 4%. The limitations were relaxed during the validation tests, producing 0.7%-1.7% (absolute) lower LOI, with a minor effect on NO, emissions.
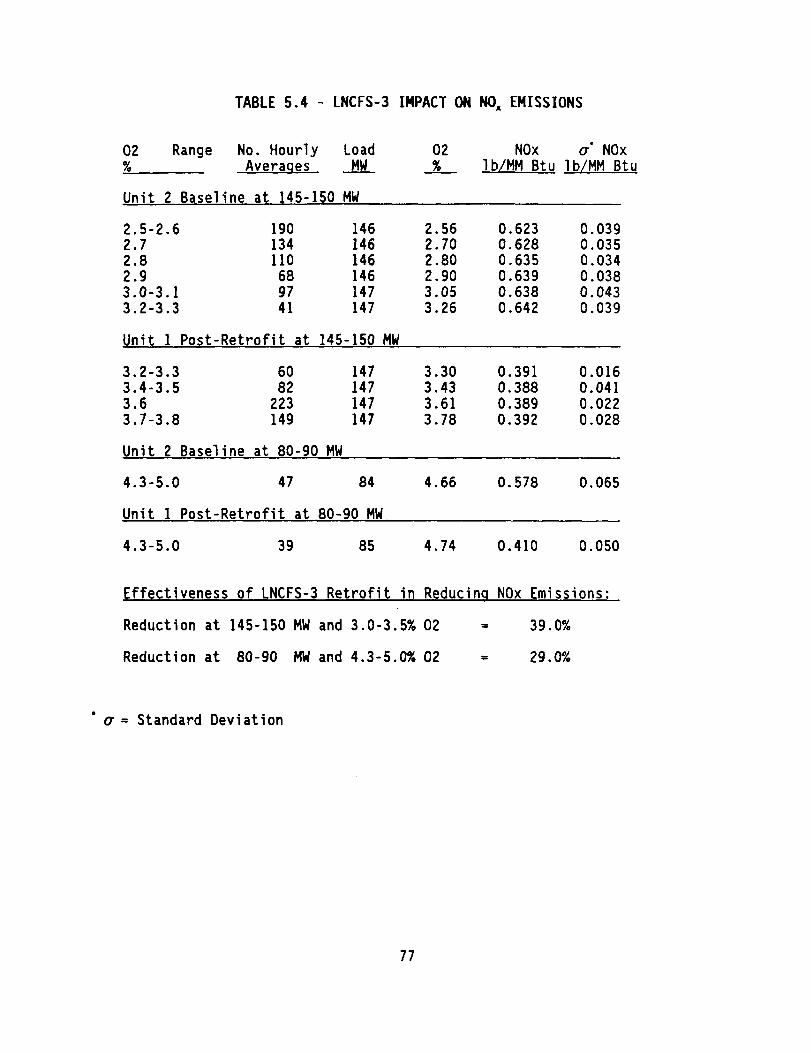
At full boiler load (145-150 MW) and 3.0X-3.5% economizer 0,, the LNCFS-3 burner lowered NO, emissions from a baseline of 0.64 lb/MM Btu to 0.39 lb/MM Btu (39% reduction). At 80-90 MW boiler load and 4.3%-5.0% economizer O,, the LNCFS-3 burner lowered NO, emissions from a baseline of 0.58 lb/MM Btu to 0.41 lb/MM Btu (29% reduction). With the LNCFS-3 burner, fly ash LO1 below 4% was maintained, and CO emissions did not increase.
The boiler efficiency was 89.3X-89.6% for baseline and 88.3%-88.5% for LNCFS-3. A lower LNCFS-3 boiler efficiency than baseline was attributed to higher post- retrofit flue gas 0, and higher stack temperatures which accompanied the air heater retrofit. When LNCFS-3 and baseline were compared at similar flue gas temperatures and compositions, estimated LNCFS-3 boiler efficiency was 0.2% (absolute) higher than baseline.
SUMMARY
Introduction
This report presents the results of Milliken Unit 2 baseline and Unit 1 Low-NO, Concentric Firing System Level 3 (LNCFS-3) test programs. Four test programs were conducted on each unit, including diagnostic, long-term, validation, and performance evaluation. The diagnostic tests were short-term (2-4 hours) statistically designed parametric tests in which the effects of selected process variables on NO, emissions and fly ash Loss-on-Ignition (LOI) were evaluated. The long-term tests involved 60-70 days of data collection to estimate the achievable annual NO, emissions. The validation tests were similar to the diagnostic tests in which the effects of selected variables were re-evaluated following the long-term tests. The performance tests evaluated the impact of the LNCFS-3 burner retrofit on boiler performance.
Milliken Units 1 and 2 are rated at 160 MW gross (150 MW net) each. Pre-retrofit data showed that NO, emissions differences between the two units were small. Unit 2 baseline test results were used to assess the NO, emissions reduction achieved by Unit 1 LNCFS-3 retrofit while maintaining high combustion efficiency and acceptable fly ash LOI. The coal used was a high volatile (37%-38% dry volatile matter), medium sulfur (1.6%-2.0% dry sulfur) Pittsburgh Seam coal.
Objective
The objective of this study is to evaluate the effectiveness of the LNCFS-3 burner retrofit to reduce NO, emissions in the NYSEG Milliken Units 1 and 2 tangentially-fired boilers.
Discussion
The results of the diagnostic (Unit 2 baseline and Unit 1 post-retrofit), long- term, validation, and performance evaluation test programs are discussed below.
Unit 2 Baseline Diaqnostic Test Prosram
The Milliken Unit 2 baseline diagnostic test program, conducted during December 6-15, 1993, evaluated the effects of boiler load, excess O,, coal air flow, burner tilt, and reduced load mill patterns on NO, emissions and 101. The following conclusions were reached:
1. Both NO, and LO1 results showed good reproducibility. Uncertainties at 95% confidence were f 0.016 lb NOJMM Btu and + 0.30% LOI. NO, was not measured, and reported NO, measurements were the sum of both NO and NO,.
2. Changing fuel air damper position had a significant effect on LO1 and a minor effect on NO, emissions. Increasing fuel air damper position from 2 to 4 increased LO1 by 0.5%. The minimum and maximum fuel air damper positions were 1 and 5, respectively.
1
3. Variation in burner tilt affected NO, emissions, but not LOI. Changing burner tilt from -+ 15’ to 0' increased NO, emissions 0.04 lb/MM Btu.
4. At reduced boiler loads (110 MW and lower), taking the top burner elevation out of service reduced NO, emissions, but made it difficult to maintain steam temperatures.
5. Higher excess 0, levels (measured at economizer outlet) increased NO, emissions and reduced LOI. The results showed that the impact of excess air on NO, emissions was reduced at lower boiler loads.
6. Higher boiler loads increased NO, emissions and reduced LO1 at the same excess 0, level.
7. Lower NO, emissions corresponded to higher LOI. Predictive correlations for NO, emissions and LO1 were derived:
% LO1 = - 1.2 t 9.4/02 t 0.25*AIR - O.O24*(MW-140) r2=84%
where 02 is excess O2 measured at the economizer outlet, MW is boiler load in MW net, TILT is burner tilt in degrees, and AIR is coal air damper position.
8. The short-term, baseline tests indicated that NO, emissions could be reduced to about 0.54 lb/MM Btu at 140 MW, while maintaining salable fly ash.
Unit 1 Post-Retrofit Diacmostic Test Prowara
The Milliken Unit 1 post-retrofit diagnostic test program, conducted during March 22-31, 1994, evaluated the effects of boiler load, excess O,, mill classifier speed, combustion air distribution (SOFA flow, CCOFA flow and coal air flow), burner settings (burner tilt, SOFA tilt and SOFA yaw), and mill patterns on NO, emissions and LOI. The following conclusions were reached:
1. The post-retrofit tests had a greater level of uncertainty in NO, emissions and about the same level of uncertainty in LOI, compared to the baseline tests. Uncertainties at 95% confidence were + 0.027 lb NOJMM Btu and f 0.35% LOI.
2. Gas stratification across the two ducts at the economizer outlet was minor.
3. NO, concentrations measured at the economizer outlet were l-2 ppm.
4. CO variation was not considered in this study because of the low concentrations measured at the economizer outlet (9-23 ppm).
2
5.
6.
7.
8.
9.
10.
11.
12.
13.
14.
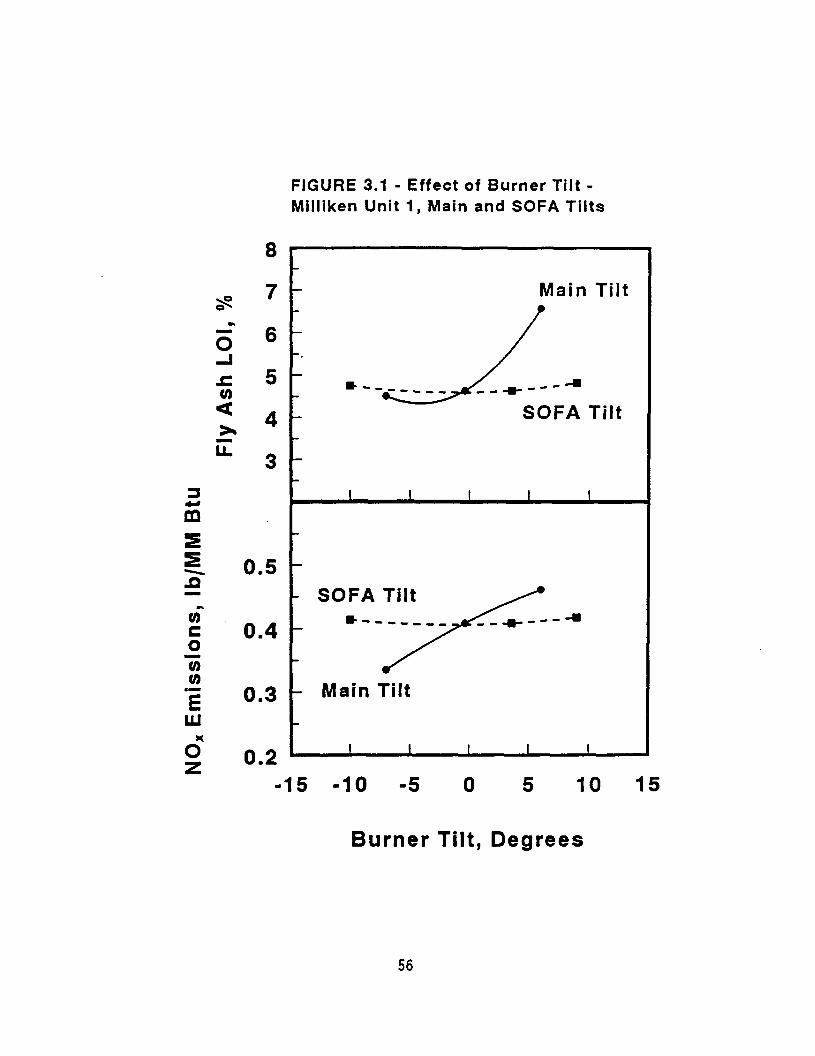
Increasing burner tilt below the horizontal position (0') was estimated to reduce NO, emissions by 0.007 lb/MM Btu and to reduce LO1 by 0.16% per degree change at full boiler load. The impact of burner tilt on main steam temperature limited changes in the burner tilt.
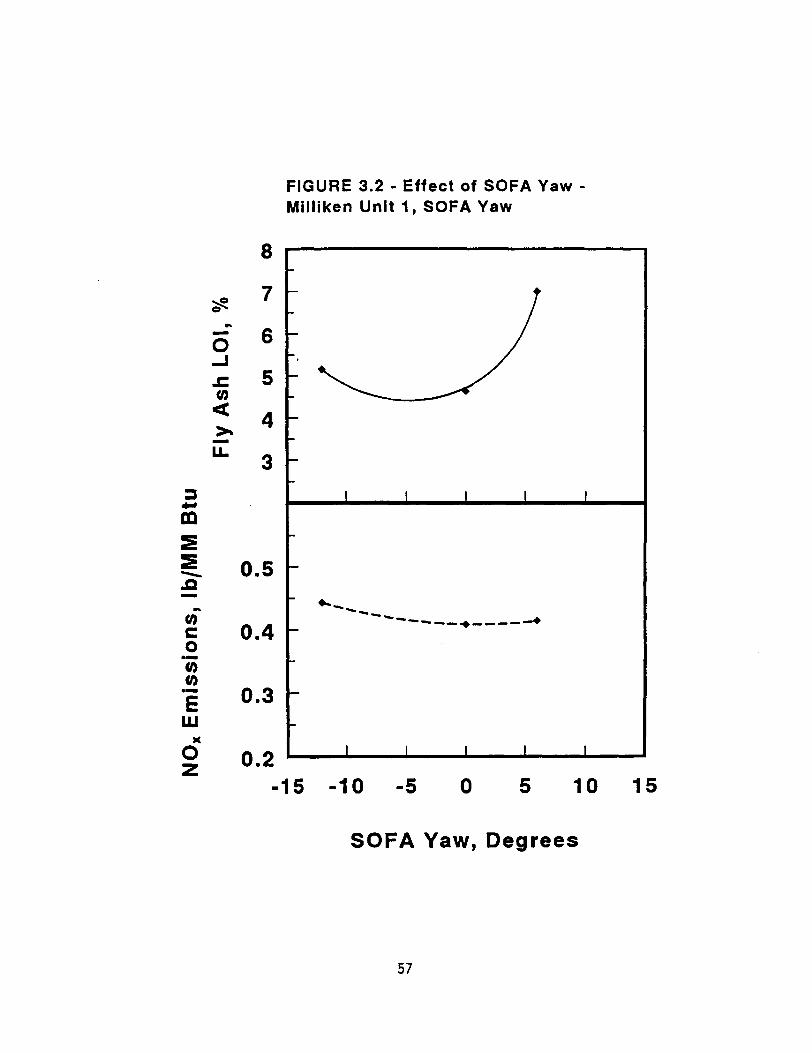
Changes in SOFA tilt produced no significant changes in either NO, emissions or LOI. SOFA yaw changes (relative to the fuel firing angle) did not significantly change NO, emissions, and increased LOI. The effect on LO1 could not be determined with certainty because SOFA yaw changes were accompanied by changes in burner tilt, and the two effects could not be separated. No significant changes in steam temperatures were detected.
Greater air staging (air flow through SOFA and CCOFA ports) reduced NO, emissions and increased LOI. Changes in SOFA damper position had a greater effect on NO, emissions than changes in CCOFA damper position. The effect on LO1 was not statistically significant when the effects of other parameters, such as burner tilt, were accounted for.
Taking the upper elevation burners out of service reduced both NO, emissions and LOI, but the effect was greater on NO, emissions.
Higher excess 0, increased NO, emissions and reduced LOI.
In general, higher boiler loads increased both ND, emissions and LOI.
Higher mill classifier speeds reduced both NO, emissions and LOI, but the effect on LO1 was more dramatic.
The post-retrofit relationship between NO, and LO1 was more complex than the pre-retrofit relationship because of greater sensitivity of the low-NO, configuration to process variables and coal properties. Fluctuations in coal ash and/or moisture contents had a dramatic effect on LO1 and a minor effect on NO, emissions.
Predictive correlations for NO, emissions and LO1 were derived:
lb NOJMM Btu = 0.12 t 0.08*02 t 0.00003*(MW-120)2 - 0,00093*(RPM-93) t O.O07*TILT
r2=84%
% LO1 = 8.1 - 1.08*02 t O.O32*(MW-120) - O.O62*(RPM-93) t O.l55*TILT
r2=69%
where 02 is excess O2 measured at the economizer outlet, MW is net MW boiler load, TILT is burner tilt in degrees from the horizontal, and RPM is mill classifier speed.
The short-term, post-retrofit LNCFS-3 test program indicated that NO, emissions could potentially be reduced to about 0.35 lb/MM Btu
3
at full boiler load, while maintaining salable fly ash.
15. The low-NO, burner retrofit reduced NO, emissions from a baseline level of 0.64 lb/MM Btu to a post-retrofit level of 0.39 lb/MM Btu, corresponding to a reduction of about 39X, while maintaining LO1 below 4%. The NO, values were based on short-term test averages and will be verified during the 51-day long-term test. NYSEG believes LNCFS-3 burner retrofit is a cost-effective technology to comply with Title IV of the 1990 Clean Air Act Amendments. To date, burner operations are acceptable.
Lonq-Term Test Proaram
The achievable annual NC?, emissions were estimated using long-term (60-70 days) CEM measurements. Specifically:
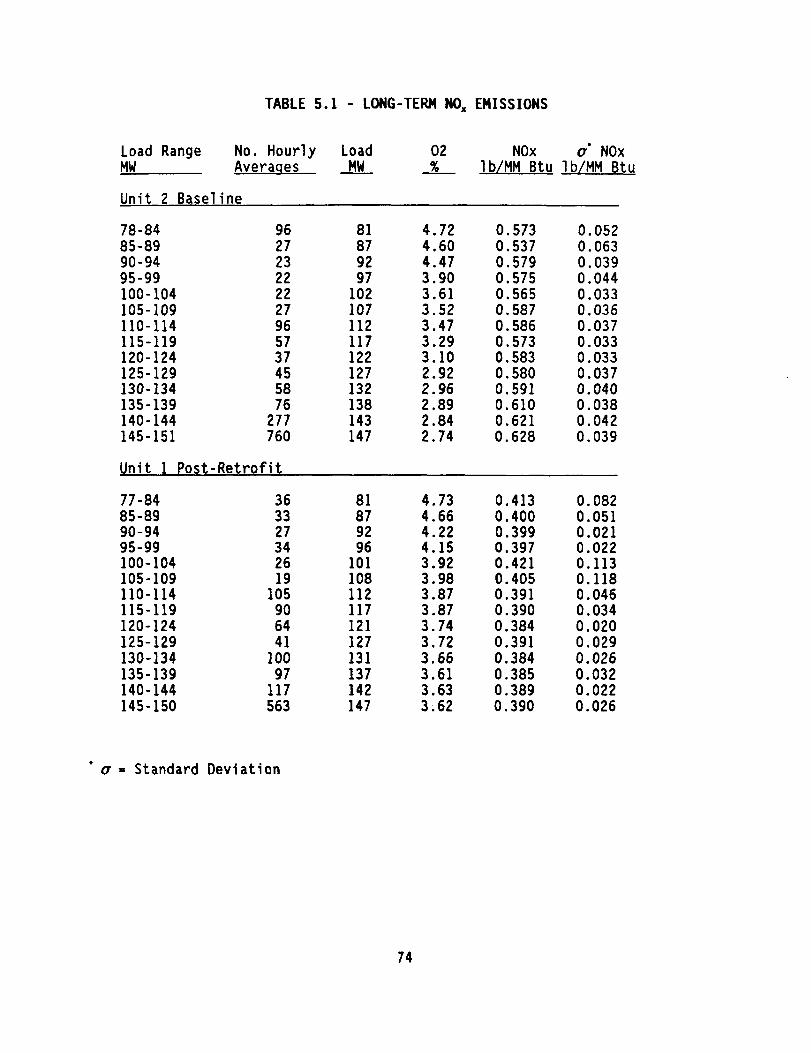
1. The achievable annual NO, emissions for Unit 2 baseline were 0.614 lb/MM Btu, with a 95% confidence level of k 0.023 lb/MM Btu.
2. The achievable annual NO, emissions for Unit 1 LNCFS-3 were 0.390 lb/MM Btu, with a 95% confidence level of k 0.003 lb/MM Btu.
Validation Test Proqram
The validation test programs were conducted after the completion of the long-term tests. The purpose of validation tests was to re-evaluate the effects of selected operating parameters on NO, emissions and LO1 and to verify the diagnostic test results. The validation test results were compared to predictions based on the correlations derived from the diagnostic test results. The test parameters for Unit 2 baseline were economizer 0, and boiler load. The test parameters for Unit 1 LNCFS-3 were economizer O,, coal fineness and boiler load. The following conclusions were reached:
1. For Unit 2 baseline, satisfactory predictions were obtained for both NO, emissions and LO1 at full boiler load (140-150 MW), but not at reduced boiler loads. Full boiler load differences between measurements and predictions were less than 0.03 lb NOJMM Btu and less than 0.3% (absolute) LOI. The larger differences in reduced boiler load test results were caused by differences in mill operations.
2. For Unit 1 LNCFS-3, satisfactory predictions were obtained for NO, emissions at full boiler load (145-150 MW). However, predictions for NO, emissions at reduced boiler loads and all predictions for LO1 (full and reduced boiler loads) were not satisfactory. At full boiler load, differences between measured and predicted NO, emissions were less than 0.036 lb/MM Btu, and measured LO1 was consistently lower (0.7X-1.7% absolute) than predicted. Full boiler load differences between measurements and predictions are explained as follows. The diagnostic test conditions produced full boiler load LO1 above 4% and were not repeated during the validation test program. The modified operations had a minor effect on NO,
4
emissions and a significant effect on LOI. LOI correlations should be adjusted to account for this difference.
Performance Evaluation
The LNCFS-3 performance evaluation included the impact of the LNCFS-3 system on NO, emissions, boiler efficiency, fly ash LOI and CO emissions. Specifically:
1. At full boiler load (145-150 MW) and 3.0%-3.5X economizer 0,, the LNCFS-3 system lowered NO, emissions from a baseline 0.64 lb/MM Btu to 0.39 lb/MM Btu (39% reduction). At 80-90 MW boiler load and 4.3%-5.0% economizer 0,, the LNCFS-3 system lowered NO, emissions from a baseline of 0.58 lb/MM Btu to 0.41 lb/MM Btu (29% reduction).
2. The boiler efficiency was 89.3%-89.6% for baseline and 88.3%-88.5% for the LNCFS-3 system. The LNCFS-3 boiler efficiency was lower than baseline because of higher post-retrofit flue gas O2 levels and higher stack temperatures which accompanied the air heater retrofit. When the LNCFS-3 system and the baseline were compared at similar flue gas temperatures and compositions, the estimated LNCFS-3 boiler efficiency was 0.2% (absolute) higher than baseline.
3. With the LNCFS-3 system, fly ash LOI below 4% was maintained, and CO emissions did not increase.
SECTION ONE INTROUUCTION
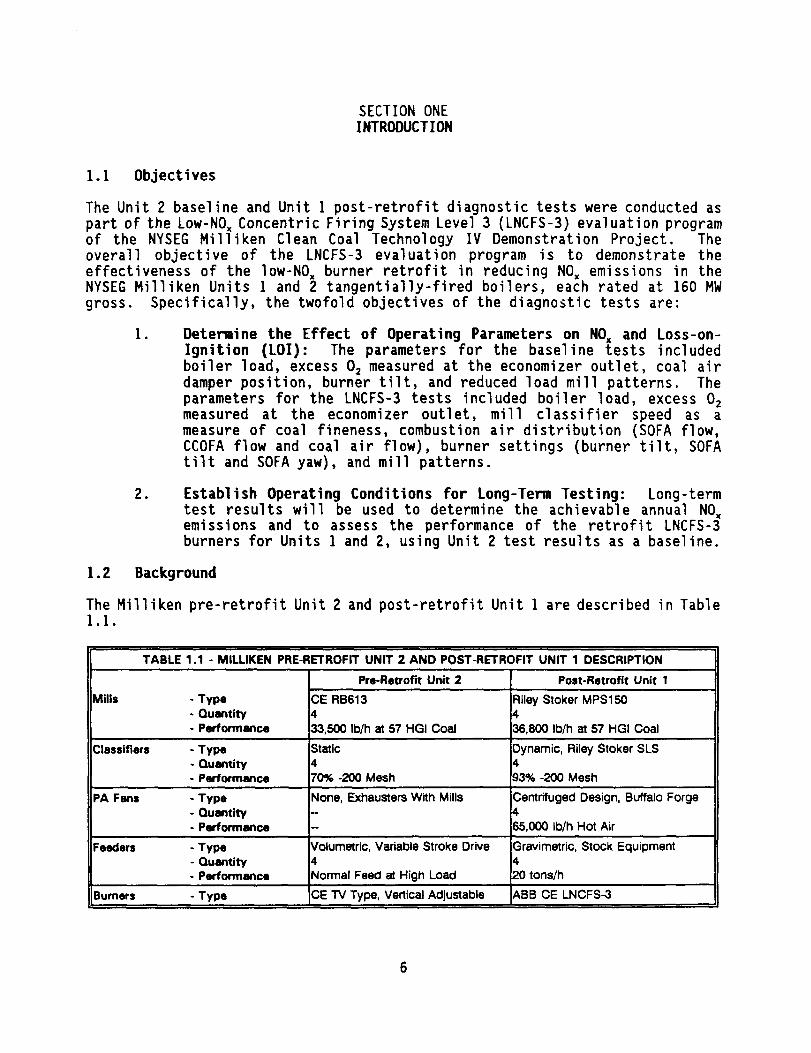
1.1 Objectives
The Unit 2 baseline and Unit 1 post-retrofit diagnostic tests were conducted as part of the Low-NO, Concentric Firing System Level 3 (LNCFS-3) evaluation program of the NYSEG Milliken Clean Coal Technoloqy IV Demonstration Project. The overall objective of the LNCFS-3 evaluatixn program is to demonstrate the effecti V eness of the low-NO, burner retrofit in reducing NO, emissions in the NYSEG M i lliken Units 1 and 2 tangentially-fired boilers, each rated at 160 MW gross. Specifically, the twofold objectives of the diagnostic tests are:
1 . Determine the Effect of Operating Parameters on NO, and Loss-on- Ignition (LOI): The parameters for the baseline tests included boiler load, excess 0, measured at the economizer outlet, coal air damper position, burner tilt, and reduced load mill patterns. The parameters for the LNCFS-3 tests included boiler load, excess 0, measured at the economirer outlet, mill classifier speed as a measure of coal fineness, combustion air distribution (SOFA flow, CCOFA flow and coal air flow), burner settings (burner tilt, SOFA tilt and SOFA yaw), and mill patterns.
2. Establish Operating Conditions for Long-Term Testing: Long-term test results will be used to determine the achievable annual NO, emissions and to assess the performance of the retrofit LNCFS-3 burners for Units 1 and 2, using Unit 2 test results as a baseline.
1.2 Background
The Milliken pre-retrofit Unit 2 and post-retrofit Unit 1 are described in Table 1.1.
TABLE 1 .l - MILLIKEN PRE-RETROFIT UNIT 2 AND POST-RETROFIT UNIT 1 DESCRIPTION
Pre-Retroffi Unit 2 Post-Retrofit Unit 1
Aills - Type CE RB613 Riley Stoker MPS150 - Quentity 4 4 - Performance 33,500 lb/h at 57 HGI Coal 36,600 lb/h at 57 HGI Coal
‘A Fans - Type None, Exhausters Wiih Mills Centrifuged Design, Buffalo Forge - aumity 4 - Performence - 65,000 lb/h Hot Air
:eeders - Type Volumetric, Variable Stroke Drive Gravimetric, Stock Equipment - auentity 4 4 - Performence Normal Feed at High Load 20 tons/h
lurners - Type CE TV Type, Vertical Adjustable ABB CE LNCFS-3
6
The LNCFS-3 configuration is expected to reduce NO, emissions from pre-retrofit levels of 0.56-0.60 lb/MM Btu (at full boiler load and 3%-4% excess 0,) to a design goal of 0.37 lb/MM Btu, while maintaining LO1 below the 4% limit required to market the fly ash. The burner retrofit was implemented on Unit 1 during the summer of 1993 and the retrofit on Unit 2 is in progress. The Unit 1 retrofit was accompanied by an upgrade of the ESP and the installation of new coal mills. Two additional burner modifications were required to reduce problems caused by flame attachment to the nozzles. NO, emissions guarantees were met in January of 1994.
1.2.1 ComDarison of Milliken Units 1 and 2 NO, Emissions
The original plan was to conduct baseline and post-retrofit testing on the same unit. However, there was not sufficient time to conduct Unit 1 baseline testing prior to its retrofit. Consequently, the option of conducting baseline testing on Unit 2 and post-retrofit testing on Unit 1 to evaluate the effectiveness of the low-NO, burner retrofit was examined. Unit 2 retrofit was scheduled approximately one year a.fter that of Unit 1. A comparison of Units 1 and 2 NO, emissions was conducted using data from short-term tests (l-3 hours) and long- term measurements (60 days).
Short-term NO, emissions data were obtained from l-3 hour tests performed on Unit 1 during August of 1991 and on Unit 2 during December of 1991. The tests were conducted by Performance Testing Services of ABB CE to determine pre-retrofit NO, levels and to estimate the potential of LNCFS-3 retrofit in reducing NO, emissions. At 3.5% excess 0, measured at the economizer outlet, NO, emissions were estimated at 0.57-0.60 lb/MM Btu at full load (150 MW net generation) and 0.41-0.44 lb/MM Btu at half load. Differences in NO, emissions between the two units were estimated at less than 0.03 lb/MM Btu. These differences were small relative to variations in NO, emissions due to changes in excess air, boiler load and burner tilt. However, the interpretations of the short-term tests were limited because of the short duration of the tests (l-3 hours each) and the small number of tests (17 tests), and required verification using long-term data.
Comparison of NO, emissions from Milliken Units 1 and 2 was also performed using 60 days of continuous emissions monitoring (CEM) and boiler load data. The data were collected during August and September of 1992. NO, emissions for both units were between 0.64 and 0.68 lb/MM Btu at an average boiler load of 133 MW and 3.5%-4.5% excess 0, measured at the economizer outlet. The average difference between the two units 30-day rolling averages was 0.024 lb NOJMM Btu, with uncertainty of to.005 lb NOJMM Btu at 95% confidence. Differences in NO, emissions between the two units were again shown to be less than 0.03 lb/MM Btu, in agreement with the analysis of short-term tests. Consequently, conducting baseline NO, emissions testing on Unit 2 for comparison with post LNCFS-3 retrofit testing on Unit 1 was an acceptable option.
The diagnostic tests were statistically designed parametric tests in which the effects of selected process variables on NO, emissions and LOI were evaluated.
1.3 Unit 1 Baseline and Unit 2 Post-Retrofit Diagnostic Tests
Unit 1 baseline and Unit 2 post-retrofit diagnostic tests were designed to provide short-term, parametric data to determine the effects of several boiler operating variables on NO, emissions and LOI. The results of these two test programs are discussed in Sections 2 and 3, respectively. A discussion of the LNCFS-3 system start-up, installation costs and fuel duct balancing tests is presented in Section 4.
1.4 Long-Term, Validation and Performance Testing
Long-term testing was conducted following the completion of the diagnostic test programs and involved 60-70 days of data collection to estimate the achievable annual NO, emissions. The validation tests were similar to the diagnostic tests and re-evaluated the effects of selected process variables following the completion of long-term testing. The performance evaluation tests evaluated the impact of the LNCFS-3 burner retrofit on boiler performance, including NO, and CO emissions, fly ash LO1 and boiler efficiency. The results of these test programs are discussed in Section 5.
SECTION TWO UNIT 2 BASELINE DIAGNOSTIC TESTS
2.1 Experimental Design
Statistically designed baseline diagnostic tests were conducted to examine the effects of boiler load, excess 02, fuel air flow, burner tilt, and reduced-load mill pattern on NO, emissions and LOI. The experimental parameter settings are listed in Table 2.1. A high setting of 5% excess 0, at the economizer outlet was possible at boiler loads of 110 MW and 80 MW, but not at 140 MW because of limited fan capacity and a high value of 4% excess 0, was used instead.
Each Milliken unit has four elevations of burners, with one coal mill per elevation. Full boiler load required all burners to be in service. Therefore, only the mill pattern with all four mills in service was tested at full load. Alternate mill patterns could be tested at reduced loads, as described in Table 2.1. At intermediate boiler load (110 MW) with three mills in service, four patterns were possible, of which two were tested. At low boiler load (80 MW) with two mills in service, six patterns were possible, of which two were tested. Mill patterns were classified as normal (normal operation at Milliken) when the burners at the lowest elevations were either taken out of service or the coal flow was minimized. Alternate mill patterns were tested in which the burners at the highest elevations were either taken out of service or the coal flow was minimized. Alternate mill patterns were tested for comparison with normal mill patterns, and might not necessarily constitute satisfactory boiler operating conditions.
The baseline test design consisted of three experimental blocks, as seen in Table 2.2. Tests marked by asterisks were replicated to allow independent estimates of the experimental error, and some tests were common to more than one block. The three experimental designs were:
1. Desim A. Full Boiler Load Tests: These tests were conducted at 140 MW to examine the effects of three independent variables: excess 0, measured at the economizer outlet, fuel air damper position and burner tilt. The design consisted of a two-level factorial (Tests l-8) to estimate linear effects, and additional tests to estimate quadratic effects (Tests 9-15). The entire set is known as a Central Composite Design.
2. Desim 8. Hill Pattern Tests: This set consisted of four tests to compare different mill patterns at reduced boiler loads (Table 2.1).
3. Desian C. Variable Boiler Load Tests: This design consisted of 15 tests, corresponding to a full three-level factorial with respect to variations in boiler load and excess 0, measured at the economizer outlet.
2.2 Experimental Plan
The baseline diagnostic tests were conducted on Unit 2 between December 6 and 15 of 1993. A total of 30 tests were conducted, each typically 3-4 hours long. A description of the tests is presented in Table 2.3. All reduced boiler load tests were conducted between December 6 and 11. A primary consideration was given to maintaining reliable boiler operation and power generation. Thus, when a set of conditions could not maintain the required steam conditions, the test was terminated as soon as sufficient data were collected.
2.2.1 Measurements
The plant 0, probe was used to monitor excess O2 concentrations at the economizer outlet. The plant CEM system was used to measure CO,, NO, and SO, concentrations at the stack. The system included a non-dispersive infrared CO, analyzer, a chemiluminescent NO, analyzer, and a pulsed fluorescent SO, analyzer. A low flow dilution probe was used and no additional conditioning was required. The CEM system passed the Relative Accuracy Test, and was calibrated daily.
Typically, 1.5-2 hours of stack CEM data (collected as 15-minute averages) at steady state conditions were averaged for each test. Steady state behavior was assumed when small changes in NO, measurements occurred with time (less than 3 ppm change in the hourly average), and typically occurred within l-2 hours after test conditions were set.
Fly ash was sampled from the ash transport pipe for 30-60 minutes during sequential unloading of the ash from the hoppers to the silo. The sampled ash was subsequently mixed and 4-8 ounces were extracted for moisture, carbon and ash analyses. Daily coal samples were collected and analyzed for moisture, proximate and ultimate compositions, and heating value. The coal and ash analyses are presented in Table 2.4.
2.3 Results and Discussion
A total of 30 baseline tests were conducted, including 7 replicates. Test results are presented in Table 2.5. CO concentrations measured at the economizer outlet were O-13 ppm for all the tests. Variation in CO was not a consideration in this study.
NO, emissions in lb/MM Btu were calculated according to EPA Method 19 (40 CFR 60 Appendix A, 1993) using measured NO, and CO, stack compositions, and calculated EPA F, factors as:
The EPA tabulated F, value for bituminous coal is 1800. The calculated values used in this study varied between 1780 and 1816 (Table 2.5).
10
LO1 was defined as the percentage of combustibles in the fly ash, calculated as:
LO1 = 100 - % Ash,,yarh,dry.
2.3.1 ExDerimental Error
Seven replicated tests were used to estimate the standard deviation of the experimental error (terror ) and the uncertainty in measurement (confidence level), for both NO, emissions and LOI, as seen in Table 2.6. Calculated o,,,,, values for NO, and LO1 were 0.024 lb/MM Btu and 0.44X, respectively. The uncertainty in measurement is + t*o/V)t, where N is the number of replicated tests, and t is a tabulated statistical parameter depending on the degrees of freedom and the desired confidence level. For 7 degrees of freedom and 95% confidence (t = 2.365), the confidence intervals were NO, + 0.016 lb/MM Btu and LO1 + 0.30%. Differences between replicated tests for NO, emissions and LO1 averaged 0.024 lb/MM Btu and 0.62%, respectively.
2.3.2 ExDerimental Results
Replicated results were averaged and the data matrix is presented in Table 2.7. Analysis of the data focussed on variations in NO, emissions and LO1 with respect to changes in the independent variables, namely, boiler load, excess 0,, fuel air flow, and burner tilt (Designs A and C). The effect of mill pattern on NO, emissions and LO1 at reduced loads (110 MW and 80 MW) was also examined (Design 8).
Analysis of the test matrix showed that for Designs A and C, there was a strong correlation between NO, emissions and LOI, and as expected, an inverse relationship was shown (negative correlation coefficient). exhibited strong correlations with both NO, and LOI.
For Design A, 0, For Design C, boiler
load/O, interaction factor (MW*02) exhibited strong correlations with both NO, emissions and LOI.
2.3.3 Effects of Fuel Air Flow and Burner Tilt
The tests of Design A (Table 2.7) examined the effects of fuel air flow and burner tilt on NO, emissions and LO1 at 140 MW boiler load. Excess 0, was also a variable in this design, but its effect is discussed in more detail in the analysis of Design C where greater variability of excess 0, was possible.
Regression analyses were used to identify the statistically significant factors affecting NO, emissions and LOI, starting with a complete quadratic model with respect to the three variables of Design A (fuel air flow, burner tilt and excess 02). The final correlations for Design A are shown in Table 2.8. AIR is fuel air damper position, TILT is burner tilt in degrees and 02 is excess 0, measured at the economizer outlet. NO, variation was directly proportional to linear changes in 0, (02), and to quadratic changes in burner tilt (TILT*TILT). LO1 variation was directly proportional to both linear and quadratic changes in excess O2 (02 and 02*02), and to linear changes in fuel air damper position (AIR). As discussed later in the derivation of predictive correlations, LO1 was correlated with the inverse 0, factor (l/02) instead of two quadratic excess 0, factors (02 and 02*02).
11
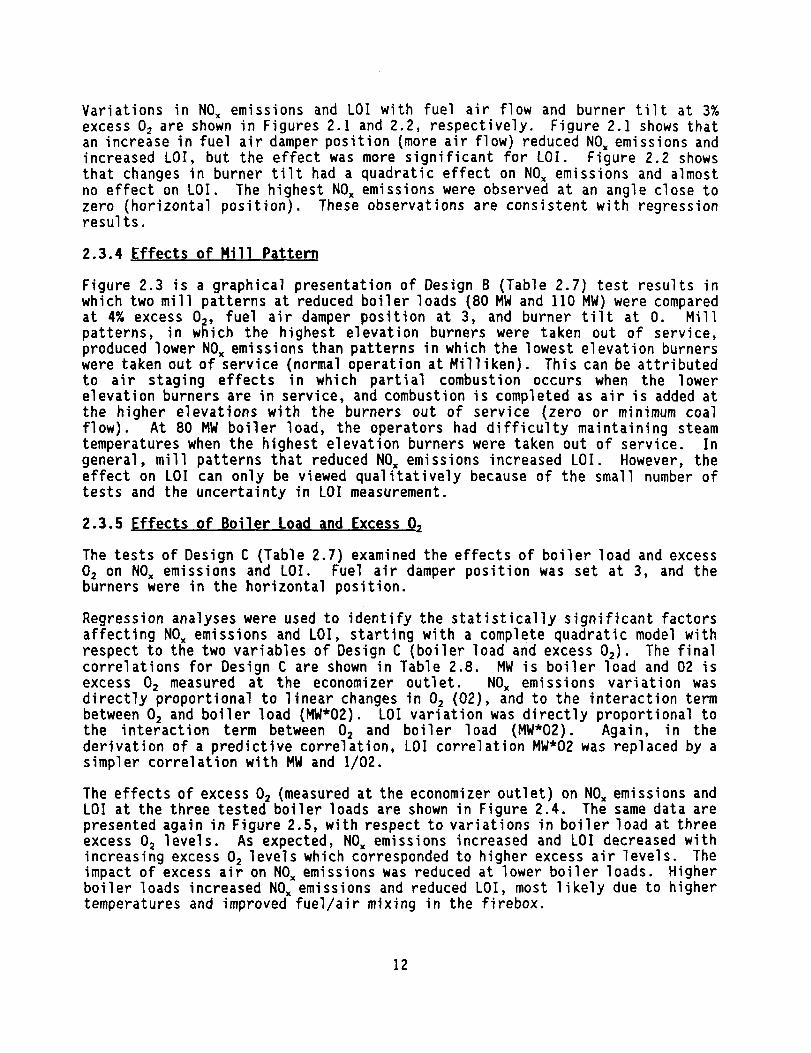
Variations in NO, emissions and LO1 with fuel air flow and burner tilt at 3% excess 0, are shown in Figures 2.1 and 2.2, respectively. Figure 2.1 shows that an increase in fuel air damper position (more air flow) reduced NO, emissions and increased LOI, but the effect was more significant for COI. Figure 2.2 shows that changes in burner tilt had a quadratic effect on NO, emissions and almost no effect on LOI. The highest NO, emissions were observed at an angle close to ;;;;l[iorizontal position). These observations are consistent with regression
.
2.3.4 Effects of Mill Pattern
Figure 2.3 is a graphical presentation of Design B (Table 2.7) test results in which two mill patterns at reduced boiler loads (80 MW and 110 MW) were compared at 4% excess O,, fuel air damper position at 3, and burner tilt at 0. Mill patterns, in which the highest elevation burners were taken out of service, produced lower NO, emissions than patterns in which the lowest elevation burners were taken out of service (normal operation at Milliken). This can be attributed to air staging effects in which partial combustion occurs when the lower elevation burners are in service, and combustion is completed as air is added at the higher elevations with the burners out of service (zero or minimum coal flow). At 80 MW boiler load, the operators had difficulty maintaining steam temperatures when the highest elevation burners were taken out of service. In general, mill patterns that reduced NO, emissions increased LOI. However, the effect on LO1 can only be viewed qualitatively because of the small number of tests and the uncertainty in LO1 measurement.
2.3.5 Effects of Boiler Load and Excess 0,
The tests of Design C (Table 2.7) examined the effects of boiler load and excess 0, on NO, emissions and LOI. Fuel air damper position was set at 3, and the burners were in the horizontal position.
Regression analyses were used to identify the statistically significant factors affecting NO, emissions and LOI, starting with a complete quadratic model with respect to the two variables of Design C (boiler load and excess 0,). The final correlations for Design C are shown in Table 2.8. MW is boiler load and 02 is excess 0, measured at the economizer outlet. NO, emissions variation was directly proportional to linear changes in 0, (02), and to the interaction term between 0, and boiler load (MW*02). LO1 variation was directly proportional to the interaction term between 0, and boiler load (MW*02). Again, in the derivation of a predictive correlation, LO1 correlation MW*02 was replaced by a simpler correlation with MW and l/02.
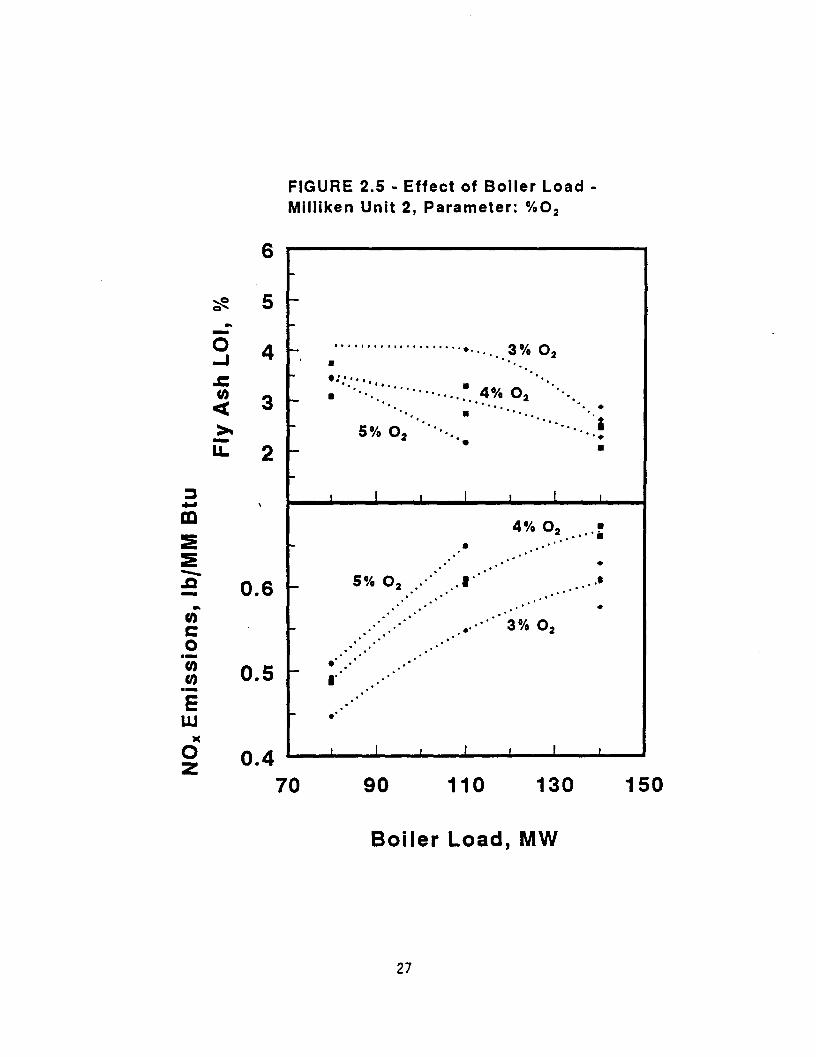
The effects of excess O2 (measured at the economizer outlet) on NO, emissions and LO1 at the three tested boiler loads are shown in Figure 2.4. The same data are presented again in Figure 2.5, with respect to variations in boiler load at three excess 0, levels. As expected, NO, emissions increased and LO1 decreased with increasing excess 0, levels which corresponded to higher excess air levels. The impact of excess air on NO, emissions was reduced at lower boiler loads. Higher boiler loads increased NO, emissions and reduced LOI, most likely due to higher temperatures and improved fuel/air mixing in the firebox.
12
2.3.6 Variations of NO, Emissions and LOI
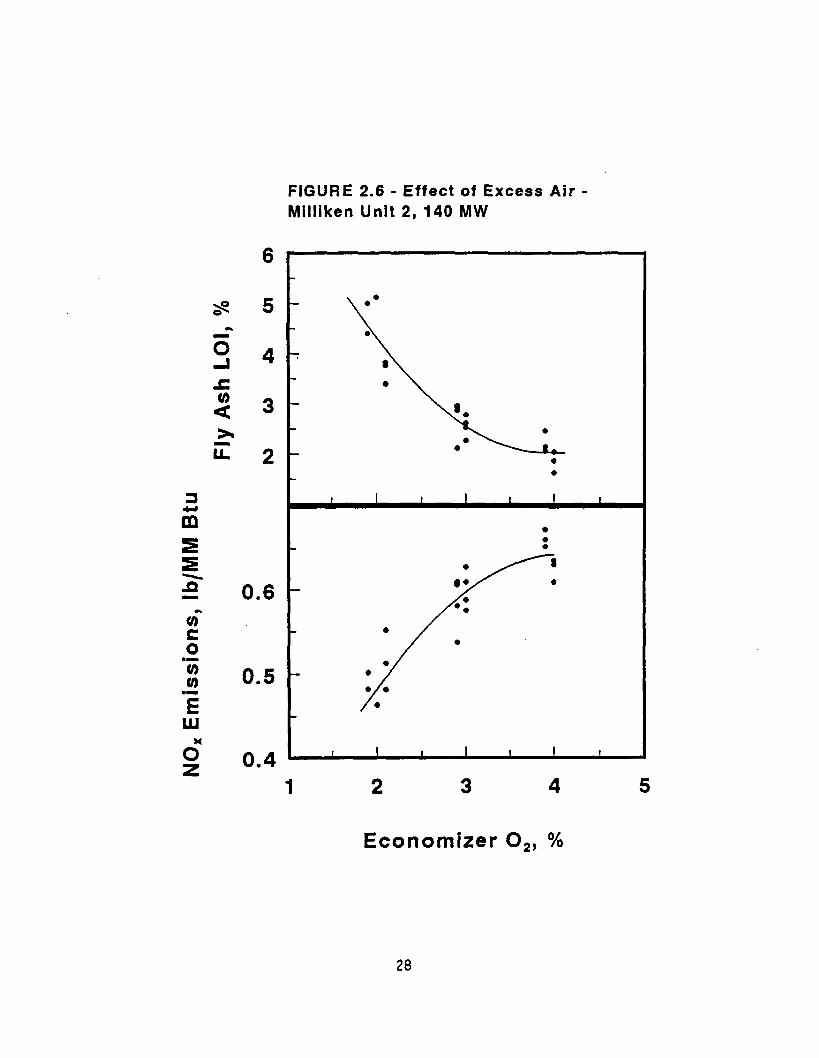
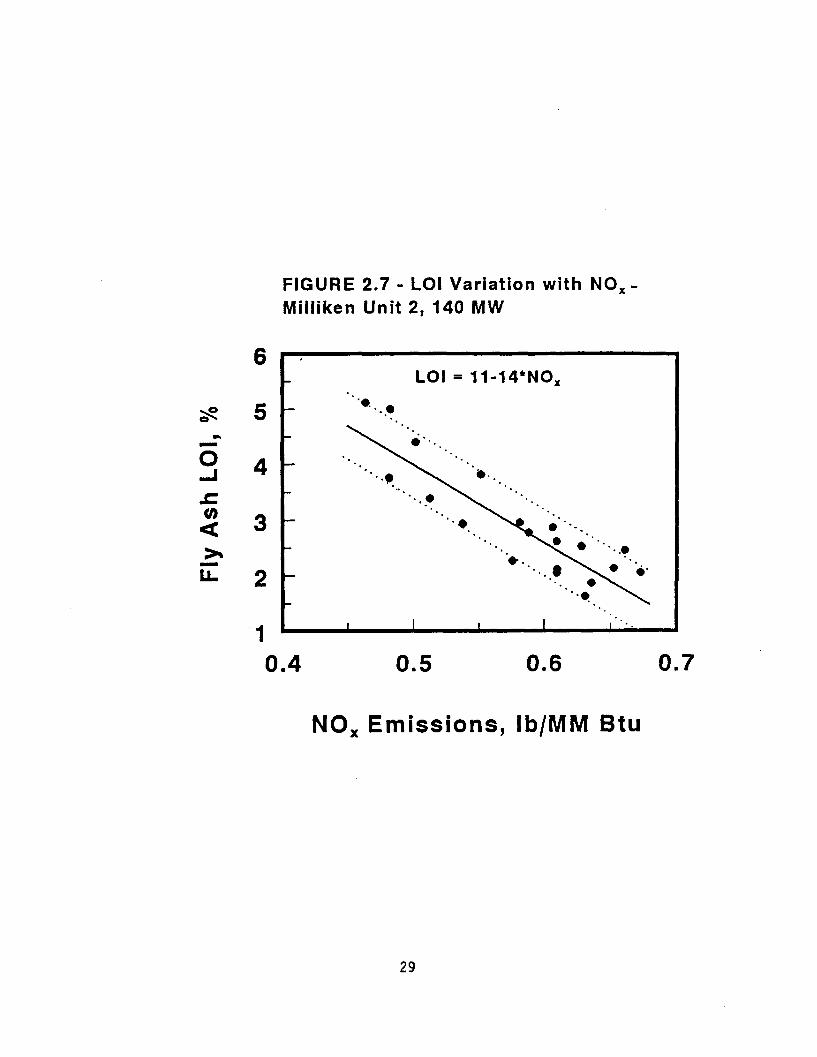
Variations in NO, emissions and LOI with excess 0, at 140 MW boiler load are shown in Figure 2.6. Excess 0, was the most significant parameter affecting both NO, emissions and LOI. The scatter of the data points was in part due to experimental variation and in part due to the effects of variables of secondary importance, including fuel air flow and burner tilt. The relationship between LO1 and NO, emissions is shown in Figure 2.7, and is approximated by the following linear relationship:
LO1 = 11 - 14 * NO,.
Where LO1 is in % and NO, is in lb NOJMM Btu.
2.3.7 Predictive Correlations for NO, Emissions and LO1
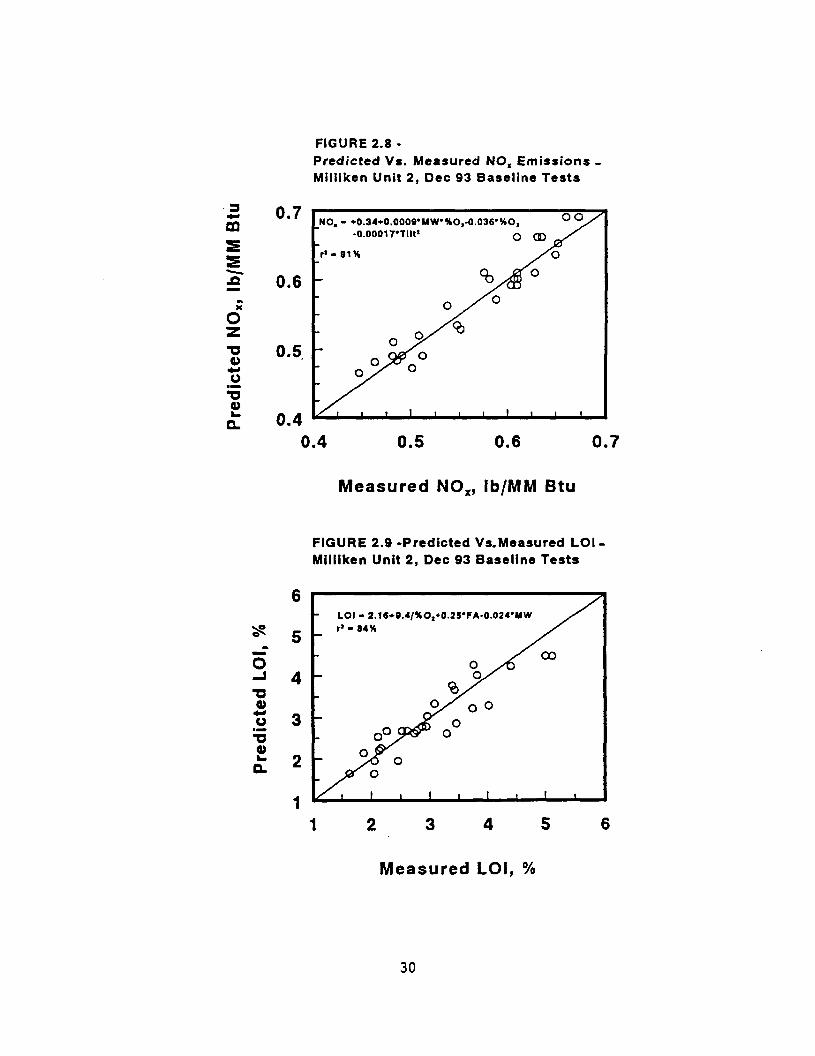
Two important factors were considered in the development of correlations from the baseline data: the statistical significance of the predictors, and the simplicity of the correlations. Therefore, when satisfactory results were obtained using only main effects, more complex terms were not included. For example, LO1 variation with excess O2 could be better described by the inverse 0, factor (l/02) than with the quadratic 0, factor (02*02). Two correlations (one for NO,, another for LOI) were derived for each Design A and another two were derived for Design C (Table 2.8). The correlations were combined to generate a single correlation for NO, emissions and another for LO1 by taking the better correlation (higher r2) as a base and including the factors that were not accounted for from the other correlation:
where 02 is excess 0, measured at the economizer outlet, MW is boiler load in MW net, TILT is burner tilt in degrees, and AIR is fuel air damper position.
Comparisons of measured and predicted NO, emissions and LO1 based on the two derived correlations are presented in Figures 2.8 and 2.9, respectively.
2.4 Conclusions
The Milliken Unit 2 baseline diagnostic tests conducted during December of 1993 were analyzed to determine the effects of boiler load, fuel air flow, excess O,, burner tilt, and reduced-load mill pattern on NO, emissions and LOI. The following conclusions were reached:
1. The average difference between replicated tests was 0.024 lb NOJMM Btu and 0.62% LOI. The uncertainty at 95% confidence, was + 0.016 lb NOJMM Btu and f 0.30% LOI.
2. Changing fuel air damper position had a significant effect on LO1 and a minor effect on NO, emissions. Increasing fuel air damper position from 2 to 4 increased LO1 0.5%. The minimum and maximum
13
(100% air flow) fuel air damper positions were 1 and 5, respectively.
3. Variation in burner tilt had a quadratic effect on NO, emissions and no significant effect on LOI. Changing burner tilt from + 15' to 0" increased NO, emissions 0.04 lb/MM Btu.
4. At reduced boiler loads (110 MW and lower), taking the top burners out of service instead of the bottom burners (normal operation at Milliken) reduced NO, emissions, but made it difficult to maintain steam temperatures.
5. Increasing excess 0, increased NO, emissions and reduced LOI. The impact of excess air on NO, emissions was reduced at lower boiler loads.
6. At the same excess O2 level, higher boiler loads increased NO, emissions and reduced LOI, most likely due to higher temperatures and improved fuel/air mixing in the firebox.
7. Lower NO, emissions corresponded to higher LOI. The variation at 140 MW boiler loads was approximated by a linear relationship as:
LO1 = 11 - 14 * NO,.
8. The following predictive correlations for NO, emissions and LO1 were derived for normal operation of Unit 2:
% LO1 = - 1.2 t 9.4/02 t 0.25*AIR - O.O24*(MW-140)
r2=91%
r2=84%
where 02 is excess 0, measured at the economizer outlet, MW is boiler load in MW net, TILT is burner tilt in degrees, and AIR is fuel air damper position.
9. The short-term, baseline tests indicated that NO, emissions could be reduced to about 0.54 lb/MM Btu at 140 MW, while maintaining salable fly ash.
14
TABLE 2.1 - UNIT 2 BASELINE TESTS - PARAMETER SETTINGS
FIGURE 2.4 - Effect of Excess Air - Milliken Unit 2, Parameter: Boiler Load
l
_ 140 MW ‘;... 110 MW
8 . . -. -. l 80 Mb -. *.
-. l .* ,.... *...*-.-
*. *. “9
1. 8 -. *. 8 -.
‘8.. ‘*
8 *.
8 *..* -. . . . . . . . . ‘8
0
I I I I I I I
. * : : : .8 : :
8 : :* : y’ ..d
140 MW :=’ l : /-h0 MW 8 :* .a*
: 8’ : :
. : *.‘. .a.** 8 *a--*
: **** 80 MW l ’
I I I I I I I
2 3
Economizer 0,, %
26
3 E
z 2 - m 2 0 .- 3 .II E
W
P
6
5
4
3
2
0.6
0.5
0.4
FIGURE 2.5 - Effect of Boiler Load - Milliken Unit 2, Parameter: %O,
Boiler Load, MW
27
3 z E s 2 - ui- 5 .I 2 .- E W 0” Z
6
5
4
3
2
0.6
0.5
0.4
FIGURE 2.6 - Effect of Excess Air - Milliken Unit 2, 140 MW
I
. 0
0
I I I I I I I
l l .
-
m
I I I I I I I
3 4 5 2
Economizer 0,, %
28
FIGURE 2.7 - LOI Variation with NO, - Milliken Unit 2, 140 MW FIGURE 2.7 - LOI Variation with NO, - Milliken Unit 2, 140 MW
6 ’ 6 ’ LOI = 11014*NO, LOI = 11014*NO,
5 - 5 - “*e,*e “*e,*e
*. *.
4 - 4 -
3 - 3 -
2 - 2 -
* .
1 l . . . .
1 ’ I I I I I I I I . . . .
0.4 0.5 0.6 0.7
NO, Emissions, lb/MM Btu
29
FIGURE 2.8 - Predicted Vs. Measured NO, Emissions - Miiiiken Unit 2, Dee 93 Baseline Tests
0.7 ’ NO, - +0.34+0.0006*htW’WO,-O.O3S-%O,
-0.00017’Tllt’
r*- 01%
0.6 -
0.4 0.5 0.6 0.7
Measured NO,, lb/MM Btu
FIGURE 2.9 -Predicted Vs.Measured LOI - Millikcn Unit 2, Dee 93 Baseline Tests
6 6 LOI - 2.16+6.4/%0,*0.25’FA-0.024’UW LOI - 2.16+6.4/%0,*0.25’FA-0.024’UW
5 5
4 4
3 3
2 2
1 1 1 1 2 3 4 5 6 2 3 4 5 6
Measured LOI, %
30
SECTION THREE UNIT 1 POST-RETROFIT DIAGNOSTIC TESTS
3.1 Experimental Design
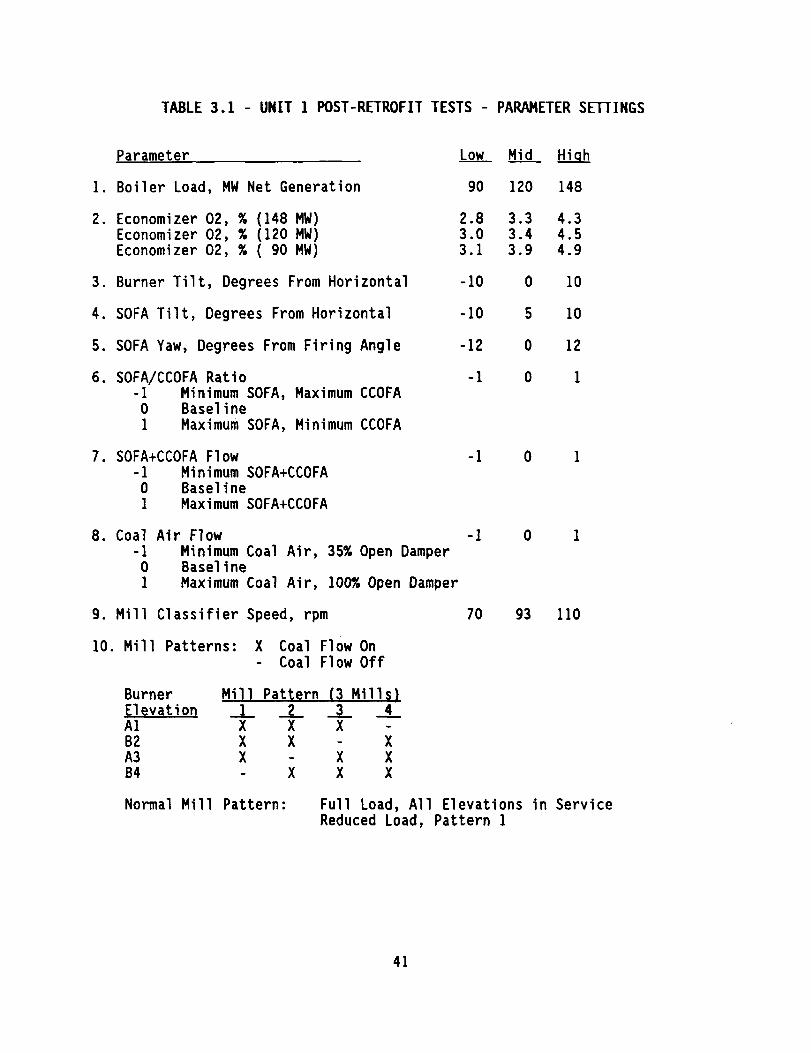
The statistically designed LNCFS-3 diagnostic test program examined the effects of boiler load, excess 02, mill classifier speed, combustion air distribution (SOFA flow, CCOFA flow and coal air flow), burner settings (burner tilt, SOFA tilt and SOFA yaw), and mill load patterns on NO, emissions and LOI. The experimental parameter settings are listed in Table 3.1. A high setting of 4.3% excess 0, at the economizer outlet at 148 MW boiler load was limited by fan capacity. Direct measurements of combustion air flows (SOFA, CCOFA and coal air) were not possible, and qualitative designations of minimum, baseline and maximum were used for the following three parameters: SOFA/CCOFA ratio, SOFA+CCOFA flow and coal air flow.
New coal mills were installed on Unit 1, one for each of the four elevations of burners. The new coal mills made it possible to test mill patterns at full load with one mill out of service, in addition to the normal operational mode with all mills in service. This option was not available for baseline testing on Unit 2 with the older coal mills, where operation at boiler loads above 135 MW required all four mills. Four configurations were possible by taking one mill out of service, as described in Table 3.1. Operation at reduced boiler loads (120 MW and 90 MW) required only three mills in service, with the lowest mill taken out of service for normal operation at Milliken. Alternate (other than normal) mill patterns at 90 MW and mill patterns with only two mills in service were not tested because of expected problems with flame stability and the coal mills tripping.
The post-retrofit test design consisted of three experimental blocks, as described in Tables 3.2, 3.3 and 3.4. Tests marked by asterisks were replicated to allow an independent estimate of the experimental error, and some tests were common to more than one design. The three experimental designs were:
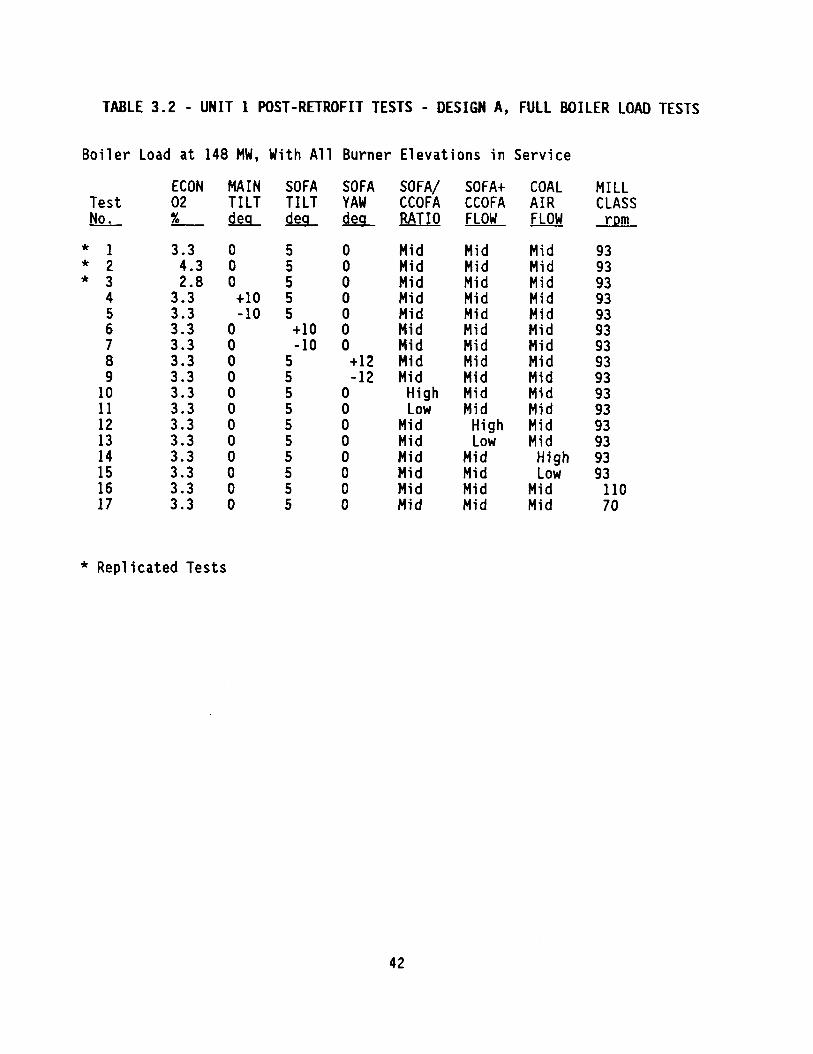
1. Desiqn A. Full Boiler Load Tests (Table 3.21: These 17 tests were conducted at 148 MW to examine positive and negative variations in each parameter from baseline settings. The tests provided a measure of the relative contribution of the parameters to variations in NO, emissions and LOI. The independent parameters were excess 02, burner tilt, SOFA tilt, SOFA yaw, SOFA/CCOFA ratio, SOFAtCCOFA flow, coal air flow and mill classifier speed.
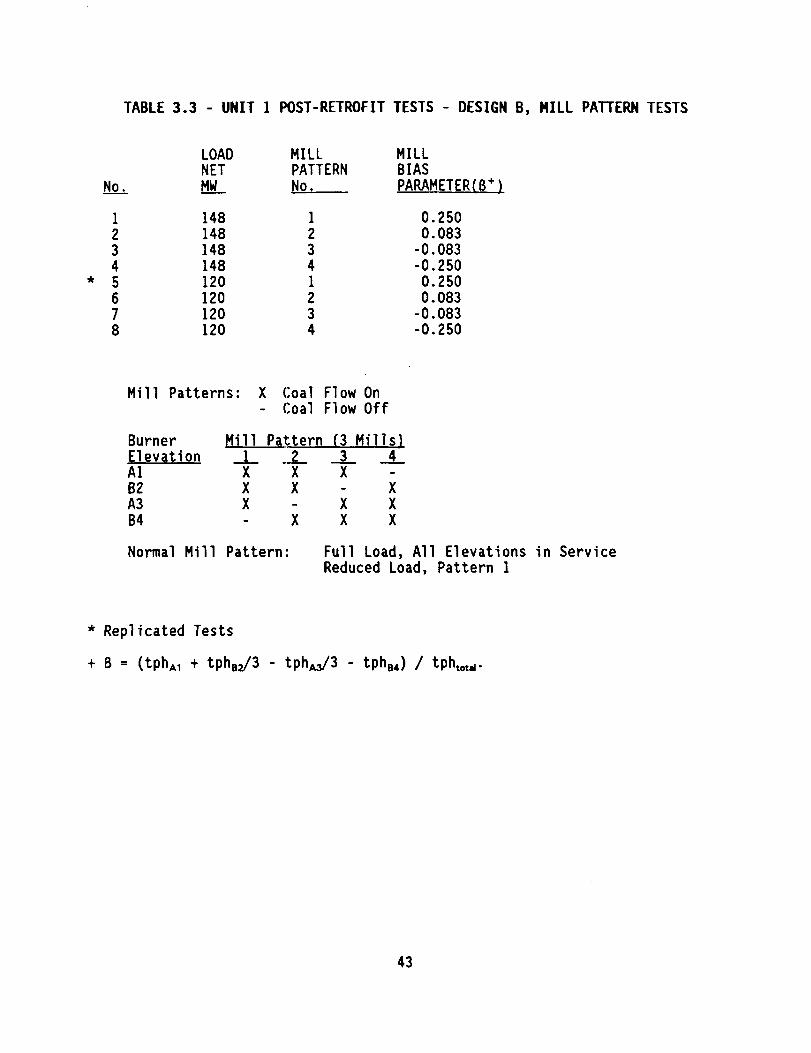
2. Desim 6. Mill Pattern Tests (Table 3.31: This set consisted of 8 tests operated with one mill out of service, including 4 possible mill patterns at 148 MW (Tests l-4) and 4 possible mill patterns at 120 MW (Tests 5-8).
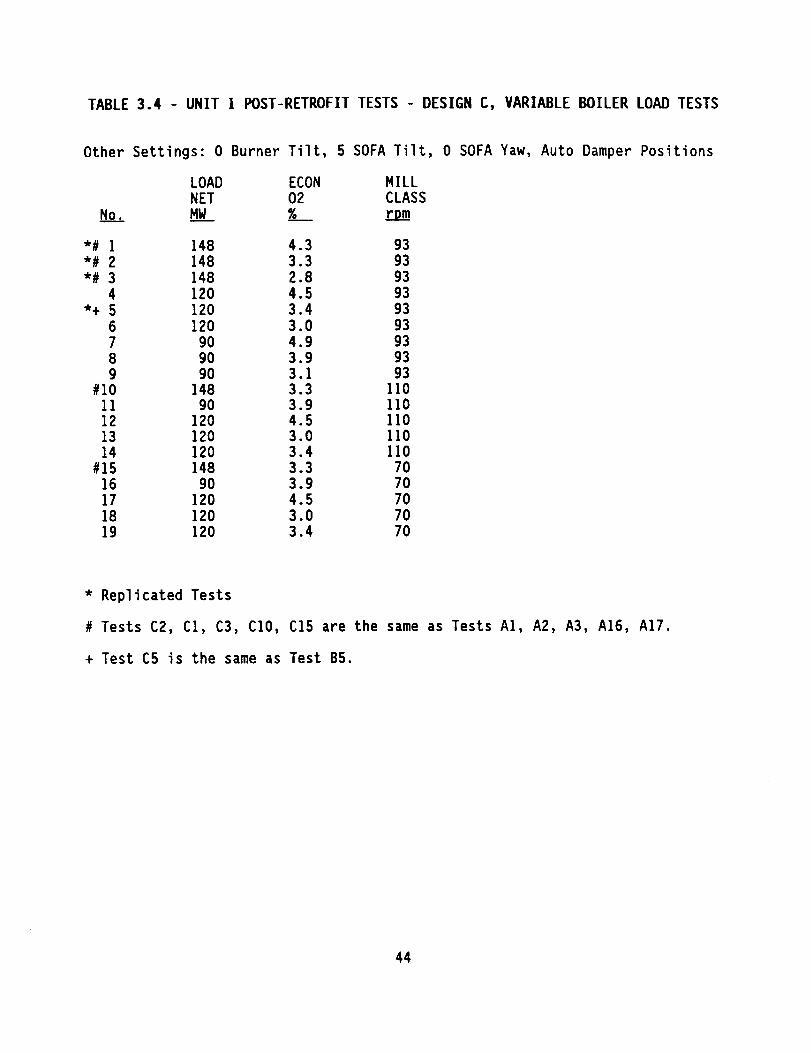
3. Desian C. Variable Boiler Load Tests (Table 3.41: This design included 19 tests, with the most significant parameters affecting NO, emissions and LO1 as the independent variables, namely, boiler load, excess 0, and mill classifier speed. The design consisted of
31
a full three-level factorial with respect to variations in boiler load and excess O2 (Tests 1-9) at a typical mill classifier setting of 93 rpm, with additional tests (Tests 10-19) to evaluate the effect of variations in mill classifier speed. A full quadratic model with respect to the independent variables could be derived from these tests.
3.2 Experimental Plan
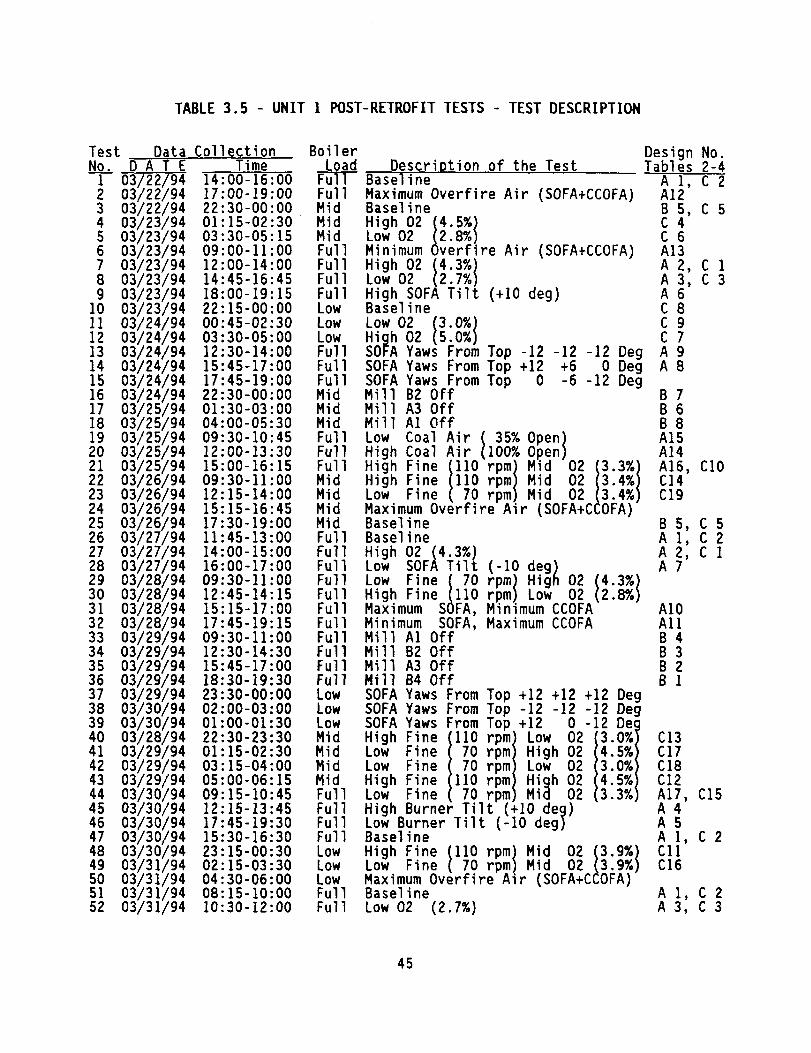
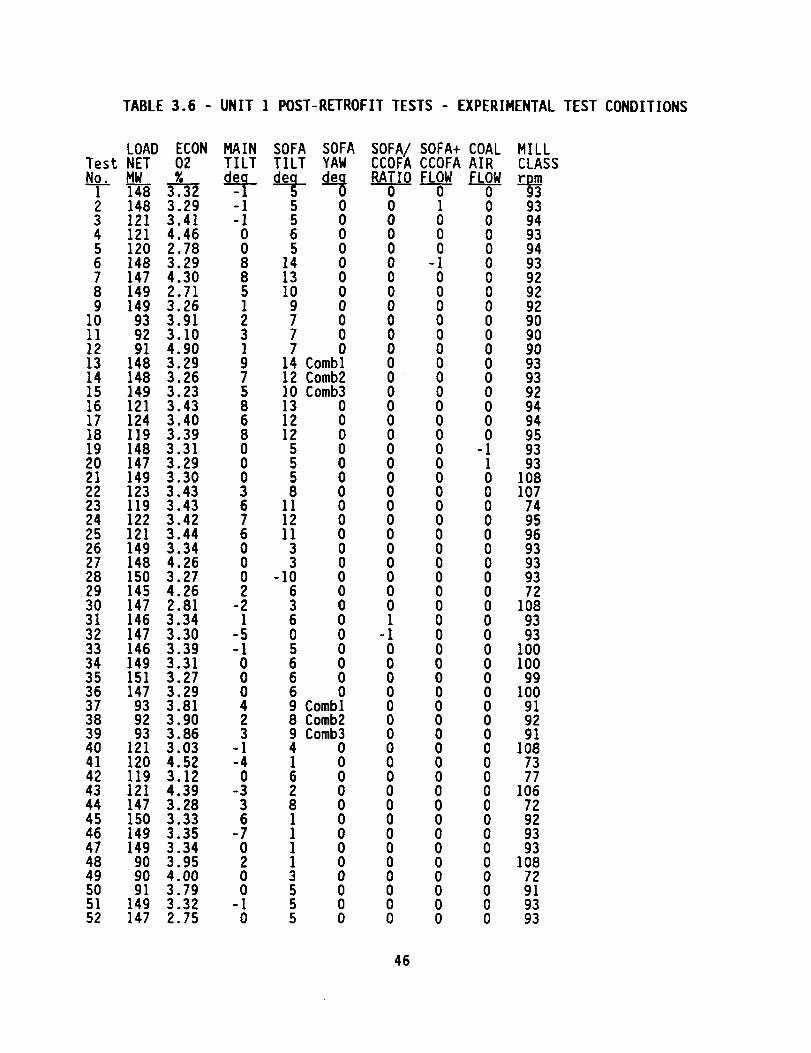
The LNCFS-3 diagnostic tests were conducted on Unit 1 between March 22 and 31 of 1994. A total of 52 tests were conducted, each typically 2-3 hours long. The tests are described in Table 3.5, and the experimental conditions are presented in Table 3.6. In general, tests at 120 MW and 90 MW boiler loads were conducted between 9 p.m. and 6 a.m. A primary consideration was given to maintaining reliable boiler operation and power generation. When a set of test conditions could not maintain the required steam conditions, the test was terminated as soon as sufficient data was collected.
3.2.1 Measurements
Two CEM systems were used for the LNCFS-3 diagnostic tests. One system, designated as the ESA system, was operated at the economizer outlet. The other system was the plant stack CEM.
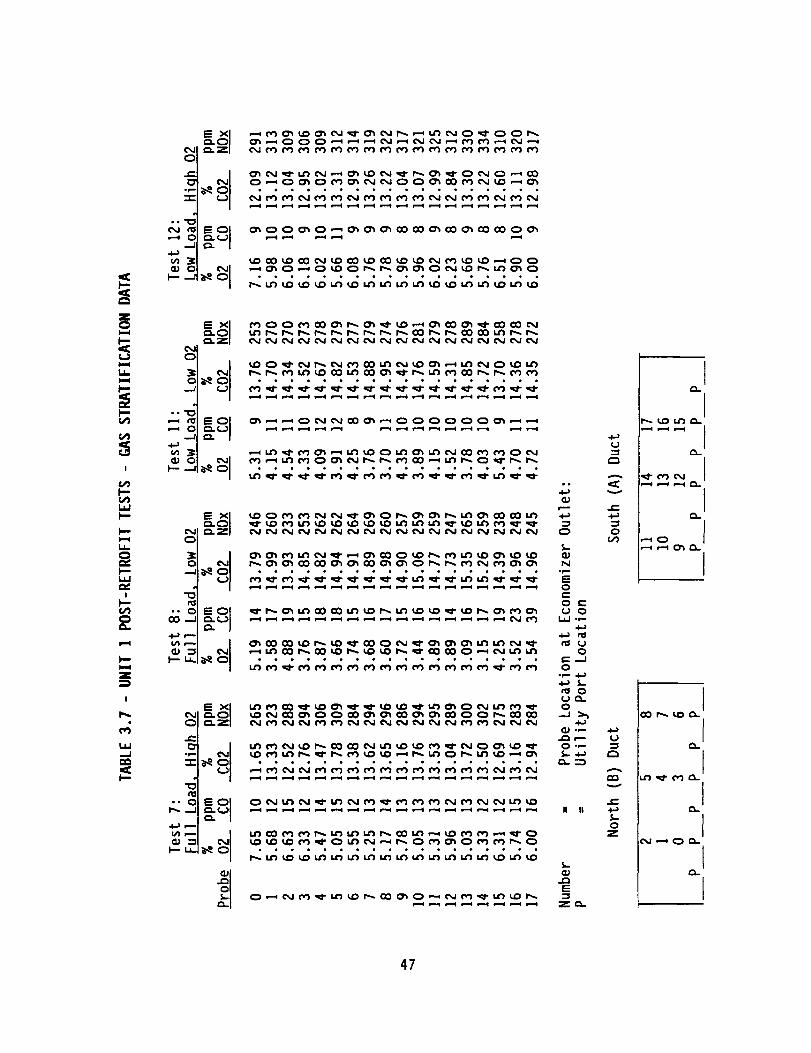
The ESA CEM system was used to measure 0,, CO, CO,, and NO, concentrations at the economizer outlet. The system included an electrochemical 0, analyzer, non- dispersive infrared CO and CO, analyzers, and a chemiluminescent NOdNO analyzer. It allowed multi-point monitoring of emissions at 36 sampling locations (18 per duct), available as individual point measurements or as a composite. The flows at the sampling locations were individually measured and controlled. Individual point measurements were made for selected tests (Tests 7, 8, 11, and 12) to determine the extent of gas stratification at the economizer outlet and to detect burner balancing problems. Concentration measurements across the duct (Table 3.7) indicated that gas stratification at the economizer outlet was minor. Composite measurements were made for all the tests.
The sampled gases were conditioned by removing moisture before reaching the flow indicators and the gaseous analyzers. This sampling method reduced the overall NO, measurement accuracy due to the loss of some NO, in the water condensate. NO, concentrations were estimated at l-2 ppm, corresponding to less than 1% of NO levels. This was verified experimentally by measuring NO, under baseline conditions (Test 47) using a second sampling system consisting of 3 probes with heated lines and a moisture freeze-out system so that the gas sample was either heated or dry at all locations before reaching the analyzer. NO, and NO measurements were indistinguishable, supporting the initial estimate of l-2 ppm NO,, calculated as the difference between NO, and NO concentrations.
The ESA CEM data were collected every 10 seconds, averaged and recorded every 10 minutes. Certification of this system was performed prior to testing, including Relative Accuracy Test. An instrument error check was performed twice daily using zero, mid and high span gases, according to EPA Protocol 1. A system bias check was performed weekly using zero and mid span gases.
32
The plant O2 probe was used to monitor 0, concentrations at the economizer outlet. The plant CEM system was used to measure CO,, NO, and SO, concentrations at the stack. The system included a non-dispersive infrared CO, analyzer, a chemiluminescent NO, analyzer, and a pulsed fluorescent SO, analyzer. A low flow dilution probe was used and no additional conditioning was required. The CEM system passed the Relative Accuracy Test, and was calibrated daily.
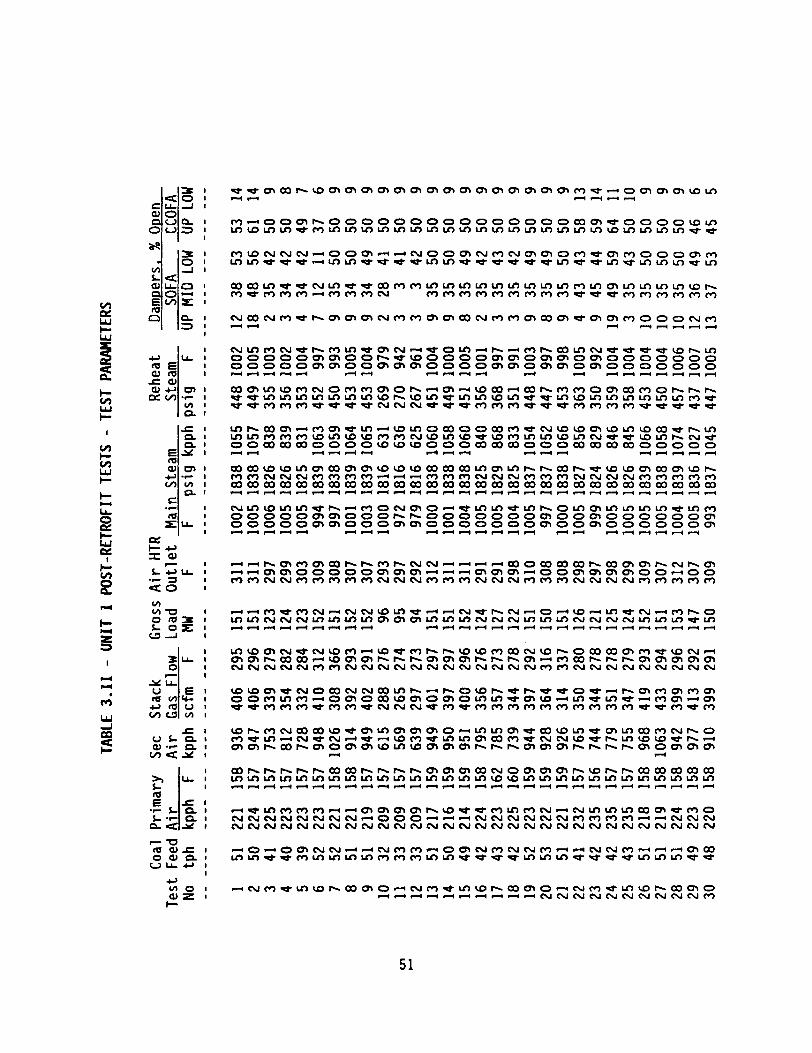
Process and CEM data were acquired using the plant Westinghouse data acquisition system (WDPF). Typically, l-2 hours of test data at steady state conditions were averaged for each test. Steady state conditions for a test were assumed when small changes in NO, measurements occurred with time (less than 3 ppm change in the hourly average), and typically occurred within l-2 hours after test conditions were set.
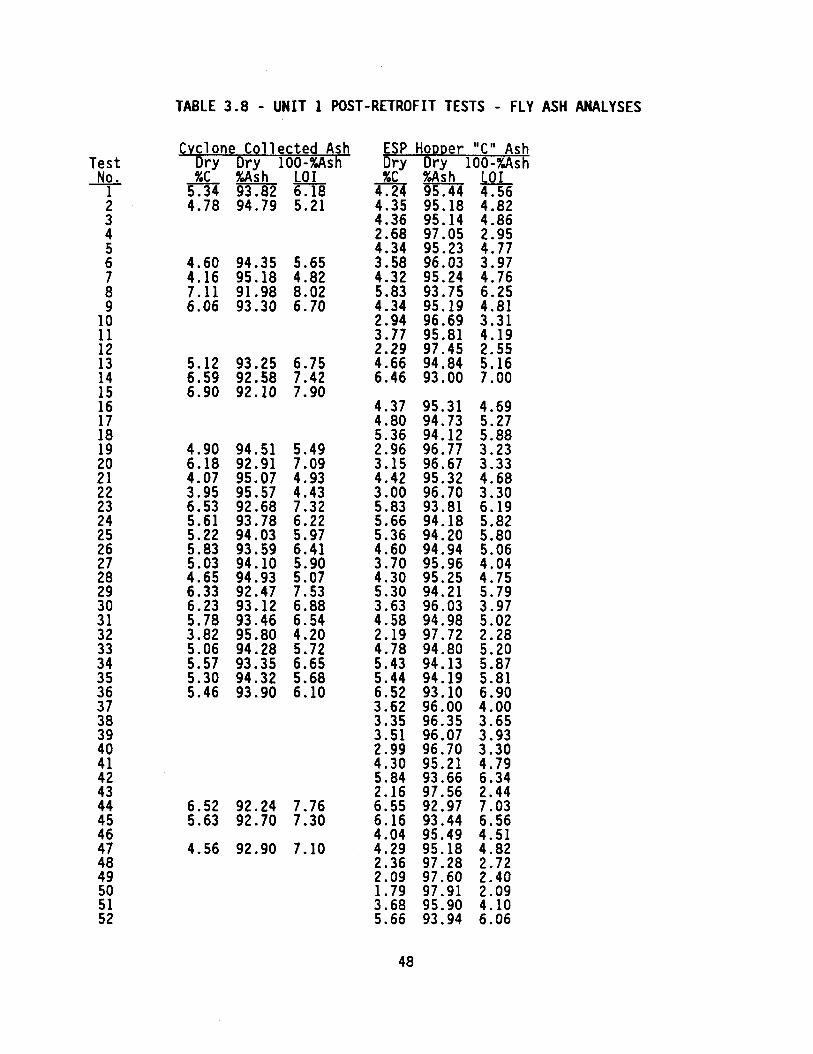
Fly ash was sampled from the ash transport pipe during unloading of the first ESP hopper ("C" hopper) to the ash silo. For tests at 148 MW, a cyclone was used to collect a second fly ash sample from the ash transport pipe for 30-60 minutes during sequential unloading of all ash hoppers to the silo, and then extracting a 4-8 ounce sample. The ash samples were subsequently analyzed for moisture, carbon and ash contents, as presented in Table 3.8.
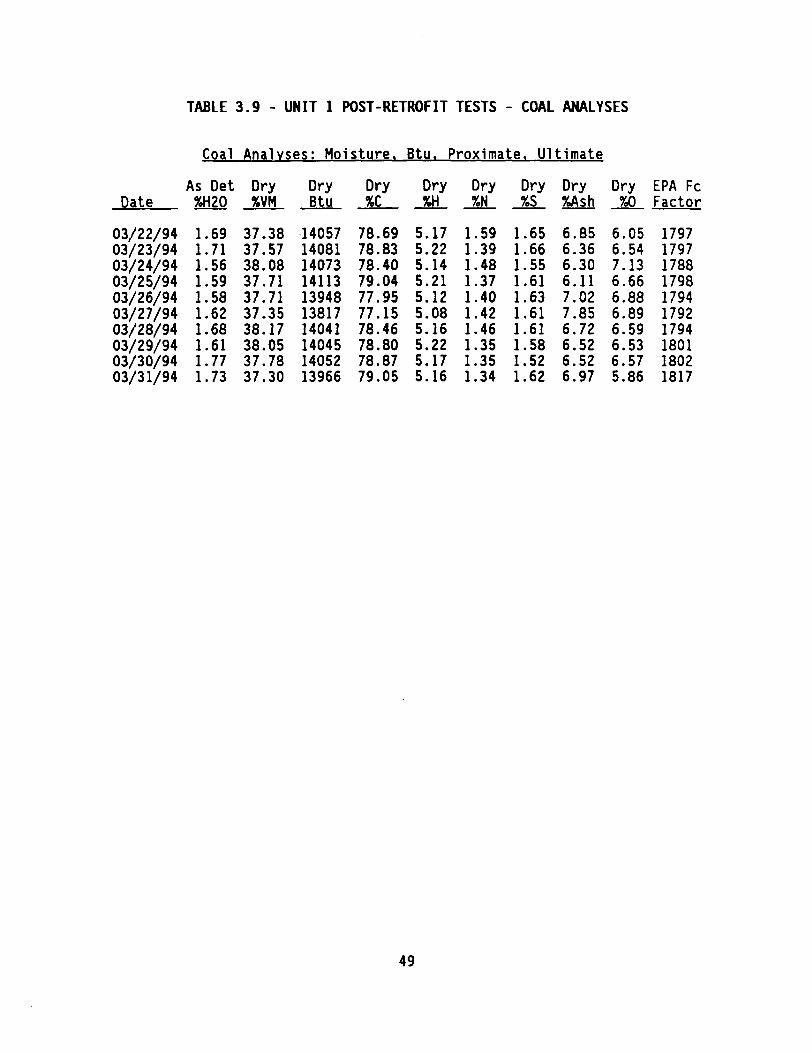
Daily coal samples were collected and analyzed for moisture, proximate and ultimate compositions, and heating value, as presented in Table 3.9.
3.3 Results and Discussion
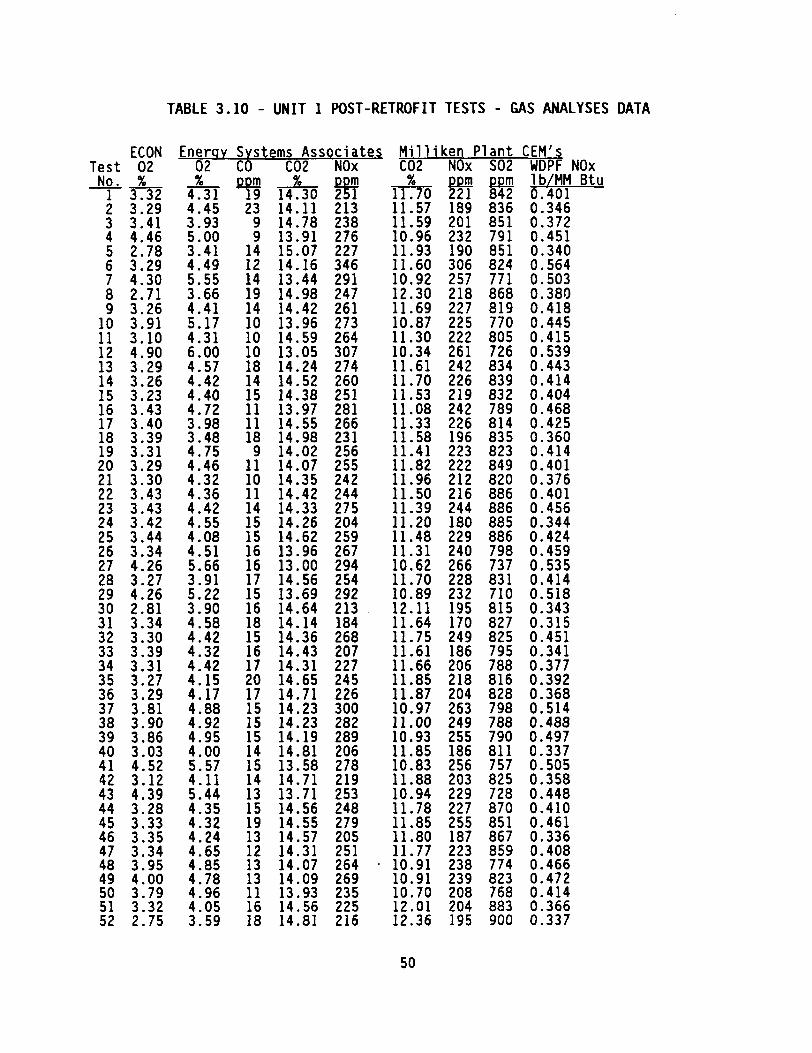
A total of 52 post-retrofit diagnostic tests were conducted, including 6 replicates. Gas analyses and test process data are presented in Tables 3.10 and 3.11, respectively. CO measurements at the economizer outlet (ESA CEM system) were 9-23 ppm for all the tests. Thus, CO variation was not a consideration in this study.
The calculation of NO, emissions in lb/MM Btu from measured NO, concentrations depends on the availability of CEM and coal analysis data according to EPA Method 19 (40 CFR 60 Appendix A, 1993). The calculations are presented below:
NO, emissions are calculated using CO, measurements as:
Where F, is scf CO, per MM Btu. A tabulated value for F, is used, or it can be calculated from coal analysis data as:
F, = 0.32lxlO%C,,.,/(Btu/lb),,,.
The EPA tabulated F, value for bituminous coal is 1800. The calculated F, values (Table 3.9) varied between 1788 and 1817, differing by less than 1% from the tabulated value.
NO, emissions are calculated using 0, measurements as:
The EPA tabulated F, value for bituminous coal is 9780.
LO1 was defined as the percentage of combustibles in the fly ash, calculated as:
LO1 = 100 - % Asht,yrh,dry.
3.3.1 Data Evaluation
Two sources of CEM data (economizer outlet and stack) were available, and two ash samples were collected for tests at 148 MW boiler load. Furthermore, NO, emissions could be calculated using different data sets. Therefore, a comparative evaluation of the different data sets was conducted.
NO, emissions data in lb/MM Btu at the stack (calculated from the tabulated F, value, and measured NO, and CO, concentrations) were extracted at one-minute intervals from the plant data acquisition system and averaged for each test. The data set was consistent with NO, emissions calculated from 15-minute averages of CO, and NO, plant CEM measurements (similar data reduction procedure to the Unit 2 baseline tests).
Two ash samples were collected for tests at 148 MW boiler load (Table 3.8), one during unloading of the first ESP hopper (referred to as "C" hopper ash), and a second sample during sequential unloading of all ash hoppers (referred to as cyclone collected ash). Only "C" hopper samples were collected for all the tests (except Test 16). Typically, LO1 checks at the plant are performed on ash collected during unloading of the first ESP hopper. The two ash samples were collected at 148 MW boiler load to compare LO1 of cyclone collected ash to that of "C" hopper ash. The carbon in the ash was related to LO1 as:
Cyclone Collected Ash: LO1 = l.O56%C,, t 0.57 r2 = 81.5%, n = 30
"C" Hopper Ash: LO1 = l.O43+%C,, t 0.21 r2 = 99.6%, n = 51
Cyclone collected ash typically had 0.5X-2.0% higher LO1 than "C" hopper ash, with an average difference of 1.2%. The "C" hopper ash data were used in analyzing the results.
3.3.2 ExDerimental Error
Six replicated tests were used to estimate the standard deviation of the experimental error (am,) and the uncertainty in measurement (confidence level), for both NO, emissions and LOI, as seen in Table 3.12. Calculated a,, values for NO, emissions and LO1 were 0.035 lb/MM Btu and 0.45X, respectively. The uncertainty in measurement is f t*u/V!i, where N is the number of replicated tests, and t is a tabulated statistical parameter depending on the degrees of freedom and the desired confidence level. For 6 degrees of freedom and 95% confidence (t = 2.447), the confidence intervals were NO, + 0.027 lb/MM Btu and
34
LO1 f 0.35%. Differences between replicated tests for NO, and LO1 averaged 0.044 lb/MM Btu and 0.6%, respectively. The uncertainty in measuring LO1 for the post- retrofit tests was comparable to that for the baseline tests. However, the uncertainty in measuring NO, was significantly greater for the post-retrofit tests than for the baseline tests, mostly likely due to the sensitivity of NO, emissions to a larger number of parameters in a low-NO, configuration.
3.3.3 ExDerimental Results
Replicated results were averaged and the reduced data matrix is presented in Table 3.13. Analysis of the data focused on the effect of the independent variables on NO, emissions and LOI. The independent parameters were boiler load, excess 0,, burner tilt, SOFA tilt, SOFA yaw, SOFA/CCOFA ratio, SOFAtCCOFA flow, coal air flow and mill classifier speed. The effect of mill load pattern on NO, emissions and LO1 was also examined (Design B).
Analysis of the test results of Designs A and C showed that, in general, LO1 increased as NO, emissions decreased. However, weak correlation coefficients were obtained, suggesting a more complex relationship between NO, and LOI, relative to that observed in baseline testing. For Design A, burner tilt exhibited strong correlations with both NO, emissions and LOI. For Design C, 0, exhibited strong correlations with both NO, emissions and LOI.
3.3.4 Effects of Combustion Air Distribution and Burner Tilt
The tests of Design A (Table 3.13) examined the effects of burner tilt, SOFA tilt, SOFA yaw, SOFA/CCOFA ratio, SOFAtCCOFA flow, and coal air flow on NO, emissions and LO1 at 148 MW boiler load. Excess O2 and mill classifier speed were also variables in this design, but their effects are discussed in more detail in the analysis of Design C where greater variability of these two parameters was possible.
Regression analyses were used to identify the statistically significant factors affecting NO, emissions and LOI, starting with a linear model with respect to the eight independent variables of Design A. The final correlations for Design A are shown in Table 3.14. 02 is excess 0, measured at the economizer outlet, S refers to SOFA flow, C refers to CCOFA flow, and TILT is burner tilt in degrees. Four variables had significant effects on NO, emissions, namely, excess 0,, burner tilt, SOFA/CCOFA ratio, and SOFAtCCOFA flow. Each exhibited about the same level of significance. Only burner tilt had a clearly significant effect on LOI.
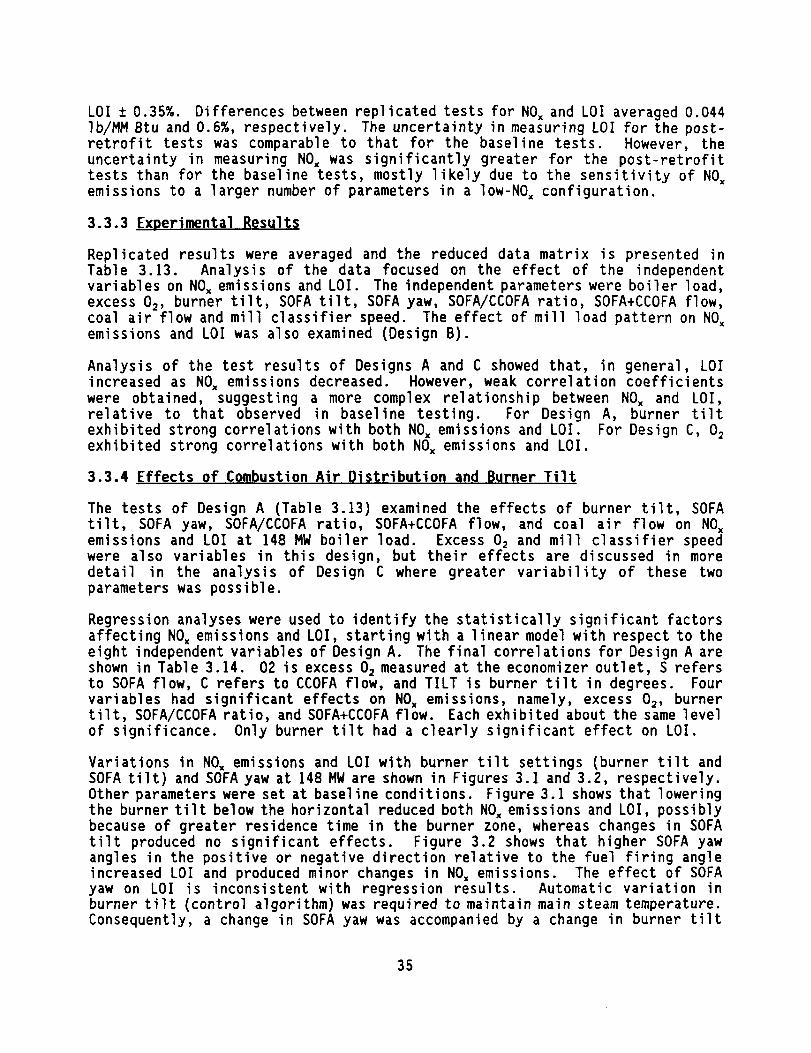
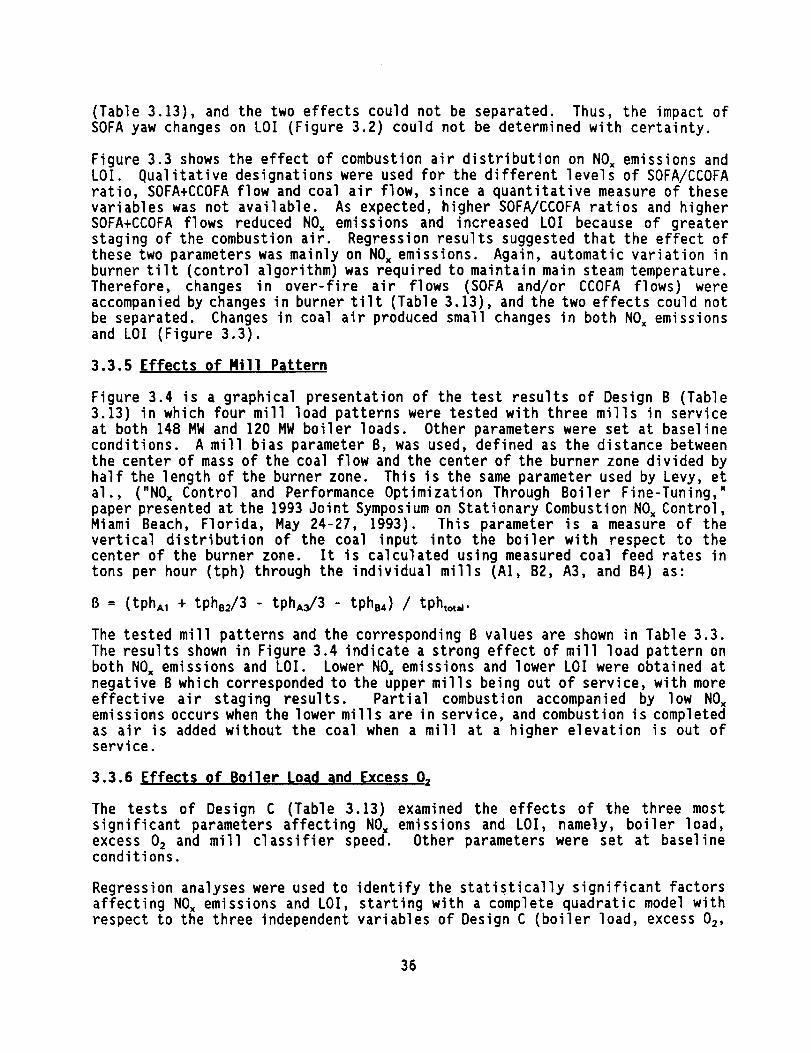
Variations in NO, emissions and LO1 with burner tilt settings (burner tilt and SOFA tilt) and SOFA yaw at 148 MW are shown in Figures 3.1 and 3.2, respectively. Other parameters were set at baseline conditions. Figure 3.1 shows that lowering the burner tilt below the horizontal reduced both NO, emissions and LOI, possibly because of greater residence time in the burner zone, whereas changes in SOFA tilt produced no significant effects. Figure 3.2 shows that higher SOFA yaw angles in the positive or negative direction relative to the fuel firing angle increased LO1 and produced minor changes in NO, emissions. The effect of SOFA yaw on LO1 is inconsistent with regression results. Automatic variation in burner tilt (control algorithm) was required to maintain main steam temperature. Consequently, a change in SOFA yaw was accompanied by a change in burner tilt
35
(Table 3.13), and the two effects could not be separated. Thus, the impact of SOFA yaw changes on LO1 (Figure 3.2) could not be determined with certainty.
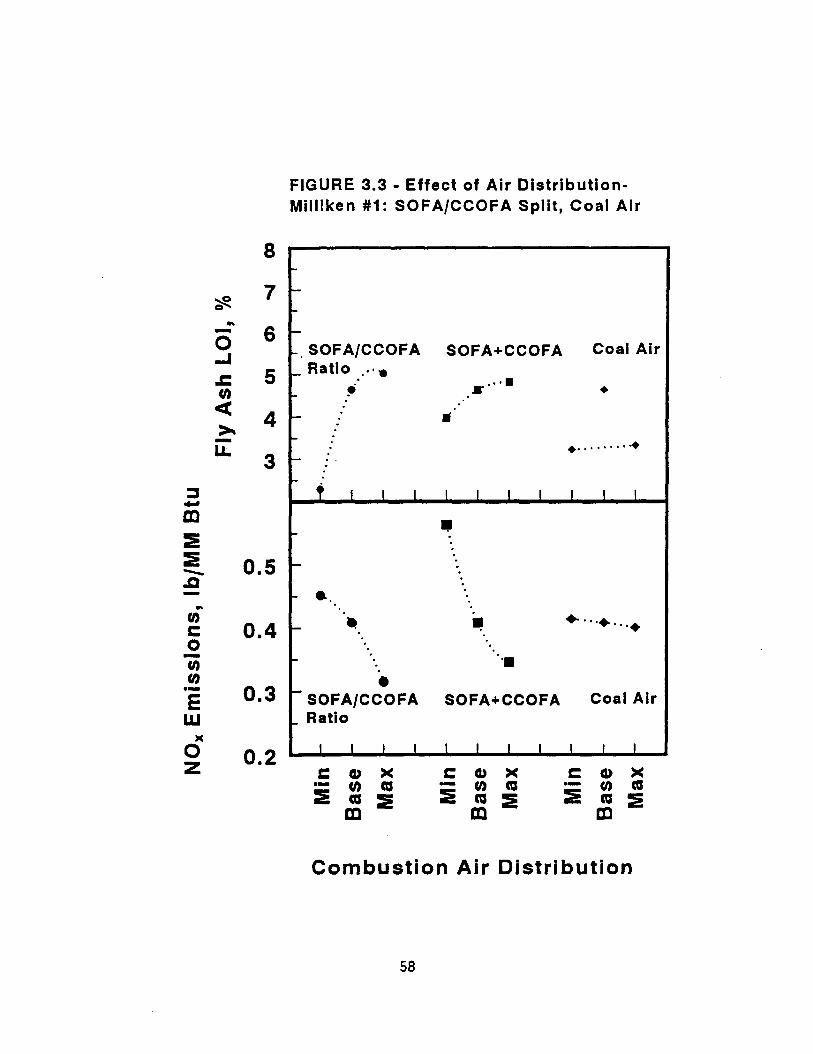
Figure 3.3 shows the effect of combustion air distribution on NO, emissions and LOI. Qualitative designations were used for the different levels of SOFA/CCOFA ratio, SOFAtCCOFA flow and coal air flow, since a quantitative measure of these variables was not available. As expected, higher SOFA/CCOFA ratios and higher SOFAtCCOFA flows reduced NO, emissions and increased LO1 because of greater staging of the combustion air. Regression results suggested that the effect of these two parameters was mainly on NO, emissions. Again, automatic variation in burner tilt (control algorithm) was required to maintain main steam temperature. Therefore, changes in over-fire air flows (SOFA and/or CCOFA flows) were accompanied by changes in burner tilt (Table 3.13), and the two effects could not be separated. Changes in coal air produced small changes in both NO, emissions and LO1 (Figure 3.3).
3.3.5 Effects of Mill Pattern
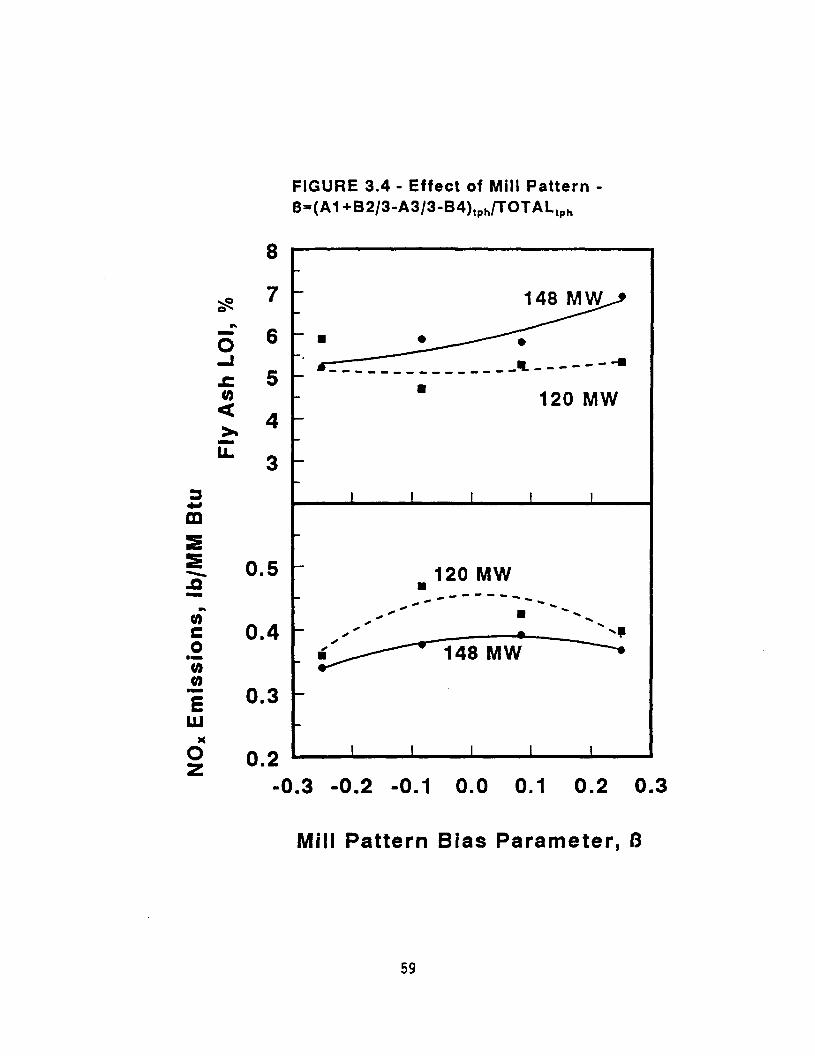
Figure 3.4 is a graphical presentation of the test results of Design B (Table 3.13) in which four mill load patterns were tested with three mills in service at both 148 MW and 120 MW boiler loads. Other parameters were set at baseline conditions. A mill bias parameter 6, was used, defined as the distance between the center of mass of the coal flow and the center of the burner zone divided by half the length of the burner zone. This is the same parameter used by Levy, et al., ("NO, Control and Performance Optimization Through Boiler Fine-Tuning," paper presented at the 1993 Joint Symposium on Stationary Combustion NO, Control, Miami Beach, Florida, May 24-27, 1993). This parameter is a measure of the vertical distribution of the coal input into the boiler with respect to the center of the burner zone. It is calculated using measured coal feed rates in tons per hour (tph) through the individual mills (Al, 82, A3, and 84) as:
6 = (tph,, + t&J3 - U&,3/3 - tph,.,) / U%,w
The tested mill patterns and the corresponding 8 values are shown in Table 3.3. The results shown in Figure 3.4 indicate a strong effect of mill load pattern on both NO, emissions and LOI. Lower NO, emissions and lower LO1 were obtained at negative 6 which corresponded to the upper mills being out of service, with more effective air staging results. Partial combustion accompanied by low NO, emissions occurs when the lower mills are in service, and combustion is completed as air is added without the coal when a mill at a higher elevation is out of service.
3.3.6 Effects of Boiler Load and Excess 0,
The tests of Design C (Table 3.13) examined the effects of the three most significant parameters affecting NO, emissions and LOI, namely, boiler load, excess 0, and mill classifier speed. Other parameters were set at baseline conditions.
Regression analyses were used to identify the statistically significant factors affecting NO, emissions and LOI, starting with a complete quadratic model with respect to the three independent variables of Design C (boiler load, excess 0,,
36
and mill classifier speed). The final correlations for Design C are shown in Table 3.14. 02 is excess 0, measured at the economizer outlet, MW is net boiler load, and RPM is mill classifier speed. on quadratic changes in boiler load,
Except for a dependence of NO, emissions quadratic effects and two-parameter
interaction effects were not statistically significant. NO, emissions were directly proportional to linear changes in excess 0, and mill classifier speed. LO1 was directly proportional to linear changes in excess 02, boiler load and mill classifier speed.
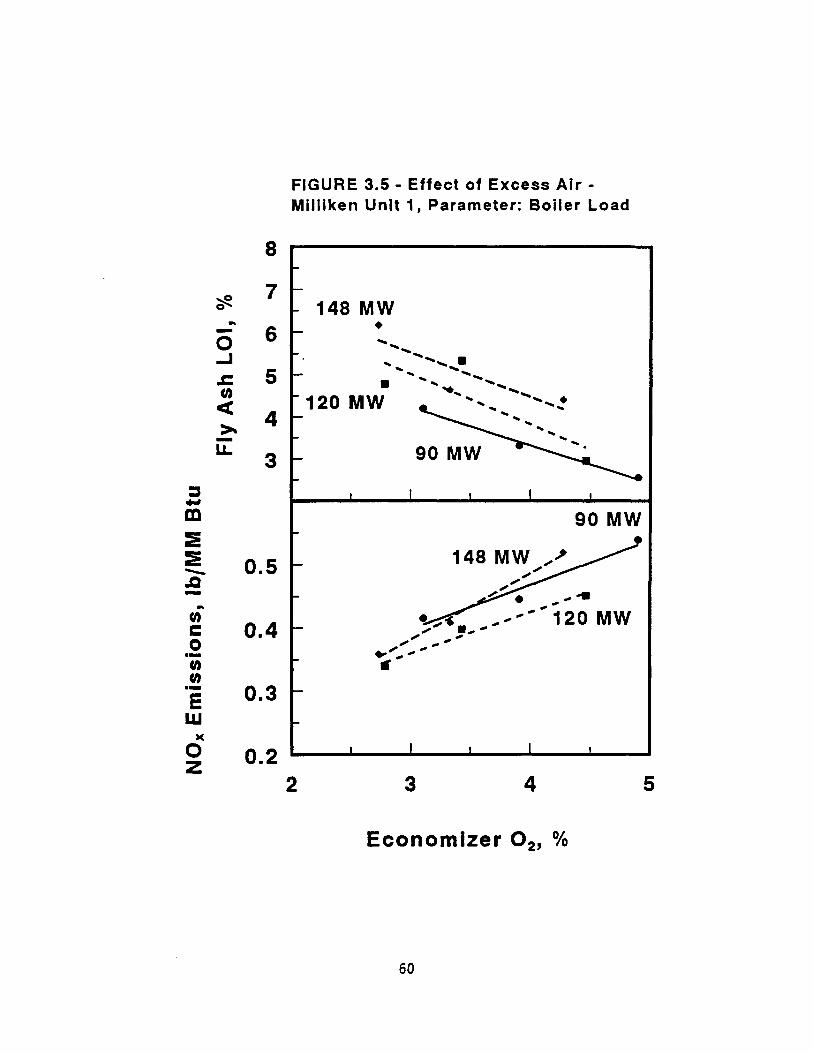
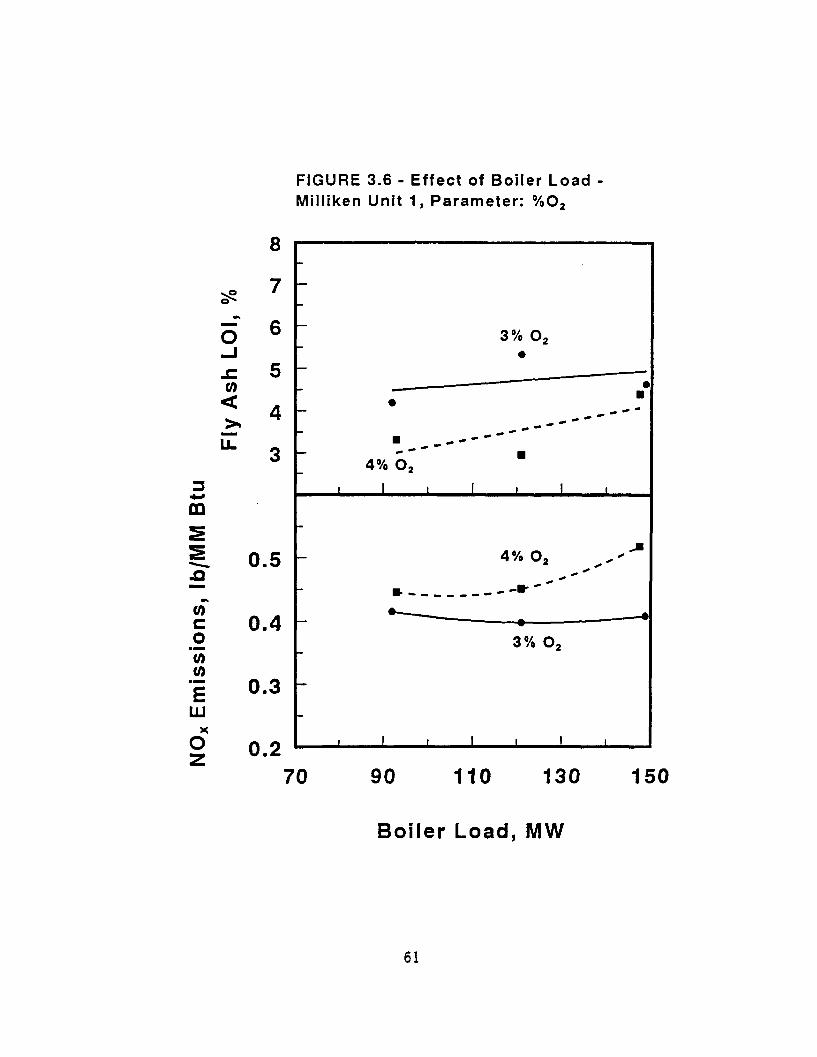
The effects of excess 0, on NO, emissions and LO1 at the three tested boiler loads (148 MW, 120 MW and 90 MW) are shown in Figure 3.5. As expected, NO, emissions increased and LO1 decreased at higher excess 0, levels which corresponded to greater excess air. The effects of boiler load changes on NO, emissions and fly ash LOI, shown in Figure 3.6, were due to two opposing effects. Reduced boiler loads corresponded to lower boiler peak temperatures, and greater overall air/fuel separation (due to air flow through burners taken out of service, without coal flow), which reduced NO, emissions and increased LOI. Furthermore, at reduced boiler loads, the SOFA air flows and SOFA fractions (of the overall combustion air flow) were lower, which increased NO, emissions and reduced LOI. The overall effect of boiler load changes (Figure 3.5) was an increase in LO1 with increasing boiler load and a quadratic change in NO, emissions with minimum values obtained at intermediate boiler loads.
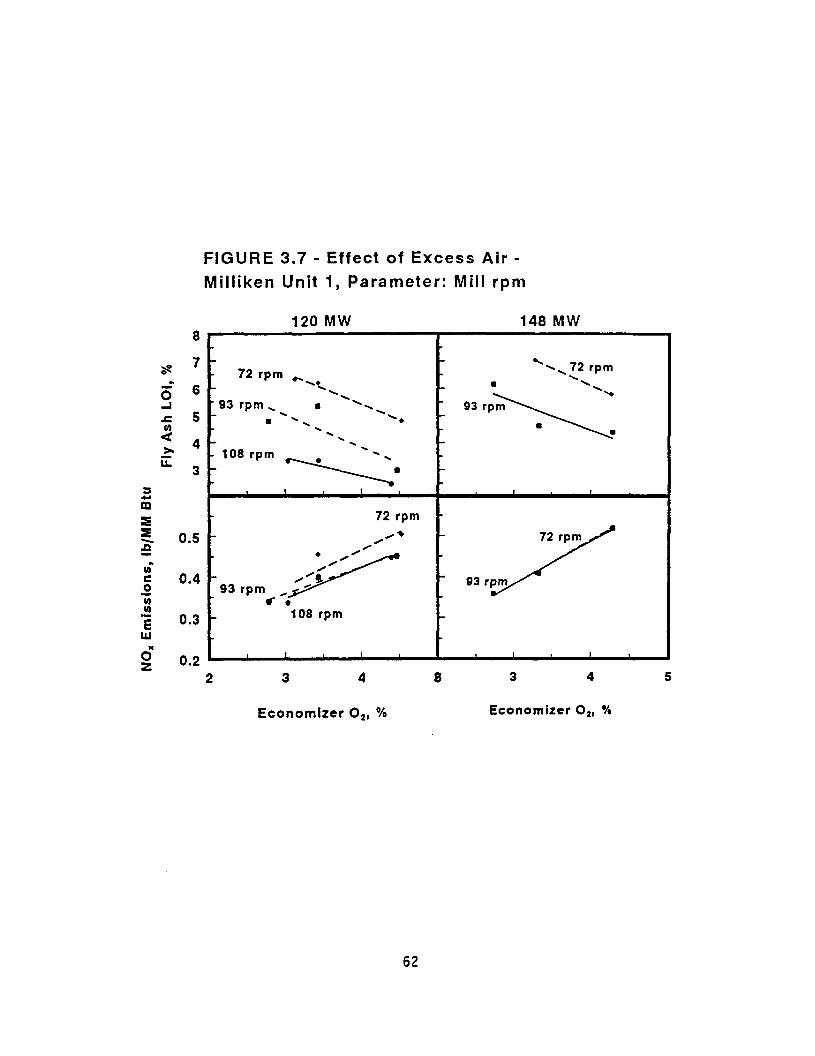
The effects of excess 0, on NO, emissions and LO1 at various mill classifier speeds (72 rpm, 93 rpm and 108 rpm) at 148 MW and 120 MW are shown in Figure 3.7. As expected, higher mill classifier speeds reduced both NO, emissions and LOI, with a more significant effect on LOI. Higher classifier speeds corresponded to higher pulverized coal fineness.
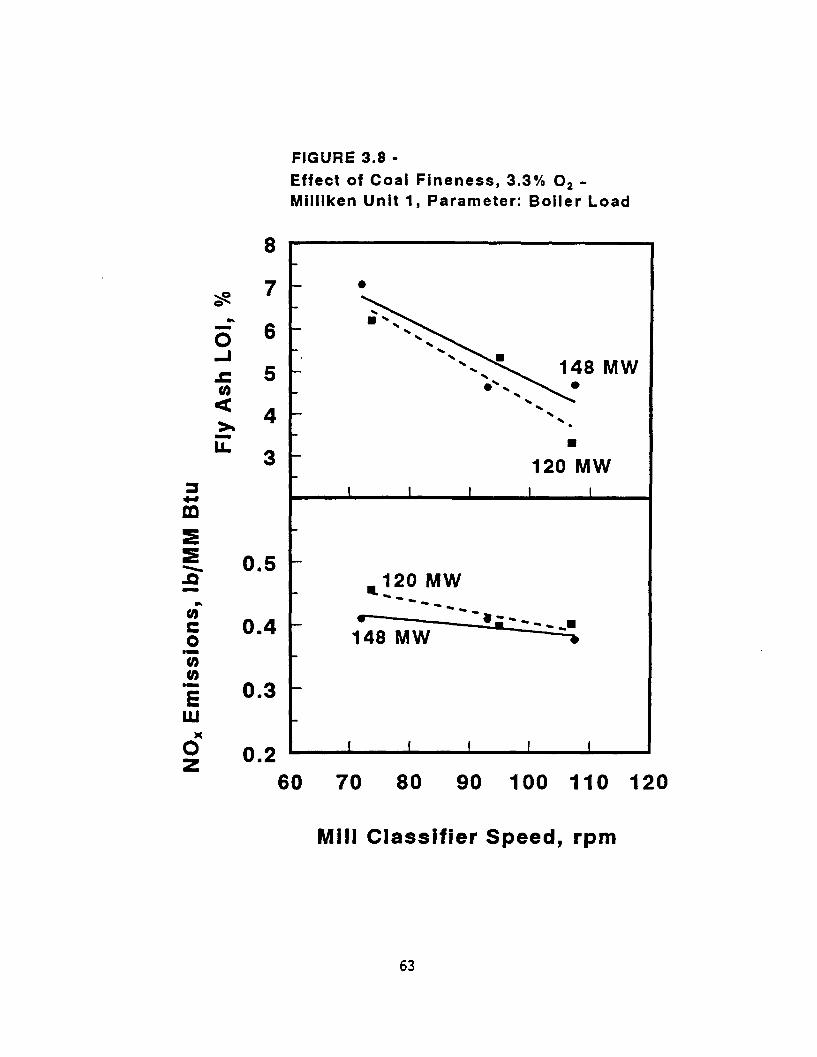
The results of Design C are presented again in Figures 3.8 and 3.9, showing variations in NO, emissions and LO1 with respect to mill classifier speed at fixed excess 0, (3.3% nominal) and two boiler loads (Figure 3.8), and at different excess 0, levels (3.0%, 3.4% and 4.5% nominal) at 120 MW (Figure 3.9). The trends seen in Figures 3.8 and 3.9 are consistent with the observations described earlier.
3.3.7 Variations of NO, Emissions and LO1
The post-retrofit test results were used to identify conditions that would reduce NO, emissions while maintaining acceptable unit performance, including salable fly ash, with emphasis on full boiler load (148 MW). Excess 0, was a significant parameter affecting both NO, emissions and LOI. This parameter is typically used to select a suitable trade-off between decreasing NO, emissions and increasing LO1 as excess air is reduced. However, the post-retrofit relationship between NO, emissions and LO1 was more complex than the pre-retrofit relationship where a simple inverse relationship was observed. This was attributed to greater sensitivity of post-retrofit NO, emissions and LO1 to process variables, including coal properties, coal fineness and burner tilt.
During the post-retrofit testing, the fly ash LO1 was generally above 4% at full boiler load. However, coal composition is an uncontrolled parameter that would greatly affect LOI. Specifically, an increase in ash and/or moisture contents
37
of the coal would decrease LOI, and might be a determining factor in maintaining fly ash LO1 below 4%. After the diagnostic tests were completed, the impacts of moisture and ash contents of the coal on flame ignition and LO1 were examined. Consequently, a coal with higher ash and higher moisture contents (relative to the coal burned during the post-retrofit tests) was specified, which produced acceptable LOI (below 4%) and acceptable flame ignition point
Increasing mill classifier speed and increasing burner tilt position below the horizontal (negative angles) reduced both NO, emissions and LOI.
Greater air staging reduced NO, emissions, with greater sensitivity to changes in SOFA rather than CCOFA. Greater air staging also increased LOI, but the effect was not statistically significant when the effects of other parameters, such as burner tilt, were accounted for.
3.3.8 Predictive Correlations for NO, Emissions and LO1
One set of correlations (one for NO, and another for LOI) was derived from Design A and another set was derived from Design C, as shown in Table 3.14. The correlations were combined to generate a single correlation for NO, emissions and another for LO1 by taking the correlation of Design C and adding the factors that were not accounted for from the correlation of Design A. As discussed earlier, typical air staging settings would not be used for long-term operation, and thus, air staging parameters (SOFA/CCOFA and SOFAtCCOFA) were not included in the final correlations. Thus, burner tilt was the only factor that was extracted from the correlation of Design A for both NO, emissions and LOI. The following correlations were obtained:
lb NOJMM Btu = 0.12 t 0.08*02 t O.O0003*(MW-120)* - O.O0093*(RPM-93) t G.O07*TILT
r*=84%
% LO1 = 8.1 - 1.08*02 t O.O32*(MW-120) - O.O62*(RPM-93) t O.l55*TILT r*=69%
where 02 is excess O2 measured at the economizer outlet, MW is net boiler load, TILT is burner tilt in degrees from the horizontal, and RPM is mill classifier speed.
Comparisons of measured and predicted NO, emissions and LO1 based on the two derived correlations are presented in Figures 3.10 and 3.11, respectively.
3.4 Conclusions
The Unit 1 post-retrofit diagnostic tests conducted during March of 1994 were analyzed to determine the effects of boiler load, excess O,, mill classifier speed, combustion air distribution (SOFA flow, CCOFA flow and coal air flow), burner settings (burner tilt, SOFA tilt and SOFA yaw), and mill load patterns on NO, emissions and LOI. The following conclusions were reached.
1. The average difference between replicated tests was 0.044 lb NOJMM Btu and 0.6% LOI. The uncertainty at 95% confidence was f 0.027 lb NOJMM Btu and +, 0.35% LOI. The reproducibility in NO, emissions had greater uncertainty for the post-retrofit tests than that for the
38
2.
3.
4.
5.
6.
7.
8.
9.
10.
11.
12.
baseline tests because of NO, sensitivity to a larger number of parameters in the low-NO, configuration. The uncertainty in measuring LO1 was about the same for the post-retrofit and the baseline tests.
Concentration measurements across the two ducts at the economizer outlet showed minor gas stratification.
NO, and NO measurements (in ppm) at the economizer outlet were indistinguishable. NO, concentrations, calculated as the difference between NO, and NO, were estimated at l-2 ppm.
CO was not a consideration in this study, because its concentration at the economizer outlet was always low, varying between 9 ppm and 23 ppm.
Increasing burner tilt below the horizontal position reduced NO, emissions by 0.007 lb/MM Btu per degree change and reduced LO1 by 0.16% per degree change.
Changes in SOFA tilt produced no significant changes in either NO, emissions or LOI. SOFA yaw changes (relative to the fuel firing angle) did not significantly change NO, emissions, and increased LOI. The effect on LO1 could not be determined with certainty because SOFA yaw changes were accompanied by changes in burner tilt, and the two effects could not be separated.
Greater air staging reduced NO, emissions, with greater sensitivity to changes in SOFA rather than CCOFA. Greater air staging also increased LOI, but the effect was not statistically significant when the effects of other parameters, such as burner tilt, were accounted for.
Taking the upper elevation burners out of service reduced both NO, emissions and LOI because of more effective air staging. The effect was greater on NO, emissions. The effect can be quantified if a mill bias parameter is used (see Section 3.3.5).
Higher excess 0, increased NO, emissions and reduced LO1 (see Item 13).
In general, higher boiler loads increased both NO, emissions and LO1 (see Item 13).
Higher mill classifier speeds (finer coal) reduced both NO, emissions and LOI, with a more dramatic effect on LO1 (see Item 13).
The post-retrofit relationship between NO, and LOI was more complex than the simple trade-off that was observed in baseline testing where NO, emissions decreased and LO1 increased as excess air was reduced. This was attributed to greater sensitivity of the low-NO,
39
configuration to process variables, including coal properties. Higher ash and/or moisture coal contents would reduce LOI, with a minor effect on NO, emissions.
13. The following predictive correlations for NO, emissions and LO1 were derived for normal operation of Unit 1:
lb NOJMM Btu = 0.12 t 0.08*02 t O.O0003*(MW-120)* - O.O0093*(RPM-93) t O.O07*TILT
r*=84%
% LO1 = 8.1 - 1.08*02 t O.O32*(MW-120) - O.O62*(RPM-93) t O.l55*TILT
r*=69%
where 02 is excess 0, measured at the economizer outlet, MW is net MW boiler load, TILT is burner tilt in degrees from the horizontal, and RPM is mill classifier speed.
14. During several short-term tests, NO, emissions were below 0.37 lb/MM Btu. However, fly ash LO1 at full boiler load was generally above 4% during the LNCFS-3 optimization test period. After the optimization test program was completed, a series of tests firing coals with higher ash and/or higher moisture contents than the coal burned during the optimization test period achieved less than 4% LOI. The current prac,tice is to operate with optimized LNCFS-3 burner settings and fire a nominal 13,000 Btu/lb (as fired) coal.
15. The short-term, post-retrofit LNCFS-3 test program indicated that NO, emissions could potentially be reduced to about 0.35 lb/MM Btu at full boiler load, while maintaining salable fly ash.
16. The low-NO, burner retrofit reduced NO, emissions from a baseline level of 0.64 lb/MM Btu to a post-retrofit level of 0.39 lb/MM Btu, corresponding to a reduction of about 39%, while maintaining LO1 below 4%. The NO, values were based on short-term test averages and will be verified during the 51-day long-term test. NYSEG believes LNCFS-3 burner retrofit is a cost-effective technology to comply with Title IV of the 1990 Clean Air Act Amendments. To date, burner operations are acceptable.
40
TABLE 3.1 - UNIT 1 POST-RETROFIT TESTS - PARAMETER SElTINGS
FIGURE 3.1 - Effect of Burner Tilt - Milliken Unit 1, Main and SOFA Tilts
- Main Tilt
-
I I I I 1
I
SOFA Tilt ---I)--- -4
Main Tilt
I I I I I
-15 -10 -5 0 15
Burner Tilt, Degrees
56
3 z E E 2 - r
E .- 2 .II) E
W
6 2
8
7
6
5
4
3
0.5
0.4
0.3
0.2
FIGURE 3.2 - Effect of SOFA Yaw - Milliken Unit 1, SOFA Yaw
I I I I I
.
& --4- -- ----+-em-
I I I I I
-15 -10 -5 5 10 15
SOFA Yaw, Degrees
57
8
7
6
5
4
3
0.5
0.4
0.3
0.2
FIGURE 3.3 - Effect of Air Distribution- Miiiiken #l: SOFA/CCOFA Split, Coal Air
SOFAjCCOFA : Ratio ..-, .
i
SOFA+CCOFA Coal Air
s” am l
:
i’
+....“’ 4
w . . . . .
-*..,* h + - * ** *. .+ . . . . “.m i
- SOFA/CCOFA SOFA+CCOFA Coal Air Ratio
Combustion Air Distribution
58
0 111
3 .I E
W
0” z
FIGURE 3.4 - Effect of Mill Pattern - B=(Al +B2/3-A3/3-B4),p,,/TOTAL,ph
8
7
6
5
4
3
0.5
0.4
0.3
0.2
:: m
120 MW
I I I I I
120 MW n
#cc- e---w4 -c
NH m -2. . .
. .
I I I I I
-0.3 -0.2 -0.1 0.0 0.1 0.2 0.3
Mill Pattern Bias Parameter, R
59
8
7
6
5
4
3
0.5
0.4
0.3
0.2
FIGURE 3.5 - Effect of Excess Air - Milliken Unit 1, Parameter: Boiler Load
148 MW
-. -
;I*0 2;;
I 1 I I I 90 MW
: .y /)
&- @ H
m
I I I I I
2 3
Economizer 0,, %
60
m z 0 .- ii .I ii
P
8
7
6
5
4
3
0.5
0.4
0.3
0.2
FIGURE 3.6 - Effect of Boiler Load - Milliken Unit 1, Parameter: %O,
3% 0, l
I l
o- 0. -0.-
8 -o-- o-
-o--
4% 0; 8
1 I I I I I I
4% 0, // .- o-
d
3% 0,
.
I I I I I I I
70 90 110 130 150
Boiler Load, MW
61
FIGURE 3.7 - Effect of Excess Air - Milliken Unit 1, Parameter: Mill rpm
120 MW 148 MW
s 7 - 72 vm - &.
5 6- - 93 . m =. . . rpm r
. -. 5- = -. .,
t . -.
). ii 4: -. 108 rpm 3 - m
A- I I I 1
72 rpm -
1:: ‘Q3 rpmd;L# ; 93rp/
0.3 - 108 rpm
0.2 I I I I I
2 3 4 8 3 4 5
Economizer 02, % Economiter 0,, %
62
FIGURE 3.8 - Effect of Coal Fineness, 3.3% 0, - Milliken Unit 1, Parameter: Boiler Load
8
7 - l
6 -
5 ,’
4 - . . . .
3 - 1201;nw I I I I I
0.5 - ,120 MW
---- --we 0.4 - l
148 MW
0.3 -
0.2 ’ I I I I I
60 70 80 90 100 110 120
Mill Classifier Speed, rpm
63
CI z 0 .- v)
.I z
W
6 z
8
7
6
5
4
3
0.5
0.4
0.3
0.2
FIGURE 3.9 - Effect of Coal Fineness, 120 MW - Miiiiken Unit 1, Parameter: 0,
- y+ .4.5% 0, . -5 -- -I ‘a ___-I n 3.4% 0,
+--,- ---a +---w-4
- 3.0% 0,
I I I I I
60 70 80 90 100 110 120
Mill Classifier Speed, rpm
64
FIGURE 3.10 - Predicted Vs. Measured NO, Emissions - Milliken Unit 1, 3-94 Post-Retrofit Test
0.6 0.6
0.5 0.5
0.4. 0.4.
0.3 0.3 0.3 0.3 0.4 0.4 0.5 0.5 0.6 0.6
Measured NO,, lb/MM Btu
FIGURE 3.11-Predicted Vs.Mtasured LOI -. Milliktn Unit 1, 3-94 Post-Retrofit Test
8 LOI- l t.11-1.08’%0,*0.032~(YW-120) LOI- l t.11-1.08’%0,*0.032~(YW-120) -o.062’(RPM-93)+0.155~1ilt -o.062’(RPM-93)+0.155~1ilt
2 3 4 5 6 7 a
Measured LOI, %
65
SECTION FOUR LNCFS-3 SYSTEM START-UP, INSTALLATION COSTS AND FUEL DUCT BALANCING TESTS
4.1 LNCFS-3 System Start-Up
The post-retrofit design fuel pipe velocity based on coal specifications supplied by NYSEG was 75-85 ft/s, compared to a pre-retrofit velocity of about 100 ft/s. The post-retrofit fuel pipe velocity range achieved satisfactory transport of the coal without particle fallout in the fuel pipe, while maintaining the desired primary air-to-fuel ratio.
After the burner system was placed in operation, flame attachment to the burner coal bucket was observed. To reduce the problem, the coal nozzle diameter was reduced to increase the fuel velocity and move the ignition point away from the coal bucket. This action did not correct the problem due to turbulence within the coal bucket. The design of the coal bucket was changed to eliminate the turbulence. The combination of the higher fuel velocity and redesigned coal bucket permitted burner operation with the ignition point between two to four feet from the face of the coal bucket.
4.2 LNCFS-3 Installation Costs
The economic impacts of a low-NO, burner retrofit consist of the capital costs for the burner installation, changes in annual operating and maintenance costs, and lost generation charges. In the interim report, only the capital costs will be reported. After one year of operation, the annual operating and maintenance costs will be estimated.
4.2.1 Cauital Costs
The capital costs are shown by category for Milliken Unit 1 in Table 4.1. The installation cost includes the replacement of four wind boxes, the installation of four new SOFA ports and SOFA ducts, field piping modifications, and wiring of the damper drives. The total capital cost is about $4.0 million or $26.56/kW. The expected range for LNCFS-3 capital costs is S15-25/kW.
Wind box and duct work installation required asbestos removal. The wind boxes were rigged and installed from outside the boiler, requiring only temporary removal of some structural steel. The turbine overhaul was completed during the scheduled retrofit outage. During the outage, the following subsystems were replaced: burners, coal mills, ESP upgrades, and a new electronic control system. An LNCFS-3 retrofit should require about an eight week outage.
66
TABLE 4.1 - UILLIKEN UNIT 1 RETROFIT COSTS
Category cost
Material Supply 61,744,659 Installation Labor $1,364,027 ABB CE Engineering 5729,000* NYSEG Engineering $146,800 Total $3,984,364 Cost Per kW $26.56/kW l
The Unit 1 ABB CE Engineering costs are for Unit 1. The Unit 2 ABB CE Engineering costs are zero because identical burners are installed in Units 1 and 2.
4.3 Unit 2 Baseline Pulverized Coal Balancing Tests
The SMG 10 probe was used to determine the fuel and air split among the four burner elevations and among the four corners of the fire box. The mill balance tests were conducted at 140 MW and 115 MW boiler loads, corresponding to Unit 2 baseline diagnostic Tests 2 and 14, respectively.
4.3.1 Full Boiler Load Test - Four Mills in Service
The mill balance measurements at 140 MW boiler load with four mills in service were performed during Unit 2 baseline diagnostic Test 2. An evaluation of the coal flow distribution among the four elevations showed that the flow to each of the top three mills was within +1.5X of the average coal flow. The flow through the bottom mill was 15% higher than the average, corresponding to about 2.5 tons per hour higher coal flow than the other mills. Coal flows among the four corners were within 24.0% of the average coal flow. Comparing the coal flows through the 16 individual ducts showed that 15 flows were within ilO% of the average. The flow though duct 81 of the top mill was 15.4% below the mill average.
4.3.2 Intermediate Boiler Load Test - TOD Three Mills in Service
The mill balance measurements at 115 MW boiler load with the top three burner elevations in service were performed during Unit 2 baseline diagnostic Test 14. An evaluation of the coal flow distribution among the three elevations showed that the flows were within i3.6% of the average coal flow. Coal flows among the four corners were within k9.5% of the average coal flow. Comparing the coal flows through the 16 individual ducts again showed that the flow though duct Bl of the top mill was 13.2% below the mill average. The other flows were within &lo% of the average.
67
4.4 Unit 1 Post-Retrofit Pulverized Coal Balancing Tests
The SMG 10 probe was used to determine the fuel and air split among the four burner elevations and among the four corners of the fire box. The mill balance tests were conducted at 148 MW boiler load during Unit 1 post-retrofit diagnostic Test 1. Measurements at reduced boiler loads were not made due to problems with the test equipment. The air seal could not be properly made between the SMG 10 probe and the coal pipe. Consequently, the coal dust was sprayed over the boiler floor and testing was discontinued.
4.4.1 Full Boiler Load Test - Four Mills in Service
The mill balance measurements at full boiler load of 148 MW with four burner elevations in service were performed during Unit 1 post-retrofit diagnostic Test 1. The coal flows to the four mills were within &11.5X of the average coal flow. At each elevation, the coal flows to the four corners were within *9.0X of the average coal flow.
68
SECTION FIVE LONG-TERM, VALIDATION AND PERFORUANCE TESTING
5.1 Long-Term Testing
The purpose of the long-term test is to estimate the achievable annual NO, emissions and to determine NO, reductions due to the LNCFS-3 retrofit. The achievable annual emissions are estimated using CEM data collected over 51 days, which is a minimum time requirement to adequately describe the time dependence of the data. This was demonstrated in a statistical evaluation of long-term CEM data conducted by The Control Technology Committee of the Utility Air Regulatory Group (UARG).
The long-term tests were conducted on pre-retrofit Unit 2 (baseline) and post- retrofit (LNCFS-3) Unit 1 under operating conditions that maintained salable fly ash (LO1 less than 4%) and reliable boiler operation. The tests met the UARG minimum requirement of 51 days of CEM measurements. The long-term measurements for Unit 2 were collected for 71 days between March 22 and May 31, 1994. The fuel air damper position was 3 (an intermediate setting between minimum and maximum positions of 1 and 5, respectively) and the wind box tilt position was automatic, typically varying between t10' and t15'. The long-term measurements for Unit 1 were collected for 59 days between May 23 and July 20, 1994. The mill classifier speed varied between 104 and 106 rpm and the wind box tilt position was automatic, typically varying between -6' and t2'.
The long-term data were collected as 15-minute averages and were subsequently combined into hourly averages. The data were grouped by boiler load range in increments of 5 MW, and averaged for each group as shown in Table 5.1. The variations of both NO, emissions and economizer 0, with boiler load are shown in Figure 5.1. At the same boiler load, baseline and post-retrofit economizer 0, level were generally different. Consequently, direct comparison of baseline and post-retrofit NO, emissions (Table 5.1 and Figure 5.1) can be misleading. Further analysis of the data was necessary to estimate NO, reductions due to the LNCFS-3 retrofit as is further discussed.
The achievable annual NO, emissions were calculated based on 30-day rolling averages obtained from the long-term CEM data. A 30-day rolling average is obtained by averaging 30 continuous daily averages following the initial 30-day lapse and rolling the average from day to day. The daily averages were calculated from the hourly averages. The achievable annual NO, emissions for pre-retrofit (baseline) Unit 2 was 0.614 lb/MM Btu with an uncertainty of f 0.023 lb/MM Btu at 95% confidence. That corresponded to 134 MW boiler load and 3.11% 0, at the economizer outlet. The achievable annual NO, emissions for post- retrofit (LNCFS-3) Unit 1 was 0.390 lb/MM Btu with an uncertainty of + 0.003 lb/MM Btu at 95% confidence. That corresponded to 134 MW boiler load and 3.72% 0, at the economizer outlet. The LNCFS-3 burner system achieved 36% NO, reduction. However, direct comparison of baseline and post-retrofit NO, emissions can be misleading, since the corresponding economizer 0, levels were different. Further evaluation of the long-term data to calculate NO, reductions at the same economizer 0, levels is discussed in Section 5.3.1 evaluating the performance of the low-NO, burner retrofit.
69
5.2 Validation Test Programs
The validation test programs are limited tests of the diagnostic test conditions. The effects of the dominant parameters affecting NO, emissions and LO1 (based on the diagnostic test results) were re-evaluated. The validation tests were conducted following the completion of the long-term tests. The objective of these tests is to validate the previous results, to characterize any changes that might have occurred during the long-term tests, and to test the predictive correlations derived from the diagnostic tests.
5.2.1 Unit 2 Baseline Validation Test Proaram
The dominant parameters affecting NO, emissions and LO1 in the Unit 2 baseline diagnostic test program were excess 0, and boiler load. Five validation tests were conducted during May 22-23, 1994, during which the economizer 0, was varied between 2% and 4% and the boiler load was varied between 80 MW and 145 MW. The test results are presented in Table 5.2. The mill patterns used during the validation test program were the same as those used during the diagnostic test program (normal operation as listed in Table 2.1), with the exception of Validation Test 1 (80 MW boiler load). The test condition could not be maintained with two mills in service (as in the diagnostic 80 MW tests) and was conducted with three mills in service (mill 84 out of service).
Comparisons between measured and predicted NO, emissions and LO1 as a function of economizer 0, at 140 MW and as a function of boiler load at 4% economizer 0, for the baseline validation tests are presented in Figures 5.2 and 5.3, respectively. The predictions are based on the diagnostic test program correlations (Section 2.3.7). At 128-143 MW boiler load, there are good agreements between measured and predicted NO, emissions and LO1 at various economizer 0, levels (see Figure 5.2). The differences between measurements and predictions were less than 0.03 lb/MM Btu for NO, emissions and less than 0.3% (absolute) for LOI, which were within the experimental uncertainties of f 0.016 lb NOJMM Btu (0.032 lb/MM Btu difference) and f 0.30% LO1 (0.6% difference) at 95% confidence (Section 2.3.1). The differences between measurements and predictions increased with decreasing boiler load (see Figure 5.3). The poor prediction at 80 MW was partially due to the difficulty in repeating the diagnostic test program mill pattern with two mills (A3 and 84) out of service (see Table 2.1). The validation test at 80 MW was conducted with only one mill (B4) out of service.
5.2.2 Unit 1 LNCFS-3 Validation Test Proaram
The dominant parameters affecting NO, emissions and LO1 in the Unit 1 LNCFS-3 diagnostic test program were excess O,, mill classifier speed and boiler load. Eight validation tests were conducted during October 17-19, 1995, during which the economizer O2 was varied between 2.8% and 4.3%, the mill classifier speed was varied between 70 and 110 rpm, and the boiler load was varied between 90 MW and 150 MW. The test results are presented in Table 5.3.
There were several operations and LNCFS-3 control differences between the validation and the diagnostic test programs, including mill patterns, the control of CCOFA and SOFA air flows and the changes associated with reducing the boiler
70
load. During the validation test program, coal mill 82 mechanical problems limited its use. Consequently, only Tests 4, 5 and 6 were conducted with all four mills in service. The remaining tests were conducted with mill B2 out of service. Furthermore, during the validation test program, greater control of air staging (two CCOFA and three SOFA air flows) was possible (compared to the diagnostic test program). This operation achieved LO1 below 4% at full boiler load, which was not possible during the diagnostic test program. Specifically, the air staging ports were operated with the two CCOFA ports fully open and the upper two SOFA ports fully closed, thus limiting the air staging control to the lowest SOFA port to achieve the desired LOI. In addition, the control algorithm used during the diagnostic test program made it difficult to separate the effects of boiler load and air staging, since a drop in boiler load was accompanied by reductions in SOFA air flows. This association between changes in boiler load and air staging was significantly reduced during the validation test program. This was a consequence of the additional control of air staging which achieved LO1 below 4%.
Comparisons between measured and predicted NO, emissions and LO1 as a function of economizer 0, at full boiler load (145-150 MW), as a function of mill classifier speed at full boiler load, and as a function of boiler load are presented in Figures 5.4, 5.5 and 5.6, respectively. The predictions are based on the diagnostic test correlations (Section 3.3.8). At full boiler load, there were good agreements between measured and predicted NO, emissions at various economizer 0, levels and at various mill classifier speed settings (Figures 5.4 and 5.5, respectively). The differences between measured and predicted NO, emissions were less than 0.036 lb/MM Btu, which were within the experimental uncertainty of f 0.027 lb NOJMM Btu (0.054 lb/MM Btu difference) at 95% confidence (Section 3.3.2). However, measured LO1 values were 0.7%-1.7X (absolute) lower than predicted. These differences are attributed to the operation of the air staging ports (CCOFA ports fully open and using only the lowest SOFA port) during the validation test program which corresponded to longer furnace residence times (compared to the diagnostic test program). Longer coal particle residence times under the high temperatures in the furnace enhance carbon burnout and reduce LOI.
The discrepancy between measured and predicted LO1 as a function of economizer 0, levels (Figure 5.4) was attributed to the operation of the staging ports (as discussed earlier) and to the different mill patterns used (compared to the diagnostic test program). The predictions were based on the diagnostic test results in which all four mills were in service, whereas the validation tests were conducted with three mills in service (82 out of service).
At reduced boiler loads (120 MW and 90 MW), measured NO, emissions were lower than predicted and measured LO1 values were higher than predicted (see Figure 5.6). The predictions are based on the diagnostic test correlations (Section 3.3.8), and the measured values are the validation test results. The discrepancy between measurements and predictions were attributed to the effects associated with boiler load changes, which differed between the diagnostic and the validation test programs. Specifically, during the diagnostic test program, a drop in boiler load was accompanied by lower SOFA air flows. The reduction in air staging with lower SOFA air flows would favor higher NO, emissions and lower LOI, whereas the reduction in boiler load might have the opposite effect on NO,
71
and LO1 because of lower furnace temperatures. This association between changes in boiler load and air staging was significantly reduced during the validation tests so that mainly the effect of boiler load was observed.
5.3 LNCFS-3 Performance Evaluation
The LNCFS-3 performance evaluation included the NO, control effectiveness and the impact of the LNCFS-3 system on the boiler efficiency. The LNCFS-3 system did not increase fly ash LO1 and did not increase CO emissions. For both baseline and the LNCFS-3 system, LO1 values were less than 4% and measured CO concentrations were less than 25 ppm.
5.3.1 NO, Control
The NO, reduction capability of the LNCFS-3 system was evaluated during the short-term diagnostic test programs (2-4 hours each) and the long-term test program (60-70 days). In both cases, Unit 2 baseline and Unit 1 LNCFS-3 test results were compared.
The variations of NO, emissions and LO1 with economizer 0, for Unit 2 baseline and Unit 1 LNCFS-3 diagnostic tests at full boiler load (140-150 MW) are presented in Figure 5.7. The LNCFS-3 test results include tests where the overfire air (SOFA and CCOFA) flows and mill classifier speeds were similar. At the same economizer O2 level, the scatter of the data was partly due to experimental variation and partly due to the variation of other parameters, such as burner tilt. During the diagnostic test programs, the LNCFS-3 system lowered NO, emissions O-15-0.22 lb/MM Btu and increased LO1 2.4%-3.2% (absolute). A simple inverse relationship was observed between baseline NO, emissions and LOI, which could be approximated by a linear function (Section 2.3.6). The post-retrofit relationship between NO, emissions and LO1 was more complex because of greater sensitivity to operating parameters (Section 3.3.7). An example is the burner tilt which had a significant effect on NO, emissions and a minor effect on LO1 during baseline testing, and significant effects on both NO, emissions and LO1 during LNCFS-3 testing. Increasing the LNCFS-3 burner tilts below the horizontal (negative tilt) was effective in reducing both NO, emissions and LOI, but also had an impact on the main steam temperature. It should be emphasized that during the LNCFS-3 diagnostic test program, LO1 was generally above 4% at full boiler load and better control of the air staging (CCOFA and SOFA air flows) was necessary to lower the LO1 below 4%. Consequently, the effectiveness of the LNCFS-3 burner retrofit was evaluated using the long-term data.
The long-term test program (60-70 days) was used to evaluate the effectiveness of the LNCFS-3 system in reducing NO, emissions. The long-term hourly averaged Unit 2 baseline and Unit 1 LNCFS-3 data at full boiler load (145-150 MW) were grouped by economizer 0, range and averaged for each group as shown in Table 5.4. The long-term NO, emissions data at full boiler load as a function of economizer 0, are shown in Figure 5.8. At low boiler load (80-90 MW), the long-term data were treated in a similar fashion, but only one economizer 0, range (4.3%-5.0%) was included because of the relatively small number of data (less than 50). At full boiler load (145-150 MW) and at 3.0%-3.5% economizer 02, the LNCFS-3 system lowered NO, emissions from a baseline 0.64 lb/MM Btu to 0.39 lb/MM Btu,
72
corresponding to 39% reduction. At 80-90 MW boiler load and at 4.3%-5.0% economizer 02, the LNCFS-3 system lowered NO, emissions from a baseline of 0.58 lb/MM Btu to 0.41 lb/MM Btu, corresponding to 29% reduction. The effectiveness of the LNCFS-3 system was lower at reduced boiler load.
In summary, following the LNCFS-3 burner retrofit, NO, emissions below 0.4 lb/MM Btu could be achieved, while maintaining marketable fly ash (LO1 less than 4%). To date, burner operations are acceptable.
5.3.2 Boiler Efficiency
The impact of the low-NO, burner retrofit on boiler efficiency was estimated at full boiler load (140-150 MW). Three baseline boiler performance tests were conducted on Unit 2 between April 18 and 20, 1994. After installing the LNCFS-3 system, two boiler performance tests were conducted on Unit 1 on October 21, 1995. The test data and the boiler efficiency results (calculations based on ASME Abbreviated Efficiency Test) are presented in Table 5.5. The baseline boiler efficiency was between 89.3% and 89.6%. The LNCFS-3 boiler efficiency was between 88.3% and 88.5%. The reduction in LNCFS-3 boiler efficiency relative to baseline was attributed to higher post-retrofit flue gas 0, levels and higher stack temperatures relative to baseline. Unit 1 air heater was retrofitted with new air heater baskets and seals. The cause of the elevated air heater flue gas exit temperatures is under investigation. The LNCFS-3 stack temperatures were 21-31 'F higher than baseline, which resulted in 0.8% (absolute) lower boiler efficiency. Furthermore, the LNCFS-3 system corresponded to higher excess O2 levels than baseline, which resulted in 0.4% (absolute) lower boiler efficiency. Consequently, if the flue gas exit temperatures and the flue gas 0, concentrations were the same for the LNCFS-3 system and the baseline, LNCFS-3 boiler efficiency 0.2% (absolute) higher than baseline would be expected.
73
TABLE 5.1 - LONG-TERM No, EMISSIONS
Load Range No. Hourly Load 02 NOx o* NOx MW Averaqes MW x lb/MM Btu lb/MM Btu
I I I I I I I Unit 2 ...................................................... .m?eiine *0-* ...... .............. ~.~.~.~.~.~.~.~.~ 6.. ...... \ 0-w 0--* -0 *c.ll-