+ All Categories
Home > Documents > Millisecond-scale motor encoding in a cortical vocal area · Millisecond-scale motor encoding in a...

Millisecond-scale motor encoding in a cortical vocal area · Millisecond-scale motor encoding in a...

Date post: 29-Jul-2018
Category:
Upload: duongngoc
View: 229 times
Download: 0 times
Share this document with a friend
31
1 Millisecond-scale motor encoding in a cortical vocal area Claire Tang 1,2 , Diala Chehayeb 2 , Kyle Srivastava 3 , Ilya Nemenman 2,4 , and Samuel Sober 2 1 Neuroscience Graduate Program, University of California, San Francisco, San Francisco, CA 94158, USA 2 Department of Biology, Emory University, Atlanta, GA 30322, USA 3 Department of Biomedical Engineering, Georgia Institute of Technology, Atlanta, GA 30332, USA 4 Department of Physics, Emory University, Atlanta, GA 30322, USA Abstract: Studies of motor control have almost universally examined firing rates to investigate how the brain shapes behavior. In principle, however, neurons could encode information through the precise temporal patterning of their spike trains as well as (or instead of) through their firing rates. Although the importance of spike timing has been demonstrated in sensory systems, it is largely unknown whether timing differences in motor areas could affect behavior. We tested the hypothesis that significant information about trialbytrial variations in behavior is represented by spike timing in the songbird vocal motor system. We found that premotor neurons convey information via spike timing far more often than via spike rate and that the amount of information conveyed at the millisecond timescale greatly exceeds the information available from spike counts. These results demonstrate that information can be represented by spike timing in motor circuits and suggest that timing variations evoke differences in behavior. Introduction: The relationship between patterns of neural activity and the behaviorally relevant parameters they encode is a fundamental problem in neuroscience. Broadly speaking, a neuron might encode information in its spike rate (the total number of action potentials produced) or in the fine temporal pattern of its spikes. In sensory systems as diverse as vision, audition, somatosensation, and taste, prior work has demonstrated that information about stimuli can be encoded by fine temporal patterns, in some cases where no information can be detected in a rate code 111 . This information present in fine temporal
Transcript

  1  

Millisecond-scale motor encoding in a cortical vocal area Claire  Tang1,2,  Diala  Chehayeb2,  Kyle  Srivastava3,  Ilya  Nemenman2,4,  and  Samuel  Sober2  

1Neuroscience  Graduate  Program,  University  of  California,  San  Francisco,  San  Francisco,  CA  94158,  USA    2Department  of  Biology,  Emory  University,  Atlanta,  GA  30322,  USA  

3Department  of  Biomedical  Engineering,  Georgia  Institute  of  Technology,  Atlanta,  GA  30332,  USA  4Department  of  Physics,  Emory  University,  Atlanta,  GA  30322,  USA  

 Abstract:  

Studies  of  motor  control  have  almost  universally  examined  firing  rates  to  investigate  how  the  brain  

shapes  behavior.    In  principle,  however,  neurons  could  encode  information  through  the  precise  temporal  

patterning  of  their  spike  trains  as  well  as  (or  instead  of)  through  their  firing  rates.    Although  the  

importance  of  spike  timing  has  been  demonstrated  in  sensory  systems,  it  is  largely  unknown  whether  

timing  differences  in  motor  areas  could  affect  behavior.    We  tested  the  hypothesis  that  significant  

information  about  trial-­‐by-­‐trial  variations  in  behavior  is  represented  by  spike  timing  in  the  songbird  

vocal  motor  system.    We  found  that  premotor  neurons  convey  information  via  spike  timing  far  more  

often  than  via  spike  rate  and  that  the  amount  of  information  conveyed  at  the  millisecond  timescale  

greatly  exceeds  the  information  available  from  spike  counts.  These  results  demonstrate  that  information  

can  be  represented  by  spike  timing  in  motor  circuits  and  suggest  that  timing  variations  evoke  differences  

in  behavior.  


Introduction:    

The  relationship  between  patterns  of  neural  activity  and  the  behaviorally  relevant  parameters  they  

encode  is  a  fundamental  problem  in  neuroscience.    Broadly  speaking,  a  neuron  might  encode  information  

in  its  spike  rate  (the  total  number  of  action  potentials  produced)  or  in  the  fine  temporal  pattern  of  its  

spikes.    In  sensory  systems  as  diverse  as  vision,  audition,  somatosensation,  and  taste,  prior  work  has  

demonstrated  that  information  about  stimuli  can  be  encoded  by  fine  temporal  patterns,  in  some  cases  

where  no  information  can  be  detected  in  a  rate  code  1-­‐11.  This  information  present  in  fine  temporal  

  2  

patterns  might  be  decoded  by  downstream  areas  to  produce  meaningful  differences  in  perception  or  

behavior.      

  However,  in  contrast  to  the  extensive  work  on  temporal  coding  in  sensory  systems,  the  timescale  

of  encoding  in  forebrain  motor  networks  has  not  been  explored.  It  is  therefore  unknown  whether  the  

precise  temporal  encoding  observed  in  sensory  systems  is  propagated  to  cortical  motor  circuits  or  

whether  millisecond-­‐scale  spike  timing  differences  in  motor  networks  could  result  in  differences  in  

behavior.    Although  many  studies  have  shown  that  firing  rates  can  predict  variations  in  motor  output  12-­‐

14,  to  our  knowledge  no  studies  have  examined  whether  different  spiking  patterns  in  cortical  neurons  

evoke  different  behavioral  outputs  even  if  the  firing  rate  remains  the  same.  

  The  songbird  provides  an  excellent  model  system  for  testing  the  hypothesis  that  fine  temporal  

patterns  in  cortical  motor  systems  can  encode  behavioral  output.    Song  acoustics  are  modulated  on  a  

broad  range  of  time  scales,  including  fast  modulations  on  the  order  of  10  msec  15,16.    Vocal  patterns  are  

organized  by  premotor  neurons  in  vocal  motor  cortex  (the  robust  nucleus  of  the  arcopallium,  or  RA;  Fig.  

1a),  which  directly  synapse  with  motor  neurons  innervating  the  vocal  muscles14,15,17.    Bursts  of  action  

potentials  in  RA  (Fig.  1b)  are  precisely  locked  in  time  to  production  of  vocal  gestures  (“song  syllables”),  

suggesting  that  the  timing  of  bursts  is  tightly  controlled  18.    Similarly,  the  ensemble  activity  of  populations  

of  RA  neurons  can  be  used  to  estimate  the  time  during  song  with  approximately  10  msec  uncertainty  15.    

However,  although  these  prior  studies  demonstrate  that  the  timing  of  bursts  is  tightly  aligned  to  the  

timing  of  song  syllables,  it  is  unknown  how  the  temporal  patterns  of  spikes  within  bursts  might  encode  

the  trial-­‐by-­‐trial  modulations  in  syllable  acoustics  known  to  underlie  vocal  plasticity  19.  Significantly,  

biomechanical  studies  have  shown  that  vocal  muscles  in  birds  initiate  and  complete  their  force  

production  within  a  few  milliseconds  of  activation  (far  faster  than  those  seen  in  most  mammalian  skeletal  

muscles),  suggesting  that  RA’s  downstream  targets  can  transduce  fine  temporal  spike  patterns  into  

meaningful  differences  in  behavior  20,21.  However,  while  it  is  clear  that  trial-­‐by-­‐trial  variation  in  spike  

  3  

counts  can  predict  variations  in  the  acoustics  of  individual  song  syllables  14,22,  it  is  unknown  whether  the  

precise  timing  of  spikes  within  bursts  might  be  even  better  predictors  of  vocal  motor  output  than  spike  

counts.  

To  quantify  the  temporal  scale  of  

encoding  in  the  vocal  motor  

system,  we  adapted  well-­‐

established  mathematical  tools  

that  have  previously  been  applied  

to  measure  information  transfer  in  

sensory  systems.    First,  we  used  a  

spike  train  distance  metric  to  

quantify  the  differences  between  

pairs  of  spike  trains  produced  

during  different  renditions  of  

individual  song  syllables  and  a  

classification  scheme  to  quantify  

whether  distance  metrics  based  on  

rate  or  timing  yielded  the  best  

prediction  of  acoustic  output  23,24.    

(c)

(d)

0

0

5

0

Pitch

(z-score)

Amplitude

(z-score)

Sp

ectr

al E

ntr

op

y

(z-s

co

re)

(b) 10

40 ms

5

0

120

Pitch (kHz)

Group 1

Group 2

RA

vocal

muscles

Motor

pathway

AFP

Brainstem

motor nuclei

(a)

(e)

Fre

q (

kH

z)

Group 1

Group 2

Group 1

Group 3

Group 4

Group 5

Group 2

2

-6

-5

4

-4

5.5 7.5

Nu

mb

er

of

tria

ls

Premotor Spike trains Behavior

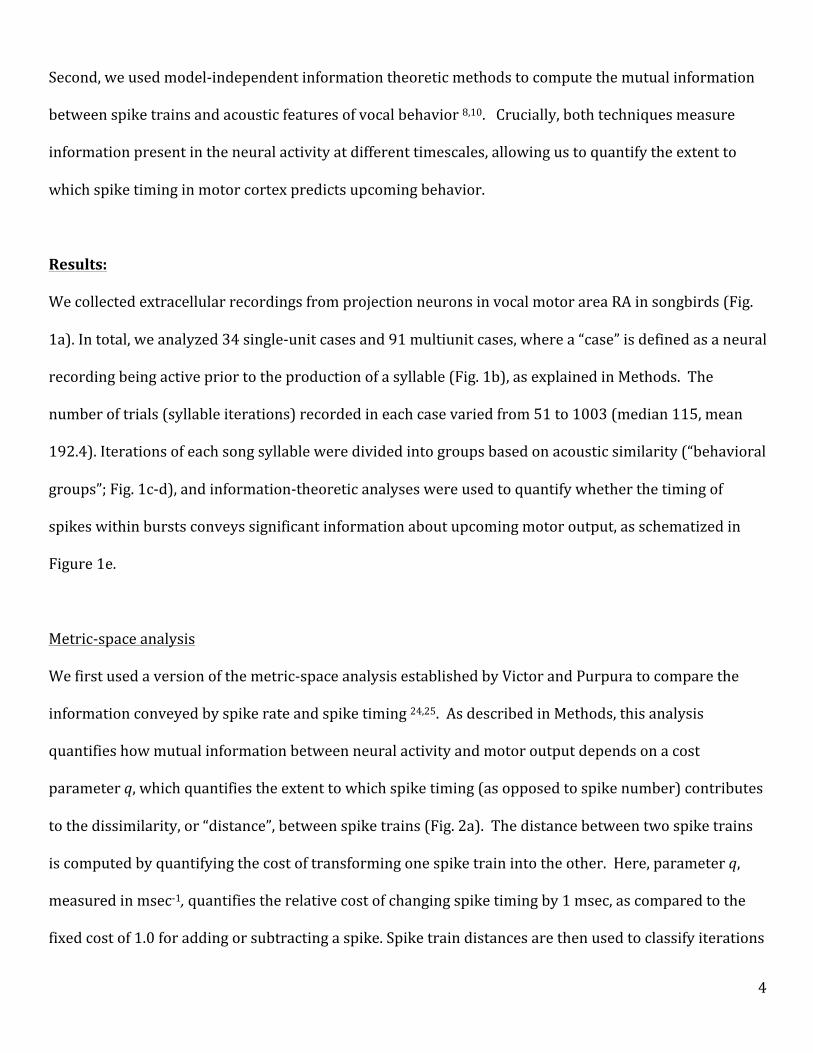
Figure  1.    Neural  data  and  spike  train  analysis.  a,  The  song  system  consists  of  two  pathways,  the  direct  motor  pathway  and  the  anterior  forebrain  pathway  (AFP).  Neurons  in  premotor  nucleus  RA  project  to  brainstem  motor  neurons  that  innervate  the  vocal  muscles.      b,  Spike  trains  recorded   from  a  single  RA  neuron.  Spectrogram  of  a  single  song   syllable  at   top  shows  the  acoustic  power  (color  scale)   at  different  frequencies  as  a  function  of  time.    Each  tick  mark  (bottom)  represents  one  spike  and  each  row  represents  one  iteration  of  the  syllable.    We  analyzed  spikes  produced  in  a  40  msec  premotor  window  (red  box)  prior  to  the  time  when  acoustic  features  were  measured  (red  arrow).    c,  Syllable   iterations  divided   into   categories   (“behavioral   groups”)   based  on   a   single   acoustic   parameter.   Here,   iterations   of   a   song   syllable  were  divided  into  two  groups  (N=2;  see  Methods)  based  on  fundamental  frequency  (“pitch”).  d,    Syllable  iterations  divided  into  N=5  groups  by   k-­‐means   clustering   in   a   three-­‐dimensional   acoustic   parameter   space     e,   We   asked   whether   spike   trains   could   be   used   to   predict  differences  in  behavior.    Specifically,  our  analysis  quantifies  the  extent  to  which  differences  in  spike  timing  can  discriminate  the  behavioral  group   from  which   the   trial   was   drawn.     This   is   shown   in   the   schematic,   in  which  differences   in   spike   timing   contain   information   about  behavioral  group  even  if  spike  counts  (four  spikes  in  this  example)  are  identical  across  trials.    

  4  

Second,  we  used  model-­‐independent  information  theoretic  methods  to  compute  the  mutual  information  

between  spike  trains  and  acoustic  features  of  vocal  behavior  8,10.      Crucially,  both  techniques  measure  

information  present  in  the  neural  activity  at  different  timescales,  allowing  us  to  quantify  the  extent  to  

which  spike  timing  in  motor  cortex  predicts  upcoming  behavior.    


Results:  

We  collected  extracellular  recordings  from  projection  neurons  in  vocal  motor  area  RA  in  songbirds  (Fig.  

1a).  In  total,  we  analyzed  34  single-­‐unit  cases  and  91  multiunit  cases,  where  a  “case”  is  defined  as  a  neural  

recording  being  active  prior  to  the  production  of  a  syllable  (Fig.  1b),  as  explained  in  Methods.    The  

number  of  trials  (syllable  iterations)  recorded  in  each  case  varied  from  51  to  1003  (median  115,  mean  

192.4).  Iterations  of  each  song  syllable  were  divided  into  groups  based  on  acoustic  similarity  (“behavioral  

groups”;  Fig.  1c-­‐d),  and  information-­‐theoretic  analyses  were  used  to  quantify  whether  the  timing  of  

spikes  within  bursts  conveys  significant  information  about  upcoming  motor  output,  as  schematized  in  

Figure  1e.    


Metric-­‐space  analysis    

We  first  used  a  version  of  the  metric-­‐space  analysis  established  by  Victor  and  Purpura  to  compare  the  

information  conveyed  by  spike  rate  and  spike  timing  24,25.    As  described  in  Methods,  this  analysis  

quantifies  how  mutual  information  between  neural  activity  and  motor  output  depends  on  a  cost  

parameter  q,  which  quantifies  the  extent  to  which  spike  timing  (as  opposed  to  spike  number)  contributes  

to  the  dissimilarity,  or  “distance”,  between  spike  trains  (Fig.  2a).    The  distance  between  two  spike  trains  

is  computed  by  quantifying  the  cost  of  transforming  one  spike  train  into  the  other.    Here,  parameter  q,  

measured  in  msec-­‐1,  quantifies  the  relative  cost  of  changing  spike  timing  by  1  msec,  as  compared  to  the  

fixed  cost  of  1.0  for  adding  or  subtracting  a  spike.  Spike  train  distances  are  then  used  to  classify  iterations  

  5  

of  each  song  syllable  into  behavioral  groups,  and  the  performance  of  the  classifier  𝐼 𝐺! ,𝐺  is  used  to  

quantify  the  mutual  information  between  neural  activity  and  vocal  output.    Figure  2b  shows  a  

representative  “rate  case”,  where  𝑞!"#=0  (that  is,  information  is  maximized  at  𝑞 = 0,  where  spike  train  

distances  are  computed  based  solely  on  spike  counts).    As  q  

increases,  the  performance  of  the  classifier  decreases  from  its  

maximal  value.    This  means  that  the  best  discrimination  between  

behavioral  groups  (Fig.  1c-­‐d)  occurs  when  only  spike  counts  are  

used  in  calculating  the  distances  between  pairs  of  spike  trains.    In  

contrast,  Figure  2c  illustrates  a  “temporal  case”.  In  temporal  cases,  

mutual  information  between  neural  activity  and  vocal  motor  output  

reaches  its  peak  when  𝑞 > 0.  This  indicates  that  there  is  better  

discrimination  when  spike  timings  are  taken  into  consideration.    

Note  that  in  the  case  shown  in  Figure  2c,  the  rate  code  does  not  

provide  significant  information  about  behavioral  output  (empty  

symbol  at  q=0).    

  Across  all  analyses  in  cases  where  information  was  

Figure  2.          Metric-­space  analysis  reveals  temporal  coding  in  the  vocal  motor  system.      a,  The  distance  between  example  spike   trains  “A”  and  “B”   is   the  sum  of  the   fixed  costs  of  adding  and  subtracting  spikes  (green  circle  and  “X”,  respectively)  and  the  cost  of  changing  spike   timing   (green  arrows),  which   is  parameterized  by   the  constant  q   (see  Methods).  b,  Representative  rate  case.    Information  I(GP,G)  about  upcoming  vocal  behavior  is  maximized  when   q  =   0,   indicating   a   rate   code.   Filled   circles,   information   significantly   greater   than  zero;   empty   circles,   nonsignificant   values.   In   this   case,   acoustically   similar   syllable  renditions   (“behavioral   groups”)   were   grouped   by   spectral   entropy.   c,   Representative  temporal   case.   Here   information   is   maximized   when  𝑞 > 0,   indicating   a   temporal   code.  Note   that   there   is   no   information   in   the   spike   count   (unfilled   circle   at   q   =   0).   In   this  example,   syllables   were   grouped   by   pitch.     Right-­‐hand   vertical   axes   in   b   and   c   shows  information  values  converted  into  d’  units  (note  nonlinear  scale).  d,  Prevalence  of  rate  and  temporal   cases.     For   each   acoustic   grouping,   the   proportion   of   temporal   cases   is  significantly   greater   than   the   proportion   of   rate   cases   (asterisks,   p<10-­‐8,   z-­‐tests   for  proportions).    Proportions  of  rate  and  temporal  cases  do  not  differ  significantly  across  the  four  behavioral  groupings.  Furthermore,   the  proportion  of   temporal  cases   is  significantly  greater   than   that   expected   by   chance   for   3D   acoustics   (cross,   p<0.05,   Poisson   test  with  Bonferroni  correction).   In  all  analyses  shown,   the  maximum  possible   information   is  1  bit  (N=2   behavioral   groups;   see   Methods),   which   corresponds   to   perfect   discrimination  between  groups.        

  6  

significant  at  any  value  of  q,  including  cases  where  𝑞!"# = 0,  the  median  value  of  𝑞!"#  was  0.3,  

suggesting  a  high  prevalence  of  temporal  cases.    Figure  2d  shows  the  prevalence  of  rate  cases  and  

temporal  cases  in  our  dataset.    As  described  in  Methods,  we  assigned  the  iterations  of  each  song  syllable  

to  behavioral  groups  based  either  on  a  single  acoustic  parameter  (e.g.  pitch,  Fig.  1c)  or  using  

multidimensional  clustering  (“3D  acoustics”,  Fig.  1d).    The  different  grouping  techniques  yielded  similar  

results.    When  syllable  acoustics  were  grouped  by  clustering  in  a  three-­‐dimensional  parameter  space  

(Fig.  2d,  blue  bars)  the  fraction  of  temporal  cases  was  significantly  greater  than  the  fraction  of  rate  cases  

(blue  asterisk;  p<10-­‐8,  z-­‐test  for  proportions).    Similarly,  temporal  cases  significantly  outnumbered  rate  

cases  when  acoustics  were  grouped  using  only  a  single  parameter  (pitch,  amplitude,  or  spectral  entropy,  

shown  by  green,  yellow,  and  red  asterisks  respectively;  p<10-­‐8).  Note  that  in  some  cases  these  analyses  

did  not  yield  a  significant  value  of  𝐼 𝐺! ,𝐺; 𝑞  for  any  value  of  q  and  thus  were  neither  rate  nor  temporal  

cases;  therefore  the  fractions  in  Figure  2d  do  not  sum  to  unity.      Additionally,  we  asked  whether  the  

proportions  of  temporal  cases  shown  in  Figure  2d  were  significantly  greater  than  chance  by  randomizing  

the  spike  times  in  each  trial  (“Poisson  test”;  Methods).    This  analysis  revealed  a  significant  proportion  of  

temporal  cases  when  vocal  acoustics  were  measured  by  multidimensional  clustering  (“3D  acoustics”,  

p<0.05  after  Bonferroni  correction  for  multiple  comparisons  indicated  by  cross  in  Fig.  2d)  but  the  same  

measure  fell  short  of  significance  when  the  three  acoustic  parameters  were  considered  individually  

(p=0.06-­‐0.24  after  Bonferroni  correction).    

  To  measure  the  maximum  information  available  from  the  metric-­‐space  analysis,  we  computed  

𝐼!"# ,  the  average  peak  information  available  across  all  cases  (see  Methods).  Across  all  metric-­‐space  

analyses,  𝐼!"#  was  0.10  bits  out  of  a  possible  1.0  bit.    As  discussed  below,  this  value  suggests  that  

additional  information  might  be  available  in  higher-­‐level  spike  train  features  that  cannot  be  captured  by  

metric-­‐space  analyses.    Additionally,  since  the  proportion  of  rate  and  temporal  cases  did  not  differ  

significantly  when  computed  from  single-­‐  or  multiunit  data  (p>0.07  in  all  cases;  z-­‐tests  for  proportions),  

  7  

we  combined  data  from  both  types  of  recording  in  this  as  well  as  subsequent  analyses.    The  similarity  

between  the  single-­‐  and  multiunit  datasets  likely  results  from  multiunit  recordings  in  this  paradigm  only  

reflecting  the  activity  of  a  single  or  a  very  small  number  of  neurons,  as  discussed  previously  14.    Finally,  

the  results  of  the  metric-­‐space  analysis  were  not  sensitive  to  the  number  of  behavioral  groups  used  to  

classify  the  iterations  of  each  song  syllable.    Although  our  primary  analysis  uses  2  behavioral  groups  (Fig.  

1c,  Fig.  2),  as  shown  in  Table  1  (Supplementary  Information)  we  found  a  similar  prevalence  of  rate  and  

temporal  cases  when  the  trials  were  divided  into  three,  five  (Fig.  1d),  or  eight  groups.      

  Our  metric-­‐space  analysis  therefore  indicates  that  in  most  RA  neurons,  taking  the  fine  temporal  

structure  of  spike  trains  into  account  provides  better  predictions  of  trial-­‐by-­‐trial  variations  in  behavior  

than  an  analysis  of  spike  rate  alone  (asterisks,  Fig.  2d).    Furthermore,  at  least  when  vocal  outputs  are  

grouped  in  three-­‐dimensional  acoustic  space,  spike  timing  can  predict  vocal  acoustics  significantly  more  

frequently  than  would  be  expected  from  chance  (cross,  Fig.  2d).  Although  the  latter  result  demonstrates  

that  spike  timing  can  carry  significant  information  about  vocal  acoustics,  it  remains  unclear  whether  

spike  timing  can  provide  information  about  single  acoustic  parameters  (beyond  the  3D  features).    

Answering  this  necessitates  the  direct  method  of  calculating  information,  as  described  below.  


Direct  method  of  calculating  information.    

In  the  metric-­‐space  analysis,  not  all  cases  were  classified  as  temporal.  Further,  when  behavior  was  

grouped  by  a  single  acoustic  parameter  rather  than  in  multidimensional  acoustic  space,  the  number  of  

temporal  cases  was  not  significantly  larger  than  by  chance  (Fig  2d,  green,  yellow,  and  red  plots).  Thus  it  

still  remains  unclear  to  what  extent  spike  timing  is  important  to  this  system  overall,  rather  than  in  

particular  instances.    Additionally,  a  drawback  of  metric-­‐space  analyses  is  that  they  assume  that  a  

particular  model  (metric)  of  neural  activity  is  the  correct  description  of  neural  encoding.    As  discussed  

more  fully  in  Methods,  metric-­‐space  approaches  therefore  provide  only  a  lower  bound  on  mutual  

  8  

information  23,25.  Put  another  way,  metric-­‐space  analyses  assume  that  the  differences  between  spike  

trains  can  be  fully  represented  by  a  particular  set  of  parameters,  which  in  our  case  include  the  temporal  

separation  between  nearest-­‐neighbor  spike  times  (Fig.  2a).    However,  if  information  is  contained  in  

higher  order  aspects  of  the  spike  trains  that  cannot  be  captured  by  these  parameters  (e.  g.  patterns  that  

extend  over  multiple  spikes),  then  metric-­‐space  analyses  can  significantly  underestimate  the  true  

information  contained  in  the  neural  code.  We  therefore  estimated  the  amount  of  information  that  can  be  

learned  about  the  acoustic  group  by  directly  observing  the  spiking  pattern  at  different  temporal  

resolutions  (Fig.  3a),  without  assuming  a  metric  structure,  similar  to  prior  approaches  in  sensory  systems  

8,10.    We  used  the  Nemenman-­‐Shafee-­‐Bialek  (NSB)  estimator  to  quantify  the  mutual  information  26,27.    As  

described  in  Methods,  this  technique  provides  minimally  biased  information  estimates,  quantifies  the  

uncertainty  of  the  calculated  information,  and  typically  requires  square-­‐root-­‐less  data  for  estimation  than  

many  other  direct  estimation  methods  26.    Nevertheless,  the  NSB  technique  requires  significantly  larger  

datasets  than  metric-­‐space  methods.    We  therefore  directly  computed  mutual  information  using  the  

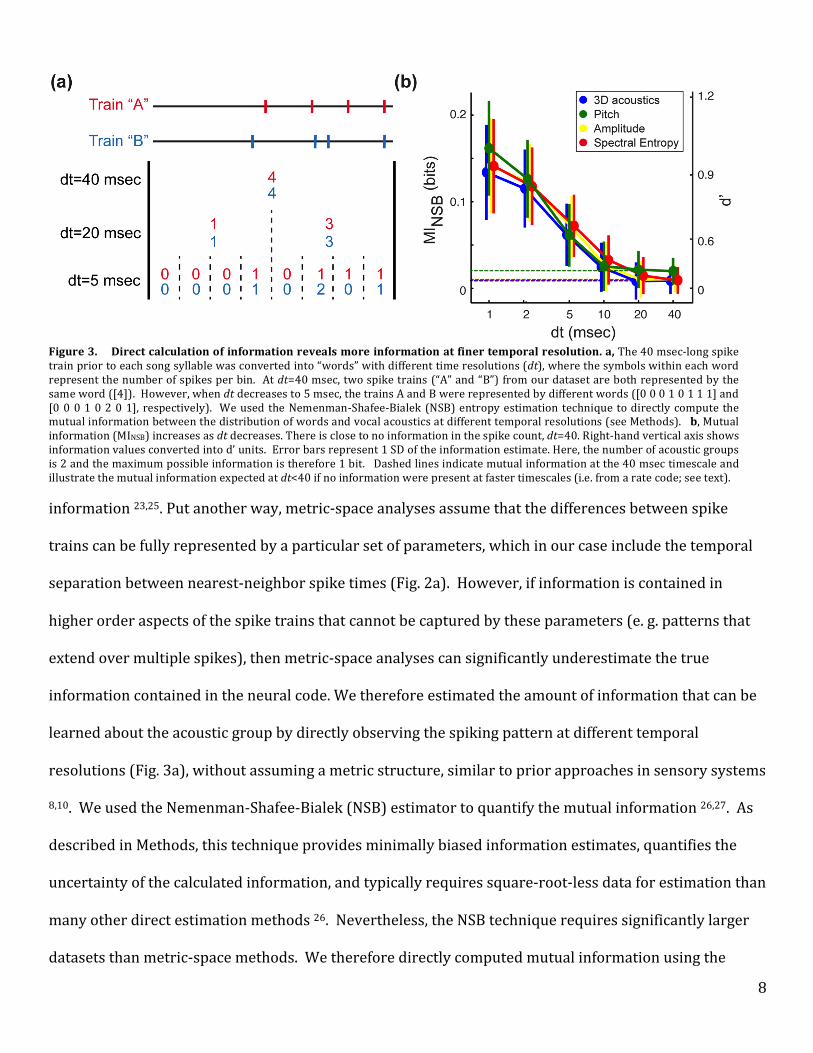
 Figure  3.        Direct  calculation  of  information  reveals  more  information  at  finer  temporal  resolution.  a,  The  40  msec-­‐long  spike  train  prior  to  each  song  syllable  was  converted  into  “words”  with  different  time  resolutions  (dt),  where  the  symbols  within  each  word  represent  the  number  of  spikes  per  bin.    At  dt=40  msec,  two  spike  trains  (“A”  and  “B”)  from  our  dataset  are  both  represented  by  the  same  word  ([4]).    However,  when  dt  decreases  to  5  msec,  the  trains  A  and  B  were  represented  by  different  words  ([0  0  0  1  0  1  1  1]  and  [0  0  0  1  0  2  0  1],   respectively).    We  used  the  Nemenman-­‐Shafee-­‐Bialek  (NSB)  entropy  estimation  technique  to  directly  compute   the  mutual  information  between  the  distribution  of  words  and  vocal  acoustics  at  different  temporal  resolutions  (see  Methods).      b,  Mutual  information  (MINSB)  increases  as  dt  decreases.  There  is  close  to  no  information  in  the  spike  count,  dt=40.  Right-­‐hand  vertical  axis  shows  information  values  converted  into  d’  units.    Error  bars  represent  1  SD  of  the  information  estimate.  Here,  the  number  of  acoustic  groups  is  2  and  the  maximum  possible  information  is  therefore  1  bit.    Dashed  lines  indicate  mutual  information  at  the  40  msec  timescale  and  illustrate  the  mutual  information  expected  at  dt<40  if  no  information  were  present  at  faster  timescales  (i.e.  from  a  rate  code;  see  text).    

  9  

subset  (41/125)  of  cases  where  the  recordings  were  long  enough  to  gather  sufficient  data  to  be  analyzed  

with  this  method.    

  We  found  that  mutual  information  rose  dramatically  as  temporal  resolution  increased.    As  shown  

in  Figure  3b,  when  averaged  across  all  41  cases  analyzed  using  the  NSB  technique,  mutual  information  

was  relatively  low  when  only  spike  counts  were  considered  (i.e.,  for  dt=40  msec).    Across  the  four  

methods  of  grouping  trials  based  on  syllable  acoustics,  mutual  information  between  spike  counts  and  

acoustic  output  ranged  from  0.009-­‐0.020  bits  (with  standard  deviations  of  ~0.015),  which  is  not  

significantly  different  from  zero.    If  information  about  motor  output  were  represented  only  in  spike  

counts  within  the  40  msec  premotor  window,  then  mutual  information  at  dt<40  would  be  equal  to  that  

found  at  dt=40  (dashed  lines  in  Fig.  3b);  note  that  this  is  true  despite  the  increase  in  word  length  at  

smaller  dt  8,10.  However,  in  all  analyses  mutual  information  increased  as  time  bin  size  dt  decreased  and  

reached  a  maximum  value  at  dt=1  msec,  the  smallest  bin  size  (and  thus  greatest  temporal  resolution)  we  

could  reliably  analyze.    At  1  msec  resolution,  mutual  information  ranged  from  0.134  -­‐0.162  (with  

standard  deviations  of  ~0.04)  bits  across  the  four  analyses  performed.    These  values  of  mutual  

information  correspond  to  d’  values  near  zero  at  dt=40  msec  and  to  d’  values  between  0.9  and  1.0  at  one-­‐

millisecond  resolution  (Fig.  3b,  right-­‐hand  axis).      These  results  indicate  that  far  more  information  about  

upcoming  vocal  behavior  is  available  at  millisecond  timescales  and  suggest  that  small  differences  in  spike  

timing  can  significantly  influence  motor  output.  Therefore,  although  in  some  individual  cases  more  

information  may  be  available  from  a  rate  code  (empty  bars,  Fig.  2d),  across  the  population  of  RA  neurons  

much  more  information  is  present  in  millisecond-­‐scale  spike  timing.      

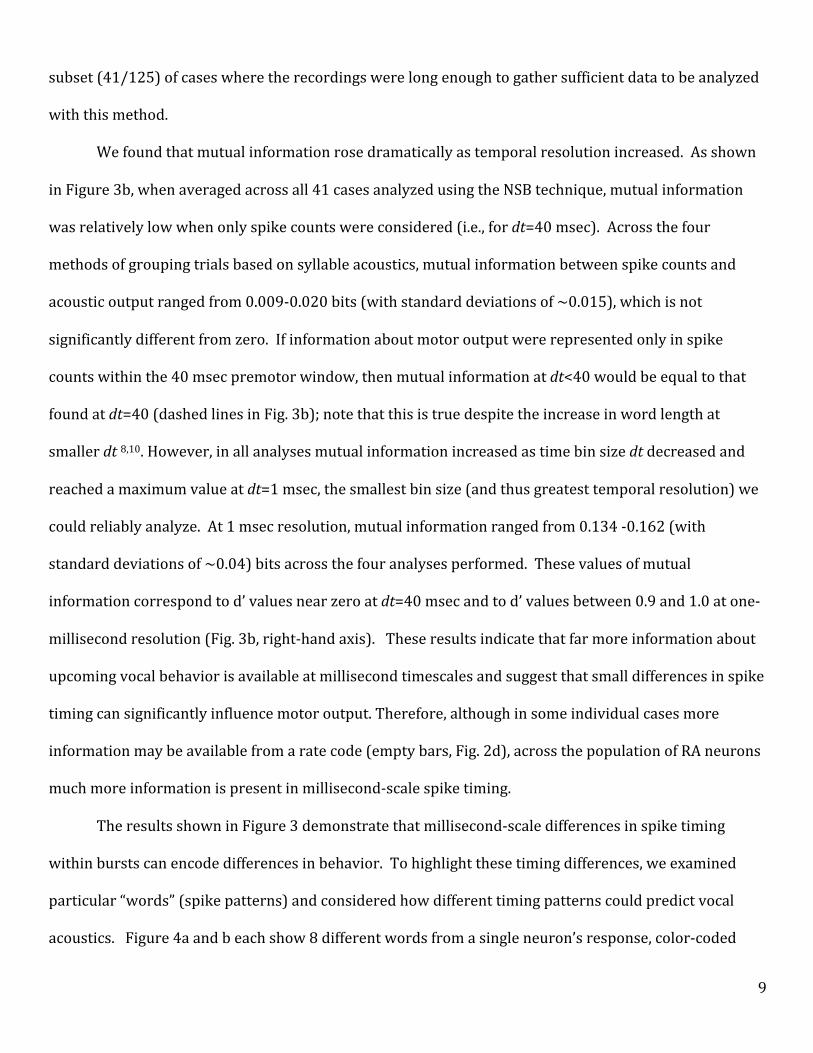
  The  results  shown  in  Figure  3  demonstrate  that  millisecond-­‐scale  differences  in  spike  timing  

within  bursts  can  encode  differences  in  behavior.    To  highlight  these  timing  differences,  we  examined  

particular  “words”  (spike  patterns)  and  considered  how  different  timing  patterns  could  predict  vocal  

acoustics.      Figure  4a  and  b  each  show  8  different  words  from  a  single  neuron’s  response,  color-­‐coded  

  10  

according  to  the  behavioral  group  in  which  each  word  

appears  most  frequently.    All  words  shown  in  Figure  4  

contain  the  same  number  of  spikes,  and  thus  are  identical  at  

the  time  resolution  of  dt  =  40  msec  (Fig.  3a).    In  the  example  

shown  in  Figure  4a,  a  distinct  set  of  spike  timing  patterns  

predicts  the  occurrence  of  low-­‐pitched  (group  1)  or  high-­‐

pitched  (group  2)  syllable  renditions.    In  Figure  4b,  

behavioral  groupings  are  performed  in  the  three-­‐dimensional  

acoustic  space  and  similarly  show  that  distinct  spike  timing  

patterns  can  predict  vocal  acoustics.    In  some  cases,  the  

timing  patterns  associated  with  behavioral  groups  share  

intuitive  features.    For  example,  the  words  associated  with  

higher  pitch  in  Figure  4a  (blue  boxes  in  grid)  have  shorter  

inter-­‐spike-­‐intervals  than  words  associated  with  lower  pitch  

(Fig.  4a,  red  boxes),  suggesting  that  fine-­‐grained  interval  

differences  drive  pitch  variation.    However,  in  other  cases  

(e.g.,  Fig.  4b)  no  such  common  features  were  apparent.    

Future  studies  incorporating  realistic  models  of  motor  neuron  and  muscle  dynamics  are  therefore  

required  to  understand  how  the  precise  timing  patterns  in  RA  can  evoke  differences  in  vocal  behavior.    

Comparing information estimates across analyses

We compared the maximum information available from the metric-space analysis (see Methods), which is

𝐼!"#=0.10 bits, to the information available at the smallest dt=1 msec in the direct information calculation,

MINSB=0.16 bits. Reassuringly,  the  peak  information  available  from  the  direct  method  is  of  the  same  order  

Figure   4:   Spike   patterns   within   bursts   predict  vocal   acoustics.    Each  grid  shows  eight   “words”  at  time   resolution   dt=1   msec   (see   Fig.   3a).     Here   we  consider   words   with   equal   numbers   of   spikes  (three).     Rows   represent   different   words,   columns  represent   characters  within   a  word,   and  boxes   are  filled   when   a   spike   is   present.     Words   are   color-­‐coded   according   to   which   behavioral   group   they  appear   in   most   frequently,   with   words   appearing  more  often  in  groups  1  and  2  shown  in  red  and  blue,  respectively.    Colored  bars  at  right  show  the  relative  frequency  with  which  each  word  appears  in  group  1  or   2,   for   example   a   solid   red   bar   indicates   a  word  that  only  occurs  in  behavioral  group  1.    Data  in  a  are  from   the   same   neuron   shown   in   Figure   1b,   with  behavioral   groups   determined   by   pitch   (Fig.   1c).    Data   in   b   are   from   a   different   neuron   with  behavioral  grouping  in  3D  acoustic  space.  Note  that  although   this   figure   illustrates   subsets   of   observed  words,  mutual  information  is  always  computed  over  the  full  distribution  of  all  words.  

  11  

of  magnitude  but  somewhat  larger  than  that  computed  independently  in  the  metric-­‐space  analysis.  This  

points  at  consistency  between  the  methods  and  yet  suggests  that  additional  information  may  be  present  

in  higher  order  spike  patterns  that  cannot  be  accounted  for  by  a  metric-­‐space  analysis,  namely  in  

temporal  arrangements  of  three  or  more  spikes. Similarly, a common technique in metric-space analysis is

to estimate the “optimal time scale” of encoding as 1/𝑞max (although other authors suggest that such estimates

may be highly imprecise25). In our dataset, the median value of 𝑞max was 0.3 msec-1, suggesting that spike

timing precision is important down to 1/𝑞max~1  msec, which is again in agreement with the direct estimation

technique.


Discussion:      

We  computed  the  mutual  information  between  premotor  neural  activity  and  vocal  behavior  using  two  

well-­‐established  computational  techniques.    A  metric-­‐space  analysis  demonstrated  that  spike  timing  

provides  a  better  prediction  of  vocal  output  than  spike  rate  in  a  significant  majority  of  cases  (Fig.  2).    A  

direct  computation  of  mutual  information,  which  was  only  possible  in  the  subset  of  recordings  that  

yielded  relatively  large  datasets,  revealed  that  the  amount  of  information  encoded  by  neural  activity  was  

maximal  at  a  1  msec  timescale,  while  the  average  information  available  from  a  rate  code  was  insignificant  

(Fig.  3).    It  also  suggested  that  information  in  the  spike  trains  may  be  encoded  in  higher  order  spike  

patterns.  

  Although  previous  studies  have  shown  that  bursts  in  RA  projection  neurons  are  aligned  in  time  to  

the  occurrence  of  particular  song  syllables  15,18,  ours  is  the  first  demonstration  that  variations  in  spike  

timing  within  these  bursts  can  predict  trial-­‐by-­‐trial  variations  in  vocal  acoustics.    These  acoustic  

variations  are  thought  to  underlie  vocal  learning  ability  in  songbirds.    A  number  of  studies  have  

demonstrated  that  nucleus  LMAN  (the  lateral  magnocellular  nucleus  of  the  anterior  nidopallium),  the  

output  nucleus  of  the  AFP  and  an  input  to  RA  (Fig.  1a),  both  generates  a  significant  fraction  of  vocal  

  12  

variability  and  is  required  for  adaptive  vocal  plasticity  in  adult  birds  28-­‐30.    A  significant  question  raised  

by  our  results  therefore  concerns  the  extent  to  which  LMAN  inputs  can  alter  the  timing  of  spikes  in  RA.    

Recent  work  has  shown  that  spike  timing  patterns  in  LMAN  neurons  encode  the  time  during  song  

31.    Future  studies  might  address  whether  the  observed  patterns  in  LMAN  spiking  can  also  predict  

acoustic  variations,  and  lesion  or  inactivation  experiments  could  quantify  changes  in  the  distribution  of  

firing  patterns  in  RA  after  the  removal  of  LMAN  inputs  32.  

  Our  results  indicate  that  spike  timing  in  cortical  motor  networks  can  carry  significantly  more  

information  than  spike  rates.    Equivalently,  these  findings  suggest  that  limiting  the  analysis  of  motor  

activity  to  spike  counts  can  lead  to  drastic  underestimates  of  information.    This  contrast  is  illustrated  by  

a  comparison  of  the  present  analysis  and  our  prior  study  examining  correlations  between  premotor  

spike  counts  and  the  acoustics  of  song  syllables  14.    In  that  earlier  study,  we  found  that  spike  rate  

predicted  vocal  output  in  ~24%  of  cases,  a  prevalence  similar  to  the  proportion  of  rate  cases  observed  in  

the  metric-­‐space  analysis  and  far  smaller  than  the  prevalence  of  temporal  cases  (Fig.  2).        Similarly,  

direct  computations  of  mutual  information  (Fig.  3)  show  that  a  purely  rate-­‐based  analysis  would  detect  

only  a  small  fraction  of  the  information  present  in  millisecond-­‐scale  timing.    Therefore  our  central  

finding  –  that  taking  spike  timing  into  account  greatly  increases  the  mutual  information  between  neural  

activity  and  behavior  –  suggests  that  correlation  and  other  rate-­‐based  approaches  to  motor  encoding  

might  in  some  cases  fail  to  detect  the  influence  of  neural  activity  on  behavior.  

  As  shown  in  Figure  3,  we  found  that  spike  timing  at  the  1  msec  timescale  provides  an  average  of  

~0.15  bits  out  of  a  possible  1.0  bit  of  information  when  discriminating  between  two  behavioral  groups.  

While  this  value  is  of  course  less  then  the  maximum  possible  information,  it  is  important  to  note  that  this  

quantity  represents  the  average  information  available  from  a  single  neuron.  A  number  of  studies  in  

sensory  systems  have  demonstrated  that  ensembles  of  neurons  can  convey  greater  information  than  can  

be  obtained  from  single  neurons  33.    While  our  dataset  did  not  include  sufficient  numbers  of  

  13  

simultaneous  recordings  to  address  this  issue,  future  analyses  of  ensemble  recordings  could  test  the  

limits  of  precise  temporal  encoding  in  the  motor  system.  

  Temporal  encoding  in  the  motor  system  could  also  provide  a  link  between  sensory  processing  and  

motor  output.    Prior  studies  have  shown  that  different  auditory  stimuli  can  be  discriminated  based  on  

spike  timing  in  auditory  responses  11,34,35,  including  those  in  area  HVC,  one  of  RA’s  upstream  inputs  36.    

Our  results  demonstrate  that  in  songbirds,  temporally  precise  encoding  is  present  at  the  motor  end  of  the  

sensorimotor  loop.    Propagating  sensory-­‐dependent  changes  in  spike  timing  into  motor  circuits  during  

behavior  might  therefore  underlie  online  changes  in  motor  output  in  response  to  sensory  feedback  37,38  

or  serve  as  a  substrate  for  long-­‐term  changes  in  motor  output  resulting  from  spike  timing-­‐dependent  

changes  in  synaptic  strength  19,39,40.  

  While  the  existence  of  precise  spike  timing  is  strongly  supported  for  a  variety  of  sensory  systems,  

a  lingering  question  is  how  downstream  neural  networks  could  use  the  information  that  is  present  at  

such  short  timescales,  and  hence  whether  the  animal’s  behavior  could  be  affected  by  details  of  spike  

timing.  Although  theoretical  studies  have  suggested  how  downstream  neural  circuits  could  decode  

timing-­‐based  spike  patterns  in  sensory  systems  41,  the  general  question  of  whether  the  high  spiking  

precision  in  sensing,  if  present,  is  an  artifact  of  neuronal  biophysics  or  a  deliberate  adaptation  remains  

unsettled  42.    

  In  motor  systems,  in  contrast,  spike  timing  differences  could  be  “decoded”  via  the  biomechanics  of  

the  motor  plant,  thereby  transforming  differences  in  spike  timing  into  measureable  differences  in  

behavior.  In  a  wide  range  of  species  43-­‐46,  the  amplitude  of  muscle  contraction  can  be  strongly  modulated  

by  spike  timing  differences  in  motor  neurons  (i.e.,  neurons  that  directly  innervate  the  muscles)  owing  to  

strong  nonlinearities  in  the  transform  between  spiking  input  and  force  production  in  muscle  fibers.    

Furthermore,  biomechanical  studies  have  shown  that  vocal  muscles  in  birds  have  extraordinarily  fast  

twitch  kinetics  and  can  reach  peak  force  production  in  less  than  4  msec  after  activation  20,21,  suggesting  

  14  

that  the  motor  effectors  can  transduce  millisecond-­‐scale  differences  in  spike  arrival  into  significant  

differences  in  acoustic  output.    Finally,  in  vitro  and  modeling  studies  have  quantified  the  nonlinear  

properties  the  songbird  vocal  organ,  demonstrating  that  small  differences  in  control  parameters  can  

evoke  dramatic  and  rapid  transitions  between  oscillatory  states,  suggesting  again  that  small  differences  

in  the  timing  of  motor  unit  activation  could  dramatically  affect  the  acoustics  of  the  song  47,48.    

  Our  results  demonstrate  that  the  temporal  details  of  spike  timing,  down  to  1  msec  resolution,  

carry  about  ten  times  as  much  information  about  upcoming  motor  output  compared  to  what  is  available  

from  a  rate  code.    This  is  in  marked  contrast  to  sensory  coding  8,10,  where  the  information  from  spike  

patterns  at  millisecond  resolution  is  often  about  double  that  available  from  the  rate  alone.    For  this  

reason,  the  most  striking  result  of  our  analysis  might  be  that  precise  spike  timing  in  at  least  some  motor  

control  systems  appears  to  be  even  more  important  than  in  sensory  systems.  In  summary,  although  

future  work  in  both  sensory  and  motor  dynamics  is  need  to  fully  explicate  how  differences  in  spike  

timing  are  mapped  into  behavioral  changes,  our  findings,  in  combination  with  previous  results  from  

sensory  systems,  represent  the  first  evidence  for  the  importance  of  millisecond-­‐level  spiking  precision  in  

shaping  behavior  throughout  the  sensorimotor  loop.  

References:  

1   Arabzadeh,  E.,  Panzeri,  S.  &  Diamond,  M.  E.  Deciphering  the  spike  train  of  a  sensory  neuron:  counts  

and  temporal  patterns  in  the  rat  whisker  pathway.  J  Neurosci  26,  9216-­‐9226,  (2006).  

2   Berry,  M.  J.,  Warland,  D.  K.  &  Meister,  M.  The  structure  and  precision  of  retinal  spike  trains.  Proc  

Natl  Acad  Sci  U  S  A  94,  5411-­‐5416,  (1997).  

3   Borst,  A.  &  Theunissen,  F.  E.  Information  theory  and  neural  coding.  Nat  Neurosci  2,  947-­‐957,  

(1999).  

4   Fairhall,  A.,  Shea-­‐Brown,  E.  &  Barreiro,  A.  Information  theoretic  approaches  to  understanding  

circuit  function.  Curr  Opin  Neurobiol  22,  653-­‐659,  (2012).  

  15  

5   Lawhern,  V.,  Nikonov,  A.  A.,  Wu,  W.  &  Contreras,  R.  J.  Spike  rate  and  spike  timing  contributions  to  

coding  taste  quality  information  in  rat  periphery.  Front  Integr  Neurosci  5,  18,  (2011).  

6   Liu,  R.  C.,  Tzonev,  S.,  Rebrik,  S.  &  Miller,  K.  D.  Variability  and  information  in  a  neural  code  of  the  cat  

lateral  geniculate  nucleus.  J  Neurophysiol  86,  2789-­‐2806,  (2001).  

7   Mackevicius,  E.  L.,  Best,  M.  D.,  Saal,  H.  P.  &  Bensmaia,  S.  J.  Millisecond  Precision  Spike  Timing  

Shapes  Tactile  Perception.  The  Journal  of  Neuroscience  32,  15309-­‐15317,  (2012).  

8   Nemenman,  I.,  Lewen,  G.  D.,  Bialek,  W.  &  van  Steveninck,  R.  R.  D.  Neural  coding  of  natural  stimuli:  

Information  at  sub-­‐millisecond  resolution.  Plos  Computational  Biology  4,  (2008).  

9   Reinagel,  P.  &  Reid,  R.  C.  Temporal  coding  of  visual  information  in  the  thalamus.  J  Neurosci  20,  

5392-­‐5400,  (2000).  

10   Strong,  S.  P.,  Koberle,  R.,  de  Ruyter  van  Steveninck,  R.  R.  &  Bialek,  W.  Entropy  and  Information  in  

Neural  Spike  Trains.  Physical  Review  Letters  80,  197-­‐200,  (1998).  

11   Wang,  L.,  Narayan,  R.,  Graña,  G.,  Shamir,  M.  &  Sen,  K.  Cortical  Discrimination  of  Complex  Natural  

Stimuli:  Can  Single  Neurons  Match  Behavior?  The  Journal  of  Neuroscience  27,  582-­‐589,  (2007).  

12   Georgopoulos,  A.  P.,  Schwartz,  A.  B.  &  Kettner,  R.  E.  Neuronal  population  coding  of  movement  

direction.  Science  233,  1416-­‐1419,  (1986).  

13   Paninski,  L.,  Fellows,  M.  R.,  Hatsopoulos,  N.  G.  &  Donoghue,  J.  P.  Spatiotemporal  Tuning  of  Motor  

Cortical  Neurons  for  Hand  Position  and  Velocity.  Journal  of  Neurophysiology  91,  515-­‐532,  (2004).  

14   Sober,  S.  J.,  Wohlgemuth,  M.  J.  &  Brainard,  M.  S.  Central  contributions  to  acoustic  variation  in  

birdsong.  J  Neurosci  28,  10370-­‐10379,  (2008).  

15   Leonardo,  A.  &  Fee,  M.  S.  Ensemble  coding  of  vocal  control  in  birdsong.  J  Neurosci  25,  652-­‐661,  

(2005).  

  16  

16   Woolley,  S.  M.,  Fremouw,  T.  E.,  Hsu,  A.  &  Theunissen,  F.  E.  Tuning  for  spectro-­‐temporal  

modulations  as  a  mechanism  for  auditory  discrimination  of  natural  sounds.  Nat  Neurosci  8,  1371-­‐

1379,  (2005).  

17   Yu,  A.  C.  &  Margoliash,  D.  Temporal  hierarchical  control  of  singing  in  birds.  Science  273,  1871-­‐

1875,  (1996).  

18   Chi,  Z.  &  Margoliash,  D.  Temporal  Precision  and  Temporal  Drift  in  Brain  and  Behavior  of  Zebra  

Finch  Song.  Neuron  32,  899-­‐910,  (2001).  

19   Tumer,  E.  C.  &  Brainard,  M.  S.  Performance  variability  enables  adaptive  plasticity  of  'crystallized'  

adult  birdsong.  Nature  450,  1240-­‐1244,  (2007).  

20   Elemans,  C.  P.,  Mead,  A.  F.,  Rome,  L.  C.  &  Goller,  F.  Superfast  vocal  muscles  control  song  production  

in  songbirds.  PLoS  One  3,  e2581,  (2008).  

21   Elemans,  C.  P.,  Spierts,  I.  L.,  Muller,  U.  K.,  Van  Leeuwen,  J.  L.  &  Goller,  F.  Bird  song:  superfast  

muscles  control  dove's  trill.  Nature  431,  146,  (2004).  

22   Wohlgemuth,  M.  J.,  Sober,  S.  J.  &  Brainard,  M.  S.  Linked  control  of  syllable  sequence  and  phonology  

in  birdsong.  J  Neurosci  30,  12936-­‐12949,  (2010).  

23   Victor,  J.  D.  &  Purpura,  K.  P.  Nature  and  precision  of  temporal  coding  in  visual  cortex:  A  metric-­‐

space  analysis.  Journal  of  Neurophysiology  76,  1310-­‐1326,  (1996).  

24   Victor,  J.  D.  &  Purpura,  K.  P.  Metric-­‐space  analysis  of  spike  trains:  Theory,  algorithms  and  

application.  Network-­Comp  Neural  8,  127-­‐164,  (1997).  

25   Chicharro,  D.,  Kreuz,  T.  &  Andrzejak,  R.  G.  What  can  spike  train  distances  tell  us  about  the  neural  

code?  J  Neurosci  Methods  199,  146-­‐165,  (2011).  

26   Nemenman,  I.  Coincidences  and  estimation  of  entropies  of  random  variables  with  large  

cardinalities.  Entropy  13,  2013-­‐2023,  (2011).  

  17  

27   Nemenman,  I.,  Shafee,  F.  &  Bialek,  W.  Entropy  and  inference,  revisted.  Advances  in  Neural  

Information  Processing  Systems  14,  (2002).  

28   Brainard,  M.  S.  &  Doupe,  A.  J.  Interruption  of  a  basal  ganglia-­‐forebrain  circuit  prevents  plasticity  of  

learned  vocalizations.  Nature  404,  762-­‐766,  (2000).  

29   Kao,  M.  H.,  Doupe,  A.  J.  &  Brainard,  M.  S.  Contributions  of  an  avian  basal  ganglia-­‐forebrain  circuit  to  

real-­‐time  modulation  of  song.  Nature  433,  638-­‐643,  (2005).  

30   Olveczky,  B.  P.,  Andalman,  A.  S.  &  Fee,  M.  S.  Vocal  experimentation  in  the  juvenile  songbird  

requires  a  basal  ganglia  circuit.  PLoS  biology  3,  e153,  (2005).  

31   Palmer,  S.  E.,  Kao,  M.  H.,  Wright,  B.  D.  &  Doupe,  A.  J.  Temporal  sequences  of  spikes  during  practice  

code  for  time  in  a  complex  motor  sequence.  arXiv  preprint  arXiv:1404.0655,  (2014).  

32   Olveczky,  B.  P.,  Otchy,  T.  M.,  Goldberg,  J.  H.,  Aronov,  D.  &  Fee,  M.  S.  Changes  in  the  neural  control  of  

a  complex  motor  sequence  during  learning.  Journal  of  neurophysiology  106,  386-­‐397,  (2011).  

33   Schneidman,  E.  et  al.  Synergy  from  silence  in  a  combinatorial  neural  code.  J  Neurosci  31,  15732-­‐

15741,  (2011).  

34   Machens,  C.  K.,  Prinz,  P.,  Stemmler,  M.  B.,  Ronacher,  B.  &  Herz,  A.  V.  M.  Discrimination  of  

behaviorally  relevant  signals  by  auditory  receptor  neurons.  Neurocomputing  38–40,  263-­‐268,  

(2001).  

35   Narayan,  R.,  Graña,  G.  &  Sen,  K.  Distinct  Time  Scales  in  Cortical  Discrimination  of  Natural  Sounds  in  

Songbirds.  Journal  of  Neurophysiology  96,  252-­‐258,  (2006).  

36   Huetz,  C.,  Del  Negro,  C.,  Lebas,  N.,  Tarroux,  P.  &  Edeline,  J.  M.  Contribution  of  spike  timing  to  the  

information  transmitted  by  HVC  neurons.  Eur  J  Neurosci  24,  1091-­‐1108,  (2006).  

37   Sakata,  J.  T.  &  Brainard,  M.  S.  Real-­‐time  contributions  of  auditory  feedback  to  avian  vocal  motor  

control.  J  Neurosci  26,  9619-­‐9628,  (2006).  

  18  

38   Sakata,  J.  T.  &  Brainard,  M.  S.  Online  contributions  of  auditory  feedback  to  neural  activity  in  avian  

song  control  circuitry.  J  Neurosci  28,  11378-­‐11390,  (2008).  

39   Fiete,  I.  R.,  Senn,  W.,  Wang,  C.  Z.  &  Hahnloser,  R.  H.  Spike-­‐time-­‐dependent  plasticity  and  

heterosynaptic  competition  organize  networks  to  produce  long  scale-­‐free  sequences  of  neural  

activity.  Neuron  65,  563-­‐576,  (2010).  

40   Sober,  S.  J.  &  Brainard,  M.  S.  Vocal  learning  is  constrained  by  the  statistics  of  sensorimotor  

experience.  Proc  Natl  Acad  Sci  U  S  A  109,  21099-­‐21103,  (2012).  

41   Thorpe,  S.,  Delorme,  A.  &  Van  Rullen,  R.  Spike-­‐based  strategies  for  rapid  processing.  Neural  

Networks  14,  715-­‐725,  (2001).  

42   de  Ruyter  van  Steveninck,  R.,  Borst,  A.  &  Bialek,  W.  in  Motion  Vision      (eds  J.M.  Zanker  &  J.  Zeil)    

(Springer,  2001).  

43   Brezina,  V.,  Orekhova,  I.  V.  &  Weiss,  K.  R.  The  neuromuscular  transform:  the  dynamic,  nonlinear  

link  between  motor  neuron  firing  patterns  and  muscle  contraction  in  rhythmic  behaviors.  J  

Neurophysiol  83,  207-­‐231,  (2000).  

44   Burke,  R.  E.  in  Handbook  of  Physiology,  The  Nervous  System,  Motor  Control.  II      (ed  V.B.  Brooks)  Ch.  

10,  (American  Physiological  Society,  1981).  

45   Garland,  S.  J.  &  Griffin,  L.  Motor  unit  double  discharges:  statistical  anomaly  or  functional  entity?  

Canadian  journal  of  applied  physiology  =  Revue  canadienne  de  physiologie  appliquee  24,  113-­‐130,  

(1999).  

46   Zhurov,  Y.  &  Brezina,  V.  Variability  of  motor  neuron  spike  timing  maintains  and  shapes  

contractions  of  the  accessory  radula  closer  muscle  of  Aplysia.  J  Neurosci  26,  7056-­‐7070,  (2006).  

47   Fee,  M.  S.  Measurement  of  the  linear  and  nonlinear  mechanical  properties  of  the  oscine  syrinx:  

implications  for  function.  Journal  of  comparative  physiology.  A,  Neuroethology,  sensory,  neural,  and  

behavioral  physiology  188,  829-­‐839,  (2002).  

  19  

48   Fee,  M.  S.,  Shraiman,  B.,  Pesaran,  B.  &  Mitra,  P.  P.  The  role  of  nonlinear  dynamics  of  the  syrinx  in  

the  vocalizations  of  a  songbird.  Nature  395,  67-­‐71,  (1998).  


Methods:  

To  measure  the  information  about  vocal  output  conveyed  by  motor  cortical  activity  at  different  

timescales,  we  recorded  the  songs  of  Bengalese  finches  while  simultaneously  collecting  physiological  data  

from  neurons  in  RA.    We  then  quantified  the  acoustics  of  individual  song  syllables  and  divided  the  

iterations  of  each  syllable  into  “behavioral  groups”  based  on  acoustic  features  such  as  pitch,  amplitude,  

and  spectral  entropy.    Mutual  information  was  then  computed  using  two  complementary  techniques.    

First,  we  used  a  metric-­‐space  analysis  1  to  quantify  how  well  the  distance  between  pairs  of  spike  trains  

can  be  used  to  classify  syllable  iterations  into  behavioral  groups.    Second,  we  used  a  direct  calculation  of  

mutual  information  2-­‐5  to  produce  a  minimally-­‐biased  estimate  of  the  information  available  at  different  

timescales.  


Neural  recordings  

Single-­‐unit  and  multiunit  recordings  of  RA  neurons  were  collected  from  four  adult  (>140  days  old)  male  

Bengalese  finches  using  techniques  described  previously  6.    All  procedures  were  approved  by  the  Emory  

University  Institutional  Animal  Care  and  Use  Committee.    Briefly,  an  array  of  four  or  five  high-­‐impedance  

microelectrodes  was  implanted  above  RA  nucleus.    We  advanced  the  electrodes  through  RA  using  a  

miniaturized  microdrive  to  record  extracellular  voltage  traces  as  birds  produced  undirected  song  (i.e.  no  

female  bird  was  present).    We  used  a  previously-­‐described  spike  sorting  algorithm  6  to  classify  individual  

recordings  as  single-­‐unit  or  multiunit.  In  total,  we  collected  53  RA  recordings  (19  single-­‐unit,  34  

multiunit),  which  yielded  34  single-­‐unit  and  91  multiunit  “cases”,  as  defined  below.    Based  on  the  spike  

waveforms  and  response  properties  of  the  recordings,  all  RA  recordings  were  classified  as  putative  

  20  

projection  neurons  that  send  their  axons  to  motor  nuclei  in  the  brainstem  6-­‐8.    A  subset  of  these  

recordings  has  been  presented  previously  as  part  of  a  separate  analysis  6.  


Acoustic  analysis  and  premotor  window  

We  quantified  the  acoustics  of  each  song  syllable  as  described  in  detail  previously  6.    Briefly,  we  

quantified  the  fundamental  frequency  (pitch),  amplitude,  and  spectral  entropy  at  a  particular  time  when  

spectral  features  were  well-­‐defined  (Fig.  1b,  red  line)  during  each  iteration  of  a  song  syllable.    We  

selected  these  three  acoustic  features  because  they  capture  a  large  percentage  of  the  acoustic  variation  in  

Bengalese  finch  song  6.    For  each  iteration  of  each  syllable,  we  analyzed  spikes  within  a  temporal  window  

prior  to  the  time  at  which  acoustic  features  were  measured.    The  width  of  this  window  was  selected  to  

reflect  the  latency  with  which  RA  activity  controls  vocal  acoustics.    Although  studies  employing  electrical  

stimulation  have  produced  varying  estimates  of  this  latency  9,10,  a  single  stimulation  pulse  within  RA  

modulates  vocal  acoustics  with  a  delay  of  15-­‐20  msec  11.    We  therefore  set  the  premotor  window  to  begin  

40  msec  prior  to  the  time  when  acoustic  features  were  measured  and  to  extend  until  the  measurement  

time  (Fig.  1b,  red  box).    This  window  therefore  includes  RA’s  premotor  latency  6,12  and  allows  for  the  

possibility  that  different  vocal  parameters  have  different  latencies.  


Determining  behavioral  groups  

While  grouping  spike  trains  is  straightforward  in  many  sensory  studies,  where  different  stimuli  are  

considered  distinct  groups,  we  face  the  problem  of  continuous  behavioral  output  in  motor  systems.  We  

took  two  approaches  to  binning  continuous  motor  output  into  discrete  classes.  First,  we  considered  only  

a  single  acoustic  parameter  and  divided  the  trials  into  equally  sized  groups  using  all  of  the  data.  For  

example,  Figure  2a  shows  trials  divided  into  two  behavioral  groups  based  on  one  parameter  (pitch).    In  

addition  to  pitch,  separate  analyses  also  used  sound  amplitude  or  spectral  entropy  to  divide  trials  into  

  21  

groups.  In  the  second  approach  (which  we  term  “3D  acoustics”;  Fig.  2b),  we  used  k-­‐means  clustering  to  

divide  trials  into  groups.    Clustering  was  performed  in  the  three-­‐dimensional  space  defined  by  pitch,  

amplitude,  and  entropy,  with  raw  values  transformed  into  z-­‐scores  prior  to  clustering.    Note  that  both  

approaches  allow  us  to  divide  the  dataset  into  an  arbitrary  number  of  groups  (parameter  N,  see  

“Discrimination  analysis”  below).    Our  primary  analysis  divided  trials  into  N=2  groups  since  a  smaller  N  

increases  statistical  power  by  increasing  the  number  of  data  points  in  each  group.  However,  alternate  

analyses  using  greater  N  yielded  similar  conclusions  (see  Results).  


Information  calculation  I:  Metric-­space  analysis  

In  previous  studies,  metric-­‐space  analysis  has  been  used  to  probe  how  neurons  encode  sensory  stimuli  

(for  a  review,  see  13).  The  fundamental  idea  underlying  this  approach  is  that  spike  trains  from  different  

groups  (e.g.  spikes  evoked  by  different  sensory  stimuli)  should  be  less  similar  to  each  other  than  spike  

trains  from  the  same  group  (spikes  evoked  by  the  same  sensory  stimulus).    In  the  present  study,  we  

adapt  this  technique  for  use  in  the  vocal  motor  system  to  ask  how  neurons  encode  trial-­‐by-­‐trial  

variations  in  the  acoustic  structure  of  individual  song  syllables.  To  do  so,  we  divide  the  iterations  of  a  

song  syllable  into  “behavioral  groups”  based  on  variations  in  acoustic  structure  (Fig.  1c).    We  then  

construct  a  “classifier”  to  ask  how  accurately  each  spike  train  can  be  assigned  to  the  correct  behavioral  

group  using  a  distance  metric  that  quantifies  the  dissimilarity  between  pairs  of  spike  trains  14.    As  

described  in  detail  below,  the  classifier  attempts  to  assign  each  trial  to  the  correct  behavioral  group  

based  on  the  distances  between  that  trial’s  spike  train  and  the  spike  trains  drawn  from  each  behavioral  

group.  Crucially,  the  distance  metric  is  parameterized  by  q,  which  reflects  the  importance  of  spike  timing  

to  the  distance  between  two  spike  trains.    This  method  therefore  allows  us  to  evaluate  the  contribution  

of  spike  timing  to  the  performance  of  the  classifier,  and  thus  to  the  information  contained  in  the  spike  

train  about  the  behavioral  group.  

  22  


Calculating  distances  

The  distance  metric  used  in  this  study,  D[q],  is  a  normalized  version  of  the  distance  metric  𝐷!"#$%[𝑞]  

originally  introduced  by  Victor  and  Purpura  14,15.  The  original  metric  is  defined  as  the  minimal  cost  of  

transforming  one  spike  train  into  a  second.  There  are  three  elementary  steps,  insertion  (Fig.  2a,  green  

circle)  and  deletion  (Fig.  2a,  green  ‘X’)  of  a  spike,  which  have  a  cost  of  1,  and  shifting  a  spike  (Fig.  2a,  

green  arrows),  which  has  a  cost  that  is  directly  proportional  to  the  amount  of  time  the  spike  is  moved.  

The  proportionality  constant,  q,  can  take  on  values  from  0  to  infinity.  When  q=0,  there  is  no  cost  for  

shifting  spikes,  and  the  distance  between  two  spike  trains  is  simply  the  absolute  value  of  the  difference  

between  the  number  of  spikes  in  each.  For  q>0,  spike  timings  matter,  and  distances  are  smaller  when  

spike  times  are  similar  between  the  two  spike  trains.  The  distance  is  normalized  by  dividing  by  the  total  

number  of  spikes  from  both  spike  trains.  The  normalized  version  of  the  Victor  and  Purpura  distance  is  

more  consistent  with  the  assumption  that  spike  trains  with  the  same  underlying  rate  should  have  

smaller  distances  than  spike  trains  with  different  rates  15.  Importantly,  the  time-­‐scale  parametric  nature  

of  𝐷[𝑞]  allows  us  to  evaluate  the  contribution  of  spike  timing  to  the  amount  of  information  transmitted  

by  the  neuron  about  the  behavior.  


Classifier-­based  measurement  of  mutual  information    

To  determine  the  amount  of  systematic,  group-­‐dependent  clustering,  a  decoding  algorithm  (“classifier”)  

is  used  to  classify  the  spike  trains  into  predicted  groups  based  on  D[q].  The  performance  of  the  classifier  

in  discriminating  between  behavioral  groups  is  measured  by  calculating  the  mutual  information  between  

the  actual  group  and  predicted  group.  

  23  

  The  classifier  assigns  trials  to  a  predicted  group  by  minimizing  the  average  distance  to  the  group.  

Given  a  spike  train  𝑠,  we  calculate  the  average  distance  from  𝑠  to  the  spike  trains  pertaining  to  a  certain  

group  𝐺!  by:  

  𝑑 𝑠,𝐺! =   𝐷[𝑞](𝑠, 𝑠!))! !!!"#$  !"#$%  !!!/!   (1)  

If  𝑠  belongs  to  group  𝐺! ,  we  exclude  the  term  𝐷[𝑞](𝑠, 𝑠)  from  the  above  equation.  The  trial  is  classified  

into  the  group  𝐺!  that  minimizes  this  average  distance,  and  the  resulting  information  is  summarized  into  

a  confusion  matrix  𝐶 𝐺!! ,𝐺!  which  indicates  the  number  of  times  that  a  trial  from  group  𝐺!  is  assigned  to  

group  𝐺!! .  The  parameter  𝑧  determines  the  geometry  of  the  average,  biasing  the  average  to  the  shortest  

distances  for  negative  values  and  emphasizing  reducing  the  distance  to  outliers  for  positive  values.    

  This  procedure  is  performed  for  a  range  of  q  values  (0,  0.05,  0.1,  0.2,  0.3,  0.5,  1,  2,  5,  10,  and  20  

msec-­‐1)  to  produce  a  set  of  confusion  matrices,  which  are  normalized  into  probability  matrices  𝑃(𝐺!!,𝐺!)  

by  dividing  by  the  total  number  of  spike  trains.  Then  the  performance  of  the  classification  can  be  

measured  by  computing  the  mutual  information,  I,  between  the  actual  group  and  predicted  group.    


 𝐼(𝐺! ,𝐺;  𝑞)  = 𝑝 𝐺!! ,𝐺!;  𝑞 log!

𝑝(𝐺!! ,𝐺!;  𝑞)  𝑝(𝐺!!;  𝑞)𝑝(𝐺!;  𝑞)

!

!!!

!

!!!


(2)  

The  variable  N  in  Equation  2  refers  to  the  number  of  groups  each  dataset’s  trials  were  divided  into.  

Except  where  otherwise  indicated,  we  used  N=2.  To  optimize  the  performance  of  the  classifier,  we  

maximized  mutual  information  across  different  values  of  z  in  the  range  of  -­‐8  to  8  for  each  value  of  q,  as  

described  previously  15.      

  𝐼!"#$%  (𝐺! ,𝐺)  is  the  information  when  only  spike  counts  are  considered,  that  is  when  q=0,  or  

𝐼(𝐺! ,𝐺;  0).  𝐼!"#(𝐺! ,𝐺)  is  the  maximum  value  of  𝐼(𝐺! ,𝐺;  𝑞),  and  the  value  of  q  associated  with  

  24  

𝐼!"#(𝐺! ,𝐺)  is  𝑞!"# .  If    𝐼(𝐺! ,𝐺;  𝑞)  plateaus,  obtaining  𝐼!"# 𝐺! ,𝐺  at  more  than  one  value  of  q,  𝑞!"#  is  

defined  as  the  smallest  of  those  values.    


Bias  correction,  “classifier”  

Because  there  is  a  component  of  the  classification  that  is  correct  by  chance,  the  estimate  from  Equation  2  

can  overestimate  the  true  information.  This  bias  can  be  computationally  approximated  and  subtracted  

from  the  original  estimate  14.  Concretely,  we  shuffle  the  spike  trains  across  groups  and  then  perform  the  

analysis  1000  times  and  calculate  the  average  information  across  these  random  reassignments.  This  

value  is  an  estimate  of  the  bias  and  is  subtracted  from  the  original  estimate.  After  subtraction,  only  

values  above  the  95th  percentile  of  the  null  distribution  of  I  values  are  considered  significant  and  

negative  values  are  set  equal  to  zero.      


Rate  cases  versus  temporal  cases    

We  define  a  “case”  as  one  neural  recording  (single-­‐  or  multi-­‐  unit)  that  meets  an  average  firing  threshold  

of  1  spike  in  the  40ms  premotor  window  before  one  syllable.  We  limited  our  analysis  to  cases  for  which  

at  least  50  trials  were  available.  After  performing  the  above  analyses  on  each  case,  we  categorized  the  

cases  into  “rate  cases”  and  “temporal  cases”.  Rate  cases  are  when  the  maximum  amount  of  information  

occurs  for  q=0.  For  rate  cases,  𝐼!"#$% = 𝐼!"# ,  indicating  that  the  best  discrimination  occurs  when  only  

spike  counts  are  considered.  For  cases  where  𝑞!"#>0,  the  fine  temporal  structure  of  the  spike  train  also  

contributes  to  discrimination,  which  we  define  as  a  temporal  case.  

      To  determine  whether  the  proportion  of  temporal  cases,  𝑝! ,  is  significantly  greater  than  chance,  

we  constructed  synthetic  datasets  in  which  we  randomized  spike  times  for  each  trial  in  each  case  

(“Poisson  test”).    These  randomized  spike  trains  had  the  same  number  of  spikes  as  our  original  data.  We  

then  performed  metric-­‐space  analysis  in  the  same  manner  as  before  and  calculated  the  proportion  of  

  25  

temporal  cases  across  all  cases.  After  generating  one  thousand  of  these  synthetic  datasets,  we  found  the  

distribution  of  𝑝!  under  the  null  hypothesis  that  spike  timings  do  not  encode  motor  output  and  asked  

whether  our  observed  𝑝!  was  greater  than  the  95th  percentile  of  this  distribution.    Additionally,  we  

performed  one-­‐sided  z-­‐tests  for  proportions  to  ask  whether  the  proportion  of  temporal  cases  exceeded  

the  proportion  of  rate  cases.    


Information  calculation  II:  Direct  method      

In  addition  to  the  metric-­‐space  analysis  described  above,  we  also  directly  calculated  the  mutual  

information  between  song  acoustics  and  neural  activity  5.  Whereas  metric-­‐space  analysis  makes  strong  

assumptions  about  the  structure  of  the  neural  code,  the  direct  approach  is  model-­‐independent  5,16.  

Specifically,  spike  train  distance  metrics  assume  that  spike  trains  that  have  spike  timings  closer  to  each  

other  are  linearly  more  similar  than  spike  trains  whose  timings  are  more  different.  As  with  all  

assumptions,  the  methods  gain  extra  statistical  power  if  they  are  satisfied,  but  they  may  fail  if  the  

assumptions  do  not  hold.  The  direct  method  simply  considers  distinct  patterns  of  spikes  at  each  

timescale,  without  assigning  importance  to  specific  differences.  Crucially,  direct  methods  allow  us  to  

estimate  the  true  mutual  information,  whereas  the  mutual  information  computed  from  a  metric-­‐space  

analysis  represents  only  a  lower  bound  on  this  quantity  17.  However,  because  the  direct  method  is  a  

model-­‐independent  approach  that  does  not  make  strong  assumptions  about  the  neural  code,  it  requires  

larger  datasets  to  achieve  statistical  power.      

  To  determine  whether  there  is  information  about  acoustics  in  the  precise  timing  of  spikes,  we  

compared  the  information  between  neural  activity  and  behavioral  group  following  discretization  of  the  

spike  trains  at  different  time  resolutions.  For  a  time  bin  of  size  dt,  each  T  =  40  msec-­‐long  spike  train  was  

transformed  into  a  “word”  with  40/dt  symbols  where  different  symbols  represent  the  number  of  spikes  

  26  

per  bin.  The  mutual  information  is  simply  the  difference  between  the  entropy  of  the  total  distribution  of  

words  𝐻!,!"[𝑅]  and  the  average  entropy  of  the  words  given  the  behavioral  group  𝐻!,!"[𝑅|G]:  

  𝐼!"#$%&  !,!"[𝑅;𝐺] = 𝐻!,!"[𝑅]  – 𝐻!,!" 𝑅 G !   (4)  

Idirect  could  be  quantified  exactly  if  the  true  probability  distributions  p(R),    p(R,G)  and  p(R|G)  were  known:  

  𝐼!"#$%& =  − 𝑝 𝑅 log! 𝑝 𝑅! − − 𝑝 𝑅,𝐺 log! 𝑝(𝑅|𝐺)!! .    

(5)  

However,  estimating  these  distributions  from  finite  datasets  introduces  a  systematic  error  (“limited  

sample  bias”  or  “undersampling  bias”)  that  must  be  corrected  18  .  There  are  several  methods  to  correct  

for  this  bias,  but  most  assume  that  there  is  enough  data  to  be  in  the  asymptotic  sampling  regime,  where  

each  typical  response  has  been  sampled  multiple  times.  As  we  increase  the  time  resolution  of  the  binning  

of  the  spike  train,  the  number  of  possible  neural  responses  increases  exponentially,  and  we  quickly  enter  

the  severely  undersampled  regime  where  not  every  “word”  is  seen  many  times,  and,  in  fact,  only  a  few  

words  happen  more  than  once  (which  we  term  “coincidence”  in  the  data).  We  therefore  employed  the  

Nemenman-­‐Shafee-­‐Bialek  (NSB)  entropy  estimation  technique  2,4,  which  can  produce  unbiased  estimates  

of  the  entropies  in  Equation  4  even  for  very  undersampled  datasets.  

  The  NSB  technique  uses  a  Bayesian  approach  to  estimate  entropy.  However,  instead  of  using  a  

classical  prior,  for  which  all  values  of  the  probability  of  spiking  are  equally  likely,  NSB  starts  with  the  a  

priori  hypothesis  that  all  values  of  the  entropy  are  equally  likely.  This  approach  has  been  shown  to  

reliably  estimate  entropy  in  the  severely  undersampled  regime  (where  the  number  of  trials  per  group  is  

much  less  than  the  cardinality  of  the  response  distribution)  provided  that  the  number  of  coincidences  in  

that  data  is  significantly  greater  than  one.  This  typically  happens  when  the  number  of  samples  is  only  

about  a  square  root  of  what  would  be  required  to  be  in  the  well-­‐sampled  regime  2,3.    

  This  method  often  results  in  unbiased  estimates  of  the  entropy,  along  with  the  posterior  standard  

deviation  of  the  estimate,  which  can  be  used  as  an  error  bar  on  the  estimate  3.  On  the  other  hand,  we  

  27  

know  that  no  method  can  be  universally  unbiased  for  every  underlying  probability  distribution  in  the  

severely  undersampled,  square-­‐root,  regime  19.  Thus  there  are  many  underlying  distributions  of  spike  

trains  for  which  NSB  would  be  biased.  Correspondingly,  the  absence  of  bias  cannot  be  assumed  and  must  

instead  be  verified  for  every  estimate,  which  we  do  as  described  below.      

    We  restricted  our  analysis  to  cases  in  which  the  number  of  trials  was  large  enough    (>200)  so  that  the  

number  of  coincidences  would  likely  be  significantly  greater  than  1.    Of  our  125  datasets,  41  passed  this  

size  criterion.    We  emphasize  that  no  additional  selection  beyond  the  length  of  recording  was  done.  Since  

recording  length  is  unrelated  to  the  neural  dynamics,  we  expect  that  this  selection  did  not  bias  our  

estimates  in  any  way.  The  NSB  analysis  was  performed  using  N=2  behavioral  groups,  since  increasing  the  

number  of  groups  greatly  decreased  the  number  of  coincidences  and  increased  the  uncertainty  of  the  

entropy  estimates  (not  shown).  Because  NSB  entropy  estimation  assumes  that  the  words  are  

independent  samples,  we  have  to  check  that  temporal  correlations  in  the  data  are  low.  To  do  this,  we  

used  NSB  to  calculate  the  entropy  of  four  different  halves  of  each  dataset:  the  first  half  of  all  trials,  the  

second  half,  and  the  two  sets  of  every  other  trial,  where  the  second  set  is  offset  from  the  first  set  by  one  

trial.  If  the  difference  in  mean  entropy  between  the  first  half  and  second  half  data  were  comparable  to  

the  difference  between  the  two  latter  sets,  then  the  effects  of  temporal  correlations  are  low.  This  would  

mean  that  the  correlations  are  unlikely  to  affect  entropy  estimation,  and  the  information  at  high  spiking  

precision  that  we  observe  cannot  just  be  attributed  to  modulation  occurring  on  a  longer  time  scale.    

  To  make  sure  that  the  NSB  estimator  is  unbiased  for  our  data,  we  estimated  each  conditional  and  

unconditional  entropy  from  all  available  N  samples,  and  then  from  𝛼𝑁,𝛼 < 1,  samples.  Twenty-­‐five  

random  subsamples  of  size  𝛼𝑁  were  taken  and  then  averaged  to  produce   𝑆 𝛼 .  We  plotted   𝑆 𝛼  vs.  

1/𝛼  and  checked  whether  all  estimates  for  1/𝛼 → 1  agreed  among  themselves  within  error  bars,  

indicating  no  empirical  sample-­‐size  dependent  bias  5,20.  In  most  cases,  no  sample  size-­‐dependent  drift  in  

the  entropy  estimates  was  observed,  and  hence  the  estimates  from  full  data  were  treated  as  unbiased.    In  

  28  

those  cases  where  bias  was  visible,  it  could  often  be  traced  to  the  rank-­‐ordered  distribution  of  words  not  

matching  the  expectations  of  the  NSB  algorithm.  Specifically,  some  of  the  most  common  words  occurred  

much  more  often  than  expected  from  the  statistics  of  the  rest  of  the  words.  Since  NSB  uses  frequencies  of  

common,  well-­‐sampled  words  to  extrapolate  to  undersampled  words,  such  uncommonly  frequent  

outliers  can  bias  entropy  estimation  4.  To  alleviate  the  problem,  we  followed  20  and  partitioned  the  

response  distribution  in  a  way  such  that  the  most  common  word  was  separated  from  the  rest  when  it  was  

too  frequent  (>2%  of  all  words).  We  use  𝑝!  to  denote  the  frequency  of  the  most  common  word  and  𝑝!  to  

denote  the  frequency  of  all  other  words.    We  then  used  the  additivity  of  entropy,  

  𝑆 = 𝑝!𝑆! + 𝑝!𝑆! + 𝑆 𝑝!,𝑝!   (6)  

to  compute  the  total  entropy  by  first  estimating  the  entropy  of  the  choice  between  the  most  common  

word  and  all  others,  𝑆(𝑝!,𝑝!),  and  the  entropy  of  most  of  the  data,  𝑆!,  independently  using  the  NSB  

method  (the  entropy  of  the  single  most  common  word,  𝑆!,  is  zero).  The  error  bars  were  computed  by  

summing  the  individual  error  bars  in  Eq.  (6)  in  quadratures.    As  verified  by  the  subsampling  procedure  

explained  above,  entropies  of  all  but  5  cases  were  unbiased  once  isolation  of  the  most  common  word  was  

performed.  

    We  then  averaged  the  mutual  information  between  the  spike  train  and  the  acoustic  group  over  all  

cases,  weighing  contribution  of  each  case  by  the  inverse  of  its  respective  posterior  variance.  The  variance  

of  the  mean  was  similarly  estimated.  Since  remaining  biased  cases  were  so  few,  and  they  typically  had  

few  coincidences  and  hence  large  error  bars,  we  expect  that  these  biased  cases  did  not  contribute  

significantly  to  bias  the  average  mutual  information.    


Peak  information  from  metric-­space  method:  

As  discussed  above,  the  metric-­‐space  and  direct  methods  of  computing  mutual  information  differ  in  their  

underlying  assumptions  about  the  statistical  structure  of  the  neural  code,  and  the  metric-­‐space  method  

  29  

can  only  produce  lower  bounds  on  the  signal-­‐response  mutual  information.  Therefore,  comparing  the  

values  of  information  computed  by  the  two  methods  is  prone  to  various  problems  of  interpretation.  It  is  

nevertheless  instructive  to  ask  whether  the  direct  method  estimates  greater  mutual  information  than  the  

metric-­‐space  analysis,  and  thus  if  patterns  of  multiple  spikes  carry  additional  information  beyond  that  in  

spike  pairs,  which  is  discoverable  by  the  metric-­‐space  method.  To  answer  this,  we  calculated  the  peak  

metric  space  information  𝐼!"# ,  which  is  the  mean  of  Imax  across  all  cases.  This  is  the  upper  bound  on  the  

information  detectable  through  the  metric-­‐space  method,  as  the  information  is  maximized  for  each  case  

independently,  rather  than  finding  a  single  optimal  q  for  all  cases.

1   Victor,  J.  D.  &  Purpura,  K.  P.  Nature  and  precision  of  temporal  coding  in  visual  cortex:  A  metric-­‐

space  analysis.  Journal  of  Neurophysiology  76,  1310-­‐1326,  (1996).  

2   Nemenman,  I.  Coincidences  and  estimation  of  entropies  of  random  variables  with  large  

cardinalities.  Entropy  13,  2013-­‐2023,  (2011).  

3   Nemenman,  I.,  Bialek,  W.  &  de  Ruyter  van  Steveninck,  R.  Entropy  and  information  in  neural  spike  

trains:  Progress  on  the  sampling  problem.  Phys  Rev  E  69,  056111,  (2004).  

4   Nemenman,  I.,  Shafee,  F.  &  Bialek,  W.  Entropy  and  inference,  revisted.  Advances  in  Neural  

Information  Processing  Systems  14,  (2002).  

5   Strong,  S.  P.,  Koberle,  R.,  de  Ruyter  van  Steveninck,  R.  R.  &  Bialek,  W.  Entropy  and  Information  in  

Neural  Spike  Trains.  Physical  Review  Letters  80,  197-­‐200,  (1998).  

6   Sober,  S.  J.,  Wohlgemuth,  M.  J.  &  Brainard,  M.  S.  Central  contributions  to  acoustic  variation  in  

birdsong.  J  Neurosci  28,  10370-­‐10379,  (2008).  

7   Spiro,  J.  E.,  Dalva,  M.  B.  &  Mooney,  R.  Long-­‐range  inhibition  within  the  zebra  finch  song  nucleus  RA  

can  coordinate  the  firing  of  multiple  projection  neurons.  Journal  of  Neurophysiology  81,  3007-­‐

3020,  (1999).  

  30  

8   Leonardo,  A.  &  Fee,  M.  S.  Ensemble  coding  of  vocal  control  in  birdsong.  J  Neurosci  25,  652-­‐661,  

(2005).  

9   Ashmore,  R.  C.,  Wild,  J.  M.  &  Schmidt,  M.  F.  Brainstem  and  forebrain  contributions  to  the  

generation  of  learned  motor  behaviors  for  song.  J  Neurosci  25,  8543-­‐8554,  (2005).  

10   Vu,  E.,  Mazurek,  M.  &  Kuo,  Y.  Identification  of  a  forebrain  motor  programming  network  for  the  

learned  song  of  zebra  finches.  The  Journal  of  Neuroscience  14,  6924-­‐6934,  (1994).  

11   Fee,  M.  S.,  Kozhevnikov,  A.  A.  &  Hahnloser,  R.  H.  Neural  mechanisms  of  vocal  sequence  generation  

in  the  songbird.  Ann  N  Y  Acad  Sci  1016,  153-­‐170,  (2004).  

12   Wohlgemuth,  M.  J.,  Sober,  S.  J.  &  Brainard,  M.  S.  Linked  control  of  syllable  sequence  and  phonology  

in  birdsong.  J  Neurosci  30,  12936-­‐12949,  (2010).  

13   Victor,  J.  D.  Spike  train  metrics.  Curr  Opin  Neurobiol  15,  585-­‐592,  (2005).  

14   Victor,  J.  D.  &  Purpura,  K.  P.  Metric-­‐space  analysis  of  spike  trains:  Theory,  algorithms  and  

application.  Network-­Comp  Neural  8,  127-­‐164,  (1997).  

15   Chicharro,  D.,  Kreuz,  T.  &  Andrzejak,  R.  G.  What  can  spike  train  distances  tell  us  about  the  neural  

code?  J  Neurosci  Methods  199,  146-­‐165,  (2011).  

16   Rieke,  F.,  Warland,  D.,  de  Ruyter  van  Steveninck,  R.  &  Bialek,  W.  Spikes:  Exploring  the  Neural  Code.    

(MIT  Press,  1996).  

17   Borst,  A.  &  Theunissen,  F.  E.  Information  theory  and  neural  coding.  Nat  Neurosci  2,  947-­‐957,  

(1999).  

18   Panzeri,  S.,  Senatore,  R.,  Montemurro,  M.  A.  &  Petersen,  R.  S.  Correcting  for  the  Sampling  Bias  

Problem  in  Spike  Train  Information  Measures.  Journal  of  Neurophysiology  98,  1064-­‐1072,  (2007).  

19   Paninski,  L.  Estimation  of  entropy  and  mutual  information.  Neural  Comput  15,  1191-­‐1253,  (2003).  

20   Nemenman,  I.,  Lewen,  G.  D.,  Bialek,  W.  &  van  Steveninck,  R.  R.  D.  Neural  coding  of  natural  stimuli:  

Information  at  sub-­‐millisecond  resolution.  Plos  Computational  Biology  4,  (2008).  

  31  


Acknowledgements:

We thank Michael Long and Robert Liu for helpful discussions and Harshila Ballal for animal care. This work

was supported by US National Institutes of Health grants R90DA033462, P30NS069250, R01NS084844, and

R01DC006636, National Science Foundation grant IOS-1208126, and McDonnel Foundation grant 220020321.

Author contributions:

C.T., I.N., and S.J.S. designed the study and wrote the paper. S.J.S. and D.C. collected the neural data, C.T.,

K.S., I.N., and S.J.S. analyzed the data.

SUPPLEMENTARY INFORMATION

Table  1.          Effect  of  dividing  trials  for  each  case  into  a  different  number  of  behavioral  groups.    Numbers  in  the  

table  are  the  percentages  of  total  cases  that  are  rate  cases  and  temporal  cases,  respectively.  Asterisks  indicate  

instances  where  the  proportion  of  temporal  cases  is  significantly  greater  than  the  proportion  of  rate  cases.  

     N   3d  acoustics  

R,  T  in  %  Pitch  

R,  T  in  %  Amplitude  R,  T  in  %  

Spectral  Entropy  R,  T  in  %  

  2   17.6,  53.6   16.8,  56.0*      

13.6,  61.6*      

16.8,  56.8*      

  3   26.4,  53.6*      

35.2,  45.6      

20.8,  48.0*      

20.0,  57.6*      

  5   20.0,  54.4*      

26.4,  53.6*      

24.0,  50.4*      

31.2,  59.2*      

  8   23.2,  54.4*      

24.8,  49.6*      

18.4,  61.6*      

20.0,  59.2*      


Recommended