Minagawa 1 Effects of aerobic interval exercise training on mouse slow and fast twitch skeletal muscles Minori Minagawa Undergraduate Honors Research Thesis The Ohio State University November 2015 Project Advisor: Dr. Anuradha Kalyanasundaram
Transcript
Minagawa
1
Effects of aerobic interval exercise training on mouse slow and fast twitch skeletal muscles
Aerobic exercise training (AET) is a well-established approach to improve aerobic
capacity, cardiovascular function and metabolic efficiency. However, the benefits of exercise
have been shown to differ based on the unique modalities of the exercise regimen. We sought to
specifically investigate the effects of aerobic interval exercise training on skeletal muscle. For
this purpose, 2.5 months old FVB/n male mice (n=6) were subjected to an aerobic interval
exercise-training program on a six-lane mouse treadmill for 6 weeks at a maximum speed of
16mts/min/10° incline for 60mins, 5 days/week. Age matched sedentary controls (n=6) were
familiarized to the treadmill twice/week at 10mts/min for 10mins. No significant differences
were observed in body weight between the sedentary and exercised mice (SED= 30.96±0.656
gms vs EX=31.59±0.610 gms). At the end of the training program, aerobic exercise capacity was
determined by subjecting the mice to a graded maximal exercise test on a modular treadmill
connected to a CLAMS metabolic unit. Critical markers of whole body aerobic capacity
including maxVO2 measurements (SED=4965.518±139.355 and EX=6295.406±60.71ml/kg/hr)
and maximum running speed (SED=33±1.22mts/min; EX=46.8±0.547mts/min) were increased
in the trained mice compared to the sedentary controls. Blood lactate levels, measured within
15secs of the exercise test were decreased in trained mice relative to untrained sedentary controls
(SED=13.26±0.676 and EX=11.78±0.660mMol/L). Our study indicates that our specific aerobic
interval exercise improves overall aerobic capacity indicated by 5.3% increase in VO2 max and
1.5mMol/L decrease in blood lactate. The Soleus and Plantaris muscles were selected as
examples of a slow and fast twitch phenotype respectively. Muscle to body ratios were not
significantly different. Fiber type switching in response to the exercise regimen was assessed by
Myosin heavy chain (MHC) isoform expression. After 7 weeks of AET, MHC 1 isoform
Minagawa
4
decreased in Soleus by 16.12% while it increased by 79.77% in the Plantaris compared to
untrained sedentary control muscles. On the other hand, MHC IIb increased by 56.72% in Soleus
while it decreased 5.92% in the Plantaris after AET. Thus our protocol, which included aspects
of both aerobic as well as endurance training, induced shifts in both slow and fast MHC isoforms
in the Soleus and Plantaris muscles. Interestingly, we find that the same exercise protocol shifted
the Soleus to favor a faster phenotype and the fast Plantaris towards a slower phenotype. The
shifts in MHC isoforms in these two muscles studied may indicate the effects of a combined
aerobic and endurance demand whereby both muscles may have reached a level of higher
efficiency by acquiring a new ratio of slow and fast capabilities.
Minagawa
5
Background
Muscle Fiber: A single skeletal muscle is known as muscle fiber or myofiber. Myofibers are
made up of many fused undifferentiated mononucleated cells called myoblasts (Kim, 2015). The
term “muscle” often refers to a whole muscle such as the Soleus and Plantaris, which are in fact
many muscle fibers bound together by connective tissue. The contractions of the skeletal muscle
help support and move the skeleton. Skeletal muscles are “striated” because a series of light and
dark bands perpendicular to the long axis of fiber can be observed under a light microscope
(Widmaier, 2001). This striation is due to the arrangement of numerous thick and thin filaments
in the cytoplasm known as myofibrils. Thus, many myofibrils make up myofibers, and bundles
of myofibers make up skeletal muscle.
Basic unit of muscle: Sarcomeres are the basic functional units of muscle fibers. A sarcomere
consists of one unit of repeating pattern of thick and thin filament along the length of the
myofibril (Wayne, 2001). The thick and thin filament is composed of contractile proteins myosin
and actin respectively (Wayne, 2001). The binding of actin on the myosin heads in presence of
ATP is what allows the muscle to contract (Widmaier, 2001). In addition to actin, the thin
filament contains two other proteins—troponin and tropomyosin that play important roles in
regulating contraction (McComas, 1993).
Sliding-filament mechanism: The protein myosin, in the thick filament has a projection that
extends toward the thin filament called cross bridges (Widmaier, 2001). Sliding-filament
mechanism is a process in which during muscle contraction, the cross bridges attaches to the thin
filament and exerts force on them leading to overlapping thick and thin filaments (Plowman,
Minagawa
6
1997). The interaction of the contractile proteins, myosin in the thick filament, and actin in the
thin filament is what allows the movement of the cross bridge (Wayne, 2001).
Motor neurons are nerves cells that innervate skeletal muscle fibers. Motor neurons
propagate action potential down the axons to the neuromuscular junction (Widmaier, 2001). The
neuromuscular junction is where Ca2+ are released eliciting Ca2+ release from the sarcoplasmic
reticulum (Wayne, 2001). As mentioned before, troponin and tropomyosin are proteins that play
important roles in regulating contraction. Specifically, the cross bridges are prevented from
binding to actin because tropomyosin molecules partially covering the myosin-binding site
(Widmaier, 2001). Troponin is bound to both actin and tropomyosin. When Ca2+ binds to specific
binding sites on troponin, the shape of troponin changes and thus tropomyosin molecules moves
away from their blocked positions on actin and exposes the myosin-binding site (Widmaier,
2001). Therefore, these two proteins play an important role for muscle relaxation.
Skeletal Muscle Fiber Types: There are different types of skeletal muscle fibers. Skeletal muscle
fibers possess a wide range of structural and functional specializations to support a variety of
workloads. They range from slow contracting fibers that are low-powered for endurance based
activities to fast contracting fibers that can produce high power for short bursts of high-intensity
work. The fibers are categorized based on their mechanical and metabolic characteristics. The
type of fiber depends on their maximal velocities of shortening and their major pathway to form
ATP (Widmaier, 2001). The maximal velocities of shortening determine whether the fibers are
fast or slow fibers (Wayne, 2001). It is dependent on rate of cross bridge cycling, which rely on
the maximal rates at which the myosin isozymes split ATP (Widmaier, 2001). Hence, fast fibers
Minagawa
7
contain myosin with high ATPase activity and slow fibers contain myosin with low ATPase
activity.
The enzymatic machinery used to synthesize ATP is another approach to classify skeletal
muscle fibers. The energy metabolism used to form ATP determines if the fibers are oxidative or
glycolytic fibers (Widmaier, 2001). Oxidative fibers have high capacity for oxidative
phosphorylation due to high concentration of mitochondria (Widmaier, 2001). Many capillaries
surround oxidative fibers in order to deliver oxygen to the muscle. Oxidative fibers are
characterized by a dark-red color due to large amounts of myoglobin. Myoglobin is an oxygen
binding protein, which increases the rate of oxygen diffusion within the fiber (Widmaier, 2001).
Thus, oxidative fibers are referred to as red muscle fibers. Glycolytic fibers on the other hand use
oxygen very minimally compared to oxidative fibers. Hence, glycolytic fibers are referred to as
white muscle fibers due to the lack of myoglobin (Wayne, 2001). Instead, glycolytic fibers are
characterized by fewer mitochondria, high concentration of glycolytic enzymes, and a large store
of glycogen (Widmaier, 2001). Based on these two characteristics, their maximal velocities of
shortening and their major pathway to form ATP, skeletal muscle fibers are categorized as slow-
twitch oxidative (SO), fast twitch-oxidative (FOG), and fast-twitch glycolytic (FG)
(McCommas, 1996).
Skeletal muscle fibers can be classified based on contractile properties, metabolic capacity
and more commonly, Myosin heavy chain (MHC) expression. Fibers that express a slow isoform
(MHC I) are termed Type I, and those that express any of the 3 fast isoforms (MHCIIa,
MHCIIx/d and MHCIIb) as Type IIa, Type IIx/d and Type IIb fibers respectively (Hody 2013).
In addition, hybrid fibers such as the Type I/IIa, IIax, IIxb can also exist that express a
combination of these MHC isoforms. In humans, Type I, IIa, and IId/x fibers have been
Minagawa
8
described, whereas rodents have four fiber types (I, IIa, IIx/d, and IIb) (Hody 2013). Type I
slow-twitch, oxidative fibers are slow in force generation and have an oxidative profile rich in
oxidative enzyme expression, mitochondria, and capillary supply (Yan 2010). Type IIa fast-
twitch, oxidative fibers are fast in force generation, but have similar oxidative profiles to the
Type I fibers (Yan 2010). Type IId/x fibers are fast-twitch with a glycolytic metabolic profile
rich in glycolytic enzyme expression and poor in mitochondria and capillary supply (Yan 2010).
Type IId/x is found in small animals and has an intermediate contractile speed (Hilber, 1999).
Type IIb fibers have an even more fast-twitch, glycolytic phenotype than type IId/x fibers (Yan
2010).
Although fibers are not classified based on their ability to resist fatigue, each of the fiber
types have notable differences. Fast-glycolytic fibers are characterized by rapid fatigue, which
means contractile activity cannot be maintained for long periods and tension is lost very fast
(Widmaier 2001). Slow-oxidative fibers on the other hand are very fatigue resistant (Widmaier
2001). Fatigue resistant means that it can maintain contractile activity for long duration and lose
little tension. Fast-oxidative fibers are in between the fast-glycolytic and slow oxidative fatigue
resistant spectrum (Widmaier 2001).
Motor unit: A motor unit consists of a motor neuron and all of the muscle fibers it innervates. It
is important to note that one motor neuron branches to innervate many muscle fibers; however, a
muscle fiber is only innervated by a branch from one motor neuron (Widmaier 2001). Although
in a single motor unit all muscle fibers are the same fiber type, a whole muscle is composed of
motor units of all three types (Widmaier 2001). Hence, each muscle is composed of several types
Minagawa
9
of myosin heavy chain (Wayne, 2001). Based on the number of each type of muscle fibers there
are in a muscle, the muscles’ maximal contraction speed, strength and fatigue capacity differ.
Muscle Adaptation to Exercise: Fiber types are extremely plastic and can switch MHC isoforms
depending on the demand on the muscle. Specifically, aerobic exercise has been shown to
dynamically alter MHC isoform expression, muscle excitation-contraction coupling machinery
and energy metabolism pathways corresponding to the mode and duration of exercise.
Aerobic exercise is a term often used to describe exercise that has significant duration but
at a relatively low intensity. Running is one example of an aerobic exercise. Endurance capacity
increases as the muscle fibers that are recruited adapts to the exercise. Adaptations include
increase in the mitochondria and increase in the number of capillaries surrounding the fibers
(Widmaier, 2001). Numerous studies have demonstrated other adaptations that endurance
training promotes such as fiber type transformation (type IIb/IId/x to IIa), mitochondrial
biogenesis, angiogenesis, and improved insulin sensitivity and metabolic flexibility (Yan 2010).
Specifically, studies have shown that endurance training triggers fast to slow fiber type
transformation (Hody, 2013).
The proportion of oxidative and glycolytic fibers within a muscle is affected with
exercise since the speed at which metabolic enzymes are produced can change. Endurance
training can significantly increase the number of fast-oxidative fibers and decrease the number of
fast glycolytic fibers within a muscle (Scott, 2001). The type of exercise performed influence the
strength and endurance capacity of a muscle. The adaptations that occur at the metabolic level
are dependent on training status, intensity, duration and the motor unit involved in the training
(Scott, 2001).
Minagawa
10
Plantaris and Soleus: Plantaris and Soleus are both hindlimb muscles in mouse (Crow, 1982).
Plantaris is a predominantly fast glycolytic muscle while Soleus is a slow oxidative muscle. The
slow twitch Soleus contains both slow and fast twitch oxidative type fibers. Fast twitch Plantaris
is composed almost exclusively of fast twitch oxidative and glycolytic fast twitch fiber types
(Crow, 1982).
VO2 max: VO2 max is the volume of oxygen consumption at maximal effort. The more
aerobically fit, the higher the VO2 max. The amount of oxygen consumption increases as
exercise intensity increases to produce energy. However, the point at which oxygen consumption
doesn’t increase with increase in exercise intensity is the VO2 max. Thus, VO2 max is measured
to quantitate aerobic capacity to determine efficacy of exercise training. Several studies have
compared the changes in VO2 max using interval training involving near-maximal intensity
versus continuous exercise of moderate training. These studies found a significantly greater
increase in VO2 in subjects who participated in the interval training (Gormley, 2008). Hence, we
found it appropriate to perform interval training with varying speed to maximize the potential
changes in VO2 max.
Lactate: Although lactate is produced in the body all the time, mainly in muscle cells and red
blood cells, lactate formation elevates during exercise (Davies, 1996). Lactate forms as a result
of carbohydrate breakdown used for energy during anaerobic exercise. Lactate formation and its
conversion to pyruvate allow the metabolism of carbohydrates to continue and supply energy.
The heart, brain, and slow twitch muscle fibers are major consumers of lactate. Lactate is cleared
Minagawa
11
from the blood through oxidation by muscle fibers. Blood lactate concentration is determined by
the rate of lactate production and clearance. Training has been shown to increase the rate of
lactate clearance when blood lactate levels were compared between aerobically trained athletes
with untrained individuals (Davies, 1996). Although trained athletes may clear lactate more
efficiently than untrained individuals, Stone et al. found that higher levels of blood lactate were
measured at the point of failure compared to untrained individuals when performing squats at
high intensity. The greater concentration of blood lactate immediately post exercise can be
attributed to the greater time and amount of work they performed compared to the untrained
individuals. Therefore, Stone suggests that training induces greater tolerance to lactate
accumulation (Stone, 1987).
Fuel source: Carbohydrate and fat are the two main sources of energy for muscular metabolism.
It is known that during low to moderate intensity exercise, fat is the predominant fuel and
increasingly becomes carbohydrate metabolism as intensity increases (Manetta, 2002). As
mentioned previously, there are several adaptations that take place with endurance training; one
specifically is an increase in the mitochondria. According to Bassett et al. effects of increase in
mitochondrial enzymes are 1) endurance trained muscles will oxidize fat at a higher rate and
therefore spare muscle glycogen and blood glucose and 2) lactate production decreased during
exercise (Bassett, 2000). It is therefore possible that the disparity in VO2 max test can be
attributed to difference in the mechanism of fuel source that powered muscle contraction during
a maximal exercise test between the exercised and sedentary mice. It is important to note that
several factors including gender, body composition, exercise mode, and training level influences
the pattern of fat oxidation (Chenevière, 2009). The point at which major fuel system changes
Minagawa
12
from fat to carbohydrate metabolism during exercise is known as the “crossover point” (Manetta,
2002). After training, the intensity at which this crossover point occurs shifts towards a higher
intensity (Manetta, 2002). Therefore, the trained athlete is able to utilize fat for a longer duration
than the untrained athlete when performing a matched exercise test. Chenevière et al. defines the
exercise intensity, at which the maximal fat oxidation (MFO) rate occurs as fat max. Fat min is
defined as the intensity at which the fat oxidation rate reached zero (i.e., respiratory exchange
ratio is greater than 1) (Chenevière, 2009). In a cross-sectional study conducted by Venables et
al. reported an average fat max occurred at 48% of VO2 max compared to 62% of VO2 max in
moderately trained subjects (Chenevière, 2009). Being able to rely on fat as fuel source is
advantageous in several ways. First, fat yields 9kcal of energy per gram versus 4kcal/g of energy
for carbohydrate. Second, the body has a seemingly unlimited amount of fat storage,
approximating 50-60,000kcal compared to that of glycogen, which has an approximate storage of
1500kcal (Lee, 2014). The ability to predominantly utilize fat for longer period of time is
advantageous when it comes to maximal exercise test because it spares glycogen that is needed
during higher intensity exercise.
Previous studies on VO2 test: Previous study on treadmill training with mice found that with
aerobic treadmill training, running for 2h/day 5days/wk, skeletal muscle mass increased by 12-
18% (Kemi, 2002). Training consisted of intervals of 8min at 85-90% of VO2 max and 2mins at
50% VO2 max. VO2 max showed an improvement of 49% above sedentary females and 29%
improvement in males. This study also found that in a 4-week regimen, myosin heavy chain
redistributed toward greater expression of type IIa and IId/x, but skeletal muscle weight
remained unchanged (Kemi, 2002).
Minagawa
13
Similar to the protocol used for this study, in sedentary mice, treadmill running skills were
maintained by treadmill running for 15mins on a flat treadmill at 0.15m/s for 3days/wk. VO2
max in untrained mice has been reported to range from 80 to 260 ml/kg/min, and RER at VO2
max from 0.91 to 1.28 (Kemi, 2002). Most importantly this study found that the weights of the
hind limb EDL and SOL muscles increased substantially (Kemi, 2002).
The purpose of this study was to understand the basic physiological changes in murine
Plantaris and Soleus as well as their changes in their overall aerobic capacity from a 7-week
treadmill interval training that included both aerobic and endurance components.
Methods
Animals: Twelve 2.5months old
FVB/n male mice were used for this
study. Mice were randomly assigned
to either a sedentary (SED; n=6) or
exercise (EX; n=6) groups. 6 mice
served as controls (sedentary group)
with no treadmill interval training.
Mice in the exercise group were
trained following the aerobic interval
training. Exer 3/6 Treadmill, Columbus Instruments (Figure 1.) was used for training the mice
and 1012M-1 Modular Enclosed Metabolic Treadmill for Mice, 1 Lane w/ Shock was used for
the exercise performance test in this study.
Figure 1. Mice exercised on a 6 lane treadmill
Minagawa
14
1. Acclimatization: Mice in the exercise group were first acclimatized to a 6 lane small
animal treadmill (Columbus Instruments). Mice were acclimatized for a week. Mice were
placed in the treadmill for 10mins and allowed to sit as well as explore.
2. Training: The mice were trained on the Exer 3/6 Treadmill, Columbus Instruments. A
programmed training protocol was used to train the mice with increasing speeds over a
period of 7 weeks (Table 1). First week was a sustained easy running at 4, 6, and
8mts/min for 30mins/day, 3days/week. Second week consisted of switching speeds
between 8, 10, and 12mts/min for 30mins/day, 3days/week. Weeks 3-8 was interval
training at 3mins at 12mts/min and 7mins at 14mts/min for 60min/day, 5days/week at 5-
degree incline.
Sedentary group: In order to limit the error for the sedentary control group, after the third week
of training, the mice were placed in the treadmill for 10mins at 10m/min with 5 degree incline so
they have some experience in running prior to the VO2 max testing. On the 7th week of training,
the incline was ramped up to 10 degrees.
Minagawa
15
Electrical Stimulus: Electrical stimulus frequency of 1Hz at the lowest intensity was turned on
only during the first and second week of training to force the mice onto the moving treadmill
belt.
Exercise Performance Test: After 7 weeks exercise training, mice were subjected to a graded
exercise test on a modular single lane treadmill connected to an OXYMAX/ Comprehensive Lab
Animal Monitoring System (CLAMS) setup, to measure VO2max, VCO2 and Respiratory
exchange ratio (RER) by indirect calorimetry in order to assess the aerobic capacity in the
exercised and sedentary mice. The mice completed a graded treadmill run to exhaustion on a
motorized rodent treadmill with an electric grid at the rear of the treadmill (Columbus
Instruments, Columbus, OH). Volume of oxygen consumption (VO2) during the test was
collected every 15 seconds. RER and VO2 were monitored throughout the test. Mice performed a
3-min warm-up by walking on the treadmill at 10 m/min and 0° grade. Speed was then increased
by 2.0 m/min every 3 min from a starting speed of 10 m/min to a maximum of 40 m/min. The
incline progressively increased 5° every stage to a maximum of 15°. Exhaustion was determined
as an inability to maintain running speed despite repeated contact with the electric grid. Once
mice ran to exhaustion, each mouse was immediately removed from the treadmill and the tail
was snipped to measure the blood lactate and glucose using the lactate and glucose strip. The
highest volume of oxygen consumed by the mouse during the test was determined as the
maximal oxygen consumption (VO2 max). This VO2 max test was performed on both control and
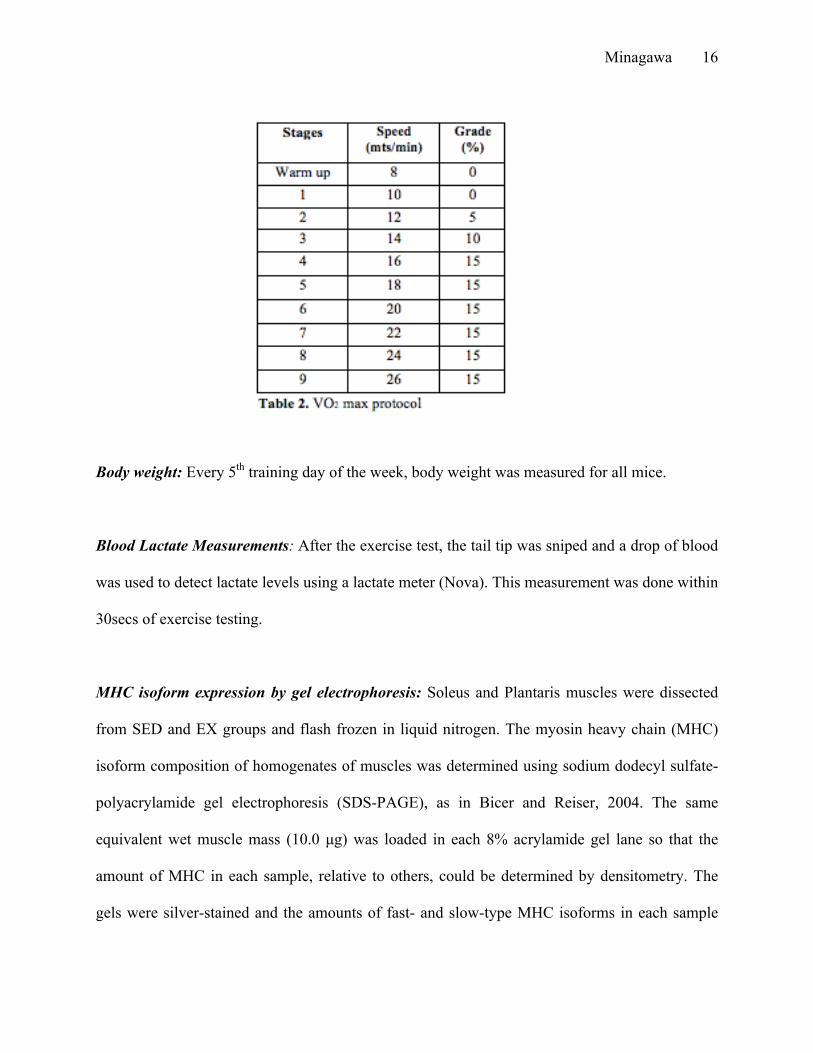
trained group. The protocol for the VO2 max test is shown below with each stage lasting 3mins
(Table 2). For every stage, speed and/ or grade was increased.
Minagawa
16
Body weight: Every 5th training day of the week, body weight was measured for all mice.
Blood Lactate Measurements: After the exercise test, the tail tip was sniped and a drop of blood
was used to detect lactate levels using a lactate meter (Nova). This measurement was done within
30secs of exercise testing.
MHC isoform expression by gel electrophoresis: Soleus and Plantaris muscles were dissected
from SED and EX groups and flash frozen in liquid nitrogen. The myosin heavy chain (MHC)
isoform composition of homogenates of muscles was determined using sodium dodecyl sulfate-
polyacrylamide gel electrophoresis (SDS-PAGE), as in Bicer and Reiser, 2004. The same
equivalent wet muscle mass (10.0 µg) was loaded in each 8% acrylamide gel lane so that the
amount of MHC in each sample, relative to others, could be determined by densitometry. The
gels were silver-stained and the amounts of fast- and slow-type MHC isoforms in each sample
Minagawa
17
were determined. Comparisons of total MHC protein amounts were limited to samples run on the
same gel, due to potential differences in stain intensity between gels. The amount of each MHC
isoform in individual samples was determined by using the ImageJ software.
Statistical Analysis: Results are presented as mean±SE. Group values were tested with a student
T-test to determine statistical significance (p<0.05).
Results
All mice successfully completed the treadmill interval training. Training increased the aerobic
capacity of trained mice as indicated by the exercise performance test. On average, the exercised
mice were also able to run at higher speeds than their sedentary controls (SED=33±1.22mts/min;
EX=46.8±0.547mts/min). The exercised mice achieved a higher maximal VO2 and VCO2
(SED=4965.518±139.355 and EX=6295.406±60.71ml/kg/hr) indicating improved aerobic
capacity. Figure 2A depicts the relationship between the volume of oxygen consumption, while
Figure 2B depicts the relationship between the volume of carbon dioxide exhaled during the
exercise test and the speed at which the mice were running in meters per minute respectively.
Compared to the sedentary group, the exercise group had a much lower VO2 during speeds 0 to
20mts/min. We can note that the exercise group was able to continue running at higher speeds
(46.8±0.547mts/min) compared to sedentary mice (33±1.22mts/min). The longer the duration of
time corresponds to being able to exercise at a higher intensity during the max exercise test.
Similarly, figure 2B indicates that the volume of carbon dioxide exhaled during the exercise test
is lower in the exercise group compared to that of sedentary group. Figure 2C depicts the RER
throughout the test, which is the overall ratio between the volume of oxygen consumed and the
Minagawa
18
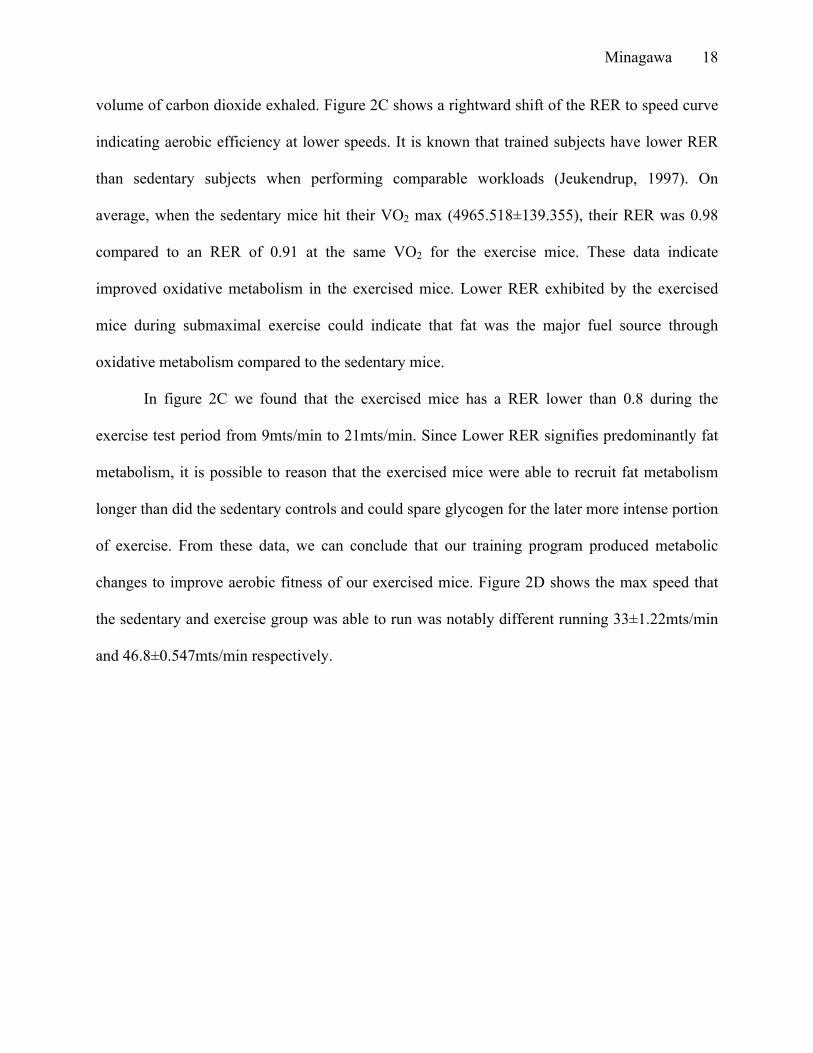
volume of carbon dioxide exhaled. Figure 2C shows a rightward shift of the RER to speed curve
indicating aerobic efficiency at lower speeds. It is known that trained subjects have lower RER
than sedentary subjects when performing comparable workloads (Jeukendrup, 1997). On
average, when the sedentary mice hit their VO2 max (4965.518±139.355), their RER was 0.98
compared to an RER of 0.91 at the same VO2 for the exercise mice. These data indicate
improved oxidative metabolism in the exercised mice. Lower RER exhibited by the exercised
mice during submaximal exercise could indicate that fat was the major fuel source through
oxidative metabolism compared to the sedentary mice.
In figure 2C we found that the exercised mice has a RER lower than 0.8 during the
exercise test period from 9mts/min to 21mts/min. Since Lower RER signifies predominantly fat
metabolism, it is possible to reason that the exercised mice were able to recruit fat metabolism
longer than did the sedentary controls and could spare glycogen for the later more intense portion
of exercise. From these data, we can conclude that our training program produced metabolic
changes to improve aerobic fitness of our exercised mice. Figure 2D shows the max speed that
the sedentary and exercise group was able to run was notably different running 33±1.22mts/min
and 46.8±0.547mts/min respectively.
Minagawa
19
VO2 Test:
Figure 2: (A, B) Aerobic capacity was increased in the exercised mice compared to sedentary mice based on VO2
and corresponding VCO2 values that increased linearly with workload intensity. (C) A decrease in the RER values
during lower intensity workloads (SED=0.8218 and EX= 0.7874 between 12 and 21mts/min) in exercised mice
compared to the sedentary controls indicate improved oxidative metabolism. (D) The exercised mice were also able
to run at higher speeds than their sedentary controls (SED=33mts/min and EX=45mts/min).
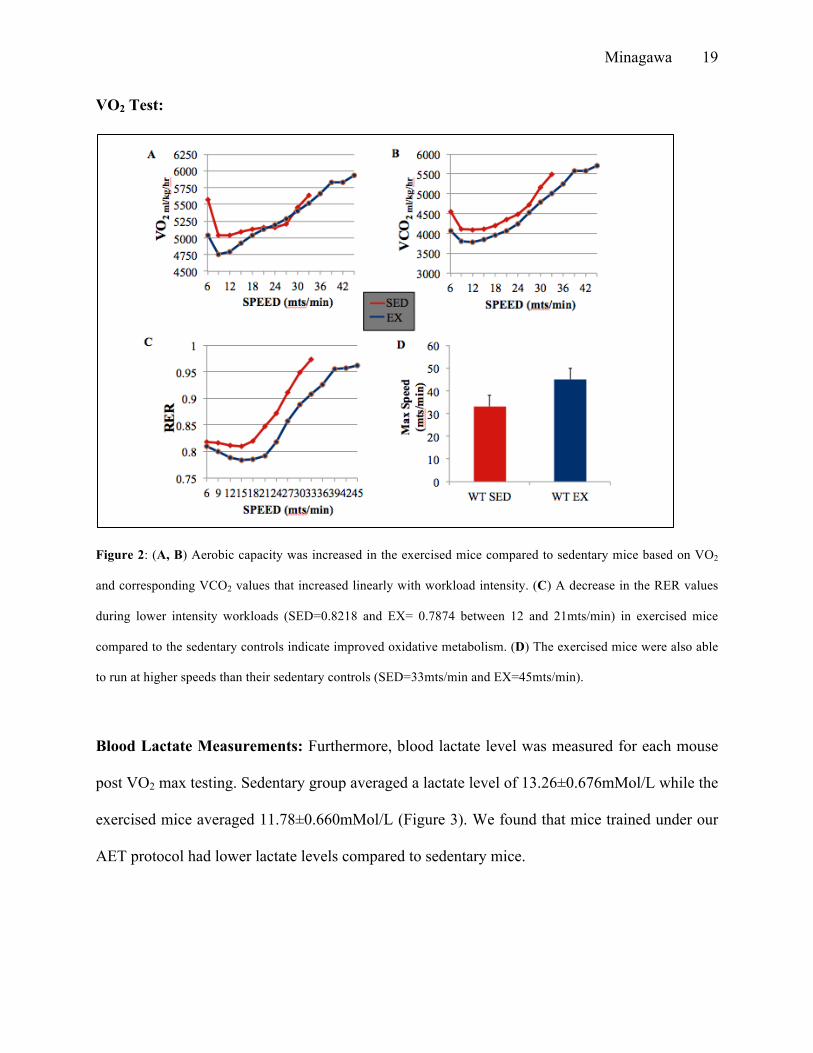
Blood Lactate Measurements: Furthermore, blood lactate level was measured for each mouse
post VO2 max testing. Sedentary group averaged a lactate level of 13.26±0.676mMol/L while the
exercised mice averaged 11.78±0.660mMol/L (Figure 3). We found that mice trained under our
AET protocol had lower lactate levels compared to sedentary mice.
Minagawa
20
Figure 3. Improved oxidative capacity was also associated with decreased blood lactate levels in the exercised mice
measured within 30secs after the exercise test.
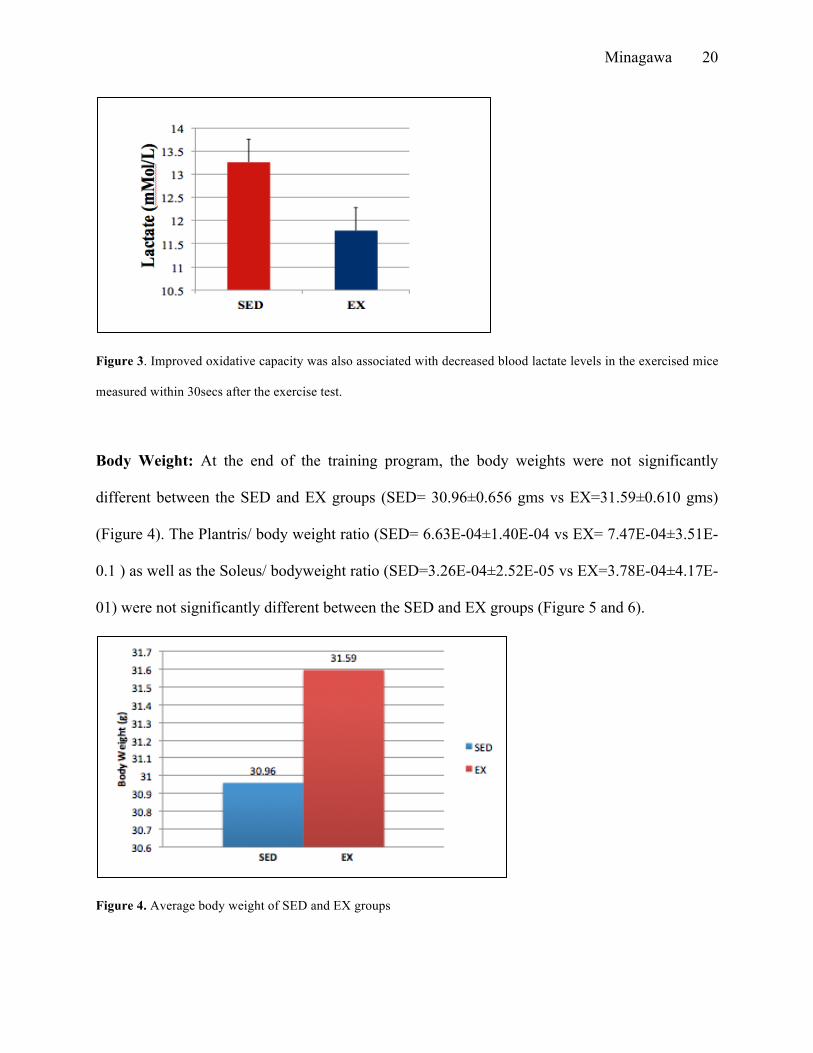
Body Weight: At the end of the training program, the body weights were not significantly
different between the SED and EX groups (SED= 30.96±0.656 gms vs EX=31.59±0.610 gms)
(Figure 4). The Plantris/ body weight ratio (SED= 6.63E-04±1.40E-04 vs EX= 7.47E-04±3.51E-
0.1 ) as well as the Soleus/ bodyweight ratio (SED=3.26E-04±2.52E-05 vs EX=3.78E-04±4.17E-
01) were not significantly different between the SED and EX groups (Figure 5 and 6).
Figure 4. Average body weight of SED and EX groups
Minagawa
21
Figure 5. Plantaris/ body weight of SED and EX
groups
Figure 6. Soleus/ body weight of SED and EX groups
Expression of Myosin Heavy Chain Isoforms in exercised slow vs. fast muscles:
After 7 weeks of AET, Soleus (e.g. of slow twitch muscle) and Plantaris (e.g. of fast twitch
muscle) muscles were dissected from exercised and sedentary mice, homogenized and subjected
to polyacrylamide gel electrophoresis and silver stained to detect MHC isoforms (Figure 7).
Figure 7. MHC isoforms of the Soleus and Plantaris in the SED and EX groups.
MHC isoforms were quantified using the ImageJ software. The density of each MHC isoform
band was quantified. The average of 3 samples of Plantaris and Soleus of both sedentary and
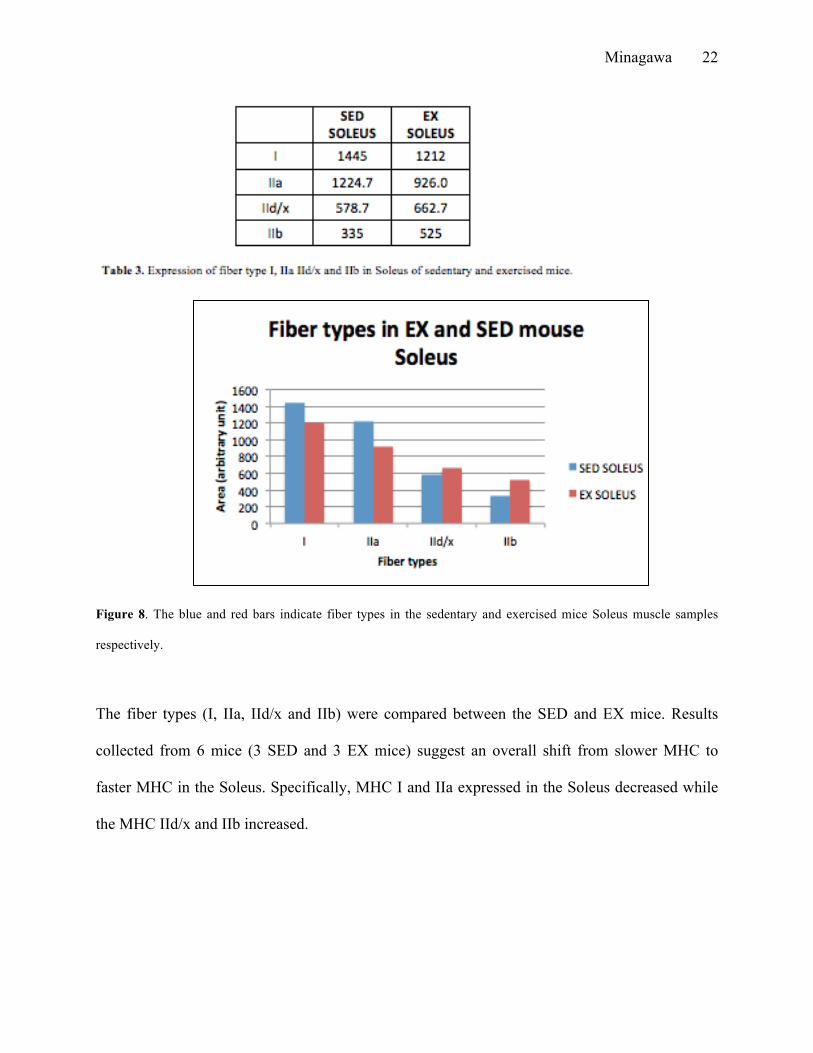
exercised mice were calculated (Table 3, 4)
Minagawa
22
Figure 8. The blue and red bars indicate fiber types in the sedentary and exercised mice Soleus muscle samples
respectively.
The fiber types (I, IIa, IId/x and IIb) were compared between the SED and EX mice. Results
collected from 6 mice (3 SED and 3 EX mice) suggest an overall shift from slower MHC to
faster MHC in the Soleus. Specifically, MHC I and IIa expressed in the Soleus decreased while
the MHC IId/x and IIb increased.
Minagawa
23
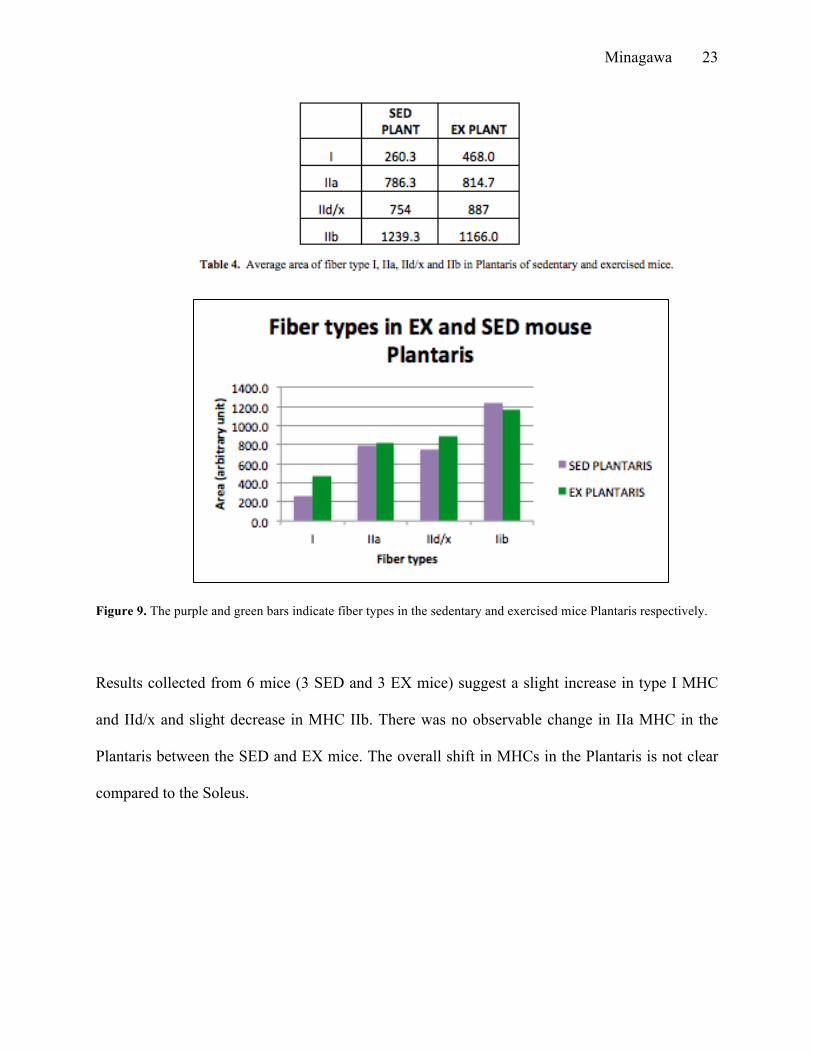
Figure 9. The purple and green bars indicate fiber types in the sedentary and exercised mice Plantaris respectively.
Results collected from 6 mice (3 SED and 3 EX mice) suggest a slight increase in type I MHC
and IId/x and slight decrease in MHC IIb. There was no observable change in IIa MHC in the
Plantaris between the SED and EX mice. The overall shift in MHCs in the Plantaris is not clear
compared to the Soleus.
Minagawa
24
Discussion
This study aimed to look at the effect of interval treadmill training on fiber type composition of
mouse Soleus and Plantaris. Previous studies have found overall increase in the oxidative
capacity of skeletal muscle after endurance exercise training (Scott, 2001). However, fiber type
transformation between slow-twitch muscle and fast-twitch muscle within the same functional
compartment has not been explored. Our study investigated the hindlimb muscles, Soleus, which
is predominantly slow-twitch and Plantaris, which is predominantly fast-twitch muscle (Crow,
1982). This study was to understand how each of the fiber types (I, IIa, IId/x, and IIb) responds
to the treadmill interval training. Fiber type transformation was observed in both Soleus and
Plantaris muscles from our interval treadmill training. The treadmill interval exercise training led
to different MHC transformation in Soleus compared to Plantaris. Training shifted the Soleus
MHC to faster MHC isoforms. MHC I and IIa decreased 16.12% and 24.39% respectively while
IId/x and IIb increased 14.52% and 56.72% respectively. The Plantaris on the other hand showed
a mixed result. The training favored an increase in both MHC I and IId/x (79.77% and 17.64%
respectively) while it decreased MHC IIB (5.92%). There was a slight increase in the IIa MHC
(3.60%) in Plantaris. This study showed that under the same stimulus, changes in the MHC
isoforms within the muscle are dependent on the fiber type. Fiber type transformations occur in
order to adapt to the stimulus and become more energetically efficient. Therefore, the MHC
isoform transformation observed in our study ties back to the type of training we had the mice
perform. Our treadmill interval training alternated between periods of high intensity (7mins)
followed by a lower intensity running (3mins). Running at faster speeds require fast MHC
isoforms. This may have induced a higher recruitment of fast-twitch muscle and so fiber type
transformation in the Soleus from slow to a faster MHC isoform is a reasonable explanation in
Minagawa
25
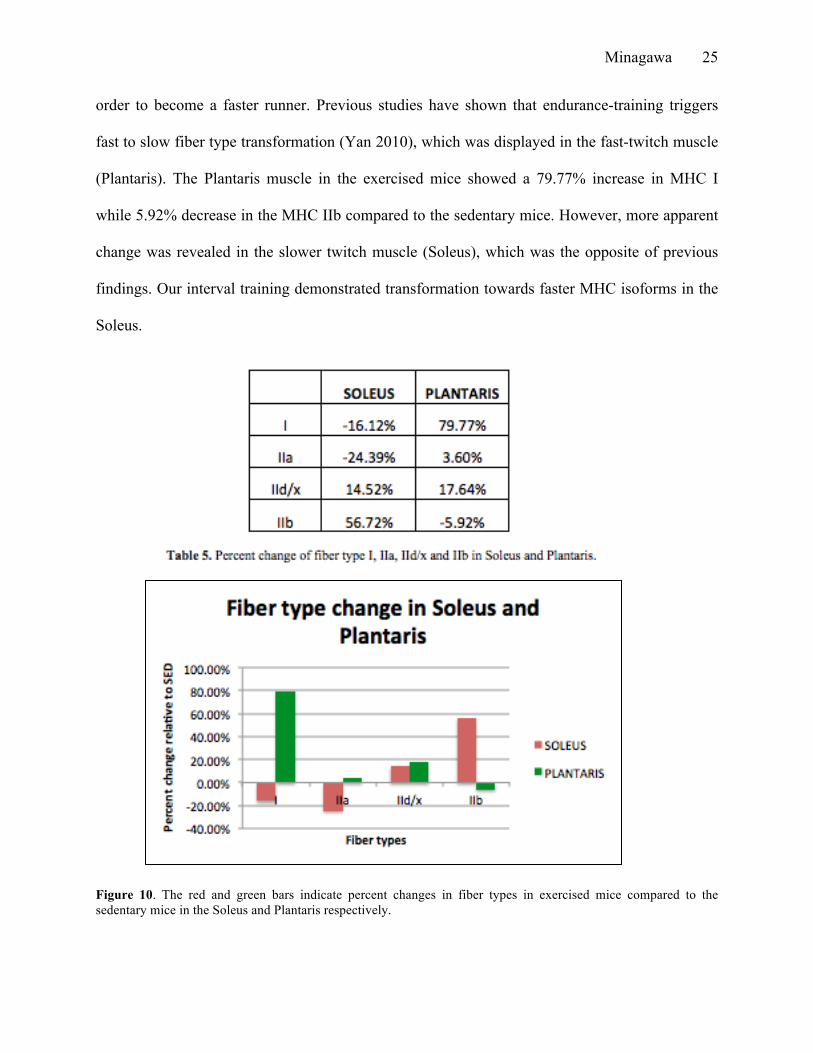
order to become a faster runner. Previous studies have shown that endurance-training triggers
fast to slow fiber type transformation (Yan 2010), which was displayed in the fast-twitch muscle
(Plantaris). The Plantaris muscle in the exercised mice showed a 79.77% increase in MHC I
while 5.92% decrease in the MHC IIb compared to the sedentary mice. However, more apparent
change was revealed in the slower twitch muscle (Soleus), which was the opposite of previous
findings. Our interval training demonstrated transformation towards faster MHC isoforms in the
Soleus.
Figure 10. The red and green bars indicate percent changes in fiber types in exercised mice compared to the sedentary mice in the Soleus and Plantaris respectively.
Minagawa
26
The fiber type composition of Soleus and Plantaris muscles therefore adapted to the exercise in
the opposite direction. The slow fiber type (Soleus) favored a faster MHC isoform shift while the
fast fiber type (Plantaris) transformed to a higher ratio of slower MHC isoforms. In conclusion,
under our treadmill interval training, the expression of MHCs in mouse hindlimb (Soleus and
Plantaris) muscles is affected in dissimilar manner. Our study further examined the relationship
between the fiber type changes in the exercised mice with increased aerobic capacity seen in the
exercise test.
There was a 5.3% increase VO2 max in the exercised mice compared to the sedentary
mice. The exercised mice were able to handle greater intensity as marked by longer duration,
approximately 12mts/min faster, compared to the sedentary mice. The blood lactate level post
exercise test was 1.5mMol/L lower in the exercise mice compared to the sedentary mice. Results
supported Bassett et al’s report that endurance trained mice oxidized fat at a higher rate and
therefore spare muscle glycogen and blood glucose, as well as lactate production decreased
during exercise. Thus, the observed changes in lactate levels as well as the rightward shift in the
VO2 levels in the exercised mice could be due to increase in slow fibers and hence in
mitochondrial metabolism that predominates in the slow fibers. Our study showed that Plantaris
increased in MHC I and IIx/d while it decreased in IIb, which supports the increase in oxidative
capacity that are present in oxidative fibers. The Soleus shifted from slow MHC to fast MHC,
which seems to contradict the increasing ability of oxidative capacity. However, the higher
intensity exercise interval period during the training may have led to favoring change to faster
MHC. Although Soleus shifted to faster MHC, because Soleus is still composed predominantly
of slow MHC, it still has a high oxidative capacity. We can conclude that our exercise program
Minagawa
27
was sufficient in generating metabolic adaptations and fiber type transformation to improve
physical fitness.
Our study also supports Chenevière et al’s conclusion that the after training, the intensity
at which this crossover point occurs shifts towards a higher intensity. The trained mice were able
to utilize fat for a longer duration than the untrained mice. The ability to metabolize fat and spare
glycogen that is needed during higher intensity exercise is beneficial to not only for endurance
athletes to maximize performance, but for people trying to lose weight.
Though our research was done on mice that followed a strict diet, this research has
potential to help shed light related to exercise and energy metabolism to increase efficiency in
training. Through understanding the relationship between training and fiber type transformation
in specific muscles, athletes can maximize performance. This study emphasizes the impact of the
intensity and duration of the training program on the unique properties of the slow and fast
muscle fibers.
Minagawa
28
Acknowledgements
I would like to thank Dr. Anuradha Kalyanasundaram for allowing me to participate in
her research project. Her incredible support and guidance throughout my time in her lab allowed
me to learn and grow passionate in this field of study. I would also like to thank her for her
support in developing my Honors Thesis. I would also like to thank Dr. Peter Reiser for his
invaluable help with the Myosin Heavy Chain isoform analyses.
Minagawa
29
Reference Augusto, Valeria, Carlos Roberto Padovani, and Gerson Eduardo Rocha Campos. "SKELETAL MUSCLE FIBER TYPES IN C57BL6J MICE." Braz. J. Morphol. Sci 21.2 (2004): 89-94. Web. 23 Oct. 2015. Bassett, D., & Howley, E. (2000). Limiting factors for maximum oxygen uptake and determinants of endurance performance. Medicine & Science in Sports & Exercise, 70-70. Bicer S, Reiser PJ. Myosin light chain isoform expression among single mammalian skeletal muscle fibers: species variations. J Muscle Res Cell Motil 2004; 25: 623–33 Chenevière, X., Malatesta, D., Peters, E., & Borrani, F. (2009). A Mathematical Model to Describe Fat Oxidation Kinetics during Graded Exercise. Medicine & Science in Sports & Exercise, 1615-1625. Crow, M. T., & Kushmerick, M. J. (January 01, 1982). Chemical energetics of slow- and fast-twitch muscles of the mouse. The Journal of General Physiology, 79, 1, 147-66. Davies, P. (1996). Lactic Acid & Blood Lactate. Retrieved May 11, 2015, from http://www.sport-fitness-advisor.com/lactic-acid.html Gormley, S., Swain, D., High, R., Spina, R., Dowling, E., Kotipalli, U., & Gandrakota, R. (2008). Effect of Intensity of Aerobic Training on VO2max. Medicine & Science in Sports & Exercise. Hody, S., Lacrosse, Z., Leprince, P., Collodoro, M., Croisier, J.-L., & Rogister, B. (February 01, 2013). Effects of Eccentrically and Concentrically Biased Training on Mouse Muscle Phenotype. Medicine & Science in Sports & Exercise, 1 Hilber K, Galler S, Gohlsch B, Pette D. Kintetic properties of myosin chain isoforms in single fibers from human skeletal muscle. FEBS Letti. 1999; 455:267-270. James, R. S., & Altringham, J. D. (February 01, 1995). The mechanical properties of fast and slow skeletal muscles of the mouse in relation to their. Journal of Experimental Biology, 198, 2 Jeukendrup AE, Mensink M, Saris WH, Wagenmakers AJ. J Appl Physiol (1985). 1997 Mar; 82(3):835-40. Kemi, O., Loennechen, J., Wisløff, U., & Ellingsen, Ø. (2002). Intensity-controlled treadmill running in mice: Cardiac and skeletal muscle hypertrophy. Journal of Applied Physiology J Appl Physiol, 1301-1309. Kim, Ji Hoon, Peng Jin, Rui Duan, and Elizabeth H. Chen. "Mechanisms of Myoblast Fusion during Muscle Development." Current Opinion in Genetics & Development 32 (2015):162-
Minagawa
30
70. ScienceDirect.Web.16Oct.2015. <http://www.sciencedirect.com/science/article/pii/S0959437X15000271>. Krüger, K., Gessner, D. K., Seimetz, M., Banisch, J., Ringseis, R., Eder, K., … Mooren, F. C. (2013). Functional and Muscular Adaptations in an Experimental Model for Isometric Strength Training in Mice. PLoS ONE, 8(11), e79069. doi:10.1371/journal.pone.0079069 Kushmerick, M. J., & Crow, M. T. (January 01, 1982). Chemical energetics, mechanics, and phosphorylation of regulatory light chains in mammalian fast- and slow-twitch muscles. Society of General Physiologists Series, 37, 159-72. Lee, O. (2014). Fat as fuel. Retrieved July 23, 2015, from http://www.pponline.co.uk/encyc/0158.htm Luginbuhl, A. J., G. A. Dudley, and R. S. Staron. "Fiber Type Changes in Rat Skeletal Muscle after Intense Interval Training." Histochemistry 81.1 (1984): 55-58. Web Manetta, J., Brun, J., Perez-Martin, A., Callis, A., Prefaut, C., & Mercier, J. (2002). Fuel oxidation during exercise in middle-aged men: Role of training and glucose disposal. Medicine & Science in Sports & Exercise,423-429. McComas, A. J. (1996). Skeletal muscle: Form and function. Champaign, IL: Human Kinetics Plowman SA, Smith DL., Exercise Physiology for Health, Fitmess, and Performance. Boston, Mass: ALlyn & Bacon; 1997: 433 Scott, Wayne, Jennifer Stevens, and Stuart A. Binder-Macleod. "Human Skeletal Muscle Fiber Type Classifications." Human Skeletal Muscle Fiber Type Classifications (2001): 1810-816. Physical Therapy; Journal of the American Physical Therapy Association. Web. 16 Oct. 2015. <http://ptjournal.apta.org/content/81/11/1810.long>. Stone MH, Pierce K, Godsen R, Wilson D and Blessing R. Heart rate and lactate levels during weight-training in trained and untrained men. Phys Sportsmed. 1987, 15(5):97-105 Widmaier, E., Raff, H., & Strang, K. (2001). Skeletal Muscle. In Human Physiology the Mechanism of Body Function (11th ed., pp. 292-316). The McGraw-Hill Companies. Yan, Z., Okutsu, M., Akhtar, Y. N., & Lira, V. A. (January 01, 2011). Regulation of exercise-induced fiber type transformation, mitochondrial biogenesis, and angiogenesis in skeletal muscle. Journal of Applied Physiology (bethesda, Md. : 1985), 110, 1, 264-74.