Mindfulness Based Stress Reduction (MBSR) in breast cancer: research and practice Caroline Hoffman, PhD Clinical Director & Research Co-ordinator The Haven Breast Cancer Support Centres London - Hereford - Leeds www.thehaven.org.uk [email protected]
Transcript
Mindfulness Based Stress Reduction (MBSR) in breast cancer:
• Free programmes of emotional support and complementary therapies for breast cancer
• Also an outreach programme called The Haven at Home (2.5h DVD and 1h CD)
The Haven in London
Mindfulness at The Haven
• MBSR has been taught to 500 people at the Haven.
• Mindful movement and meditation practice classes (drop-in) are also available twice a month
What is mindfulness?
• Mindfulness means paying attention (being aware) in a particular way:on purpose,in the present moment,and non-judgmentally.
Dr Jon Kabat-Zinn
Founder
Mindfulness-Based Stress Reduction Programme
What is mindfulness?
“Mindfulness is about being fully awake in our lives. It is about perceiving the exquisite vividness of each moment. We feel more alive. We also gain immediate access to our own powerful inner resources for insight, transformation, and healing.”
Jon Kabat-Zinn
Mindfulness training is worldwide• Up to 3,000 health
professionals among 18,000 participants in the MBSR programme at the Center for Mindfulness, University of Massachusetts, USA
• www.bemindful.co.uk lists mindfulness courses available by area in Great Britain (GB)
• Mindfulness at Monash University, Melbourne, Australia
Professional teacher training centres:
• University of Massachusetts USA (MBSR)
• University of Oxford, G.B. (MBCT)
• University of Bangor, G.B. (MBSR and MBCT)
Aim of MBSR study
The aim of this randomised controlled trial was to determine if and how much MBSR affects mood, disease-related quality of life, including endocrine symptoms, and wellbeing in women with stages 0 to III breast cancer.
Numbers of study participants
• 229 women who had attended the Haven
• Computer randomised into blocks of four
• 114 in intervention group
• 115 in wait-list control group
• Sample size calculated for 80% power from Profile of Mood States (Speca et al 2000)
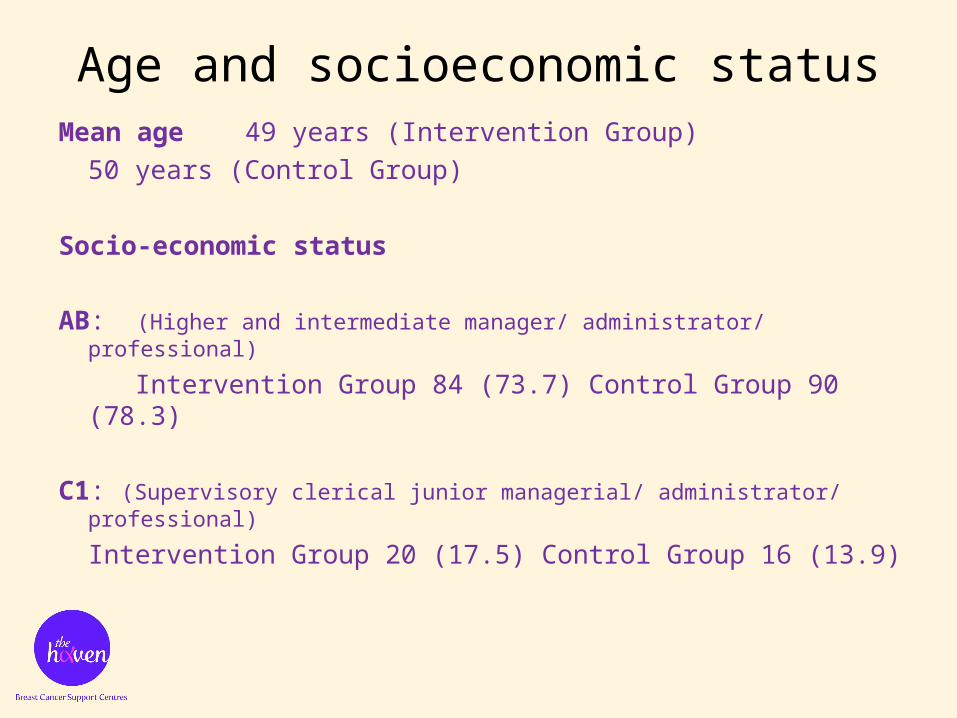
Age and socioeconomic statusMean age 49 years (Intervention Group)
50 years (Control Group)
Socio-economic status
AB: (Higher and intermediate manager/ administrator/ professional)
Intervention Group 84 (73.7) Control Group 90 (78.3)
Intervention Group 20 (17.5) Control Group 16 (13.9)
Measurement tools
• Profile of Mood States (POMS) (65 item) Primary outcome measure
• Quality of Life measures:
FACT-B (Breast) (37 item)
FACT-ES (Endocrine Symptoms) (19 item)
WHO-5 Wellbeing questionnaire (5 item)
MBSR Programme taught
8-week MBSR programme• Week 1 and 8: 2 and a quarter hours (Uni. Mass 3 hrs)• Week 2 to 6: 2 hours per week (Uni.Mass 2.5 hrs)• 6-hour day of mindfulness in week 6 on a Saturday:
10am to 4pm (both groups together for this)
Number of groups• Pilot group• 7 cycles of 8 week programmes (13 groups) in 2005 -2006 • Regular clinical supervision for clinician-researcher
Contents of MBSR programme
• Ways of seeing – how we perceive our world• Awareness of thoughts, emotions and body sensations• Mindful body scan, mindful stretches, mindful sitting
practice• Understanding stress • Awareness of habitual thought patterns and emotional
reactions• Mindfulness in everyday life
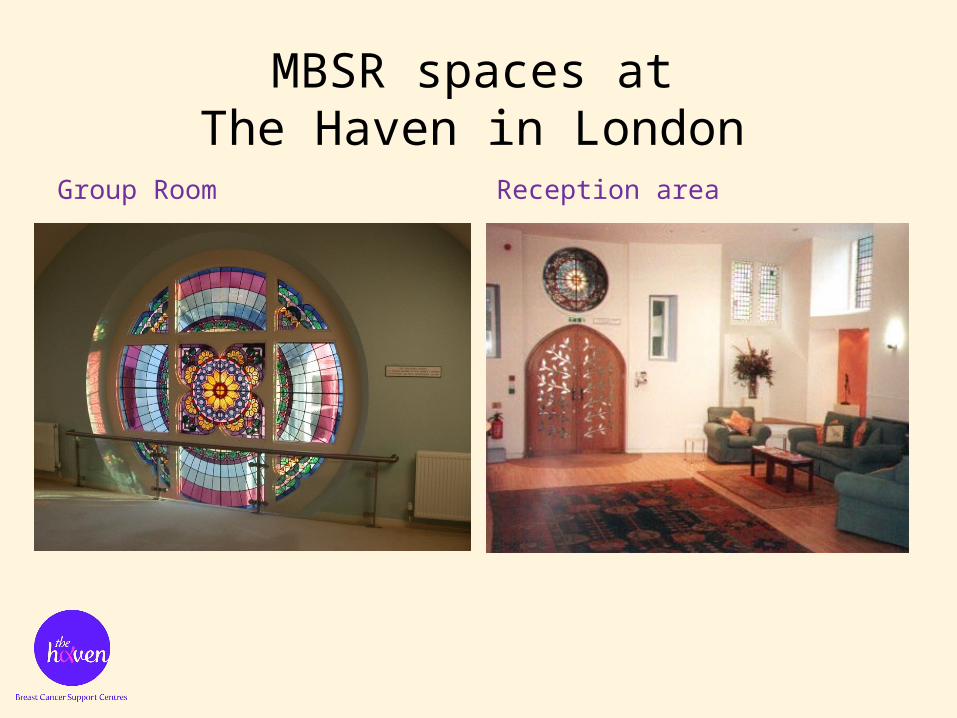
MBSR spaces atThe Haven in London
Group Room Reception area
Home Practice
• Home Practice Manual included photos of stretching exercises, meditation sitting positions, information on stress, some stories, exercises, tips
• 4 x 45 minute CDs: Mindful Body Scan, Mindful Lying Stretches, Mindful Sitting Meditation, Mindful Standing Stretches
• Home practice sheets
• Record of formal home mindfulness practice
Profile of mood states (POMS) (primary outcome)
• Total Mood Disturbance
• Subscales Anxiety
Depression
Anger
Vigour
Fatigue
Confusion
POMSOutcome measure mean (SD) Intervention
(N=103)Control (N=111)
MeanDifference +p value
CI (95%) for difference
T1 Total Mood Disturbance 43.65 (34.73) 49.23 (39.37) N=110
T3 Confusion-Bewilderment 8.24 (5.32) 9.64 (4.79) -1.4* -2.76, -0.40
T1 = weeks -2 to 0, T2 = weeks 8 to 10, T3 = weeks 12 to 14*p<0.05, **p<0.01, *** p<0.001
FACT - quality of life measure
FACT-B (breast) and FACT ES (endocrine symptoms)Subscales:• Physical wellbeing• Social and family wellbeing• Emotional wellbeing• Functional wellbeing• Breast-specific subscale (B)• Endocrine-specific subscale (ES)
T3 FWB 19.45 (5.32) 17.53 (5.37) N=110 1.92** 0.47, 3.37
T1 = weeks -2 to 0, T2 = weeks 8 to 10, T3 = weeks 12 to 14*p<0.05, **p<0.01, *** p<0.001
Minimally important differences scores (MIDs) for FACT
ScalesMIDs score Reference:
Clinically significant range for MIDs
T2 FACT-B 7* 7-8
T3 FACT-B 8*
T2 FACT-B TOI 5* 5-6
T3 FACT-B TOI 5*
T2 Breast subscale 0 2-3
T3 Breast subscale 0
* denotes significant valuesT1= weeks -2 to 0, T2= weeks 8 to 10, T3 = weeks 12 to 14
WHO 5-item wellbeing questionnaire
For each of the five statements below, please put a circle round one number, which is closest to how you have been feeling over the last week. Notice that the higher numbers mean better well-being.
Over the last week All the time Most of the time
More than half of the time
Less than half of the time
Some of the time
At no time
I feel cheerful and in good spirits
5 4 3 2 1 0
I feel calm and relaxed
5 4 3 2 1 0
I feel active and vigorous
5 4 3 2 1 0
I wake up feeling fresh and rested
5 4 3 2 1 0
My daily life is filled with things that interest me
5 4 3 2 1 0
Scores for WHO-5 wellbeing questionnaire
WHO 5-item wellbeing questionnaire mean
(SD) % score
Intervention(N=102)
Control(N=110)
Mean difference and p value
CI (95%) for difference
T1 WHO-5 13.04 (4.48) 52.2%
12.53 (4.68) 50.1%
0.09
T2 WHO-5 14.91 (4.23) 59.6%
12.59 (4.92) 50.4%
2.32*** 1.06, 3.56
T3 WHO-5 15.08 (4.61) 60.3%
12.64 (4.30) 50.6%
2.44*** 1.23, 3.64
T1 = weeks -2 to 0, T2 = weeks 8 to 10, T3 = weeks 12 to 14*p<0.05, **p<0.01, *** p<0.001
Clinical significance for WHO-5
WHO-5 mean (SD) % score
Intervention (N=102)
Control (N=110) Level of clinical significance in % (changes of ≥10% are significant)
T1 WHO-5 52.2% 50.1% 1.1%
T2 WHO-5 59.6% 50.4% 9.2%
T3 WHO-5 60.3% 50.6% 9.7%
T1 = weeks -2 to 0, T2 = weeks 8 to 10, T3 = weeks 12 to 14
Measurements of illness stress and life stress
• How difficult or stressful is your illness for you at the moment?
• Apart from your illness, have you had any recent events in your life which has affected you strongly or been particularly stressful?
Perceptions of difficulty or stress caused by breast cancer
(independent sample t-tests)
Intervention Group Means (SD)
Control GroupMeans (SD)
Mean difference
and p value
CI 95% for difference
T1 4.20 (2.03) (N=105)
4.11 (2.24) (N=110)
0.09 -0.48, 0.67
T2 3.28 (2.20)(N=92)
3.98 (2.24)(N=104)
-0.7** -1.32, -0.07
T3 2.63 (1.94)(N=86)
3.64 (2.24)(N=94)
-1.01*** -1.63, -0.40
*p<0.05, **p<0.01, *** p<0.001
T1 = weeks -2 to 0, T2 = weeks 8 to 10, T3 = weeks 12 to 14
Perceptions of difficulty or stress from other live events did not give significant results.
Themes from qualitative data (intervention group only)
Main themes (N = 92) (%)
More mindful 92 (100%)
Being calmer, centred, at peace, connected and more confident 30 (32.6%)
The value and challenges of mindfulness practice 28 (30.4%)
Being more aware 27 (29.3%)
Coping with stress, anxiety and panic 27 (29.3%)
Accepting things as they are, being less judgemental of myself and others
18 (19.6%)
Improved communication and personal relationships 16 (17.4%)
Making time and creating space for myself 15 (16.3%)
‘Great to be supported through a difficult time and this (MBSR) has truly been a gift that I will always have and I think not only support me, but my family and friends because I will be in a better place’
How mindfulness helped with pain, stress and anxiety
• ‘I at first wondered if the programme was for me. After the first session, I was in tears, but Caroline convinced me to continue with the body scan and I did. It has helped me greatly with my pain (peripheral neuropathy for 18 months). Other practices have helped me with daily stress and remaining calm’
• More aware now of anxious thoughts and their effects on the body. Aware of when I am reacting to thoughts in a stressed and anxious manner.


![Mathias Schardt, JOANNEUM Research, Co-ordinator EUFODOS ... · Mathias Schardt, JOANNEUM Research, Co-ordinator . EUFODOS: ... Project Co -ordinator ... Vertikale Struktur[cm] Profil](https://static.documents.pub/doc/80x56/5b5b9e887f8b9a905c8e6992/mathias-schardt-joanneum-research-co-ordinator-eufodos-mathias-schardt.jpg)


