Mineral Metabolism in ESRD Mineral Metabolism in ESRD Dr. Gordon Wong Dr. Gordon Wong The Credit Valley Hospital The Credit Valley Hospital May 12, 2007 May 12, 2007 THE GOOD, THE BAD AND THE
Transcript
Mineral Metabolism in ESRDMineral Metabolism in ESRD
Dr. Gordon WongDr. Gordon WongThe Credit Valley Hospital The Credit Valley Hospital May 12, 2007May 12, 2007
THE GOOD, THE BAD AND THE
As Kidney Function Declines, As Kidney Function Declines, Secondary HPT DevelopsSecondary HPT Develops
0
5.5
11
18
22
100+
90–9
980
–89
70–7
960
–69
50–5
940
–49
30–3
920
–29
10–1
9
CrCl (mL/min)
pmol
/L0.5
0.75
1.0
1.25
1.5
100+
90–9
980
–89
70–7
960
–69
50–5
940
–49
30–3
920
–29
10–1
9
CrCl (mL/min)
mm
ol/L
Ionized Calcium
Martinez I et al. Martinez I et al. Am J Kidney Am J Kidney DisDis 1997;29:4961997;29:496--502.502.
iPTH
*
**
*p<0.05, compared to CrCl ≥ 50 mL/min
Phosphorus
CaP
PTH
1,25-OH Vit D3
Renal insufficiency:Renal insufficiency:
P excretion
Ca absorptionPO4 absorption
PathophysiologyPathophysiology of Secondary HPT in CKDof Secondary HPT in CKD
Ca2+
PO43-
KidneyDisease
PTH
SystemicToxicity
BoneDisease
PTH
Vit. D
Adapted from Skorecki K et al. In: Harrison’s Principles of Internal Medicine. 15th ed. 2002:1551-1562.
Renal Bone Disease: Histology Peritoneal Dialysis Renal Bone Disease: Histology Peritoneal Dialysis
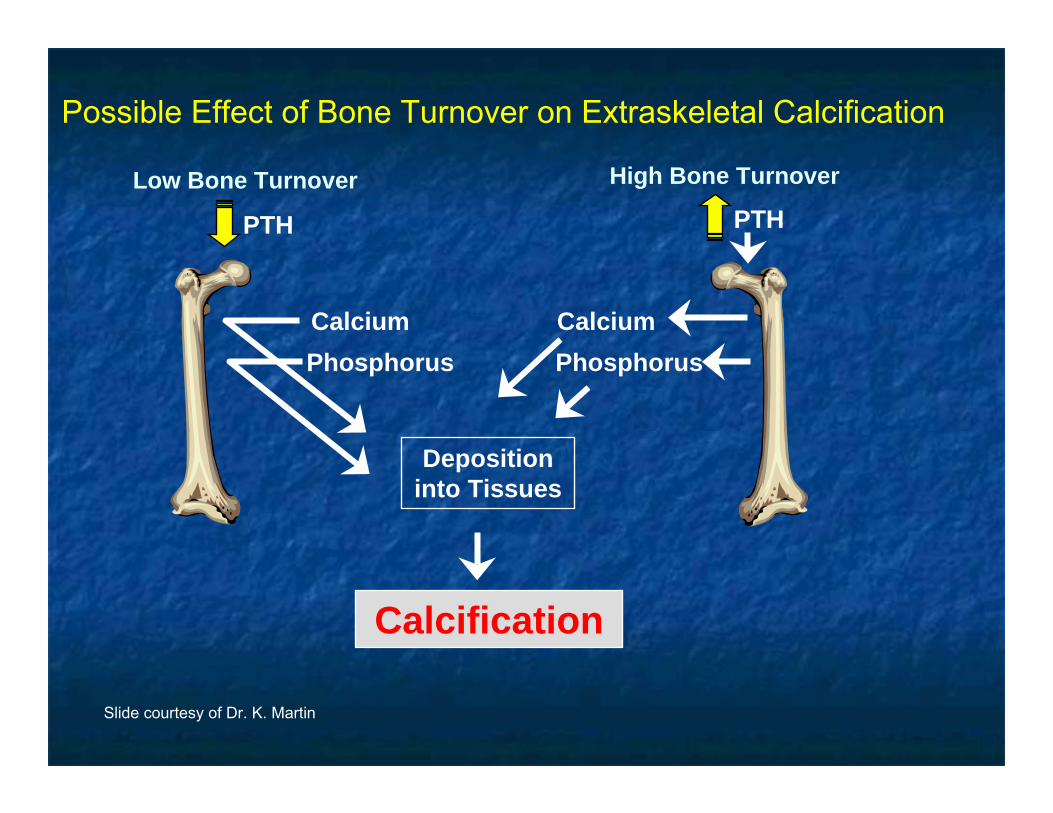
Possible Effect of Bone Turnover on Extraskeletal Calcification
Slide courtesy of Dr. K. Martin
Vascular CalcificationVascular Calcification
Passive ProcessPassive ProcessAltered mineral metabolism due Altered mineral metabolism due to CRFto CRFA component of generalized soft A component of generalized soft tissue and visceral calcificationtissue and visceral calcificationMedial wall calcificationMedial wall calcificationAmorphous deposition of Amorphous deposition of calcium and phosphoruscalcium and phosphorusCalcium oxalateCalcium oxalate
Active / Regulated ProcessActive / Regulated ProcessRegulated or modulated by Regulated or modulated by genetic factorsgenetic factorsProteins involved in bone and Proteins involved in bone and mineral metabolism are mineral metabolism are expressed in calcified vascular expressed in calcified vascular lesionslesionsBoth Both intimalintimal and medial wall and medial wall calcificationcalcificationOsteocalcinOsteocalcin, matrix GLA protein, , matrix GLA protein, PTHrPPTHrPHydroxyapatiteHydroxyapatiteVSMC may assume VSMC may assume characteristics of characteristics of osteoblastosteoblast--like like cells cells in vitroin vitro
Ketteler, Kidney International (2006) 70, S5–S9.
+
+ + PO4
CBfa1BMP2
ALP
Osteocalcin
Osteonectin
Leptin
Collagen IFibronectin
LDLox
TNF-α
Dexamethasone
Klotho-/-
PTH 7-84
++++
+
++
++
+
+
Vit D3Ca
+Oncostatin
-
Osteoprotegerin
MGPOsteopontin
BMP7Collagen IV
Fetuin
PTHrP PTH 1-34
-- -
-- -
-
-
Inductors (+) and Inhibitors (-) of Vascular Calcifications
pyrophosphate
+
Molecular Mechanisms of Vascular CalcificationMolecular Mechanisms of Vascular CalcificationFour TheoriesFour Theories
Speer MY & Giachelli M. Cardiovascular Pathology 2004;13:63-70.
Vascular Calcification
1. Loss of Inhibition• MGP• OPN• Fetuin-A/α2-HS glycoprotein• Pyrophosphate• Others
2. Induction of Bone Formation• Vascular
osteoblast/chromdrocyte-like cells
3. Circulating nucleational complexes
4. Cell Death
HyperphosphatemiaHypercalcemia
Ca X Pi
Ca/Pi loadedMatrix vesicles
Apoptoticbodies
BisphosphonatesOPGRemodeling bone
•Pi•Lipids•Inflammatory Cytokines•Others
Vascular Calcification is a Regulated ProcessVascular Calcification is a Regulated Process
Adapted from Derici U et al. Semin Dial 2006;19:60–68
Mechanisms of transdifferentiation of vascular smooth muscle cells by uraemic conditions (in vivo and in vitro):
VSMC with osteoblastic phenotypeHydroxyapatite
Calcification activators
Osteoblastic differentiation
Calcificationinhibitors
Apoptosis of vascular smooth muscle cells
(VSMC)
Mineral imbalance
Calcifying cells
Nucleation by hydroxyapatite vesicles
Identifying those at riskIdentifying those at risk
Association Between Serum Phosphorus and AllAssociation Between Serum Phosphorus and All--Cause and Cardiac MortalityCause and Cardiac Mortality
DOPPS I data (1996-2000). Model stratified by country, corrected for facility clustering, and adjusted for age, race, gender, years with ESRD, BMI, 14 summary comorbid conditions, dialysate calcium, serum albumin, iPTH, albumin-corrected calcium, vitamin D use, phosphate binder use, and prior parathyroidectomy. n= 14,298.
Association Between AlbuminAssociation Between Albumin--Corrected Calcium Corrected Calcium and Alland All--Cause and Cardiac MortalityCause and Cardiac Mortality
DOPPS I data (1996-2000). Model stratified by country, corrected for facility clustering, and adjusted for age, race, gender, years with ESRD, BMI, 14 summary comorbid conditions, dialysate calcium, serum iPTH, phosphorus, albumin, vitamin D use, phosphate binder use, and prior parathyroidectomy. n= 12,114.
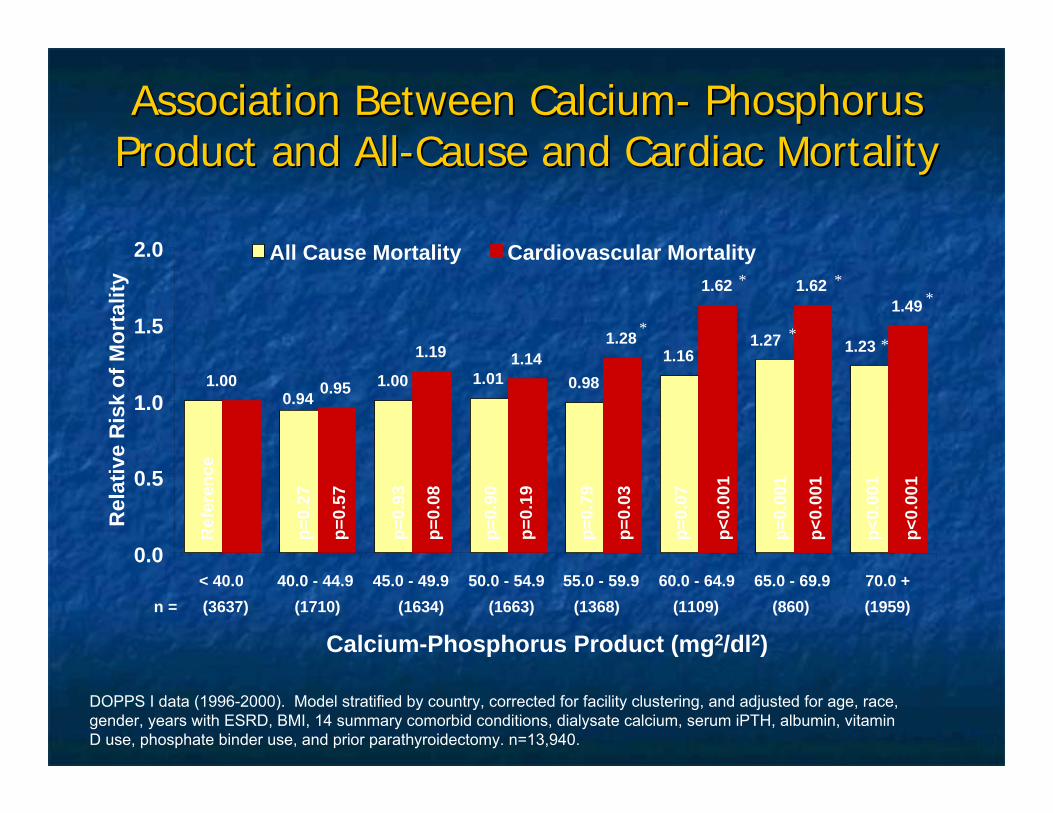
Association Between CalciumAssociation Between Calcium-- Phosphorus Phosphorus Product and AllProduct and All--Cause and Cardiac MortalityCause and Cardiac Mortality
Calcium-Phosphorus Product (mg2/dl2)
DOPPS I data (1996-2000). Model stratified by country, corrected for facility clustering, and adjusted for age, race, gender, years with ESRD, BMI, 14 summary comorbid conditions, dialysate calcium, serum iPTH, albumin, vitamin D use, phosphate binder use, and prior parathyroidectomy. n=13,940.
Association Between Intact PTH (Association Between Intact PTH (iPTHiPTH) ) and Alland All--Cause and Cardiac MortalityCause and Cardiac Mortality
iPTH (pmol/l)
DOPPS I data (1996-2000). Model stratified by country, corrected for facility clustering, and adjusted for age, race, gender, years with ESRD, BMI, 14 summary comorbid conditions, dialysate calcium, serum albumin, phosphorus, albumin-corrected calcium, vitamin D use, phosphate binder use, and prior parathyroidectomy. n=8,638.
Conventional units Conventional units (mg/(mg/dLdL))
CSN 2006CSN 2006KDOQIKDOQI
CSN targets might lead to worse Canadian performance compared to KDOQI.
Number of Mineral Metabolism Target Number of Mineral Metabolism Target Levels Achieved, by CountryLevels Achieved, by Country
Patients (%) within targets
Country
DOPPS II data (2002-04), among prevalent cross-section of patients with reported values for all four measures, n=4687
# TargetsAchieved
4
3
2
1
022 12 13 19 15 12 16 21 22 25 17
2424 19
28 28 23 2225 27 28
24
2835 40
28 29 32 2833 32 30
30
22 21 22 20 22 26 2817 23
8 7 7 7 6 718 14
4 4 2 35
0
20
40
60
80
100
Australia-New
Zealand
BelgiumCanadaFranceGermany Italy Japan Spain Sweden UK US
Projected Number of PatientProjected Number of Patient--years Saved for all Hemodialysis years Saved for all Hemodialysis Patients Who Attained the Best Targets According to the Patients Who Attained the Best Targets According to the Guidelines Practiced in Canada: Projected for the Next 5 Guidelines Practiced in Canada: Projected for the Next 5
years (2006years (2006--2010)2010)
13,49213,4923,43,4
((15.7%15.7%))4,3574,357((5.1%5.1%))
8,3028,302((9.6%9.6%))
920920((1.1%1.1%))
1,0261,026((1.2%1.2%))
1,5961,596((1.9%1.9%))
401401((0.5%0.5%))
--Patient years Patient years gained if 100% gained if 100% within targets (% within targets (% of total years)of total years)55
99,63799,63790,50190,50194,44694,44687,06487,06487,17187,17187,74087,74086,54586,54586,14486,144Patient years Patient years (total)(total)
0.1010.1010.1520.1520.1290.1290.1740.1740.1730.1730.1700.1700.1770.1770.1800.180Annual death rate Annual death rate (per patient year)(per patient year)
TotalTotal11(sum of 1(sum of 1--6)6)
66Facility Facility cathetecatheter ≤r ≤10%10%
55AlbumAlbum
in in ≥≥40 40 g/Lg/L
44CalciumCalcium2.22.2--2.6 2.6 mmol/Lmmol/L
33POPO44
0.80.8--1.8 1.8
mmol/Lmmol/L
22HbHb≥≥110 110 g/Lg/L
11Kt/VKt/V≥≥1.21.2
CurreCurrent nt
statiststatisticsics
MeasureMeasure
Nephrology News and Issues (NN&I) (21:5:69-85, 2007).
TreatmentTreatment
Treatment overview:Treatment overview:
dietary POdietary PO44 restrictionrestrictionPOPO44 removal via dialysisremoval via dialysisPOPO44 bindersbindersvitamin D supplementationvitamin D supplementationcalcimimeticscalcimimetics
Treatment:Treatment:
dietary protein intake of 1 dietary protein intake of 1 -- 1.2 g/kg/day 1.2 g/kg/day results in a P load of ~ 1 g/day or ~ 7 g/wk results in a P load of ~ 1 g/day or ~ 7 g/wk of which 60% is actually absorbed ~ 4 g/wkof which 60% is actually absorbed ~ 4 g/wkHD will remove ~ 3 g/wkHD will remove ~ 3 g/wkPD will remove ~ 2 g/wkPD will remove ~ 2 g/wkPOPO44 binders are critical in managementbinders are critical in management
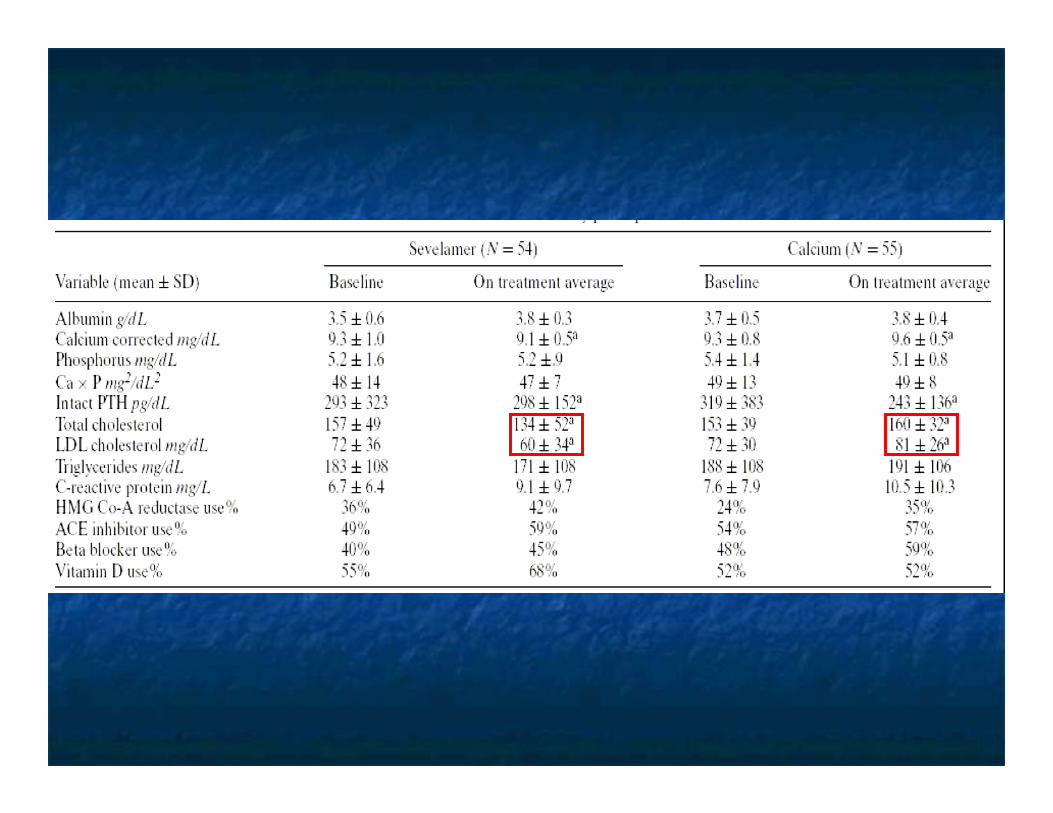
SevelamerSevelamer: effect on coronary : effect on coronary calcificationcalcification
129 pts new to 129 pts new to hemodialysishemodialysissevelamer vs sevelamer vs Ca containing P binderCa containing P binderEBCT baseline, 6 months, 12 months, EBCT baseline, 6 months, 12 months, 18 months18 months*** at baseline 37% of *** at baseline 37% of sevelamer sevelamer treated pts had no detectable coronary treated pts had no detectable coronary lesions lesions vs vs 31% in Ca group (no 31% in Ca group (no comment as to statistical significance)comment as to statistical significance)
Block, Kidney International, Vol. 68 (2005), pp. 1815–1824
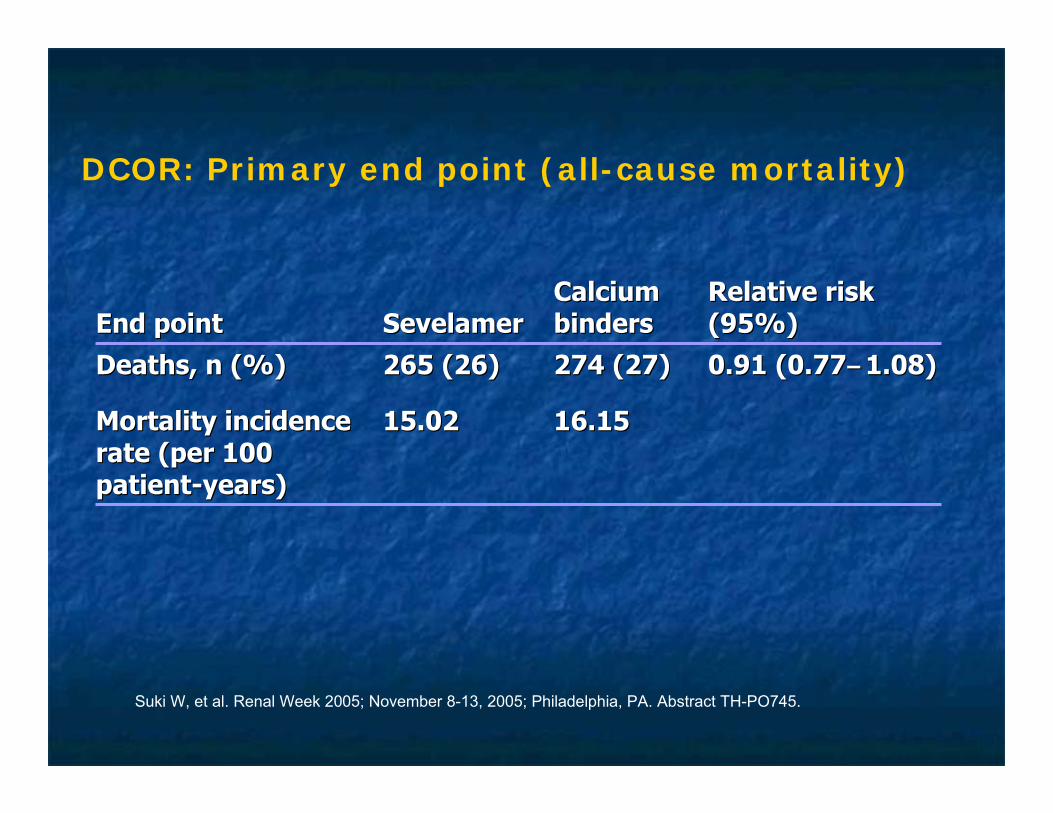
2100 HD pts2100 HD ptsopen label open label sevelamer vs sevelamer vs Ca based bindersCa based bindersf/u 45 monthsf/u 45 monthsprimary endpoint: all cause mortalityprimary endpoint: all cause mortality
Suki W, et al. Renal Week 2005; November 8-13, 2005; Philadelphia, PA. Abstract TH-PO745.
Suki W, et al. Renal Week 2005; November 8-13, 2005; Philadelphia, PA. Abstract TH-PO745.
Lanthanum carbonateLanthanum carbonate is a high affinity phosphate is a high affinity phosphate binder binder in vivoin vivo
Adapted from: Damment SJP, Webster I. Poster presented at ASN 2003Hutchison A. Nephrol Dial Transplant 2004;19 Suppl 1:i19–24
Time on treatment (weeks)
Urin
e ph
osph
orus
exc
retio
n(m
mol
/24
h)
0
0.3
0.4
0.5
0.6
0.8
–3 –2 –1 0 1 2 6
0.1
0.2
3 4 5
0.7 5/6th nephrectomized rat model
Vehicle
CaCO3
AIOH3
Lanthanum carbonate
Sevelamer HCL
Adverse events versus standard therapyAdverse events versus standard therapyPercentage of patients with adverse eventPercentage of patients with adverse eventAdverse eventAdverse event
SensiparSensipar™ Consistently Improved All ™ Consistently Improved All Secondary HPT Endpoints in Phase III TrialsSecondary HPT Endpoints in Phase III Trials
*TARGETS: iPTH 150 - 300 pg/mL (16.5 - 33 pmol/L), Ca x P < 55 mg2/dL2 (< 4.5 mmol2/L2), Ca 8.4–9.5 mg/dL (2.1-2.4 mmol/L), P 3.5–5.5 mg/dL (1.1-1.8 mmol/L)
Clinical Outcomes with Clinical Outcomes with CinacalcetCinacalcet::
Combined analysis of safety dataCombined analysis of safety dataParathyroidectomyParathyroidectomy, fracture, hospitalisations and , fracture, hospitalisations and mortalitymortality
Methods:Methods:Database: 1184 patients (697 Database: 1184 patients (697 cinacalcetcinacalcet, 487 control), 487 control)4 similarly designed randomised, double4 similarly designed randomised, double--blind, blind, placeboplacebo--controlled clinical trialscontrolled clinical trialsCinacalcetCinacalcet or placebo administered to patients or placebo administered to patients receiving standard care (phosphate binders and receiving standard care (phosphate binders and vitamin D) for SHPT vitamin D) for SHPT Relative risk assessment with followRelative risk assessment with follow--up times from 6 up times from 6 to 12 monthsto 12 months
Adapted from Cunningham J et al. Kidney Int 2005
Reduction in the Risk of Reduction in the Risk of ParathyroidectomyParathyroidectomy with with
CinacalcetCinacalcet
* Refers to the risk that an event does not occur Adapted from Cunningham J et al. Kidney Int 2005
Standard therapyStandard therapy + cinacalcet
Week
Even
t-fre
e Pr
obab
ility
*
0 4 8 12 16 20 24 28 32 36 40 44 48 52
0.90
0.95
1.00
93% RRR
p < 0.009
0.3 (cinacalcet) vs. 4.1 (control) parathyroidectomies per 100 patient years (p < 0.01)
Reduced Risk of Fracture with Reduced Risk of Fracture with CinacalcetCinacalcet
* Refers to the risk that an event does not occur Adapted from Cunningham J et al. Kidney Int 2005
Week
Even
t-fre
e Pr
obab
ility
*
0.90
0.95
1.00
4 8 12 16 20 24 28 32 36 40 44 48 520
Standard therapyStandard therapy + cinacalcet
54% RRR
p < 0.04
Patients treated with cinacalcet had a significant reduction in fracture rate compared to control - 3.2 vs. 6.9 fractures per 100 patient years (p < 0.05)
Reduced CV Reduced CV HospitalizationHospitalizationRates with Rates with CinacalcetCinacalcet
Standard therapyStandard therapy + cinacalcet
Week
Even
t-fre
e Pr
obab
ility
*
0.75
0.80
0.85
0.90
0.95
1.00
0 4 8 12 16 20 24 28 32 36 40 44 48 52
39% RRR
p < 0.005
* Refers to the risk that an event does not occur Adapted from Cunningham J et al. Kidney Int 2005
Patients treated with cinacalcet had a significant reduction in CV hospitalization rates compared to control – 15.0 vs. 19.7 hospitalizations per 100 patient years (p < 0.01)
Reduction
Slight Reduction
No effect
Increase
iPTHiPTH
Non CaNon Ca--based based POPO44 bindersbinders
CaCa--basedbasedPOPO44 bindersbinders
CinacalcetCinacalcet HClHCl
Vitamin DVitamin D
Ca Ca xx PPCaCaPPAgentAgent
Effects of Drug Therapies on Effects of Drug Therapies on Bone/Mineral ParametersBone/Mineral Parameters
Summary:Summary:
CVD is the major cause of mortality in CVD is the major cause of mortality in ESRDESRD
vascular calcification is largely attributable vascular calcification is largely attributable to disordered mineral metabolismto disordered mineral metabolism
therapeutic strategies are evolvingtherapeutic strategies are evolving


![Comprehensive ESRD Care Initiative LDO Model€¦ · Comprehensive ESRD Care Initiative LDO Model . July [15], 2015 . ... Comprehensive ESRD Care Initiative Participation Agreement](https://static.documents.pub/doc/80x56/5af2cc657f8b9a95468ba91b/comprehensive-esrd-care-initiative-ldo-model-comprehensive-esrd-care-initiative.jpg)


