Page 1
The Federal Institute for Geosciences and Natural Resources is the central geoscientific authority providing advice to the German Federal Government in all geo-relevant questions. It is subordinate to the Federal Ministry for Economic Affairs and Energy (BMWi).
Mineral Resources for Future Technologies
IV. Deutsch-Peruanisches Rohstoffforum „Mining 4.0.“, Lima, Peru
Dr. Peter Buchholz
Head, German Mineral Resources Agency (DERA)
Federal Institute for Geosciences and Natural Resources (BGR)
Page 2
The Federal Institute for Geosciences and Natural Resources is the central geoscientific authority providing advice to the German Federal Government in all geo-relevant questions. It is subordinate to the Federal Ministry for Economic Affairs and Energy (BMWi).
2
Modern products contain thewhole periodic system of
elements!
A secure and sustainalblesupply of minerals is
essential!
Page 3
DigitalizationCu, Ge, Ga, Ag, Au, Ta ….
© Fotolia.com
Page 4
4Rio Tinto foto library©jamesteohart - Fotolia.com
Smart Cities – 5GCu, Ge, Ga, As, Ag, Au, Ta ….
Page 5
Smart CitiesCu, Ge, Ga, Ag, Au, Ta ….
5 ©Gorodenkoff - Fotolia.com
Industry 4.0 – Virtual RealityCu, Ge, Ga, Ag, Au, Ta ….
Page 6
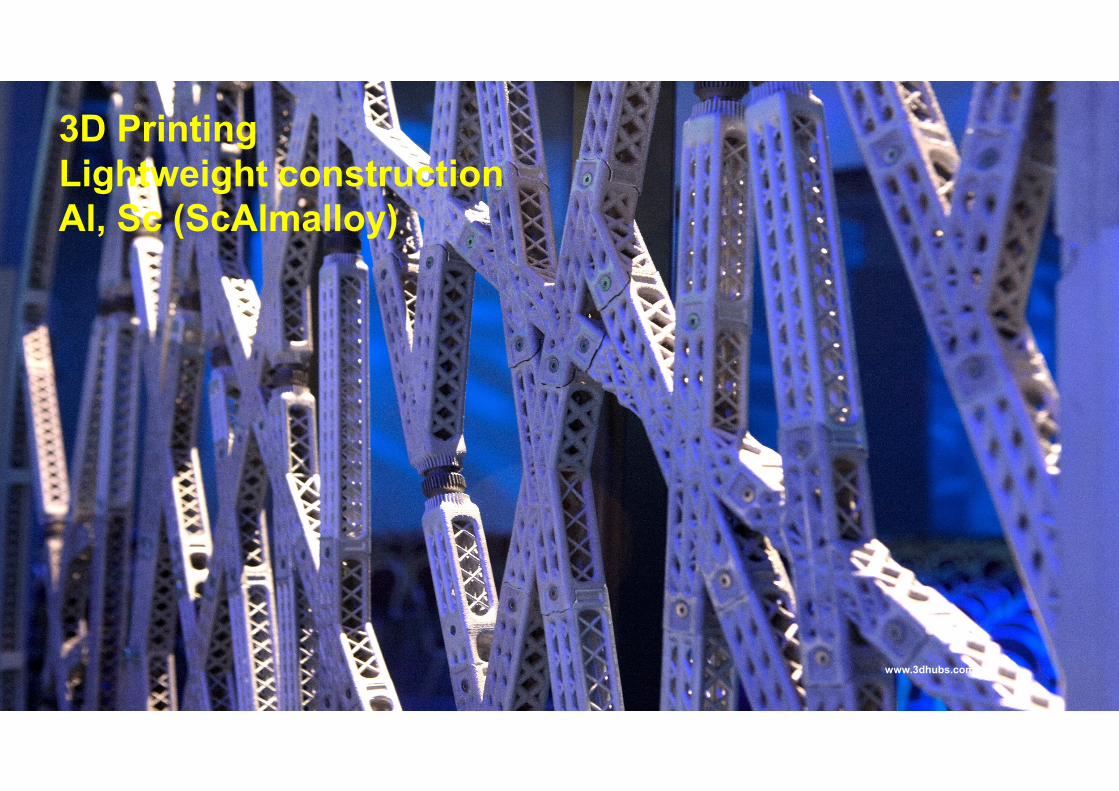
Scalmalloy – Scandium-Magnesium-Aluminium-Legierung
www.3dhubs.com
3D PrintingLightweight constructionAl, Sc (ScAlmalloy)
Page 7
7
©metamorworks - Fotolia.com
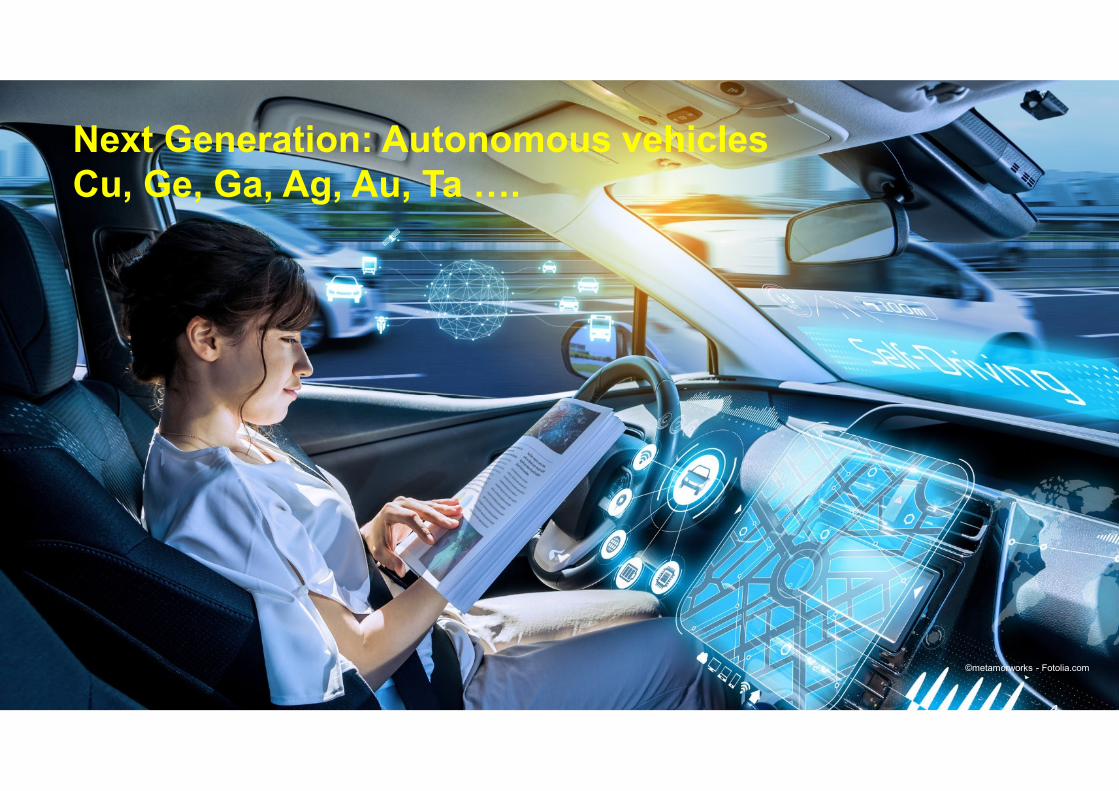
Next Generation: Autonomous vehiclesCu, Ge, Ga, Ag, Au, Ta ….
Page 8
8
©malp - Fotolia.com
Next Generation: Hyperloop?Carbon fibre, composites, steel, cement, Cu, Zn …
Page 9
9
source: fotalia
E-mobilityLi, Co, Ni, Mn, Graphite
Page 10
Ne
w v
eh
icle
reg
istr
atio
ns
[mill
ion
]
2018: 97 Mio. vehicles incl. ≈ 2,1 Mio. Electric Vehicles ≈ 125 GWh
Raw material demand forbatteries in electric vehicles2017
Lithium 11,700 t(� 24.5%)
Cobalt 14,500 t(� 12.2%)
Manganese 12,900 t(� 6.1%)
Nickel 32,900 t(� 1.6%)
Due to the different types of batteries in electric vehicles and the lack of data, the data on demand are only rough estimates.
E-mobility
New electric vehicle registration 2017 (1,3 Mio. Units) Estimated raw material demand for batteries:
Share of total raw material demand 2017
Graphit 37.000 t(� 3.2%)
New E-Vehicles Registrations
http://www.ev-volumes.com/country/total-world-plug-in-vehicle-volumes/
https://www.acea.be/statistics/tag/category/key-figures
Page 11
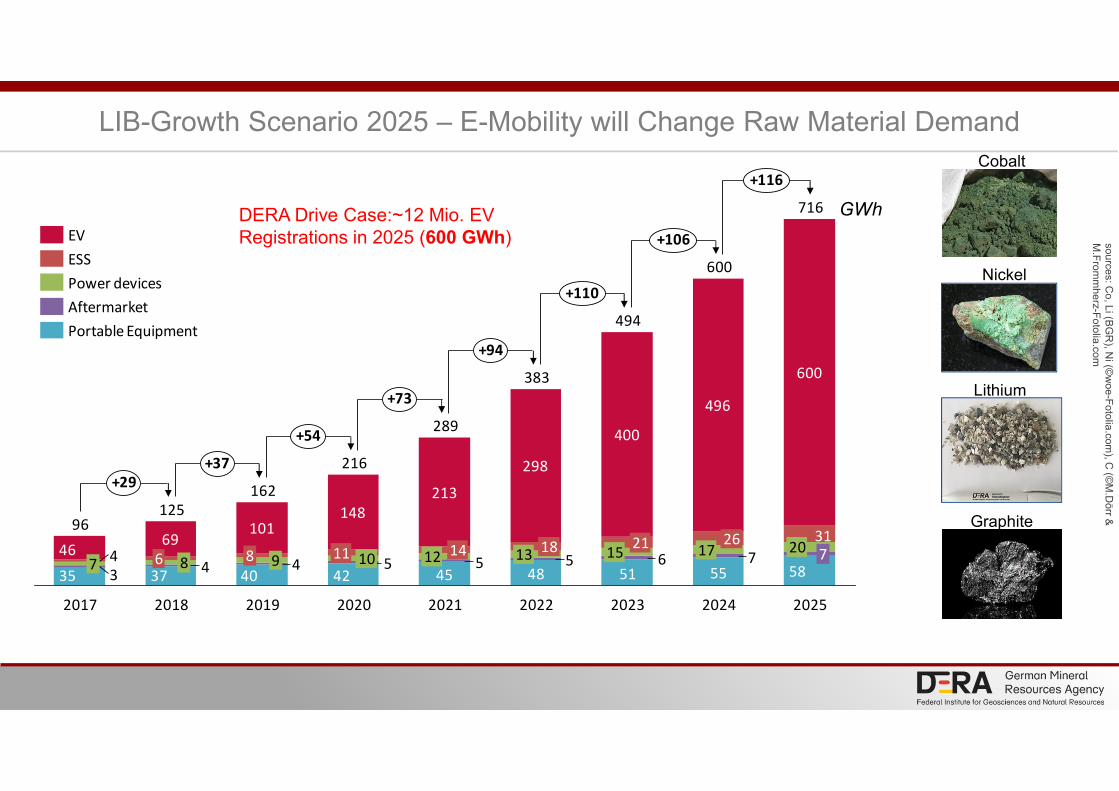
LIB-Growth Scenario 2025 – E-Mobility will Change Raw Material Demand
69101
148
213
298
400
496
600
585548 514542403735655544
374
3146
2022
383
1318
2021
289
12 14
2020
216
1011
+54
+37
+29
2025
716
720
2024
600
1726
2023
494
1521
+116
+106
+110
+94
+73
2019
162
98
2018
125
86
2017
96
7
ESS
Portable Equipment
Aftermarket
Power devices
EV
GWh
Cobalt
Lithium
Nickel
Graphite
so
urc
es: C
o, L
i (BG
R), N
i (©w
oe
-Fo
tolia
.com
), C (©
M.D
örr
&
M.F
rom
mh
erz-F
oto
lia.c
om
DERA Drive Case:~12 Mio. EV Registrations in 2025 (600 GWh)
Page 12
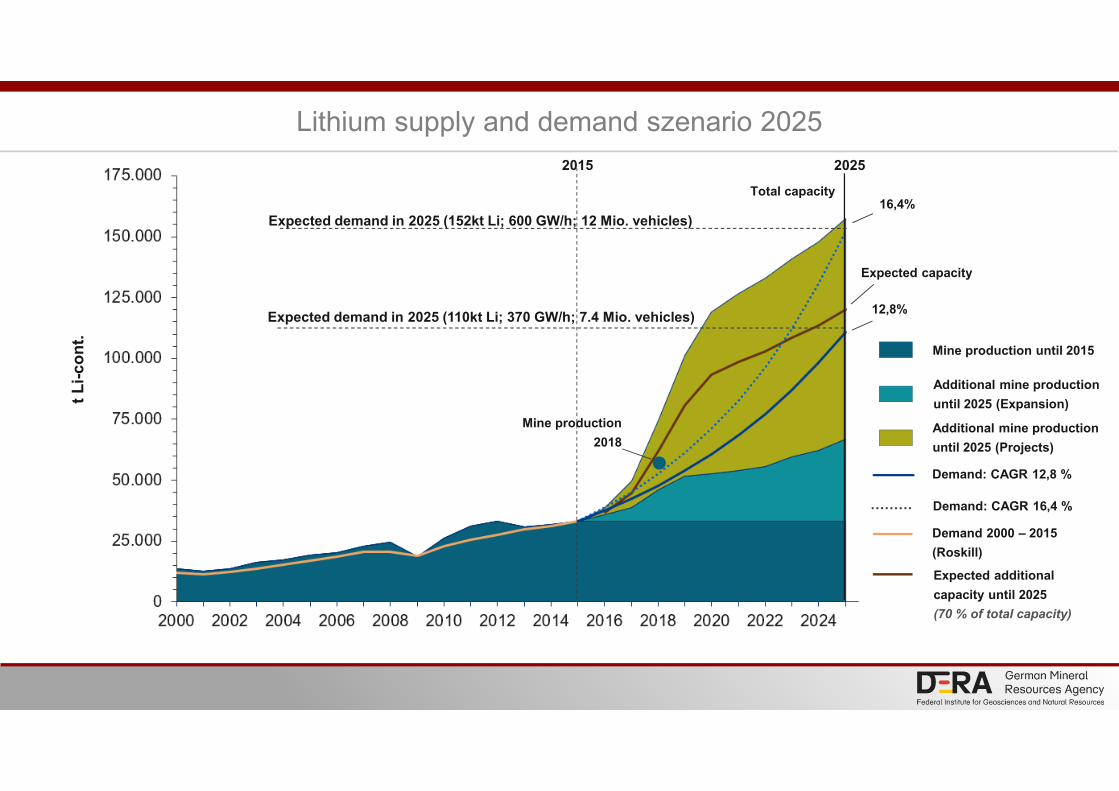
t L
i-c
on
t.
Expected demand in 2025 (152kt Li; 600 GW/h; 12 Mio. vehicles)
2025
12,8%
Expected capacity
Total capacity16,4%
Demand: CAGR 12,8 %
Additional mine production
until 2025 (Expansion)
Mine production until 2015
Demand 2000 – 2015
(Roskill)
Expected additional
capacity until 2025
(70 % of total capacity)
Additional mine production
until 2025 (Projects)
Demand: CAGR 16,4 %
Mine production
2018
2015
Expected demand in 2025 (110kt Li; 370 GW/h; 7.4 Mio. vehicles)
Lithium supply and demand szenario 2025
Page 13
13
Lithium supply
Source: S&P SNL database
Lithium production 2018, total cash costs, US$/t LCE
Australia
Chile
5,000 US$/LCE
Page 14
European Developments
Source: Infinity Lithium 2019
Page 15
European Developments
Source: Infinity Lithium 2019
Page 16
European Lithium-Ion Battery Supply Chain
Source: Infinity Lithium 2019
Page 17
17
Renewable energy
Page 18
18
Wind power
Quelle: fotolia
Page 19
0
100.000
200.000
300.000
400.000
500.000
600.000Raw material demand for wind turbines 2017
Iron6.8 mio. t(� 0.6%)
Copper 150,000 t(� 0.8%)
Aluminium 150,000 t(� 0.3%)
Chrome 71,500 t(� 0.2%)
Nickel 52,500 t(� 2.4%)
Tin 11,700 t(� 3.2%)
Rare Earth 6,200 t(� 4.8%)
Global installed wind power capacity
Molybdenum 10,200 t(� 3.6%)
Due to the different types of windturbines and the lack of data, thedata on demand are only roughestimates.
Estimated raw material demand (50 GW) in 2017:
[MW]
Share of total raw material demand 2017
Wind energy
World Wind Energy Association 2019, Ren21 2019
1,200 to >2,000 GW expected for 2030
GWEC, Greenpeace International, German Aerospace Centre (DLR)
2018 = 591 GW
Page 20
Permanent magnetic motors for direct drive wind turbines in the offshore sector:
Use of NdFeB magnets, which may contain neodymium, dysprosium, terbium, or praseodymium…
Magnetic mass significantly higher than in other drive technologies
Average Content in Kg/MW
Technology Neodymium DysprosiumPraseodymium/
Terbium
Gear (high speed) 18.9 – 24.8 1.8 – 4.5 6.6
Gear (middle speed) 18.9 – 49.6 3.7 – 4.5 6.6
Direct Drive 101 – 211.4 13.2 – 30 35 – 44
REEProduction [t]
2013 Demand [t]
2013Estimated Demand [t]
2035
Neodymium/Praseodymium 36,600# low10,100
(3,800 – 17,600)
Dysprosium/Terbium 2,330# low500
(130 – 1,170)# Metal production calculated from REO; Fraunhofer ISI/DERA, 2016
Rare earths in (offshore) wind turbines
5-10 MW
Page 21
Permanent magnetic motors for direct drive wind turbines in the offshore sector:
Use of NdFeB magnets, which may contain neodymium, dysprosium, terbium, or praseodymium…
Magnetic mass significantly higher than in other drive technologies
Average Content in Kg/MW
Technology Neodymium DysprosiumPraseodymium/
Terbium
Gear (high speed) 18.9 – 24.8 1.8 – 4.5 6.6
Gear (middle speed) 18.9 – 49.6 3.7 – 4.5 6.6
Direct Drive 101 – 211.4 13.2 – 30 35 – 44
REEProduction [t]
2013 Demand [t]
2013Estimated Demand [t]
2035
Neodymium/Praseodymium 36,600# low10,100
(3,800 – 17,600)
Dysprosium/Terbium 2,330# low500
(130 – 1,170)
Rare earths in (offshore) wind turbines
5-10 MW
# Metal production calculated from REO; Fraunhofer ISI/DERA, 2016
Page 22
Permanent magnetic motors for direct drive wind turbines in the offshore sector:
Use of NdFeB magnets, which may contain neodymium, dysprosium, terbium, or praseodymium…
Magnetic mass significantly higher than in other drive technologies
Average Content in Kg/MW
Technology Neodymium DysprosiumPraseodymium/
Terbium
Gear (high speed) 18.9 – 24.8 1.8 – 4.5 6.6
Gear (middle speed) 18.9 – 49.6 3.7 – 4.5 6.6
Direct Drive 101 – 211.4 13.2 – 30 35 – 44
REEProduction [t]
2013 Demand [t]
2013Estimated Demand [t]
2035
Neodymium/Praseodymium 36,600# low10,100
(3,800 – 17,600)
Dysprosium/Terbium 2,330# low500
(130 – 1,170)
Rare earths in (offshore) wind turbines
5-10 MW
# Metal production calculated from REO; Fraunhofer ISI/DERA, 2016
Page 23
Brazil600 t REO
Russia2,600 t REO
Australia18,500 t REO
China~120,000 t REO
+ unofficial mining
Vietnam5,000 t REO
Malaysia? t SEO
Thailand1,000 t SEO
India~2,000 t SEO
Burundi700 t SEO
Myanmar15,000 t SEO
USA11,000 t REO
Mine production 2018: 175,000 t REO (without unofficial mining in China)China: 68%, Australia: 10.5%, Myanmar 9%, USA: 6%, Vietnam 2,7%, Russia: 1.5%
Rare earth production 2018 and trade
Page 24
Matikhal/Odisha
India: Aluva/Kerala
China
Malaysia: Kuantan
Japan
Russia: Solikamsk
Kazakhstan: Irtysh
Estonia: Sillamäe
Thailand
Vietnam: Thuan An
Quelle: EURARE 2017
Quelle: EURARE 2017
Rare Earth Separation Plantsoperating
HRE
projected
Rare earth processing
Page 25
25Source: fotolia
Solar power
- Thin film cells of amorphous andcrystall. Silicium
- Galliumarsenide cells (GaAs)- Cadmiumtelluride cells (CdTe)- CIS cells (Cu-In-Diselenide; Cu-In-Ga-
Diselenide)
Page 26
Raw material demand for solar power 2017
Iron17 mio. t(� 1.4%)
Copper 450,000 t(� 2.3%)
Tin 46,300 t(� 12.7%)
Lead 26,900 t(� 0.6%)
Zinc 3,000 t(� 0.1%)
Tellurium
Global installed solar power capacity
Cadmium
Due to the different types of photovoltaic systems and the lack of data, the data on demand are only rough estimates.
Newly installed capacity – 99 GW in 2017 Estimated raw material demand:[MW]
Share of total raw material demand 2017
Aluminium 3.5 mio. t(� 6.0%)
Selenium
0
100.000
200.000
300.000
400.000
500.000
Gallium
Indium
Solar energy
2018 = 505 GW
>1,100 GW expected in 2022
SolarPowerEurope, 2019
Ren21 2019
Page 27
https://www.deutsche-rohstoffagentur.de/DERA/DE/Downloads/zukunftstechnologien-zusammenfassung-en.pdf?__blob=publicationFile&v=5
MetalProduction
2013Demand
2013Demand
2035Factor Emerging technologies
Lithium 30,000 t 610 t 110,000 t 3.6Lithium-ion batteries, lightweight airframes
Heavy rare earths (Dy/Tb) 2,400 t 2,000 t 7,400 t 3.1 Magnets, e-cars, wind power
Rhenium 50 t 50 t 120 t 2.4 Super alloys
Light rare earths (Nd/Pr) 37,000 t 29,000 t 64,000 t 1.7 Magnets, e-cars, wind power
Tantalum 1,300 t 500 t 2,100 t 1.6Microcapacitors, medical technology
Scandium 7 t 1 t 9 t 1.3 SOFC fuel cells
Cobalt 130,000 t 5,000 t 120,000 t 0.9 Lithium-ion batteries, XtL.
Germanium 140 t 60 t 120 t 0.8 Fiber optic, IR technology
Platinum 190 t 0 t 110 t 0.6 Fuel cells, catalysts
Tin 290,000 t 180,000 t 150,000 t 0.5 Transparent electrodes, solders
Palladium 200 t 20 t 100 t 0.5 Catalysts, seawater desalination
Indium 800 t 230 t 360 t 0.5 Displays, thin layer photovoltaics
Gallium 350 t 90 t 130 t 0.4 Thin layer photovoltaics, IC, WLED
Silver 26,000 t 5,800 t 8,300 t 0.3 RFID
Copper 18,000,000 t 120,000 t 5,300,000 t 0.3 Electric motors, RFID
Titanium 240,000 t 9,000 t 41,000 t 0,2 Seawater desalination, implants
Minor Metals demand for emerging technologies, 2016
revised for 2025
Page 28
https://www.deutsche-rohstoffagentur.de/DERA/DE/Downloads/zukunftstechnologien-zusammenfassung-en.pdf?__blob=publicationFile&v=5
MetalProduction
2013Demand
2013Demand
2035Factor Emerging technologies
Lithium 30,000 t 610 t 110,000 t 3.6Lithium-ion batteries, lightweight airframes
Heavy rare earths (Dy/Tb) 2,400 t 2,000 t 7,400 t 3.1 Magnets, e-cars, wind power
Rhenium 50 t 50 t 120 t 2.4 Super alloys
Light rare earths (Nd/Pr) 37,000 t 29,000 t 64,000 t 1.7 Magnets, e-cars, wind power
Tantalum 1,300 t 500 t 2,100 t 1.6Microcapacitors, medical technology
Scandium 7 t 1 t 9 t 1.3 SOFC fuel cells
Cobalt 130,000 t 5,000 t 120,000 t 0.9 Lithium-ion batteries, XtL.
Germanium 140 t 60 t 120 t 0.8 Fiber optic, IR technology
Platinum 190 t 0 t 110 t 0.6 Fuel cells, catalysts
Tin 290,000 t 180,000 t 150,000 t 0.5 Transparent electrodes, solders
Palladium 200 t 20 t 100 t 0.5 Catalysts, seawater desalination
Indium 800 t 230 t 360 t 0.5 Displays, thin layer photovoltaics
Gallium 350 t 90 t 130 t 0.4 Thin layer photovoltaics, IC, WLED
Silver 26,000 t 5,800 t 8,300 t 0.3 RFID
Copper 18,000,000 t 120,000 t 5,300,000 t 0.3 Electric motors, RFID
Titanium 240,000 t 9,000 t 41,000 t 0,2 Seawater desalination, implants
Minor Metals demand for emerging technologies, 2016
revised for 2025
Page 29
https://www.deutsche-rohstoffagentur.de/DERA/DE/Downloads/zukunftstechnologien-zusammenfassung-en.pdf?__blob=publicationFile&v=5
MetalProduction
2013Demand
2013Demand
2035Factor Emerging technologies
Lithium 30,000 t 610 t 110,000 t 3.6Lithium-ion batteries, lightweight airframes
Heavy rare earths (Dy/Tb) 2,400 t 2,000 t 7,400 t 3.1 Magnets, e-cars, wind power
Rhenium 50 t 50 t 120 t 2.4 Super alloys
Light rare earths (Nd/Pr) 37,000 t 29,000 t 64,000 t 1.7 Magnets, e-cars, wind power
Tantalum 1,300 t 500 t 2,100 t 1.6Microcapacitors, medical technology
Scandium 7 t 1 t 9 t 1.3 SOFC fuel cells
Cobalt 130,000 t 5,000 t 120,000 t 0.9 Lithium-ion batteries, XtL.
Germanium 140 t 60 t 120 t 0.8 Fiber optic, IR technology
Platinum 190 t 0 t 110 t 0.6 Fuel cells, catalysts
Tin 290,000 t 180,000 t 150,000 t 0.5 Transparent electrodes, solders
Palladium 200 t 20 t 100 t 0.5 Catalysts, seawater desalination
Indium 800 t 230 t 360 t 0.5 Displays, thin layer photovoltaics
Gallium 350 t 90 t 130 t 0.4 Thin layer photovoltaics, IC, WLED
Silver 26,000 t 5,800 t 8,300 t 0.3 RFID
Copper 18,000,000 t 120,000 t 5,300,000 t 0.3 Electric motors, RFID
Titanium 240,000 t 9,000 t 41,000 t 0,2 Seawater desalination, implants
Minor Metals demand for emerging technologies, 2016
revised for 2025
Page 30
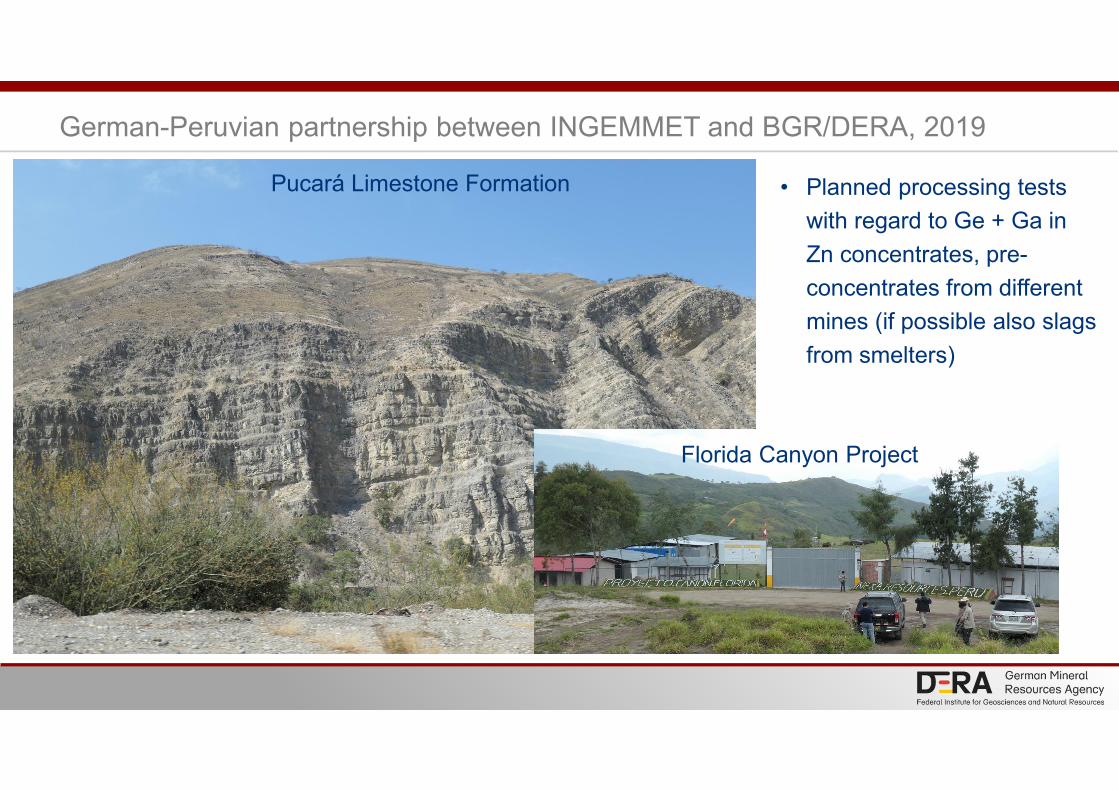
Pucará Limestone Formation
Florida Canyon Project
• Planned processing tests
with regard to Ge + Ga in
Zn concentrates, pre-
concentrates from different
mines (if possible also slags
from smelters)
German-Peruvian partnership between INGEMMET and BGR/DERA, 2019
Page 31
• 2019: Investigation of drill
cores in the Florida
Canyon Pb-Zn project
(Nexa Resources)
• Analytics of ores and
concentrates of the San
Vicente Pb-Zn mine (Co.
Minera San Ignacio)
German-Peruvian partnership between INGEMMET and BGR/DERA
Page 32
The Federal Institute for Geosciences and Natural Resources is the central geoscientific authority providing advice to the German Federal Government in all geo-relevant questions. It is subordinate to the Federal Ministry for Economic Affairs and Energy (BMWi).
Thank you very much!Muchas gracias por su atencion