IntroductionTHE TUVATU ore system is one of the three largest gold sys-tems in Fiji, the other two are the Emperor (Ahmad et al.,1987; Begg, 1996) and Mt. Kasi (Turner, 1986) deposits. Allthree are late Miocene-early Pliocene alkaline igneous rock-related gold systems spatially associated with the >250-kmnortheast-trending Viti Levu lineament. The Tuvatu gold de-posit is located in western Viti Levu, Fiji, 50 km southwest ofthe Emperor gold deposit. Both deposits are owned by Em-peror Gold Mining Company and production at the Emperordeposit has occurred intermittently since the early 1930s. TheEmperor deposit contains approximately 280 t Au (produc-tion and reserves), whereas the Tuvatu deposit contains re-serves of about 13 t Au. Both deposits have gold grades ofabout 9 g/t and contain precious metal tellurides.
A clear genetic relationship among porphyry copper-stylemineralization, epithermal low-sulfidation gold telluride min-eralization and alkaline igneous rocks of the Tavua volcano atthe Emperor deposit was demonstrated by Ahmad et al.(1987), Setterfield et al. (1991, 1992), Eaton and Setterfield(1993), Begg (1996), and Begg et al. (1997). Ahmad et al.(1987), Pals et al. (2003), and Pals and Spry (2003) recognizedeight stages of hydrothermal mineralization with auriferouspyrite and tellurides forming in at least two stages in flat-lyingveins (so-called “flatmakes”), steep structures, breccias, shat-ter zones, and stockworks. Fluid inclusion and stable isotopestudies by Ahmad et al. (1987) and Begg (1996) have shown
the involvement of magmatic fluids in the Emperor deposit. This study describes the petrology, mineralogy, paragene-
sis, stable isotope geochemistry, and fluid inclusion character-istics of the Tuvatu deposit and compares them with previ-ously described characteristics of the Emperor deposit. Agenetic model for the Tuvatu deposit is proposed that incor-porates the formation of porphyry- and epithermal-style min-eralization spatially and genetically associated with alkalinemagmatism.
Regional Geologic SettingFiji is comprised of two large islands, Viti Levu and Vanua
Levu, and approximately 300 smaller islands. Together theyare positioned on a prominent offset of the convergentboundary between the Pacific and Indo-Australian tectonicplates. Fiji is presently a remnant oceanic arc that developedduring the Tertiary (Gill et al., 1984). From the middle Meso-zoic to late Miocene, active subduction of the Pacific plate be-neath the Indo-Australian plate occurred along the Vitiaztrench (Fig. 1). Collisions of the Ontong-Java Plateau into theSolomon Islands and the Melanesian Border Plateau into theeastern portion of the Vitiaz trench stopped subduction alongthe Vitiaz trench and led to a reversal of arc polarity north ofFiji along the Vanuatu segment of the arc possibly as early as8 Ma (Hamburger and Isacks, 1988; Gill and Whelan, 1989;Begg and Gray, 2002). A new trench (Vanuatu trench) was es-tablished on the western side of the Vanuatu arc, making theVitiaz arc an inactive, relict trench. Between 8 and 5.5 Ma, anarc north of Fiji fragmented to form a transverse rift. Some-time later, the Fiji platform, comprising the present-day FijiIslands, underwent counterclockwise rotation.
Mineralogical, Petrological, Stable Isotope, and Fluid Inclusion Characteristics of theTuvatu Gold-Silver Telluride Deposit, Fiji: Comparisons with the Emperor Deposit
NANCY L. SCHERBARTH* AND PAUL G. SPRY†
Department of Geological and Atmospheric Sciences, 253 Science I, Iowa State University, Ames, Iowa 50011
AbstractThe Tuvatu gold-silver telluride deposit with reserves of 13 t Au is the second largest gold deposit in Fiji after
the large Emperor gold telluride deposit (production, and proven and probable reserves of 280 t Au). The de-posits are 50 km apart and occur along the >250-km east-northeast–trending Viti Levu lineament. They arespatially associated with alkaline rocks of almost identical age (~5.4–4.6 Ma) and having a shoshonitic affinity.The gold mineralization in both deposits is spatially and genetically related to monzonite intrusions and to alow-grade porphyry copper-style system. The Emperor deposit occurs along the margins of the Tavua volcanowhereas the Tuvatu deposit may occur adjacent to an eroded shoshonite volcano. At both locations, low-sulfi-dation, epithermal gold telluride mineralization occurs in flat-lying veins, steep faults, shatter zones, stock-works, and hydrothermal breccias. Mineralization in both deposits formed in multiple stages and is character-ized by the presence of quartz-roscoelite telluride veins in which gold-rich tellurides were deposited prior tosilver-rich tellurides. Gold tellurides and vanadium minerals were deposited at approximately 250°C from mod-erately saline fluids. Oxygen and hydrogen isotope compositions of ore fluids at Emperor and Tuvatu are sim-ilar to the composition of waters exsolved from arc magmas. Previously published values of δ34S of sulfides(–20.3 to +3.9‰) from Emperor are like those obtained from the Tuvatu deposit (–15.3 to –3.2‰) and indi-cate, along with mineral assemblages, that the ore fluids were oxidizing and near the hematite-pyrite buffer.
The similar igneous lithological units of almost identical age, transition from porphyry- to epithermal-stylemineralization, paragenetic relationships, and comparable fluid inclusion and stable isotope data suggest acommon origin for sulfide and gold telluride mineralization at the Tuvatu and Emperor deposits. Potential ex-ists for additional epithermal gold telluride mineralization near volcanic centers in shoshonitic rocks (Ba andKoroimavua Volcanic groups) spatially related to the Viti Levu lineament in northern Viti Levu.
† Corresponding author: e-mail, [email protected]*Present address: Tectonic Resources NL, Suite 4 100 Hay Street, Subi-
The east-northeast–trending Fiji fracture zone and thenortheast-trending Hunter fracture zone are presently active,major left-lateral transform zones. The Fiji fracture zone de-fines the northern boundary of the Fiji platform and thesouthern boundary of the Pacific plate. The Hunter fracturezone is a fossil subduction zone where the South Fiji basincrust was formerly subducted beneath Fiji. Fracture zonessubparallel to the Fiji fracture zone are the Viti Levu linea-ment, which runs along the northernmost portion of VitiLevu, and the Vatulele-Beqa lineament, which occurs alongthe edge of the Fiji platform just south of Viti Levu. Thesefracture zones have controlled the distribution of lateMiocene to early Pliocene volcanic centers on the Fiji plat-form (Gill and Whelan, 1989).
The oldest rocks in Fiji are the upper Eocene to lowerOligocene (35–40 Ma) Yavanu Group, which are composed ofextrusive and intrusive tholeiitic rocks, a trondjhemitic stock,
a tonalite (Yavuna) stock, and minor volcaniclastic rocks andlimestone. From middle to late Miocene (7–12.5 Ma), theColo orogeny created large-scale faulting and folding of theupper Oligocene to middle Miocene (13–32 Ma) WainimalaGroup along with the emplacement of the plutonic suite ofgabbro and minor tonalite intrusions (Begg, 1996; Begg andGray, 2002). At the end of the Colo orogeny, Viti Levu un-derwent a period of widespread and voluminous volcanismfrom 6.5 to 2.5 Ma (Colley and Flint, 1995). Magmatic com-positions changed from island-arc tholeiite and calc-alkalineandesite to shoshonite at ~5.5 Ma (Gill and Whelan, 1989).
During the early Pliocene, the prominent Tavua and Raki-raki volcanoes, composed of shoshonite and high K calc-alka-line volcanic rocks, were erupted (Colley and Flint, 1995).The Koroimavua Group occurs to the northeast of Nadi andconsists of basal shoshonitic volcaniclastic sandstone andmudstone overlain by the Sabeto Volcanics, which include
136 SCHERBARTH AND SPRY
0361-0128/98/000/000-00 $6.00 136
FIG. 1. Tectonic reconstruction of the southwest Pacific region (modified after Hathaway, 1993). A. 5.5 Ma. B. Presentday.
shoshonitic lava, breccia, rudite, and sandstone (Begg, 1996).The Ba Volcanic Group dominates the northern half of VitiLevu and is composed of shoshonites and, to a lesser extent,calc-alkaline volcanic rocks. The Tavua volcano, the largest inFiji, is a main feature of the Ba Volcanic Group and hosts theEmperor gold deposit. Both the Koroimavua and Ba Groupsoccur along the east-northeast–trending axis defining the VitiLevu lineament and appear to be contemporaneous (Fig. 2).
Geology of the Tuvatu AreaThe oldest geologic unit in the Tuvatu area is the 12 to 26
Ma Nadele Breccia, which is a member of the WainimalaGroup (Fig. 3). It constitutes approximately 60 percent of the1-km2 deposit area (Hatcher, 1998) and consists of andesiticto basaltic reworked, polymict volcanic breccias, pillow lavas,and sedimentary rocks. The polymict volcanic breccias appearto be the dominant unit of the Nadele Breccia (A-Izzeddin,1998). Thin layers of volcanic sandstone and siltstone arecommonly interbedded with the breccias and can exhibitcrossbedding. Hatcher (1998) identified zeolite, chlorite, andepidote within the groundmass of the Nadele Breccia, whichformed in response to the low-grade metamorphism duringthe Colo orogeny. The Wainimala Group is unconformably
overlain by members of the Sabeto Volcanics, the basal unitof the Koroimavua Volcanic Group, which, according toHatcher (1998), consists of augite-biotite flows and brecciawith a basal sequence of andesitic and dacitic lithic and crys-tal tuffs, grits, and agglomerates with minor flows. K-Ar dat-ing of the Sabeto Volcanics by McDougall (1963) yielded anage of 5.4 ± 0.1 Ma. These volcanic rocks constitute roughly10 to 15 percent of the topographic high zone along the east-ern margin of the deposit area (Hatcher, 1998). The NadeleBreccia was intruded by the 4.9 ± 0.1 Ma Navilawa Mon-zonite, which McDougall (1963) interpreted to be the intru-sive equivalent of the Sabeto Volcanics. The Navilawa Mon-zonite consists of multiple phases, including an earlyfine-grained micromonzonite, a medium-grained monzonite,basaltic-andesite dikes, and late-stage pegmatitic dikes (A-Izzeddin, 1998). The medium-grained monzonite (hereafterreferred to as “monzonite”) is surrounded by an envelope ofmicromonzonite and contains inclusions of micromonzonite.Together, the micromonzonite and monzonite have an ellipti-cal shape with a northeast-southwest axis 3 km long and 2 kmwide (Fig. 3). Porphyry copper-style mineralization occurs atthe center of the Navilawa Monzonite near the transitionzone between micromonzonite and monzonite at the
TUVATU GOLD-SILVER TELLURIDE DEPOSIT, FIJI 137
0361-0128/98/000/000-00 $6.00 137
FIG. 2. Geology of Viti Levu, Fiji (modified after Begg, 1996; Rodda, 1967). The location of the Tuvatu prospect with re-spect to the Emperor deposit and the Viti Levu lineament is indicated.
Kingston prospect, 1.8 km north of the Tuvatu deposit (Col-ley and Flint, 1995). Faults in the Tuvatu area strike north tonortheast and northeast to southeast with near-vertical dips;however, in places, they dip shallowly to the west. Some ofthese shallow-dipping structures host epithermal gold miner-alization near the margin of the Navilawa Monzonite (Fig. 4).
Sampling and Analytical MethodsMajor and trace element analyses were obtained from 20
drill core samples of micromonzonite (n = 4) and monzonite(n = 10) from the Navilawa Monzonite suite and basaltic-an-desite dikes (n = 6), which intrude the Navilawa Monzonite(Tables 1, 2). Major elements (SiO2, Al2O3, Fe2O3, CaO,MgO, Na2O, K2O, MnO, TiO2, P2O5, Cr2O3, LOI) were de-termined by LiBO2 fusion and measured by ICP-AES tech-niques, C and S by LECO analysis, and trace elements (As,Ba, Bi, Cd, Co, Cs, Cu, Ga, Hf, Mo, Nb, Ni, Pb, Rb, Sb, Sc,Sn, Sr, Ta, Te, Th, Tl, U, V, W, Y, Zn, Zr), including 14 rareearth elements (La, Ce, Pr, Nd, Sm, Eu, Gd, Tb, Dy, Ho, Er,Tm, Yb, Lu), were obtained by LiBO2 fusion and measuredby ICP-MS techniques by Acme Analytical Laboratories.Standards used by Acme Analytical Laboratories were accu-rate to within ±5 ppm for the trace elements and to within ±2percent for major elements. Base metal compositions wereobtained by dissolving the samples in aqua regia and analyz-ing them with an ICP-AES, whereas high precision Au andAg determinations were done by a classical lead-collectionfire assay technique. Dore bead is parted in nitric acid and theprecious metal flake is either weighed (gravimetric finish) or
digested by addition of hydrochloric acid for analysis by ICP-AES.
Electron microprobe analyses of minerals in the NavilawaMonzonite and the attendant porphyry- and epithermal-stylemineralization in the Tuvatu area were obtained with anARL-SEMQ electron microprobe at Iowa State University.These data are tabulated in Scherbarth (2002). Details of thestandards used, the data-reduction procedure, and the oper-ating conditions are given in Scherbarth (2002) and Pals et al.(2003).
Gold, As, and Te contents of pyrite from the Tuvatu depositwere obtained using a Cameca IMS-3f ion microprobe(SIMS) at the Advanced Mineral Technology Laboratory(AMTEL), London, Ontario. Minimum detection limits (2σ)of 150, 500, and 300 ppb were obtained for Au, As, and Te,respectively. Operating conditions of the ion microprobe anddetails of analysis are given in Pals et al. (2003).
Petrochemistry of Igneous Rocks from TuvatuThe micromonzonite phase of the Navilawa Monzonite
contains phenocrysts of approximately equal amounts of eu-hedral to subhedral orthoclase and plagioclase, along with py-roxene, amphibole, magnetite, and biotite in a matrix of lath-like zoned plagioclase that has been altered to white mica(Hatcher, 1998; Fig. 5A). Lesser amounts of subhedral ortho-clase, plagioclase, diopside, hornblende, biotite, apatite, andmagnetite (Fig. 5B) also occur in the groundmass. Thecoarse-grained monzonite contains less plagioclase but morebiotite, the latter occurring as books of biotite displaying a
138 SCHERBARTH AND SPRY
0361-0128/98/000/000-00 $6.00 138
FIG. 3. Simplified geologic map of the Tuvatu prospect (modified from Emperor Gold Mining Company, 2000).
miarolitic texture. The groundmass of basaltic-andesite dikesis primarily composed of fine-grained plagioclase laths withlesser amounts of clinopyroxene, olivine, magnetite, andpyrite (Fig. 5C).
The majority of the igneous rocks from the Tuvatu depositare unaltered to weakly altered; the least altered sampleswere chosen in this study. Monzonite and micromonzonitecontain between 46.8 to 52.4 wt percent SiO2, and 4.6 to 9.9
TUVATU GOLD-SILVER TELLURIDE DEPOSIT, FIJI 139
0361-0128/98/000/000-00 $6.00 139
FIG. 4. Plan view of the Tuvatu prospect lode structures (modified from Emperor Gold Mining Company, 2000).
TABLE 1. Chemical Composition of Navilawa Monzonite and Basaltic-Andesite Dikes from the Tuvatu Deposit
wt percent Na2O + K2O where K2O >Na2O (Table 1). Thebasaltic-andesite dikes contain 50.0 to 52.8 wt percent SiO2
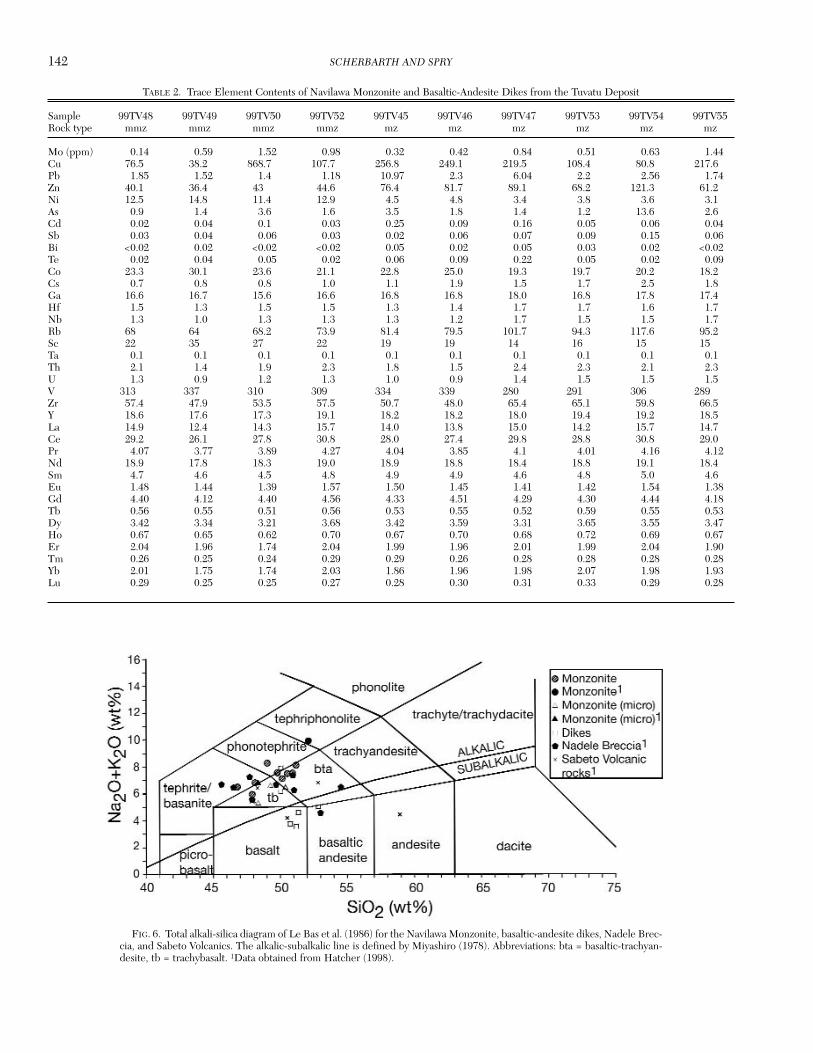
and 3.5 to 7.9 wt percent Na2O + K2O where K2O <Na2O (ex-cluding sample 99TV77). Based on the total alkali-silica dia-gram of Le Bas et al. (1986), samples of monzonite and mi-cromonzonite from Hatcher (1998) and from this study fallentirely within the alkaline field defined by Miyashiro (1978)and are chemically equivalent to volcanic rocks consisting oftrachybasalts, basaltic trachyandesites, tephrites and/orbasanites, phonotephrite, and tephriphonolite (Fig. 6). Thebasaltic-andesite dikes plot within the subalkaline field (withthe exception of samples 99TV51 and 99TV81) and, based ontotal alkali-silica content, they consist of basalt, basaltic-an-desite, trachybasalt, and phonotephrite (Fig. 6). Althoughdata for the Nadele Breccia from Hatcher (1998) are in-cluded in Figure 6, samples of this rock type were not ana-lyzed in the present study because they contain a variety ofrock fragments with a wide range of chemical compositions.
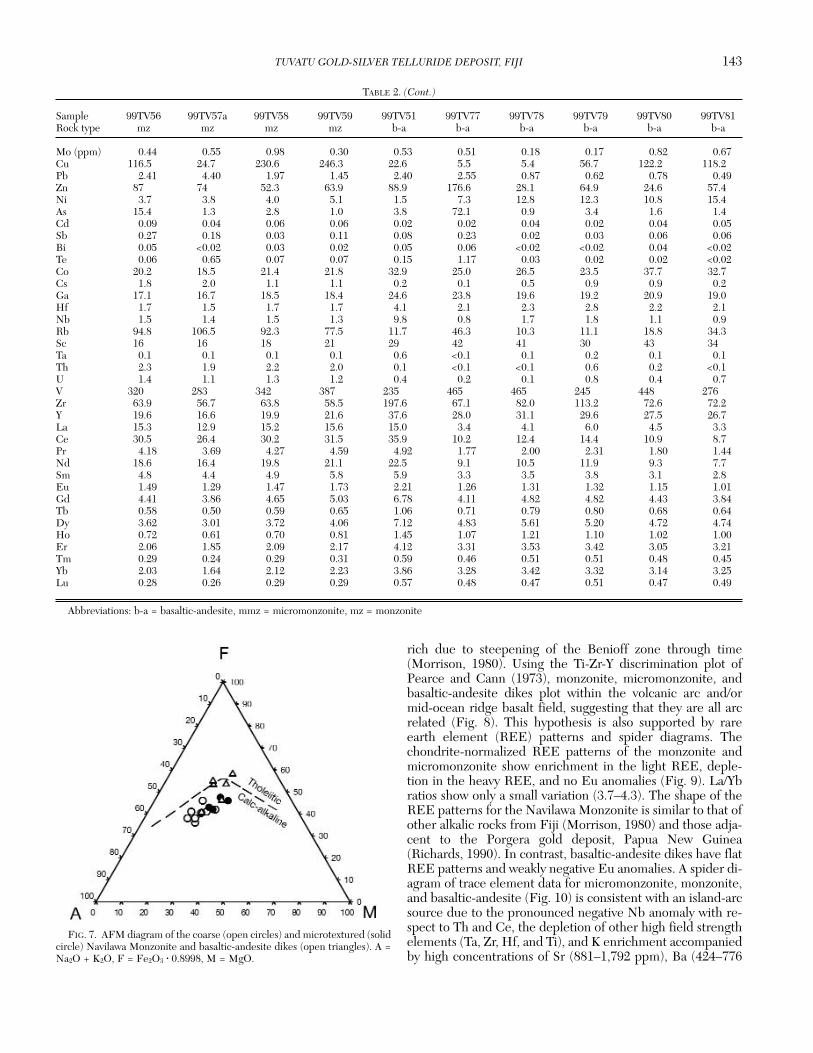
Monzonite and micromonzonite exhibit moderate negativecorrelations between SiO2 and Fe2O3 (r2 = 0.58), CaO (r2 =0.64), and TiO2 (r2 = 0.65) concentrations. These negativecorrelations suggest that monzonite and micromonzonite aretextural variants and were probably comagmatic. DecreasingMg values [Mg/(Mg + Fe2+), where Fe2+ = 0.85(Fetotal)] of0.56 to 0.44 from micromonzonite to monzonite are consis-tent with an evolving differentiated magma. These correla-tions, along with a pronounced calc-alkaline trend (Fig. 7), re-flect the early fractionation of ferromagnesian silicates andoxides and the later fractionation of plagioclase, orthoclase,and biotite.
The Navilawa Monzonite contains <53 wt percent SiO2 andhas low Na2O/K2O ratios (0.4–0.9), low TiO2 (0.5–0.8 wt %),Rb/Zr ratios >1, and Hf/Zr ratios <1, all of which reflectshoshonitic compositions. The shoshonitic affinity of theserocks is consistent with the oblique plate convergencewherein successively younger igneous rocks become more K
Notes: Ctotal and Stotal are not included in total; Mg# = Mg/(Mg + Fe2+) where (Fe2+ = 0.85 × Fetotal); all samples contain <0.028 g/t; abbreviations: b-a =basaltic-andesite; n.d. = not determined; mmz = micromonzonite; mz = monzonite
1DDH100, 258.78 m 5DDH53, 290.0 m 9DDH58, 58.6 m 13DDH135, 196.6 m 17DDH183, 150.0 m2DDH112, 298.65 m 6DDH79, 116.7 m 10DDH176, 501.26 m 14DDH135, 173.8 m 18DDH187, 144.16 m3DDH130, 252.25 m 7DDH80, 84.6 m 11DDH65, 63.4 m 15DDH130, 262.0 m 19DDH191, 323.70 m4DDH76, 218.5 m 8DDH65, 61.85 m 12DDH58, 55.3 m 16DDH177, 289.0 m 20DDH172, 62.50 m
FIG. 5. Photomicrographs of igneous textures taken in transmitted cross-polarized light (A-C) and ore textures in plane-polarized reflected light (D-J). A. Typical micromonzonite consisting of a matrix of lathlike zoned plagioclase with clinopy-roxene (cpx) phenocrysts. B. Weakly altered monzonite consisting of hornblende (hbl) and phlogopite (phl) within coarse-grained plagioclase (pl). C. Basaltic-andesite dominated by zoned plagioclase. The opaque minerals in (A), (B), and (C) aremainly magnetite with minor pyrite. D. Pyrite (py) along the octahedral cleavage of magnetite (mt) and in the embayed endsof phlogopite (phl) in the Tuvatu lode. E. Zoned phlogopite in chlorite (chl)-quartz (qtz) vein in the Murau 1 lode. The lightzones represent areas of high Mg and F content whereas dark zones represent areas of high Fe-Ti content. F. Native gold(G) and bladed pyrite that was subsequently filled with marcasite (mc) in a quartz (qtz)-roscoelite vein in the Nasivi SKLlode. G. Anhedral tennantite (t) grain with inclusions of chalcopyrite (cp) and calaverite (cal) in quartz (qtz) in the NasiviSKL lode. H. Euhedral galena (gn) with inclusions of petzite (pet), hessite (hess), sylvanite (syl), and stützite (stut) in theUR5 lode; galena is in contact with sphalerite (sp). I. Galena (gn) associated with altaite (a) and native gold (G) in the URW3lode. J. Coloradoite (co) with native gold and coexisting with calaverite (cal) and petzite (pet) in roscoelite in the UpperRidges lode.
TUVATU GOLD-SILVER TELLURIDE DEPOSIT, FIJI 141
0361-0128/98/000/000-00 $6.00 141
142 SCHERBARTH AND SPRY
0361-0128/98/000/000-00 $6.00 142
TABLE 2. Trace Element Contents of Navilawa Monzonite and Basaltic-Andesite Dikes from the Tuvatu Deposit
FIG. 6. Total alkali-silica diagram of Le Bas et al. (1986) for the Navilawa Monzonite, basaltic-andesite dikes, Nadele Brec-cia, and Sabeto Volcanics. The alkalic-subalkalic line is defined by Miyashiro (1978). Abbreviations: bta = basaltic-trachyan-desite, tb = trachybasalt. 1Data obtained from Hatcher (1998).
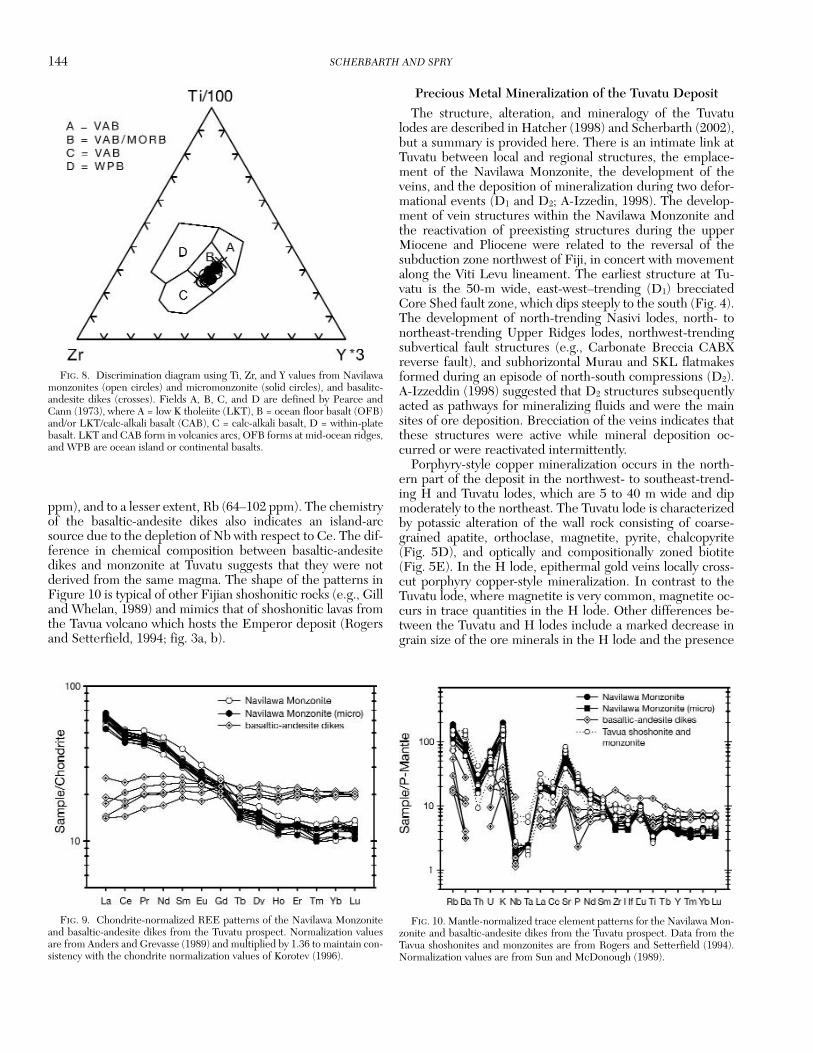
rich due to steepening of the Benioff zone through time(Morrison, 1980). Using the Ti-Zr-Y discrimination plot ofPearce and Cann (1973), monzonite, micromonzonite, andbasaltic-andesite dikes plot within the volcanic arc and/ormid-ocean ridge basalt field, suggesting that they are all arcrelated (Fig. 8). This hypothesis is also supported by rareearth element (REE) patterns and spider diagrams. Thechondrite-normalized REE patterns of the monzonite andmicromonzonite show enrichment in the light REE, deple-tion in the heavy REE, and no Eu anomalies (Fig. 9). La/Ybratios show only a small variation (3.7–4.3). The shape of theREE patterns for the Navilawa Monzonite is similar to that ofother alkalic rocks from Fiji (Morrison, 1980) and those adja-cent to the Porgera gold deposit, Papua New Guinea(Richards, 1990). In contrast, basaltic-andesite dikes have flatREE patterns and weakly negative Eu anomalies. A spider di-agram of trace element data for micromonzonite, monzonite,and basaltic-andesite (Fig. 10) is consistent with an island-arcsource due to the pronounced negative Nb anomaly with re-spect to Th and Ce, the depletion of other high field strengthelements (Ta, Zr, Hf, and Ti), and K enrichment accompaniedby high concentrations of Sr (881–1,792 ppm), Ba (424–776
FIG. 7. AFM diagram of the coarse (open circles) and microtextured (solidcircle) Navilawa Monzonite and basaltic-andesite dikes (open triangles). A =Na2O + K2O, F = Fe2O3 � 0.8998, M = MgO.
ppm), and to a lesser extent, Rb (64–102 ppm). The chemistryof the basaltic-andesite dikes also indicates an island-arcsource due to the depletion of Nb with respect to Ce. The dif-ference in chemical composition between basaltic-andesitedikes and monzonite at Tuvatu suggests that they were notderived from the same magma. The shape of the patterns inFigure 10 is typical of other Fijian shoshonitic rocks (e.g., Gilland Whelan, 1989) and mimics that of shoshonitic lavas fromthe Tavua volcano which hosts the Emperor deposit (Rogersand Setterfield, 1994; fig. 3a, b).
Precious Metal Mineralization of the Tuvatu DepositThe structure, alteration, and mineralogy of the Tuvatu
lodes are described in Hatcher (1998) and Scherbarth (2002),but a summary is provided here. There is an intimate link atTuvatu between local and regional structures, the emplace-ment of the Navilawa Monzonite, the development of theveins, and the deposition of mineralization during two defor-mational events (D1 and D2; A-Izzedin, 1998). The develop-ment of vein structures within the Navilawa Monzonite andthe reactivation of preexisting structures during the upperMiocene and Pliocene were related to the reversal of thesubduction zone northwest of Fiji, in concert with movementalong the Viti Levu lineament. The earliest structure at Tu-vatu is the 50-m wide, east-west–trending (D1) brecciatedCore Shed fault zone, which dips steeply to the south (Fig. 4).The development of north-trending Nasivi lodes, north- tonortheast-trending Upper Ridges lodes, northwest-trendingsubvertical fault structures (e.g., Carbonate Breccia CABXreverse fault), and subhorizontal Murau and SKL flatmakesformed during an episode of north-south compressions (D2).A-Izzeddin (1998) suggested that D2 structures subsequentlyacted as pathways for mineralizing fluids and were the mainsites of ore deposition. Brecciation of the veins indicates thatthese structures were active while mineral deposition oc-curred or were reactivated intermittently.
Porphyry-style copper mineralization occurs in the north-ern part of the deposit in the northwest- to southeast-trend-ing H and Tuvatu lodes, which are 5 to 40 m wide and dipmoderately to the northeast. The Tuvatu lode is characterizedby potassic alteration of the wall rock consisting of coarse-grained apatite, orthoclase, magnetite, pyrite, chalcopyrite(Fig. 5D), and optically and compositionally zoned biotite(Fig. 5E). In the H lode, epithermal gold veins locally cross-cut porphyry copper-style mineralization. In contrast to theTuvatu lode, where magnetite is very common, magnetite oc-curs in trace quantities in the H lode. Other differences be-tween the Tuvatu and H lodes include a marked decrease ingrain size of the ore minerals in the H lode and the presence
144 SCHERBARTH AND SPRY
0361-0128/98/000/000-00 $6.00 144
FIG. 8. Discrimination diagram using Ti, Zr, and Y values from Navilawamonzonites (open circles) and micromonzonite (solid circles), and basalitc-andesite dikes (crosses). Fields A, B, C, and D are defined by Pearce andCann (1973), where A = low K tholeiite (LKT), B = ocean floor basalt (OFB)and/or LKT/calc-alkali basalt (CAB), C = calc-alkali basalt, D = within-platebasalt. LKT and CAB form in volcanics arcs, OFB forms at mid-ocean ridges,and WPB are ocean island or continental basalts.
FIG. 9. Chondrite-normalized REE patterns of the Navilawa Monzoniteand basaltic-andesite dikes from the Tuvatu prospect. Normalization valuesare from Anders and Grevasse (1989) and multiplied by 1.36 to maintain con-sistency with the chondrite normalization values of Korotev (1996).
FIG. 10. Mantle-normalized trace element patterns for the Navilawa Mon-zonite and basaltic-andesite dikes from the Tuvatu prospect. Data from theTavua shoshonites and monzonites are from Rogers and Setterfield (1994).Normalization values are from Sun and McDonough (1989).
of trace amounts of native gold, calaverite, petzite, and ten-nantite. Although these two lodes are overprinted by gold-bearing epithermal-style veins and associated propylitic andphyllic alteration, most gold occurs in epithermal-style veinsunrelated to porphyry-style mineralization in the NavilawaMonzonite, basaltic-andesite dikes and, to a lesser extent, theNadele Breccia.
Epithermal gold mineralization was deposited in three lodetypes, “steep-dipping veins” striking northeast (e.g., Nasiviand Upper Ridges lodes), shallowly dipping veins (<45°) orflatmakes representing reactivated oblique thrust faults (e.g.,Murau lode), and irregular brecciated bodies or shatter zones(e.g., SKL lode) that occur at the intersection of the other twolode types (Fig. 4). Each lode consists of up to nine individ-ual flatmakes (e.g., SKL) or vertical veins (e.g., Upper Ridges)that are generally no more than 1 m wide. In most places, al-teration zones are narrow and do not extend more than 1 minto the wall rocks. Individual veins contain between 2 and100 g/t Au, with the Upper Ridges veins containing the high-est grades (5–100 g/t Au). Most veins are silicified and includebase metal sulfides (pyrite, chalcopyrite, sphalerite, andgalena), native gold and/or electrum (fineness of 714–984, n= 17), tellurides, and gangue minerals (quartz, chalcedony,sericite, adularia, and roscoelite). Medium-grained cockadeand fine-grained banded quartz in the veins is intergrownwith or replaced by chalcedony. Adularia and white micaoccur within the medium- to fine-grained quartz. Roscoelite,contains up to 32.71 wt percent V2O3, among the highest re-ported vanadium values in roscoelite from an epithermal Au-Ag-Te deposit. This mineral is found between quartz grainsand chalcedony where it rims native gold and occurs in con-tact with pyrite, tennantite, and tellurides, especiallycalaverite. Trace amounts of karelianite (V2O3), Ti-free nolan-ite [(V,Fe,Ti,Al)10O14(OH)2, with between 65.2–87.3 wt %V2O3], schreyerite (V2Ti3O9), vanadian rutile (with up to 5.2wt % V2O3), an unnamed vanadium silicate [VSiO3(OH)], andmagnetite (up to 0.69 wt % V2O3) are also spatially associatedwith roscoelite and calaverite in the veins (Spry andScherbarth, 2002).
Other epithermal gold veins in the Tuvatu area (Fig. 4) in-clude the Plant Site lode, otherwise referred to as the Westlode, located west of the other vein systems. This area in-cludes three east-west–trending lodes (WEST1, WEST2,and WEST3), one northwest-southeast lode (WEST4) thatcuts across the other three lodes, and the distal Nubunidikeand Davui lodes, located north of the adit entrance (Fig. 3).The Nubunidike and Davui veins are similar in style andcomprise quartz veins up to several centimeters in widthcontaining sphalerite as the dominant sulfide with lesserpyrite and chalcopyrite.
The age of the Tuvatu mineralization is unknown. Mc-Dougall (1963) reported a K-Ar age of 4.9 ± 0.1 Ma for biotitefrom the Navilawa Monzonite that is slightly older than a U-Th-He age of 3.5 ± 0.1 Ma from coarse apatite crystals in theTuvatu lode (B. I. A. McInnes, writ. commun., 2002). Theyounger date is the age of apatite as it cooled to its lower clo-sure temperature of 68° ± 5°C (e.g., Wolf et al., 1996). An ageof 3.89 ± 0.05 Ma, using 40Ar/39Ar techniques, for porphyry-and epithermal-style mineralization at the Emperor deposithas been reported by Begg (1996) and Begg and Gray (2002).
Paragenetic sequence, vein mineralization, and alteration styles
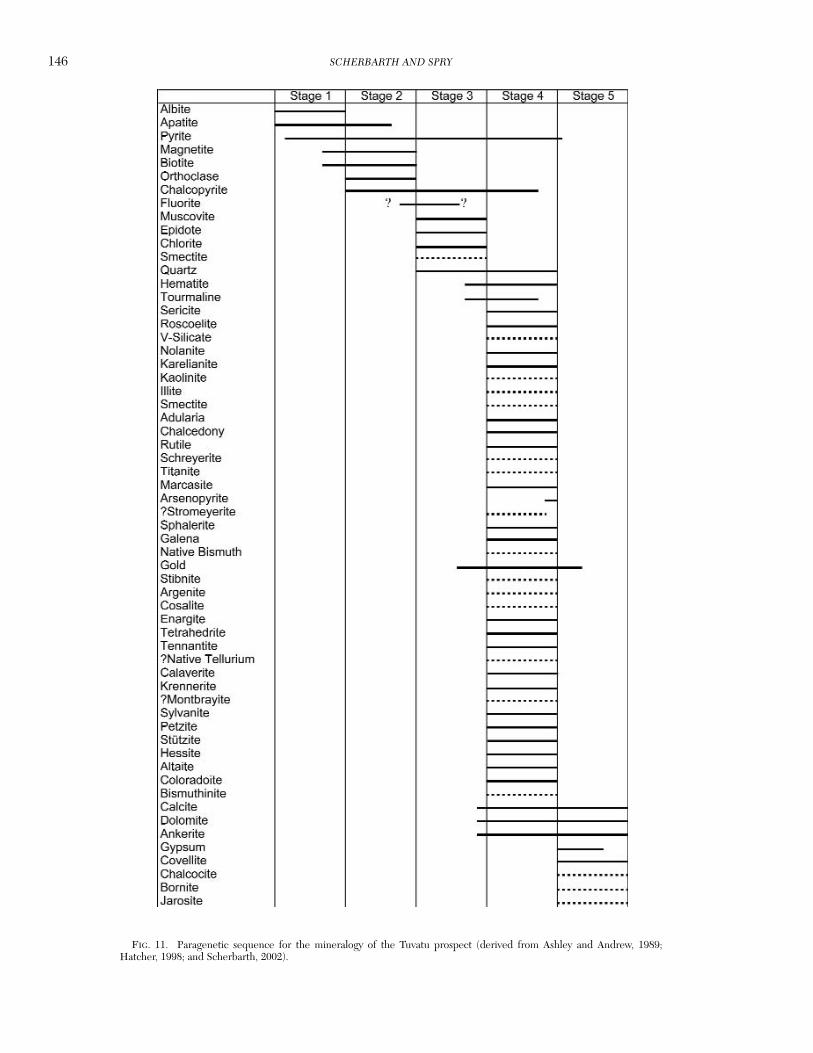
A five-stage paragenetic sequence of mineralization (Fig.11) is proposed based on reflected and transmitted light mi-croscope and electron microprobe studies of 244 polishedand doubly polished thin sections, together with structuralstudies, crosscutting relationships between minerals, andetching of pyrite with 1:1 HCl-KMnO4 to map zones of ar-senic distribution. This paragenetic sequence also incorpo-rates preliminary mineralogical observations of Hatcher(1998) and Ashley and Andrew (1989). The five stages consistof a late magmatic event (stage 1) followed by three primaryhydrothermal alteration stages in the wall rocks (potassic,propylitic, phyllic; stages 2–4), and a late supergene or post-mineralization stage (stage 5). The mineralogy of samples inindividual lodes is reported in Scherbarth (2002).
The spatial disposition between epithermal veins and alter-ation is shown schematically in Figure 12. Photographs ofphyllic and potassic alteration are shown in Figure 12A and B,respectively. Coarse apatite along with albite, biotite, ortho-clase, and pyrite occur in stage I veins and also as a slightlyfiner grained alteration assemblage up to several meters awayfrom the veins. The presence of apatite in this stage appearsto be linked to the magmatic event as monzonite and mi-cromonzonite both contain magmatic apatite. Stage 2 potas-sic alteration has a pegmatitic appearance characterized bycoarse orthoclase, biotite, magnetite, chalcopyrite, and pyrite(Fig. 12B). These minerals most commonly occur as a re-placement of early stage I alteration. Localized occurrencesof stage 3 propylitic alteration in the wall rocks overprintstage 2 alteration or occur outboard of stage 2 alteration, to adistance of a few centimeters. Epidote, chlorite, muscovite,quartz, pyrite, chalcopyrite, and minor smectite characterizestage 3 alteration. The most important gold-bearing event wascoincident with the stage 4 phyllic alteration, which over-prints stages 1 to 3. Native gold and electrum are spatially as-sociated with base metal sulfides (galena and sphalerite), ten-nantite, and tellurides, which occur in the veins up to 4 cmwide along with quartz, chalcedony, calcite, minor sericite,and V-bearing minerals (including roscoelite). Fine-grainedsilicification, carbonate, and sericite give a bleached zonearound stage 4 veins. However, it should be noted that thereis commonly a selvage of adularia (up to a few millimeterswide) around the veins that separates the vein from thebleached zone (Fig. 12A). Pyrite is also found in the alterationzone surrounding veins.
Pyrite
Pyrite is by far the most abundant sulfide in the Tuvatu de-posit and is the major host of native gold, tellurides, and in-visible gold in arsenic-bearing varieties. Pyrite of varying tex-tures occurs almost continuously throughout the five stages ofthe alteration and vein-filling sequence. In stages 1 and 2,pyrite formed as fine-grained (<0.2 mm) disseminated pyrito-hedrons and as interstitial subhedral to anhedral smooth andpitted grains (0.15–5 mm in length) between biotite and or-thoclase and replacing magnetite. These same pyrite texturesare also observed in stage 3 where pyrite encloses muscoviteand chlorite. In stage 4, brecciated pyrite (0.8–2.4 mm)
TUVATU GOLD-SILVER TELLURIDE DEPOSIT, FIJI 145
0361-0128/98/000/000-00 $6.00 145
146 SCHERBARTH AND SPRY
0361-0128/98/000/000-00 $6.00 146
FIG. 11. Paragenetic sequence for the mineralogy of the Tuvatu prospect (derived from Ashley and Andrew, 1989;Hatcher, 1998; and Scherbarth, 2002).
formed in carbonate veins, whereas cubic to pyritohedralpyrite (individual grains <0.2 mm and masses up to 3 mm inlength) formed in coarse- to medium-grained quartz (≤0.3mm) veins, and the interstices were filled by chalcopyrite, na-tive gold, or tennantite. Single blades, flakes, and masses ofbladed pyrite formed within medium- to fine-grained quartz,chalcedony, and roscoelite (Fig. 5F). These plates and/ormasses (0.2–2 mm) were subsequently filled with marcasiteand rimmed by arsenopyrite, which contains native gold orelectrum.
In view of the presence of up to 11,100 ppm Au, 5,800 ppmTe, and up to 16.6 wt percent As in pyrite from the nearbyEmperor deposit and the fact that invisible gold constitutesbetween 47 and 92 percent of the gold budget in the deposit(Pals et al., 2003), a preliminary study of the invisible goldcontent of pyrite at Tuvatu was undertaken. Prior to under-taking secondary ion microprobe spectrometry (SIMS) analy-ses, 95 electron microprobe analyses of pyrite were obtained
from 22 different samples (Scherbarth, 2002). Arsenic con-centrations in pyrite range from <0.01 to 11.06 wt percent As,with 18 grains containing >0.5 wt percent As (Table 3;Scherbarth, 2002). The highest concentrations of arsenicwere recorded in stage 4 pyrite. Twelve SIMS analyses for Au,As, and Te were obtained on three samples and showed thatcoarse anhedral grains of stage 2 pyrite contained no de-tectable amounts of As, up to 0.45 ppm Au, and up to 2.71ppm Te (Table 4). Subhedral to euhedral fine-grained massesof stage 4 pyrite contain up to 143 ppm Au, 296 ppm Te, and0.21 wt percent As, and porous stage 4 pyrite contains 51 ppmAu, 57.90 ppm Te, and 1.27 wt percent As. Although there areinsufficient SIMS data to determine the relative contributionof invisible gold to the overall gold budget of the Tuvatu de-posit, they indicate that the invisible gold content of pyrite,which exhibits the same textural variants as those observed inthe Emperor deposit, could be a significant contributor andthat further analyses need to be obtained.
TUVATU GOLD-SILVER TELLURIDE DEPOSIT, FIJI 147
0361-0128/98/000/000-00 $6.00 147
FIG. 12. Schematic illustration of a generalized epithermal vein and associated alteration zonation. Note that stages 3and 4 occur outboard of the epithermal vein and are superimposed on stages 1 and 2. All four stages do not always occurnear a given epithermal vein. A. Fine-grained quartz vein (indicated with arrows) that contains sphalerite and galena. Thisvein is immediately surrounded by stage 4 adularia that commonly occurs on the margins of epithermal veins. The host rockis micromonzonite. B. Coarse-grained, stage 2, potassic alteration showing coarse-grained apatite, biotite, magnetite, or-thoclase, pyrite, and chalcopyrite. Abbreviations: ab = albite, bt = biotite, cal = calaverite, ccp = chalcopyrite, chl = chlo-rite, ep = epidote, gn = galena, mag = magnetite, ms = muscovite, or = orthoclase, py = pyrite, qtz = quartz, rsc = roscoelite,sp = sphalerite.
148 SCHERBARTH AND SPRY
0361-0128/98/000/000-00 $6.00 148
TABLE 3. Representative Electron Microprobe Analyses of Native Gold, Electrum, Tellurides, Sulfosalts, and Sulfides
Element Electrum1 Gold2 Calaverite3 Petzite4 Sylvanite5 Hessite6 Stützite7 Coloradoite8
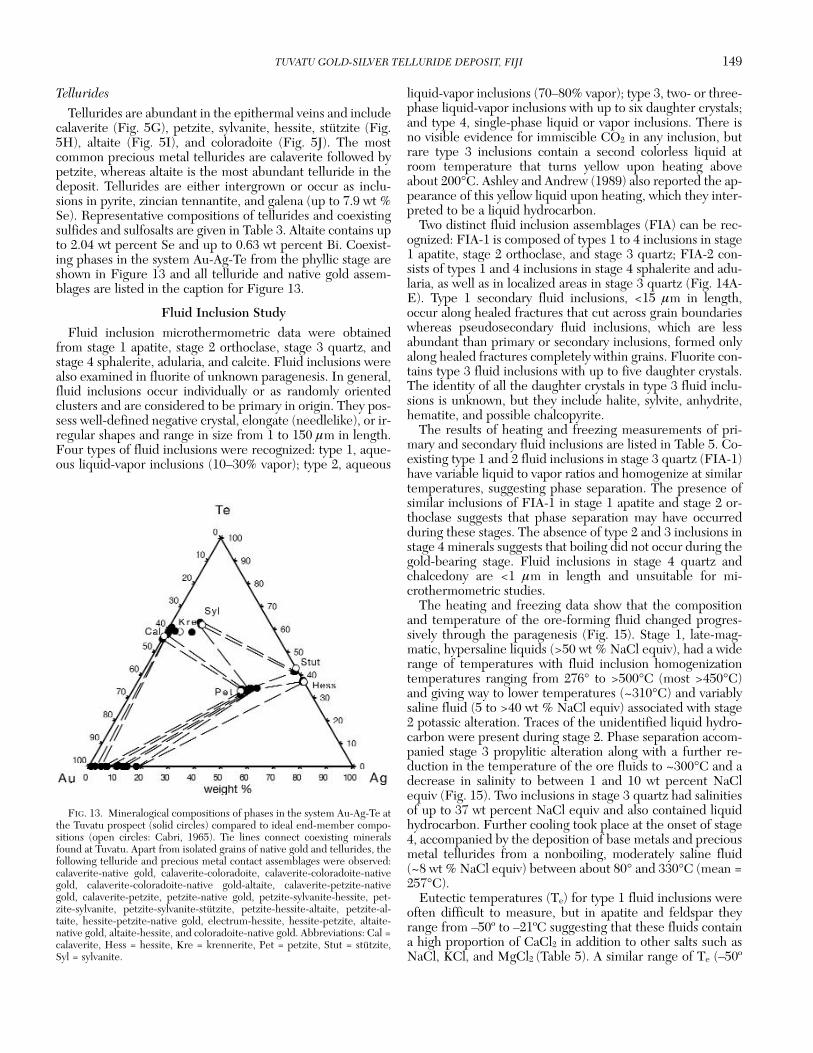
Tellurides are abundant in the epithermal veins and includecalaverite (Fig. 5G), petzite, sylvanite, hessite, stützite (Fig.5H), altaite (Fig. 5I), and coloradoite (Fig. 5J). The mostcommon precious metal tellurides are calaverite followed bypetzite, whereas altaite is the most abundant telluride in thedeposit. Tellurides are either intergrown or occur as inclu-sions in pyrite, zincian tennantite, and galena (up to 7.9 wt %Se). Representative compositions of tellurides and coexistingsulfides and sulfosalts are given in Table 3. Altaite contains upto 2.04 wt percent Se and up to 0.63 wt percent Bi. Coexist-ing phases in the system Au-Ag-Te from the phyllic stage areshown in Figure 13 and all telluride and native gold assem-blages are listed in the caption for Figure 13.
Fluid Inclusion StudyFluid inclusion microthermometric data were obtained
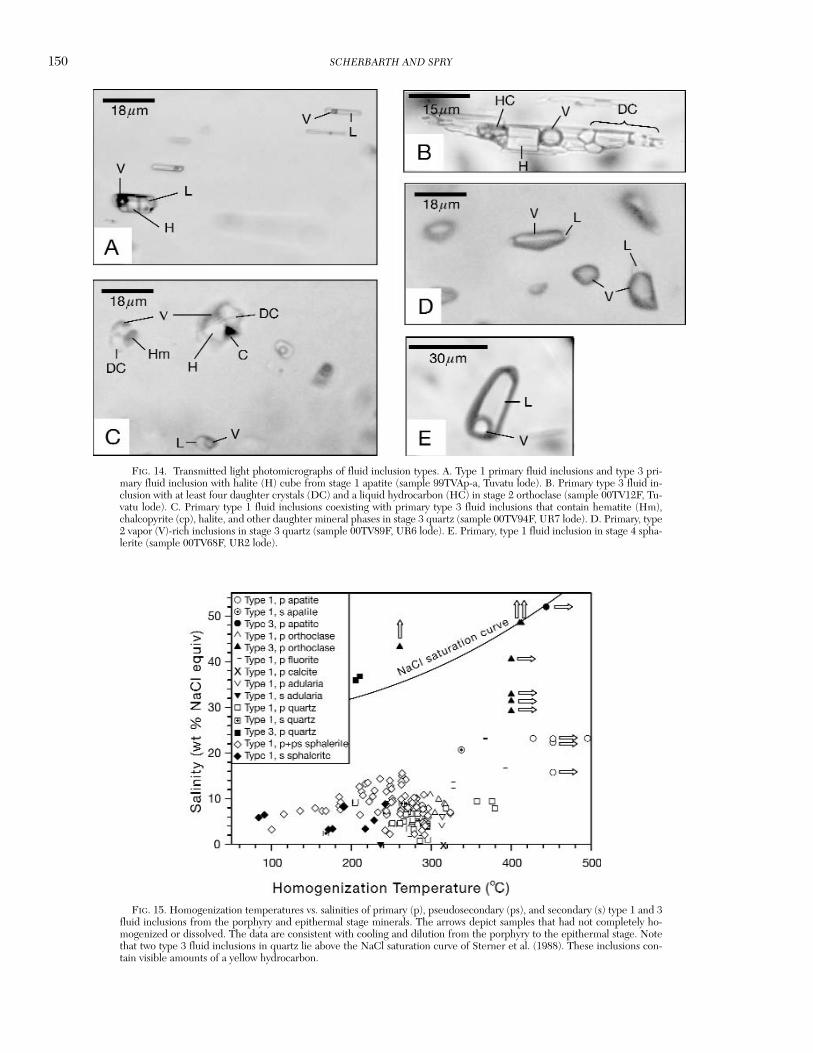
from stage 1 apatite, stage 2 orthoclase, stage 3 quartz, andstage 4 sphalerite, adularia, and calcite. Fluid inclusions werealso examined in fluorite of unknown paragenesis. In general,fluid inclusions occur individually or as randomly orientedclusters and are considered to be primary in origin. They pos-sess well-defined negative crystal, elongate (needlelike), or ir-regular shapes and range in size from 1 to 150 µm in length.Four types of fluid inclusions were recognized: type 1, aque-ous liquid-vapor inclusions (10–30% vapor); type 2, aqueous
liquid-vapor inclusions (70–80% vapor); type 3, two- or three-phase liquid-vapor inclusions with up to six daughter crystals;and type 4, single-phase liquid or vapor inclusions. There isno visible evidence for immiscible CO2 in any inclusion, butrare type 3 inclusions contain a second colorless liquid atroom temperature that turns yellow upon heating aboveabout 200°C. Ashley and Andrew (1989) also reported the ap-pearance of this yellow liquid upon heating, which they inter-preted to be a liquid hydrocarbon.
Two distinct fluid inclusion assemblages (FIA) can be rec-ognized: FIA-1 is composed of types 1 to 4 inclusions in stage1 apatite, stage 2 orthoclase, and stage 3 quartz; FIA-2 con-sists of types 1 and 4 inclusions in stage 4 sphalerite and adu-laria, as well as in localized areas in stage 3 quartz (Fig. 14A-E). Type 1 secondary fluid inclusions, <15 µm in length,occur along healed fractures that cut across grain boundarieswhereas pseudosecondary fluid inclusions, which are lessabundant than primary or secondary inclusions, formed onlyalong healed fractures completely within grains. Fluorite con-tains type 3 fluid inclusions with up to five daughter crystals.The identity of all the daughter crystals in type 3 fluid inclu-sions is unknown, but they include halite, sylvite, anhydrite,hematite, and possible chalcopyrite.
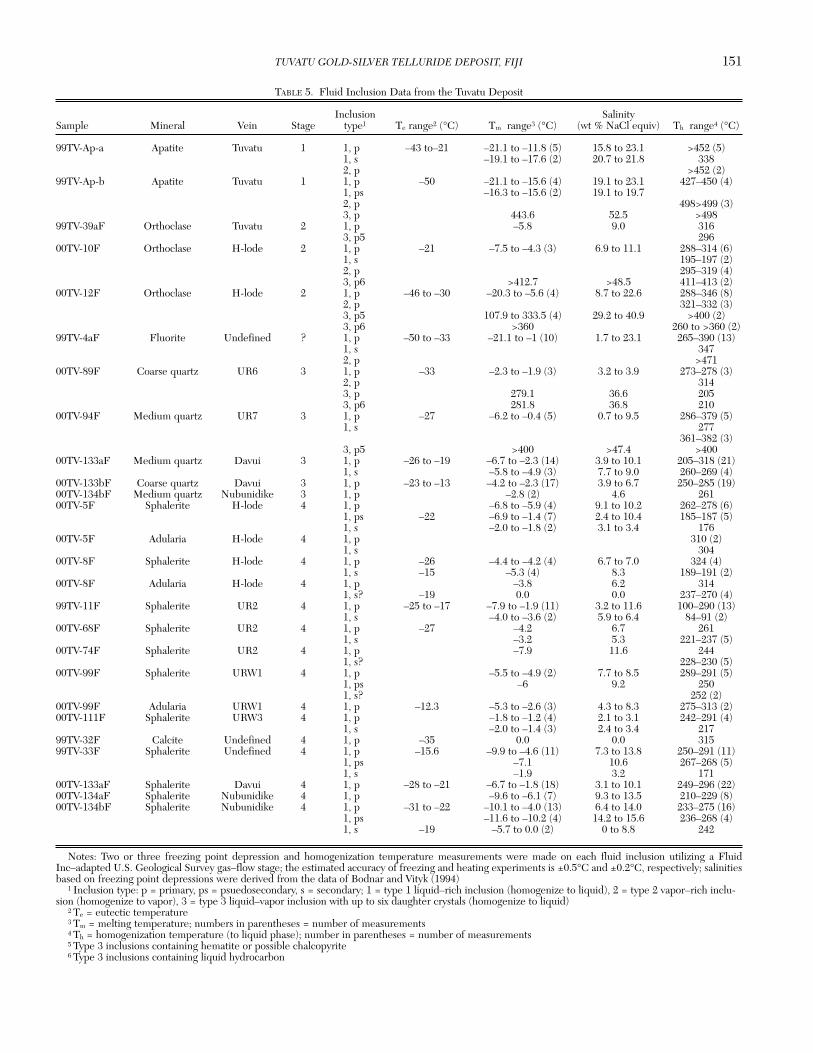
The results of heating and freezing measurements of pri-mary and secondary fluid inclusions are listed in Table 5. Co-existing type 1 and 2 fluid inclusions in stage 3 quartz (FIA-1)have variable liquid to vapor ratios and homogenize at similartemperatures, suggesting phase separation. The presence ofsimilar inclusions of FIA-1 in stage 1 apatite and stage 2 or-thoclase suggests that phase separation may have occurredduring these stages. The absence of type 2 and 3 inclusions instage 4 minerals suggests that boiling did not occur during thegold-bearing stage. Fluid inclusions in stage 4 quartz andchalcedony are <1 µm in length and unsuitable for mi-crothermometric studies.
The heating and freezing data show that the compositionand temperature of the ore-forming fluid changed progres-sively through the paragenesis (Fig. 15). Stage 1, late-mag-matic, hypersaline liquids (>50 wt % NaCl equiv), had a widerange of temperatures with fluid inclusion homogenizationtemperatures ranging from 276° to >500°C (most >450°C)and giving way to lower temperatures (~310°C) and variablysaline fluid (5 to >40 wt % NaCl equiv) associated with stage2 potassic alteration. Traces of the unidentified liquid hydro-carbon were present during stage 2. Phase separation accom-panied stage 3 propylitic alteration along with a further re-duction in the temperature of the ore fluids to ~300°C and adecrease in salinity to between 1 and 10 wt percent NaClequiv (Fig. 15). Two inclusions in stage 3 quartz had salinitiesof up to 37 wt percent NaCl equiv and also contained liquidhydrocarbon. Further cooling took place at the onset of stage4, accompanied by the deposition of base metals and preciousmetal tellurides from a nonboiling, moderately saline fluid(~8 wt % NaCl equiv) between about 80° and 330°C (mean =257°C).
Eutectic temperatures (Te) for type 1 fluid inclusions wereoften difficult to measure, but in apatite and feldspar theyrange from –50º to –21ºC suggesting that these fluids containa high proportion of CaCl2 in addition to other salts such asNaCl, KCl, and MgCl2 (Table 5). A similar range of Te (–50º
TUVATU GOLD-SILVER TELLURIDE DEPOSIT, FIJI 149
0361-0128/98/000/000-00 $6.00 149
FIG. 13. Mineralogical compositions of phases in the system Au-Ag-Te atthe Tuvatu prospect (solid circles) compared to ideal end-member compo-sitions (open circles: Cabri, 1965). Tie lines connect coexisting mineralsfound at Tuvatu. Apart from isolated grains of native gold and tellurides, thefollowing telluride and precious metal contact assemblages were observed:calaverite-native gold, calaverite-coloradoite, calaverite-coloradoite-nativegold, calaverite-coloradoite-native gold-altaite, calaverite-petzite-nativegold, calaverite-petzite, petzite-native gold, petzite-sylvanite-hessite, pet-zite-sylvanite, petzite-sylvanite-stützite, petzite-hessite-altaite, petzite-al-taite, hessite-petzite-native gold, electrum-hessite, hessite-petzite, altaite-native gold, altaite-hessite, and coloradoite-native gold. Abbreviations: Cal =calaverite, Hess = hessite, Kre = krennerite, Pet = petzite, Stut = stützite,Syl = sylvanite.
150 SCHERBARTH AND SPRY
0361-0128/98/000/000-00 $6.00 150
FIG. 14. Transmitted light photomicrographs of fluid inclusion types. A. Type 1 primary fluid inclusions and type 3 pri-mary fluid inclusion with halite (H) cube from stage 1 apatite (sample 99TVAp-a, Tuvatu lode). B. Primary type 3 fluid in-clusion with at least four daughter crystals (DC) and a liquid hydrocarbon (HC) in stage 2 orthoclase (sample 00TV12F, Tu-vatu lode). C. Primary type 1 fluid inclusions coexisting with primary type 3 fluid inclusions that contain hematite (Hm),chalcopyrite (cp), halite, and other daughter mineral phases in stage 3 quartz (sample 00TV94F, UR7 lode). D. Primary, type2 vapor (V)-rich inclusions in stage 3 quartz (sample 00TV89F, UR6 lode). E. Primary, type 1 fluid inclusion in stage 4 spha-lerite (sample 00TV68F, UR2 lode).
FIG. 15. Homogenization temperatures vs. salinities of primary (p), pseudosecondary (ps), and secondary (s) type 1 and 3fluid inclusions from the porphyry and epithermal stage minerals. The arrows depict samples that had not completely ho-mogenized or dissolved. The data are consistent with cooling and dilution from the porphyry to the epithermal stage. Notethat two type 3 fluid inclusions in quartz lie above the NaCl saturation curve of Sterner et al. (1988). These inclusions con-tain visible amounts of a yellow hydrocarbon.
TUVATU GOLD-SILVER TELLURIDE DEPOSIT, FIJI 151
0361-0128/98/000/000-00 $6.00 151
TABLE 5. Fluid Inclusion Data from the Tuvatu Deposit
Inclusion SalinitySample Mineral Vein Stage type1 Te range2 (°C) Tm range3 (°C) (wt % NaCl equiv) Th range4 (°C)
99TV-Ap-a Apatite Tuvatu 1 1, p –43 to–21 –21.1 to –11.8 (5) 15.8 to 23.1 >452 (5)1, s –19.1 to –17.6 (2) 20.7 to 21.8 3382, p >452 (2)
99TV-Ap-b Apatite Tuvatu 1 1, p –50 –21.1 to –15.6 (4) 19.1 to 23.1 427–450 (4)1, ps –16.3 to –15.6 (2) 19.1 to 19.72, p 498>499 (3)3, p 443.6 52.5 >498
00TV-10F Orthoclase H-lode 2 1, p –21 –7.5 to –4.3 (3) 6.9 to 11.1 288–314 (6)1, s 195–197 (2)2, p 295–319 (4)3, p6 >412.7 >48.5 411–413 (2)
00TV-12F Orthoclase H-lode 2 1, p –46 to –30 –20.3 to –5.6 (4) 8.7 to 22.6 288–346 (8)2, p 321–332 (3)3, p5 107.9 to 333.5 (4) 29.2 to 40.9 >400 (2)3, p6 >360 260 to >360 (2)
99TV-4aF Fluorite Undefined ? 1, p –50 to –33 –21.1 to –1 (10) 1.7 to 23.1 265–390 (13)1, s 3472, p >471
00TV-89F Coarse quartz UR6 3 1, p –33 –2.3 to –1.9 (3) 3.2 to 3.9 273–278 (3)2, p 3143, p 279.1 36.6 2053, p6 281.8 36.8 210
00TV-94F Medium quartz UR7 3 1, p –27 –6.2 to –0.4 (5) 0.7 to 9.5 286–379 (5)1, s 277
361–382 (3)3, p5 >400 >47.4 >400
00TV-133aF Medium quartz Davui 3 1, p –26 to –19 –6.7 to –2.3 (14) 3.9 to 10.1 205–318 (21)1, s –5.8 to –4.9 (3) 7.7 to 9.0 260–269 (4)
00TV-133bF Coarse quartz Davui 3 1, p –23 to –13 –4.2 to –2.3 (17) 3.9 to 6.7 250–285 (19)00TV-134bF Medium quartz Nubunidike 3 1, p –2.8 (2) 4.6 26100TV-5F Sphalerite H-lode 4 1, p –6.8 to –5.9 (4) 9.1 to 10.2 262–278 (6)
1, ps –22 –6.9 to –1.4 (7) 2.4 to 10.4 185–187 (5)1, s –2.0 to –1.8 (2) 3.1 to 3.4 176
00TV-5F Adularia H-lode 4 1, p 310 (2)1, s 304
00TV-8F Sphalerite H-lode 4 1, p –26 –4.4 to –4.2 (4) 6.7 to 7.0 324 (4)1, s –15 –5.3 (4) 8.3 189–191 (2)
00TV-99F Sphalerite URW1 4 1, p –5.5 to –4.9 (2) 7.7 to 8.5 289–291 (5)1, ps –6 9.2 2501, s? 252 (2)
00TV-99F Adularia URW1 4 1, p –12.3 –5.3 to –2.6 (3) 4.3 to 8.3 275–313 (2)00TV-111F Sphalerite URW3 4 1, p –1.8 to –1.2 (4) 2.1 to 3.1 242–291 (4)
1, s –2.0 to –1.4 (3) 2.4 to 3.4 21799TV-32F Calcite Undefined 4 1, p –35 0.0 0.0 31599TV-33F Sphalerite Undefined 4 1, p –15.6 –9.9 to –4.6 (11) 7.3 to 13.8 250–291 (11)
1, ps –7.1 10.6 267–268 (5)1, s –1.9 3.2 171
00TV-133aF Sphalerite Davui 4 1, p –28 to –21 –6.7 to –1.8 (18) 3.1 to 10.1 249–296 (22)00TV-134aF Sphalerite Nubunidike 4 1, p –9.6 to –6.1 (7) 9.3 to 13.5 210–229 (8)00TV-134bF Sphalerite Nubunidike 4 1, p –31 to –22 –10.1 to –4.0 (13) 6.4 to 14.0 233–275 (16)
1, ps –11.6 to –10.2 (4) 14.2 to 15.6 236–268 (4)1, s –19 –5.7 to 0.0 (2) 0 to 8.8 242
Notes: Two or three freezing point depression and homogenization temperature measurements were made on each fluid inclusion utilizing a FluidInc–adapted U.S. Geological Survey gas–flow stage; the estimated accuracy of freezing and heating experiments is ±0.5°C and ±0.2°C, respectively; salinitiesbased on freezing point depressions were derived from the data of Bodnar and Vityk (1994)
1 Inclusion type: p = primary, ps = psuedosecondary, s = secondary; 1 = type 1 liquid–rich inclusion (homogenize to liquid), 2 = type 2 vapor–rich inclu-sion (homogenize to vapor), 3 = type 3 liquid–vapor inclusion with up to six daughter crystals (homogenize to liquid)
2 Te = eutectic temperature3 Tm = melting temperature; numbers in parentheses = number of measurements4 Th = homogenization temperature (to liquid phase); number in parentheses = number of measurements5 Type 3 inclusions containing hematite or possible chalcopyrite6 Type 3 inclusions containing liquid hydrocarbon
to –33ºC) is exhibited by type 1 fluids in fluorite, whereashigher values of Te (–35º to –12ºC) for type 1 fluid inclusionsin quartz, sphalerite, calcite, and adularia suggest lower con-centrations of dissolved CaCl2.
The overburden thickness at the time of formation of theore-forming system is unknown. The presence of stage 2 flu-ids that formed at Th >400°C with salinities as high as 41 wtpercent NaCl equiv suggest a pressure of about 200 bars,using data from Bodnar et al. (1985). We view this as a mini-mum pressure, since Ashley and Andrew (1989) reported thepresence of fluid inclusions in stage 1 apatite that homoge-nized at Th >550°C and had salinities >50 wt percent NaClequiv. Therefore, minimum pressures may have reached 400bars, consistent with lithostatic conditions (Hedenquist et al.,1998). Since type 1 fluids in stage 4 sphalerite were not boil-ing during the time of entrapment, the Th only provides aminimum pressure of entrapment. Using a mean value of Th
of 257°C and a salinity of 8 wt percent NaCl equiv for type 1fluid inclusions in stage 4 sphalerite yields a minimum trap-ping pressure of 38 bars (Haas, 1971), which corresponds toa depth of approximately 450 m. However, a more realistic es-timate using the range of combined Th (100.2º–323.7ºC) andsalinities (2.1–15.6 wt % NaCl equiv) for type 1 fluid inclu-sions suggests a range of pressures from 1 to 107 bars. Atthese temperatures and pressures, the rocks will behave in abrittle manner, resulting in a dominantly hydrostatic pressureregime.
Stable Isotope StudiesSilicate-, oxide-, and sulfide-bearing samples were col-
lected from drill core and underground localities for oxygen,hydrogen, and sulfur isotope analyses. Sixteen oxygen isotopeanalyses were obtained from coarse magnetite, phlogopite,and orthoclase from stage 2, vein quartz from stage 3, andchalcedony from stage 4. Two of the coarse orthoclase sam-ples were also used in the fluid inclusion study. The results ofoxygen isotope analyses from this study are combined with 12oxygen isotope analyses obtained by Ashley and Andrew(1989; Fig. 16, Table 6). Using the paragenetic sequenceidentified herein, the orthoclase, biotite, and magnetite ana-lyzed by Ashley and Andrew (1989) are considered by us to befrom stage 2, whereas the muscovite and quartz are fromstage 3. Hydrogen isotope compositions of four coarse phlo-gopite crystals from the Tuvatu lode were also determined.Equations used to determine δ18O and δD compositions ofwater in equilibrium with various minerals are given inTable 6.
Oxygen isotope compositions for water in equilibrium withstage 2 orthoclase, magnetite, and phlogopite, and stage 3muscovite and quartz range from 4.4 to 10.2 per mil (mean =7.3 ± 1.4‰), whereas values of δ18O for water in equilibriumwith stage 4 quartz range from 7.8 to 11.5 per mil (mean = 9.5± 1.1‰). Although there is an increase of 2.2 per mil in themean of the data from stage 2 and 3 to stage 4 fluids, the largestandard deviations suggest that there is no statistical differ-ence between the fluids. The isotopic composition of water inequilibrium with stage 2 phlogopite overlaps with that of arcmagmas and subduction-related volcanic vapor as defined byGiggenbach (1992) and Taylor (1992). They also overlap withδ18O (3.0–7.0‰) and δD (–58 to –10‰) values of fluid
inclusion waters extracted from stages II, III, and IV quartzfrom the Emperor deposit (Ahmad et al., 1987) (Fig. 16).
Forty-seven sulfur isotope analyses were obtained fromstages 1 to 4 pyrite and from stage 4 chalcopyrite, sphalerite,and galena (Table 7). Pyrite from stages 1 and 2 of the Tuvatuand H lodes has δ34S values of –5.8 to –3.2 per mil (n = 7) andis considered to be representative of porphyry-style mineral-ization. In contrast, sulfides from epithermal mineralization(stage 4) possess δ34S values that range from –15.3 to –3.6 permil (mean = –8.1 ± 2.6‰; n = 40).
Temperatures obtained from pyrite-galena and sphalerite-galena pairs (sample 00TV-5, H-lode) using calibrations givenin Ohmoto and Rye (1979) are 330º and 244ºC, respectively,and a galena-chalcopyrite pair (sample 99TV-37b, UR1) is108ºC. The temperature obtained from the sphalerite-galenageothermometer is close to the mean temperature of 257ºCobtained from primary type 4 fluid inclusions in sphalerite.
Discussion
Source of the ore-forming components and conditions of formation of the Tuvatu deposit
Preliminary fluid inclusion data for the porphyry stage atTuvatu suggest that fluids responsible for this mineralizationwere high-temperature (>550ºC), high-salinity (>50 wt %NaCl equiv) liquids that likely boiled. Temperatures and salin-ities declined prior to and during deposition of epithermal
152 SCHERBARTH AND SPRY
0361-0128/98/000/000-00 $6.00 152
FIG. 16. Plot of δD vs. δ18O showing isotopic compositions of water inequilibrium with stage 2 phlogopite (solid circles) and δ18O of water in equi-librium with stage 2 orthoclase and magnetite, stage 3 muscovite and quartz,and stage 4 quartz and chalcedony. These data overlap with waters from arcmagmas and subduction-related vapor fields of Giggenbach (1992) and Tay-lor (1992). The histogram is of oxygen isotope compositions of fluids in equi-librium with stage 2 magnetite, orthoclase, and phlogopite, stage 3 muscoviteand quartz, and stage 4 quartz. Data used in the histogram are derived fromAshley and Andrews (1989) and Scherbarth (2002). Shown for comparisonare fluids in equilibrium with stage II, III, and IV quartz (solid triangles)from the Emperor deposit, Fiji, from Ahmad et al. (1987). Abbreviations:MWL = meteoric water line, SMOW = standard mean ocean water.
gold from a nonboiling, moderately saline fluid (~ 8 wt %NaCl equiv) between about 80° and 330°C (mean = 257°C).These results are supported by fluid inclusion data from foursamples of stage 1 apatite, stage 2 orthoclase, and stage 3quartz, in an unpublished CSIRO report from Ashley and An-drew (1989). The apparent transition from magmatic to ep-ithermal conditions was likely accompanied by a change froma lithostatic to a hydrostatic pressure regime.
Calculated δ18O and δD values for water in equilibrium withphlogopite from the porphyry-style mineralization at Tuvatuare consistent with an arc magmatic source or subduction-related volcanic vapor. The relatively high δ18O and δD valuesmay also indicate enrichment of the heavy isotope in the resid-ual liquid of a degassed melt. A contribution from meteoricwater cannot be assessed owing to the lack of δD data for stage4 minerals. However, an increase in the δ18O composition offluids from stage 2 to 4, with stage 4 values ranging from 7.8to 11.5 per mil, suggests that the involvement of meteoricwater and the degree of water-rock interaction was minimal.Stage 3 and 4 fluids are within the range of δ18O compositions
exhibited by waters in equilibrium with arc magmas or sub-duction-related volcanic vapor.
Sedimentary rocks are not present in the immediate vicin-ity of the Tuvatu deposit, although the Nadele Breccia, 2 kmsouthwest of Tuvatu, contains minor siltstone, sandstone, andlimestone (Colley and Flint, 1995). However, these rocks aredevoid of sulfides and are unlikely to have contributed sulfuror metals to the ore-forming system at Tuvatu. The spatial as-sociation of porphyry Cu mineralization (Kingston prospect)and gold telluride mineralization (Tuvatu and Banana Creekdeposits) with the Navilawa Monzonite makes this intrusionthe most likely source of sulfur and metals. The isotopic com-position of sulfides (δ34S = –5.8 to –3.2‰; mean = –4.9‰) instages 1 and 2 porphyry-style mineralization overlaps with therange of values normally ascribed to magmatic sulfur(Ohmoto, 1986) and that associated with an early porphyry-style event (δ34S = –5.5 to +6.5‰) from typical porphyry cop-per deposits (Richards and Kerrich, 1993). If phase separa-tion of the ore fluid took place during stages 1 and 2, thegreater volatility of H2S relative to oxidized S species, such as
TUVATU GOLD-SILVER TELLURIDE DEPOSIT, FIJI 153
0361-0128/98/000/000-00 $6.00 153
TABLE 6. Oxygen and Hydrogen Isotope Data for the Porphyry and Epithermal Stage Minerals at the Tuvatu Deposit
Notes: Silicate and oxide samples were analyzed for oxygen using the BrF5 extraction technique described by Clayton and Mayeda (1963); the hydrogenisotope analyses of phlogopite were determined by a method similar to that described by Vennemann and O’Neil (1993), where a Zn reagent is used for thequantitative conversion of H2O to H2; both the oxygen and hydrogen samples were analyzed with a Finnigan-MAT 252 stable isotope ratio mass spectrome-ter at Indiana University and their isotopic ratios are reported in the standard per mil notation relative to SMOW; the analytical precision for δ18O is ±0.05per mil and ±1 per mil for δD; fluid values for stages 2, 3, and 4 are calculated based on mean Th values of 310°, 300°, and 257°C of orthoclase, quartz, andsphalerite, respectively
1 Based on quartz-water oxygen isotope fractionation equation of Matsuhisa et al. (1979) 2 Based on feldspar-water, phlogopite-water and muscovite-water oxygen isotope fractionation equations of Zheng (1993a, b)3 Based on magnetite-water oxygen isotope fractionation equation of Bottinga and Javoy (1973)4 Based on phlogopite-water hydrogen isotope fractionation equation of Suzuoki and Epstein (1976)5 Ashley and Andrew (1989)
SO2, will cause an increase in fO2 in the residual liquid andcould produce the lower sulfur isotope values. Further phaseseparation during stage 3 could also account for the range ofδ34S of sulfides of –15.3 to –3.6 per mil (mean = –8.1‰) forstages 3 and 4. The fact that the early- and late-stage sulfurisotope values overlap supports the concept of a continuumbetween fluid sources for the porphyry and epithermal stagesof mineralization.
Low δ34S values of the Tuvatu sulfides could also resultfrom the direct addition of magmatic volatiles to the hy-drothermal fluid. At temperatures below 400°C, SO2 will dis-proportionate from volcanic gases into reduced and oxidizedspecies and ultimately result in the sulfide becoming en-riched in 32S relative to H2SO4 (Ohmoto and Rye, 1979).
Disproportionation of magmatic SO2 is common in epither-mal gold deposits (e.g., Arribas, 1995). Whether this processcan generate δ34S values in sulfides as low as –15.3 and –20.3per mil in the Tuvatu and Emperor deposits, respectively, isuncertain but a direct addition of magmatic volatiles to thehydrothermal fluids that formed these deposits cannot beruled out.
In any case, the low δ34S values of sulfides at Tuvatu suggesta shift to higher fO2 conditions during the evolution of the ore-forming system (Ohmoto, 1972). This interpretation is sup-ported by the transition from an assemblage dominated bypyrite and magnetite in the porphyry stage to an assemblageof pyrite and hematite in the epithermal stage (Fig. 11). Chlo-rite in stage 3 gives way to hematite in stage 4 which also
154 SCHERBARTH AND SPRY
0361-0128/98/000/000-00 $6.00 154
TABLE 7. Sulfur Isotope Compositions of Sulfides in the Tuvatu Prospect
Notes: T (°C) calculated from Ohmoto and Rye (1970): 1 = pyrite-galena: T = (1.01 × 10³)/(δpy-ga)1/2; 2 = sphalerite-galena: T = (0.85 × 10³)/(δsph-ga)1/2; andCampbell and Larson (1998): 3 = galena-chalcopyrite: T = (–0.58 × 10⁶)/(δgal-cp)1/2 West 1, West 2, West 4 are the Plant Site lodes shown in Figure 4; the lo-cation of the Nubunidike and Davui lodes are shown in Figure 3
Sulfide separates were cryogenically converted SO2 by combustion with vanadium pentoxide, utilizing the method of Yanagisawa and Sakai (1983)
reflects a change to higher fO2 conditions as the ore fluidsevolved. Spry and Scherbarth (2002) showed that the assem-blage calaverite-roscoelite-karelianite, which is present instage 4, forms under oxidizing conditions near the hematite-magnetite buffer. This assemblage also requires that the stage4 ore fluid was near neutral to slightly acid. Marked variationsin values of δ34S with time may also be the result of an in-crease in pH. For example, an effervescing CO2-rich ore fluidcould also produce an increase in pH; but, the absence of anyvisible CO2 in fluid inclusions in Tuvatu ore, gangue, and al-teration minerals suggests that this process was not impor-tant. Furthermore, the presence of K-feldspar in stage 2 andsericite and muscovite in stage 4 suggests that the pH of theore-forming fluid decreased.
Thermodynamic modeling by Cooke and McPhail (2001)predicts that tellurium species, Te2(g) and H2Te(g), are car-ried in the vapor phase and then condense to react with aque-ous gold-bearing species Au(HS)–
2 or Au(HS). However, it isunclear whether aqueous telluro-gold species such asAu(Te2)–, Au2(Te2)0, and Au(Te2)2
3– (Seward, 1973), Au thio-telluride (Starling et al., 1989), or Au(HTe)–
2 (Cooke andMcPhail, 2001) were precursor complexes to gold-rich tel-lurides in the Tuvatu deposit. Textural relationships amongtellurides at Tuvatu suggest that, in general, gold-rich tel-lurides (e.g., calaverite) formed prior to silver-rich tellurides(e.g., sylvanite and hessite) although they all formed duringstage 4. The stability of calaverite and nonprecious metaltellurides in the Tuvatu deposit are plotted in log fS2-log fTe2space at 250ºC (derived from approximate temperature offormation of coexisting stage 4 sphalerite; Fig. 17). The rangeof conditions indicated by calaverite-sphalerite assemblages(i.e., log fS2 = –13.3 to –11.3 and log fTe2 = –12.9 and –7.8)are based on equilibrium assemblages involving pyrite,calaverite, native gold, coloradoite, galena, and altaite, andthe range of compositions of sphalerite (1.1–10.5 mol % FeS)in equilibrium with pyrite. Note that the assemblages petzite-sylvanite and petzite-sylvanite-hessite, which have been iden-tified at the Tuvatu deposit, are unstable at temperatures>170ºC and likely formed from reactions involving the break-down of the metastable γ- or χ-phases of Cabri (1965).
Although Au contents of intrusive and extrusive rocks in theTuvatu area are not known, Ag, V, and Te data are available(Gill and Whelan, 1989). Geochemical studies of the Navi-lawa Monzonite (this study) and its extrusive equivalent, theSabeto Volcanics, have V contents of 280 to 387 ppm (mean= 317 ppm V) and 292 to 355 ppm (mean = 329 ppm V), re-spectively, and basaltic andesite dikes which crosscut the Nav-ilawa Monzonite but predate hydrothermal mineralizationcontain 235 to 465 ppm V (mean = 356 ppm V). These V con-centrations are comparable to those of intrusive and extrusiverocks spatially related to other porphyry and/or epithermalsystems, such as Emperor (146–259 ppm V, mean = 204 ppm:Rogers and Setterfield, 1994), the Gies deposit, Montana(11–208 ppm V, mean = 91 ppm: Zhang and Spry, 1994), andthe Porgera deposit, Papua New Guinea (197–338 ppm V,mean = 259 ppm: Richards, 1990) where roscoelite is presentin the ore-forming stage. At Tuvatu, magnetite and phlogo-pite grains contain up to 0.69 and up to 0.49 wt percent V2O3,respectively, and are the likely hosts of vanadium. Similarcompositions have been reported for magnetite from alkaline
intrusions intimately associated with the Golden Sunlight(Zhang and Spry, 1994) and Porgera (Richards, 1990) de-posits. The Navilawa Monzonite contains 0.02 to 0.65 ppm Te(mean = 0.11 ppm) and up to 2.5 ppm Ag, and basaltic-an-desite dikes contain 0.02 to 1.17 ppm Te (mean = 0.28 ppm)and up to 2.8 ppm Ag. Although we are unable to determinethe volumes of the Navilawa Monzonite and the basaltic-an-desite dikes, and thus their Ag, V, and Te budgets, we specu-late that the concentrations of these elements in the NavilawaMonzonite are sufficient to account for the Ag, Te, and V inthe Tuvatu deposit.
Comparison between the Tuvatu and Emperor ore systems
Gold reserves for the Tuvatu and the Emperor gold de-posits are different by more than an order of magnitude; how-ever, they share several geological, geochemical, and geo-physical attributes. These similarities suggest a commonorigin for the two mineralizing systems. Both are associatedwith prominent regional-scale gravity anomalies along theViti-Levu lineament. The Emperor deposit occurs along themargins of the Tavua volcano whereas the Tuvatu deposit isconsidered to have formed adjacent to an eroded shoshonitevolcano (Colley and Flint, 1995). The deposits are spatiallyrelated to monzonite intrusive and extrusive rocks of similarcomposition (e.g., Fig. 10) and of almost identical age(~5.4–4.6 Ma). A 3.89 ± 0.05 Ma 40Ar-39Ar age for porphyry-and epithermal-style mineralization at the Emperor deposit issimilar to a U-Th-He age of 3.5 ± 0.1 Ma of apatite inporphyry-style mineralization at the Tuvatu deposit. Both
TUVATU GOLD-SILVER TELLURIDE DEPOSIT, FIJI 155
0361-0128/98/000/000-00 $6.00 155
FIG. 17. Log fS2 vs. log fTe2 diagram showing the approximate conditions(shaded area) for stage 4 mineralization at 250°C. Equilibria were calculatedusing data listed in Afifi et al. (1988).
deposits exhibit a genetic relationship between low-gradeporphyry Cu mineralization and epithermal gold telluridemineralization, with the latter forming in flatmakes, steepfaults, shatter zones, stockworks, and hydrothermal brecciasin both deposits. These deposits also possess similar alterationstyles, pyrite morphologies (some with a high As content),paragenetic sequences, and telluride mineralogy.
Although fluids responsible for porphyry-style mineraliza-tion at both places were likely boiling, those associated withthe porphyry-style mineralization at Emperor were cooler(~350°C) and generally less saline (up to ~15 wt % NaClequiv) than those associated with porphyry-style mineraliza-tion in the Tuvatu and H lodes in the Tuvatu deposit (Eatonand Setterfield, 1993; Begg et al., 1997). Ore-bearing fluidscooled progressively from early to late stages in both deposits,with the initial deposition of tellurides at approximately250°C. At the Emperor deposit, the temperature of the orefluids further decreased from 250° to 170°C as salinities de-creased from about 13 to 5 wt percent NaCl equiv (Ahmad etal., 1987; Begg et al., 1997).
Both deposits are characterized by the association Au-Ag-Te-V in which precious metal tellurides are intergrown withvanadium minerals. At Emperor and Tuvatu, calaverite is in-tergrown with roscoelite but it is also intergrown with kare-lianite, nolanite, schreyerite, vanadian rutile, and an unnamedvanadian silicate [VSiO3(OH)] in the Tuvatu deposit. Gold-rich tellurides likely preceded the deposition of silver-rich tel-lurides in both deposits.
Ahmad et al. (1987) proposed that oxygen and hydrogenisotope data from the Emperor deposit indicate possible con-tributions of magmatic water, seawater, and meteoric waters.However, Begg (1996) considered that the Emperor porphyryand epithermal systems formed largely from fluids derivedfrom a degassed magma with probable contributions from cir-culating meteoric waters in varying degrees of partial isotopicequilibrium with local volcanic rocks. Calculated oxygen andhydrogen isotope compositions of ore fluids from the Em-peror and Tuvatu deposits both overlap the range of compo-sitions of waters exsolved from arc magmas.
Ahmad et al. (1987) reported δ34S values of –15.3 to –4.2per mil for nine pyrite samples and one galena sample fromearly to late hydrothermal stages at Emperor and indicatedthat the isotopic compositions shifted to lower values withtime. Begg (1996) reported δ34S values of –6.5 to +3.9 per milfrom porphyry-stage sulfides and –20.0 to –0.9 per mil fromepithermal-stage sulfides. The range of values of δ34S of sul-fides from Tuvatu (–15.3 to –3.2‰) is similar to that of Em-peror sulfides (–20.3 to +3.9‰). The source of sulfur for sul-fides in the Tuvatu deposit was most likely the NavilawaMonzonite, and local monzonitic stocks were probably alsothe source of sulfur for the Emperor deposit (Eaton and Set-terfield, 1993; Begg, 1996). These rocks were also the likelysources for other ore-forming components including Au, Ag,Cu, V, and Te.
Implications for exploration
The Tuvatu and Emperor deposits are low-sulfidation golddeposits hosted by alkaline igneous rocks and, in this respect,share geologic affinities with other low-sulfidation deposits inthe southwest Pacific (e.g., Porgera, Papua New Guinea,
Richards and Kerrich, 1993; Mt. Kare, Papua New Guinea,Richards and Ledlie, 1993; Ladolam, Papua New Guinea,Carman, 2003; Acupan, Philippines, Cooke and McPhail,2001). Among these geologic similarities is the transition fromporphyry- to epithermal-style gold mineralization at Porgeraand Ladolam, which is also apparent at Far Southeast-Lep-anto, Philippines (Hedenquist et al., 1998). In addition, thereappears to be a genetic relationship between large epithermalgold deposits and spatially related small satellite deposits orprospects. Examples include the Porgera and Mt. Kare de-posits, which are 18 km apart (Richards and Ledlie, 1993),the Ladolam deposit and Conical Seamount occurrence, lo-cated 10 km apart (Petersen et al., 2002), and the Emperorand Tuvatu deposits. In each of these examples, there is astrong similarity between the geologic setting, the composi-tion of the igneous rocks genetically related to mineralization,and the precious metal mineralization and associated alter-ation for the large deposit and its satellite. All four occur-rences in Papua New Guinea are related to complex conver-gent tectonics, and both Richards and Ledlie (1993) andPetersen et al. (2002) point toward district-scale magmaticevents to explain the close spatial and genetic relationshipsbetween the large and satellite deposits. For the Emperorand Tuvatu deposits, adjacent monzonites and shoshoniticlavas was erupted during the early stages of the break-up ofthe Vanuatu-Fiji-Tonga arc following intra-arc collision. Innorthwestern Viti Levu, the emplacement of these lavas wasrelated to north-south compression along the Viti Levu linea-ment and likely resulted in the formation of highly prospec-tive epithermal gold mineralization at Emperor and Tuvatu.
Exploration for epithermal gold mineralization along theViti Levu lineament over the last two decades has identifiedadditional prospects in the shoshonitic Ba and KoroimavuaGroups in the Vuda, Ba, and Raki Raki areas (Colley andFlint, 1995) and these also may be satellites of the Emperorand Tuvatu deposits. The area around the Navilawa Mon-zonite has been a focus of exploration since the mid 1980s. In1987, Continental Resources discovered the Banana Creekprospect, 3 km northeast of the Tuvatu prospect (Colley andFlint, 1995). It occurs along the margins of the NavilawaMonzonite and is along strike from the structure that hoststhe Tuvatu prospect. Mincor Resources subsequently drilledthe prospect in 1999 and it was more recently drilled by Al-caston Mining in 2002. Alcaston Mining discovered Tuvatu-style gold telluride mineralization with some specimens con-taining up to 72g/t Au (Alcaston Mining NL, 2004 annualreport). They intersected several gold veins with one signifi-cant gold-bearing vein intercept containing 0.4 m at 23.4 g/tgold and 6.3 g/t Ag.
AcknowledgmentsThis study was funded by Emperor Gold Mining Company
Limited (EGMCL) and by a Society of Economic GeologistsHugh E. McKinstry student research grant to NLS. EGMCLgeologists, Tony Woodward, David A-Izzeddin, AkuilaTawaka, Christine Fung, Saimoni Tuibau, and Don Milellaare thanked for discussing various aspects of Tuvatu geologyand for guidance during underground and core shed visits.Brent McInnes generously provided us with the unpublishedAr-Ar age of apatite. We also acknowledge the assistance of
156 SCHERBARTH AND SPRY
0361-0128/98/000/000-00 $6.00 156
Stephen Chryssoulis with SIMS analyses and Doug Crowe,Bill McClain, and Ed Ripley with stable isotope analyses.Adriana Heimann assisted with drafting. This manuscript wasgreatly improved by the reviews of Jeff Hedenquist, and D.C.“Bear” McPhail and the editorial suggestions of Mark Han-nington.
January 22, 2003; February 16, 2006
REFERENCESAfifi, A.M., Kelly, W.C., and Essene, E.J., 1988, Phase relations among tel-
lurides, sulfides, and oxides: I. Thermochemical data and calculated equi-libria: ECONOMIC GEOLOGY, v. 83, p. 377–294.
Ahmad, M., Solomon, M., and Walsh, J.L., 1987, Mineralogical and geo-chemical studies of the Emperor gold telluride deposit, Fiji: ECONOMICGEOLOGY, v. 82, p. 345–370.
A-Izzeddin, D., 1998, The Tuvatu gold project, western Viti Levu [abs.]: Pa-cific Exploration Technology (PET 98), Nadi, Fiji, September 1998, Ab-stract Volume, p. 29–30.
Anders, E., and Grevasse, N., 1989, Abundance of elements: Meteoritic andsolar: Geochimica et Cosmochimica Acta, v. 53, p. 197–214.
Arribas, A., Jr., 1995, Characteristics of high sulfidation epithermal depositsand their relation to magmatic fluid: Mineralogical Association of CanadaShort Course Series, v. 23, p. 419–454.
Ashley, P.M., and Andrew, A.S., 1989, Petrographic, fluid inclusion and sta-ble isotope investigation of a suite of samples from the Tuvatu prospect,Fiji: Commonwealth Scientific Industrial Research Organization, Divisionof Exploration Geoscience, Unpublished Restricted Report 50R, 33 p.
Begg, G., 1996, Genesis of the Emperor gold deposit, Fiji: UnpublishedPh.D. thesis, Clayton, Australia, Monash University, 466 p.
Begg, G., and Gray, D.R., 2002, Arc dynamics and tectonic history of Fijibased on stress and kinematic analysis of dikes and faults of the Tavua vol-cano, Viti Levu Island, Fiji: Tectonics, v. 21, p. 1–14.
Begg, G.C., Loucks, R.R., Gray, D.R., Foster, D.A., Kent, A.J., and Cooke,D.R., 1997, Magmas, fluids, and tectonics: The Emperor story [abs.]: Geo-logical Society of Australia Abstracts 44, p. 7.
Bodnar, R.J., and Vityk, M.O., 1994, Interpretations of microthermometricdata for H2O-NaCl fluid inclusions, in DeVivo, B., and Frezzotti, M.L.,eds., Fluid inclusions in minerals: Methods and applications: Blacksburg,Virginia Polytechnic Institute and State University Press, p. 117–130.
Bodnar, R.J., Burnham, C.W., and Sterner, S.M., 1985, Synthetic fluid inclu-sions in natural quartz. III. Determination of phase equilibrium propertiesin the system H2O-NaCl to 1000°C and 1500 bars: Geochimica et Cos-mochimica Acta, v. 49, 1861–1873.
Bottinga, Y., and Javoy, M., 1973, Comments on oxygen isotope geother-mometry: Earth and Planetary Science Letters, v. 20, p. 250–265.
Cabri, L.J., 1965, Phase relations in the Au-Ag-Te system and their miner-alogical significance: ECONOMIC GEOLOGY, v. 60, p. 1569–1606.
Campbell, A.R., and Larson, P.B., 1998, Introduction to stable isotope appli-cations in hydrothermal systems: Reviews in Economic Geology, v. 10, p.173–193.
Carman, G.D., 2003, Geology, mineralization, and hydrothermal evolution ofthe Ladolam gold deposit, Lihir Island, Papua New Guinea: Society of Eco-nomic Geologists Special Publication 10, p. 247–284.
Clayton, R.N., and Mayeda, T.K., 1963, The use of bromine pentafluoride inthe extraction of oxygen from oxides and silicates for isotopic analysis:Geochimica et Cosmochimica Acta, v. 27, p. 43–52.
Colley, H., and Flint, D.J., 1995, Metallic mineral deposits of Fiji: Fiji Min-eral Resources Department Memoir 4, 196 p.
Cooke, D.R., and McPhail, D.C., 2001, Epithermal Au-Ag-Te mineraliza-tion, Acupan, Baguio district, Philippines: Numerical simulations of min-eral deposition: ECONOMIC GEOLOGY, v. 96, p. 109–132.
Eaton, P.C., and Setterfield, T.N., 1993, The relationship between epither-mal and porphyry hydrothermal systems within the Tavua caldera, Fiji:ECONOMIC GEOLOGY, v. 88, p. 1053–1083.
Giggenbach, W.F., 1992, Isotopic shifts in waters from geothermal and vol-canic systems along convergent plate boundaries and their origins: Earthand Planetary Science Letters, v. 113, p. 495–510.
Gill, J.B., and Whelan, P., 1989, Early rifting of an oceanic island arc (Fiji)produced shoshonitic to tholeiitic basalts: Journal of Geophysical Research,v. 94, p. 4561–4578.
Gill, J.B., Stork, A.L., and Whelan, P.M., 1984, Volcanism accompanyingbackarc basin developments in the southwest Pacific: Tectonophysics, v.102, p. 207–224.
Haas, J.L., Jr., 1971, The effect of salinity on the maximum thermal gradientof a hydrothermal system at hydrostatic pressure: ECONOMIC GEOLOGY, v.66, p. 940–946.
Hamburger, M.W., and Isacks, B.L., 1988, Diffuse back-arc deformation inthe southwestern Pacific: Nature, v. 332, p. 599–604.
Hatcher, R., 1998, Relation of structures, alteration and mineralisation at theTuvatu gold prospect, Viti Levu, Fiji islands: Unpublished Bachelor of Ap-plied Science thesis, Brisbane, Queensland Institute of Technology, 151 p.
Hathaway, B., 1993, The Nadi basin: Neogene strike-slip faulting and sedi-mentation in a fragmental arc, western Viti Levu, Fiji: Journal of the Geo-logical Society of London, v. 150, p. 563–581.
Hedenquist, J.W., Arribas, A., Jr., and Reynolds, T.R., 1998, Evolution of anintrusion-centered hydrothermal system: Far Southeast-Lepanto porphyryand epithermal Cu-Au deposits, Philippines: ECONOMIC GEOLOGY, v. 93, p.373–404.
Korotev, R.L., 1996, A self-consistent compilation of elemental concentrationdata for 93 geochemical reference samples:P Geostandards Newsletter 20,p. 217–245.
Le Bas, M.J., Le Maitre, R.W., Streickeisen, A., and Zanettin, B., 1986, Achemical classification of volcanic rocks based on total alkali-silica diagram:Journal of Petrology, v. 27, p. 745–750.
Matsuhisa, Y., Goldsmith, J.R., and Clayton, R.N., 1979, Oxygen isotopicfractionation in the system quartz-albite-anorthite-water: Geochimica etCosmochimica Acta, v. 43, p. 1131–1140.
McDougall, I., 1963, Potassium-argon ages of some rocks from Viti Levu,Fiji: Nature, v. 198, p. 677.
Miyashiro, A., 1978, Nature of alkalic volcanic rock series: Contributions toMineralogy and Petrology, v. 66, p. 91–104.
Morrison, G.W., 1980, Characteristics and tectonic setting of the shoshoniterock association: Lithos, v. 13, p. 97–108.
Ohmoto, H., 1972, Systematics of sulfur and carbon isotopes in hydrothermalore systems: ECONOMIC GEOLOGY, v. 67, p. 551–578.
——1986, Stable isotope geochemistry of ore deposits: Reviews in Mineral-ogy, v. 16, p. 491–559.
Ohmoto, H., and Rye, R.O., 1979, Isotopes of sulfur and carbon, in Barnes,H.L., ed., Geochemistry of hydrothermal ore deposits, 2nd ed.: New York,Wiley Interscience, p. 509–567.
Pals, D.W., and Spry, P.G., 2003, Telluride mineralogy of the low-sulfidationepithermal Emperor gold deposit, Vatukoula, Fiji: Mineralogy and Petrol-ogy, v. 79, p. 285–307.
Pals, D.W., Spry, P.G., and Chryssoulis, S.L., 2003, Invisible gold and tel-lurium in arsenic-rich pyrite from the Emperor gold deposit, Fiji: Implica-tions for gold distribution and deposition: ECONOMIC GEOLOGY, v. 98, p.479–493.
Pearce, J.A., and Cann, J.R., 1973, Tectonic setting of basic volcanic rocks de-termined using trace element analyses: Earth and Planetary Science Let-ters, v. 19, p. 290–300.
Petersen, S., Herzig, P.M., Hannington, M.D., Jonasson, I.R., and Arribas,A., Jr., 2002, Submarine gold mineralization near Lihir Island fore-arc,Papua New Guinea: ECONOMIC GEOLOGY, v. 97, p. 195–1813.
Richards, J.P., 1990, Petrology and geochemistry of alkalic intrusives at thePorgera gold deposit, Papua New Guinea: Journal of Geochemical Explo-ration, v. 35, p. 141–199.
Richards, J.P., and Kerrich, R., 1993, The Porgera gold mine, Papua NewGuinea: Magmatic hydrothermal to epithermal evolution of an alkalic-typeprecious metal deposit: ECONOMIC GEOLOGY, v. 88, p. 1017–1052.
Richards, J.P., and Ledlie, I., 1993, Alkalic intrusive rocks associated with theMount Kare gold deposit, Papua New Guinea: Comparison with the Porg-era intrusive complex: ECONOMIC GEOLOGY, v. 88, p. 755–782.
Rodda, P., 1967, Outline of the geology of Viti Levu, Fiji: New Zealand Jour-nal of Geology and Geophysics, v. 10, p. 1260–1273.
Rogers, N.W., and Setterfield, T.N., 1994, Potassium and incompatible-ele-ment enrichment in shoshonitic lavas from the Tavua volcano, Fiji: Chem-ical Geology, v. 118, p. 43–62.
Scherbarth, N.L., 2002, Petrological, mineralogical, fluid inclusion and stableisotope characteristics of the Tuvatu gold-silver telluride deposit, upper Sa-beto River, Fiji: Unpublished M.Sc. thesis, Ames, Iowa State University,157 p.
Setterfield, T.N., Eaton, P.C., Rose, W.J., and Sparks, R.S.J., 1991, The Tavuacaldera, Fiji: A complex shoshonitic caldera formed by concurrent faulting
TUVATU GOLD-SILVER TELLURIDE DEPOSIT, FIJI 157
0361-0128/98/000/000-00 $6.00 157
and downsagging: Journal of the Geological Society of London, v. 148, p.115–127.
Setterfield, T.N., Mussett, A.E., and Oglethorpre, R. D. J., 1992, Magmatismand associated hydrothermal activity during the evolution of the Tavuacaldera: 40Ar-39Ar dating of the volcanic intrusive, and hydrothermal events:ECONOMIC GEOLOGY, v. 87, p. 1130–1140.
Seward, T.M., 1973, Thio complexes of gold and transport of gold in hy-drothermal solutions: Geochimica et Cosmochimica Acta, v. 37, p.379–399.
Spry, P.G., and Scherbarth, N.L., 2002, The vanadium-tellurium-gold associ-ation at the epithermal Tuvatu gold deposit, Fiji: Implications for ore de-position [abs.]: Geological Society of Australia, Abstracts 67, p. 342.
Starling, A., Gilligan, J.M., Carter, A.H.C., Foster, R.P., Saunders, R.A., 1989,High-temperature hydrothermal precipitation of precious metals on thesurface of pyrite: Nature, v. 340, no. 6231, p. 298–300.
Sterner, S.M., Hall, D.L., and Bodnar, R.J., 1988, Systematic fluid inclusions:Solubility relations in the system NaCl-KCl-H2O under vapor-saturatedconditions: Geochimica et Cosmochimica Acta, v. 52, p. 989–1006.
Sun, S.-S., and McDonough, W.F., 1989, Chemical and isotopic systematicsof oceanic basalts: Implications for mantle composition and processes: Ge-ological Society of London Special Publication 42, p. 313–345.
Suzuoki, T., and Epstein, S., 1976, Hydrogen isotope fractionation betweenOH-bearing minerals and water: Geochimica et Cosmochimica Acta, v. 40,p. 1229–1240.
Taylor, B.E., 1992, Degassing of H2O from rhyolite magma during eruptionand shallow intrusion and the isotopic composition of magmatic water inhydrothermal systems: Geological Survey of Japan Report 279, p. 190–194.
Turner, S.J., 1986, Fluid inclusion, alteration and ore mineral studies of anepithermal, mineralised vein system: Mount Kasi, Vanua Levu, Fiji: Un-published M.Sc .thesis, Auckland, New Zealand, University of Auckland,142 p.
Vennemann, T.W., and O’Neil, J.R., 1993, A simple and inexpensive methodof hydrogen isotope and water analyses of minerals and rocks based on zincreagent: Chemical Geology, v. 103, p. 227–234.
Wolf, R.A., Farley, K.A., and Silver, L.T., 1996, Helium diffusion and lowtemperature thermochronology of apatite: Geochimica et CosmochimicaActa, v. 60, p. 4231–4240.
Yanagisawa, F., and Sakai, H., 1983, Thermal decomposition of barium sul-fate-vanadium pentoxide-silica glass mixtures for preparation of sulfurdioxide isotope ratio measurements: Analytical Chemistry, v. 55, p.985–987.
Zhang, X., and Spry, P.G., 1994, Petrological, mineralogical, fluid inclusionand stable isotope studies of the Gies gold-silver telluride deposit, JudithMountains, Montana: ECONOMIC GEOLOGY, v. 89, p. 602–628.
Zheng, Y.-F., 1993a, Calculation of oxygen isotope fractionation in anhydroussilicate minerals: Geochimica et Cosmochimica Acta, v. 57, p. 1079–1091.
_____1993b, Calculation of oxygen isotope fractionation in hydroxyl-bearingsilicates: Earth and Planetary Science Letters, v. 120, p. 247–263.