Page 1
Montana Tech LibraryDigital Commons @ Montana Tech
Graduate Theses & Non-Theses Student Scholarship
Summer 2019
MINERALOGY AND FLUID INCLUSIONSTUDY OF THE CRYSTAL MOUNTAINFLUORITE MINE, RAVALLI COUNTY,MONTANAFrancis Grondin
Follow this and additional works at: https://digitalcommons.mtech.edu/grad_rsch
Part of the Geological Engineering Commons
Page 2
MINERALOGY AND FLUID INCLUSION STUDY OF THE CRYSTAL
MOUNTAIN FLUORITE MINE, RAVALLI COUNTY, MONTANA
by
Francis Grondin
A thesis submitted in partial fulfillment of the
requirements for the degree of
Masters of Science in Geosciences: Geology Option
Montana Tech
2019
Page 3
ii
Abstract
The Crystal Mountain Fluorite Mine, known for its vast amounts of massively grown
fluorite and rare accessory minerals including fergusonite (YNbO4) and thortveitite (Sc2Si2O7), is
located in the Sapphire Mountains 22 km east of the town of Darby, Montana. This site has been
mined previously between the years of 1954 through 1973. The Taber collection of drill core,
thin sections, mine maps and miscellaneous reports on Crystal Mountain was recently donated to
the Montana Bureau of Mines and Geology for future studies. The purpose of the present study
has been to use modern methods of mineral identification and fluid inclusions on these samples
to better understand the origin of the deposit. Hand samples collected from drill core and in the
field were made into polished sections for analysis by SEM-EDS, Raman spectroscopy, and fluid
inclusion microthermometry. The fluorite itself varies from colorless to deep purple, and is
strongly enriched in yttrium (average of 1.51 wt% Y). The ore bodies were essentially pure
fluorite in shallow-dipping masses up to 7 meters thick and > 40m in diameter. Impurities
included silicate minerals (albite, phlogopite, quartz), Fe-oxides, titanite, apatite, thortveitite,
sulfide minerals (pyrite, pyrrhotite, chalcopyrite), thorite, fergusonite, allanite, xenotime,
monazite, and other REE-rich minerals. Thin sections of country rock show weak K-
metasomatism in the form of orthoclase replacing plagioclase and phlogopite replacing
amphibole. However, this alteration is subtle and is easily missed by visual inspection of
outcrops and hand samples. Near contacts with country rock, fluorite is intergrown with silicate
minerals in a texture that appears igneous.
Two populations of fluid inclusions were found in the fluorite. Primary inclusions
average 10-15m in size, are distributed randomly throughout the fluorite, and have homogenization temperatures from 350 to > 500ºC. All primary inclusions contain multiple
daughter minerals including halite, sylvite, ankerite, siderite, and quartz. Salinities determined
by the temperatures of halite dissolution ranged from 35 to 56 wt% NaCl. Secondary fluid
inclusions, which occur along healed fractures in the fluorite, are bigger at an average of 30-
50m, with no daughter minerals. However, these inclusions contain a double bubble at room
temperature which indicates a high CO2 content. Based on fluid inclusion geobarometry, the
fluorite at Crystal Mountain formed at a minimum pressure of about 3 kbar, which corresponds
to a depth of > 10 km.
The above observations suggest that Crystal Mountain is a unique example of a magmatic
fluorite deposit formed by crystallization of a fluoro-silicate melt that separated from a granitic
melt. This model is consistent with the high temperatures, high pressures, and elevated
concentrations of incompatible elements (Y, Nb, Ti, Sc, Th, REE) in the deposit, as well as the
geometry of the massive fluorite ore bodies. Similar high temperature and high salinity fluid
inclusions have been found in other fluorite deposits of western Montana, including the
Snowbird, Spar, and Wilson Gulch deposits. More work is needed to determine the ages of these
deposits and how they relate to one another.
Keywords: Geochemistry, fluid inclusion geobarometry, magmatic fluids, fluorite melt, Idaho
batholith, yttrium, scandium, rare earth elements
Page 4
iii
Dedication
This thesis could not be possible without the support of my loving mother Jeanne Prud’Homme
and father Jean Grondin. I dedicate this solely to them since without their emotional and
financial support I would not be here to complete a master’s degree in Geology and have a
kickstart on my career. It is impossible to thank you enough for the morals and values you have
taught me as a child. I could not have asked for better role-models. I also want to thank my
brother Christian and friends, Stephen, Kristen, Christian, and Tyler. Their support has given me
motivation and dedication to work hard. Thank you for all the laughs!
Page 5
iv
Acknowledgements
I would like to give a huge thank you to my advisor Dr. Chris Gammons for
keeping me on track and making all of this possible. I would also like to thank my
committee members Dr. Dick Berg and Dr. Larry Smith for their guidance during
my thesis writing and Dr. Dick Berg for his great editing. A big thank you to Ms.
Peggy Delaney for helping me find and organize all of the maps and cores I
needed from the Montana Bureau and AMC collection. Dr. Gary Wyss was
extremely helpful during SEM-EDS analysis with identification of minerals and
instrument operation. Finally, thank you to the Stan & Joyce Lesar foundation for
supporting and funding this research.
Page 6
v
Table of Contents
ABSTRACT ............................................................................................................................................. II
DEDICATION ........................................................................................................................................ III
ACKNOWLEDGEMENTS ........................................................................................................................ IV
LIST OF TABLES .................................................................................................................................... VII
LIST OF FIGURES ................................................................................................................................. VIII
LIST OF EQUATIONS ............................................................................................................................. XI
1. INTRODUCTION ................................................................................................................................. 1
1.1. Thesis Statement ................................................................................................................ 1
1.2. History of the Crystal Mountain Mine ................................................................................ 1
1.3. Geologic Setting ................................................................................................................. 2
1.4. Previous Studies ................................................................................................................. 4
2. METHODS ........................................................................................................................................ 7
2.1. Historical Documents ......................................................................................................... 7
2.2. Sample Collection ............................................................................................................... 7
2.3. Optical Petrography ........................................................................................................... 8
2.4. Raman Spectroscopy .......................................................................................................... 9
2.5. SEM-EDS ............................................................................................................................. 9
2.6. X-ray Diffraction ............................................................................................................... 10
2.7. Fluid Inclusions ................................................................................................................. 10
2.8. S-isotopes ......................................................................................................................... 13
3. RESULTS ......................................................................................................................................... 14
3.1. Description of the fluorite bodies ..................................................................................... 14
3.2. Mineralogy ....................................................................................................................... 18
Page 7
vi
3.2.1. Thin section petrography .................................................................................................................. 19
3.2.2. SEM results ........................................................................................................................................ 24
3.2.3. Raman Spectroscopy ......................................................................................................................... 29
3.3. Sulfur isotopes .................................................................................................................. 30
3.4. Fluid inclusions ................................................................................................................. 31
3.5. Other mineralogical work ................................................................................................ 35
3.5.1. Thortveitite ........................................................................................................................................ 35
3.5.2. Fluorite .............................................................................................................................................. 38
4. DISCUSSION .................................................................................................................................... 42
4.1. Conditions of fluorite formation ....................................................................................... 42
4.2. Association of fluorite with incompatible elements ......................................................... 44
4.3. Genetic model for the Crystal Mountain fluorite deposit ................................................. 46
4.4. Comparison of Crystal Mountain to other nearby deposits ............................................. 51
5. CONCLUSIONS ................................................................................................................................. 53
5.1. Recommendations ........................................................................................................... 55
6. REFERENCES CITED ........................................................................................................................... 56
7. APPENDIX A: (SEM-EDS ANALYSES) ................................................................................................ 61
8. APPENDIX B: (FLUID INCLUSION DATA) .............................................................................................. 67
Page 8
vii
List of Tables
Table I: List of minerals identified in this study. ...............................................................18
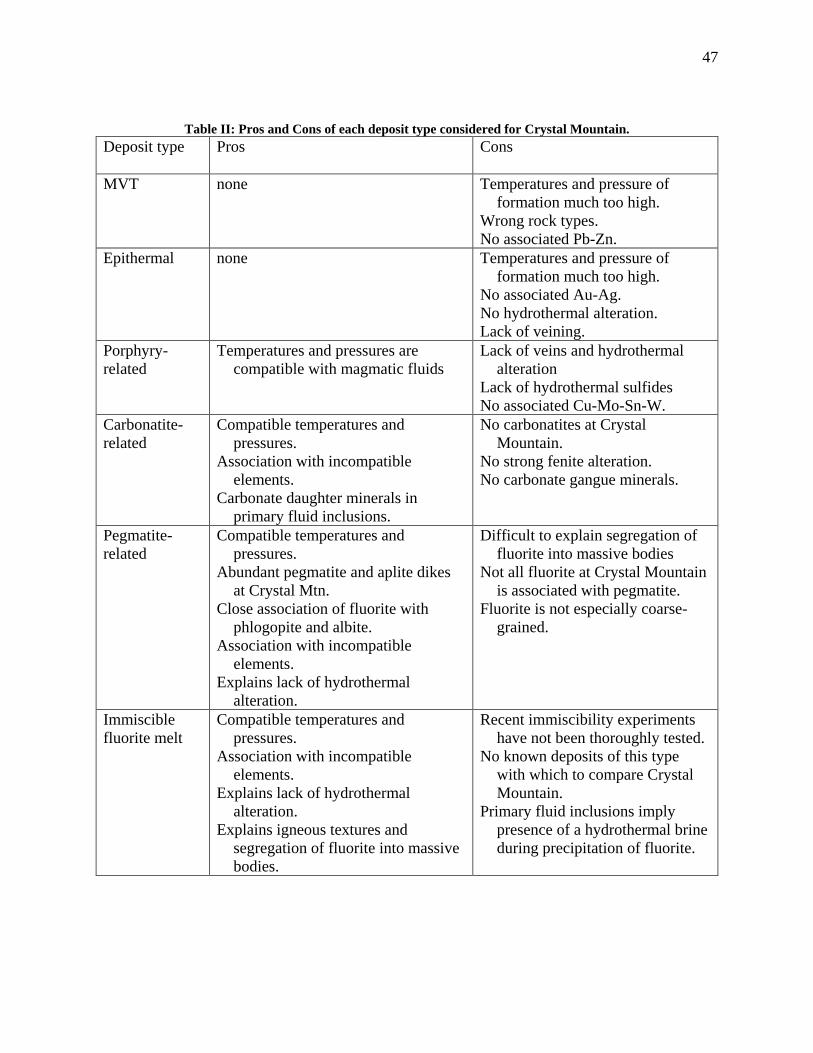
Table II: Pros and Cons of each deposit type considered for Crystal Mountain. ..............47
Page 9
viii
List of Figures
Figure 1: Location of the Crystal Mountain Mine. ..............................................................2
Figure 2: Geologic map of a portion of the Philipsburg 1:100,000 scale quadrangle showing the
location of the Crystal Mountain Mine (Modified from Lonn et al., 2003). ...........3
Figure 3: Diagrammatic cross-section showing the relationship between the Bitterroot core
complex and the Sapphire block ca. 51-50 Ma. (Modified from Foster and Fanning,
1997). .......................................................................................................................4
Figure 4: Plan map and cross-sections through the Crystal Mountain fluorite mine. Redrawn
from Taber (1952) ....................................................................................................5
Figure 5: Fluid inclusion station at Montana Tech. ...........................................................12
Figure 6: Photograph of the closed open-pit mine (looking north). ..................................14
Figure 7: A) Photograph of aplite-pegmatite dikes with mafic inclusions near bottom of the open
pit. B) Closeup showing rounded purple fluorite in a granite-pegmatite. .............15
Figure 8: East-west geologic cross section through the Crystal Mountain Mine (Redrawn from
section E-E' of Taber Collection, map #53232). ....................................................16
Figure 9: Photo of core from hole #183. Note the visible purple fluorite section. ............17
Figure 10: Handpicked fluorite samples from the Crystal Mountain Mine. ......................17
Figure 11: Thin section photographs of fluorite in granitic host rock. Images at left are in PPL,
right are in XPL. A, B = JWT -40; C, D = JWT -41b; E, F = JWT -51. ..............21
Figure 12: Thin section photographs showing thortveitite, fluorite, and phlogopite. Images at left
are in PPL, right are in XPL. A,B,C,D = JWT -41b; E,F = JWT -43. ..................22
Page 10
ix
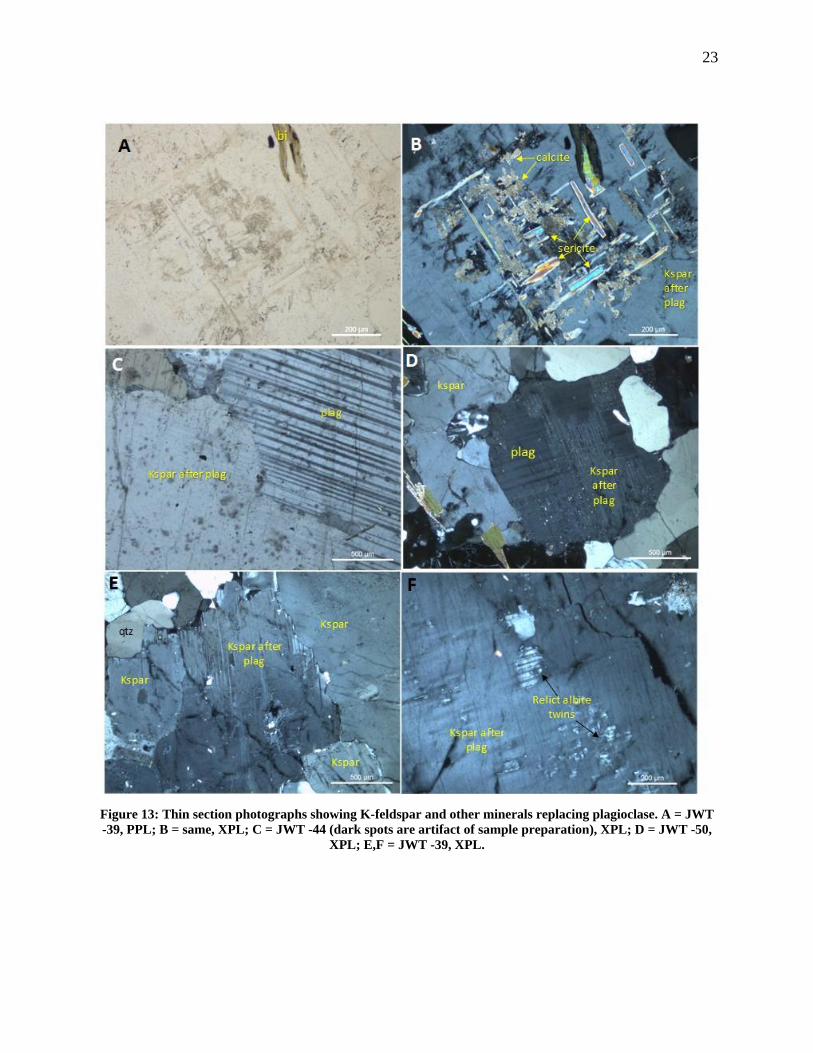
Figure 13: Thin section photographs showing K-feldspar and other minerals replacing
plagioclase. A = JWT -39, PPL; B = same, XPL; C = JWT -44 (dark spots are artifact of
sample preparation), XPL; D = JWT -50, XPL; E,F = JWT -39, XPL. ................23
Figure 14: SEM-BSE images of fluorite and accessory minerals. Abbreviations: fl = fluorite; qtz
= quartz; ap = apatite; phlog = phlogopite. ...........................................................25
Figure 15: SEM-BSE images of thorite and thorogummite (A,B), fergusonite and aeschynite (C,
D), and xenotime (E,F). Abbreviation: fl = fluorite. ..............................................27
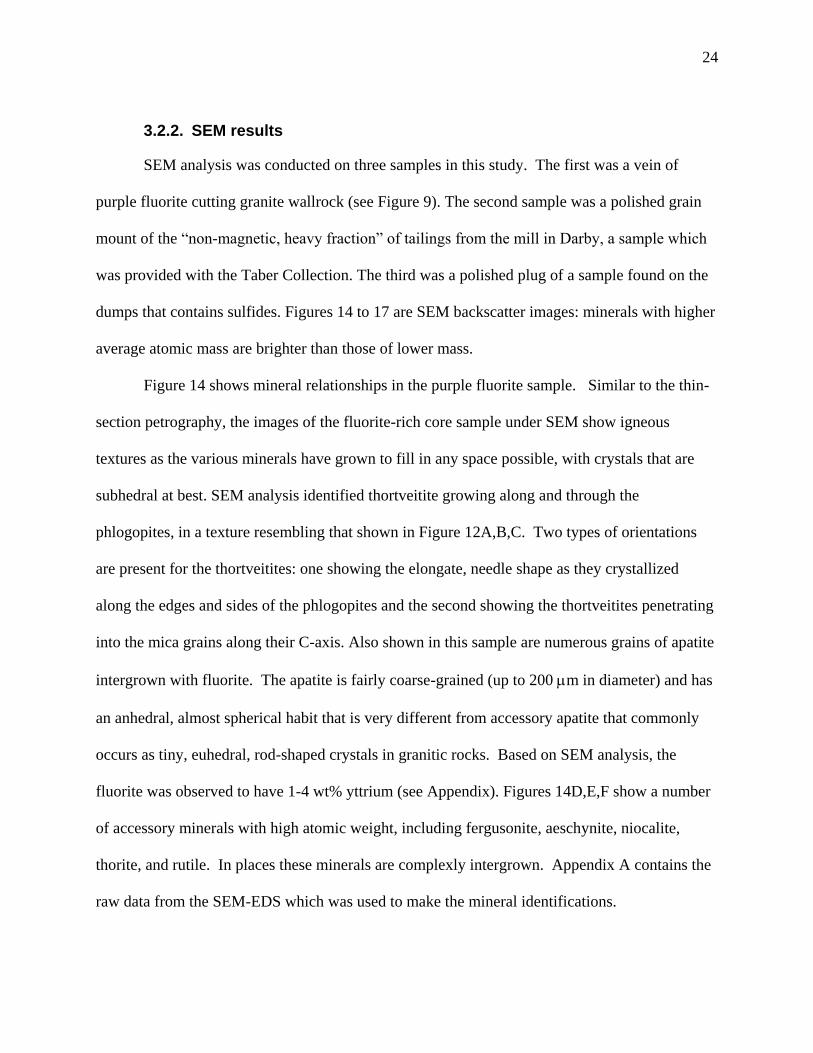
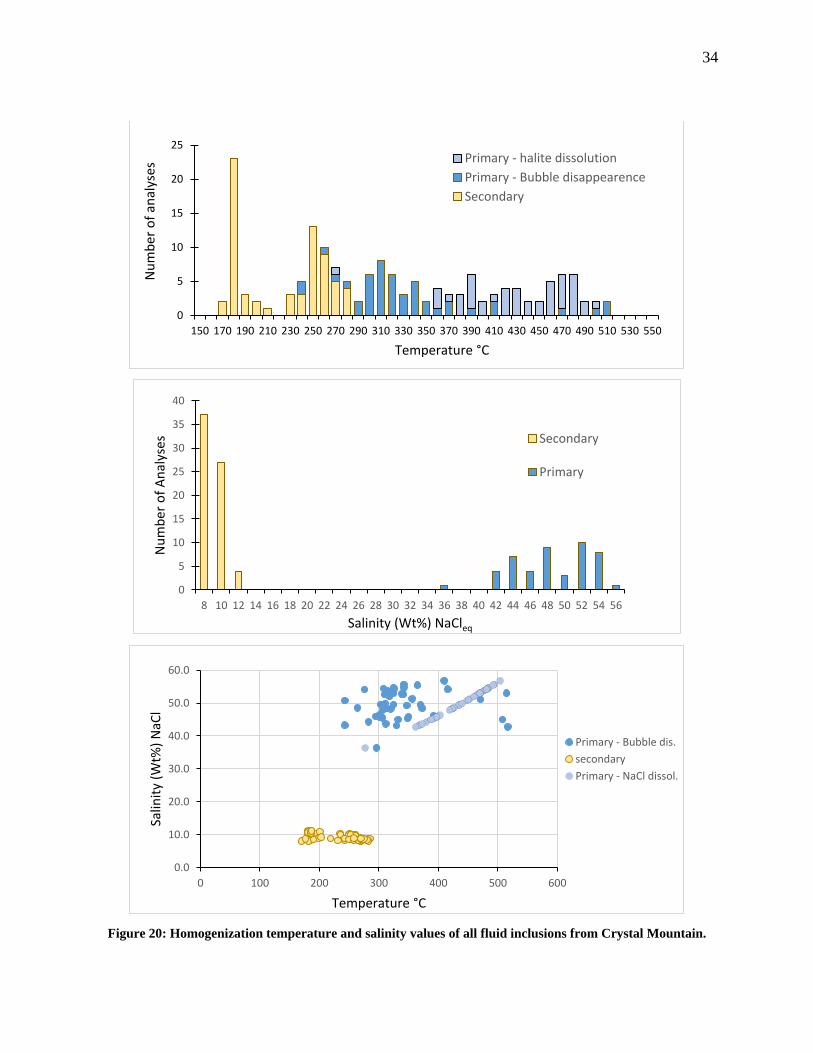
Figure 16: SEM-BSE images of miscellaneous heavy minerals. ......................................28
Figure 17: SEM-BSE image of sulfide mineral assemblage from Taber fluorite mine.
Abbreviations: po = pyrrhotite; pyr = pyrite; cpy = chalcopyrite; qtz = quartz....29
Figure 18: Petrographic images of primary fluid inclusions in fluorite from Crystal Mountain.
................................................................................................................................31
Figure 19: Petrographic images of secondary fluid inclusions from Crystal Mountain. ...32
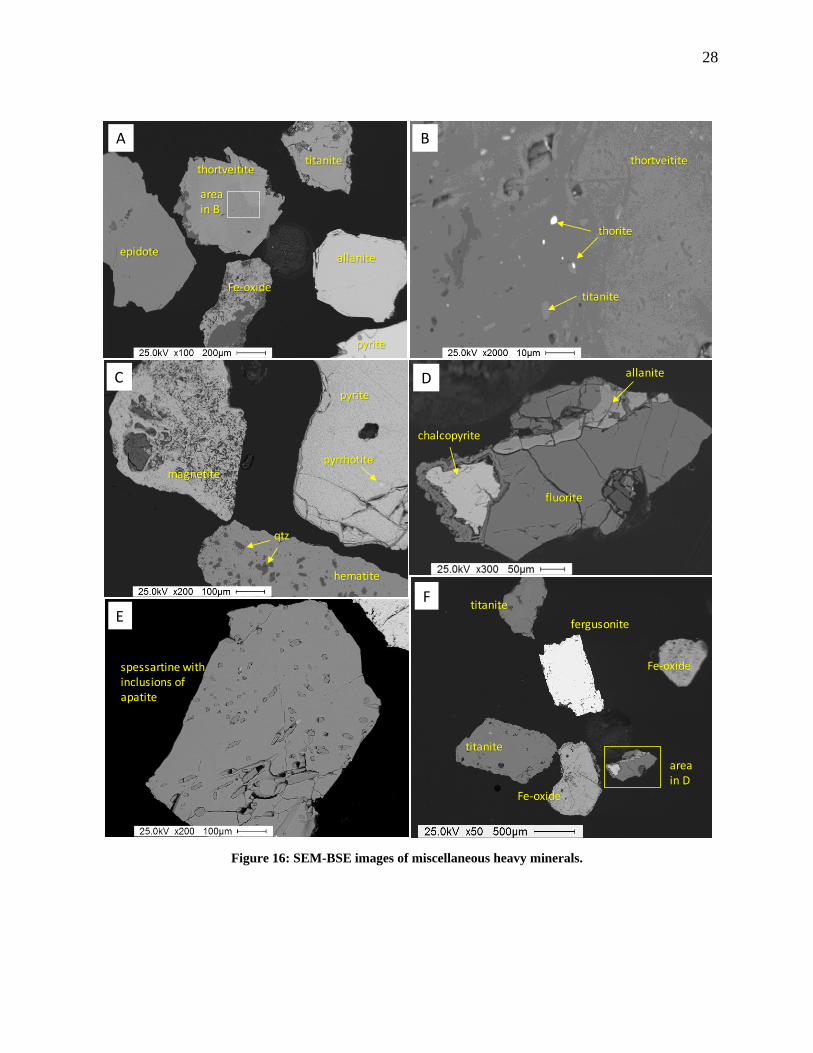
Figure 20: Homogenization temperature and salinity values of all fluid inclusions from Crystal
Mountain. ...............................................................................................................34
Figure 21: Thortveitite crystals from the Taber Collection with minor amounts of purple fluorite.
................................................................................................................................36
Figure 22: Raman spectra for thortveitite. Black pattern is thortveitite from Crystal Mountain
obtained in this study (514nm). Other patterns are for RRUFF ID #R060360 at 532nm
(blue), R061065 at 532nm (green) and 785nm (purple). .......................................37
Figure 23: XRD pattern of thortveitite obtained in this study (red) with a reference pattern of
peaks (grey). ...........................................................................................................38
Page 11
x
Figure 24: Raman spectra for fluorite. Black pattern is fluorite from Crystal Mountain obtained
in this study (514nm). Other patterns are for RRUFF ID #R050045 at 514nm (blue),
532nm (green) and 785nm (purple). ......................................................................39
Figure 25: XRD spectra of fluorite showing this study (red) with a reference peak pattern (dotted
black)......................................................................................................................40
Figure 26: XRD pattern of albite (green peaks) inclusions in fluorite. Purple lines correspond to
muscovite. Some fluorite may also be present. ......................................................41
Figure 27: Graph showing minimum pressures in MPa on primary fluorite fluid inclusions from
Crystal Mountain. Modified from Becker et al. (2008) .........................................43
Figure 28: Periodic table of elements modified to show incompatible elements found within the
Crystal Mountain deposit (red). .............................................................................46
Figure 29: Granite melt showing fluorite globules forming and sinking to the bottom of the melt.
................................................................................................................................50
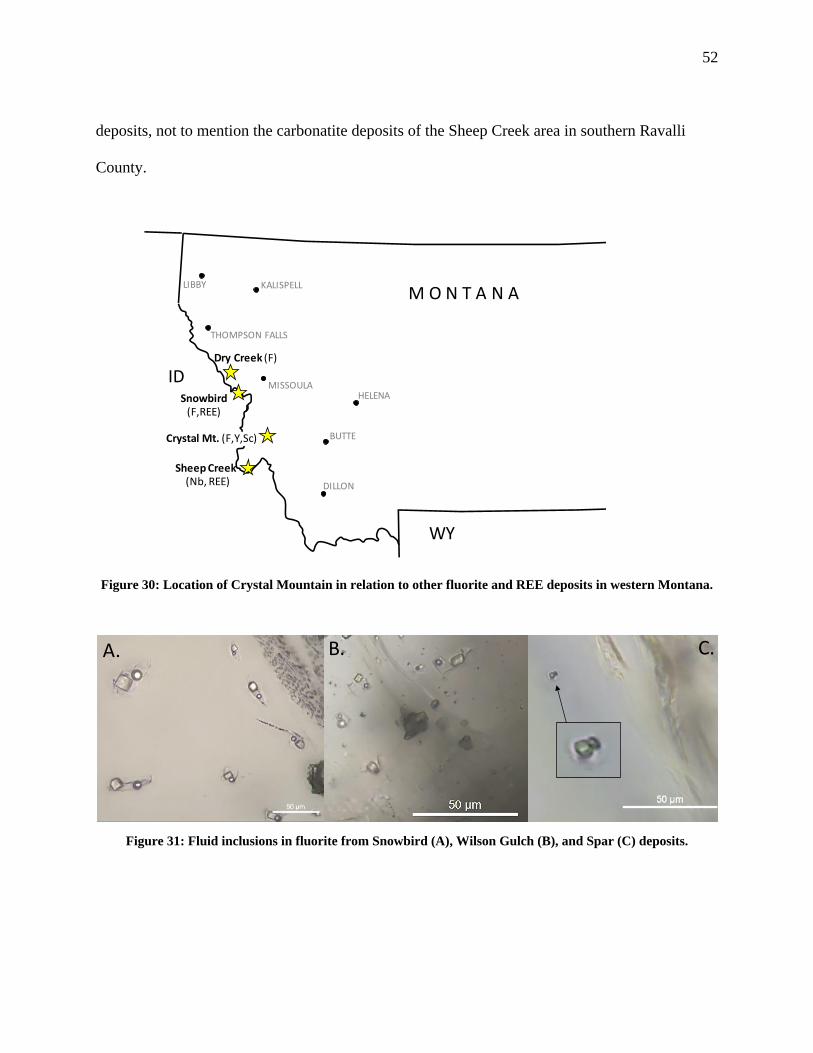
Figure 30: Location of Crystal Mountain in relation to other fluorite and REE deposits in western
Montana. ................................................................................................................52
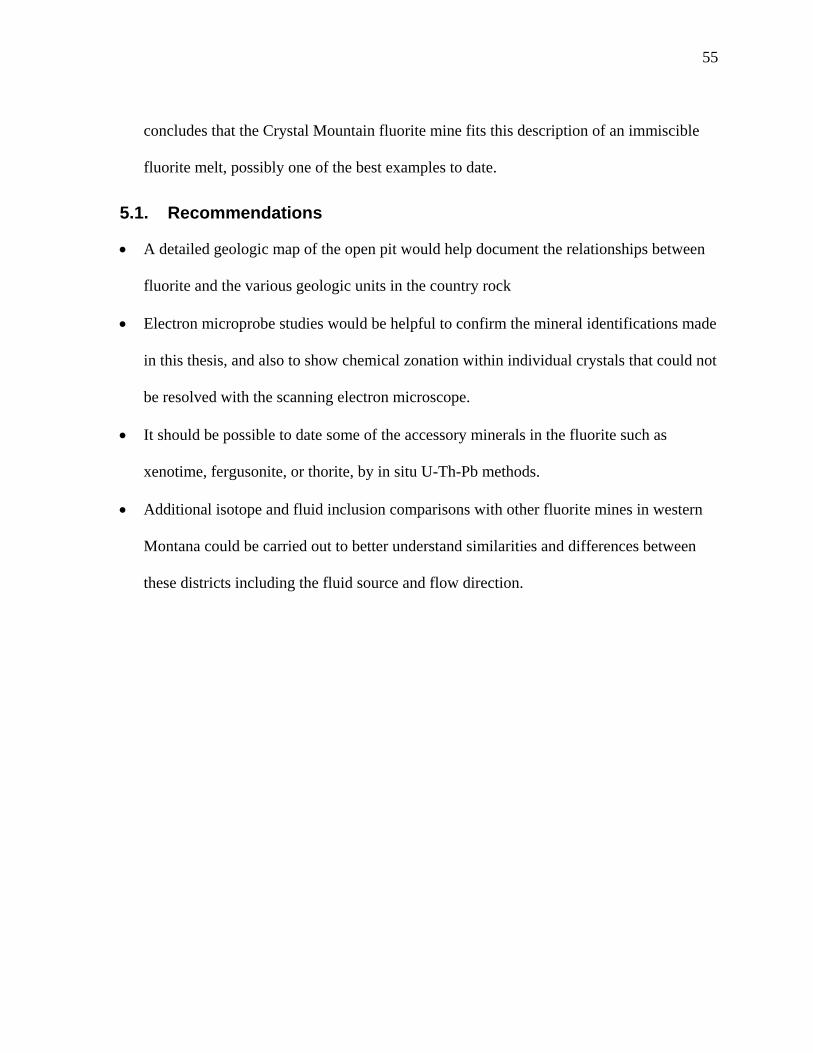
Figure 31: Fluid inclusions in fluorite from Snowbird (A), Wilson Gulch (B), and Spar (C)
deposits. .................................................................................................................52
Page 12
xi
List of Equations
Equation 1: K-spar (orthoclase) replacing Ca-rich plagioclase. ………………………… 20
Equation 2: K-spar replacing Na-rich plagioclase. ……………………………………… 20
Equation 3: Pyrrhotite altering to pyrite and siderite. …………………………………… 30
Equation 4: Salinity of secondary inclusions by freezing runs. ……………………...….. 34
Equation 5: Salinity of primary inclusions by halite dissolution. ……………………….. 36
Page 13
1
1. Introduction
1.1. Thesis Statement
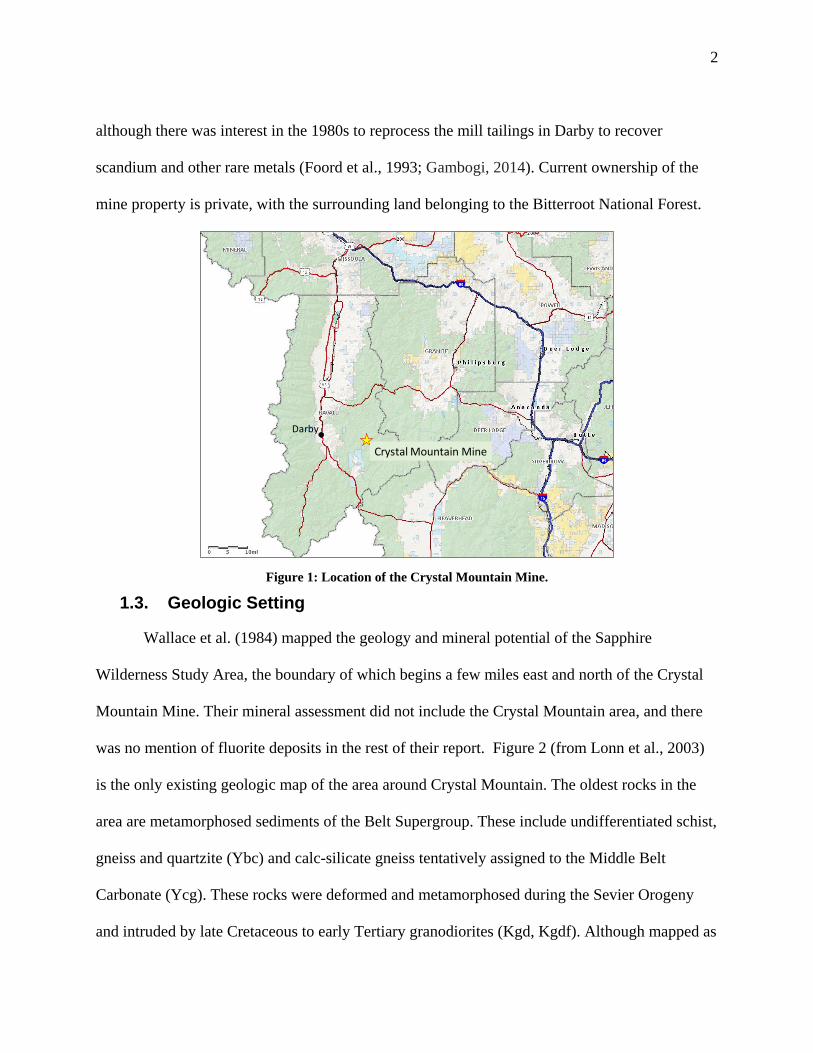
The Crystal Mountain fluorite mine is located in the southern Sapphire Mountains,
roughly 22 km east of the town of Darby, Montana (Figure 1). Despite having been the largest
producer of metallurgical-grade fluorite in the State (Geach, 1963), very little has been published
about this deposit. It is known to contain some rare minerals, including thortveitite (Sc2Si2O7),
fergusonite ((Y,REE)NbO4), thorite ((Th,U)SiO4), and xenotime ((Y,REE)PO4) (Foord et al.,
1993). The main objective of this thesis is to use modern methods of ore deposit investigation to
better understand the mineralogy and geochemistry of the Crystal Mountain fluorite deposit, and
to draw conclusions as to how it formed. This study was aided by a recent gift of a set of rocks,
exploration drill core, thin sections, and associated mine documents to the Mining Archives
Repository of the Montana Bureau of Mines and Geology. These materials are called the Taber
Collection, in honor of the prior operator of the mine, Mr. John W. Taber.
1.2. History of the Crystal Mountain Mine
The Crystal Mountain Mine is located in Ravalli County, sections 17 and 18, T3N, R18W
(lat. 46.00583N, long. 113.88667W) at an elevation of 6,800 ft. above sea level. Access is via 21
miles of dirt road from the Rye Creek Road turnoff on U.S. Highway 93, 4 miles south of Darby.
Economic interest began in 1937 when ore grade fluorite was discovered by L. I. Thomson and
A. E. Cumley (Taber, 1952). Open-pit mining operations took place by Roberts Mining
Company between the years of 1954 through 1973. According to the USGS Minerals Resource
Data System (MRDS, 2019), the primary commodity mined at Crystal Mountain was fluorite at
96% grade. No data on total production or reserves of fluorite are available, although in 1956 the
ore was being hauled to the mill in Darby at a rate of 50 T/hr. The mine is currently inactive,
Page 14
2
although there was interest in the 1980s to reprocess the mill tailings in Darby to recover
scandium and other rare metals (Foord et al., 1993; Gambogi, 2014). Current ownership of the
mine property is private, with the surrounding land belonging to the Bitterroot National Forest.
Figure 1: Location of the Crystal Mountain Mine.
1.3. Geologic Setting
Wallace et al. (1984) mapped the geology and mineral potential of the Sapphire
Wilderness Study Area, the boundary of which begins a few miles east and north of the Crystal
Mountain Mine. Their mineral assessment did not include the Crystal Mountain area, and there
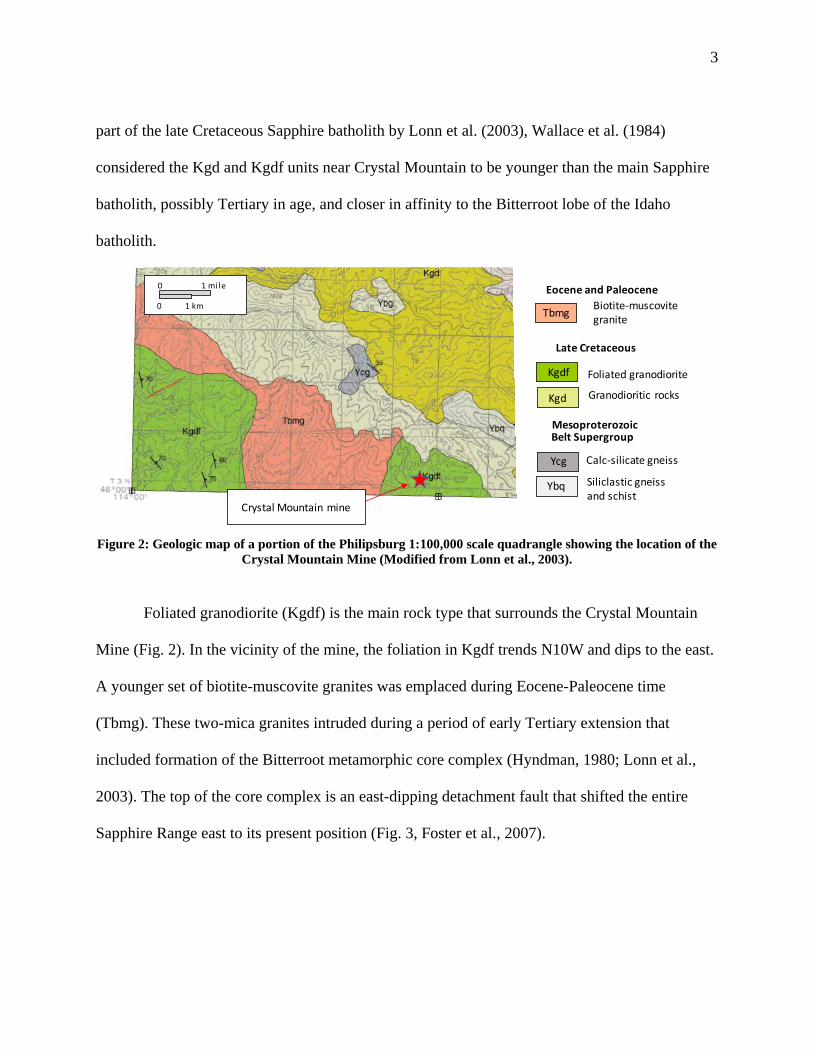
was no mention of fluorite deposits in the rest of their report. Figure 2 (from Lonn et al., 2003)
is the only existing geologic map of the area around Crystal Mountain. The oldest rocks in the
area are metamorphosed sediments of the Belt Supergroup. These include undifferentiated schist,
gneiss and quartzite (Ybc) and calc-silicate gneiss tentatively assigned to the Middle Belt
Carbonate (Ycg). These rocks were deformed and metamorphosed during the Sevier Orogeny
and intruded by late Cretaceous to early Tertiary granodiorites (Kgd, Kgdf). Although mapped as
Crystal Mountain Mine
Darby
Page 15
3
part of the late Cretaceous Sapphire batholith by Lonn et al. (2003), Wallace et al. (1984)
considered the Kgd and Kgdf units near Crystal Mountain to be younger than the main Sapphire
batholith, possibly Tertiary in age, and closer in affinity to the Bitterroot lobe of the Idaho
batholith.
Figure 2: Geologic map of a portion of the Philipsburg 1:100,000 scale quadrangle showing the location of the
Crystal Mountain Mine (Modified from Lonn et al., 2003).
Foliated granodiorite (Kgdf) is the main rock type that surrounds the Crystal Mountain
Mine (Fig. 2). In the vicinity of the mine, the foliation in Kgdf trends N10W and dips to the east.
A younger set of biotite-muscovite granites was emplaced during Eocene-Paleocene time
(Tbmg). These two-mica granites intruded during a period of early Tertiary extension that
included formation of the Bitterroot metamorphic core complex (Hyndman, 1980; Lonn et al.,
2003). The top of the core complex is an east-dipping detachment fault that shifted the entire
Sapphire Range east to its present position (Fig. 3, Foster et al., 2007).
0 1 mi le
0 1 km
Crystal Mountain mine
Ybq
Kgd
Siliclastic gneiss and schist
Kgdf
Tbmg
Granodioritic rocks
Foliated granodiorite
Biotite-muscovite granite
Eocene and Paleocene
Late Cretaceous
Mesoproterozoic
Ycg
Belt Supergroup
Calc-silicate gneiss
Page 16
4
Figure 3: Diagrammatic cross-section showing the relationship between the Bitterroot core complex and the
Sapphire block ca. 51-50 Ma. (Modified from Foster and Fanning, 1997).
1.4. Previous Studies
Despite being discovered in the 1930s, there was no mention of Crystal Mountain in a
1950 summary of fluorspar deposits in Montana (Ross, 1950). Fluorite at Crystal Mountain was
first described by Taber (1952, 1953), and the site was subsequently included in later
compilations of fluorite resources in Montana (Sahinen, 1962; Geach, 1963; Parker, 1976). Two
separate areas of fluorite mineralization, approximately 3000 feet apart, crop out at Crystal
Mountain. These are termed the Lumberjack Claims (to the west) and the Retirement Claims (to
the east). Figure 4, redrawn from Taber (1952), shows the general layout of the fluorite masses at
the Lumberjack Claims which were the focus of later open-pit mining. Three shallow-dipping,
tabular masses of nearly pure fluorite occur that are 100-200 feet thick and 200-400 feet long
(Taber, 1952, 1953). The fluorite ore was exceptionally pure (> 97% CaF2) and varied in color
from colorless-white to pale green to a deep purple. Taber (1952) did not give a detailed account
of rock types surrounding the fluorite bodies, referring to the country rock simply as “granite”.
A few details were added by later workers. For example, Weis et al. (1958) described large
“inclusions” of amphibole-plagioclase gneiss, biotite-quartz-plagioclase gneiss, and pegmatite
Crystal Mountain
deposit
Page 17
5
within the host granite, and pointed out that the foliation in the gneissic inclusions is
approximately parallel to the fluorite bodies. Parker (1976) stressed the existence of granite-
pegmatite dikes that are both older and younger than the fluorite. Foord et al. (1993) mentioned a
small outcrop of “melagabbro” at the Retirement Claims, and suggested that this rock is similar
to the inclusions of amphibole-plagioclase gneiss in the Lumberjack area.
Figure 4: Plan map and cross-sections through the Crystal Mountain fluorite mine. Redrawn from Taber
(1952)
AA’
B
B’
fluorite
“granite”
N
Contour interval: 25 feet
Lumberjack Claims: Plan View
6900´
6800´
A
A’
Lumberjack Claims: Cross Sections
6800´
6750´
BB’
0 100 200 ft
Page 18
6
The existence of minerals with high radioactivity at Crystal Mountain was first reported
by Weis et al. (1958). High counts were associated with purple fluorite near biotite, and were
attributed to the presence of microscopic inclusions of U-Th-bearing minerals, of which only
one, fergusonite, was identified. The rare mineral thortveitite (Sc2Si2O7) was first reported at
Crystal Mountain by Parker and Havens (1963), and later described in more detail by Foord et al.
(1993). According to Foord and others, the thortveitite occurs in areas of the fluorite that have
other mineral inclusions, such as biotite, magnetite, fergusonite, allanite-(Ce), xenotime,
clinopyroxene (ferroan diopside), and amphibole (actinolite and calcic edenite). Other minerals
reported by Foord et al. (1993) include apatite, chalcopyrite, spessartine, pyrite, titanite, rutile,
zircon, thorite, uranothorite, molybdenite, and thorianite (?). Foord and others stated that Crystal
Mountain was the only known occurrence of thortveitite in North America as of 1993, and one of
only about a dozen world-wide. The Mindat.com website (accessed in April, 2019) lists 61
reported localities for thortveitite, four of which are in N. America. Besides Crystal Mountain,
these include two sites in the Franklin area, New Jersey, and the Deadhorse Creek intrusive
complex near Thunder Bay, Ontario.
Based on the previous studies, it can be concluded that the fluorite ore bodies at Crystal
Mountain are highly unusual for their combination of size and purity, for their “clean” contacts
with the granitic host rocks (lacking evidence of hydrothermal alteration), and for their long list
of rare, associated minerals. The goal of this thesis is to try to explain these unusual features.
Page 19
7
2. Methods
2.1. Historical Documents
The Taber collection of thin sections and core from the Anaconda Mining Company
(AMC) collection at Montana Technological University made in the 1950s contains hundreds of
documents on the Crystal Mountain mine. Many of these documents include geologic maps of
the area, drill hole locations, production planning, and optical data on their collected thin
sections. The Montana Bureau of Mines and Geology digitized these documents through
scanning and most of the collection is now made available to the public for viewing and
downloading at http://mbmg.mtech.edu/mbmgcat/public/ListArchives.asp. For the purpose of
this study, many of the documents were reviewed and analyzed for information about the mine.
Some of the more predominant documents analyzed were the thin section petrography sheets,
geologic maps, cross-sections, and overall open pit layout designs. Thin section petrography
documents were reviewed for possible minerals and textures that might have been overlooked in
the Raman and SEM analyses. These sections also help with confirmation of certain minerals
observed.
2.2. Sample Collection
Samples were collected from the Taber Collection drill core and from dumps and
outcrops at the Crystal Mountain mine. Field work was conducted in June of 2018; samples
were collected from the mine site and surrounding waste rock piles. The sampling strategy
yielded different fluorite types (purple and clear) for comparison, as well as surrounding host
rock for composition studies to find a relation between the igneous bodies and the tabular
fluorite. Sampling of the rock core was done with a focus of finding fluorite within the core,
labelling the box taken from and depth of core. Using an oil saw and smaller water-based
Page 20
8
trimming saw at Montana Tech, rock and core samples were cut to fit a 1-inch diameter mold for
epoxy mounting. Once mounted, plugs were finely polished using a Buehler AutoMet 250
automated polisher. The sample surface was polished to 0.4 microns. All the polished samples
were examined under an optical microscope using reflected light (for plugs) or both reflected and
transmitted light (thin-sections).
2.3. Optical Petrography
Thin-sections were manually created from drill core and premade thin-sections were used
for petrographic analysis. Both the drill core and premade thin-sections were from the Taber
collection located in the AMC of Montana Tech. The Taber thin-sections and drill core contain
organized samples taken in the 1950s during prospecting of the area during the first mining
operations. The collection of thin-sections analyzed show textures and mineralogical data for the
fluorite and associated host rocks of Crystal Mountain. A total of 55 thin-sections are in the
collection, most of which have notes archived on the mineralogy of the sample and where the
samples were taken. Samples created using drill core were recorded based on box number
(Figure 9). Thin-sections were observed at different magnification lenses under both plane-
polarized light (PPL) and crossed polarized light (XPL). Images were taken using the Leica
MC170 digital research polarizing microscope.
Using the Leica, initial identification of important minerals and fluid inclusions was
recorded. Unidentifiable minerals using optical petrography were mapped and set aside for later
Raman Spectroscopy. However, thin-sections made from the Taber collection have a coverslip
on top of the grains, making Raman difficult and SEM impossible. Therefore, those samples
were used as a reference and similar hand sample material was used to make new polished thin-
Page 21
9
sections for SEM and Raman analysis. Fluorite thin-sections prepared for fluid inclusion analysis
were mapped and labeled with locations of primary and secondary inclusions.
2.4. Raman Spectroscopy
The purpose of doing Raman Spectroscopy is to further add evidence for identifying
minerals. Samples of fluid inclusions and host rock were collected and used for the Raman
Spectrometry analysis. The Renishaw Raman Spectrometer was operated by Dr. Chris
Gammons. The Raman laser was used in a closed environment with limited light, running with a
laser power of 100% at 514nm, exposure of 3 seconds, cosmic ray removal and 10
accumulations per sample. Raman spectra were matched with screen shots of the area analyzed.
Analysis of fluid inclusion daughter minerals was difficult due to the fluorite host dominating the
spectra received. Some minerals have been identified using both Raman Spectrometry and SEM
analysis for added confirmation of mineralogy.
Spectrum data were recorded and compared with a databank of minerals from the Crystal
Sleuth program. Spectra that were unreadable or low count were discarded from this study to
prevent false information. Areas with good spectra were hit multiple times to make sure there
was consistency in the spectra given. Spectra that matched with a specific mineral multiple times
were considered true and added to Table I. All of the mineral grains identified using Raman
Spectroscopy have also been identified using SEM analysis.
2.5. SEM-EDS
The Scanning Electron Microscope (SEM) located on the Montana Tech campus at the
Natural Resources Research Center (NRRC) laboratory was used to determine mineralogy and
rock texture by means of energy dispersive X-ray analysis (EDX). The LEO 1430VP SEM was
Page 22
10
operated by Gary Wyss and Chris Gammons. Each sample was scanned manually, and grayscale
images were created using the backscanner electron (BSE) detector. In BSE images, minerals
with high atomic mass appear bright, whereas minerals with low atomic mass are dark. To
quantify the elemental composition, an EDAX Apollo 40 detector equipped with a 3.3 window
type and a collection rate of 35,000-55,000 counts per second was used. Raw data were
processed with the ZAF inter-element correction scheme. Although the EDX analyses are
standardless, they are considered accurate enough to correctly identify minerals in most cases.
2.6. X-ray Diffraction
The X-ray Diffraction (XRD) instrument used was an Olympus Terra portable XRD with
a cobalt source. The sample container collects clay sized material and rotates it within its
chamber while recording minerals present in the clay. A standard run-time for a sample is 30 to
60 minutes where the data is recorded to the machine. Using a flash drive, the data can be
transferred to any computer for mineral identification using XPowder software. Each sample
gives a specific pattern that can be matched using a databank to identify which mineral was
scanned. XRD was used on the identified minerals from the Taber collection through SEM and
Raman analysis to add confirmation for minerals present at Crystal Mountain.
2.7. Fluid Inclusions
Samples of massively grown fluorite from Crystal Mountain were collected and doubly
polished for fluid inclusion analysis. About 30 thin-sections were made, including 20 fluorite and
3 quartz samples from Crystal Mountain, as well as 7 fluorite samples from Wilson Gulch (Dry
Creek district). Samples were cut using a diamond water saw, labeled and sealed with epoxy in a
one-inch diameter plug. After a twenty-four hour epoxy hardening period the plug was polished
Page 23
11
on one side using the Buehler automatic polisher. The polished side of the plug was then glued to
a frosted petrographic slide and cut to 0.5 mm thick using an Isomet saw. The cut surface was
then polished identically on the Buehler automatic polisher. The doubly polished sample was
then put into an acetone bath for twenty-four hours to remove epoxy. Samples were then cleaned
with soap to remove excess acetone that would cloud up optical view.
At this time fluid inclusions were mapped and drawn within the matrix of the fluorite.
Each sample was labelled based on consistency of primary and secondary inclusions with their
areas recorded before analysis began. The sample was then broken down into smaller chips for
analysis of the fluid inclusions in a USGS-type heating/freezing stage. The samples were broken
manually into 3 mm x 3 mm sizes to fit the stage. Figure 5 shows the petrographic microscope,
28x objective lens, all set up with the heating/freezing stage and connected to a variac and
trendicator to control temperature and flow rates of air or N2 gas. Size of fluid inclusions, along
with primary or secondary identification and daughter minerals present was noted before analysis
began.
Freezing runs on fluid inclusions are done to determine liquid salinity if the salinity is
below 28% NaCleq. Freezing runs were considered unnecessary on primary inclusions due to
visible halite crystals within the inclusion that provide evidence for salinity values above 28%.
With visible halite crystals, heating runs must be done to dissolve the halite crystal. With either
freezing or heating runs, different equations must be used to determine the salinity values. With
secondary inclusions, freezing runs were conducted to determine their salinities. Nitrogen gas
was pumped through a Dewar full of liquid N2 to chill and then it was fed to the stage inlet line
to cool the sample chamber in the stage to T < -60ºC. Freezing of all water within the inclusion
was observed before nitrogen gas pumping was turned off. The stage was slowly thawed, using a
Page 24
12
Figure 5: Fluid inclusion station at Montana Tech.
steady flow of N2 gas until all ice melted back into a liquid state (Tm). This melting temperature
was recorded and put into the salinity equation to obtain salinity in weight percent NaCl
equivalent (wt% NaCleq) values. Temperatures were brought to just over 11ºC during each run to
ensure that clathrates were not missed. Continuing with secondary inclusions, heating runs were
performed directly after freezing runs to get homogenization temperatures.
Heating runs on secondary inclusions are done to see when the CO2-rich vapor bubble
disappears, giving us the minimum temperature at which the fluid inclusion formed, known as
the homogenization temperature (Th). These runs were always performed after freezing runs due
to damage and fractures that could be caused on the chip, effecting future data. During heating
runs, the chip was heated by a stream of air which was passed over the heating element. The
temperature of the heating element was controlled manually. The temperature of the chip within
the stage was raised until the vapor bubble dissolved into the liquid. Once the homogenization
temperature was reached, the heating element was shut off to cool down the stage and chip.
Liquid N2 Dewar
Stage
Petrographic Scope
Thermocouple
Trendicator
Variac
Page 25
13
During this time, observation of the bubble reappearing was critical to ensure that
homogenization temperature has indeed been reached. Additional heating runs were performed
on the same inclusion to make sure that the fluid inclusion had not cracked or leaked which
would give false data. The chip was heated at a moderate 15-20ºC per minute until the bubble
shrank or showed signs of movement. The rate of heating was greatly slowed until the bubble
was completely out of view. Only heating runs were performed on primary inclusions. The same
process was done for the homogenization temperature on these samples. For salinity however,
the sample was heated until the halite crystal completely dissolved. Just like the CO2 bubble, the
rate of heating was greatly slowed down when the halite crystal showed signs of shrinkage or
movement. Once the halite crystal dissolved, heating stopped until the reappearance of the halite
crystal was observed. Multiple runs were done to confirm that the inclusion had not cracked. The
recorded melting temperature for the halite crystal was put into a salinity equation to give the
weight percent of that sample. Analysis and recorded data for any confirmed cracked/leaking
inclusions were removed from the final data set due to inaccuracies.
2.8. S-isotopes
Although sulfide minerals are uncommon at the Crystal Mountain deposit, two samples
containing pyrite were collected from the mine dumps and submitted to the University of
Nevada-Reno for S-isotope analysis by Dr. Simon Poulson. Sample preparation followed the
methods of Giesemann et al. (1994) and measurements were performed using a Eurovector
elemental analyzer interfaced to a Micromass IsoPrime isotope ratio mass spectrometer (IRMS).
Results are given in the usual delta (34S) notation relative to the Vienna Canon Diablo Troilite
(VCDT) isotope standard and have an estimated uncertainty of ±0.2‰.
Page 26
14
3. Results
3.1. Description of the fluorite bodies
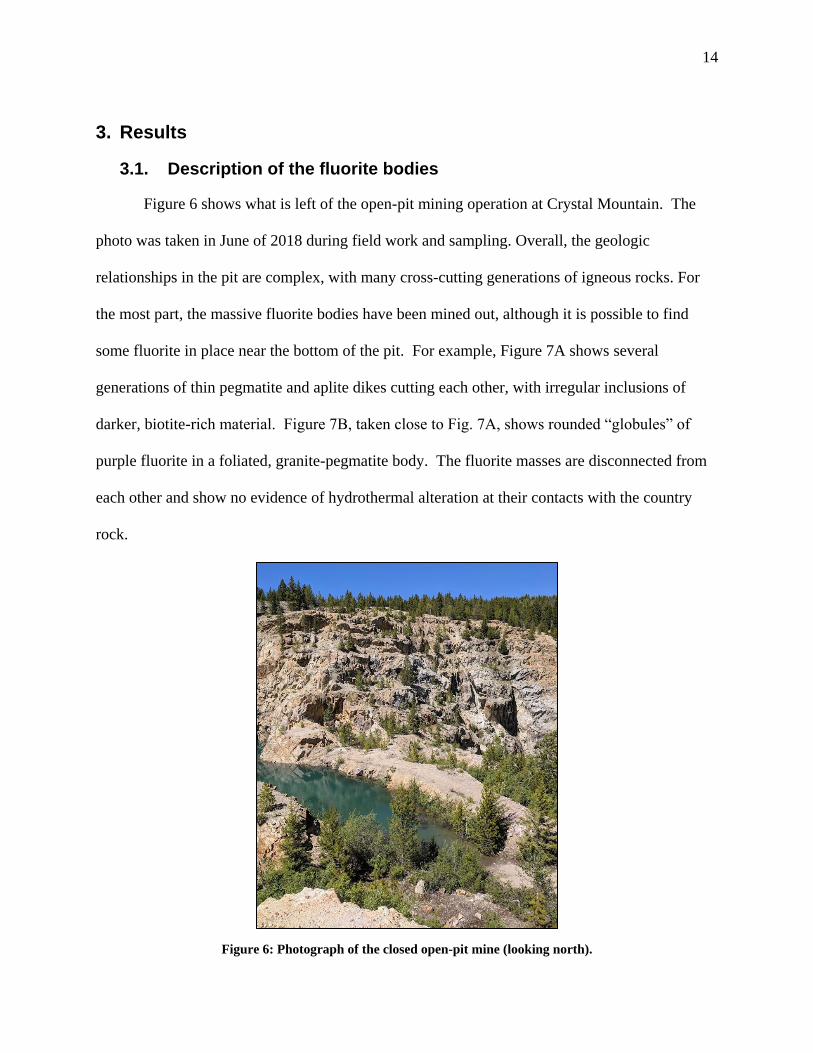
Figure 6 shows what is left of the open-pit mining operation at Crystal Mountain. The
photo was taken in June of 2018 during field work and sampling. Overall, the geologic
relationships in the pit are complex, with many cross-cutting generations of igneous rocks. For
the most part, the massive fluorite bodies have been mined out, although it is possible to find
some fluorite in place near the bottom of the pit. For example, Figure 7A shows several
generations of thin pegmatite and aplite dikes cutting each other, with irregular inclusions of
darker, biotite-rich material. Figure 7B, taken close to Fig. 7A, shows rounded “globules” of
purple fluorite in a foliated, granite-pegmatite body. The fluorite masses are disconnected from
each other and show no evidence of hydrothermal alteration at their contacts with the country
rock.
Figure 6: Photograph of the closed open-pit mine (looking north).
Page 27
15
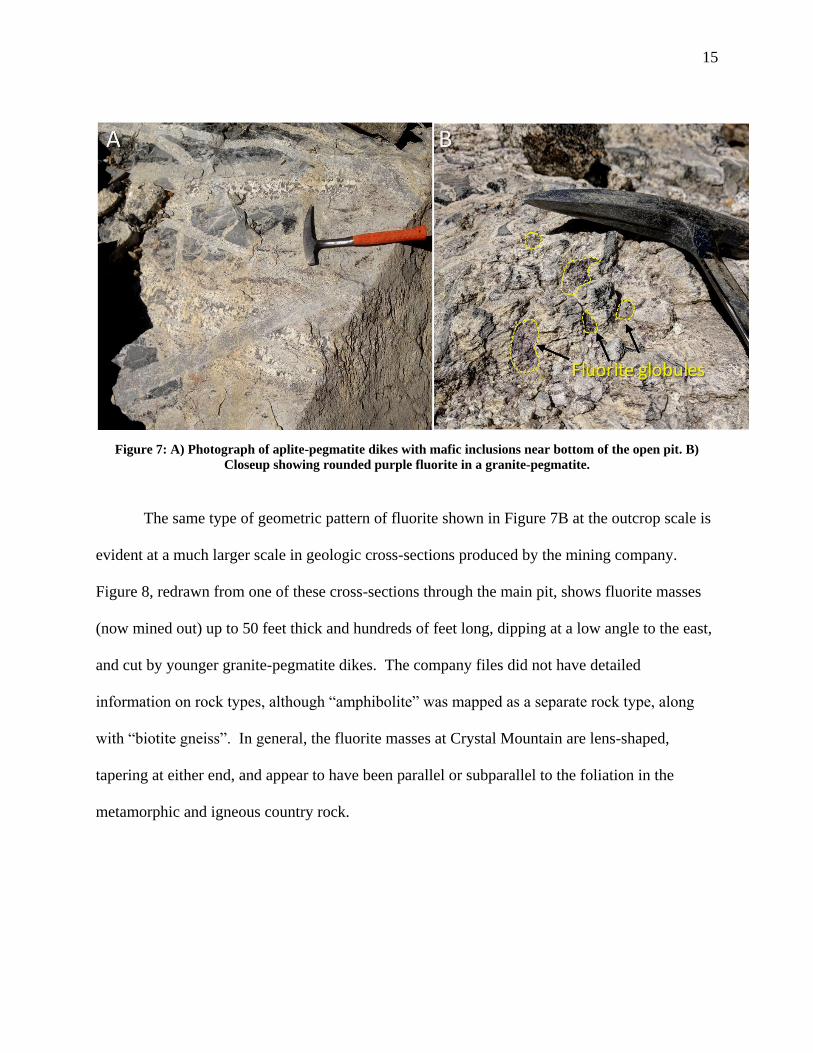
Figure 7: A) Photograph of aplite-pegmatite dikes with mafic inclusions near bottom of the open pit. B)
Closeup showing rounded purple fluorite in a granite-pegmatite.
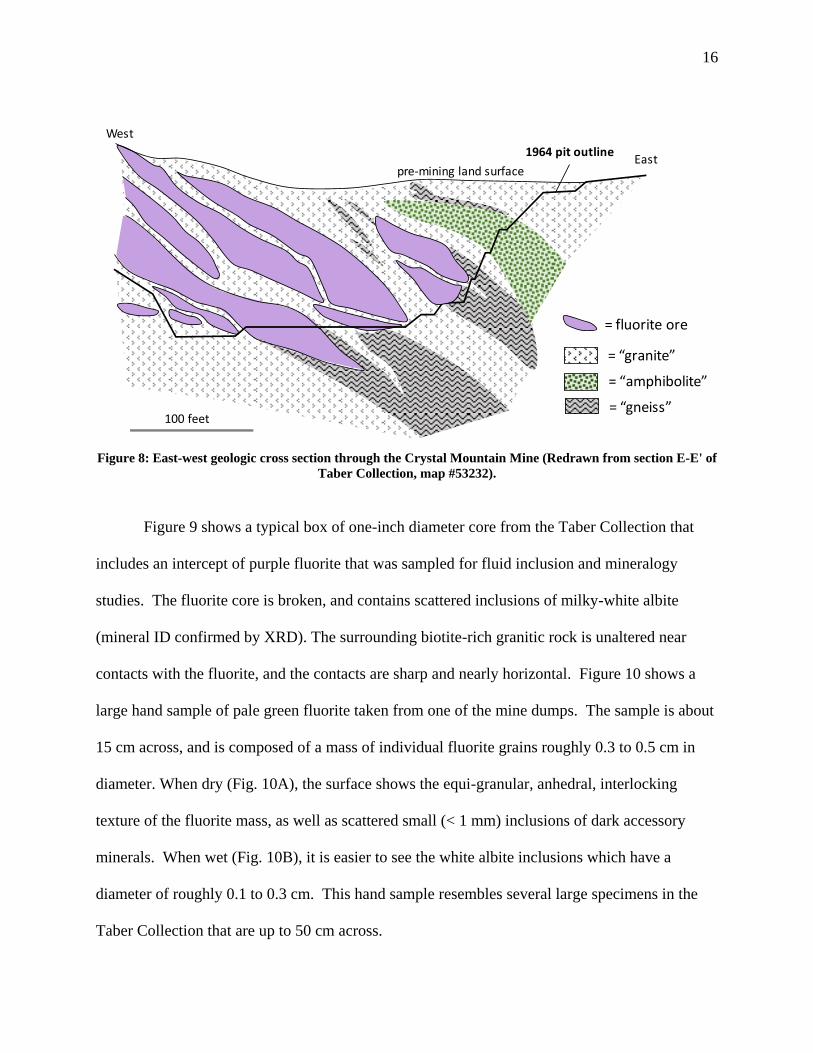
The same type of geometric pattern of fluorite shown in Figure 7B at the outcrop scale is
evident at a much larger scale in geologic cross-sections produced by the mining company.
Figure 8, redrawn from one of these cross-sections through the main pit, shows fluorite masses
(now mined out) up to 50 feet thick and hundreds of feet long, dipping at a low angle to the east,
and cut by younger granite-pegmatite dikes. The company files did not have detailed
information on rock types, although “amphibolite” was mapped as a separate rock type, along
with “biotite gneiss”. In general, the fluorite masses at Crystal Mountain are lens-shaped,
tapering at either end, and appear to have been parallel or subparallel to the foliation in the
metamorphic and igneous country rock.
Page 28
16
Figure 8: East-west geologic cross section through the Crystal Mountain Mine (Redrawn from section E-E' of
Taber Collection, map #53232).
Figure 9 shows a typical box of one-inch diameter core from the Taber Collection that
includes an intercept of purple fluorite that was sampled for fluid inclusion and mineralogy
studies. The fluorite core is broken, and contains scattered inclusions of milky-white albite
(mineral ID confirmed by XRD). The surrounding biotite-rich granitic rock is unaltered near
contacts with the fluorite, and the contacts are sharp and nearly horizontal. Figure 10 shows a
large hand sample of pale green fluorite taken from one of the mine dumps. The sample is about
15 cm across, and is composed of a mass of individual fluorite grains roughly 0.3 to 0.5 cm in
diameter. When dry (Fig. 10A), the surface shows the equi-granular, anhedral, interlocking
texture of the fluorite mass, as well as scattered small (< 1 mm) inclusions of dark accessory
minerals. When wet (Fig. 10B), it is easier to see the white albite inclusions which have a
diameter of roughly 0.1 to 0.3 cm. This hand sample resembles several large specimens in the
Taber Collection that are up to 50 cm across.
= fluorite ore
= “granite”
= “amphibolite”
= “gneiss”
1964 pit outline
pre-mining land surface
West
East
100 feet
Page 29
17
Figure 9: Photo of core from hole #183. Note the visible purple fluorite section.
Figure 10: Handpicked fluorite samples from the Crystal Mountain Mine.
Page 30
18
3.2. Mineralogy
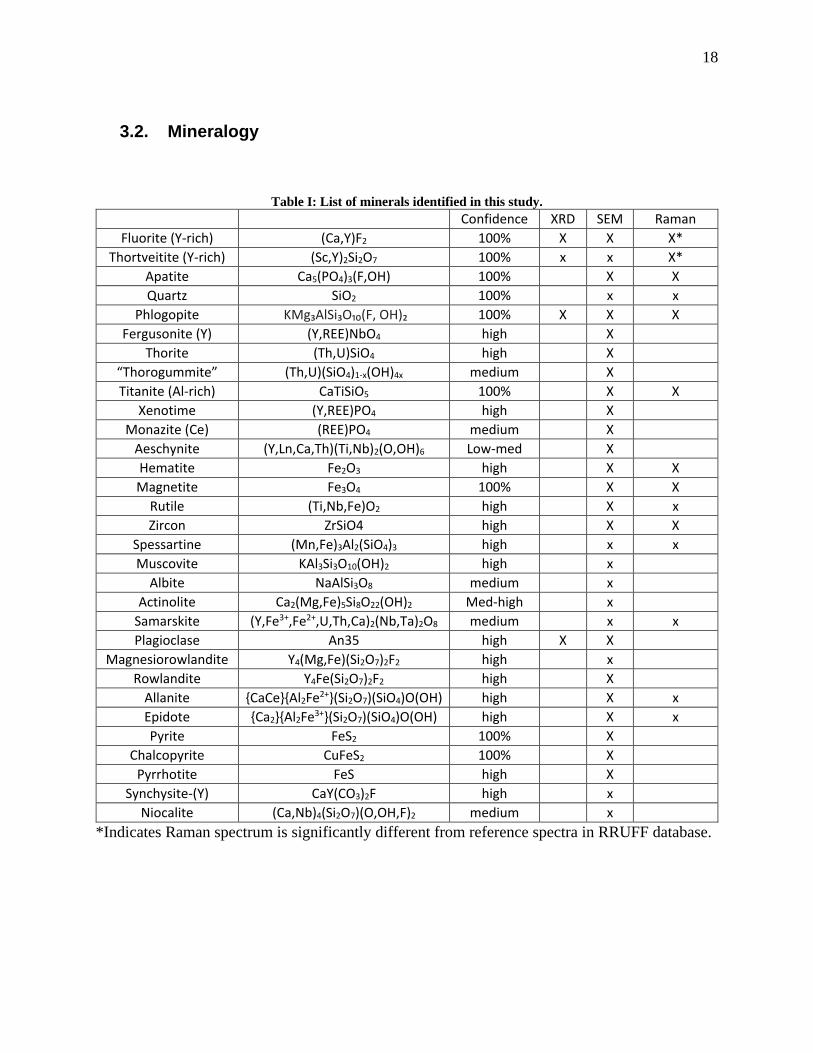
Table I: List of minerals identified in this study.
Confidence XRD SEM Raman
Fluorite (Y-rich) (Ca,Y)F2 100% X X X*
Thortveitite (Y-rich) (Sc,Y)2Si2O7 100% x x X*
Apatite Ca5(PO4)3(F,OH) 100% X X
Quartz SiO2 100% x x
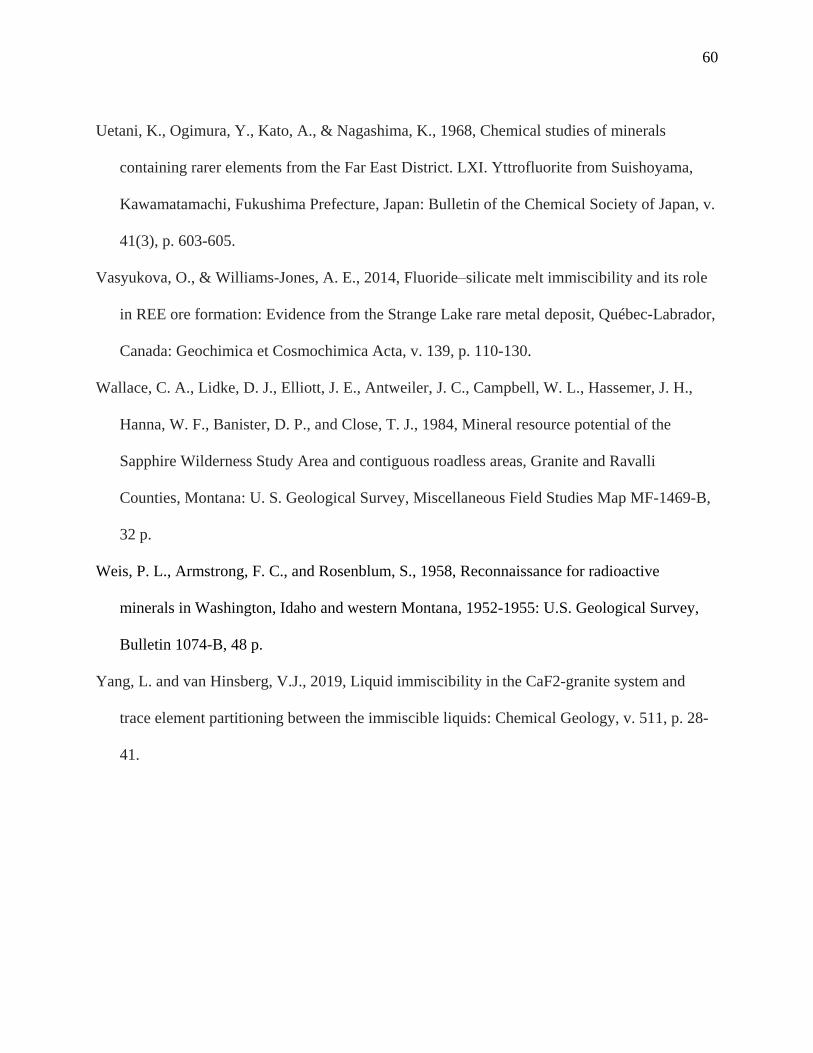
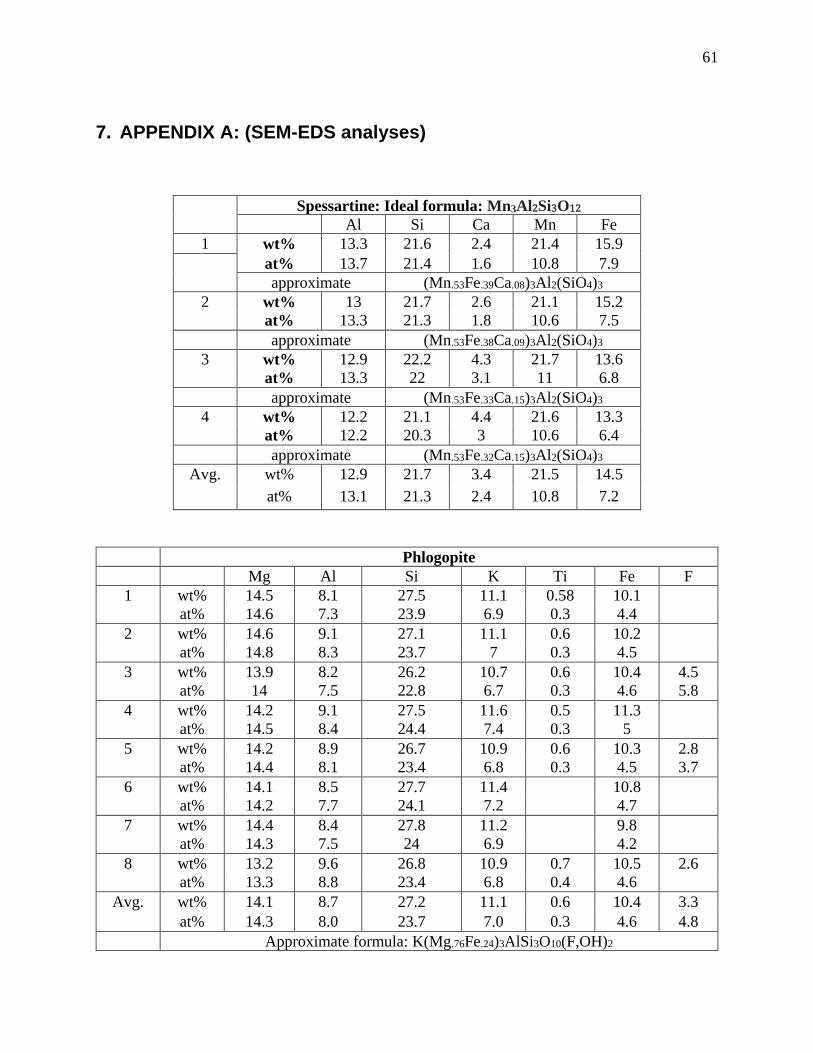
Phlogopite KMg₃AlSi₃O₁₀(F, OH)₂ 100% X X X
Fergusonite (Y) (Y,REE)NbO4 high X
Thorite (Th,U)SiO4 high X
“Thorogummite” (Th,U)(SiO4)1-x(OH)4x medium X
Titanite (Al-rich) CaTiSiO5 100% X X
Xenotime (Y,REE)PO4 high X
Monazite (Ce) (REE)PO4 medium X
Aeschynite (Y,Ln,Ca,Th)(Ti,Nb)2(O,OH)6 Low-med X
Hematite Fe2O3 high X X
Magnetite Fe3O4 100% X X
Rutile (Ti,Nb,Fe)O2 high X x
Zircon ZrSiO4 high X X
Spessartine (Mn,Fe)3Al2(SiO4)3 high x x
Muscovite KAl3Si3O10(OH)2 high x
Albite NaAlSi3O8 medium x
Actinolite Ca2(Mg,Fe)5Si8O22(OH)2 Med-high x
Samarskite (Y,Fe3+,Fe2+,U,Th,Ca)2(Nb,Ta)2O8 medium x x
Plagioclase An35 high X X
Magnesiorowlandite Y4(Mg,Fe)(Si2O7)2F2 high x
Rowlandite Y4Fe(Si2O7)2F2 high X
Allanite {CaCe}{Al2Fe2+}(Si2O7)(SiO4)O(OH) high X x
Epidote {Ca2}{Al2Fe3+}(Si2O7)(SiO4)O(OH) high X x
Pyrite FeS2 100% X
Chalcopyrite CuFeS2 100% X
Pyrrhotite FeS high X
Synchysite-(Y) CaY(CO3)2F high x
Niocalite (Ca,Nb)4(Si2O7)(O,OH,F)2 medium x
*Indicates Raman spectrum is significantly different from reference spectra in RRUFF database.
Page 31
19
3.2.1. Thin section petrography
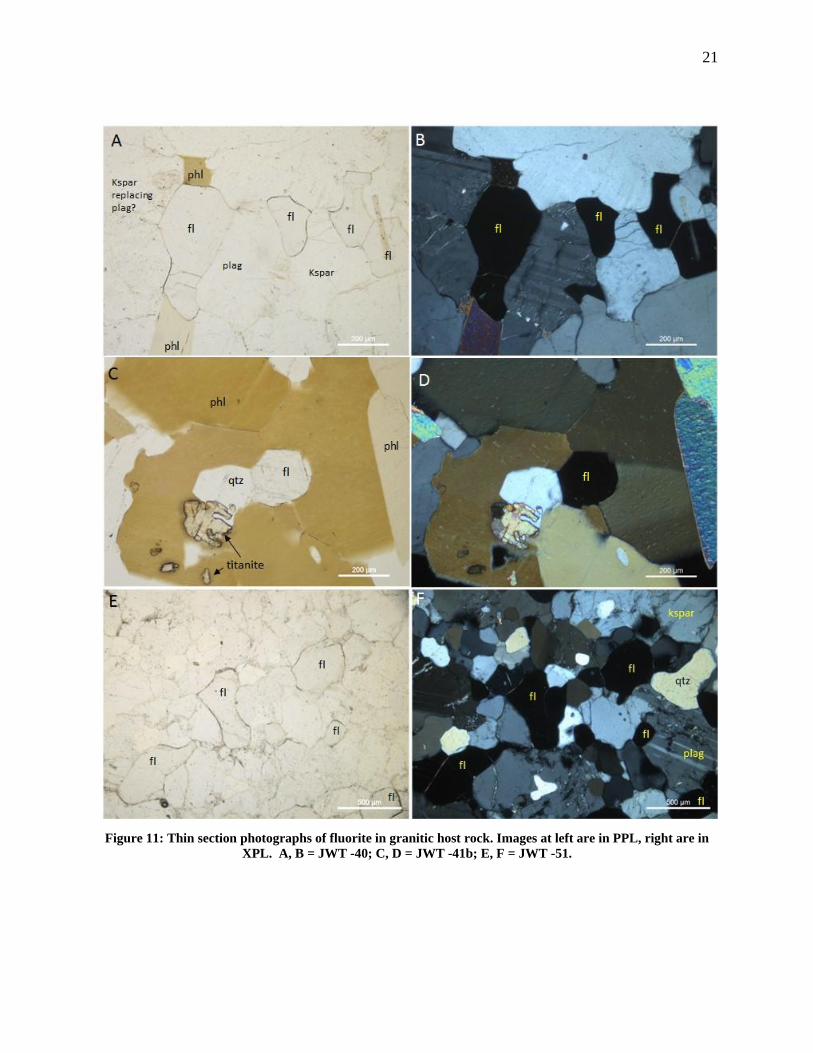
Figure 11 shows textural relationships between fluorite and the surrounding minerals in
samples of igneous rock collected close to the fluorite ore body. The fluorite occurs as isolated
grains with subhedral to anhedral shapes, and has a similar grain size compared to the
surrounding quartz, feldspar, and biotite. Overall, the textures displayed in Fig. 11 could be
classified as hypidiomorphic granular, i.e., a typical texture for granitic intrusions. Feldspar and
biotite (possibly phlogopite, see SEM section) in contact with fluorite show no reaction rim or
other signs of alteration (Fig. 11a,b). However, the titanite grain in Fig. 11c is highly resorbed,
suggesting that it is dissolving or reacting out of the assemblage.
Figure 12 shows several thin sections containing thortveitite. The thortveitite occurs as
irregular spindle- or rod-shaped crystals with high relief and with a distinct cleavage that helps to
differentiate this mineral from titanite. In sample JWT-41b, the thortveitite is found along the
edges of biotite (possibly phlogopite) near contacts with fluorite. The thortveitite grains in this
thin section were positively identified by Raman spectroscopy. Sample JWT-43 was labeled a
“gabbro” by the company geologists, and has a higher % of mafic minerals, including biotite,
pyroxene, and possibly some amphibole. In JWT-43, scattered crystals of thortveitite
preferentially occur within biotite (phlogopite?) that appears to be younger than the surrounding
pyroxene and amphibole. All of the mafic minerals in the field of view show a “quartz sieve”
texture, suggesting they have been partly replaced by metasomatic reactions.
Figure 13 shows images of primary igneous plagioclase that is being altered to other
minerals. In Fig. 13a, the core of the plagioclase grains are altered to a mixture of K-feldspar,
calcite, and muscovite, while the rims show K-feldspar replacing plagioclase that still has some
Page 32
20
relict albite twins. One way to interpret this texture is that the core of the plagioclase was Ca-
rich, and broke down by a reaction such as the following:
2CaAl2Si2O8 + 2CO2 + 2SiO2 + 2K+ +2H2O =
2CaCO3 + KAlSi3O8 + KAl3Si3O10(OH)2 + 2H+ (1)
In contrast, the rims may have been Na-rich, with a simpler cation exchange reaction:
NaAlSi3O8 + K+ = KAlSi3O8 + Na+ (2)
Figures 13C, D, E, and F show more examples of plagioclase that was replaced by K-
feldspar. In some cases there is a sharp reaction boundary between the K-spar and plag (e.g.,
Fig. 13C) while in other cases the replacement appears to have been gradual, with islands of
isolated plagioclase containing albite twins that are in optical continuity with each other (Figs.
13E, F).
In summary, the textures seen in the Taber Collection thin sections suggest that some
type of K-metasomatism occurred in the country rock of the Crystal Mountain deposit.
However, the alteration is fairly subtle, and is not limited to samples that contain fluorite. Also,
there is no evidence of veins in any of the thin sections examined. Thus, if metasomatic fluids
passed through these rocks, this must have been a slow, gradual process, possibly taking place
along grain boundaries. Fluorite shows textures that suggest it crystallized from a magma,
probably late in the sequence judging from its anhedral shapes. Thortveitite is most commonly
associated with biotite (phlogopite), which, in the more mafic specimens, may be an alteration
product of precursor pyroxene or amphibole. In this study, no thortveitite was seen in fresh
pyroxene. This is in contrast to the findings of Foord et al. (1993) who described thortveitite
with pyroxene in a “mela-gabbro” rock from Crystal Mountain.
Page 33
21
Figure 11: Thin section photographs of fluorite in granitic host rock. Images at left are in PPL, right are in
XPL. A, B = JWT -40; C, D = JWT -41b; E, F = JWT -51.
Page 34
22
Figure 12: Thin section photographs showing thortveitite, fluorite, and phlogopite. Images at left are in PPL,
right are in XPL. A,B,C,D = JWT -41b; E,F = JWT -43.
Page 35
23
Figure 13: Thin section photographs showing K-feldspar and other minerals replacing plagioclase. A = JWT
-39, PPL; B = same, XPL; C = JWT -44 (dark spots are artifact of sample preparation), XPL; D = JWT -50,
XPL; E,F = JWT -39, XPL.
Page 36
24
3.2.2. SEM results
SEM analysis was conducted on three samples in this study. The first was a vein of
purple fluorite cutting granite wallrock (see Figure 9). The second sample was a polished grain
mount of the “non-magnetic, heavy fraction” of tailings from the mill in Darby, a sample which
was provided with the Taber Collection. The third was a polished plug of a sample found on the
dumps that contains sulfides. Figures 14 to 17 are SEM backscatter images: minerals with higher
average atomic mass are brighter than those of lower mass.
Figure 14 shows mineral relationships in the purple fluorite sample. Similar to the thin-
section petrography, the images of the fluorite-rich core sample under SEM show igneous
textures as the various minerals have grown to fill in any space possible, with crystals that are
subhedral at best. SEM analysis identified thortveitite growing along and through the
phlogopites, in a texture resembling that shown in Figure 12A,B,C. Two types of orientations
are present for the thortveitites: one showing the elongate, needle shape as they crystallized
along the edges and sides of the phlogopites and the second showing the thortveitites penetrating
into the mica grains along their C-axis. Also shown in this sample are numerous grains of apatite
intergrown with fluorite. The apatite is fairly coarse-grained (up to 200 m in diameter) and has
an anhedral, almost spherical habit that is very different from accessory apatite that commonly
occurs as tiny, euhedral, rod-shaped crystals in granitic rocks. Based on SEM analysis, the
fluorite was observed to have 1-4 wt% yttrium (see Appendix). Figures 14D,E,F show a number
of accessory minerals with high atomic weight, including fergusonite, aeschynite, niocalite,
thorite, and rutile. In places these minerals are complexly intergrown. Appendix A contains the
raw data from the SEM-EDS which was used to make the mineral identifications.
Page 37
25
Figure 14: SEM-BSE images of fluorite and accessory minerals. Abbreviations: fl = fluorite; qtz = quartz;
ap = apatite; phlog = phlogopite.
siderite
phlogapatite
ap
ap
fluorite
fl
flfl
fl
qtz
apatite
thortveite
qtz
phlog
phlog
phlogopite
fl
fl
fl
fl
thortveiteinclusions
qtz
thortveite
fl
area in B
area in C
phlog
aeschynite
fluorite
fluoritephlog
thorite
niocalite
titaniteTiO2
fl
qtz
qtz
thort
phlog
plag+ qtz ap
apfluorite
fergusonite
thortveite
fergusonite
niocalite
phlog
A B
C D
E F
Page 38
26
Figures 15 and 16 show SEM backscatter electron images of heavy minerals concentrated
from the Darby mill tailings. Several grains of thorite and thorogummite were found (Fig. 15A,
B). The presence of water in the chemical formula of thorogummite explains why it is less
bright compared to the unaltered thorite. Thorogummite is a hydrous phase which forms during
lower temperature alteration of thorite that has undergone radiation damage (metamict). In terms
of their Th-U-Si ratios, the two phases gave almost the same SEM-EDS compositions. Attached
to the bottom of the thorite grain in Figure 15A are some cracked grains of Fe-rich rowlandite
(Y4Fe(Si2O7)2F2), whereas Figure 15E shows several grains of Mg-rich rowlandite. Grains
containing intergrowths of aeschynite and fergusonite are seen in Figure 15C and D. Fergusonite
appears brighter than aeschynite because its formula - (Y,REE)NbO4 - contains a higher
percentage of Y and REE compared to aeschynite: (Y,REE)(Nb,Ti)2(O,OH)6. In Fig. 15C,
aeschynite appears to be replacing fergusonite, whereas in Fig. 15D fergusonite occurs as a late
rim around a central aeschynite grain. Figures 15E and F show two xenotime grains. Xenotime
has the ideal formula YPO4, although REE, Th, and U can substitute for Y in the structure. The
grain in Fig. 15E, which has several round fluorite inclusions, appears to be altering to
rowlandite. Some of this alteration could be caused by damage from radioactive decay of Th and
U atoms.
Figure 16 shows SEM images of some more miscellaneous minerals found in the “heavy,
non-magnetic” fraction of the mill tailings. A large thortveitite crystal (Fig. 16A) is shown on
close-up to have many small inclusions of thorite and titanite. Figures 16C and D show some
sulfide minerals (pyrite, pyrrhotite, chalcopyrite). Also shown in the images are grains of
allanite, hematite, magnetite, epidote, titanite, and a spessartine garnet with dozens of tiny
inclusions of apatite (Fig. 16E). Many of these phases are intergrown with fluorite.
Page 39
27
Figure 15: SEM-BSE images of thorite and thorogummite (A,B), fergusonite and aeschynite (C, D), and
xenotime (E,F). Abbreviation: fl = fluorite.
thorogummite
thorite
rowlandite
thorite
thorogummite
fergusonite/ samarskite
fl
flfl
niocalite
aeschynite
xenotime
fl
fl
fl
Mg-rowlandite
xenotime
flfl
fl
A B
C D
E F
fergusoniteaeschynite
Page 40
28
Figure 16: SEM-BSE images of miscellaneous heavy minerals.
A B
C D
EF
thorite
thortveitite
titanite
thortveitite
area in B
fluorite
chalcopyrite
allanite
pyrite
pyrrhotite
hematite
magnetite
qtz
spessartine with inclusions of apatite
fergusonite
area in D
allaniteepidote
titanite
pyrite
Fe-oxide
titanite
titanite
Fe-oxide
Fe-oxide
Page 41
29
Finally, Figure 17 shows an SEM image of a sulfide-rich sample collected from the mine
dumps at Crystal Mountain. In this sample, pyrrhotite (FeS) is altering to pyrite + siderite. This
reaction, which can be written as follows,
2FeS + CO2 + ½ O2 → FeS2 + FeCO3 (3)
is common in high-temperature hydrothermal deposits where pyrrhotite converts to pyrite as the
system cools down (Kelly and Rye, 1979). Small amounts of quartz and chalcopyrite are
intergrown with siderite, and the entire assemblage is rimmed by a coating of Fe-oxide which
probably represents weathering.
Figure 17: SEM-BSE image of sulfide mineral assemblage from Taber fluorite mine. Abbreviations:
po = pyrrhotite; pyr = pyrite; cpy = chalcopyrite; qtz = quartz.
3.2.3. Raman Spectroscopy
Analysis using the Raman laser was done on grain samples from the Taber collection and
daughter minerals from hand-made fluorite thin-sections. Mineral grains in question from thin-
pyr
pyrpo
po
pyr
cpy
qtz
siderite
po
Page 42
30
section petrography and SEM analysis were analyzed under the Raman laser for additional
confirmation on mineral identification.
Using the Raman laser on fluorite inclusion daughter minerals proved to be quite
difficult. Since the laser has to go through the fluorite, all of the spectra received on fluorite
daughter minerals had an overwhelmingly strong fluorite spectrum. To counteract this, a run was
done on just the fluorite to get the pure fluorite spectrum. This spectrum was then used to
compare with laser runs on daughter minerals. Any new peaks visible were considered to be
from that daughter mineral. Using this technique, calcite, dolomite, quartz and possibly siderite
were found within many of the primary inclusions. More sparsely observed minerals include
quartz with the rest being unidentified. The fluorite itself showed a drastically different spectrum
than that of the Crystal Sleuth databank. This could be due to the 1-4 wt% yttrium of the fluorite
composition.
3.3. Sulfur isotopes
Two pyrite samples collected from separate rock samples on the Crystal Mountain dump
gave 34S values of +3.0 and +3.2‰. Sulfur with this type of isotope signature could have come
from many different sources, including primary magma (mantle 34S is close to 0 ‰) or
hydrothermal remobilization of sulfide out of Precambrian metasediments. It is interesting to
note that a sample of pyrite collected in 2018 from the Snowbird fluorite deposit also returned a
value of +3.0‰ (C. Gammons, pers. commun., 2018). More data would be needed to say
whether or not this is just a coincidence.
Page 43
31
3.4. Fluid inclusions
There are two types of inclusions present within the fluorite matrix: primary and
secondary. Primary inclusions (Figure 18) were identified by their smaller size, averaging less
than 5μm but sometimes as big as 10-15μm, their numerous and large daughter minerals,
especially halites, and the fact that they are scattered randomly (and sparsely) throughout the
fluorite samples. Many of the primary inclusions observed only had the bubble and up to 2
daughter minerals (Figure 18A). However, some of the primary inclusions hosted plenty of
daughter minerals as shown in Figure 18B. Attempted identification of daughter minerals was
Figure 18: Petrographic images of primary fluid inclusions in fluorite from Crystal Mountain.
conducted using Raman spectroscopy. Some of the minerals including calcite, dolomite and
quartz were confirmed while others are uncertain.
Secondary inclusions were identified by their larger size, averaging 30-50μm, their lack
of daughter minerals, and by the way that they cluster in a line along healed fractures. Many of
the secondary fluid inclusions showed three phases at room temperature, with a central CO2(v)
bubble, a rim of CO2(l), and an outer phase of H2O(l). These inclusions contain no daughter
A B
Page 44
32
minerals of any kind and have large CO2 vapor bubbles that show three phases: H2O(l), CO2(v)
and CO2 (l). Figure 19A shows many secondary inclusions on healed fractures of the fluorite as
Figure 19: Petrographic images of secondary fluid inclusions from Crystal Mountain.
teardrop style inclusion shapes. These inclusions are consistent with all others from different
samples observed. The three phases found in these inclusions are visible in Figure 19B.
Heating and freezing runs were performed on primary and secondary fluid inclusions in
fluorite samples from the mine, waste rock piles, and cores of the Taber collection. Figure 20
shows homogenization temperatures and salinity values for all secondary inclusion samples. This
Figure also displays a comparison of homogenization temperatures vs total salinity by weight
percent.
The salinity (NaCleq content) of the secondary inclusions was calculated from the
temperature of final ice melting (Tm, ºC) as follows:
1.76958*(-Tm) - 0.042384*(Tm)^2 + 0.00052778*(-Tm)^3 (4)
B A
H2O(l)
CO2(v)
CO2(l)
Page 45
33
This calculation was used during freezing runs when ice melting temperatures were
recorded to be below 0ºC. All secondary inclusions were calculated through this method which
record low salinity values (<28 wt%).
All primary inclusions were liquid rich and contained a large halite daughter mineral,
sometimes with additional daughter minerals. When an inclusion contained two transparent salt
crystals that dissolved upon heating, the larger of the two was assumed to be halite, and the
smaller to be sylvite. Some inclusions had transparent daughter minerals with high birefringence
that were identified by Raman spectroscopy to be carbonates (calcite, dolomite). Other daughter
minerals could not be identified. All of the primary inclusions had small vapor bubbles, < 10%
by volume at room temperature. Upon heating, most of the primary inclusions showed vapor
bubble disappearance at a temperature that was less than the temperature of halite daughter
dissolution. Figure 20 shows histograms of vapor bubble disappearance and halite dissolution
for all of the primary inclusions examined. It should be mentioned that many of the larger
primary inclusions decrepitated prior to final homogenization at temperatures as high as 500ºC
or greater. Therefore, the data set may be biased to lower temperature values.
Page 46
34
Figure 20: Homogenization temperature and salinity values of all fluid inclusions from Crystal Mountain.
0
5
10
15
20
25
150 170 190 210 230 250 270 290 310 330 350 370 390 410 430 450 470 490 510 530 550
Primary - halite dissolution
Primary - Bubble disappearence
Secondary
Temperature °C
Nu
mb
er o
f an
alys
es
0
5
10
15
20
25
30
35
40
8 10 12 14 16 18 20 22 24 26 28 30 32 34 36 38 40 42 44 46 48 50 52 54 56
Nu
mb
er o
f A
nal
yses
Salinity (Wt%) NaCleq
Secondary
Primary
0.0
10.0
20.0
30.0
40.0
50.0
60.0
0 100 200 300 400 500 600
Salin
ity
(Wt%
) N
aCl
Temperature °C
Primary - Bubble dis.
secondary
Primary - NaCl dissol.
Page 47
35
The salinity (NaCl content) of the primary inclusions was calculated from the
temperature of final halite dissolution (Td, ºC) as follows:
26.218 + 0.0072*(Td) + 0.000106*(Td)^2 (5)
All primary inclusions were liquid and mineral rich, containing (e.g., sylvite, carbonates, and
other unidentified phases) < 10% vapor by volume at room temperature (25ºC). These inclusions
displayed high salinity values (~50 wt.%) and homogenization temperatures (>400ºC). Salinity
values were determined through dissolution of halite crystals within inclusion fluid at
temperatures between 400ºC and 500ºC. Homogenization and salinity temperature results were
used to calculate crystallization pressure of the fluorite (see chapter 4).
3.5. Other mineralogical work
3.5.1. Thortveitite
Thortveitite, Sc2Si2O7, is one of the more interesting minerals found during the research
process. This is a rare silicate mineral for North America and is rich in scandium, a critical metal
based on the 2018 USGS assessment report (Fortier et al., 2018). Figure 21 shows photographs
of thortveitite grains that were hand-picked under a binocular microscope from a sample of “non-
magnetic, heavy minerals” that was included with the Taber Collection. Figure 21B shows two
thortveitite grains that have attached purple fluorite. The crystals are 1-3 mm on average with
euhedral-subhedral growth textures. Samples observed from this research under SEM analysis
are much smaller (<1mm) on average.
Page 48
36
Figure 21: Thortveitite crystals from the Taber Collection with minor amounts of purple fluorite.
The Raman spectra given for the thortveitite, Figure 22, is different than the reference
spectra from the Crystal Sleuth database. First issues with the current Raman database is that no
thortveitite reference spectrum is given for 514nm (laser used for this study). Secondly, the ideal
chemistry wanted for reference was Sc2Si2O7, yet the calculated formula that was used as the
thortveitite reference was (Sc1.44Y0.30Zr0.07Fe3+0.08Mn0.06Yb0.05)Σ=2(Si1.99Al0.01)Σ=2O7. The spectra
from this study had a different formula than the reference given. The largest difference found in
the formulas between this study and the databank formula is the yttrium content. Using SEM-
EDS analysis, the average atomic Y content of 13 thortveitite grains from this study came out to
be 4.2% ± 3.5% (see appendix A for data). The study spectra peaks are expected to be quite
different from the reference standard that has a Y content of 15%. Thortveitite grains examined
in this study also contain low amounts of Fe (1.6 wt%) and traces of Ca (0.7 wt%) which could
have affected the spectra in Figure 22.
A B
Page 49
37
Figure 22: Raman spectra for thortveitite. Black pattern is thortveitite from Crystal Mountain obtained in
this study (514nm). Other patterns are for RRUFF ID #R060360 at 532nm (blue), R061065 at 532nm (green)
and 785nm (purple).
To confirm the identification of this mineral as thortveitite, Raman and SEM-EDS
analysis was accompanied by XRD. Several of the hand-picked grains shown in Figure 21 were
crusted and analyzed by XRD. The XRD pattern received was then applied to a database where
the mineral thortveitite came out with very high accuracy (Figure 23). With the application of
XRD and SEM-EDS for the confirmation of thortveitite as a mineral of this study, the Raman
spectra shows the variety and unique pattern observed due to differences in chemical formulas.
Page 50
38
Figure 23: XRD pattern of thortveitite obtained in this study (red) with a reference pattern of peaks (grey).
3.5.2. Fluorite
The ideal fluorite chemistry, CaF2, is looked for and used by reference databanks on tests.
The first identification test used on fluorite from Crystal Mountain was Raman spectroscopy.
Many fluorite samples were hit with the Raman laser, all of which recorded similar peaks. When
comparing the spectra from this study to the Crystal Sleuth databank (Figure 24), there are clear
differences in peak locations. For example, this study is the only one that has a large peak at 950
cm-1 (different locations for blue and purple), and there is no peak at 300 cm-1 from this study.
The differences in the Raman spectra are speculated to be due to differences in the
concentrations of Y and other trace elements in the fluorite from Crystal Mountain compared to
the reference samples.
Page 51
39
Figure 24: Raman spectra for fluorite. Black pattern is fluorite from Crystal Mountain obtained in this study
(514nm). Other patterns are for RRUFF ID #R050045 at 514nm (blue), 532nm (green) and 785nm (purple).
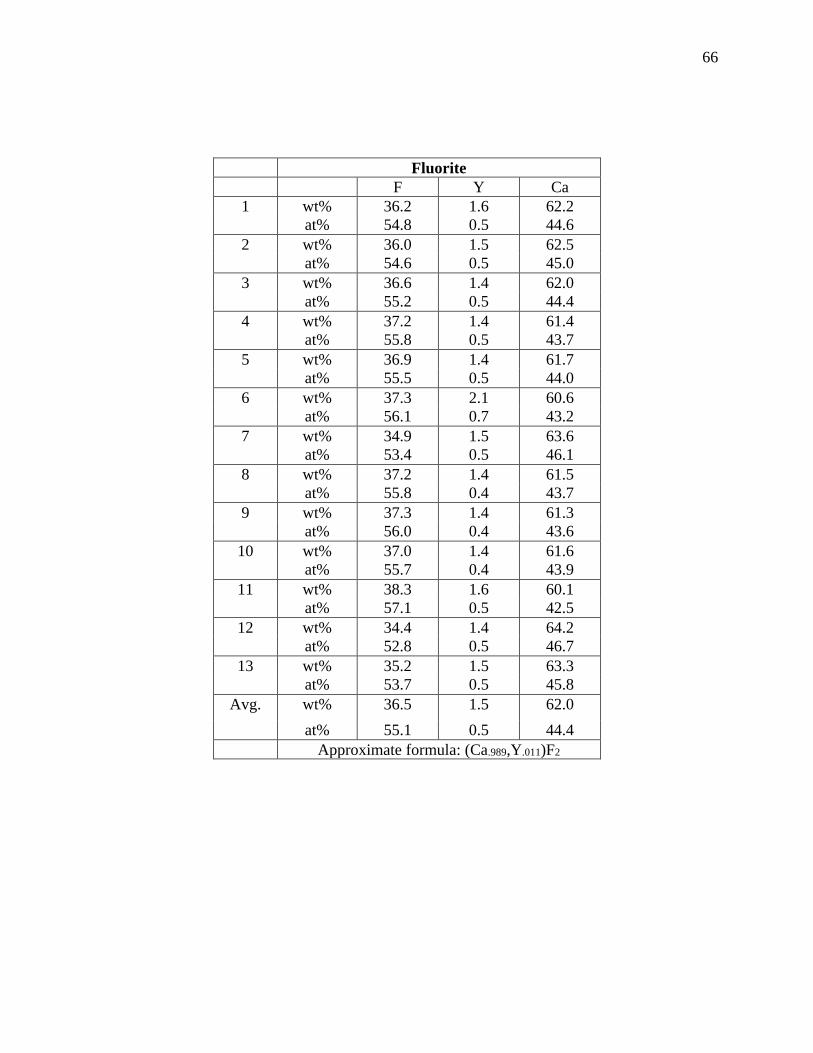
Based on SEM-EDS results for 13 samples of fluorite at Crystal Mountain, the average
wt% of Y in the fluorite is 1.51% ± 0.5%. This leads to the following formula based on atomic
percents: (Ca.989,Y.011)F2 (see appendix A for data). In other words, about 1.1% of the Ca sites in
fluorite are substituted by Y. Although the amount of yttrium found within the fluorite matrix
seems low, it has a massive effect on the Raman spectra received. Similar to the thortveitite, this
shows how yttrium has entered the matrix of several minerals, making identification more
difficult.
Similar to work done on the thortveitite, XRD analysis was done on these crystals for
added confirmation that fluorite was the mineral in question. Figure 24 shows the spectra of the
sample from Crystal Mountain in question. When compared to the fluorite peak from the
database (dotted black line) it matches with high accuracy.
Page 52
40
Figure 25: XRD spectra of fluorite showing this study (red) with a reference peak pattern (dotted black).
A paper from Pingitore et al. (2014) discussed Y-rich fluorite from Round Top, Texas.
This paper stated the Y-bearing fluorite wt% from two separate localities, the Joseph Mine in
New Mexico and Innhavet, Norway. At these localities, the wt% of Y are 1.7% and 15.5%
respectively. When comparing this study to those localities, the closest comparison is with the
Joseph Mine in New Mexico at 1.7 wt%. Pingitore and others point out that leaching of fluorite
from Round Top could be a means to recover Y and the heavy REEs.
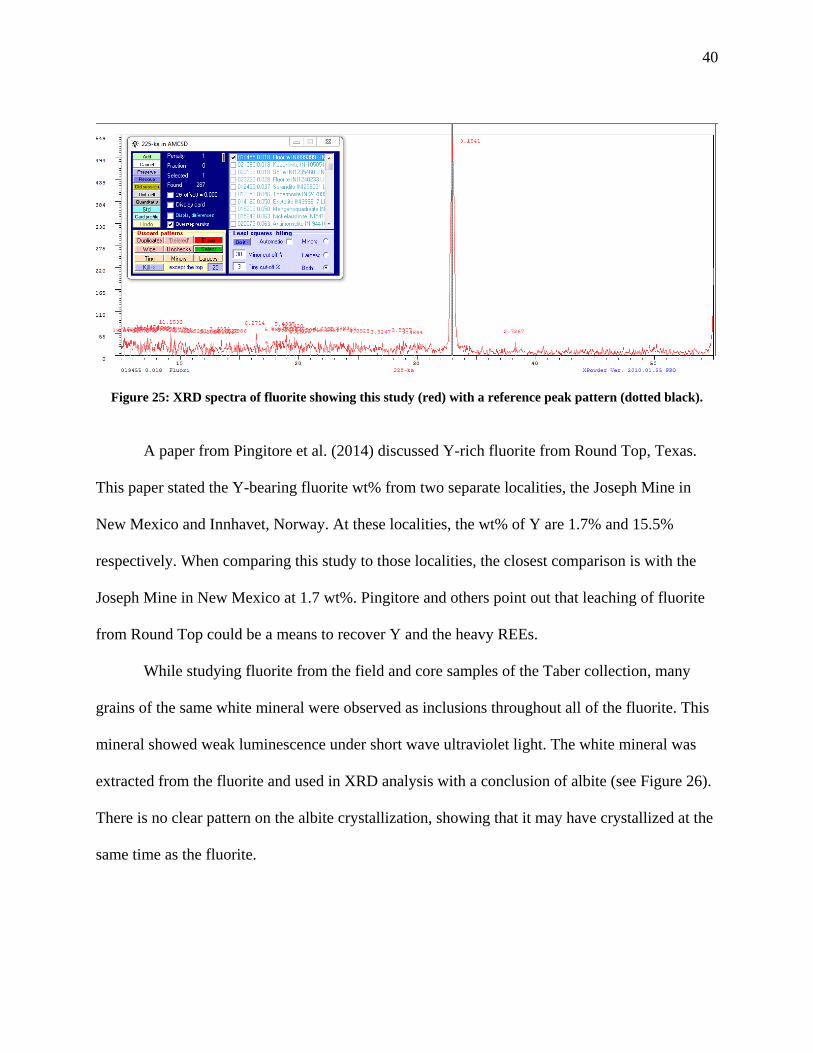
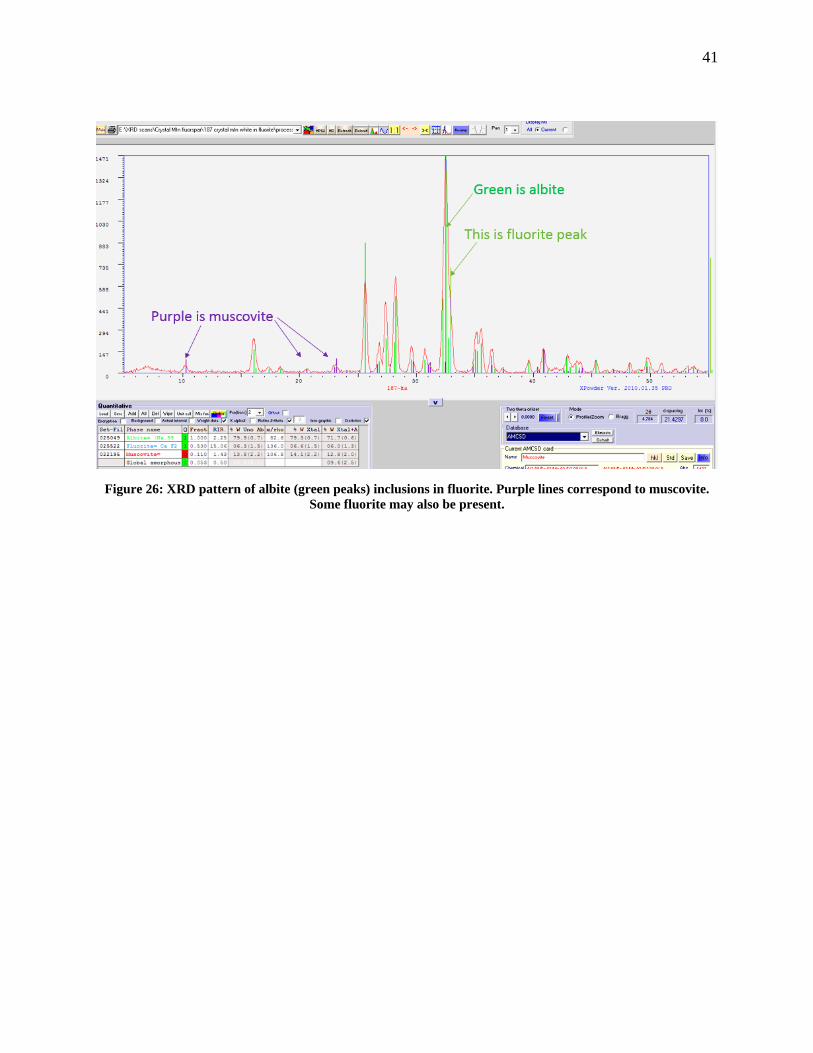
While studying fluorite from the field and core samples of the Taber collection, many
grains of the same white mineral were observed as inclusions throughout all of the fluorite. This
mineral showed weak luminescence under short wave ultraviolet light. The white mineral was
extracted from the fluorite and used in XRD analysis with a conclusion of albite (see Figure 26).
There is no clear pattern on the albite crystallization, showing that it may have crystallized at the
same time as the fluorite.
Page 53
41
Figure 26: XRD pattern of albite (green peaks) inclusions in fluorite. Purple lines correspond to muscovite.
Some fluorite may also be present.
Page 54
42
4. Discussion
4.1. Conditions of fluorite formation
The primary fluid inclusions trapped in fluorite give the best information on the
temperatures and pressures of formation, as well as the composition of the hydrothermal fluid
that coexisted with the fluorite. Homogenization temperatures of primary fluid inclusions had a
range of 240 to > 510ºC. The primary inclusions had very large halite daughter minerals, and,
based on the temperature of final dissolution of the halites, average salinities were in the range of
42-56 wt% NaCl (see Figure 20). The majority of the primary fluid inclusions showed vapor-
bubble disappearance at a temperature that was much lower (in some cases, as much as 200ºC
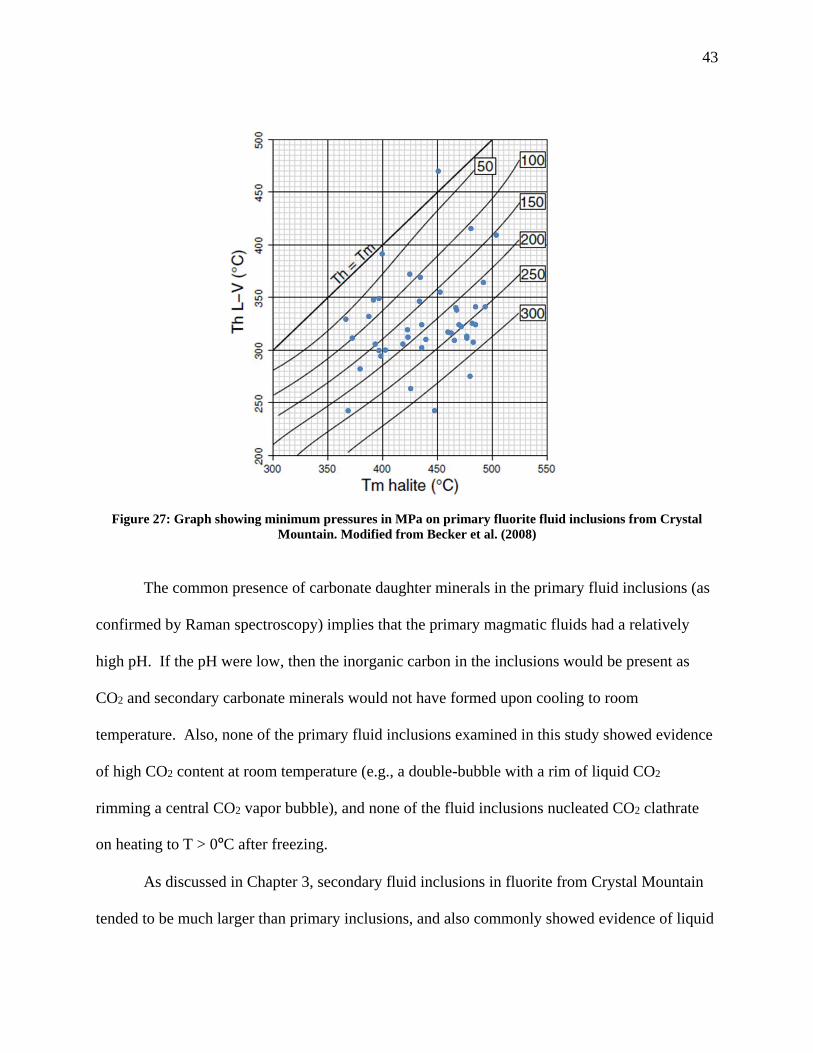
lower) than the temperature of final halite dissolution. As discussed by Becker et al. (2008), this
type of fluid inclusion can be used to estimate the minimum pressure of trapping. Figure 27,
redrawn from Becker et al. (2008), plots the temperature of homogenization of liquid + vapor to
liquid (Th L-V) on the y-axis, and the temperature of final halite dissolution (Tm halite) on the x-
axis. The diagonal contour lines show the pressures in MPa (mega-Pascals) for the Crystal
Mountain fluid inclusions (shown as blue dots). The greater the difference between Th L-V and
Tm halite, the greater the pressure of trapping. The pressure estimates for the primary fluid
inclusions range anywhere from 50 to over 300 MPa. Given that these pressure estimates are
minimum values, it is likely that most of the Crystal Mountain fluid inclusions were trapped at
pressures at or above 300 MPa (3.0 kbar). Assuming an average lithostatic gradient of 3.5
km/kbar, a pressure of 3.0 kbar implies a depth of formation of 10.5 km. Thus, the fluorite
deposits at Crystal Mountain must have formed at considerable depth, far below the range of
convecting meteoric waters. The only type of fluid that could form at such great depth and with
such high salinity is a magmatic fluid.
Page 55
43
Figure 27: Graph showing minimum pressures in MPa on primary fluorite fluid inclusions from Crystal
Mountain. Modified from Becker et al. (2008)
The common presence of carbonate daughter minerals in the primary fluid inclusions (as
confirmed by Raman spectroscopy) implies that the primary magmatic fluids had a relatively
high pH. If the pH were low, then the inorganic carbon in the inclusions would be present as
CO2 and secondary carbonate minerals would not have formed upon cooling to room
temperature. Also, none of the primary fluid inclusions examined in this study showed evidence
of high CO2 content at room temperature (e.g., a double-bubble with a rim of liquid CO2
rimming a central CO2 vapor bubble), and none of the fluid inclusions nucleated CO2 clathrate
on heating to T > 0ºC after freezing.
As discussed in Chapter 3, secondary fluid inclusions in fluorite from Crystal Mountain
tended to be much larger than primary inclusions, and also commonly showed evidence of liquid
Page 56
44
CO2 at room temperature (double-bubble shape). The secondary inclusions showed total
homogenization to the liquid H2O phase at temperatures in the range of 160 to 290ºC, much
lower than the primary fluid inclusions (see Figure 20). The secondary inclusions also had much
lower salinity, with estimates in the range of 8 to 12 wt% NaCleq based on ice melting
temperatures. It is possible that the secondary fluid inclusions at Crystal Mountain represent
primary magmatic fluids that cooled down and became more dilute after mixing with
surrounding groundwater. It is also possible that the secondary inclusions were trapped at a
much later time than the fluorite crystallization, and have no genetic link to the primary
inclusions. Given the abundance of CO2, it is likely that the secondary fluids had a lower pH
(more acidic) compared to the primary inclusions.
The stable S-isotope composition of two pyrite samples from Crystal Mountain fell in the
range of +3.0 to +3.2 ‰. This result is consistent with a magmatic source of S, for which 34S is
typically expected to range between -5 and +5‰, close to the mantle value of 0.0‰ (Marini et
al., 2011). Similar 34S values were obtained for sulfide minerals in the Butte porphyry-lode
deposit, which is believed to have formed primarily from magmatic fluids (Field et al., 2005).
Not much more can be said regarding S-isotopes considering the small amount of data.
4.2. Association of fluorite with incompatible elements
Unlike most deposits worldwide in which fluorite is intergrown with other vein minerals,
the Crystal Mountain deposit contains large masses of almost pure fluorite. The most common
impurity minerals associated with fluorite identified by SEM-EDS are silicate minerals that are
also found in the surrounding country rock (e.g., albite, phlogopite, quartz, epidote), iron oxides
Page 57
45
(hematite, magnetite), and accessory minerals that are rich in incompatible elements such as P
(mainly as apatite), Ti (as titanite, rutile), Sc (as thortveitite), U and Th (as thorite and
thorogummite), Nb (as fergusonite and samarskite), Zr (as zircon), and Y with other rare earth
elements (as fergusonite, xenotime, monazite, rowlandite, allanite, synchysite). The fluorite
itself has an unusually high yttrium content, with an average composition based on standardless
SEM-EDS analysis of 1.5 ± 0.5 wt% Y (see table in appendix A). Figure 28 shows some of the
incompatible elements (i.e., with a charge or ionic radius that does not substitute easily into
common silicate minerals) at Crystal Mountain. Although some sulfide minerals are present
(mainly pyrite, pyrrhotite, and chalcopyrite), the deposit as a whole is notably low in sulfides.
The high concentrations of incompatible elements in the deposit imply a genetic link to igneous
rocks that are also enriched in incompatible elements. This would include late-stage granites
(aplite-pegmatites) and carbonatites (igneous rocks with > 50% carbonate minerals).
As mentioned previously, fluorite in the Round Top Mountain deposit in west Texas has
unusually high yttrium content (Pingitore et al., 2014). However, the Round Top deposit is
hosted by a shallow, rhyolite laccolith, and therefore has few geologic similarities to Crystal
Mountain. In a recent review of the trace element compositions of fluorites from western
Canada, Mao et al. (2016) concluded that the Y and Sr content of fluorite could be useful as an
indicator of the type of deposit or country rock the fluorite is associated with. However, none of
the fluorites examined by Mao et al. (2016) had Y content as high as the Crystal Mountain
fluorite.
Page 58
46
Figure 28: Periodic table of elements modified to show incompatible elements found within the Crystal
Mountain deposit (red).
4.3. Genetic model for the Crystal Mountain fluorite deposit
Fluorite is a relatively common mineral that is found in a variety of hydrothermal and
magmatic settings (Magotra et al., 2017). Some of the more important deposit types that can be
rich in fluorite are summarized in Table II, including Mississippi-Valley Type (MVT) deposits,
epithermal deposits, porphyry-related deposits (especially Mo and Sn-W), carbonatite-related
deposits, and granite pegmatites. The last row in Table II, labeled “immiscible fluorite melt”, is
a new idea based on recent experiments done at McGill University which show that a fluorite-
rich melt can separate from a silicate melt under certain petrologic conditions (Yang and van
Hinsberg, 2019).
Page 59
47
Table II: Pros and Cons of each deposit type considered for Crystal Mountain.
Deposit type Pros Cons
MVT none Temperatures and pressure of
formation much too high.
Wrong rock types.
No associated Pb-Zn.
Epithermal none Temperatures and pressure of
formation much too high.
No associated Au-Ag.
No hydrothermal alteration.
Lack of veining.
Porphyry-
related
Temperatures and pressures are
compatible with magmatic fluids
Lack of veins and hydrothermal
alteration
Lack of hydrothermal sulfides
No associated Cu-Mo-Sn-W.
Carbonatite-
related
Compatible temperatures and
pressures.
Association with incompatible
elements.
Carbonate daughter minerals in
primary fluid inclusions.
No carbonatites at Crystal
Mountain.
No strong fenite alteration.
No carbonate gangue minerals.
Pegmatite-
related
Compatible temperatures and
pressures.
Abundant pegmatite and aplite dikes
at Crystal Mtn.
Close association of fluorite with
phlogopite and albite.
Association with incompatible
elements.
Explains lack of hydrothermal
alteration.
Difficult to explain segregation of
fluorite into massive bodies
Not all fluorite at Crystal Mountain
is associated with pegmatite.
Fluorite is not especially coarse-
grained.
Immiscible
fluorite melt
Compatible temperatures and
pressures.
Association with incompatible
elements.
Explains lack of hydrothermal
alteration.
Explains igneous textures and
segregation of fluorite into massive
bodies.
Recent immiscibility experiments
have not been thoroughly tested.
No known deposits of this type
with which to compare Crystal
Mountain.
Primary fluid inclusions imply
presence of a hydrothermal brine
during precipitation of fluorite.
Page 60
48
This thesis has presented evidence that can be used for or against each of the above
deposit types being present at Crystal Mountain. Based on the high temperature and pressure of
formation of fluorite in the deposit, both MVT (i.e., basinal brine) and epithermal deposits can be
discounted. Constantopoulos (1988) reported data for fluid inclusions in fluorite for several
epithermal veins in south-central Idaho. Although porphyry-related deposits form at
temperatures and depths that overlap with Crystal Mountain, the deposit shows no evidence of
porphyry style mineralization (e.g., existence of Cu- or Mo-sulfides, cassiterite, or W minerals),
vein textures, or hydrothermal alteration (e.g., strong potassic or phyllic alteration). In addition,
none of the igneous rocks at Crystal Mountain are porphyritic. Fluorite is commonly associated
with carbonatites, and carbonatites are also highly enriched in incompatible elements (Nb, Y,
REE, etc..). Buhn et al. (2002) described high temperature, high salinity fluid inclusions from a
fluorite deposit in Namibia that is associated with carbonatites. Small carbonatite “vein-dikes”
have been described in southern Ravalli County (Heinrich and Levinson, 1961), approximately
60 km southwest of Crystal Mountain. However, the main issue with this deposit type is that
Crystal Mountain lacks carbonate minerals. The only carbonates found in this study were as
daughter minerals in primary fluid inclusions. Furthermore, the deposit lacks any evidence of
strong alkali metasomatism (i.e., “fenite”) that is usually found near carbonatite intrusions.
The two deposit types that best fit the Crystal Mountain occurrence are “pegmatite-
related” and “immiscible fluorite melt”. The country rock at Crystal Mountain contains many
criss-crossing dikes of pegmatite-aplite with an overall granitic composition, and some of these
are closely associated with pods of fluorite (Figure 7). Pegmatites are known for their tendency
to concentrate incompatible elements. Yttrium-rich fluorite (formerly considered a separate
mineral, yttrofluorite) containing >10 wt% combined Y + REE has been found in granite
Page 61
49
pegmatites in the Colorado Front Range (Haynes, 1965), Norway (Sverdrup, 1968) and Japan
(Uetani et al., 1968). As well, pegmatites form at temperatures and pressures that overlap with
Crystal Mountain, and often contain extremely salty fluid inclusions (Sirbescu and Nabelek,
2003). The biggest problem with calling Crystal Mountain a pegmatite-related deposit is that the
fluorite ore bodies are mono-mineral masses that are larger in dimension than the nearby
pegmatite dikes. Nowhere at Crystal Mountain is fluorite found intergrown with coarse-grained
pegmatite minerals such as alkali feldspar or quartz, and the fluorite itself is not especially
coarse-grained.
The last idea is that the fluorite masses at Crystal Mountain may have formed by
separation of an immiscible fluorite-rich melt from a co-existing silicate melt. Recent
experiments by Yang and van Hinsberg (2019) have shown the presence of a miscibility gap in
the CaF2-granite system in the temperature range of 500 to 1200ºC. During cooling,
incompatible elements including Y and the REE partition strongly into the CaF2-rich melt
droplets which, because of their greater density, would tend to sink to the floor of the magma
chamber (Figure 29). The experimental results were used by Yang and van Hinsberg (2019) to
help explain the recent finding of fluorite-melt inclusions in granite and granite-pegmatite of the
Strange Lake rare metal deposit of Quebec and Labrador, Canada (Vasyukova and Williams-
Jones, 2014). The best part of this theory for Crystal Mountain is that it explains the igneous
textures displayed within and along the margins of the fluorite bodies, as well as the segregation
of fluorite into large masses of nearly pure CaF2.
Page 62
50
Overall, a granite-fluorite immiscible melt theory fits the available evidence in this thesis
best for the origin of the Crystal Mountain fluorite deposits. However, the presence of primary
fluid inclusions in Crystal Mountain fluorite shows that a hydrothermal fluid was present as the
fluorite grains grew. This fluid was extremely saline, enriched in NaCl, KCl, carbonate, and
silica, as well as other constituents that could not be identified in this study. An important
question is whether the fluorite deposited from this aqueous fluid (hydrothermal model), or if the
aqueous fluid separated directly from a fluorite-rich melt (magmatic model). Hydrothermal
fluids can exsolve from magmas by two processes: 1) a drop in pressure; or 2) crystallization of
anhydrous minerals, which increases the mole fraction of water in the melt (Burnham, 1979). In
porphyry copper deposits, these two processes are sometimes referred to as “first boiling” and
“second boiling”, respectively. At Crystal Mountain, the primary fluid inclusions in fluorite may
have formed by a second boiling process. As the fluorite mass crystallized from a CaF2-rich
melt, the mole fraction of H2O in the residual melt increased to the point that an aqueous fluid
separated. Furthermore, the volume of aqueous fluid formed must have been relatively small,
judging from the lack of hydrothermal veining or alteration at Crystal Mountain.
Granite meltFluorite melt droplets
Massive fluorite
Figure 29: Granite melt showing fluorite globules forming and sinking to the bottom of the melt.
Page 63
51
4.4. Comparison of Crystal Mountain to other nearby deposits
The Crystal Mountain fluorite mine shares similarities with surrounding deposits in
western Montana. Figure 30 shows the location of Crystal Mountain with respect to the fluorite
deposits at Snowbird and the Dry Creek district (Spar, Wilson Gulch, and Lime Gulch deposits).
The geology of these deposits was described in the report of Sahinen (1962) and the thesis of
Sanford (1972). Additional details on REE geochemistry were given by Ekambaram et al.
(1986). The Snowbird and Dry Creek deposits contain fluorite in close association with very
coarse-grained (pegmatitic) quartz and carbonate minerals (calcite, Fe-rich dolomite). Detailed
petrological and fluid inclusion work was done at Snowbird by Metz et al. (1985) and Samson et
al. (2004). Based on the presence of high temperature, extremely salty fluid inclusions in quartz
and fluorite, Samson et al. (2004) concluded that the Snowbird deposit formed from magmatic
fluids that were released during cooling of the Idaho Batholith. Additional fluid inclusion
studies of fluorite at Snowbird, Spar, and Wilson Gulch are in progress at Montana Tech (C.
Gammons, pers. commun., 2019). Preliminary results show that all of these fluorite occurrences
have similar high-temperature and high-salinity fluid inclusions (Fig. 31), and probably share
some genetic aspects in common. There are also important differences. For example, the
Snowbird and Dry Creek deposits have abundant carbonate minerals, whereas Crystal Mountain
has none. Snowbird is rich in coarse-grained parisite, a rare earth fluoro-carbonate mineral,
whereas REE minerals are uncommon and microscopic in size at Crystal Mountain, and have not
been reported from Dry Creek, with the exception of xenotime (Sanford, 1972). Also, the
geometry of pure fluorite masses found at Crystal Mountain is not found at the other western
Montana fluorite deposits. Crystal Mountain remains unique in this respect. More research is
needed to determine what is the genetic link between Crystal Mountain and the other fluorite
Page 64
52
deposits, not to mention the carbonatite deposits of the Sheep Creek area in southern Ravalli
County.
Figure 30: Location of Crystal Mountain in relation to other fluorite and REE deposits in western Montana.
Figure 31: Fluid inclusions in fluorite from Snowbird (A), Wilson Gulch (B), and Spar (C) deposits.
Snowbird(F,REE)
Dry Creek (F)
Sheep Creek(Nb, REE)
M O N T A N A
WY
ID
KALISPELL
HELENA
BUTTE
DILLON
MISSOULA
LIBBY
THOMPSON FALLS
Crystal Mt. (F,Y,Sc)
A. B. C.
Page 65
53
5. Conclusions
The following is a list of some of the more important findings from this study:
The Crystal Mountain fluorite deposit contains a swarm of lens-shaped bodies of massive
fluorite up to 50 ft. thick and hundreds of feet long surrounded by granodiorite, biotite
gneiss, and amphibolite
The fluorite masses have sharp contacts with surrounding wall rock, with no obvious
evidence of hydrothermal alteration
In thin section, the textures displayed could be classified as hypidiomorphic granular, i.e.,
a typical texture for granitic intrusions. Feldspar and phlogopite in contact with fluorite
show no reaction rim or other signs of alteration
The textures seen in the Taber Collection thin sections suggest that some type of K-
metasomatism occurred in the country rock of the Crystal Mountain deposit. However,
the alteration is fairly subtle, and is not limited to samples that contain fluorite. Also,
there is no evidence of veins in any of the thin sections examined
Accessory minerals of note include albite, apatite, phlogopite, titanite, thorite, and
thortveitite.
Thortveitite is most commonly associated with phlogopite which, in the more mafic
specimens, may be an alteration product of precursor pyroxene or amphibole. In this
study, no thortveitite was seen in fresh pyroxene.
In this study, using SEM-EDS analysis, the average atomic Y content of 13 thortveitite
grains is 4.3% ± 3.5%.
Based on SEM-EDS results for 13 samples of fluorite at Crystal Mountain, the average
wt% of Y in the fluorite is 1.51% ± 0.5%.
Page 66
54
There are two types of fluid inclusions present within the fluorite matrix: primary and
secondary. Primary inclusions were identified by their smaller size, averaging less than
5μm but sometimes as big as 10-15μm, their numerous and large daughter minerals,
especially halites, and the fact that they are scattered randomly (and sparsely) throughout
the fluorite samples.
Primary fluid inclusions displayed high salinity values (~50 wt% NaCl) and high
temperatures of final homogenization (>400ºC). Most primary inclusions showed vapor
bubble disappearance at a lower temperature compared to the temperature of final halite
dissolution.
Secondary fluid inclusions had lower salinity (~6 to 12 wt% NaCleq) and lower
homogenization temperatures (170 to 280ºC). Many secondary inclusions had three
phases at room temperature, including a narrow rim of CO2(l).
The differences between the temperatures of bubble disappearance and halite dissolution
were used to estimate the minimum pressures of trapping for each primary fluid
inclusion. The data indicate a minimum pressure of 3.5 kbar, which corresponds to a
depth (assuming lithostatic conditions) of 10.5 km below surface.
The country rock of granodiorite and gneiss composition shows no evidence of
hydrothermal alteration near contacts with the fluorite. The granular fluorite shows an
intergrown pattern with surrounding minerals, indicating crystallization during plutonic
activity. These observations, coupled with the anomalous concentrations of high field
strength elements (Sc, Nb, Ti, Y, REE, U, Th) in the deposit, suggest the possibility of
Crystal Mountain being a magmatic fluorite deposit formed by crystallization of an
immiscible F-silicate melt (Yang and van Hinsberg, 2019). Data received from this study
Page 67
55
concludes that the Crystal Mountain fluorite mine fits this description of an immiscible
fluorite melt, possibly one of the best examples to date.
5.1. Recommendations
A detailed geologic map of the open pit would help document the relationships between
fluorite and the various geologic units in the country rock
Electron microprobe studies would be helpful to confirm the mineral identifications made
in this thesis, and also to show chemical zonation within individual crystals that could not
be resolved with the scanning electron microscope.
It should be possible to date some of the accessory minerals in the fluorite such as
xenotime, fergusonite, or thorite, by in situ U-Th-Pb methods.
Additional isotope and fluid inclusion comparisons with other fluorite mines in western
Montana could be carried out to better understand similarities and differences between
these districts including the fluid source and flow direction.
Page 68
56
6. References cited
Becker, S. P., Fall, A., and Bodnar, R. J., 2008, Synthetic fluid inclusions. XVII. PVTX
properties of high salinity H2O-NaCl solutions (>30 wt % NaCl): Application to fluid
inclusions that homogenize by halite disappearance from porphyry copper and other
hydrothermal ore deposits: Economic Geology, v. 103, p. 539-554.
Buhn, B., Rankin, A. H., Schneider, J., and Dulski, P., 2002, The nature of orthomagmatic,
carbonatitic fluids precipitating REE, Sr-rich fluorite: fluid inclusion evidence from Okorusu
fluorite deposit, Namibia: Chemical Geology, v. 186, p. 75-98.
Constantopoulos, J., 1988, Fluid inclusions and rare earth element geochemistry of fluorite from
south-central Idaho: Economic Geology, v. 83, p. 626-636.
Ekambaram, V., Brookins, D. G., Rosenberg, P. E., and Emanuel, K. M., 1986, Rare-earth
element geochemistry of fluorite-carbonate deposits in western Montana, USA: Chemical
Geology, v. 54, p. 319-331.
Field, C. W., Zhang, L., Dilles, J. H., Rye, R. O., and Reed, M. H., 2005, Sulfur and oxygen
isotopic record in sulfate and sulfide minerals of early, deep, pre-Main Stage porphyry Cu–
Mo and late Main Stage base-metal mineral deposits, Butte district, Montana: Chemical
Geology, v. 215, p. 61-93.
Foord, E. E., Birmingham, S. D., Demartin, F., Pilati, T., Gramaccioli, C.M., and Lichte, F. E.,
1993, Thortveitite and associated Sc-bearing minerals from Ravalli County, Montana:
Canadian Mineralogist, v. 31, p. 337-346.
Fortier, S. M., Nassar, N. T., Lederer, G. W., Brainard, J., Gambogi, J., and McCullough, E. A.,
2018, Draft critical mineral list – Summary of methodology and background information –
Page 69
57
U. S. Geological Survey Technical Input Document in response to Secretarial Order No.
3359: U. S. Geological Survey, Open-File Report 2018-1021, 16p.
Foster, D. A., and Fanning, C. M., 1997, Geochronology of the northern Idaho batholith and the
Bitterroot metamorphic core complex: Magmatism preceding and contemporaneous with
extension: Geological Society of America Bulletin v. 109, p. 379-394.
Foster, D.A., Doughty, P.T., Kalakay, T.J., Fanning, C.M., Coyner, S., Grice, W.C., and Vogl, J.,
2007, Kinematics and timing of exhumation of metamorphic core complexes along the Lewis
and Clark fault zone, northern Rocky Mountains, USA: Geological Society of America
Special Paper 434, p. 207-232.
Gambogi, J., 2014, Scandium: U.S. Geological Survey, Mineral Commodities Summaries,
February, 2014, p. 140-141.
Geach, R. D., 1963, Fluorspar, In Mineral and Water Resources of Montana: Montana Bureau
Mines Geology, Special Publication 28, p. 65-67.
Giesemann, A., Jager, H. J., Norman, A. L., Krouse, H. P., and Brand, W. A., 1994, On-line
sulfur-isotope determination using an elemental analyzer coupled to a mass spectrometer:
Analytical Chemistry, v. 66, p. 2816–2819.
Haynes, C. V. Jr., 1965, Genesis of the White Cloud and related pegmatites in the South Platte
area, Jefferson County, Colorado: Geological Society of America Bulletin, v. 76, p. 441-462.
Heinrich, E. W., and Levinson, A. A., 1961, Carbonatic niobium-rare earth deposits, Ravalli
County, Montana: American Mineralogist, v. 46, p. 1424-1447.
Hyndman, Donald W., 1980, Bitterroot dome-Sapphire tectonic block, an example of a plutonic-
core gneiss-dome complex with its detached suprastructure: Cordilleran metamorphic core
complexes: Geological Society of America Memoir 153, p. 427-443.
Page 70
58
Kelly, W. C., and Rye, R. O., 1979, Geologic, fluid inclusion, and stable isotope studies of the
tin-tungsten deposits of Panasqueira, Portugal: Economic Geology, v. 74, p. 1721-1822.
Lonn, J. D., McDonald, C., Lewis, R. S., Kalakay, T. J., O’Neill, J. M., Berg, R. B., and
Hargrave, P., 2003, Preliminary geologic map of the Philipsburg 30’× 60’quadrangle,
Montana: Montana Bureau of Mines and Geology Open File Report, MBMG 483.
Magotra, R., Namga, S., Singh, P., Arora, N., and Srivastava, P. K., 2017, A new classification
scheme of fluorite deposits: International Journal of Geosciences, v. 8, p. 599-610.
Mao, M., Simandl, G. J., Spence, J., Neetz, M., and Marshall, D., 2016, Trace element
composition of fluorite and its potential use as an indicator in mineral exploration: British
Columbia Ministry of Energy and Mines: British Columbia Geological Survey Paper 1,
p. 181-206.
Marini, L., Moretti, R., and Accornero, M., 2011, Sulfur isotopes in magmatic-hydrothermal
systems, melts, and magmas: Reviews in Mineralogy and Geochemistry, v. 73(1), p. 423-
492.
Metz, M. C., Brookins, D. G., Rosenberg, P. E., and Zartman, R. E., 1985, Geology and
geochemistry of the Snowbird deposit, Mineral County, Montana: Economic Geology, v. 80,
p. 394-409.
MRDS, 2019, Mineral Resource Data System, U.S. Geological Survey
Parker, R. L., and Havens, R. G., 1963, Thortveitite associated with fluorite, Ravalli County,
Montana: U.S. Geological Survey, Professional Paper 475-B, p. B10-B11.
Parker, R. L., 1976, Washington-Idaho-Montana-Wyoming-South Dakota, in Shawe, D. R., ed.,
Geology and Resources of Fluorine in the United States: U. S. Geological Survey,
Professional Paper 933, p. 38.
Page 71
59
Pingitore, N., Clague, J., and Gorski, D., 2014, Round Top Mountain rhyolite (Texas, USA), a
massive, unique Y-bearing-fluorite-hosted heavy rare earth element (HREE) deposit: Journal
of Rare Earths, v. 32(1), p. 90-96.
Ross, C. P., 1950, Fluorspar prospects of Montana: U.S. Geological Survey, Bulletin 955-E, p.
173-224.
Sahinen, U. M., 1962, Fluorspar deposits in Montana: Montana Bureau Mines Geology, Bulletin
28, 38p.
Samson, I. M., Wood, S. A., and Finucane, K., 2004, Fluid inclusion characteristics and genesis
of the fluorite-parisite mineralization in the Snowbird deposit, Montana: Economic Geology,
v. 99, p. 1727-1744.
Sanford, S. R., 1972, The geology and geochemistry of the Spar and related deposits, Mineral
County, Montana: M. S. thesis, Washington State University, Pullman, WA, p. 95.
Sirbescu, M. L. C., and Nabelek, P. I., 2003, Crystallization conditions and evolution of
magmatic fluids in the Harney Peak Granite and associated pegmatites, Black Hills, South
Dakota—Evidence from fluid inclusions: Geochimica et Cosmochimica Acta, v. 67(13), p.
2443-2465.
Sverdrup, T. L., 1968, Yttrofluorite-yttrocerite-cerfluorite in Norwegian pegmatites: Norsk Geol.
Tidsskr, v. 48, p. 245-252.
Taber, J. W., 1952, Crystal Mountain fluorite deposits, Ravalli County, Montana: U.S. Bureau
Mines, Rep. Invest. 4916.
Taber, J. W., 1953, Montana’s Crystal Mt. fluorite deposit is big and high grade: Mining World,
v. 15, no. 7, p. 43-46.
Page 72
60
Uetani, K., Ogimura, Y., Kato, A., & Nagashima, K., 1968, Chemical studies of minerals
containing rarer elements from the Far East District. LXI. Yttrofluorite from Suishoyama,
Kawamatamachi, Fukushima Prefecture, Japan: Bulletin of the Chemical Society of Japan, v.
41(3), p. 603-605.
Vasyukova, O., & Williams-Jones, A. E., 2014, Fluoride–silicate melt immiscibility and its role
in REE ore formation: Evidence from the Strange Lake rare metal deposit, Québec-Labrador,
Canada: Geochimica et Cosmochimica Acta, v. 139, p. 110-130.
Wallace, C. A., Lidke, D. J., Elliott, J. E., Antweiler, J. C., Campbell, W. L., Hassemer, J. H.,
Hanna, W. F., Banister, D. P., and Close, T. J., 1984, Mineral resource potential of the
Sapphire Wilderness Study Area and contiguous roadless areas, Granite and Ravalli
Counties, Montana: U. S. Geological Survey, Miscellaneous Field Studies Map MF-1469-B,
32 p.
Weis, P. L., Armstrong, F. C., and Rosenblum, S., 1958, Reconnaissance for radioactive
minerals in Washington, Idaho and western Montana, 1952-1955: U.S. Geological Survey,
Bulletin 1074-B, 48 p.
Yang, L. and van Hinsberg, V.J., 2019, Liquid immiscibility in the CaF2-granite system and
trace element partitioning between the immiscible liquids: Chemical Geology, v. 511, p. 28-
41.
Page 73
61
7. APPENDIX A: (SEM-EDS analyses)
Spessartine: Ideal formula: Mn3Al2Si3O12 Al Si Ca Mn Fe
1 wt% 13.3 21.6 2.4 21.4 15.9 at% 13.7 21.4 1.6 10.8 7.9 approximate
formula:
(Mn.53Fe.39Ca.08)3Al2(SiO4)3
2 wt% 13 21.7 2.6 21.1 15.2 at% 13.3 21.3 1.8 10.6 7.5 approximate
formula:
(Mn.53Fe.38Ca.09)3Al2(SiO4)3
3 wt% 12.9 22.2 4.3 21.7 13.6 at% 13.3 22 3.1 11 6.8 approximate
formula:
(Mn.53Fe.33Ca.15)3Al2(SiO4)3
4 wt% 12.2 21.1 4.4 21.6 13.3 at% 12.2 20.3 3 10.6 6.4 approximate
formula:
(Mn.53Fe.32Ca.15)3Al2(SiO4)3
Avg. wt% 12.9 21.7 3.4 21.5 14.5
at% 13.1 21.3 2.4 10.8 7.2
Phlogopite Mg Al Si K Ti Fe F
1 wt% 14.5 8.1 27.5 11.1 0.58 10.1
at% 14.6 7.3 23.9 6.9 0.3 4.4
2 wt% 14.6 9.1 27.1 11.1 0.6 10.2
at% 14.8 8.3 23.7 7 0.3 4.5
3 wt% 13.9 8.2 26.2 10.7 0.6 10.4 4.5 at% 14 7.5 22.8 6.7 0.3 4.6 5.8
4 wt% 14.2 9.1 27.5 11.6 0.5 11.3
at% 14.5 8.4 24.4 7.4 0.3 5
5 wt% 14.2 8.9 26.7 10.9 0.6 10.3 2.8 at% 14.4 8.1 23.4 6.8 0.3 4.5 3.7
6 wt% 14.1 8.5 27.7 11.4 10.8
at% 14.2 7.7 24.1 7.2 4.7
7 wt% 14.4 8.4 27.8 11.2 9.8
at% 14.3 7.5 24 6.9 4.2
8 wt% 13.2 9.6 26.8 10.9 0.7 10.5 2.6 at% 13.3 8.8 23.4 6.8 0.4 4.6
Avg. wt% 14.1 8.7 27.2 11.1 0.6 10.4 3.3
at% 14.3 8.0 23.7 7.0 0.3 4.6 4.8
Approximate formula: K(Mg.76Fe.24)3AlSi3O10(F,OH)2
Page 74
62
Thortveitite: Ideal formula: Sc2Si2O7 Si Sc Ca Fe Y
1 wt% 26.5 37.5 7.1 at% 25.7 22.7 2.2
2 wt% 28.6 39.7 1.1 2.2 0 at% 27.2 23.6 0.7 1.1 0
3 wt% 28.6 40.6 0.9 1.4 0 at% 27.2 24.1 0.6 0.7 0
4 wt% 28.9 40.3 1.7 0 at% 27.3 23.8 0.8 0
5 wt% 28 39.3 0.7 2.1 2.3 at% 27.2 23.9 0.5 1 0.7
6 wt% 27.6 38.9 0.5 1.8 3.3 at% 26.7 23.6 0.4 0.9 1
7 wt% 28.1 39.9 0.6 2.3 2.1 at% 27.4 24.3 0.4 1.1 0.6
8 wt% 28.22 40.3 3.8 at% 27.4 24.4 1.2
9 wt% 27.8 42 1.34 3.7 at% 27.8 26.2 0.7 1.2
10 wt% 27.63 39.7 1.6 5.3 at% 27.6 24.8 0.8 1.7
11 wt% 28.3 37.9 1.3 5.2 at% 27.8 23.2 0.6 1.6
12 wt% 29 38 1.27 2.5 at% 27.5 22.5 0.6 0.8
13 wt% 27.3 35.5 9.3 at% 26.9 21.8 2.9
Avg. wt% 28.0 39.2 0.8 1.7 3.4
at% 27.2 23.8 0.5 0.8 1.1
Approximate formula: (Sc.91Y.04Fe.03Ca.02)2Si2O7
Page 75
55
Fergusonite: Samarskite
Y Nb Th Ca La Ce Eu Gd Dy Yb
1 wt% 19 40.9 9.4 1.9 0.4 1.6 0.8 3.2 4.6 2.5
at% 11.8 24.4 2.2 2.6 0.1 0.6 0.3 1.1 1.6 0.8
approximate formula: (Y.56REE.34Th.10Ca.12)NbO4 2 wt% 21.2 43.3 7.6 1.3 0.9 2.4 4.6
at% 13.2 25.7 1.8 1.7 0.4 0.8 1.6
approximate formula: (Y.68REE.14Th.09Ca.09)NbO4 3 wt% 28.14 46.3 2.51 5.14
at% 16.39 25.81 0.8 1.6
approximate formula: (Y.87REE.13)NbO4 4 wt% 17.7 40 5.1 1.4 0.4 2.7 5.4
at% 11.9 25.8 1.3 2.1 0.2 1 2
approximate formula: (Y.87REE.13)NbO4
Rowlandite
F Mg Si Y Gd Dy Er Yb Nd Fe
1 wt% 2.8 3.7 18.5 40.9 3 6.5 3.8 3.3
at% 5.7 5.8 25.3 17.6 0.7 1.5 0.8 0.7
approximate formula: (Y.83REE.17)4Mg(Si2O7)2(F,OH)2
2 wt% 17.9 34.9 6.1 4.41 8.56
at% 21.4 13.1 1.31 1.03 5.14
approximate formula: (Y.85REE.15)4Fe(Si2O7)2(F,OH)2
Page 76
64
Xenotime
Y P Yb Sc Ce Nd Sm Ge Dy Gd
1 wt% 26.6 6.7 8.3 1.1 3.9 5.9 2.4 2.6 3.7
at% 12.5 9.1 2 1.1 1.2 1.7 0.7 0.7 1
approximate formula: (Y.60REE.35Sc.05)PO4
2 wt% 38.9 15.4 10.5 0.06 2.2 2.2
at% 14.8 16.8 2.1 0.02 1.1 0.5
approximate formula: (Y.82REE.18)PO4
3 wt% 30.9 7.5 4.5 5.1
at% 12.9 8.9 1 4.2
approximate formula: (Y.71Sc.23REE.06)PO4
4 wt% 41.57 15.1 1.9 2.4
at% 15.7 16.4 0.4 0.5
approximate formula: (Y.97REE.03)PO4
Avg wt% 34.5 11.2 7.8 3.1 2.0 3.9 NA NA 3.0 2.3
at% 14.0 12.8 1.7 2.7 0.6 1.1 NA NA 1.1 0.5
Page 77
65
Titanite: Ideal formula: CaTiSiO5
Al Si Ca Ti Fe
1 wt% 4.4 19.9 25.6 21.7 2.7
at% 4.5 19.6 17.6 12.5 1.3
2 wt% 2.2 22.9 22.2 21.7 3.8
at% 2.2 22.2 15.1 12.3 1.9
3 wt% 3.9 19.3 25.4 22.7 2.7
at% 4 19 17.5 13.1 1.3
4 wt% 4.3 19.6 25.4 22.1 2.8
at% 4.4 19.4 17.5 12.8 1.4
5 wt% 3.7 19.9 25.4 21.6 2.8
at% 3.8 19.4 17.4 12.4 1.4
Avg. wt% 3.7 20.3 24.8 22.0 3.0
at% 3.8 19.9 17.0 12.6 1.5
Approximate formula: Ca.93Ti.69Si1.08Al.21Fe.09O5
Thorite: Ideal formula: ThSiO4
Si Th U
1 wt% 9.8 56.5 19.1
at% 21.6 15 5
approximate formula: (Th.75U.25)SiO4
2 wt% 7.93 21.99 19.6
at% 15.5 12.3 4.5
approximate formula: (Th.73U.27)SiO4
3 wt% 10.6 60.7 14.7
at% 24.6 17.1 4
approximate formula: (Th.81U.19)SiO4
Avg. wt% 9.4 46.4 17.8
at% 20.6 14.8 4.5
Thorogummite
Si Th U
1 wt% 8.4 62.44 13.2
at% 18 16.2 3.3
approximate formula: (Th.83U.17)SiO4.H2O
2 wt% 8.7 57.3 16.4
at% 17.6 14 3.9
approximate formula: (Th.78U.22)SiO4.H2O
3 wt% 8.6 60.1 9.7
at% 16.3 13.8 2.2
approximate formula: (Th.86U.14)SiO4.H2O
Page 78
66
Fluorite
F Y Ca
1 wt% 36.2 1.6 62.2
at% 54.8 0.5 44.6
2 wt% 36.0 1.5 62.5
at% 54.6 0.5 45.0
3 wt% 36.6 1.4 62.0
at% 55.2 0.5 44.4
4 wt% 37.2 1.4 61.4
at% 55.8 0.5 43.7
5 wt% 36.9 1.4 61.7
at% 55.5 0.5 44.0
6 wt% 37.3 2.1 60.6
at% 56.1 0.7 43.2
7 wt% 34.9 1.5 63.6
at% 53.4 0.5 46.1
8 wt% 37.2 1.4 61.5
at% 55.8 0.4 43.7
9 wt% 37.3 1.4 61.3
at% 56.0 0.4 43.6
10 wt% 37.0 1.4 61.6
at% 55.7 0.4 43.9
11 wt% 38.3 1.6 60.1
at% 57.1 0.5 42.5
12 wt% 34.4 1.4 64.2
at% 52.8 0.5 46.7
13 wt% 35.2 1.5 63.3
at% 53.7 0.5 45.8
Avg. wt% 36.5 1.5 62.0
at% 55.1 0.5 44.4
Approximate formula: (Ca.989,Y.011)F2
Page 79
67
8. APPENDIX B: (Fluid inclusion data)
Primary
Inclusions
Temperature of vapor
bubble disappearance (ºC)
Halite dissolution temperature (ºC)
Salinity
wt% NaCl
1 303 436 49.5
2 312 477 53.8
3 347 434 49.3
4 325 436 49.5
5 341 467 52.7
6 342 485 54.6
7 342 494 55.6
8 410 504 56.8
9 243 448 50.7
10 370 435 49.4
11 308 483 54.4
12 323 472 53.2
13 317 463 52.3
14 325 485 54.6
15 314 477 53.8
16 325 470 53.0
17 339 468 52.8
18 356 453 51.2
19 471 451 51.0
20 310 466 52.6
21 326 482 54.3
22 318 460 52.0
23 276 480 54.1
24 515 470 53.0
25 416 481 54.2
26 365 492 55.4
27 243 369 43.3
28 295 399 46.0
29 392 400 46.1
30 296 277 36.3
31 320 423 48.2
32 330 367 43.1
33 283 380 44.3
34 517 362 42.7
35 373 425 48.4
36 312 373 43.7
Page 80
68
37 508 388 45.0
38 300 397 45.8
39 301 403 46.3
40 307 394 45.5
41 348 392 45.3
42 350 397 45.8
43 333 388 45.0
44 264 426 48.5
45 313 424 48.3
46 311 440 49.9
47 307 419 47.8
Secondary
Inclusions
Temperature of vapor
bubble disappearance (ºC)
Ice melting temperature (ºC)
Salinity
wt% NaCl
1 260 -6.5 9.9
2 261 -6.6 10.0
3 235 -6.8 10.2
4 251 -6.7 10.1
5 235 -6.6 10.0
6 258 -6.6 10.0
7 251 -6.7 10.1
8 252 -6.5 9.9
9 250 -6.5 9.9
10 249 -6.6 10.0
11 250 -6.6 10.0
12 256 -6.5 9.9
13 256 -6.6 10.0
14 260 -6.4 9.7
15 252 -6.6 10.0
16 181 -7.3 10.9
17 180 -7.2 10.7
18 188 -7.2 10.7
19 183 -7.1 10.6
20 184 -7.2 10.7
21 182 -7.3 10.9
22 188 -7.1 10.6
23 185 -7.5 11.1
24 181 -7.6 11.2
25 195 -6.9 10.4
26 184 -7.0 10.5
27 181 -7.1 10.6
28 186 -7.2 10.7
Page 81
69
29 185 -7.3 10.9
30 181 -7.2 10.7
31 181 -7.2 10.7
32 186 -7.4 11.0
33 201 -7.3 10.9
34 185 -7.1 10.6
35 186 -7.0 10.5
36 187 -7.5 11.1
37 243 -5.4 8.4
38 269 -5.8 8.9
39 282 -5.6 8.7
40 270 -5.1 8.0
41 255 -5.7 8.8
42 231 -5.3 8.3
43 285 -5.6 8.7
44 282 -5.2 8.1
45 269 -5.3 8.3
46 260 -5.5 8.5
47 219 -5.7 8.8
48 243 -5.7 8.8
49 170 -5.1 8.0
50 250 -5.5 8.5
51 258 -5.4 8.4
52 183 -5.4 8.4
53 199 -5.8 8.9
54 181 -5.3 8.3
55 185 -5.3 8.3
56 182 -5.1 8.0
57 177 -5.6 8.7
58 190 -5.5 8.5
59 280 -5.4 8.4
60 267 -5.5 8.5
61 265 -5.3 8.3
62 266 -5.3 8.3
63 258 -5.8 8.9
64 274 -5.6 8.7
65 270 -5.6 8.7
66 275 -5.6 8.7
67 203 -6.0 9.2
68 270 -5.7 8.8