TRANSPORTA TION R ESEARCH RECORD 1418 35 Mineralogy of Aggregates in Relation to the Frictional Performance of Seal Coat Pavement Overlays: A Petrographic Study MOHAMED-ASEM u. ABDUL-MALAK, D. W. FOWLER, AND A. H. MEYER A petrographic study was conducted to id entify the min e ral og i ca l and textural prope rti e of aggrega tes th at may influence the fri c- tional per fo rm ance of seal coa t pavemem ov erlay constructed with th ese agg regates . Twenty aggrega te a mple were petro- gr aphi ca lly examined a nd the ir fr icti onal perfo nnance in eal coat ove rl ays wa · monitored over abo ut 4 year . The petrographic and fi eld results were used to fo rmul ate a proba bili stic prediction mod el de ·cribing fi e ld performanc e. St a ti stica ll y ignifi ca nL pe- trographic vari a bl es in cluded th e percentage of grain- upported texture particles th e amounts of dolomiti c and oth er ca rbonate grains in aggregate particles, the percentage of noncarbonate ma- trix in particles, and the level of prevailing void content. A con- struction-related vari abl e, the des ign spreading rate of aggregate particles, also showed signific ance in explaining ome of the. ob- served variation in frictional performance. A petrographic study was conducted as part of a research project at the University of Texas at Austin. The ultimate aim of this project was to formulate statistical models for predicting the frictional performance of seal coat pavement overlays. The methodology (1 ,2) involved establishing 59 seal coat test sections in all the four environmental regions of Texas and monitoring their frictional performances over time. The following factors , believed to have an influence on perfor- mance and identified in the literature and Texas districts sur- veys (J), were considered: aggregate physical and mineral- ogical properties, construction variables, traffic, and environment and weather variables. Construction data had construction application rates and types of aggregates and asphalt. Aggregate samples obtained from construction sites were tested in the laboratory for their basic properties, polish susceptibility, resistance to weathering action, and resistance to abrasion and impact actions. Twenty of the samples were also examined for their mineralogical and petrographical properties. In this examination, the mineral- ogical constituents were estimated, and the textural charac- teristics were evaluated. The frictional performance data were graphed to detect the sources of variations and then grouped according to the dif- ferent variables considered. The grouping gave insights into which variables controlled the observed differences in fric- tional performance. The grouping was followed by extensive statistical modeling, which pinpointed the significant varia- M.-A. U. Abdul-Malak, Faculty of Enginee ring and Architecture, American University of'Beirut, Beiru r, Lebanon. D. W. Fowler and A. H. Meyer, Department of Civil Engineering, The University of Texas at Austin, Austin , Tex. 7871 2- 1 076 . hies. In this paper, only the results pertaining to the observed effects of aggregate's petrographic properties on frictional performance are presented. OBJECTIVES OF THE PETROGRAPHIC STUDY The petrographic examination was performed 1. To determine the physical properties of an aggregate that may be observed by petrographic methods and that may have a bearing on the performance of the aggregate in seal coat surfaces; 2. To identify, describe, and classify the constituents of the aggregate sample; and 3. To determine the relative amounts of the constituents of the samples when the constituents differ significantly in a property, such as hardness, that may be expected to influence the frictional behavior of the aggregate when used in these surfaces. BACKGROUND Rocks can be classified into three major groups: igneous, sedimentary, or metamorphic. Igneous rocks are formed by cooling and solidification of magma. Metamorphic rocks are formed by transformations of preexisting rocks while they remain in the solid state. Most of the aggregates of this study were sedimentary rocks. Hence, the formation, composition, and texture of this type of rock were reviewed to develop a procedure for identifying the mineralogical and petrographic properties that may be relevant to the study. Formulation of Sedimentary Rocks Sedimentary rocks are formed either by the accumulation of weathered mineral and rock fragments or by precipitation. However, postdepositional changes are common in these rocks and affect both the texture and composition (3) . These changes occur at relatively low temperatures and are termed diage- netic, which includes compaction, solution, and authigenesis and replacement (3 ,4) . The most common authigenic minerals replacing calcite in limestones are quartz, chert, and dolomite.
Transcript
TRANSPORTA TION RESEARCH RECORD 1418 35
Mineralogy of Aggregates in Relation to the Frictional Performance of Seal Coat Pavement Overlays: A Petrographic Study
MOHAMED-ASEM u. ABDUL-MALAK, D. W. FOWLER, AND A. H. MEYER
A petrographic study was conducted to identify the mineralogical and textural propertie of aggregates that may influence the frictional perfo rmance of seal coat pavemem overlay constructed with these aggregates . Twenty aggregate ample were petrographica lly examined and their frictional perfonnance in eal coat overlays wa · monitored over about 4 year . The petrographic and field results were used to fo rmulate a probabilistic prediction model de ·cribing field performance. Statistically ignificanL petrographic variables included the percentage of grain- upported texture particles the amounts of dolomitic and other carbonate grains in aggregate particles, the percentage of noncarbonate matrix in particles, and the level of prevailing void content. A construction-related variable, the design spreading rate of aggregate particles, also showed significance in explaining ome of the. observed variation in frictional performance.
A petrographic study was conducted as part of a research project at the University of Texas at Austin. The ultimate aim of this project was to formulate statistical models for predicting the frictional performance of seal coat pavement overlays. The methodology (1 ,2) involved establishing 59 seal coat test sections in all the four environmental regions of Texas and monitoring their frictional performances over time. The following factors , believed to have an influence on performance and identified in the literature and Texas districts surveys (J), were considered: aggregate physical and mineralogical properties, construction variables, traffic, and environment and weather variables .
Construction data had construction application rates and types of aggregates and asphalt. Aggregate samples obtained from construction sites were tested in the laboratory for their basic properties, polish susceptibility, resistance to weathering action, and resistance to abrasion and impact actions . Twenty of the samples were also examined for their mineralogical and petrographical properties. In this examination, the mineralogical constituents were estimated, and the textural characteristics were evaluated.
The frictional performance data were graphed to detect the sources of variations and then grouped according to the different variables considered . The grouping gave insights into which variables controlled the observed differences in frictional performance. The grouping was followed by extensive statistical modeling, which pinpointed the significant varia-
M.-A. U. Abdul-Malak, Faculty of Engineering and Architecture, American University of'Beirut, Beirur, Lebanon. D. W. Fowler and A. H . Meyer, Department of Civil Engineering, The University of Texas at Austin, Austin , Tex. 78712-1076.
hies. In this paper , only the results pertaining to the observed effects of aggregate's petrographic properties on frictional performance are presented.
OBJECTIVES OF THE PETROGRAPHIC STUDY
The petrographic examination was performed
1. To determine the physical properties of an aggregate that may be observed by petrographic methods and that may have a bearing on the performance of the aggregate in seal coat surfaces;
2. To identify, describe , and classify the constituents of the aggregate sample; and
3. To determine the relative amounts of the constituents of the samples when the constituents differ significantly in a property , such as hardness, that may be expected to influence the frictional behavior of the aggregate when used in these surfaces.
BACKGROUND
Rocks can be classified into three major groups: igneous , sedimentary, or metamorphic. Igneous rocks are formed by cooling and solidification of magma . Metamorphic rocks are formed by transformations of preexisting rocks while they remain in the solid state. Most of the aggregates of this study were sedimentary rocks. Hence, the formation , composition, and texture of this type of rock were reviewed to develop a procedure for identifying the mineralogical and petrographic properties that may be relevant to the study.
Formulation of Sedimentary Rocks
Sedimentary rocks are formed either by the accumulation of weathered mineral and rock fragments or by precipitation. However, postdepositional changes are common in these rocks and affect both the texture and composition (3) . These changes occur at relatively low temperatures and are termed diagenetic, which includes compaction, solution, and authigenesis and replacement (3 ,4) . The most common authigenic minerals replacing calcite in limestones are quartz, chert, and dolomite.
36
Composition of Sedimentary Rocks
Limestone, dolomite, sandstone, and chert are the most common sedimentary rocks. Common minerals in these rocks include carbonate minerals such as calcite and dolomite and noncarbonates such as quartz, chert, pyrite, and feldspar. The calcite and dolomite minerals are soluble in dilute hydrochloric acid and have hardness values of 4 or less according to Mohs's scale of hardness; calcite has a hardness of 3, whereas dolomite is slightly harder with a hardness of 3.5 to 4.0. The noncarbonate minerals are insoluble and their hardness ranges from 6 to 7.
Texture of Sedimentary Rocks
Texture refers to a rock's crystallinity, grain size, and the mutual relationship of the individual components ( 4,5). Some rocks are composed of single size grains , whereas others are made up of large crystals scattered through a matrix of smullcr ones.
The material in aggregates with a wide range of particle sizes is subdivided into grains and matrix. These terms refer to the relative size of the particles and their deposition in the aggregate. If grains compose more than two-thirds of an aggregate, the grains will be in contact, resulting in a grainsupported texture. In this texture, the matrix simply fills in the potential pores between the grains. On the other hand, if the grains are much fewer, loosely packed, and scattered in the matrix, they appear to be suspended in the matrix , resulting in a matrix-supported texture.
In limestones, the matrix may be composed of microcrystalline calcite or spary calcite. Calcite grains may be fossils, oids, pellets, or intraclasts, all of which consist of calcite spar or mud with different internal structures.
TRANSPORTATION RESEARCH RECORD 1418
EXAMINATION PROCEDURE AND RESULTS
Examination Procedure
A simple petrographic procedure was developed that included those mineralogical and textural properties identified. Table 1 was designed to facilitate organization of the information from the examination. The second part of the table was adapted from Dunham's limestone classification (4) and modified so that it can also be used for the examination of rocks other than sedimentary. Dunham suggested the use of a polarizing microscope for examining thin sections of aggregate particles, whereas in this study the mineralogical and textural properties of aggregates were evaluated by examining aggregate particles under a stereomicroscope. A total of 20 handful-sized aggregate samples, representing the limestone rock asphalt (LMRA), limestone (LMST), siliceous gravel (SIGR), and sandstone (SDST) aggregate groups were examined. The LMRA aggregate group is characterized by natural impregnation of asphalt into the pores of the rock. The impregnated asphalt and the asphalt coating on the precoated samples were extracted (6) before these samples were examined as follows:
1. Acid-etch the handful-sized sample to reveal the depositional texture of the carbonate particles and remove dust coating. Etch by placing the sample in a container and adding enough dilute hydrochloric acid (concentration of 5 to 10 percent) to cover the particles being examined. The container is gently swirled for approximately 20 sec, then rinsed thoroughly with water. Caution should be taken for potential spattering when examining calcareous particles.
2. The aggregate sample is then subdivided into groups, each having particles with certain textural and mineralogical characteristics that may be related similarly to the overall expected performance. To accomplish this, each aggregate particle is examined on all of its sides using a stereomicroscope
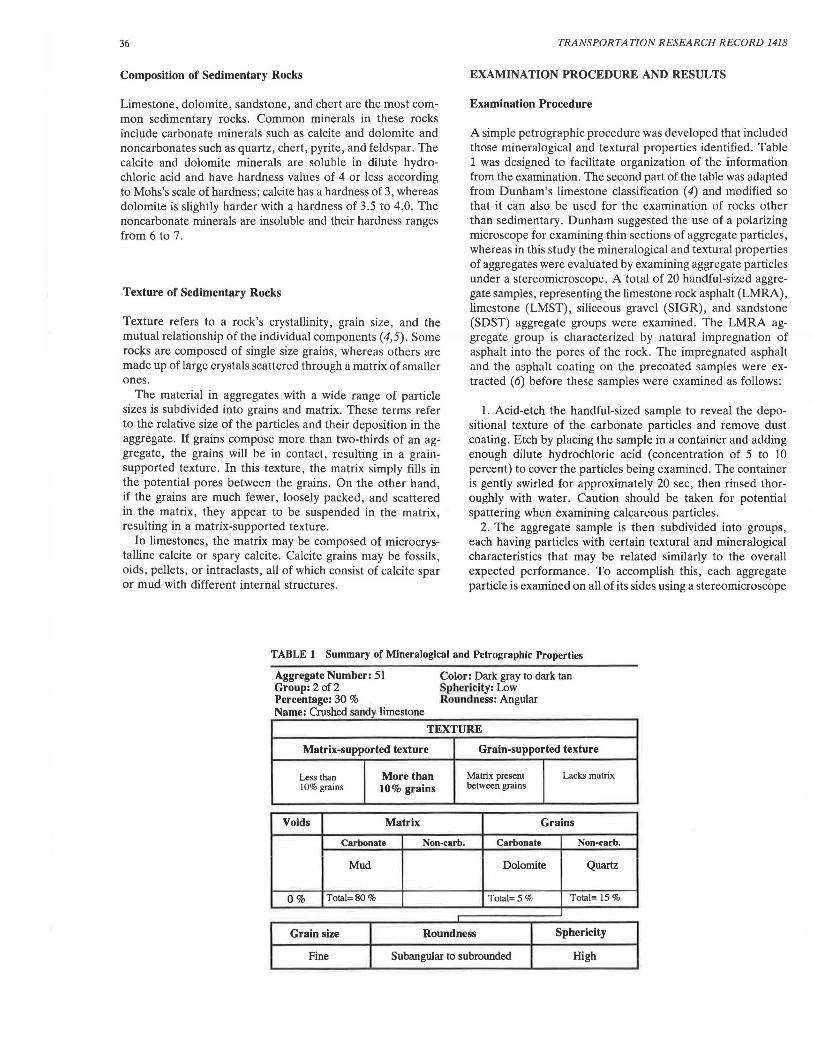
TABLE 1 Summary of Mineralogical and Petrographic Properties
Color: Dark gray to dark tan Sphericity: Low .Roundness: Angular
TEXTURE
Matrix-supported texture Grain-supported texture
Less than More than Matrix present Lacks matrix 10% grains 10% grains between grains
Voids Matrix Grains
Carbonate Non-carb. Carbonate Non-carb.
Mud Dolomite Quartz
0% Total=80% Total=5% Total= 15%
Grain size Roundness Sphericity
Fine Subangular to subrounded High
Abdul-Malak et al.
at a magnification of 10 to 45 and then placed in a group that best represents its overall textural and mineralogical characteristics . A balance should be sought between a reasonable number of groups and properly representing the expected performance. It is suggested that the number of groups be limited to five, preferably three for crushed limestones.
3. The data for each subdivided group are summarized in separate tables. The first part of each table has information on the approximate percentage of total sample, name, color, roundness, and sphericity of group particles. On the basis of roundness and the curvature of the corners of a particle, six classes can be distinguished: very angular, angular, subangular, subrounded, rounded, and well rounded. Sphericity, a measure of how closely the particle shape approaches that of a sphere, is characterized as low, medium, or high.
4. In the second part, each group is classified according to its overall textural appearance into either a matrix- or grainsupported texture.
5. The textural evaluation is taken one step further by classifying matrix-supported textures into either less than 10 percent grains or more than 10 percent grains . Grain-supported textures are subdivided into either matrix present between grains or no matrix present (by the end of this step, a particular group will have been assigned to one of the four textural classifications of Table 1).
6. Once a texture class is selected, the aggregate group is described in terms of its overall average percentage of voids and the percentage and mineralogy of its matrix and grains. The mineral constituents of the matrix and grains categories are then divided into carbonates and noncarbonates. The percent subtotal in this third part of the table must add up to 100 (i.e., percent void + percent carbonate matrix + percent noncarbonate matrix + percent carbonate grains + percent noncarbonate grains = 100). In each class under the matrix and grains categories, the different minerals are expressed in terms of their percentages of the percent subtotal for that class.
7. The grains are characterized with respect to their size, roundness, and sphericity. Grain size is evaluated from very fine to very coarse, whereas grain roundness and sp11ericity are evaluated in the same manner as those of the aggregate particles in the first part of the table.
8. Photomicrographs of the texture representing each of the groups encountered in a particular aggregate are taken.
Examination Results
The results describing a group of limestone particles in Aggregate 51 are included in Table 1. Table 2 summarizes information on the different groups encountered in each aggregate sample. The results for each group in a particular aggregate sample were used to calculate weighted results that represent the sample as a whole. For each of the variables included in Table 1, this was done by multiplying the results obtained in each of the groups by the respective percentages of the groups to the whole sample. The weighted results, given in Table 3, were used in the statistical analysis. The meanings of the variables in this table are as follows:
VCG = percent void content in grain-supported texture particles,
VCM = percent void content in matrix-supported texture particles,
SPH = particle sphericity, and RND = particle roundness.
The meanings of the abbreviations under the sphericity and roundness variables are as follows: LTM, low to medium; MED, medium; ANGU, angular; ATSA, angular to subangular; A TSR, angular to subrounded; and WRTA, well rounded to angular.
The noncarbonate content weighted results when compared with those of the insoluble residue test (ASTM D3042-79) performed on all examined sample indicated a coefficient of correlation of 0.99. This gives confidence in the resuJts of the subjective evaluation o[ mineralogical content attempted in this study. Future work may involve a more objective method of mineralogical evaluation, such as the X ray diffraction procedure.
Textures and Minerals Encountered
The rocks examined were from all of the three basic rock types and exhibited a wide variety of textures. The sedimentary rocks were carbonates, sand tones and cherts. The igneous and metamorphic rocks included quartzite, quartz, granite gneiss, and a minor amount of volo11nic rocks.
The carbonate rocks were mudstone , wackestones, packstones, dolomitic limestones, sandy limestones, and dolomites. The matrix was predominantly microcrystalline calcite mud, with partial recrystallization of the mud to spary calcite in some. The carbonate grains observed were composed of
calcite spar, calcite mud, or doh>mite. H wever, siliceous pyr.ite, pyrolu ite clay, and limonite grains as well a stylolite formation were al o found. In addition, these rocks had a wide range of visible porosity, which is considered to generally increase frictional properties. This phenomenon may be compared with that of the synthetic lightweight aggregates whose vesicular structure contributes to the well-documented, excellent frictional properties (1).
Mudstones are matrix-supported limestones with less than 10 percent grains. Some mudstones were dense and firm, comprising well-compacted microcrystalline calcite, whereas others had a considerable amount of voids. Wackestones are also matrix-supported limestones but with more than 10 percent grains. Tht:se were found with a wide range of percent voids in their structures. Packstones, which are grain-supported limestones, had the widest range of percent voids in this study. Some were firmly dense, whereas others were so porous that they were described as very soft and friable. The !alter were frequently composed of calcite and dolomite grain that were not well compacted.
The presence of dolomite grains, which have a hardness lightly greater than that of calcite grains, is expected to en
hance the frictional properties of the carbonate rocks. When dolomite grains were more than a trace in a limestone, the rock was referred to as a dolomitic limestone. Similarly, when quartz grains were found in sizeable amounts, the limestone was referred to as a sandy limestone.
Dolomites were also observed that were predominantly composed of dolomite grains with calcite mud filling the pores between them. Thus, they were clas ified as grain supported.
The other types of sedimentary rocks examined wer sandstones and cherts. Sandstones were commonly composed of abundant quartz feldspar or carbonate grains cemented together with calcite or silica and perhaps some minor hematite and other impurities . Therefore they were considered to have an excellent grain-supported texture. When the grains were cemented with calcite, the rock was referred to as a calcareous
Abdul-Malak et al.
sandstone. This rock is believed to have excellent differential wear, which has great influence on frictional properties. Chert is a microcrystalline quartz formed by ei1her the accumulation of organism sediment or precipitation from solution. Although cherts are hard and, thus, are expected to aid in frictional resistance, they were classified as matrix-supported because of the lack of surface texture .
In the metamorphic and igneous groups, quartz.ite and granite gneiss were identified. Quartzite is a metamorpho ed quartz sandstone. ft was composed of quartz grains with silica cement that had grown in optical continuity around each fragment. Granite gneiss also referred to as metagranite, is a metamorphic rock containing mostly quartz with some fe ld par and mica in a conspicuously foliated, banded or aligned pattern. Both rocks were considered to have a granular .texture and lacked matrix .
Last was quartz, a hard rock with no surface texture. It was considered to be matrix-supported with less than 10 percent grains.
ANALYSIS OF FIELD DATA
Collected Data
Field data were gathered on all established test sections. The data for each test section consisted of a survey of construction variables performed at the construction site, traffic data collected annually, m;ults of field testing , and long-term and periodical weather data.
For each test section, a survey was made of the coarse aggregate material and asphalt type and the rates at which both materials were to be placed [the design distribution rate of asphalt and the spreading rate of aggregate (AGSR)]. The AGSR ranged from 77 to 142 m2 of surface for each cubic meter of aggregate (70 to 130 yd2/yd3). The annual average daily traffic (ADT) counts varied between 300 and 3,500 vehicles per lane.
80
ll:i 70 • 0
~ 60 :E: Pi! 0 so ir.. Pi! ll:i 40 Ao.
~ 30 = 0 I:: 20
39
The skid resistance test has been conducted twice a year in accordance with ASTM E274. The measured friction is expressed as a friction number (FN). Six sets of skid resistance measurements that spanned about 3.5 years were used in the analysis to follow.
Detailed climatological data have also been ought. Specifically tlie data have been concerned with the testing seasons (dry or wet) and the amount of rainfall that occurred before and during field testing. These data were statistically analyzed to explain as much of the field performance variability as possible.
Grouping of Field Frictional Data
The friction data for the test sections and replicates built with the 20 aggregates examined petrographically were used. The data were grouped according to the major variables describing aggregate texture and mineralogy.
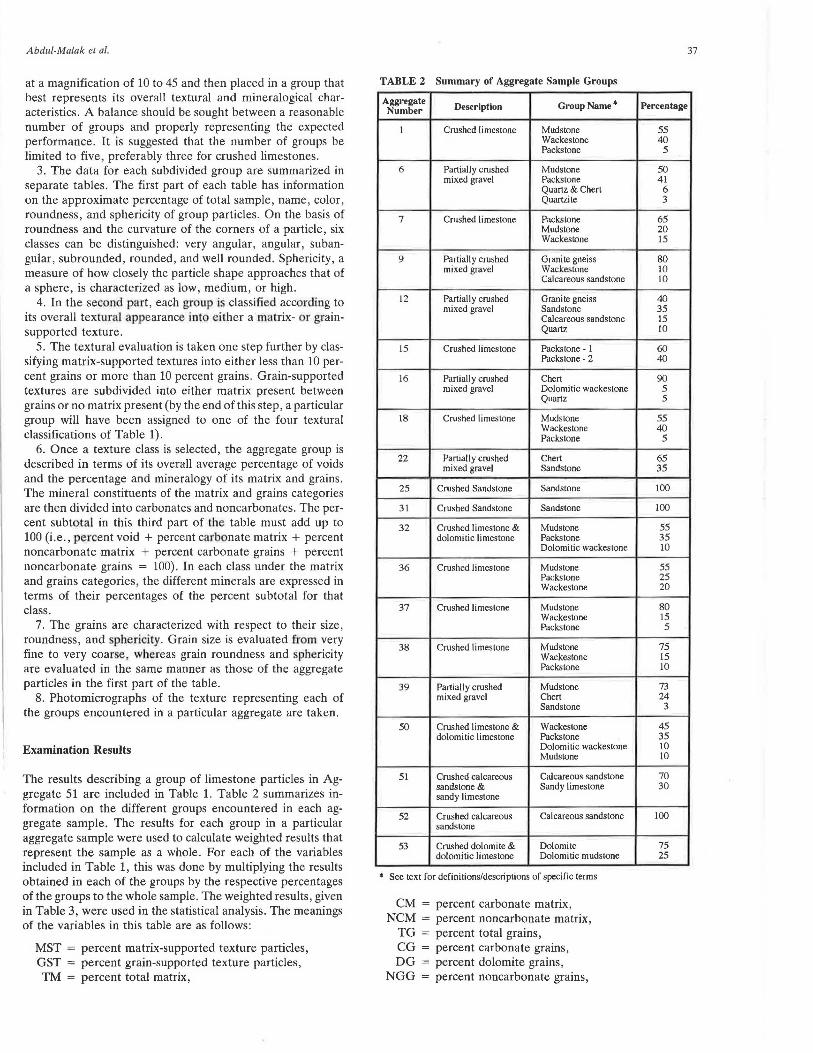
First, the data for the 20 aggregates were divided into two groups on the basis of percentage of particles with a grainsupported texture (Figure 1). Most of the aggregates with more than 50 percent GST particles had performance levels above the zone of minimum friction. This zone was assumed to be confining FNs in the range of 30 to 40. The data for the group with less than 50 percent GST particles were widely scattered but generally showed a decrease in frictional resistance. Groupings according to content of minerals with Mohs's hardness values greater than 5 revealed further explanations for the observed variations. Aggregates with more than 50 percent GST particles but less than 10 percent hard minerals experienced a decrease in frictional resistance (Figure 2), whereas the majority of the aggregates with less than 50 percent GST particles but more than 90 percent hard minerals had the highest FNs (Figure 3).
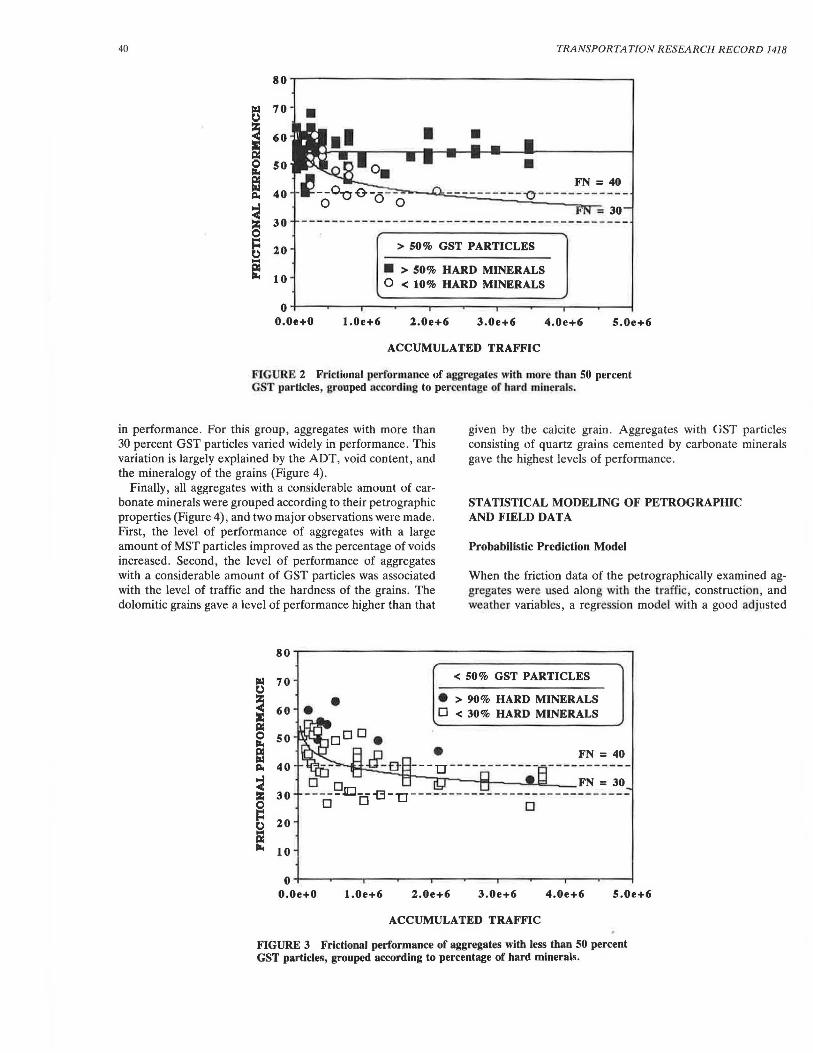
Second, the data for the 20 aggregates were grouped according to percentage of hard minerals (2). The group with less than 30 percent hard minerals showed a general decrease
• I• I
0 .... P:I ir.. 10
• > 50% GST PARTICLES 0 < 50% GST PARTICLES
0 O.Oe+O l.Oe+6 2.0e+6 3.0e+6 4.0e+6 S.Oe+6
ACCUMULATED TRAFFIC
FIGURE I Frictional performance of aggregates considered in the petrographic examination, grouped according to their textural classification.
FIGURE 2 Frictional performance of aggregate with more than 50 percent GST particles, grouped according to percentage of hard mineral .
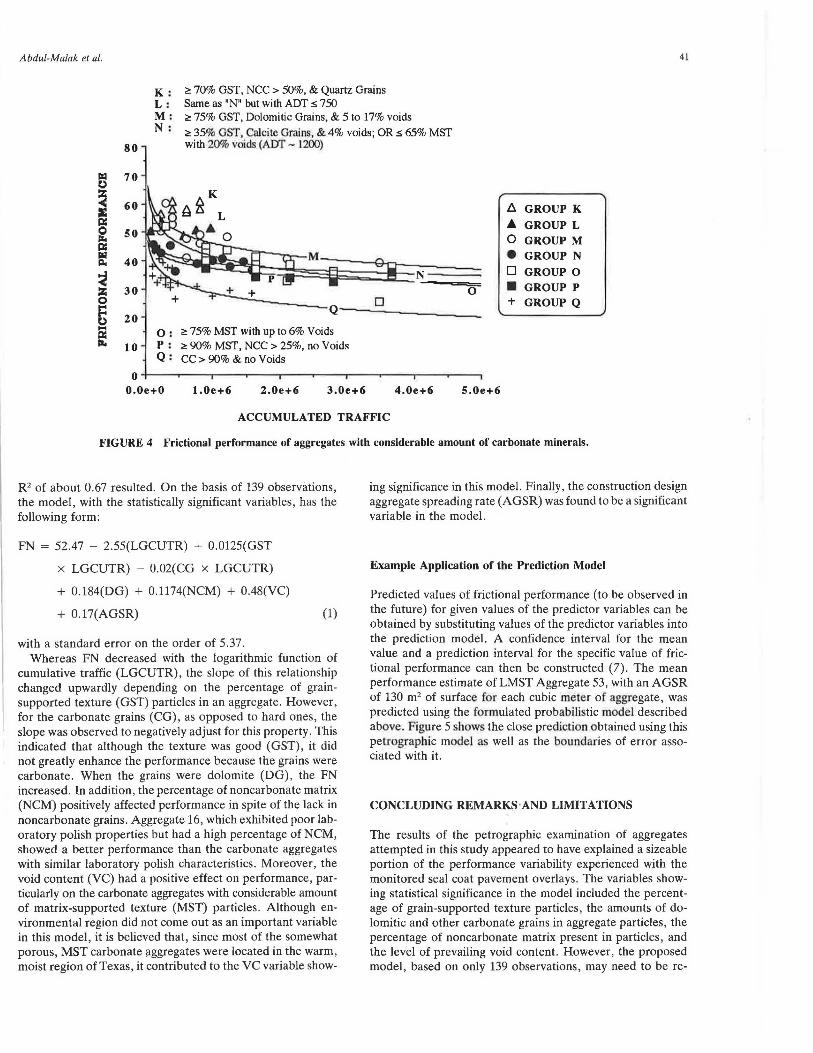
in performance. For this group, aggregates with more than 30 percent GST particles varied widely in performance. This variation is largely explained by the ADT, void content, and the mineralogy of the grains (Figure 4).
given by the calcite grain. Aggregates with GST particles consisting of quartz grains cemented by carbonate minerals gave the highest levels of performance.
Finally, all aggregates with a considerable amount of carbonate minerals were grouped according to their petrographic properties (Figure 4), and two major observations were made. First, the level of performance of aggregates with a large amount of MST particles improved as the percentage of voids increased. Second, the level of performance of aggregates with a considerable amount of GST particles was associated with the level of traffic and the hardness of the grains. The dolomitic grains gave a level of performance higher than that
~ 70
~ 60 • •
STATISTICAL MODELING OF PETROGRAPHIC AND FIELD DATA
Probabilistic Prediction Model
When the friction data of the petrographically examined aggregates were used along with the traffic, construction, and weather variables, a regression model with a good adjusted
< 50% GST PARTICLES
e > 90% HARD MINERALS 0 < 30% HARD MINERALS I .. e FN=40
... 40 __ '[]' _______________________ _
0 D FN=30 -----:u::l---e-'[J-----------------------------
0 0 D ~ :z; 30
~ t) 20
~ 10
o+-~-.-~~.--~-.-~--..~~..-~-.-~--.~~-.-~-..~--1
O.Oe+O 1.0e+6 2.0e+6 3.0e+6 4.0e+6 5.0e+6
ACCUMULATED TRAFFIC
FIGURE 3 Frictional performance of aggregates with less than 50 percent GST particles, grouped according to percentage of hard minerals.
Abdul-Malak et al. 41
K <!: 70% GST, NCC> 50%, & Quartz Grains L Same as "N" but with ADT s 750 M <!: 75% GST, Dolomitic Grains, & 5 to 17% voids N <!: 35% OST, calcite Grains, & 4% voids; OR s 65% MST
80 with 20% voids (ADT -1200)
Ill 70 0
~ 60 fi. GROUP K :E: i::t; A GROUP L 0 so 0 J:&. GROUP M i::t; Ill
40 • GROUP N Q,
~ N D GROUP 0
:z; 30 0 • GROUP P 0 + GROUP Q i:::: Q 0 20 ....
0: <!: 75% MST with up to 6% Voids i::t; J:&. 10 P: <!: 90% MST, NCC> 25%, no Voids
Q: CC> 90% & no Voids
0 O.Oe+O 1.0e+6 2.0e+6 3.0e+6 4.0e+6 S.Oe+6
ACCUMULATED TRAFFIC
FIGURE 4 Frictional performance of aggregates with considerable amount of carbonate minerals.
R2 of about 0.67 resulted. On the basis of 139 observations, the model, with the statistically significant variables, has the following form:
FN = 52.47 - 2.55(LGCUTR) + 0.0125(GST
x LGCUTR) - 0.02(CG x LGCUTR)
+ 0.184(DG) + 0.1174(NCM) + 0.48(VC)
+ 0.17(AGSR)
with a standard error on the order of 5 .37.
(1)
Whereas FN decreased with the logarithmic function of cumulative traffic (LGCUTR), the slope of this relationship changed upwardly depending on the percentage of grainsupported texture (GST) particles in an aggregate. However, for the carbonate grains (CG), as opposed to hard ones, the slope was observed to negatively adjust for this property. This indicated that although the texture was good (GST), it did not greatly enhance the performance because the grains were carbonate. When the grains were dolomite (DG), the FN increased. In addition, the percentage of noncarbonate matrix (NCM) positively affected performance in spite of the lack in noncarbonate grains. Aggregate 16, which exhibited poor laboratory polish properties but had a high percentage of NCM, showed a better performance than the carbonate aggregates with similar laboratory polish characteristics. Moreover, the void content (VC) had a positive effect on performance, particularly on the carbonate aggregates with considerable amount of matrix-supported texture (MST) particles. Although environmental region did not come out as an important variable in this model, it is believed that, since most of the somewhat porous, MST carbonate ;i.ggregates were located in the warm, moist region of Texas, it contributed to the VC variable show-
ing significance in this model. Finally, the construction design aggregate spreading rate (AGSR) was found to be a significant variable in the model.
Example Application of the Prediction Model
Predicted values of frictional performance (to be observed in the future) for given values of the predictor variables can be obtained by substituting values of the predictor variables into the prediction model. A confidence interval for the mean value and a prediction interval for the specific value of frictional performance can then be constructed (7). The mean performance estimate of LMST Aggregate 53, with an AGSR of 130 m2 of surface for each cubic meter of aggregate, was predicted using the formulated probabili tic model described above. Figure 5 how the close prediction obtained using this peuographic model as well as the boundaries of error associated with it.
CONCLUDING REMARKS · AND LIMITATIONS
The results of the petrographic examination of aggregates attempted in this study appeared to have explained a sizeable portion of the performance variability experienced with the monitored seal coat pavement overlays. The variables showing statistical significance in the model included the percentage of grain-supported texture particles, the amounts of dolomitic and other carbonate grains in aggregate particles, the percentage of noncarbonate matrix present in particles, and the level of prevailing void content. However, the proposed model, based on only 139 observations, may need to be re-
Fl(;UKt: 5 l'redicted versus observed perfunnalll:e for LMST Aggregate 54 petrographic probabilistic model.
fined and validated to include a wider range of aggregates and service conditions.
ACKNOWLEDGMENT
This study was conducted by the Center for Transportation Research at the University of Texas at Austin under the sponsorship of the Texas Department of Highways and Public Transportation in cooperation with the Federal Highway Administration. The authors express their appreciation to Margaret Hanson and Tom Patty of Erlin, Hime Associates for their assistance in the petrographic examination. Thanks are also extended to the University Research Board of the American University of Beirut, which made it possible for the first author to conduct follow-up research on this subject.
REFERENCES
1. Abdul-Malak, M. U., A. H. Meyer, and D. W. Fowler. Research Program for Predicting the Frictional Characteristics of Seal-Coat
Pavement Surfaces. In Transportntio11 Research Record 1217, TRB, National Research Council, Washington, D.C., 1989, pp. 53-64.
2. Abdul-Malak , M. U. lmplicatio11 of Aggregates i11 tl1e Co11structio11 Oil{/ Perfomumce of Seal Com Pav11me111 Overlays. Ph.D . di serta lion . The Univer ity of Texas al Austin , Austin 1990.
3. Greensmith, J. T. Pe1rology of the Sedimentary Rocks (7lh edition). Unwin Hyman , London, 1989.
4. Williams, H ., F. J. Turner, and . M. Gilbert. Petrography: An b1trod11ctio11 to tire Study of Rocks i11 Tlri11 Sections. W. H. Freeman and Company, San Francisco, Calif., 1982.
5. Dietrich, R. V., and B. J. Skinner. Rocks and Rock Minerals. John Wiley and Sons, New York, 1979.
6. Test Method Tex-210-F-1986: Determination of Asphalt Content of Bituminous Mixtures by Extraction. In Manual of Test Methods, Texas State Department of Highways and Public Tran portalion, Austin, March 1986.
7. Kachigan , S. K. Statistical Analysis: An interdisciplinary lntroduc1io11 to U11iwrriatea11d Multivariate Methods. Radius Press , New York, 1986.
Publication of this paper sponsored by Committee on Mineral Aggregates.