IoM AMMR 2014 published by Department of Infrastructure June 2014 Page | i Minerals and Secondary Aggregate Technical Planning Group Annual Minerals Monitoring Report AMMR 2014 Purpose of the Report The Minerals and Secondary Aggregate Technical Planning Group (MSATPG) Annual Minerals Monitoring Report (AMMR) is produced to: a. provide an agreed joint industry/Government annual report on minerals on the IOM including data on: declared sales of minerals in tonnes and, where available, by end use; mineral reserves; forecasts of need; and landbanks b. assess the future availability of minerals c. identify any specific issues related to minerals production, availability or use on the Island over the next 12 months and make recommendations on how to address those issues. The information contained within this report is intended to advise the need for minerals considered essential for the social and economic well-being of the Island. Although some minerals are imported, the aim of the Isle of Man is to maintain a high degree of self-sufficiency in mineral provision, particularly aggregates. This is inextricably linked to the need for the Island’s mineral reserves to be used sustainably and includes the use, wherever practicable, of recycled and secondary aggregate. Status of the Report The AMMR is published as the official Government statement on minerals, including mineral reserves and need. It is intended to advise the interpretation of need within the Isle of Man Strategic Plan 2007 policies: Minerals Policy 1 and Waste Policy 1. The AMMR is supported by baseline geological data and historical information contained within the Department of Economic Development’s (DED) Minerals Resources Plan and takes account of the Department of Infrastructure (DOI) Waste Policy and Strategy 2012-2020 1 . Baseline Data The baseline data used in this Report are provided from the following: a. data on primary aggregate sales are provided by DED and are compiled from half yearly mining lease/licence returns. It covers the period from 1st December 2012 to 31 st November 2013; b. data on recycled aggregate sales are provided by industry and have been combined to protect commercial confidentiality. In advance of licence return data being fully available, the data is collated from a limited number of companies involved in aggregate reprocessing and therefore presents a minimum figure. Data on void space (Table 14) is a best estimate. Information on remaining capacity within quarries with permitted infill is based on re-adjustments following landfill and can only be verified by full site 1 www.gov.im/transport/operations/wastemanagement/stratagy.xml
Transcript
IoM AMMR 2014 published by Department of Infrastructure June 2014
P a g e | i
Minerals and Secondary Aggregate Technical Planning Group Annual Minerals Monitoring Report
AMMR 2014
Purpose of the Report The Minerals and Secondary Aggregate Technical Planning Group (MSATPG) Annual Minerals Monitoring Report (AMMR) is produced to: a. provide an agreed joint industry/Government annual report on minerals on the IOM including data on: declared sales of minerals in tonnes and, where available, by end use; mineral reserves; forecasts of need; and landbanks
b. assess the future availability of minerals
c. identify any specific issues related to minerals production, availability or use on the Island over the next 12 months and make recommendations on how to address those issues.
The information contained within this report is intended to advise the need for minerals considered essential for the social and economic well-being of the Island. Although some minerals are imported, the aim of the Isle of Man is to maintain a high degree of self-sufficiency in mineral provision, particularly aggregates. This is inextricably linked to the need for the Island’s mineral reserves to be used sustainably and includes the use, wherever practicable, of recycled and secondary aggregate. Status of the Report The AMMR is published as the official Government statement on minerals, including mineral reserves and need. It is intended to advise the interpretation of need within the Isle of Man Strategic Plan 2007 policies: Minerals Policy 1 and Waste Policy 1. The AMMR is supported by baseline geological data and historical information contained within the Department of Economic Development’s (DED) Minerals Resources Plan and takes account of the Department of Infrastructure (DOI) Waste Policy and Strategy 2012-20201. Baseline Data The baseline data used in this Report are provided from the following: a. data on primary aggregate sales are provided by DED and are compiled from half yearly mining lease/licence returns. It covers the period from 1st December 2012 to 31st November 2013;
b. data on recycled aggregate sales are provided by industry and have been combined to protect commercial confidentiality. In advance of licence return data being fully available, the data is collated from a limited number of companies involved in aggregate reprocessing and therefore presents a minimum figure.
Data on void space (Table 14) is a best estimate. Information on remaining capacity within quarries with permitted infill is based on re-adjustments following landfill and can only be verified by full site
IoM AMMR 2014 published by Department of Infrastructure June 2014
P a g e | ii
survey. Data on void space in operational quarries is equally difficult to ascertain. Figures presented are estimated tonnages for current planning permissions. The AMMR reports on mineral sales and reserves for all quarries on the Island. On the Isle of Man the Government owns and operates two HR quarries, namely Poortown Quarry (PT) and Stoney Mountain Quarry (SM). This is to ensure that the Island can meet its national need for highest grade aggregate and rock for Government infrastructure works. If reviewed against the factors used for financial reporting for commercial mining operations2, neither PT nor SM would be considered commercial quarries. Most of the high quality aggregate produced from the PT and SM is utilised by Government. However mineral from both PT and SM is supplied to the commercial sector, some of which is for use in Government projects. At present it is only possible to confirm the tonnage of aggregate used in DOI civil engineering works. In seeking to reflect this situation the AMMR currently reports the aggregate data including and excluding Government sales and reserves. Contribution of Reserves from Government Quarries to the Commercial Landbank It is acknowledged that removing Government reserves entirely from the calculation of HR landbank does not accurately represent the availability of aggregate to the commercial market. The methodology for calculating the landbank for HR needs therefore to be refined to take this into account. It is proposed that over the next twelve months the MSATPG will work with the DOI to develop a methodology for estimating, on an annual basis, the reserves within Government operated quarries that will supply aggregate to the commercial sector and contribute to the national landbank of HR mineral reserves. This work will take into account the following: a. the mineralogy of the Poortown dolerite results in a high grade aggregate which is suitable for use as a psv (polished stone value)/coated aggregate. However the reserve is not uniform in its characteristics as it is often inter-bedded with host rock, with zones of contact /metamorphosis producing poor quality, often soil rich, material and overlain by variable depths and compositions of overburden. At Stoney Mountain, although the reserve is not capable of producing a high grade aggregate, it is an essential source of armour stone and Type 1 for use by Government. However with quartz rich intrusions, weathering and faulting, the reserve is variable in quality;
b. access to the high quality material at Poortown is restricted to Government use and is not normally made available for non-Government use unless it is in the national interest to supply to local private customers. National interest would include situations where the only alternative is the importation of mineral. If a viable alternative source is available on Island, then the mineral would not normally be sold. However the limitations of production, together with the need to prioritise sale of aggregate for Government operations, can also restrict sales to private companies. This can and has resulted in the private sector having to import high psv mineral during periods of high demand;
c. the lower quality, non-psv, mineral which is not used in asphalts is generally sold to private customers. The stone content of this material is of variable quality and may require further processing. Stockpiling the material on site is not a viable option. There is insufficient room within the quarry, and stockpiling would prohibit effective quarry operations. Removing the material to an alternate site for storage would also be cost prohibitive. It is therefore considered to be in the interests of mineral sustainability and self-sufficiency that non-psv
IoM AMMR 2014 published by Department of Infrastructure June 2014
P a g e | iii
material is made available to the commercial market where its sale can deliver value for money for the tax-payer. NB consideration of the sale price of aggregates is not within the remit of the AMMR.
Report Summary Total aggregate sales for 2013 was 278,840 tonnes compared to 287,440 tonnes in 2012. This is a reduction of 8,600 tonnes or 3%, considerably lower than the 27% reduction experienced during the previous year. Sand and Gravel (S&G) sales showed a 7% (7,100 tonnes) decrease and for Hard Rock (HR) quarries, an overall 1% (1,460 tonnes) decrease. The decrease in HR sales in 2013 was most notable in sales from commercial quarries which realised a 22,510 tonnes reduction compared to figures for the previous year. Overall commercial quarries contributed 40% of the HR aggregates required on Island, with the balance being met through sales from Government quarries which increased by 21,050 tonnes. This increase can largely be explained by the requirement to provide high specification aggregates from Poortown Quarry to capital projects such as the Peel Road improvement works. The marked slowdown in the rate of decrease in demand for primary aggregate during 2013 could be interpreted as an indication of economic recovery. In addition if sales of recycled aggregate are included, then the total tonnage of aggregate sales actually increased, from 381.86kt in 2012 to 435.69kt in 2013. Sale of recycled aggregate (graded crushed stone and oversize) accounted for the largest percentage increase in 2013.However, the figures have to be treated with caution. There have been a number of capital projects undertaken during this year, each of which has required a significant tonnage of aggregate. If these projects had not been active then it is possible that the decline in aggregate sales would have continued at the same rate as observed since 2008. The reduction in the sale of primary aggregate has impacted on the length of landbanks. The landbank for S&G stands at 19.6 years, increasing from 18 years in AMMR2013. HR landbanks have held at 10 years or more. Including Government reserves and sales the landbank at the 30th November 2013 is 17.9 years; if excluded, the landbank reduces to 10.00 years. There are opportunities for reducing the use of primary won aggregate in construction projects, specifically in road construction, maintenance and repair. This will require a change from prescriptive to performance design specifications. The use of locally sourced crushed limestone as an agricultural fertilizer continues and the tonnage applied to land increased slightly during 2013. DEFA have assessed the neutralising value and performance of different forms of limestone and conclude that Billown lime, if crushed sufficiently and applied in a timely and targeted manner, is an effective liming agent for Manx soils. Reported sales of graded and crushed recycled aggregate have more than doubled since last year. Although this may in part be due to more consistent data management, it does indicate an increased demand for recycled products. The amount of glass recycled continues to decline, with the tonnage for bring bank and kerbside collected household glass now lower than before the introduction of the kerbside collection scheme. Commercial glass recycling has also declined. Whilst there has been a slight reduction in the use of glass packaging within the drinks industry this does not account for the decline which is more likely due to declining participation in recycling schemes.
IoM AMMR 2014 published by Department of Infrastructure June 2014
P a g e | 1
Minerals and Secondary Aggregate Technical Planning Group Annual Minerals Monitoring Report 2013
Contents Page
AMMR Purpose, Status, Baseline data and Summary i-ii
1 Sale of Primary Minerals 3
2 End use of extracted minerals 5
3 Tonnage of recycled and secondary aggregate sold or used off-site 8
4 Mineral reserves and licenced aggregate reprocessing capacity 12
5 Forecast need for minerals, and review of mineral production 16
6 Landbanks for hard rock and sand and gravel 19
7 Need for New Minerals Reserves 21
8 Imports/Exports 23
9 Mineral Matters and Issues 24
10 Membership of the MSATPG 2013/14 25
Figures and Tables:
Page
Figure 1 2013 Sales of Primary Aggregate & Building Stone 4 Figure 2 Total 10 Year Sales of Primary Aggregate & Building Stone
2004-2013 5
Figure 3 Percentile Summary of Aggregate Sales by sub Categories 6 Figure 4 Agricultural Lime Production 2004 – 2013 7 Figure 5 Sales of Primary and Recycled Aggregate 2012-2013 9
Figure 6 Tonnage of Domestic Glass delivered for recycling 10 Figure 7 Total Waste to EfW and Incinerator Bottom Ash tonnage 2004-
2013 (tonnes) 11
Figure 8 List of Licenced Waste Aggregate Reprocessing Facilities 13 Figure 9 Comparison of Actual with Forecast Aggregate Sales Based on
IoM AMMR 2014 published by Department of Infrastructure June 2014
P a g e | 2
Figure MSA01 Point of Ayre Figure MSA02 Ballaharra Quarry Figure MSA03 Poortown Quarry Figure MSA04 Oatlands Complex Figure MSA05 Dhoon Quarry Figure MSA06 Cringle Quarry Figure MSA07 Earystane Quarry Figure MSA08 Billown Quarry Table 1 Summary of Primary Aggregate & Building Stone Sales 2013 3 Table 2 Total Sales as Primary Aggregate 2004 – 2013 4 Table 3 Total Sales as Building Stone 2004 – 2013 4 Table 4 Total Sales as Primary Aggregate & Building Stone 2004-2013 4 Table 5 Aggregate Sales by Sub Categories 2007 - 2013 (‘000 tonnes) 6 Table 6 Sales of Recycled Aggregate (minimum) ‘000’s t 8 Table 7 Sand and Gravel Reserves 12 Table 8 Hard Rock Reserves 12 Table 9 Forecast of Need for Sand & Gravel in 2014 17 Table 10 Forecast of Need for Hard Rock in 2014 (All Quarries) 17 Table 11 Forecast of Need for Hard Rock in 2014 (Excluding all sales
from Government Quarries) 18
Table 12 Summary of Aggregate Need in 2014 18 Table 13 MSATPG Membership 25 Appendix 1 Table 14 Void Space 26 Table 15 Monitoring of Mineral Planning Application Decisions made 1st
January - 31st December 2013 28
IoM AMMR 2014 published by Department of Infrastructure June 2014
P a g e | 3
1. Sale of Primary Minerals
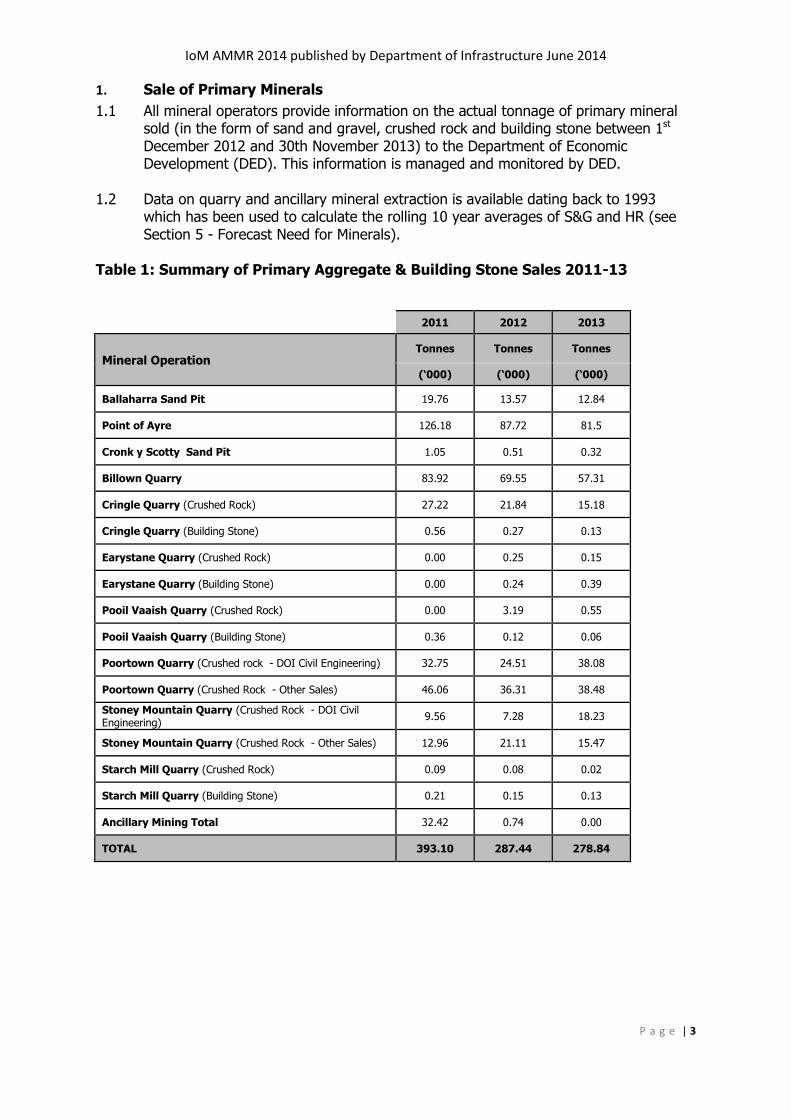
1.1 All mineral operators provide information on the actual tonnage of primary mineral sold (in the form of sand and gravel, crushed rock and building stone between 1st December 2012 and 30th November 2013) to the Department of Economic Development (DED). This information is managed and monitored by DED.
1.2 Data on quarry and ancillary mineral extraction is available dating back to 1993
which has been used to calculate the rolling 10 year averages of S&G and HR (see Section 5 - Forecast Need for Minerals).
Table 1: Summary of Primary Aggregate & Building Stone Sales 2011-13
IoM AMMR 2014 published by Department of Infrastructure June 2014
P a g e | 4
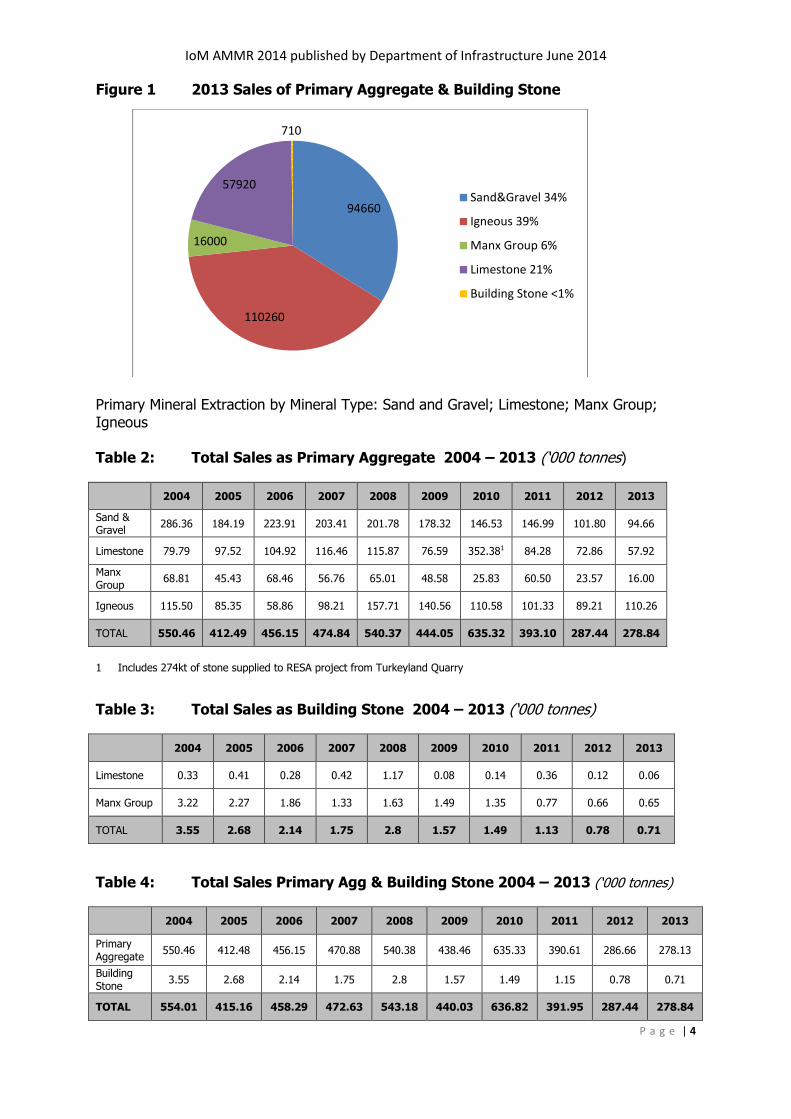
Figure 1 2013 Sales of Primary Aggregate & Building Stone
Primary Mineral Extraction by Mineral Type: Sand and Gravel; Limestone; Manx Group; Igneous Table 2: Total Sales as Primary Aggregate 2004 – 2013 (‘000 tonnes)
IoM AMMR 2014 published by Department of Infrastructure June 2014
P a g e | 5
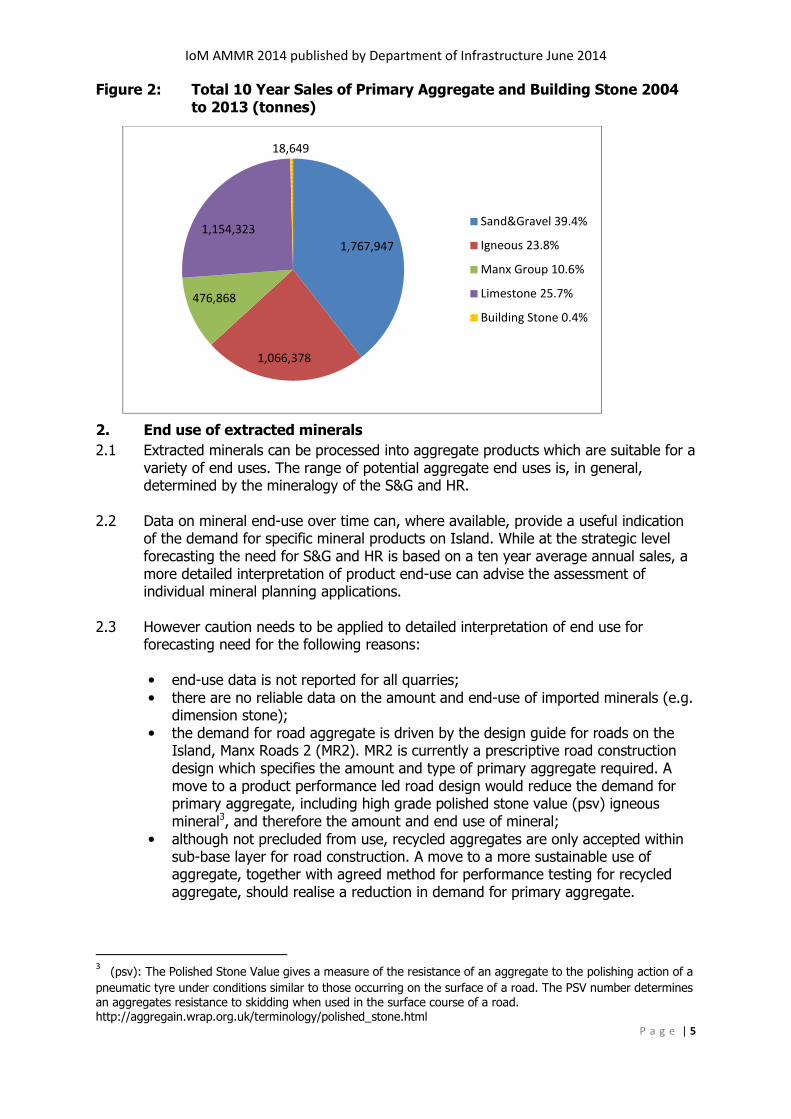
Figure 2: Total 10 Year Sales of Primary Aggregate and Building Stone 2004 to 2013 (tonnes)
2. End use of extracted minerals
2.1 Extracted minerals can be processed into aggregate products which are suitable for a variety of end uses. The range of potential aggregate end uses is, in general, determined by the mineralogy of the S&G and HR.
2.2 Data on mineral end-use over time can, where available, provide a useful indication
of the demand for specific mineral products on Island. While at the strategic level forecasting the need for S&G and HR is based on a ten year average annual sales, a more detailed interpretation of product end-use can advise the assessment of individual mineral planning applications.
2.3 However caution needs to be applied to detailed interpretation of end use for
forecasting need for the following reasons:
• end-use data is not reported for all quarries;
• there are no reliable data on the amount and end-use of imported minerals (e.g. dimension stone);
• the demand for road aggregate is driven by the design guide for roads on the Island, Manx Roads 2 (MR2). MR2 is currently a prescriptive road construction design which specifies the amount and type of primary aggregate required. A move to a product performance led road design would reduce the demand for primary aggregate, including high grade polished stone value (psv) igneous mineral3, and therefore the amount and end use of mineral;
• although not precluded from use, recycled aggregates are only accepted within sub-base layer for road construction. A move to a more sustainable use of aggregate, together with agreed method for performance testing for recycled aggregate, should realise a reduction in demand for primary aggregate.
3 (psv): The Polished Stone Value gives a measure of the resistance of an aggregate to the polishing action of a pneumatic tyre under conditions similar to those occurring on the surface of a road. The PSV number determines
an aggregates resistance to skidding when used in the surface course of a road. http://aggregain.wrap.org.uk/terminology/polished_stone.html
1,767,947
1,066,378
476,868
1,154,323
18,649
Sand&Gravel 39.4%
Igneous 23.8%
Manx Group 10.6%
Limestone 25.7%
Building Stone 0.4%
IoM AMMR 2014 published by Department of Infrastructure June 2014
P a g e | 6
Table 5: Aggregate Sales by Sub Categories 2007 - 2013 (‘000 tonnes)
Type 1 and Bulk Fill 190.11 214.52 138.84 404.76 155.04 105.19 108.90 1317.36 188.19
Building / Dimension Stone
1.74 2.80 1.58 1.49 1.15 0.78 0.72 10.26 1.47
TOTAL 479.01 544.39 446.97 638.03 392.91 288.34 278.84 3068.49 438.36
Figure 3: Percentile Summary of Aggregate Sales by Sub Categories (7 year average)
35
8.9
12.8
42.9
0.3
Sand&Gravel
PSV/High Grade
Graded Agg/bitumen
affinity
Type 1 & Bulk Fill
Building/Dimension
Stone
IoM AMMR 2014 published by Department of Infrastructure June 2014
P a g e | 7
Agricultural Lime 2.4 All agricultural land used for crop production requires the soil to have a pH in the
region of 5.8 to 6.2 to maintain good levels of production and ensure that any fertilisers applied are utilised efficiently. The majority of the Island’s soils are acidic and therefore require the periodic application of lime to increase and/or maintain pH. Sources of lime used on the Island commonly includes crushed limestone and imported pelletised lime, historically crushed limestone has also been imported. Limestone used for agricultural purposes is not classified as an ‘aggregate’ for the purposes of forecasting need for HR. However as the tonnage used is minimal in comparison with total aggregate sales it has not been excluded from the calculation of HR need.
Figure 4: Agricultural Lime Production 2004 – 2013 (Billown Quarry)
2.5 A field scale trial conducted by DEFA indicates that the Billown lime, if crushed
sufficiently and applied in a timely and targeted manner can prove to be an effective liming agent for Manx soils.
2.6 DEFA advise that, if Billown is to cease producing agricultural lime and there are no
alternative on Island sources, the Island’s agricultural industry will need to be given a reasonable period of notice to allow it to plan for alternative sources.
62445813 5997
69126611
47665266
4640
39054282
0
1000
2000
3000
4000
5000
6000
7000
8000
2004 2005 2006 2007 2008 2009 2010 2011 2012 2013
Tonnage
Lime for Ag
Use
IoM AMMR 2014 published by Department of Infrastructure June 2014
P a g e | 8
3. Tonnage of recycled and secondary aggregate sold or allocated for use off-site (tonnes)
3.1 Facilities licenced under the Public Health Act 1990 for recycling of waste into
recycled or secondary aggregate are required to submit tonnage data to DEFA. The data currently held on recycled or secondary aggregate production is incomplete. DEFA are in the process of revising their licence return forms and database to standardise the classification of waste types to European Waste Catalogue4 (EWC) codes, and to simplify the process by developing on-line returns. Additional information on the production and management of construction and demolition waste may be available through returns for the ‘Permit to Demolish a Building’ issued under the Building Control Act 1991.
3.2 In the interim, data on the sale of recycled aggregate from main aggregate re-
processors is summarised below, together with data on the source waste material required for the production of recycled or secondary aggregate.
Table 6 Sales of Recycled Aggregate - minimum (000’s tonnes)
Year 2011/2
*
2012 2013
Recovered & Manufactured Sand 34.84 35.50 29.47
Graded & Crushed Stone 52.44 58.09 127.3
Oversize 1.07 0.72 0.829
Total 88.35 94.31 157.6
*operations at one site commenced part way through 2011. Data for 2011 therefore
includes data from 2012 to provide a full year production. This data (Jan – May) is also reported for 2012.
IoM AMMR 2014 published by Department of Infrastructure June 2014
P a g e | 9
Sales of Primary and Recycled Aggregate 2012-2013 3.3 Figure 5(a) indicates the total tonnage of aggregate sales (primary extracted and
recycled) 2012-2013. Whereas the total sales of primary aggregate (Table 5) declined between 2012 (288.34kt) and 2013 (278.84kt), if sales of recycled aggregate are included then the total tonnage of aggregate sales actually increased, from 381.86kt in 2012 to 435.69kt in 2013. Sale of recycled aggregate (graded crushed stone and oversize) accounted for the largest percentage increase in 2013 Table 5(b). Although data on sale of recycled aggregate is incomplete, the information that is available allows are more accurate assessment of the demand for aggregate on the Island. Figure 5(a) suggests that in 2013 there was a slight increase in activity within the construction sector.
Figure 5 (b) Percentage of Annual Sales - Primary and Recycled Aggregate
0
50
100
150
200
250
300
350
400
450
500
2012 2013
HR primary
Recycled
Aggregate
S&G primary
Recycled &
manufactured
sand
0%
10%
20%
30%
40%
50%
60%
70%
80%
90%
100%
2012 2013
HR primary
Recycled
Aggregate
S&G primary
Recycled &
manufactured
sand
IoM AMMR 2014 published by Department of Infrastructure June 2014
P a g e | 10
Production of Recycled Aggregate - Source Waste Materials Glass 3.4 Glass bottles and jars collected as part of the Island’s domestic waste recycling
schemes (all Island Bring Banks and localised kerbside collection) and some glass collected from commercial premises are processed into eco-sand. This sand replacement is suitable for used in construction (as a blinding layer, or as a base layer for decorative block paviours or non-flexible pipes) and reduces the demand for primary won aggregate.
3.5 Figure 5 indicates the tonnage of glass collected from the domestic waste stream
since 2004, including glass collected following the introduction of the kerbside collection scheme in 2008. Whilst some food and beverage manufacturers have changed from the use of glass to plastic packaging, this does not account for the notable decline in glass recollected from the domestic waste stream since 2010. It is suspected this is mainly due to a decline in householder participation in recycling schemes. In terms of commercial glass it is known that some collected commercial glass is now being diverted to landfill rather than a recycling route. To increase the availability of eco-sand effort needs to be made to increase both participation in household waste recycling schemes and the collection of glass waste for recycling from within the commercial sector.
Figure 6: Tonnage of Domestic Glass delivered for Recycling 2002 – 2013
0.00
200.00
400.00
600.00
800.00
1000.00
1200.00
1400.00
1600.00
1800.00
Bring bank/kerbside glass
Kerbside
collected
Bring Bank
Collected
IoM AMMR 2014 published by Department of Infrastructure June 2014
P a g e | 11
Incinerator Bottom Ash (primary and secondary streams, includes boiler ash) 3.6 The Energy from Waste (EfW) plant produced an average of 11,600 tonnes of
Incinerator Bottom Ash [IBA] 2010 - 2013. Following metal extraction and maturation, the annual output of IBA produces around 9,500 tonnes of material with the potential for being reprocessed into Incinerator Bottom Ash Aggregate [IBAA]. This material is currently stored in Turkeyland Quarry (permitted landfill capacity 585,000m3).
3.7 IBAA has the potential to be used as a secondary aggregate, and the feasibility of its use in certain ‘bound’ applications e.g. bitumen coated stone and concrete blocks has been investigated. Due to costs associated with environmental risk control in storage of IBAA and with production plant modification, use of IBAA in these ‘bound’ applications is not considered to be commercially viable. IBAA may also have the engineering properties to be used in certain applications as a capping or sub-base in roads, paths and car-parks etc. Having undertaken initial studies to assess the environmental risks associated with the use of IBAA in various locations, DOI is in the process of reviewing the results. Any future trials would be subject to site-specific environmental risk assessments.
Figure 7 Total Waste to EfW and Incinerator Bottom Ash tonnage 2004-2013
(tonnes)
Source: DOI 2014
Figure 6 shows total tonnage of waste deposited at the EfW (primary and secondary waste streams) and the residual tonnage of IBA. Incineration of waste reduces the volume of waste by circa 95% and weight by circa 75%.
IBA0
10,000
20,000
30,000
40,000
50,000
60,000IBA
EfW All
Waste
IoM AMMR 2014 published by Department of Infrastructure June 2014
P a g e | 12
4. Mineral Reserves and Aggregate Reprocessing Capacity
4.1 A mineral reserve is the total tonnage of mineral that is permitted to be extracted under a planning permission. Mineral reserves have been calculated for all existing mineral operations. The mechanism for determining mineral reserves is based on two options: a) any re-assessment of reserves carried out by the mineral operator; or b) assessment of reserves based on the total tonnage of minerals permitted to be extracted by an approved planning permission and adjusted by deducting the total tonnage of sales between the date of activation of the planning permission and November 2013.
4.2 The reserve calculations have been undertaken by DED which collates information on
annual mineral sales as part of the licencing of mineral extraction and collection of mineral royalties. The following mineral reserves reflect the situation at each mineral operation as at the end of November 2013.
TABLE 7: Sand and Gravel Reserves @ 30 Nov 2013
2011 2012 2013
Operation Tonnes
('000)
Tonnes
('000)
Tonnes
('000)
Point of Ayre 3,074.00 2,986.28 2,904.78
Ballaharra Sand Pit 575.00 561.43 548.59
Cronk y Scotty Sand Pit 19.50 18.99 18.67
TOTAL 3,668.50 3,566.70 3,472.04
TABLE 8: Hard Rock Reserves @ 30 Nov 2013
2011 2012 2013
Mineral Operation Tonnes
('000)
Tonnes
('000)
Tonnes
('000)
Limestone Billown Quarry 297.20 227.65 170.34
Pooil Vaaish Quarry5 111.60 108.29 107.68
Manx Group
Cringle Quarry 1,237.50 1,215.39 1,200.08
Earystane Quarry 135.00 134.51 133.97
Starch Mill Quarry 37.70 37.47 37.32
Igneous Poortown Quarry 1,058.80 997.98 921.42
Stoney Mountain Quarry 2,335.00 2,306.61 2,272.91
TOTAL 5,212.80 5,027.90 4,843.72
5 A planning application to regularise mineral extraction activity on this site was withdrawn in January 2014. The site does not currently benefit from planning permission for mineral extraction.
IoM AMMR 2014 published by Department of Infrastructure June 2014
P a g e | 13
4.3 There are currently no capacity restrictions attached to waste management licences for aggregate reprocessing facilities. The reprocessing capacity of each site is therefore determined by a combination of material input, equipment capacity, size of facility, and any conditions attached to the planning permission. The list of licenced waste aggregate reprocessing facilities is listed in Figure 7. In addition to licenced facilities some construction and demolition waste aggregate may be managed at the point of production
Figure 8 List of Licenced Waste Aggregate Reprocessing Facilities correct at 2012 WASTE DISPOSAL LICENCE NO. (Expiry
date)
LICENCE HOLDER SITE ADDRESS AUTHORISED WASTE TYPES which include
Units 43 & 43a Snugborough Trading Estate, Braddan,
Inert waste Transfer station
WDL/01/2003/V2 (Not Applicable)
Birchalls (Plant Hire) Ltd.
Birchalls (Plant Hire) Ltd., The Technical
Site, The Old Airfield, Andreas
Inert construction & demolition waste.
Transfer Station
Source: DEFA Environmental Protection Unit 2014
IoM AMMR 2014 published by Department of Infrastructure June 2014
P a g e | 14
Need for Facilities for Managing Construction and Demolition Type Waste 4.4 The evidence base for assessing the need for waste management facilities is the DOI
Waste Policy and Strategy 2012-2022 (WPS) published in January 2013. In terms of waste management infrastructure requirements WPS Policy 4 Waste Infrastructure states ‘We will ensure the Island has access to an adequate network of waste storage processing, treatment and disposal facilities developed in accordance with the principle of self-sufficiency, proximity and cost.’ The WPS also states a ‘reduction in landfill will be delivered.. through an increase in reuse and recycling in construction and demolition type waste’ (p4).
4.5 The WPS does not identify a shortage of, or a need for, construction and demolition
(C&D) type reprocessing facilities either in totality or at specific locations across the Island. In planning policy terms therefore there is no acknowledged need for additional C&D reprocessing facilities, as required by Strategic Plan Waste Policy 1.
4.6 The past few years have seen an increase in the number of aggregate and C&D
reprocessing facilities developed for private use only. The operators of these facilities indicate they are for the sole use of one company/operator, and are not open for general commercial use. The key driver for this appears to be cost, with operators saving on the need to pay commercial gate fees, setting aside the capital costs of site development. Whilst there are no planning or licence restrictions on their use, restricting access effectively reduces the number of sites and processing capacity available to manage commercially arising C&D waste. It is not known if this has an impact on the amount of C&D material reprocessed. It is known that unrestricted commercial C&D facilities are not operating at maximum capacity.
4.7 The main planning considerations in assessing the need for C&D waste type facilities
relate to the:
• source of waste arising, i.e where in relation to the proposed facility will the majority of waste be produced;
• forecast of waste arisings in the medium to long term, and options for on sites waste minimisation, reuse and reprocessing in accordance with the waste hierarchy;
• estimated tonnage of material to be imported to the facility annually; • location of existing waste management facilities and any commercial restriction on their use;
• duration of the planning permission applied for; • impact on carbon emissions from transportation of waste to the facility and the reprocessed aggregate and waste for landfill from the facility.
Need for Landfill Capacity 4.8 The WPS key proposal for landfill is to ‘Develop a long term landfill solution for
specific (problematic) wastes beyond the current lifespan of Wrights Pit North (i.e. 2020)’. The technical specifications, capacity requirement and preferred location of this void space are not included. The WPS does not identify a need for additional general landfill capacity for non-problematic wastes. The WPS indicates that the long term capacity for inert wastes is ‘predominantly provided by Turkeylands inert landfill site which has a capacity of over 600,000m3 void space’ providing ‘sufficient inert waste landfill space for the next 20 years.6 This site is now permitted in part for the
6 Data on inert waste arisings is estimated
IoM AMMR 2014 published by Department of Infrastructure June 2014
P a g e | 15
storage/disposal of processed IBA. At current rates of disposal to EfW and assuming a 75% reduction by weight, at 1t:1m3 the site has capacity for storage of IBA for an estimated 20 years. In planning policy terms therefore there is no ‘acknowledged need’ for landfill capacity for disposal of inert waste or IBA as required by IoM Strategic Plan 2007 - Waste Policy 1.
4.9 In relation to the restoration of former mineral workings by infill, the main planning
considerations in relation to need will include:
• the forecast need for inert landfill void space post 2020; • the need for the Island to secure a landbank of strategic infill void space; • the location of existing landfill facilities and any commercial restriction on their use;
• the capacity of the site and duration of planning permission applied for; • the suitability of former mineral workings to take differing types of landfill and engineering requirements (i.e. lining of waste cells)
• the proximity principle and impact of carbon emissions from transportation of waste to the facility.
4.10 Table 14 in Appendix 1 indicates the estimated void space for quarries with
permission for restoration by infill, and lists operational mineral workings with provisions for restoration and estimated permitted tonnages of mineral for extraction/associated void space. Please note this data is incomplete. Information on remaining capacity within quarries with permitted infill is awaiting verification. Data on void space in operational quarries is difficult to ascertain. Figures presented are estimated tonnages for current planning permissions. In many cases these are extensions to existing quarries and therefore total void capacity associated with that quarry will be considerably greater.
IoM AMMR 2014 published by Department of Infrastructure June 2014
P a g e | 16
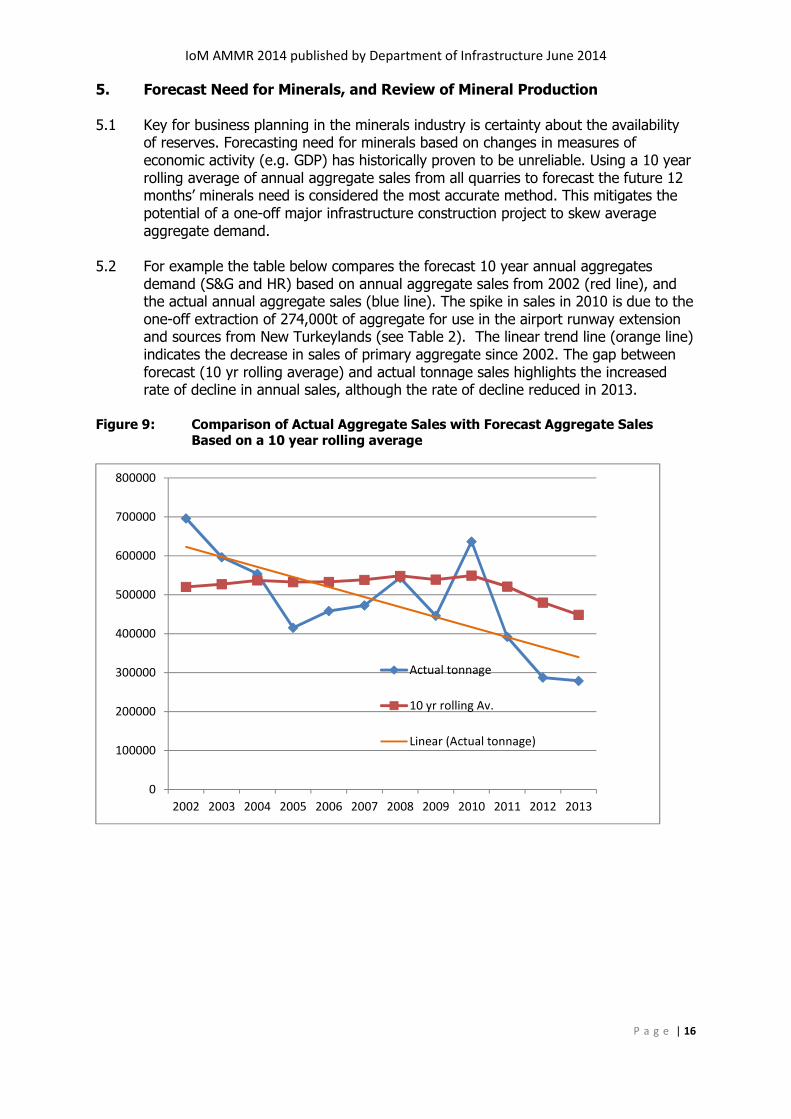
5. Forecast Need for Minerals, and Review of Mineral Production
5.1 Key for business planning in the minerals industry is certainty about the availability of reserves. Forecasting need for minerals based on changes in measures of economic activity (e.g. GDP) has historically proven to be unreliable. Using a 10 year rolling average of annual aggregate sales from all quarries to forecast the future 12 months’ minerals need is considered the most accurate method. This mitigates the potential of a one-off major infrastructure construction project to skew average aggregate demand.
5.2 For example the table below compares the forecast 10 year annual aggregates
demand (S&G and HR) based on annual aggregate sales from 2002 (red line), and the actual annual aggregate sales (blue line). The spike in sales in 2010 is due to the one-off extraction of 274,000t of aggregate for use in the airport runway extension and sources from New Turkeylands (see Table 2). The linear trend line (orange line) indicates the decrease in sales of primary aggregate since 2002. The gap between forecast (10 yr rolling average) and actual tonnage sales highlights the increased rate of decline in annual sales, although the rate of decline reduced in 2013.
Figure 9: Comparison of Actual Aggregate Sales with Forecast Aggregate Sales
IoM AMMR 2014 published by Department of Infrastructure June 2014
P a g e | 17
5.3 Forecast of Aggregate Need in 2014 5.3.1 Sand and Gravel
Table 9: Forecast of Need for Sand and Gravel in 2014
The annual sand and gravel requirement for 2014 is c.176,800 tonnes. 5.3.2 Hard Rock (aggregate/building stone)
HR quarries are operated on Island by both the commercial sector and by Government. To reflect how this impacts on commercial need for, and availability of, aggregate, the AMMR reports the aggregate data in a number of formats, including and excluding Government sales and reserves.
Option A All Sales from All HR quarries Based on a 10 year rolling average of annual aggregate/building stone sales from all HR quarries including all sales (to private and commercial sectors) from Poortown (PT) and Stoney Mountain (SM) quarries. Table 10: Forecast of Need – HR 2014 - All HR Quarries
The total HR requirement for 2014 (based on all HR sales) is c.270,300 tonnes.
IoM AMMR 2014 published by Department of Infrastructure June 2014
P a g e | 18
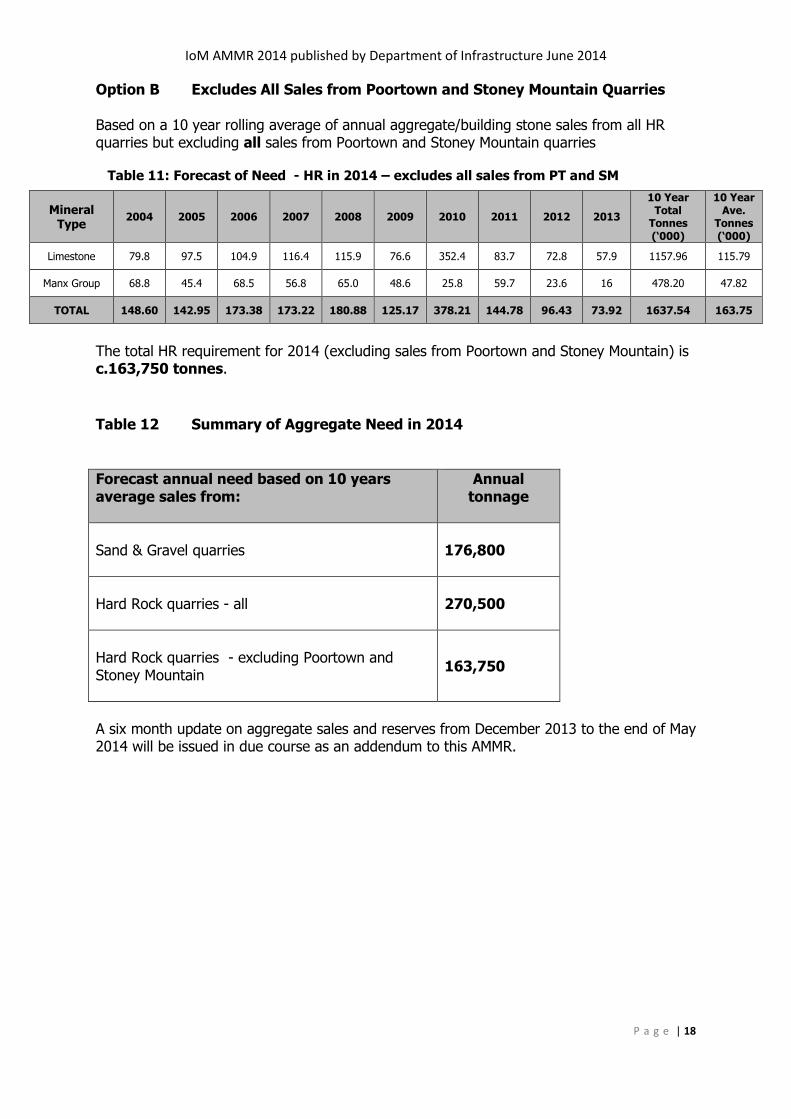
Option B Excludes All Sales from Poortown and Stoney Mountain Quarries Based on a 10 year rolling average of annual aggregate/building stone sales from all HR quarries but excluding all sales from Poortown and Stoney Mountain quarries
Table 11: Forecast of Need - HR in 2014 – excludes all sales from PT and SM
The total HR requirement for 2014 (excluding sales from Poortown and Stoney Mountain) is c.163,750 tonnes.
Table 12 Summary of Aggregate Need in 2014
Forecast annual need based on 10 years average sales from:
Annual tonnage
Sand & Gravel quarries
176,800
Hard Rock quarries - all
270,500
Hard Rock quarries - excluding Poortown and Stoney Mountain
163,750
A six month update on aggregate sales and reserves from December 2013 to the end of May 2014 will be issued in due course as an addendum to this AMMR.
IoM AMMR 2014 published by Department of Infrastructure June 2014
P a g e | 19
6. Landbanks
6.1 A mineral landbank is defined as the stock of permitted reserves that have a valid planning permission. Landbanks are needed to ensure a continuous supply of minerals. Conventional advice is that minimum length of the landbank should reflect the time needed to obtain planning permission and bring the operations into full production. The landbank required for both HR and S&G is set at 10 years.
6.2 It is acknowledged that landbanks are only an indication of the availability of
minerals. The interpretation and management of landbanks should be based on considerations of real need and real supply taking into account factors such as: the nature and quality of the aggregate which may change within a quarry and over time; known constraints on the availability of consented reserves that might limit output over the landbank period; significant future increases in demand that can be forecast with reasonable certainty.
Classification 6.3 The standard protocol adopted by Aggregate Working Parties across the UK for
classifying landbanks is by the two main mineral types HR and S&G. There is some sub- classification but this is for minerals with a specialised end use e.g. silica sand.
6.4 The option of sub-dividing the reserves of these two main mineral types was
considered. For example, HR reserves could be sub-divided into high grade aggregate (psv/ bitumen affinity), Type 1/graded aggregate, and building stone. However the option was discounted as being both impracticable and imprecise. A HR reserve may produce a range of aggregate types due to local variations in mineralogy, weathering along faults lines, intrusions or bedding planes. Reserves can also be processed into a range of products according to demand. The landbank for HR on the Island is therefore calculated as follows:
Landbank for Hard Rock = Total Mineral reserves remaining at Hard Rock quarries
________________________________________ Average 10 year annual mineral production from Hard
Rock quarries 2014 Landbank Assessments at 30th November 2013
Sand and Gravel Landbank
Sand and Gravel Landbank of permitted reserves = 3,472,040 tonnes
10 year forecast of annual production = 176 800 tonnes
S&G Landbank = 19.6 Years (i.e. 3,472,040 ÷ 176,800)
IoM AMMR 2014 published by Department of Infrastructure June 2014
P a g e | 20
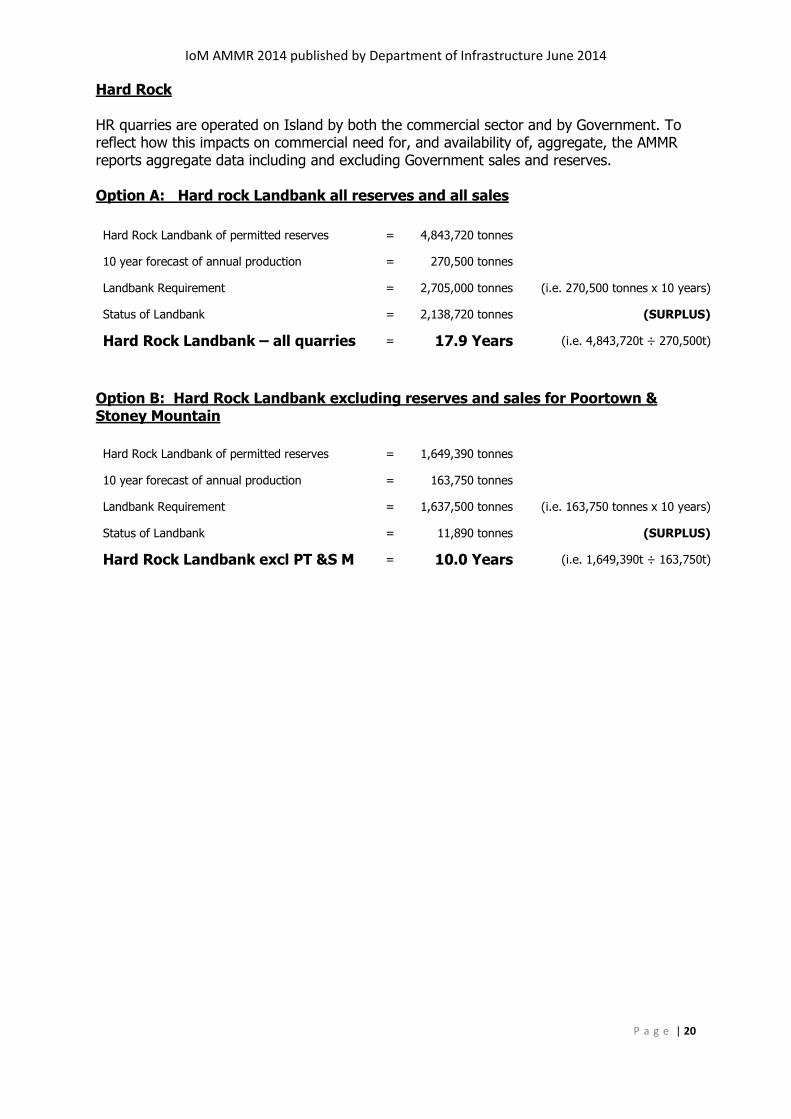
Hard Rock HR quarries are operated on Island by both the commercial sector and by Government. To reflect how this impacts on commercial need for, and availability of, aggregate, the AMMR reports aggregate data including and excluding Government sales and reserves. Option A: Hard rock Landbank all reserves and all sales
Hard Rock Landbank of permitted reserves = 4,843,720 tonnes
10 year forecast of annual production = 270,500 tonnes
Hard Rock Landbank excl PT &S M = 10.0 Years (i.e. 1,649,390t ÷ 163,750t)
IoM AMMR 2014 published by Department of Infrastructure June 2014
P a g e | 21
7 Need for New Mineral Reserves
7.1 It is important for the economic wellbeing of the Island that as far as practicable, provision of minerals is made through the extraction and processing of indigenous mineral resources, and the reprocessing of waste aggregate.
7.2 The landbank for each main mineral classification is calculated from average annual
mineral sales over the previous ten years. This does not include provision from recycled or secondary aggregate. At present there is no reliable methodology for forecasting future arisings of recycled aggregate, which depends heavily upon the activity of the construction and demolition sector. In reviewing mineral landbanks consideration will need to be given therefore to the potential supply of material from the recycling sector to replace the need for bulk/lower specification aggregate.
Call for Sites (CfS) 7.3 A landbank of less than 10 years highlights that new mineral reserves will be
required to ensure the strategic provision of minerals to meet the forecasted mineral sales. Where a landbank is less than 10 years DOI-Planning will undertake a Call for Sites (CfS) to identify where industry are considering applications for future reserves.
7.4 The CfS process is not a planning applications process. It does not require the
submission of detailed information about a prospective minerals site, or undergo the environmental impact assessment of a planning application. A CfS is an invitation to the minerals industry to identify mineral resources which, at some point in the future, they intend to apply to extract.
7.5 The CfS is a very useful process in so far as it can:
i. assure the construction sector that minerals can be supplied on island; ii. guide developers where future mineral sites may be developed requiring the
need for buffer zones, or prior extraction to avoid mineral sterilisation; iii. indicate to residents where mineral sites may be developed or extended.
Mineral Safeguarding Areas (MSA’s) 7.6 Key also is the need for Mineral Safeguarding Areas (MSA’s), within which the
imperative is to safeguard the reserve from sterilisation by development or designation which would act as a constraint against future mineral extraction. MSA’s support the sustainable management of minerals and are applied only to key economic minerals. On the Isle of Man these are identified as massive intrusions of igneous mineral i.e. dolerite and granite, and are shown on the MSA maps: MSA 03Poortown, MSA 04Oatlands, MSA 05Dhoon, together with the appropriate 200m buffer zone7 for HR. It was acknowledged that delineation of these mineral resources will have to rely upon the best available geological map information supplemented with any available borehole data.
7 Minerals and Secondary Aggregate Technical Group: Technical Report April 2012
IoM AMMR 2014 published by Department of Infrastructure June 2014
P a g e | 22
Need for Aggregate Reserves - 2014 7.7 A review of the landbanks indicates that at November 2013: i. there is no need to seek to identify further reserves of sand and gravel for
aggregate purposes, the landbank standing at 19.6 years
ii. there is no need to seek to identify further reserves of HR for aggregate purposes. Calculation of landbanks including and excluding reserves from Government operated quarries stand at, or over, 10 years (17.9 and 10.1 years respectively).
iii. the landbank for HR Option B, which excludes reserves from Government operated quarries, is 10.0 years. Without any further permitted commercial HR reserves in the next 12 months, the landbank will be below 10 years by AMMR 2015 and a call for sites will be required.
7.8 This assessment of need for aggregate does not take account of the need for
agricultural lime which is a non- aggregate product (see Section 2).
7.9 A ‘Restricted Call for Sites’ (RCfS) to companies operational mineral workings was undertaken by the DoI Planning in November 2011. This followed the recommendation of the Minerals and Secondary Aggregate Technical Group (MSATG) after a review of methods for identifying potential new mineral reserves. Extensions to existing workings were preferred, the rationale being that, in general, a quarry extension has a lower environmental impact that a greenfield development.
7.10 The initial RCfS elicited five submissions none of which have been progressed. They
have been confirmed for AMMR2013 and are indicated as a green line on the MSA site maps (MSA01 Point of Ayre, MSA02 Ballaharra, MSA06 Cringle, MSA07 Earystane, MSA08 Billown), together with the appropriate buffer zone8 (100m for sand and gravel, 200 m for HR). The submissions did not contain sufficient information to allow a full assessment of their potential as prospective reserves, although as they are geologically conjunctive with current mineral permissions it can be assumed that suitable reserves are available. The proposed sites have not however been subject to assessment against planning policy, therefore access to RCfS mineral resources may be constrained or even prevented.
8 Minerals and Secondary Aggregate Technical Group: Technical Report April 2012
IoM AMMR 2014 published by Department of Infrastructure June 2014
P a g e | 23
8 Minerals Imports and export
8.1 The Island needs a range of minerals to sustain its economy, infrastructure and welfare. These include hydrocarbons such as coal and oil, minerals such as salt, aggregate limestone, granite/diorite, and sand. Geologically some of these are readily available and accessible on Island, whilst others are not.
Imports 8.2 Where local sources of minerals do not occur, are not available in the quantities and
specification required, or are economically not viable to extract, then minerals are imported. Of importance for the AMMR is to seek to identify the tonnage and type and frequency of aggregate imported. This indicates the degree to which the Island is self-sufficient in aggregate provision and where local reserves are not meeting aggregate product demands. Importation of aggregate is energy intensive and will increase the carbon load or embedded energy within the aggregate. This will contribute to the embodied9 carbon10 of infrastructure and buildings constructed using that aggregate.
8.3 Data on aggregate importation is limited as there is no requirement to declare
imports. Bulk loads imported by ship can be monitored via DOI harbours data. There are no recorded landings of bulk aggregate between Nov11 and Nov 12. During 2012/2013 dimension or dressed stone continued to be imported for use as cladding and wall construction. Output from the main quarry producing dimension/dressed stone has now increased and it is anticipated that the use of locally soured material will increase. It is known that dressed aggregate, aggregate and building stone is imported by builders merchants and for use in Regeneration Projects across the Island. Despite a request by DED, information about imports has not been forthcoming.
Exports 8.4 The market for mineral export is limited to specialist products. Historically the main
mineral suitable for export was black limestone from Pooil Vaaish.
9 http://www.sustain.co.uk/embodied-carbon.aspx Embodied carbon is very closely related to carbon footprinting. The main
difference is that the term carbon footprint can also be used to discuss operational carbon requirements, for example heating and lighting a building, or operation of a power tool. Whereas embodied carbon can only be used in the context of materials, for example all activities related to the construction of a building, including the production of materials. Embodied carbon can be defined as the amount of carbon released from material extraction, transport, manufacturing, and related activities. This may be calculated from cradle to (factory) gate, cradle to (installation) site, or (ideally) from cradle to grave.
10
http://www-csd.eng.cam.ac.uk/themes0/resource-flows-1/embodied-energy-and-carbon-in-buildings-eecb The UK Government pledged to reduce carbon emissions by 80% by 2050 (Climate Change Act of 2008). Regulations are being introduced requiring all new buildings to be ‘zero carbon’ by 2019. These are defined as buildings which emit net zero carbon during their operational lifetime. In order to meet the 80% target it is necessary to reduce the carbon emitted during the whole life-cycle of buildings, including that emitted during the processes of material extraction, manufacturing, delivery to site, construction process, maintenance and refurbishment, waste processing, demolition and recycling. These elements make up the‘embodied carbon’ of the building.
IoM AMMR 2014 published by Department of Infrastructure June 2014
P a g e | 24
9 Minerals Matters and Issues 9.1 This is the third AMMR since the formation of the MSATPG in May 2012. During the
forthcoming year the Group aims to: a. Work with DEFA and DOI to improve the capture, collation and analysis of data
on construction and demolition waste, and recycled aggregate.
b. Work with HSWI to: progress a review of the health and safety legislation and regulations related to the operation and management of quarries and aggregate reprocessing facilities; promote industry working in accordance with HSE ACOP; and, establish an Island based training and assessment scheme for demonstrating competency.
c. Promote the introduction of performance testing for aggregate and recycled aggregate for use in construction.
d. Promote the revision of design standards for roads (MR2) to accommodate performance led design.
e. Work with DOI to develop a methodology for estimating on an annual basis the reserves within Government operated quarries that will supply aggregate to the commercial sector, and contribute to the national landbank of HR mineral reserves.
f. Monitor landbanks and identify the need for new aggregate reserves.
g. Work with DEFA to monitor: the need for agricultural lime; annual sales of crushed limestone from Billown Limestone Quarry; and, mineral reserves at Billown.
h. Maintain a watching brief on production of the DOI implementation strategy 5 year Action Plan advised in the Waste Policy and Strategy 2012-2020 to identify proposals for use of IBAA or recycled aggregate, and monitor the need for landfill.
i. Maintain a watching brief on the requirement for Restoration Bonds attached to planning permissions for mineral extraction.
j. Provide technical to DOI Planning on the drafting of relevant planning policies and area plans, and guidance on the interpretation of Minerals Policy 1 and Waste Policy 1.
IoM AMMR 2014 published by Department of Infrastructure June 2014
P a g e | 25
10. Membership of the MSATPG 2013/14
Full Membership. Membership of the MSATPG is taken from companies operating mineral workings on Island, companies licenced for the reception and processing of waste aggregate, and representatives from the Department of Infrastructure – Planning and Building Control and the Department of Economic Development – Mines and Minerals. Table 13: MSATPG Membership 2013 - 2014
Mineral Operation Mineral type Representative Company
Cringle Quarry Manx Group Davey Craine A V Craine & Sons Ltd
Earystane Quarry Manx Group Michael Craig Earystone Ltd
Co-opted members The Terms of Reference for the MSATPG allow co-option of representatives from Government Departments or NGO’s etc for the purpose of discussing specific technical operational or policy matters. Since 2013 the IoM Health and Safety at Work Inspectorate (Bernard Warden) has been co-opted to the MSATPG to review the regulation of minerals and aggregate recycling operations under the Health and Safety at Work Act 1974, the IoM Management of Health and Safety at Work Regulations 2003, and the HSE Health and Safety Quarries Regulations 1999 - Approved Code of Practice.
IoM AMMR 2014 published by Department of Infrastructure June 2014
Change of use of field to sand quarry 3767, extraction to max 3m below water table, with infill with inert to max 4m above wt
part
SITES - PP RESTORATION YET TO BE AGREED
Billown operational quarry limestone n/a current pp prohibits infill. Interim restoration scheme submitted. Lease agreement is return to agricultural land use original land levels.
Poortown operational quarry;
03/01843/B EQ (on appeal 6/5/2005)
dolerite n/a landscape scheme submitted but matters of restoration to be included in a scheme (cond 32) for approval within 2 years cessation of quarrying
no but condition 30
indicates this is not precluded
SITES - PP RESTORATION NO INFILL
Pt of Ayre Operational Quarry 97/01561
sand and gravel
n/a low level restoration to lake
n
Stoney Mountain Operational Quarry 09/01544/B EQ
granite 2,335,000 t low level restoration, planting of heath and natural re-vegetation
n
IoM AMMR 2014 published by Department of Infrastructure June 2014
P a g e | 27
Table 14 MSATPG AMMR 2014 - Void Space Audit continued
Starch Mill Operational quarry 01/02350/B
manx formation
37,500t No overburden removed from the site O/B to be spread over the remaining flat surfaces/ rock faces when working completed and left to seed naturally.
n
Cringle Operational Quarry 08/02090
manx formation
est reserves 1,215,000t
20 yr pp to 2030 - restoration to low level heathland and lake
n
Earystane Operational Quarry 08/01790/B - 12/11/08 - to 12/11/18
manx formation
est reserves 134,000t
natural re-vegetation n
Cronk y Scotty Operational Quarry pp 11/01379/B 24/02/12
sand est reserves 19,000t
Re-colonisation utilising turf and heath transplantation with marram grass
n
SITES - NO RESTORATION CONDITIONS
Pooil Vaaish Historic mineral extraction – no planning permission
limestone est reserves 108,000t
IoM AMMR 2014 published by Department of Infrastructure June 2014
P a g e | 28
Table 15: Monitoring of Mineral and Aggregate Reprocessing Planning Applications - Decisions made 1st January 2013 – 31st March 2014