+ All Categories
Home > Documents > Minicircular DNA as a potential gene therapy vector in ... · Dissertação para obtenção do Grau...

Minicircular DNA as a potential gene therapy vector in ... · Dissertação para obtenção do Grau...

Date post: 08-Feb-2019
Category:
Upload: vokhanh
View: 213 times
Download: 0 times
Share this document with a friend
108
UNIVERSIDADE DA BEIRA INTERIOR Ciências Minicircular DNA as a potential gene therapy vector in cervical cancer Joel Marques Alves Dissertação para obtenção do Grau de Mestre em Bioquímica (2º ciclo de estudos) Orientadora: Prof. Doutora Ângela Sousa Coorientadora: Prof. Doutora Fani Sousa Covilhã, Outubro de 2017
Transcript

i

UNIVERSIDADE DA BEIRA INTERIOR Ciências

Minicircular DNA as a potential gene therapy

vector in cervical cancer

Joel Marques Alves

Dissertação para obtenção do Grau de Mestre em

Bioquímica

(2º ciclo de estudos)

Orientadora: Prof. Doutora Ângela Sousa

Coorientadora: Prof. Doutora Fani Sousa

Covilhã, Outubro de 2017

ii

iii

“No que diz respeito ao desempenho, ao compromisso, ao esforço, à dedicação, não existe

meio termo. Ou você faz uma coisa bem feita ou não faz.”

Ayrton Senna

iv

v

Para as pessoas mais importantes da minha vida e que eu mais amo,

Os Meus Pais

vi

vii

Acknowledgments

First of all, I would like to thank Professor Ângela Sousa and Professor Fani Sousa for

the opportunity and for believing in me to carry out this work. Thank you for all the

dedication, effort and availability throughout this year, as well the scientific expertise and

the criticisms and suggestions made during the guidance of the work.

I thank the University of Beira Interior, especially the Health Science Research Center

for providing the necessary conditions for the realization of this project. I would also like to

express my gratitude to all the people at the Biotechnology and Biomolecular Sciences group

for all their help and knowledge sharing.

I am deeply grateful to Doctor Patrícia Pereira and Doctor Augusto Pedro for their

willingness to help me when needed, overcoming some obstacles found throughout the work.

Thank you for sharing your valuable scientific knowledge and, above all, for the friendship

that we have created this year.

I would like to thank Henrique, for your availability in the last days, your help and

support and sharing your knowledge in Western Blot technique.

I would like to thank Margarida Almeida, Joana Valente for the time spent with me,

for your accessibility and availability in sharing your knowledge, for your support, for the

friendly words and encouragement throughout this year that allowed me to advance in the

work.

To my laboratory colleagues, Maria, Joana, João and Pedro, who became my “Milos”

throughout this year, I want to thank you for all the friendship we share, for the endless

hours we spent together, and especially for the support that we create in each other.

Between laughs and cries was a gratifying year at your side, thank you for that.

I want to thank all my friends and family who have always supported me and never

stopped believing in me. Thanks to the good friends that the Faculty gave me, it was a great

5 years spent with you.

Por último, mas não menos importante, quero agradecer do fundo do coração aos

meus pais porque sem eles nada disto teria sido possível. Nunca vão ser suficientes as

palavras para vos agradecer todo o carinho, dedicação, educação, apoio incondicional e por

todos os sacrifícios que tiveram de fazer para me tornar naquilo que sou hoje e isso, claro,

devo-vos a vocês. Obrigado por me terem permitido viver um sonho, que de certa forma

também é vosso!

viii

ix

Resumo Alargado

O Vírus do Papiloma Humano (HPV) infecta um elevado número de pessoas em todo o

mundo, estando associado a mais de 99% do cancro cervical, e por isso, é considerado a

segunda maior causa de morte em mulheres. O HPV é característico de inúmeras infeções e

doenças associadas ao ser humano, dependendo do tipo de vírus envolvido. O HPV 16 é um

vírus de alto risco pertencente ao género alfa-vírus do papiloma da espécie 9 e é o principal

promotor da infeção do cancro cervical. O HPV 16 contém uma vasta diversidade genómica,

sendo a proteína E6 responsável pela progressão do tumor devido à inativação da proteína

supressora de tumor p53. A proteína E6 é considerada uma das proteínas oncogénicas do

vírus, pois controla o ciclo celular nas células infetadas e estimula a proliferação celular.

Assim, novas abordagens terapêuticas para o tratamento deste cancro têm sido exploradas,

nomeadamente, a terapia genética que se baseia na inserção de material genético de

interesse nas células, resultando na expressão das proteínas codificadas pelos respetivos

genes. O DNA plasmídico (pDNA) é um vetor não viral de baixa toxicidade e

imunogenicidade, de fácil obtenção e manipulação, sendo por isso muito explorado em

vacinas de DNA e em terapia génica. O plasmídeo contém na sua constituição sequências

bacterianas essenciais à sua replicação no hospedeiro recombinante, como o gene de

replicação, motivos CpG e marcadores seletivos de antibióticos, assim como a cassete de

expressão eucariota constituída por um promotor, o(s) gene(s) de interesse e um terminador.

Apesar de já terem sido descritos alguns casos de aplicação terapêutica de pDNA bem-

sucedidos, atualmente, o uso de DNA minicircular (mcDNA) como vetor multigénico tem sido

mais aprofundado uma vez que este apresenta alguns diferenças, que podem ser benéficas

em relação ao pDNA. O mcDNA é constituído pela cassete de expressão eucariota, e não inclui

as sequências bacterianas e motivos CpG, pois estes podem desencadear respostas

imunológicas adversas e apresentar baixa biocompatibilidade e, ainda, não contém os

marcadores seletivos de antibióticos que podem causar resistência na flora bacteriana

humana. Assim, o mcDNA é um vetor de DNA biologicamente ativo, que além das suas

dimensões serem inferiores ao pDNA, não manifesta efeitos citotóxicos inerentes por ser

desprovido de sequências bacterianas, apesentando normalmente eficiências de transfeção e

expressão de transgenes superiores aos níveis encontrados para o plasmídeo.

Portanto, o presente trabalho visa construir um vetor de mcDNA contendo o gene da

p53 para restabelecer os níveis desta proteína supressora de tumor em células cancerígenas

do colo do útero, de forma a induzir apoptose destas células. A produção de mcDNA começou

pela clonagem da sequência codificante da p53 num plasmídeo parental (PP). A estirpe

Escherichia coli (E. coli) Top 10 foi transformada por choque térmico com o vetor p53-PP, e

após construção, o vetor foi sequenciado para obter a confirmação da inserção da sequência

x

codificante da p53 no vetor. Posteriormente, a estirpe E. coli ZYCY10P3S2T foi transformada

por choque térmico com o vetor p53-PP. O uso desta estirpe de E. coli é de grande

importância uma vez que esta permite a recombinação do PP, dando origem ao mcDNA e ao

miniplasmídeo por indução com L-arabinose durante o crescimento celular. Além disso, no

processo de recombinação, esta estirpe também digere o miniplasmídeo contaminante

através da ação das endonucleases. De modo a obter um processo de recombinação eficiente,

foi necessário otimizar este processo através de estudos no qual foram testados diferentes

tempos de indução e diferentes concentrações do indutor L-arabinose. O melhor rácio entre

mcDNA-p53/PP-p53 foi conseguido aplicando 0,01% de L-arabinose e 2 horas de indução.

Após produção, o mcDNA deve ser extraído e purificado para que possa ser avaliada a

eficiência de transfeção e efeito celular deste vetor em estudos in vitro. Têm sido exploradas

várias técnicas cromatográficas para a purificação de pDNA mas nem todas permitem obter

resultados satisfatórios. Atualmente, a cromatografia de afinidade é a mais estudada para

purificação de ácidos nucleicos porque é uma técnica que maximiza a recuperação e pureza

do DNA, especialmente o pDNA na sua forma biologicamente ativa, a isoforma superenrolada

(sc). Isto deve-se ao facto de a cromatografia de afinidade utilizar o reconhecimento

molecular entre as moléculas alvo e os agentes de ligação específica tendo em conta a função

biológica e estrutura química dos ligandos, como por exemplo, a utilização de alguns

aminoácidos que mostram elevada especificidade e seletividade para reconhecer o pDNA. Por

isso, neste trabalho foi estudada uma nova coluna cromatográfica de maneira a explorar o

caráter de afinidade simultâneo de dois ligandos de aminoácidos, a arginina e lisina,

imobilizados no mesmo grupo funcional, a triazina. Inicialmente foram testadas condições

que favorecem maioritariamente interações iónicas ou hidrofóbicas nos passos de

ligação/eluição, para se avaliar o perfil de interação entre a amostra e a matriz de modo a

purificar o mcDNA-p53 sc. Os melhores resultados foram obtidos por duas estratégias

diferentes, tendo-se revelado que uma favorecia a seletividade e a outra favorecia o

rendimento de recuperação. Sendo assim, a estratégia de equilíbrio com menor concentração

de sal parece favorecer a seletividade da matriz, obtendo uma amostra de sc mcDNA-p53 com

menor teor de impurezas, embora a recuperação da amostra injetada não seja total. Por

outro lado, o uso da estratégia de ligação efetiva da amostra à matriz, manipulando em

simultâneo o pH, parece favorecer a recuperação do mcDNA-p53 na isoforma sc, apesar de

conter algumas impurezas.

Nos estudos preliminares de transfeção in vitro, foram avaliadas a eficiência de transfeção

dos vetores PP e mcDNA e a expressão da proteína supressora de tumor p53. Inicialmente,

através de estudos de imunocitoquímica para visualização da expressão da proteína verde

fluorescente, verificou-se que a transfeção das células cancerígenas do colo do útero (HeLa)

ocorreu com ambos os vetores PP e mcDNA, tendo sido mais eficiente com o mcDNA. De

seguida, foi confirmada a presença de transcritos da p53 através de RT-PCR e, por fim,

confirmou-se pela técnica de Western Blot a expressão da p53 em células transfetadas.

xi

Em suma, este trabalho permitiu a construção, biossíntese e recuperação de um vetor

de DNA minicircular que codifica a proteína supressora de tumor p53, mostrando grande

potencial para prosseguir com estudos de transfeção in vitro e in vivo no sentido de

desenvolver futuramente uma estratégia para o tratamento do cancro do colo do útero.

Palavras-chave

Cancro cervical, cromatografia de afinidade, DNA minicircular, proteína supressora

de tumor p53, terapia génica.

xii

xiii

Abstract

The Human Papillomavirus (HPV) infects a large number of people worldwide and is

associated with more than 99% of cervical cancer, being a second major cause of cancer

death in women. HPV E6 oncoprotein is responsible for the progression of this tumor due to

the inactivation of the p53 tumor suppressor. Thus, novel therapeutic approaches for the

treatment of this cancer have been explored, for example gene therapy, which is based on

the insertion of genetic material of interest into the cells, resulting in the expression of

proteins encoded by the respective genes.

Plasmid DNA has been the non-viral vector mainly used in DNA therapeutics due to its

simple manufacture, low toxicity and immunogenicity. Despite some successful cases, the

possibility of using a DNA vector of reduced size, decreased toxicity by elimination of the

bacterial cassette and able to favor the target gene expression by increased transfection

efficiency, makes the minicircular DNA (mcDNA) a very promising gene therapy vector.

Therefore, the present work aims to construct a mcDNA vector encoding p53 to

reestablish the levels of this tumor suppressor protein in cervical cancer cells and to induce

apoptosis. The production of mcDNA started by cloning the p53-encoding sequence into a

parental plasmid (PP). Then, Escherichia coli ZYCY10P3S2T strain was transformed by heat

shock with the p53-PP vector. The use of this E. coli strain is of major importance since it

allows the plasmid recombination to form mcDNA and miniplasmid species by induction with

L-arabinose during cell growth. Moreover, after the recombination process, this strain is also

able to digest the contaminant miniplasmid through endonucleases action. A highest mcDNA-

p53/PP-p53 ratio was achieved by optimizing the recombination step to use 0.01% of L-

arabinose and 2h of induction.

After the production, the mcDNA must be purified for further evaluation of

transfection efficiency and cellular effect through in vitro studies. For that, a new

chromatographic column was studied in order to explore the simultaneous affinity character

of two ligands (arginine and lysine) immobilized in the same functional group (triazine), in

which hydrophobic binding/elution conditions were explored and optimized in order to purify

the sc mcDNA-p53. When it was used lower salt concentration in the equilibrium step, it

seemed that the selectivity of the column was favored, obtaining a sample of sc mcDNA-p53

with lower content of impurities, although the total recovery of the injected sample has been

sacrificed. On the other hand, using the strategy of effective binding of the sample to the

column and manipulating the pH was seemed to favor the recovery of sc mcDNA-p53 despite

containing some impurities.

In vitro transfection studies were performed to evaluate the transfection efficiency

of PP and mcDNA vectors and the p53 expression, by using HeLA cells. Through

immunocytochemistry it was observed that PP and mcDNA vectors were able to transfect

xiv

HeLa cells, being more efficient with mcDNA. By RT-PCR it was confirmed the presence of

p53 transcripts and by western blot it was verified the correct expression of p53 tumor

suppressor in transfected cells

Overall, this work allowed the construction, biosynthesis and recovery of a

minicircular DNA vector encoding the p53 tumor supressor protein, showing great potential to

proceed to in vitro and in vivo studies in order to develop a strategy for cervical cancer

treatment in the future.

Keywords

Affinity chromatography, cervical cancer, gene therapy, minicircular DNA, p53 tumor

suppressor protein.

xv

Table of Contents

RESUMO ALARGADO IX

ABSTRACT XIII

LIST OF FIGURES XVII

LIST OF TABLES XIX

LIST OF ABBREVIATIONS XXI

LIST OF SCIENTIFIC COMMUNICATIONS XXIII

CHAPTER I – INTRODUCTION 3

1.1 HUMAN PAPILLOMAVIRUS 3 1.1.1 E6 ONCOPROTEIN 4 1.2 P53 – THE TUMOR SUPPRESSOR PROTEIN 6 1.3 DNA-BASED THERAPIES 8 1.3.1 DNA VACCINES 8 1.3.2 GENE THERAPY 10 1.3.3 GENE DELIVERY 11 1.3.3.1 VIRAL VECTORS 12 1.3.3.2 NON-VIRAL VECTORS 14 1.4 PLASMID DNA 16 1.4.1 UPSTREAM PROCESS 17 1.4.2 DOWNSTREAM PROCESS 18 1.4.3 PDNA PURIFICATION 19 1.4.3.1 SIZE-EXCLUSION CHROMATOGRAPHY (SEC) 20 1.4.3.2 ANION-EXCHANGE CHROMATOGRAPHY (AEC) 20 1.4.3.3 HYDROPHOBIC INTERACTION CHROMATOGRAPHY (HIC) 21 1.4.3.4 AFFINITY CHROMATOGRAPHY (AC) 21 1.5 MCDNA 23 1.5.1 PRODUCTION 23 1.5.2 PURIFICATION 25

CHAPTER II – AIM OF THE THESIS 29

CHAPTER III – MATERIALS AND METHODS 33

3.1 MATERIALS 33 3.1.1 PLASMID DNA 33 3.1.2 PARENTAL PLASMID 34 3.2 METHODS 35 3.2.1 BACTERIAL GROWTH CONDITIONS 35 3.2.2 PCR AMPLIFICATION 35 3.2.3 CLONING STEP 36 3.2.4 PREPARATION AND TRANSFORMATION OF E. COLI COMPETENT CELLS 37 3.2.5 OPTIMIZATION OF MCDNA-P53 SYNTHESIS 37

xvi

3.2.6 MCDNA-P53 RECOVERY 38 3.2.7 MCDNA-P53 PURIFICATION - AFFINITY CHROMATOGRAPHY 39 3.2.8 CHROMATOGRAPHIC COLUMN SYNTHESIS 39 3.2.9 ENERGY DISPERSIVE X-RAY SPECTROSCOPY 41 3.2.10 ZETA POTENTIAL MEASUREMENT 41 3.2.11 CELL CULTURE 41 3.2.11.1 TRANSFECTION 41 3.2.11.2 RNA EXTRACTION 42 3.2.11.3 PROTEIN EXTRACTION 43 3.2.12 IMMUNOCYTOCHEMISTRY 43 3.2.13 REVERSE TRANSCRIPTION POLYMERASE CHAIN REACTION 44 3.2.13.1 CDNA SYNTHESIS 44 3.2.13.2 RT-PCR 44 3.2.14 WESTERN BLOT 45 3.2.14.1 PROTEIN QUANTIFICATION 45 3.2.14.2 POLYACRYLAMIDE GEL ELECTROPHORESIS 45 3.2.14.3 ELECTROBLOTTING 46 3.2.15 AGAROSE GEL ELECTROPHORESIS 46

CHAPTER IV – RESULTS AND DISCUSSION 49

4.1 MCDNA-P53 CONSTRUCTION 49 4.1.1 PDNA-FLAG-P53 AND PARENTAL PLASMID AMPLIFICATION AND RECOVERY 49 4.1.2 P53 FRAGMENT AMPLIFICATION 50 4.1.3 P53 FRAGMENT AND PP DIGESTIONS 51 4.1.4 CLONING AND E. COLI TRANSFORMATION 53 4.2 OPTIMIZATION OF MCDNA-P53 PRODUCTION 57 4.3 MCDNA-P53 PURIFICATION 60 4.4 IN VITRO TRANSFECTION STUDIES 68 4.4.1 TRANSFECTION EFFICIENCY ANALYSIS 68 4.4.2 P53 GENE TRANSCRIPTION 69 4.4.3 P53 PROTEIN EXPRESSION 70

CHAPTER V – CONCLUSIONS AND FUTURE PERSPECTIVES 75

CHAPTER VI – BIBLIOGRAPHY 79

xvii

List of Figures

Figure 1. Human papillomavirus 16 (HPV 16) genome structure. 4  Figure 2. Effect of the interaction between E6 and p53 tumor supressor protein. 5  Figure 3. Schematic structure of p53 gene. 6  Figure 4. Outcome of p53. 7  Figure 5. Graphical representation of the main areas of study for the application of gene

therapy. 10  Figure 6. Schematic representation of the delivery of a DNA-based therapeutic using a DNA

delivery vector. 11  Figure 7. Graphical representation of gene therapy vectors used for delivery in clinical trials.

12  Figure 8. Plasmid DNA process development. 17  Figure 9. Schematic representation of mcDNA-producing technology from PP. 24  Figure 10. Plasmid pcDNA3-FLAG-p53 vector Map. 34  Figure 11. Parental Plasmid (PP) vector Map. 34  Figure 12. Schematics solid-phase synthesis of triazine-based ligands.   40  Figure 13. Calibration curve with protein standards (0.2-10 µg/µL). 45  Figure 14. (A) Electrophoresis of E. coli DH5α cell lysates: pDNA sample purified by NZYTech

purification kit. (B) Agarose gel electrophoresis of E. coli ZYCY10P3S2T cell lysates: PP sample

purified by NZYTech purification modified kit. 50  Figure 15. Agarose gel electrophoresis of PCR amplification. 51  Figure 16. XbaI and BamHI restriction enzymes sites in PP map. 51  Figure 17. Agarose gel electrophoresis of PP linearization. 52  Figure 18. Agarose gel electrophoresis of PP and p53 fragment digestions. 53  Figure 19. Agarose gel electrophoresis of colonies PCR. 54  Figure 20. (A) Agarose gel electrophoresis of PP-p53 miniprep extraction; (B) Agarose gel

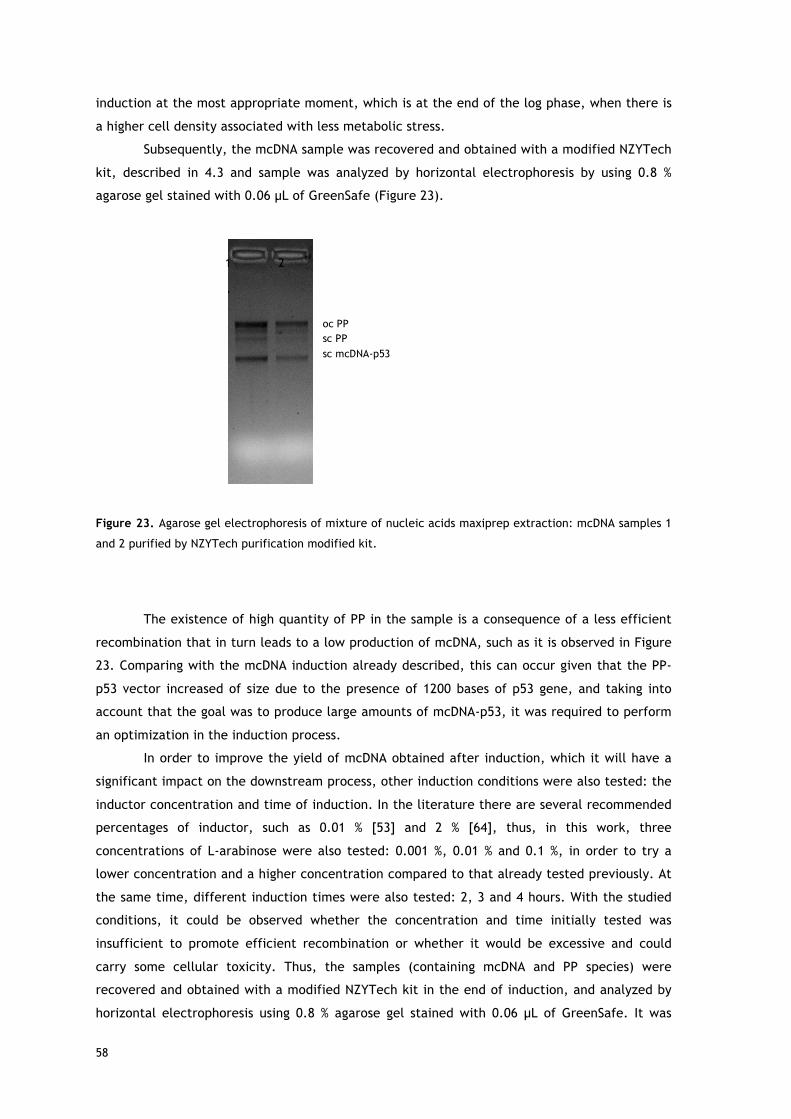
electrophoresis of PP-p53. 55  Figure 21. DNA sequence alignment of p53 gene and p53-cloned PP. 56  Figure 22. Agarose gel electrophoresis of colony PCR. 57  Figure 23. Agarose gel electrophoresis of mixture of nucleic acids maxiprep extraction:

mcDNA samples 1 and 2 purified by NZYTech purification modified kit. 58  Figure 24. Agarose gel electrophoresis of mixture of nucleic acids maxiprep extraction. 59  Figure 25. (A) Chromatographic profile of ionic conditions test; (B) Agarose gel

electrophoresis of samples collected at the column outlet; (C) Chromatographic profile of

hydrophobic conditions test; (D) Agarose gel electrophoresis of samples collected at the

column outlet. 63  

xviii

Figure 26. (A) Chromatographic profile of lysate using hydrophobic conditions; (B) Agarose

gel electrophoresis of samples collected at the column outlet. 64  Figure 27. (A) Chromatographic profile of lysate; (B) Agarose gel electrophoresis of samples

collected at the column outlet. 65  Figure 28. (A) Chromatographic profile of lysate only with decreasing salt concentration; (B)

Agarose gel electrophoresis of samples collected at the column outlet. 66  Figure 29. (A) Chromatographic profile of lysate with salt and pH variations; (B) Agarose gel

electrophoresis of samples collected at the column outlet. 67  Figure 30. HeLa cells immunocytochemistry images for PP-p53 and mcDNA-p53 staining. 69  Figure 31. Agarose gel electrophoresis of PCR amplification from HeLa transfected cells study.

70  Figure 32. Western Blot of p53 and β-actin expression. 71  

xix

List of Tables

Table 1. Human papillomavirus grouping, according to their risk to produce cervical cancer or

precancerous lesions. 3  Table 2. Advantages and disadvantages of using DNA vaccines. 9  Table 3. Advantages and disadvantages of using viral vectors. 13  Table 4. Advantages and disadvantages of using non-viral vectors. 14  Table 5. Advantages and disadvantages of delivery systems of non-viral vectors. 15  Table 6. Specifications of pDNA quality, according to regulatory agencies. 19  Table 7. Affinity chromatography methods for purification of nucleic acids. 22  Table 8. Primers for p53 fragment amplification. 36  Table 9. Primer for PP-p53 sequencing. 55  Table 10. Agarose matrix analysed by energy dispersive X-ray spectroscopy. 61  Table 11. Triazine-agarose matrix functionalized with arginine and lysine amino acids

analysed by energy dispersive X-ray spectroscopy. 61  Table 12. Zeta potential measurment of different matrices. 62  

xx

xxi

List of Abbreviations

µg Microgram

µL Microliter

µm Micrometer

ºC Celsius

APC Antigens Presenting Cells

BCA Bicinchoninic acid

DEPC Diethypyrocarbonate

DNA Deoxyribonucleic Acid

E. coli Escherichia coli

E6AP E6 Association Protein

EDTA Ethylenediaminetetraacetic Acid

EU Endotoxin Unit

FBS Fetal Bovine Serum

FDA Food and Drug Administration

g Gram

gDNA Genomic DNA

GFP Green Fluorescent Protein

HCl Chloride Acid

HPV Human Papillomavirus

K2HPO4 Dipotassium Hydrogen Phosphate

KH2PO4 Potassium Dihydrogenphosphate

kbp Kilo Base Pair

kDa Kilo Daltons

L Liter

LAL Limulus Amebocyte Lysate

LB Luria-Bertani

M Molar

mA Miliampere

mAU Miliabsorbance units

mcDNA Minicircular DNA

min Minutes

mL Milliliter

mM Milimolar

mRNA Messenger RNA

NaCl Sodium Chloride

NaOH Sodium Hidroxide

xxii

(NH4)2SO4 Ammonium Sulfate

nm Nanometer

oc Open circular isoform

OD600nm Optical density at 600nm

ORF Opening Reading Frames

p53 Tumor supressor protein

PBS Phosphate buffered saline

PCR Polimerase Chain Reaction

pDNA Plasmid DNA

pKa Acid dissociation constant

PP Parental Plasmid

RNA Ribonucleic Acid

rpm Rotations per minute

sc Supercoiled isoform

SDS Sodium Dodecyl Sulfate

TAE Tris, Acetic Acid, EDTA

TB Terrific Broth

Tris Tris(hydroxymethyl)aminomethane

UV Ultraviolet

v/v Volume/Volume

w/v Weight/Volume

xxiii

List of Scientific Communications

Oral Communication related with this thesis

Alves JM, Almeida AM, Maia CJ, Queiroz JA, Sousa F and Sousa A. Biosynthesis and purification

of a minicircular DNA vector for cervical cancer therapy. XII Annual CICS-UBI Symposium. 6-7

July 2017, Covilhã, Portugal.

Poster Communication related with this thesis

Alves JM, Almeida AM, Maia CJ, Queiroz JA, Sousa F and Sousa A. Minicircular DNA as a

potential gene therapy vector in cervical cancer. II International Congress in Health Sciences

Research towards innovation and entrepreneurship – Trends in Biotechnology for Biomedical

Applications. 17-19 May 2017, Covilhã, Portugal.

xxiv

1

CHAPTER I

2

3

Chapter I – Introduction

1.1 Human Papillomavirus

Human Papillomavirus (HPV) is responsible for numerous infections and diseases

associated with humans, depending on the type of virus involved [1, 2]. There are more than

200 papilloma viruses belonging to the Papovariridae family, in which they are divided into 5

genera depending on their differences in DNA sequences: alpha-virus, beta-virus, gamma-virus,

mu-virus and nu-virus of papilloma (Figure A), being the first three the major groups. These

groups can also be classified according to the location where they cause the infection: at the

cutaneous level, which includes the beta-virus, gamma-virus, mu-virus and nu-virus of

papilloma or at the level of mucosa where it stands out the alpha virus of papilloma [3, 4]. For

the major group, the alpha virus of papilloma is further classified according to the risk of

causing cervical cancer: low, moderate or high risk (Table 1). High-risk viruses are carcinogen

agents, and are called human carcinogenic viruses [5].

Table 1. Human papillomavirus grouping, according to their risk to produce cervical cancer or

precancerous lesions (adapted from [5]).

.

HPV 16 is a high-risk virus belonging to the papillomavirus type 9 alpha virus and is the

main promoter of cervical cancer infection [6]. About 61.35% of cases of cervical cancer are

due to invasion by HPV 16 [4]. This cancer causes the death of about 0.25 million women per

year, being considered the second most common cancer among women worldwide [2].

Human papillomaviruses are small size and feature approximately 8000 bp double

stranded DNA complexed with histones [3, 5, 7]. HPV 16 contains a broad genomic diversity

(Figure 1) [3]. It includes genes involved in replication, being the most common the E1 gene

that encodes a DNA helicase for replication and amplification of the viral genome and the E2

gene whose role is to modify the normal function of cells for the benefit of the virus. It also has

genes used in the packaging and structure of the virus capsule (L1 and L2 gene) and genes

involved in the cell cycle control, such as the E4, E5, E6 and E7 genes. As for the structural

HPV group HPV types High risk HPV-16, HPV-18, HPV-45, HPV-56

Intermediate risk HPV-31, HPV-33, HPV-35, HPV-51, HPV-52, HPV-58

Low risk HPV-6, HPV-11, HPV-42, HPV-43, HPV-44

4

level, the protein viral particles have an icosahedral structure of 50 to 60 nm, which contains

360 molecules of L1 proteins organized in 72 capsomers. These structures are linked between

the C-terminal of the L1 protein and the neighbor capsomer by disulfide bonds, thus forming

the viral capsid. It may also contain some molecules of L2 proteins, but these are not fully

exposed on the surface of virion [4, 7].

Figure 1. Human papillomavirus 16 (HPV 16) genome structure (adapted from [3]).

This virus penetrates the epithelium through microabrasions and infects the

keratinocytes that are located in the basal layer of the epithelial cells. As a consequence, the

virus will activate the cell cycle through infected and differentiated epithelial cells, in order to

create a competent environment for replication and amplification of viral genome and coupling

of the infectious particles [2].

The E6 and E7 proteins are considered the oncogenic proteins from the HPV 16 because

they control the cell cycle in infected cells, stimulate cell proliferation and inhibit some

aspects of innate immunity, specifically, they prevent interactions between epithelial and

dendritic cells (antigens presenting cells) and block the production and responsiveness of

interferons from infected cells [7, 8].

1.1.1 E6 Oncoprotein

The E6 oncoprotein is composed by 150 amino acids with 18 kDa approximately and it is

localized in the nuclear matrix and non nuclear membrane fraction. As for the structural level,

E6 consists by two zinc finger domains and in the base of each zinc finger are two motifs

containing two cysteines (C-X-X-C, being the X any amino acid). In the second zinc finger

5

domain include an LXXLL motif, which is necessary to mediate interactions between the E6

protein and the other host proteins, specifically and commonly the cellular E3 ubiquitin-ligase

known as E6-associated protein (E6AP). The interaction between E6 protein with E6AP results in

loss of p53 activity from the infected eukaryotic cells [9], because the E6 oncoprotein leads to

the degradation of p53 tumor suppressor protein mediated by ubiquitin binding, inhibiting

apoptosis [10].

This mechanism has been reported for the high-risk HPV-16, while in the case of low-

risk, E6 also binds p53 but with reduced efficiency, being unable of inducing p53 degradation.

This tumor suppressor protein can sense stress or potential damage in cellular DNA and invoke a

protective response by blocking the cell cycle progression or inducing apoptosis in the affected

cell, which is extremely important to maintain the genome integrity and stability. When the

p53 protein detects damage in the cellular DNA or oncogenic signals, it activates the

WAF1/Cip1 gene, which is an inhibitor of cyclin-dependent kinases. High cellular levels of this

complex WAF1/Cip1 inhibits cyclin-dependent kinases, which are important for progression

through the cell cycle. Thus, the cell cycle stops in the G1 phase in order to repair the damage

in the DNA and maintain the genome stability and cell integrity (Figure 2) [9].

Figure 2. Effect of the interaction between E6 and p53 tumor supressor protein (adapted from [9]).

6

The E6 oncoprotein also leads to the activation of the catalytic protein subunit of

human telomerase (hTERT). This endogenous enzyme takes care of maintaining the size of

telomeres, and thus with each cell division the telomere does not diminish and cell can divide

whenever it needs, making them permanently young. Therefore, with hTERT activation, the

cells maintain the end of chromosomes, thus preventing cell senescence since the telomer size

decrease leads to the rapid aging of the primary cells. [6].

Another problem caused by HPV infection is the inhibition of the immediate immune

response. This occurs because the E6 oncoprotein inhibits epithelial-cell-dendritic-cell

interactions and block the production of and responsiveness of infected cells to interferons.

Thus, this oncogenic protein, by inactivation or mutation of p53 function, triggers the

uncontrolled proliferation of cells through continued replication of cells with damaged DNA

promoting mutation, chromosomal instability and carcinogenesis of the host genome, along

with the inhibition of apoptosis pathways and inhibition of the immediate immune response,

leading to the start and progression of the tumor.

1.2 p53 – The Tumor Suppressor Protein

The inactivation of tumor suppressor p53 is one of the most common dysfunctions found

in cancer and it is estimated that the p53 gene is mutated in nearly 50% of all known cancers

[11]. It is a unique transcription factor, generally considered as the “guardian of the genome”

due to its most essential feature that is the ability to inhibit cell proliferation [12]. The human

p53, or TP53 is a nuclear phosphoprotein composed of 393 amino acids, 5 structural and

functional domains: an N-terminal transactivation domain, a proline-rich regulatory domain, a

sequence-specific DNA-binding domain, an oligomerization domain and a C-terminal domain

involved in the regulation of DNA-binding (Figure 3) [11].

Figure 3. Schematic structure of p53 gene (adapted from [11]).

7

As regards the three-dimensional structure, the DNA-binding domain is made of a

scaffold of beta-sheets that supports flexible loops and helixes. This characteristic allows to

the direct contact with DNA. Thus, this domain is the most important not only due to the fact

that it is the most mutated region in cancer pathologies but also because it is important to

trigger apoptosis by annulling protein–DNA contacts or by disrupting protein folding [11].

The p53 signaling pathway is activated in response to a variety of factors such as stress,

oncogenic signals or other damage, allowing it to coordinate transcription programs that

ultimately contribute to tumor suppression. Thus, p53 allows to block cell growth and induce

apoptosis, and it is therefore extremely necessary to maintain or restore their proper function

in cells (Figure 4) [12].

Figure 4. Outcome of p53 (adapted from [12]).

There are already several approaches with promising results, in which they aim to

reactivate p53 through the use of drugs that may influence the mechanism of p53 control. As

for example, a strategy already described showing good results in pre-clinical models is the use

of molecules that inhibit the formation of p53 complex with its negative regulator MDM2. This

occurs because MDM2 gene contains a p53-binding site that allows to bind tightly to p53 and

inhibits its activity as a transcription factor. However, the majority of these approaches are

8

based on viral delivery systems, such as the first commercialized p53 cancer based therapy,

which is used adenovirus for gene delivery [13].

To solve this problem, many therapies are used as new therapeutic approaches based

on the delivery of DNA by using different type of vectors [14].

1.3 DNA-based Therapies

DNA-based therapies have been an interesting field under study due to their increasing

impact over the last few years in various types of diseases. This therapeutic strategy became

possible since decoding the genome. From this discovery, knowledge about genes and their

expression products allowed the establishment of the relationship between genes and their

respective expression products, mainly proteins, which can be associated to particular diseases

[15].

For this approach, two therapeutic strategies have emerged with application of DNA:

DNA vaccines and gene therapy. The first one intends to stimulate immune responses by

delivering the genes encoding antigens for specific pathogens while gene therapy is based on

the delivery of genetic material that encodes a desired gene, into the nucleus of malignant or

mutated cell, resulting in its expression and subsequently, trigger its therapeutic effect [16,

17]. Both therapies have demonstrated potential in the evolution of clinical medicine being

considered promising alternative therapies [16].

1.3.1 DNA vaccines

One of the greatest achievements of medicine was vaccination, since it allowed

controlling the spread of numerous diseases. Significant developments have been observed in

recent decades, but the efficacy of vaccines has to be controlled over time and their safety

still represents a limitation [18]. The main goal of the vaccine is to prevent diseases in order to

trigger an immune response against a pathogen. Presently, conventional vaccines are already

marketed, which are based on dead pathogens, pathogenic subunits or attenuated viruses, but

they are applied only to a small number of diseases. DNA vaccines have been developed to

stimulate a strong and durable cellular and humoral immune responses through insertion of

genes encoding antigens of specific pathogens. One of the major and important differences of

DNA vaccines over conventional vaccines is their ability to transport highly conserved regions,

allowing more effective fighting against pathogens that have suffered changes [19].

9

DNA vaccines have been demonstrating several advantages when compared to

conventional vaccines, namely the increased safety, easier production and better specificity,

bringing fewer obstacles since there is no risk of reversal of the virus activation that could

trigger an infection. However, there are some disadvantages associated with this type of

vaccine, such as low immunogenicity and low transfection efficiency. These problems appear

because the delivery of naked DNA is not able to bypass biological barriers and it can be

partially degraded or totally destroyed in the path to the cell nucleus (Table 2) [20, 21].

Table 2. Advantages and disadvantages of using DNA vaccines (adapted from [20, 21]).

Currently, there are commercial preventive vaccines against HPV infection, with the

principle of mimicking the infection caused by the virus so that the immune system memorizes

specific functions to trigger in a future contact with the infectious agent and, thus, increase

the immunity and protection against the virus [22]. However, these vaccines are not effective

for already existing infections [23]. This has emphasized the need to develop not only

preventive but also therapeutic vaccines in order to combat the proliferation of the virus and

activate the humoral and cellular responses of the immune system through the insertion of

genes encoding specific pathogens into multigenic vectors [24].

Advantages Disadvantages

Easy to store and transport Low immunogenicity

Low cost production process Risk of production of antibodies against the DNA administered

Possibility of prolonged exposition and action

Insertion of DNA with potential incidence of some cellular modifications

Low transfection efficiency or insufficient antigen expression

Greater field of application

No risk of return for virulent infections

Induction of a immune response similar to that of vaccines with attenuated virus

Immune response focus only on target antigen

10

1.3.2 Gene Therapy

Gene therapy has been of increasing interest, due to the potential to treat a wide

variety of acquired or inherited diseases, many of which are considered incurable, such as

oncological, cardiovascular, infectious diseases and hereditary monogenic diseases (Figure 5).

Nowadays, with the therapeutic successes, there was a growing development of this therapy,

having now a more general applicability, with more than 1900 clinical trials in progress [25,

26].

Figure 5. Graphical representation of the main areas of study for the application of gene therapy

(adapted from [26]).

This therapy is based on the transfer of nucleic acids encoding the functional gene into

the target cells, in order to replace or repair the mutated or deleted gene, thus regulating

cellular procedures. So, gene therapy is only conceivable due to the ability of cells to capture

new genetic information and express the encoded proteins. However, the correct identification

of the gene suitable for the treatment of the disease and an efficient, precise and safe

transport system is crucial [27].

As it is a therapy with genetic manipulation, regulatory control is of the highest

importance because many ethical issues are raised, as well as safety concerns and possible

adverse effects on the patient. Currently, legislation only allows gene therapy to be directed to

somatic cells [25]. Therefore, gene therapy should result from a balance between safety and

efficacy, and when these points are reached, this therapy could be applied for the treatment of

various diseases [28].

11

1.3.3 Gene Delivery

For DNA-based therapies (i.e gene therapy and DNA vaccines) to become a real

treatment option and to succeed, it is necessary an efficient delivery of genetic material to the

target cells (Figure 6) [16]. Delivery systems represent an effective option to transport the DNA

to the target cell, protecting it from degradation and facilitating the path to the cell nucleus

[25]. Throughout this path, several obstacles may arise, such as the transport to the cell or the

access into the cell nucleus, which limits the effectiveness of the therapeutic strategy [29].

Figure 6. Schematic representation of the delivery of a DNA-based therapeutic using a DNA delivery

vector (adapted from [16]).

In order to obtain the perfect delivery system and ensure maximum efficiency, the

vector must meet the following prerequisites: to be innocuous and biocompatible, to avoid

degradation by nucleases, detection by phagocytes and capture by the reticuloendothelial

system; to present correct dimensions and ability to cross the plasma membrane and enter into

the nucleus, where transcription will occur; and finally be safe and do not cause any harmful

effect [25, 28].

12

One of the most essential factors to be taken into consideration when designing the

vectors to be used is the targeting, because it must be ensured that these delivery systems are

able to bypass biological barriers and move only to the target cells. If non-target cells are

transfected during delivery process, some undesirable effects can occur in patients [30].

Delivery systems can be classified as viral and non-viral. Although both have advantages

and disadvantages, non-viral vectors are a focus of increasing study because they are safer,

present low immunogenicity and have a relatively simple manufacture. In studies based on gene

therapy, the use of non-viral vectors has increased, but viral vectors such as adenovirus and

retrovirus are still used (Figure 7) [26].

Figure 7. Graphical representation of gene therapy vectors used for delivery in clinical trials (adapted

from [26]).

1.3.3.1 Viral Vectors

Viruses were the first delivery vectors used in DNA-based therapy because they present

numerous properties that allow them to easily recognize and enter in eukaryotic cells,

expressing their genes and consequently infecting the host cell [31]. This type of vectors has

good applicability because they present high cellular evasion capacity, which facilitates the

delivery of the genetic material. This ability can be exploited within the framework of gene

therapy by replacing infectious and non-essential genes of the virus with therapeutic genes

[30].

There are several viral vectors that can be used, such as adenovirus, adeno-associated

virus, retrovirus and lentivirus, which present several advantages and disadvantages

summarized in Table 3. Retroviruses were the first viral vectors to be described and, in this

13

case the safety of the vector is a major concern because they randomly integrate the genome

of the host cell, which can lead to serious health complications. However, due to inherent

advantages such as low pathogenicity, high infection efficiency and easy of handling, studies

are still being done to improve its safety. Adenoviruses are double-stranded DNA viruses, being

the most applied in the clinical context, since they present low pathogenicity and high capacity

of protein expression. These vectors have the ability to infect several cell types and are easy to

produce. However, they exhibit high immunogenicity and may trigger an immune response in

the host. The adeno-associated vectors are small single-stranded DNA viruses and their

replication is dependent on infection by a helper virus. Unlike adenoviruses, they have low

immunogenicity and pathogenicity, low immune response by the host and high stability.

However, they have the inconvenience of limiting the size of the therapeutic gene to be

transported. Lentiviruses act on a wide variety of cells and present a reduced risk of

mutagenesis, since they tend to integrate far from promoters, but yet present some pathogenic

potential (Table 3) [32].

Table 3. Advantages and disadvantages of using viral vectors (adapted from [32]).

Vector Advantages Disadvantages

Retrovirus

Fairly prolonged expression High transfection efficiency Substantial clinical experience Low immunogenicity

Low transfection efficiency in-vivo Insert size limit of 8kb ex-vivo Transfects only proliferating cells Difficult manufacture and quality control Safety concerns (mutagenesis)

Adenovius

High transfection efficiency Transfects proliferating and non-proliferating cells Substantial clinical experience

Strong immune responses Insert size limit of 7.5kb Difficult quality control

Adeno-associated virus

Efficient transfection of wide variety of cell types in-vivo Prolonged expression Low immunogenicity

Difficult manufacture and quality control Insert size limit of 4.5 kb Limited clinical experience Safety concerns (mutagenesis)

Lentivirus

Transfects proliferating and non-proliferating cells Transfects hematopoietic stem cells

Very difficult manufacture and quality control Poor storage characteristics Insert size limit of 8 kb No clinical experience Safety concerns

14

Overall, despite the viral vectors are very efficient gene delivery vectors, these

systems also present some disadvantages. These include safety concerns, such as the possible

occurrence of mutagenesis and carcinogenesis, induction of immune responses, the low DNA

amount that can be loaded and the high commercial cost. Considering these limitations, the

use of non-viral DNA-based therapy has appeared as a convincing approach for the gene

delivery [33].

1.3.3.2 Non-viral Vectors

In order to overcome the problems associated with viral delivery systems, non-viral

vectors are being explored. They allow to improve some features, particularly, more safety,

capacity for insertional mutagenesis, ability to transfer and deliver highest size genes. Other

important characteristics in non-viral vectors are that they are less pathogenic and may have

reduced toxicity in comparison with the existing viral vectors, and also include as advantage

their easier production, with lower associated costs and higher stability (Table 4) [32].

Table 4. Advantages and disadvantages of using non-viral vectors (adapted from [32]).

As already discussed, the entry of non-viral vectors into target cells may be difficult

and limited, so they must overcome several biological obstacles in order to be able to exert

their correct function. Thus, different methods have been developed, including the use of

synthetic and natural materials, or even the use of physical forces, which facilitate the access

of the genetic material into the cell nucleus. Chemical approaches use synthetic or natural

compounds as carriers to deliver nucleic acids into the target cells. On the other hand, physical

approaches employ a physical force that permeates the cell membrane and facilitates

Advantages Disadvantages

Manufacture and quality control relatively simple Good storage characteristics Low immunogenicity Good safety profile Efficient transfection ex-vivo Delivery to any somatic cell Non-infectious No limit on size of plasmid

Short duration of expression Repeat therapy required as plasmid does not replicate with host cells Inefficient transfection in vivo

15

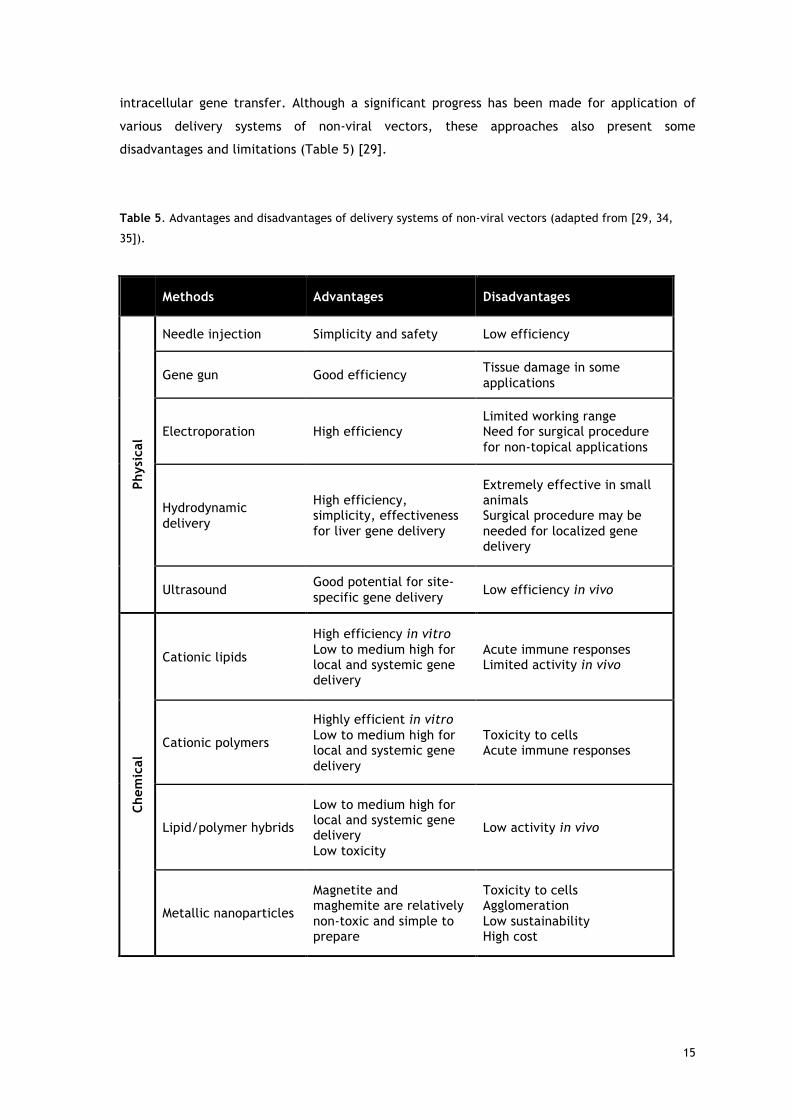
intracellular gene transfer. Although a significant progress has been made for application of

various delivery systems of non-viral vectors, these approaches also present some

disadvantages and limitations (Table 5) [29].

Table 5. Advantages and disadvantages of delivery systems of non-viral vectors (adapted from [29, 34,

35]).

Methods Advantages Disadvantages

Phys

ical

Needle injection Simplicity and safety Low efficiency

Gene gun Good efficiency Tissue damage in some applications

Electroporation High efficiency Limited working range Need for surgical procedure for non-topical applications

Hydrodynamic delivery

High efficiency, simplicity, effectiveness for liver gene delivery

Extremely effective in small animals Surgical procedure may be needed for localized gene delivery

Ultrasound Good potential for site-specific gene delivery Low efficiency in vivo

Chem

ical

Cationic lipids

High efficiency in vitro Low to medium high for local and systemic gene delivery

Acute immune responses Limited activity in vivo

Cationic polymers

Highly efficient in vitro Low to medium high for local and systemic gene delivery

Toxicity to cells Acute immune responses

Lipid/polymer hybrids

Low to medium high for local and systemic gene delivery Low toxicity

Low activity in vivo

Metallic nanoparticles

Magnetite and maghemite are relatively non-toxic and simple to prepare

Toxicity to cells Agglomeration Low sustainability High cost

16

In recent years, research in new non-viral systems has been intensified in order to

develop efficient strategies of DNA-based therapy. In this case, the therapeutic gene delivery

can be performed by using different classes of non-viral vectors, namely plasmids, cosmids, and

artificial chromosomes [15]. The most used is the plasmid DNA (pDNA) and numerous studies

have been developed by applying this modern technology [36].

1.4 Plasmid DNA

Plasmid DNA has stimulated a continuing interest mainly for application in gene therapy

and DNA vaccines. In these therapeutic approaches, plasmid DNA is used as a vector to deliver a

gene to the target cells and induce the production of relevant proteins and produce the

expected therapeutic effect [36].

Plasmid DNA consists in a double-stranded circular DNA molecule, being mainly

produced by using prokaryotic systems as hosts such as Escherichia coli (E. coli), isolated,

purified and delivered through biotechnological processes [37]. Plasmids have the ability to

naturally replicate, in an autonomous way into the bacterium and independently of the host

cell cycle. As regards its structure, the pDNA is divided into hydrophilic backbone, composed by

sugar and phosphate group, and hydrophobic interior of double helix, composed by planar bases

stacked on each other. The phosphate groups of the pDNA molecule are negatively charged

when the pH is higher than 4 [27].

In the two last decades, the plasmid DNA-based delivery vectors were the most popular

non-viral systems used in clinical trials, gaining recognition for application in different diseases.

This fact is probably due to the low toxicity, immunogenicity and high safety when compared

with viral vectors. However, there are limitations in the use of this vector, such as low

transgene expression levels through possible damages occurred in structural genes of eukaryotic

expression cassette and the biological barriers mentioned before, which can reduce the

transfection efficiency, resulting in the production of low levels of the target protein [38]. To

increase expression levels, one of the strategies explored has been the isolation of the

supercoiled (sc) isoform of plasmid DNA. This isoform is considered the most appropriate and

bioactive form for therapeutic applications due to its functional, compact and undamaged

structure. These factors allow better access to the nucleus of the target cell facilitating gene

expression. Nevertheless, other isoforms can be generated from the sc pDNA isoform by either

single strand nick, resulting the open circular (oc) isoform or double strand nick, which forms

linear isoform. The existence of different pDNA isoforms also depends on other factors such as

DNA sequence, stress or unfavorable environment conditions such as extreme pH or high

temperatures [39].

17

In order to be acceptable the use of this sc pDNA isoform in therapeutic applications, it

will be essential to conform all quality criteria recommended by regulatory agencies (such as

FDA) in terms of the contaminant content present in the final sample (host constituents,

namely endotoxins, genomic DNA, RNA and proteins) [40]. For that purpose, the

biotechnological process involved in pDNA preparation is divided into two main steps: upstream

process, which includes the production of pDNA by genetically modified organisms and

downstream process that corresponds to the plasmid isolation and purification (Figure 8) [41].

Ultimately, it is important to make a balance between the development of strategies that allow

a faster and most cost-effective production process without compromise the integrity of pDNA

and a purification strategy that enables effective isolation of the plasmid in the sc isoform for a

possible therapeutic application.

Figure 8. Plasmid DNA process development (adapted from [41]).

1.4.1 Upstream Process

As mentioned before, it is important to control the sc pDNA quality during the

biotechnological process and fulfill the recommendations of regulatory agencies. For that,

firstly it is needed a large-scale production, and then it is required the establishment of a

suitable downstream process to guarantee a high purity degree. In parallel, it is also mandatory

to select and apply analytical techniques sensitive enough to evaluate the vector’s quality [24].

The design and engineering of pDNA is an essential step to ensure the successful pDNA

manufacturing. The structure of plasmid DNA is divided into two major regions: the bacterial

18

amplification unit and the eukaryotic transcription unit. The first one contains the origin of

replication (ori), which is crucial to occur an autonomous and efficient vector replication and in

adequate quantities, an antibiotic resistance gene for growth selection of cells transformed

with the vector, non-methylated CpG motifs that consists of DNA sequences composed by

cytosines and guanines connected by phosphodiester bonds, which are useful to activate

immune system and presenting antigens for DNA vaccine approaches. Finally, the second region

of pDNA denominated by eukaryotic expression cassette contains the gene of interest for

further expression in the eukaryotic cells, and the regulatory elements, such as promoters,

enhancers and the polyadenylation termination sequence (PolyA), which is important for

transcript stabilization and protection against RNA degradation [42, 43].

The next step consists in the choice of the bacterial strain and optimization of the

fermentation conditions to enable the production of large quantities of sc pDNA under stable

conditions. Escherichia coli is the ideal host for this type of use, because it has been described

as very effective in producing pDNA since this bacterial strain have inherent advantages,

namely the ability to reach a high cell density in a short time, reduced consumption of

nutrients, economical and well genetically characterized in comparison to a wide variety of

hosts. Another characteristic of this host is the capacity to allow the manipulation of

fermentation conditions such as the composition of culture medium, temperature and pH,

which is essential for application in different strategies of plasmid production [39].

Once the production step is completed, it is required the improvement of sc pDNA

isolation and purification. It is fundamental to optimize all initial processes because the

downstream process will be strongly influenced by previous steps [41].

1.4.2 Downstream Process

After upstream process, it is essential to release plasmids from the host cells and

perform their separation from other cellular components, since the production is intracellular.

Thus, downstream process is critical for impurity elimination, being an important step of pDNA

recovery and isolation [41].

Cell lysis is the first step involved in this procedure, which can be performed by

mechanical or chemical methods. Alkaline lysis is the most applied technique and is based on

cellular membrane disruption by using a buffer containing NaOH to disrupt the hydrogen bonds,

which also denatures proteins that are involved in maintaining cell membrane, followed by the

release of all intracellular constituents (such as pDNA, RNA, genomic DNA (gDNA), proteins and

endotoxins). On the other hand, this agent with high pH levels promotes the denaturation of

gDNA, RNA and cell wall material. In particular, the sc pDNA isoform also relaxes in the

presence of the NaOH, however, if the pH is lower than 12.5 prevents, during a short time, the

19

separation of complementary strands [44]. Subsequently, the formation of a precipitate with

these contaminants occurs by addition of a neutralizing buffer, containing high concentration of

potassium acetate, and finally the precipitate is removed by centrifugation. This process is

considered a critical step in the recovery of sc pDNA and it is important to avoid plasmid loss

and its conversion into other isoforms. Although the use of denaturation and precipitation

processes during the alkaline lysis, the clarified sample resultant from this procedure still

contains proteins, RNA, gDNA and endotoxins. To solve this problem, concentration and

clarification steps should be performed to remove contaminants and increase the plasmid mass

fraction. Therefore, in order to concentrate the plasmid by precipitation, it can be used an

alcohol (such as isopropanol) and to clarify the sample by precipitation of high molecular

weight impurities it can be used a salt (such as ammonium sulfate) [45].

Finally, it is crucial the application of a chromatographic technique to carry out the

final pDNA purification. Chromatography has evolved in recent years and is considered one of

the most efficient methods to obtain high quality and quantity of pDNA, respecting some

requirements [44, 45].

1.4.3 pDNA Purification The pDNA has to be purified in order to proceed with the therapeutic application, since

a therapeutic product should present a high purity degree and quality, according to guidelines

recommended by regulatory agencies (Table 6) [40].

Table 6. Specifications of pDNA quality, according to regulatory agencies (adapted from [40]).

To separate the sc pDNA isoform from the other plasmid isoforms and host components,

liquid chromatography is chosen as the central technique. The physical and chemical

resemblances between host impurities and non-functional pDNA isoforms and sc pDNA represent

Biomolecule Guidelines

pDNA >97% sc

Proteins Not detectable

RNA Not detectable

gDNA <2 ng/ug plasmid

Endotoxins <0.1 EU/ug plasmid

20

one of the major complications in its purification. Specifically, the similarities are the negative

charge with RNA, gDNA and endotoxins, hydrophobicity with endotoxins and molecular mass

with gDNA. Different chromatographic methods have been developed based on properties such

as size, charge, hydrophobicity or affinity. Thus, this process have been optimized in order to

ensure the structural and functional stability of the active sc pDNA and, at the same time,

create a faster and more efficient separation, resulting in the maximum recovery yield [41,

46].

1.4.3.1 Size-exclusion chromatography (SEC)

Size-exclusion chromatography allows the pDNA purification from other molecules

present in a lysate based on differences of their molecular size. SEC can be applied with high

efficiency in separation of pDNA from RNA and endotoxins because RNA and endotoxins are

smaller molecules that have greater ability to penetrate inside the pore space, retarding the

movement through the column and their elution. However, separation of large molecules, such

as gDNA and different isoforms of pDNA, is limited because these molecules travel around the

particles of the column and are the first to be eluted, being difficult to isolate from sc pDNA

[40, 46].

1.4.3.2 Anion-exchange chromatography (AEC)

This chromatographic method consists in the separation of biomolecules based on the

attraction between opposite charges. Plasmid DNA is considered a polyanionic molecule that

will interact with positively charged ligands immobilized in the stationary phase. Usually, the

ligands used for pDNA purification by AEC are quaternary amines and the electrostatic

interactions are predominant. For binding and elution of different molecules and impurities

have been explored different salt concentration, and in this technique, it was already

described that the binding step preferably occurs at low salt concentration. After binding,

elution occurs by increasing salt concentration and it is dependent on the charge density, chain

length and conformation of molecules. The separation of sc pDNA from other isoforms in an

anion-exchange column can be possible with an optimized gradient due to the fact that sc is

more compact and has a higher charge density than the oc or linear isoforms, being eluted

later. However, it is necessary to take into account that the chemical and structural similarity

between sc pDNA and the remaining biomolecules can limit their separation [44, 46].

21

1.4.3.3 Hydrophobic interaction chromatography (HIC)

Hydrophobic interaction chromatography is a method that explores and recognizes

differences in hydrophobicity between nucleic acids and host impurities. The binding is

achieved by column loading at a high salt concentration, because ionic strength is responsible

to remove hydration water around hydrophobic groups, favoring the interaction between

biomolecules and ligands. The elution of different biomolecules is accomplished by reducing

the salt concentration, which weakens hydrophobic interactions and, thus, species are eluted

by increasing order of hydrophobicity. In the case of pDNA purification, this method allows the

evaluation of differences in hydrophobicity between double-strand and single-strand nucleic

acids and host contaminants. Therefore, this chromatographic technique is efficient in

separation of RNA and endotoxins, though, it presents low selectivity in relation to the

different pDNA isoforms [46, 47].

1.4.3.4 Affinity chromatography (AC)

Affinity chromatography has become a popular method for biomolecules purification

and it is the unique technique that uses specific binding agents to recognize and purify the

target molecule based on their biological function or chemical structure [14, 37, 48]. AC has

some advantages such as the possibility to reduce the number of steps, increasing yields and

improving process economics. The ligands used in this process may be either natural or

synthetic, although natural ligands present some limitations mainly in regard to its biological

origin. In this way, to solve this problem, synthetic ligands have been developed, combining the

selectivity of natural ligands with high capacity and durability of synthetic systems. This

strategy separates biomolecules on the basis of reversible interactions between the target

biomolecule and its specific ligand immobilized into the stationary phase. For that, the binding

step starts by inject a sample containing the target biomolecule onto the stationary phase,

with appropriate pH and ionic strength in the buffer. To obtain the target biomolecule, the

elution steps can be performed specifically, with competitive agents, or non-specifically by

changing buffer conditions, such as pH, ionic strength or polarity, depending on the

characteristics of the biomolecules [44]. Different types of AC have been used for sc pDNA

purification, such as immobilized metal-ion AC, triple-helix AC, polymyxin B AC, protein-DNA

AC and amino acid-DNA AC. These AC types present advantages and limitations, although,

amino acid-DNA has been extensively studied because of its ability to promote a set of

interactions with nucleic acids (Table 7) [46].

22

Table 7. Affinity chromatography methods for purification of nucleic acids (adapted from [46]).

Affinity type Principle Specific

binding Advantages Limitations

Imm

obili

zed

met

al-i

on

Chelating ligands charged with divalent metal-ion specifically interact with aromatic nitrogen atoms through p-d orbital overlap

Single-stranded nucleic acids (particularly purine bases)

Efficient resolution of RNA from gDNA and pDNA; High endotoxin removal; Separation of denatured pDNA

pDNA in the flowthrough; Incomplete RNA capture in complex mixtures; Co-elution of all DNA forms

Trip

le-h

elix

Specific sequences present on DNA are recognized by an immobilized oligonucleotide, forming a triple-helix

Double-stranded DNA

Discrimination of different plasmids based on their sequence; sc pDNA isolation in one chromatographic step; Reduction of RNA, gDNA and endotoxin contamination levels; Possibility for scale-up

Loss of pDNA during washing step; Low yields; Slow kinetics of triple-helix formation; Long chromatographic run times

Poly

myx

in B

Immobilized polymyxin B specifically recognizes the lipid structure of endotoxins

Endotoxins

Elimination of endotoxin contamination from pDNA preparations

Non-specific interaction of ligands with pDNA; Poor yields; Toxicity of polymyxin B

Prot

ein-

DN

A A protein or

protein complex immobilized on the matrix specifically recognizes a DNA motif

pDNA

Discrimination of different plasmids based on their sequence; pDNA isolation from clarified lysates; Elimination of proteins and RNA from preparation

Relatively low yields; Contamination with gDNA

Am

ino

acid

-DN

A Multiple

interactions occur between immobilized amino acids and nucleic acids

sc pDNA

sc pDNA purification in a single chromatographic step; Efficient elimination of RNA, gDNA, proteins and endotoxins

Elution with high salt concentration and relatively low yields (for histidine)

23

1.5 mcDNA

As described before, pDNA present several characteristics that makes this a highly

attractive biopharmaceutical product. However, there are some particularities that can

represent a limitation in therapeutic applicability, such as bacterial sequences essential for

replication in the host, which can lead to an inefficient therapeutic response and possible

clinical complications [49]. Specifically, pDNA presents genes conferring resistance to an

antibiotic that can spread to human bacterial flora through a horizontal gene transfer, placing

biological safety at risk. Additionally, unnmethylated CpG motifs are a limitation in gene

therapy because they are immunostimulating by promoting activation of Toll-Liker receptors,

affecting the expression of therapeutic gene in the target cell, inducing inflammatory

responses and cell death. On the other hand, after pDNA entry into the target cell, bacterial

sequences may associate with histones creating a dense heterochromatin structure that may

lead to transcription factors inaccessibility. Therefore, these sequences contribute to the

reduction or silencing of gene expression, thus compromising the efficiency of pDNA in gene

therapy. Finally, the bioavailability of this vector is compromised due to its high molecular size

[42, 49].

In this context, minicircular DNA (mcDNA) appears as a promising alternative, since it

comprises an improvement of pDNA, not containing these structural units fundamental for the

production in the bacterial host, being considered safer and with capacity to promote high

levels of gene expression [50]. The mcDNA was first isolated from E. coli by Cozzaelly, Kelly

and Kornberg in 1968. In this innovating study, the minicircular DNA was described as a small

molecule, which genetic information was limited to a small number of genes and whose

biological function was unknown [51]. This biomolecule has been evolving and, currently, is

classified as a non-viral vector that arises from higher molecular size plasmids by elimination of

genes essential for bacterial maintenance and replication [52].

1.5.1 Production

The mcDNA presents a supercoiled structure and is characterized by the absence of

bacterial sequences, thus, exhibiting high therapeutic potential [28]. This molecule results

from the intracellular recombination of the parental plasmid (firstly produced in the

recombinant bacterial host, such as E. coli), which will give rise to mcDNA and miniplasmid

(mP) through a recombinase (Figure 9). The mP includes genes responsible for production in the

bacterial host, and mcDNA contains the eukaryotic cassette responsible for the therapeutic

gene expression [53].

24

For the PP recombination step, numerous procedures were tested in order to promote

the formation of the desired biomolecules through the action of recombinases into specific

sequences present in the PP. Initially, this process was carried out by using the lambda

integrase, but it presented low yields in conversion of PP to mcDNA and mP with undesired

levels of toxicity [54, 55]. Recently, another approach has been used, allowing more promising

results, due to the fact that it is more efficient, simpler and with lower associated costs. The

method consists in the use of serine phiC31 recombinase that acts at the attB and attP sites,

promoting an unidirectional recombination. To occur conversion of PP into mcDNA and mP, it is

used a recombination inducer, the L-arabinose, which promotes expression of serine phiC31

recombinase that leads the production of this biomolecules. Simultaneously, it occurs the

activation of SceI-I endonuclease that promotes the cleavage and elimination of mP and PP

residues, which are considered impurities [52].

Figure 9. Schematic representation of mcDNA-producing technology from PP (adapted from [53]).

The mcDNA production can be influenced by different parameters such as temperature,

induction time and the inducer concentration. The optimization of these factors is crucial

because they can influence the levels of mcDNA and impurity production. Previous studies have

described that the induction time and the inducer concentration depend on the implemented

recombination process. For instance, it was shown that a production at 42ºC followed by an L-

arabinose induction process at 32ºC increases the yield of mcDNA production [53].

25

However, from the recombination process, amounts of mP and PP can still remain,

suggesting that recombination was not complete. Therefore, a purification procedure is

required to isolate mcDNA and obtain a vector with potential application in therapy [56].

1.5.2 Purification

The implementation of a strategy that allows the purification of mcDNA and subsequent

application in therapeutic approaches has been a huge challenge for researchers, due to the

fact that these developments face difficulties imposed by the sample complexity and similarity

between the biomolecules present in the original sample, which contains the mcDNA and other

impurities such as PP and mP. Thus, some methodologies have been tested [49, 56].

Restriction enzymes have already been used to eliminate PP and mP residues, but the

isolation of mcDNA has not been well achieved and the use of restriction enzymes may

compromise the application on industrial and therapeutic scale [57]. Another method for

mcDNA purification is the application of density gradients by using ethidium bromide and

cesium chloride that are not conceivable in clinical context due to their toxicity [54].

On the other hand, a mcDNA purification strategy was implemented, based on affinity

chromatography through interactions between proteins and DNA, in which occurs interaction

between the lactose repressor and the respective operon. This technique requires the

incorporation of the modified lactose operon into the mcDNA to be recognized by the

immobilized protein into the matrix. The mcDNA elution occurs by the addition of a

competitive agent that will lead to the breakdown of the established interactions. This strategy

has the disadvantage of involving a previous step of incorporating lactose operon into the

mcDNA, so that it can establish interaction with the chromatographic matrix [58]. Therefore, it

will be essential the development of an efficient purification technology that allows the mcDNA

isolation, complying the conditions imposed by the regulatory agencies.

26

27

CHAPTER II

28

29

Chapter II – Aim of the thesis

The present work proposes the construction of a mcDNA vector encoding the p53 gene,

to reestablish the levels of this tumor suppressor protein in cervical cancer cells. Thus, after

the construction step by molecular biology methodologies, it is necessary to optimize the

recombination process of the parental plasmid into mcDNA through the addition of different

concentrations of L-arabinose inducer at different induction times, in order to obtain a less

complex and impure sample facilitating the mcDNA purification process. Given that the

production of mcDNA is intracellular, it is necessary to carry out alkaline lysis followed by pre-

purification steps. Then, the next step is focused on the application of an efficient downstream

process to isolate and purify the mcDNA. In this context, affinity chromatography will be

exploited by using a new chromatographic column comprising two ligands (arginine and lysine

amino acids) immobilized in the same functional group (triazine). The binding/elution

conditions such as pH, concentration or salt type must be manipulated in order to isolate the

mcDNA sc isoform during the chromatographic steps. This purified biomolecule may

subsequently be evaluated regarding its purity. The purified sample will then be applied in in

vitro transfection studies of cervical cancer cells to evaluate the expression of the p53 tumor

suppressor encoded in mcDNA.

30

31

CHAPTER III

32

33

Chapter III – Materials and Methods

3.1 Materials

For the vector construction through enzymatic digestion and cloning, enzymes XbaI,

BamHI and T4 DNA ligase were used, respectively, and obtained from Takara Bio USA - Clontech

Laboratories, Inc.. For the PCR methodology, Taq Polimerase and MgCl2 were obtained from

NZYTech, Lda.- Genes and Enzymes, Lisbon, Portugal. To the vector dephosphorylation, the

enzyme CIP was purchased from New England BioLabs, Ipswich, MA. During the production, a

bacterium E. coli DH5α transformed with the pcDNA3-FLAG-p53 and a bacterium E. coli

ZYCY10P3S2T transformed with the vector pMC.CMV-MCS-EF1-GFP-SV40 polyA were used and

obtained from the company System Biosciences. Reagents used for the bacterial cultures

(tryptone and yeast extract) were purchased from Bioakar Diagnostics and the LB medium

purchased from Panreac. For fragment and vector purification it was used NucleoSpin Gel and

PCR Clean-up kit obtained from Macherey-Nagel & Co., Germany. For alkaline lysis and pDNA

purification, the NZYTech Plasmid Maxi kit was used. In electrophoresis technique, it was used

Greensafe Premium obtained from NZYTech, Lda.- Genes and Enzymes, Lisbon, Portugal. The

buffers used for chromatographic assays were pre-filtered with membranes whose pore size was

0.2 µm (Schleicher Schuell, Dassel, Germany) and degassed by ultrasonic system. For

concentration of the samples obtained in the chromatographic experiments, Vivaspin®

concentrators were used (Vivaproducts, Littleton, MA, USA). The solutions used were prepared

with ultra-pure deionized water, purified with the Millipore Milli-Q system (Billerica, MA, USA).

3.1.1 Plasmid DNA

The 6.59 kbp pcDNA3-FLAG-p53 plasmid was purchased from Addgene (Cambridge, MA,

USA). This vector encodes for the human p53 protein conjugated with a FLAG tag and contains

the ampicillin resistance gene and the SV40 virus mammalian expression promoter.

34

Figure 10. Plasmid pcDNA3-FLAG-p53 vector Map (adapted from Addgene).

3.1.2 Parental Plasmid

The 7.06 kbp pMC.CMV-MCS-EF1-GFP-SV40Poly A was purchased from Addgene

(Cambridge, MA, USA). The vector contains the kanamycin resistance gene, the CMV7 promoter

and the recombination sites attB and attP.

Figure 11. Parental Plasmid (PP) vector Map (adapted from Addgene).

35

3.2 Methods

3.2.1 Bacterial growth conditions

The pcDNA3-FLAG-p53 plasmid used for the p53 fragment amplification was produced

by first inoculating the strain into LB-agar plates (30 µg/mL, ampicilin). After growth on solid

medium, the fermentation started from a pre-fermentation (OD600nm = 2.6) so that the initial

OD600nm of the fermentation was 0.2. The bacterial growth was carried out by a cell culture of

E. coli DH5α in an orbital (Agitorb 200 IC, Aralab) at 37 ºC, with agitation of 250 rpm in a 1 L

erlenmeyer with 250 mL of complex Terrific Broth medium (20 g/L of tryptone, 24 g/L of yeast

extract, 4 mL/L of glycerol, 0.017 M KH2PO4, 0.072 M K2HPO4) supplemented with 30 µg/mL of

ampicillin. Growth was suspended at late log phase (OD600nm  ≈ 8). At this stage the pcDNA3-

FLAG-p53 was obtained, and the bacterial samples were collected by centrifugation (10 min, 4 ºC, 450 g) and stored at -20 ºC.

The pMC.CMV-MCS-EF1-GFP-SV40Poly A plasmid used as the base vector was produced

by the same way than pDNA3-FLAG-p53 vector, but using a cell culture of E. coli ZYCY10P3S2T

supplemented with 50 µg/mL of kanamycin at 42ºC. In this case, the growth was suspended at

late log phase (OD600nm ≈ 5).

3.2.2 PCR Amplification

To obtain the p53 fragment, the Taq Polimerase enzyme (NZYTaq2x Green MasierMix

separate MgCl2) and specific primers (StabVida) at 100 pmol (Table 1) were used. In a PCR tube,

6.25 µL of enzyme Taq Polimerase, 0.6 µL of primer forward (diluted 1:20), 0.6 µL of primer

reverse (diluted 1:20), 2 µL of MgCl2, 1 µL of pDNA (diluted 1:100) was included in a tube and

water was added until a final volume of 12.5 µL. After mixing, incubation and amplification was

carried out at 95 ºC for 5 min, (95 ºC for 40 sec, 60 ºC for 30 sec and 72 ºC for 1 min) x 30

cycles and finally at 72 ºC for 5 min in a thermocycler. The results were analyzed by 0.8%

agarose gel electrophoresis after purification with a PCR Purification Kit.

36

Table 8. Primers for p53 fragment amplification.

3.2.3 Cloning Step

For the enzymatic digestions of p53 fragment and Parental Plasmid, XbaI and BamHI

restriction enzymes were used. In a PCR tube, 1 µL of enzyme, 2 µL of 10x buffer, 1 µg of pDNA

or p53 fragment amplified was mixed and water was added until a final volume of 20 µL. After

the preparation, incubation was carried out at 37 ºC for 2 hours in a thermocycler. The results

were analyzed by 0.8% agarose gel electrophoresis after purification with a PCR Purification

Kit.

Before the cloning step, it was performed the dephosphorylation of the digested PP

vector, by using the CIP enzyme. In a PCR tube, 1 µL of enzyme, 2 µL of 10x buffer (NEB3), 1 µg

of PP, already digested by XbaI and BamHI, were mixed and water was added until reach a final

volume of 20 µL. Then the mixture was incubated at 37ºC for 1 hour in a thermocycler. The

results were analyzed by 0.8% agarose gel electrophoresis after purification with a PCR

Purification Kit.

The cloning mixture was based in a modified cloning protocol by Promega, in which it

was fixed the concentration of the vector (digested and dephosphorylated PP) to 100 ng and

was variated the concentration of insert (p53 digested fragment) through different ratios

calculated by this equation:

ng  of  insert =  ng  of  vector  ×  kb  size  of  insert

kb  size  of  vector  ×  

insertvector


Thus, the ratios 1/3, 3/1, 1/1 of insert/vector were tested. The reaccional mixture was

prepared in a sterile eppendorf tube, where 2 µL of enzyme ligase, 2 µL of 10x buffer, 100 ng

of vector and x ng of insert, calculated by the previously equation, were included and water

was added up until a final volume of 20 µL. After the preparation, incubation was carried out at

4 ºC for 18 h (overnight). To finalize the cloning process, the next step was the transformation

of E. coli, and for that, the mixture was incubated to room temperature for 25 minutes.

Primer

Forward 5'- AAT CTA GAA TGG AGG AGC CGC AGT CAG ATC -3'

Reverse 5'- ATG GAT CCT CAG TCT GAG TCA GGC CCT TC -3'

37

3.2.4 Preparation and Transformation of E. coli competent cells

The Ionue method for the preparation of ultra-competent E. coli cells was applied,

which is based on a slower growth of the bacterial culture by inducing thermal stress by

decreasing the growth temperature [59]. An isolated bacterial colony was selected from a

plaque that was previously inoculated for 16 hours at 37 ºC, into 25 mL of SOB medium (2 % w/v

tryptone, 0.5 % w/v yeast extract, 8.56 mM NaCl, 2.5 mM KCl, 10 mM MgCl2 and 10 mM MgSO4)

in a 250 mL erlenmeyer. It was incubated for 6 hours at 37ºC with vigorous shaking (250 rpm),

and at the end, this culture was used to inoculate another 250 mL erlenmeyer with 62.5 mL of

SOB medium and 500 uL of the initial culture. This bacterial culture was incubated overnight at

20 ºC, 250 rpm. The OD600 was measured until reaching 0.55, and, then, the bacterial growth

was stopped and the erlenmeyer was transferred to a cold bath for 10 minutes. To become

competent, cells were collected by centrifugation at 2500 g for 10 minutes at 4 ºC, followed by

carefully resuspension in 20 mL ice cold ITB (55 mM MnCl2.4H2O, 15 mM CaCl2

.2H2O, 250 mM KCl,

10 mM PIPES – 0.5 M at pH=6.7), and finally a centrifugation at 2500 g for 10 min at 4 ºC. To

complete the procedure, the cells were carefully resuspended in 5 mL of ice cold ITB and 375

ul of DMSO was added, and it was gently blending the bacterial suspension, being lastly placed

on ice for 10 minutes. Finally, 100 µl of the cell suspension was transferred into cold sterile

tubes and the competent cells were frozen rapidly by submerging the hermetically sealed tubes

in liquid nitrogen and then stored at -80 ºC.

E. coli competent cells were transformed by heat shock with the p53-PP vector. The

process starts by adding the PP-p53 to 100 µL of E. coli competent cells Top 10/ ZYCY10P3S2T

and incubating on ice for 30 minutes. Next, the mixture was incubated at 42 ºC for 45 seconds

and, subsequently, incubated at ice for 2 minutes. This mixture was added to a 15 mL sterile

falcon tube with 400 µL of SOB medium in a orbital (Agitorb 200 IC, Aralab) at 37 ºC, 1 hour,

250 rpm. Finally, 250 µL of this bacterial culture was inoculated into LB-agar plates (50 µg/mL,

kanamycin) and finally it was evaluated the bacterial colonies by PCR.

3.2.5 Optimization of mcDNA-p53 synthesis

For the production of mcDNA, an induction mixture was added to bacterial cultures,

when the fermentation reached an optical density (OD600nm) of approximately 5, consisting in a

final volume of 250 mL of LB medium, 10 mL of 1 M NaOH with the pH adjusted to 7. L-

arabinose (20% w/v) was used up to a final concentration of 0.001% or 0.01% or 0.1%, to find

the best conditions. The recombination process was run for different hours (2, 3 and 4 hours) in

a cooled orbital with constant temperature at 32 ºC and stirring at 250 rpm. The end of this

38

procedure, consist of the mcDNA obtention by centrifugation of the bacterial samples (10 min,

4 ºC, 450 g) and the cells stored at -20 ºC.

3.2.6 mcDNA-p53 recovery

For mcDNA and PP extraction, NZYTech Plasmid Maxi kit was used, including some

modifications to the protocol provided by the manufacturer. Initially, the bacterial pellet was

resuspended in 20 mL of P1 buffer (50 mM of Tris-HCl at pH=8.0, 10 mM of EDTA hydratated and

100 µg/mL RNase A). Thereafter, 20 mL of P2 buffer (200 mM of NaOH, 1 % of SDS (w/v)) was

added in order to promote the lysis of cells. The tubes were gently homogeneized and

incubated at room temperature for 5 minutes. The lysis step was stopped with the addition of

20 mL of P3 buffer (3.0 M of Potassium Acetate at pH=5.0). Next, incubation on ice was

promoted for 20 min, followed by two centrifugations, 30 and 15 minutes (20000 g and 4 ºC)

that resulted in the elimination of some precipitated contaminants, such as cell debris, gDNA

and proteins. The supernatant was added to a anion exchange column, previously equilibrated

with QBT Buffer (750 mM NaCl, 50 mM MOPS, 15 % isopropanol (v/v), 0.15 % Triton X-100 (v/v)

at pH=7.0), and the proteins and low molecular weight molecules were initially removed by the

addition of a buffer with low pH and salt content (0.90 M of NaCl). Next, elution of the mcDNA

was promoted by the addition of a buffer with higher pH and higher salt concentration (1.75 M

of NaCl). The species obtained in this step were precipitated by the addition of 0.7 volumes of

isopropanol, followed by incubation on ice for 20 minutes. The obtained sample was subjected

to centrifugation (16000 g, 4 ºC and 30 min) and the obtained pellet was resuspended in 1 mL

of Tris-EDTA buffer (10 mM at pH=8.0). In this protocol, washing and elution buffers applied to

the purification columns had a concentration of 1M and 1.25M, respectively. These

concentrations are normally applied in conventional plasmids such as pDNA-FLAG-p53.

However, to mcDNA recovery, it was necessary some changes at these buffer concentrations

because under these concentrations, it was observed loss of mcDNA in the washing and elution

steps. Therefore, after some optimizations by the group it was verified that the best

concentrations in the washing and elution buffers were 0.9M and 1.75M, respectively. These

concentrations allowed lower loss of mcDNA sample and, at the same time, to obtain a final

sample with the minimum amount of contaminants. These modifications to the initial protocol

of NZYTech kit suggest that mcDNA promotes stronger interactions with the ion exchange kit

columns than pDNA probably because this biomolecule is smaller, compact and has more

density of charges per surface area than pDNA. Thus, due to the intensity of interactions

established by the mcDNA, higher ionic strength was necessary in the elution step to disrupt

this binding. This procedure resulted in samples of mcDNA and PP that were later used in

chromatographic assays for the isolation of the supercoiled isoform of mcDNA.

39

3.2.7 mcDNA-p53 purification - Affinity chromatography

The chromatographic studies were carried out in the AKTA Purifier system (GE

Healthcare Biosciences, Uppsala, Sweden) with UNICORN software 5.11. This system consists of

a compact separation unit and a computer. A new chromatographic column was studied in

order to explore the simultaneous affinity character of two ligands (arginine and lysine)

immobilized in the same functional group (triazine). For the mcDNA purification, the column

was equilibrated with and without the presence of salt at a flow rate of 1 mL/min. When the

equilibrium conditions were reached, the sample obtained from the lysis was injected using a

200 µL loop. After injection of the sample under these conditions the binding of the sample to

the column was studied and, subsequently, different gradients were applied in order to

promote the elution of the retained biomolecules. The fractions corresponding to each peak

were recovered, concentrated by centrifugation, dessalted and then analyzed by agarose gel.

All chromatographic assays were performed at room temperature and the absorbance was

continuously monitored at 260 nm. At the end of the chromatographic assays, the column was

regenerated by using a flow rate of 0.5 mL/min with 0.1 M NaOH in 30 % isopropanol (v/v) and,

finally, the column and the AKTA Purifier system were cleaned with Mili-Q water.

3.2.8 Chromatographic column synthesis

The chromatographic matrix preparation and modification with specific ligands was

performed by using the protocol already described for similar matrices [60]. Briefly, epoxy-

activated agarose was produced by reacting SepharoseTM CL–6B with 10 M NaOH (0.04 g/mL

moist agarose) for 30 min at 34 ºC, followed by addition of epichlorohydrin (0.072 g/mL moist

agarose) for 3 h at 34 ºC. To continue with the column preparation, it was necessary to

determine the amount of epoxy groups through incubation of 1 g of epoxy-activated agarose

with 3 mL of an aqueous solution of 1.3 M sodium thiosulfate for 20 min at room temperature

with agitation, and, then epoxy groups were quantified by titration with 0.1 M HCl. Before

functionalizing the agarose with the triazine, epoxy-activated agarose was washed with Mili-Q

H2O, resuspended in 5 M NH4OH (1.5 g/mL moist resin) and incubated overnight in the orbital

shaker at 40 ºC. Aminated agarose was then washed with Mili-Q H2O and resuspended in a cold

solution of 50 % (v/v) acetone/Mili Q H2O with 1 molar equivalent of NaHCO3 relative to epoxy

(1 g/mL agarose). The functionalization step was started by dissolving cyanuric chloride, which

is a chlorinated derivative of 1,3,5-triazine in acetone (8.6 g/mL cyanuric chloride) with 5

equivalent molar excess relative to epoxy content. After that, it was added to the aminated

resin, followed by incubation for 1h in ice with agitation. Once again, after incubation step, the

40

triazine-functionalized resin was washed by 3 steps: first 2 times the resin volume with

acetone, second 3 times the resin volume with 50% (v/v) acetone/Mili-Q H2O and, finally, 5

times the resin volume only with H2O. The cyanuric chloride-functionalized agarose was then

placed in flasks and the amino acid binding was started by adding arginine with 2 molar

equivalent relative to epoxy (0.5 mL/well), an upper cover was placed and the flask was

incubated for 24 h at 30 ºC with agitation at 100 rpm. Afterwards, the ligand was washed 5

times with 0.75 mL of the solvent in which the amino acid was dissolved and, next, 5 times

with 0.75 mL of Mili-Q H2O and the solvent was left to drain by gravity. The filter plate was

bottom-capped and the second amino acid, lysine, was then added to each row of the filter

plate with 5 molar equivalent relative to epoxy (0.5 mL/well) and incubated for 48 h at 80 ºC in

the orbital shaker at 100 rpm (Figure 23).

In the end, to finish the matrix preparation, the functionalized resin was washed 5

times with 0.75 mL of the solvent in which each amino acid was solubilized, followed by 1 time

with 0.75 mL of 0.1 M HCl, 1 time with 0.75 mL of Mili-Q H2O, 1 time with 0.75 mL of 0.1 M

NaOH in 30 % isopropanol (v/v), and, finally, 5 times with 0.75 mL of Mili-Q H2O.

Figure 12. Schematics solid-phase synthesis of triazine-based ligands. A solid matrix functionalized with a

nucleophile (denoted by Nü) readily reacts with cyanuric chloride at 0 ◦C. The cyanuric chloride-modified

scaffold undergoes two subsequent nucleophilic substitutions by R1 and R2 substituted nucleophiles,

where R1 and R2 are arginine and lysine, respectively. The first substitution occurs at 30 ◦C for 24 h and

the second substitution at 80 ◦C for 48 h (adapted from [60]).

R1:

R2:

- Arginine

- Lysine

41

3.2.9 Energy dispersive X-ray spectroscopy

In order to confirm if the amino acid ligands (arginine and lysine) were immobilized in

the triazine-agarose matrix, an energy dispersive X ray analysis (EDX) was performed in Rontec,

and the samples were placed on aluminum stub supports, air-dried at room temperature and

finally sputter-coated with gold. It was measured the percentage of different atoms, such as

Carbon, Oxygen, Sodium, Phosphorus and Nitrogen present in agarose matrix and triazine-

agarose functionalized with arginine and lysine.

3.2.10 Zeta potential measurement

Zeta potential measurement of matrices was performed in a Zetasizer Nano-ZS (Malvern

Instruments, Worcestershire, UK). Before analysis, the matrices were diluted and ressuspended

in filtered and deionized water. The surface charges (zeta potential) were assessed in a zeta

disposable folded capillary cells and determined by laser Doppler electrophoresis using a

Zetasizer Nano ZS (Malvern Instruments Ltd., UK), at 25 ºC. The average values of size and zeta

potential were calculated with the data obtained from three measurements ± SD.

3.2.11 Cell culture

HeLa cells were cultured in Dulbecco’s Modified Eagle Medium (DMEM) High Glucose

Medium (Sigma-Aldrich, St. Louis, MO, USA) supplemented with 10 % v/v of fetal bovine serum

(FBS) and a mixture of penicillin (100 µg/mL) and streptomycin (100 µg/mL). All cells were

grown at 37 ºC in a humidified atmosphere with 5 % of CO2 in air.

3.2.11.1 Transfection

The purpose of the transfection protocol was to verify the expression of p53 protein

with PP-p53 and mcDNA-p53, in order to identify the most effective biomolecule. Thus, the

transfection protocol was performed with X-tremeGENETM HP DNA Transfection Reagent (Roche

42

Diagnostics GmbH, Germany) according to manufacturer’s instructions, in order to transfect

HeLa cells with PP-p53 and mcDNA-p53 obtained by NZYTech extraction kit. Briefly, HeLa cells

were cultured until a confluence of 80 % to 90 % was obtained. Then, complete medium was

substituted by medium without antibiotic and FBS and cells were incubated for 24 hours.

Thereafter, K2 transfection reagent and different plasmid samples (1 µg of each vector) were

incubated at room temperature for 20 minutes and added to the respective wells. Protein

extraction, RNA extraction and immunocytochemistry were performed with non-transfected

and transfected cells. Cells intended to be used for protein extraction were cultured in 6-wells

and incubated during 72h after transfection, while cells planned to be used for

immunocytochemistry were cultured in 12-wells with 15 mm coverslips and incubated during 48

h after transfection and cells used for RNA extraction were cultured in 12-wells and incubated

during 24 and 48 h after transfection.

3.2.11.2 RNA extraction

Transfected cells and controls were used for RNA extraction by adding 250 µL of

TripleXtractor to each well (12 well plates). The samples were either immediately stored at -80

ºC or used to RNA extraction. The samples were incubated 5 minutes at room temperature,

followed by adding 50 µL of chloroform and vigorous mixing, leading to the separation of the

different biomolecules present in the sample. Then, incubation was carried out for 10 minutes

at room temperature, followed by centrifugation at 4 ºC for 15 minutes at 12000 g in a Hettich

Mikro 200R centrifuge (Hettich Andreas GmbH, Tuttlingen, Germany). Thereafter, the aqueous

phase was carefully pipetted, to recover all RNA species without destabilizing other

biomolecules and contaminating the retrieved sample. RNA was precipitated by adding 125 µL

of ice-cold isopropanol, followed by gentle shaking and 10 minutes incubation on ice.

Centrifugation was performed for 15 minutes at 4 ºC and 12000 g. The pellet was washed with

125 µL of 75 % Ethanol in Diethylpyrocarbonate (DEPC) water to remove possible organic

compounds and centrifuged for 5 minutes at 12000g. Finally, the supernatant was discarded

and the pellet was resuspended in 20 µL DEPC water. An electrophoresis in 1 % agarose gel was

carried out to confirm the success of the technique. RNA quantification was performed with

Nanophotometer (Implen GmbH, Munich, Germany).

43

3.2.11.3 Protein extraction

Transfected and control cells were also submitted to protein extraction. Briefly, cells

were scrapped with cell scrapper and phosphate buffered saline (PBS) and divided in

microtubes. Then, the microtubes were centrifuged at 11500 rpm for 7 minutes at 4 ºC in a

Hettich Mikro 200R centrifuge (Andreas Hettich GmbH, Tuttlingen, Germany). The supernatant

was discarded and 500 µL of PBS were added, followed by centrifugation in the same

conditions. Then, supernatant was discarded again and complete lysis medium was added

according to pellets volume, followed by 10 minutes of incubation on ice. Complete lysis

medium consists in 25 mM Tris (pH 7.4), 2.5 mM EDTA, 2 % Triton X-100, 2.5 mM EGTA, 1 mM

PMSF, 10 µL/mL complete EDTA free protease inhibitor cocktail (Roche, Indianapolis, USA). The

resulting proteins were used to perform western blot technique.

3.2.12 Immunocytochemistry

Immunocytochemistry was used to evaluate and compare the transfection efficiency of

the PP and mcDNA vectors, by assessing the green fluorescent protein (GFP) fluorescence. To

perform this technique, it was necessary to place the coverslips previously to the seeding of

cells in 12-wells. After 48 hours of transfection, the coverslips were gently washed 3 times with

PBS, fixed with 4 % paraformaldehyde for 15 minutes, washed again 3 times with PBS, and

permeabilized with 1 % Triton X-100 in PBS for 5 minutes. The coverslips were washed 3 times

with PBS 0.1 %, followed by 10 minutes incubation with DAPI for nucleus staining. The

coverslips were mounted with a drop of mounting medium and stored at 4 ºC or -20 ºC.

Coverslips were analyzed using a Zeiss LSM 710 laser scanning confocal microscope (Carl Zeiss

SMT, Inc., Oberkochen, Germany) and image achievement was performed with Zeiss Zen

software. Immunofluorescence analysis and image manipulation was performed with ImageJ 1.0

software.

44

3.2.13 Reverse transcription polymerase chain reaction

3.2.13.1 cDNA synthesis

To assess mRNA expression of target proteins it is necessary to synthetize cDNA from

the extracted RNA. Thus, 500 ng of total RNA from non-transfected and transfected cells (24 h-

48 h post transfection) were reversely transcribed into cDNA with RevertAid First Strand cDNA

Synthesis Kit (Thermo Scientific, Molecular Biology, USA). According to the manufacturer’s

instructions, 0.5 µL of Random Primers was added, followed by H2O adding to a final volume of

6 µL. The samples were incubated for 5 minutes at 65 ºC in a thermal cycler T Professional

Basic Gradient (Biometra GmbH, Göttingen, Germany). Afterwards, 2 µL of reaction buffer, 0.5

µL of Ribolock RNase Inhibitor, 1 µL dNTP mix and 0.5 µL of Revertaid M-MuPVRT were added by

this exact order. Then, cDNA synthesis reaction was incubated for 5 minutes at 25 ºC, followed

by 60 minutes at 42 ºC and, finally for 5 min at 70 ºC, in the thermal cycler. Finally, the

resultant cDNA was stored at -20 ºC.

3.2.13.2 RT-PCR

Reverse transcription polymerase chain reaction (RT-PCR) was performed by using the

thermal cycler Gradient Basic Professional T (Biometra GmbH, Goettingen, Germany). RT-PCR

was performed by adding 1 µL cDNA to a reaction with 6.25 µL Taq polymerase, 0.5 µL MgCl2,

0.4 µL of each forward and reverse primer. Primers were designed specifically for p53 gene

(Fw: 5’- CCT CAC CAT CAT CAC ACT GG -3’; Rv: 5’- CCT CAT TCA GCT CTC GGA AC -3’), with

resulting amplification of a DNA fragment of 286 bp. The following cycle conditions were used:

95 ºC for 5 minutes, 20 cycles at 95 ºC for 30 seconds, 60 ºC for 30 seconds and 72 ºC for 1

minute and final extension at 72 ºC for 5 minutes.

45

3.2.14 Western Blot

3.2.14.1 Protein quantification

The Bradford micro-assay from BioRad (Hemel Hempstead, UK) was used to measure

the protein concentration. In summary, 1 µL of sample, 159 µL of MiliQ water and 40 µL of

Biorad reagent were prepared in a microplate for each sample. The assay was performed in

triplicate. Upon 15 minutes of incubation at room temperature, absorbance was recorded at

595 nm in an Anthos 2020 microplate reader (Biochrom, Cambridge, United Kingdom).

Afterwards, a calibration curve was constructed, by using Bovine Serum Albumin (BSA) from

Sigma-Aldrich (St. Louis, MO, United States of America) as a standard protein (0.2-10 µg/µL), as

depicted in Figure 13.

Figure 13. Calibration curve with protein standards (0.2-10 µg/µL).

3.2.14.2 Polyacrylamide gel electrophoresis

Polyacrylamide gel electrophoresis was performed with pooled fractions of proteins of

transfected and control cells, using 12.5 % polyacrylamide resolving gel and 4.7 %

polyacrylamide stacking gel. The samples were prepared with 25 µg of each protein sample,

whose volume was calculated through the calibration curve constructed by protein

quantification, and 5 µL of loading buffer, followed by 5 minutes of denaturing at 100 ºC. The

y = 0,0615x + 0,0645 R² = 0,97291

0

0,1

0,2

0,3

0,4

0,5

0,6

0,7

0,8

0 2 4 6 8 10 12

Abs

orva

nce

595n

m

[Protein] µg/µL

46

molecular weight marker used was NZYColour Protein Marker II (NZYTech, Lda. - Genes and

Enzymes, Lisbon, Portugal). Afterwards the electrophoresis was carried out at 200 V, for 45

minutes. The resulting electrophoresis gel was used for electroblotting.

3.2.14.3 Electroblotting

Protein gel electrotransfer is based on the transference of total proteins of an

electrophoresis gel to a polyvinylidenedifluoride membrane. Electroblotting was carried out

through a Biorad System with the protein gel resulting from previous electrophoresis.

Membrane activation was performed with sheer methanol, followed by MiliQ water

equilibration. Electrotransfer was performed at 0.75 mA and 250 V for 90 minutes. Afterwards,

the membrane was washed 3 times with Washing Buffer (20mM Tris at pH=8.0, 150mM NaCl, 0.1

% Tween 20) for 5 minutes, followed by 1 hour of incubation at room temperature with milk,

under constant agitation. Afterwards, the membrane was washed 3 times for 5 minutes, cut-out

and incubated by 1 hour at room temperature with rabit anti-p53 monoclonal antibody (Santa

Cruz Biotechonology, Heidelberg, Germany). Hereafter, the membranes were washed 3 times

with Washing buffer for 5 minutes and incubated at room temperature with goat anti-rabit IgG

polyclonal antibody (Santa Cruz Biotechnology Heidelberg, Germany) for 1 hour, followed by

washing 3 times for 5 minutes with Washing buffer. Then, membranes were incubated for 5

minutes with ECL - Westerb blotiing detection kit (WesternBrightTM Quantum, Advansta Inc.,

USA) and were visualized in BioRad ChemiDocTM Imaging System (Bio-Rad, Hemel Hempstead,

UK).

3.2.15 Agarose gel electrophoresis

Samples obtained at the end of the enzymatic digestion, PCR, lysis and in each

chromatographic assay were analyzed by horizontal electrophoresis (Clever Scientific) with a

0.8 %/1 % agarose gel with 15 cm length (Hoefer, San Francisco, CA, USA) stained with 0.06 µL

of Greensafe. Electrophoresis was run for 30 min at 120 V in TAE buffer (40 mM of Tris base, 20

mM of acetic acid and 1 mM EDTA at pH=8.0). The gel was analyzed under ultraviolet (UV) light

using the Uvitec Cambridge Fire-Reader UV system equipped with a camera (UVITEC

Cambridge, Cambridge, UK).

47

CHAPTER IV

48

49

Chapter IV – Results and Discussion

Considering the high prevalence of cervical cancer caused by HPV infection in women

worldwide, and consequently, the increasing number of deaths caused by this pathology, the

development of new therapeutic approaches based on DNA delivery is increasingly required.

Plasmid DNA has been the non-viral vector mainly used in DNA therapeutics, but despite some

successful cases, it has some obstacles that may be exceeded by using a new promising gene

therapy vector, the minicircular DNA.

In this way, the main goals of this thesis are the construction, production and

purification of a mcDNA vector encoding p53 to reestablish the levels of this tumor suppressor

protein in cervical cancer cells. Thus, in this present work it was firstly constructed the PP-p53

vector, followed by optimization of mcDNA-p53 production. Finally, it was also studied a

purification strategy by exploring the simultaneous affinity character of two amino acid ligands

immobilized in the same functional group in order to purify the sc mDNA-p53 isoform. At last, it

was performed in vitro studies in order to evaluate the transfection efficiency, the presence of

p53-mRNA transcripts and p53 expression.

4.1 mcDNA-p53 Construction

4.1.1 pDNA-FLAG-p53 and Parental Plasmid Amplification and

Recovery

The production and recovery of high-copy number of sc pDNA is fundamental for

therapeutic applications. Some factors such as the host, the recombinant plasmid vector and

growth conditions must be taken into account to obtain an efficient manufacturing process,

which can provide large quantities of plasmid production [61]. Escherichia coli strains have

been considered the most efficient host for pDNA production, not only yielding high amounts of

vector but also maintaining its integrity [36].

In order to obtain the p53 fragment, it was required the pDNA-FLAG-p53 amplification.

This vector was obtained by E. coli DH5α fermentation in a refrigerated orbital at 37 ºC, and

with agitation of 250 rpm until it reaches an OD600nm of 8. In the first step, a pDNA-FLAG-p53

plasmid sample was obtained with NZYTech kit, using the NZYTech protocol without

modifications, and the resultant sample was analyzed by horizontal electrophoresis with a 0.8 %

50

agarose gel stained with 0.06 µL of GreenSafe (Figure 14A). On the other hand, to obtain the

vector’s base for mcDNA-p53 construction, Parental Plasmid amplification was obtained by E.

coli ZYCY10P3S2T fermentation in an orbital at 42 ºC, and with agitation of 250 rpm until it

reaches an OD600nm of 5. In the next step, PP sample was obtained with NZYTech kit, using the

NZYTech protocol with the same modifications adopted for mcDNA extraction, as described in

section 3.2.9, in order to maintain the samples at the same conditions. These conditions of PP

production and recovery were already described in a previous study [53]. Finally, PP sample

was analyzed by horizontal electrophoresis with a 0.8 % agarose gel stained with 0.06 µL of

GreenSafe (Figure 14B). It can be concluded that after DNA extraction the resultant samples

mainly contain the sc isoform pDNA-FLAG-p53 and sc PP, but still containing the open circular

isoform as contaminant.

Figure 14. (A) Electrophoresis of E. coli DH5α cell lysates: pDNA sample purified by NZYTech purification

kit. (B) Agarose gel electrophoresis of E. coli ZYCY10P3S2T cell lysates: PP sample purified by NZYTech

purification modified kit.

4.1.2 p53 Fragment Amplification

After pDNA-FLAG-p53 isolation, PCR amplification was required in order to obtain the

p53 fragment. The amplification was carried out by using specific primers that were designed

to amplify the p53 gene and including the ends of sequence for the restriction enzymes

recognition: XbaI and BamHI represented in section 3.2.2.

The amplified p53 fragment was purified by PCR Purification Kit, and analyzed by 1 %

agarose gel electrophoresis (Figure 15). As depicted in Figure 15, it can be observed a single

band with approximately 1.2 kbp that correspond to the size of p53 gene fragment. Thus, this

result shows that amplification has successfully occurred.

oc pDNA-FLAG-p53

sc pDNA-FLAG-p53 oc PP

sc PP

(A) (B)

51

Figure 15. Agarose gel electrophoresis of PCR amplification. M - Molecular weight marker, C- -Negative

control of PCR amplification, S - p53 fragment amplified by PCR and purified by PCR purification kit.

4.1.3 p53 Fragment and PP Digestions

In order to proceed with the cloning step, it was necessary to use the same restriction

enzymes on both p53 fragment and PP vector. For that, it was used two restriction enzymes:

XbaI and BamHI that will recognize their restriction sites present in both p53 fragment and PP

Multiple Cloning Site (MCS) (Figure 16).

Figure 16. XbaI and BamHI restriction enzymes sites in PP map.

5’-ATTCTAGAGCTAGCGAATTCGAATTTAAATCGGATCCGC-3’

XbaI BamHI

M C- S

p53 fragment (1.2kbp)

52

Firstly, it was confirmed if PP vector's linearization completely occurred by using one of

the restriction enzymes. Thus, the enzymatic digestion was performed with XbaI during 1 hour

at 37 ºC, and then, the digestion product was purified with PCR purification kit and analyzed by

0.8 % agarose gel electrophoresis (Figure 17). The results proved that the digestion was

successful, being present a single band corresponding to a linear PP. Simultaneously, the p53

fragment amplified before, was also digested with XbaI in the same conditions, but was not

analyzed by agarose gel electrophoresis due to the fact that it will not occur any difference in

the molecular size of fragment after digestion. This sample was also purified with the PCR

purification kit for further digestion with the second enzyme.

Figure 17. Agarose gel electrophoresis of PP linearization. M – Molecular weight marker, S – PP vector

digested with XbaI and purified by PCR purification kit.

After digestion of PP and p53 fragment with XbaI, it was performed the enzymatic

digestion with the second enzyme, BamHI, during 1 hour at 37 ºC, and then, the samples were

purified with the PCR purification kit and analyzed by 1 % agarose gel electrophoresis. The

result presented in Figure 18 shows the successful digestion of PP vector, being observed only

one band correspondent to the linear fragment of 7.06 kbp from this vector. In addition, it is

also confirmed the presence of p53 fragment, due to the band that arises at 1.2 kbp (by

comparing to the molecular weight marker). By this result, it is also possible verify that, both

fragments present a good integrity to proceed the cloning process.

M S

ln PP (7.06 kbp)

53

Figure 18. Agarose gel electrophoresis of PP and p53 fragment digestions. M - Molecular weight marker;

PDV – PP vector digested with XbaI and BamHI, and purified by PCR purification kit; PDF – p53 fragment

digested with XbaI and BamHI, and purified by PCR purification kit.

4.1.4 Cloning and E. coli Transformation

After digestions and purification of PP vector and p53 fragment, the fragments acquired

the same cohesive ends due to restriction enzymes. Thus, it was proceeded to the cloning step

that consisted in ligation of p53 fragment into PP vector. Several ligation conditions were

tested such as different ratios of PP vector/p53 fragment (1/3, 3/1 and 1/1), diverse

incubation times and different incubation temperatures (overnight at 4 ºC, 3 h at 16 ºC/21 ºC).

It was still tested the previous cloning conditions by using dephosphorylated PP vector or non-

dephosphorylated PP vector, due to the fact that dephosphorylated vector can prevent and

possibly stop the self-ligation of vector during cloning step.

Subsequently, E. coli Top10 strain was transformed with previous cloning products by

heat shock, because this strain is more suitable for large plasmid transformation [62, 63].

Isolated colonies were replicated to another agar plate and, at the same time, resuspended in

10 µL of 20 mM NaOH, lysed at 100 ºC for 5 minutes and used for PCR test to confirm p53

fragment presence. After this, samples were analyzed by 1% agarose gel electrophoresis (Figure

19).

M PDV PDF

ln PP (7.06 kbp)

p53 fragment (1.2 kbp)

54

Figure 19. Agarose gel electrophoresis of colonies PCR. M - Molecular weight marker; C– - Negative

control of PCR; C+ - Positive control of PCR; Lane 1-3 – PCR amplification of colonies from 1/3D ratio;

Lane 4-7 - PCR amplification of colonies from 3/1D ratio; Lane 8-11 – PCR amplification of colonies from

1/3 ratio.

In Figure 19, PCR positive control was made by using the pDNA-FLAG-p53 vector. The

PP-p53 transformation occurred only in 3/1D ratio of insert/dephosphorylated vector,

represented by the lanes 4, 5 and 6. However, results from the ratio 1/1 were not shown

because it was not possible isolate colonies from the agar plate. After confirming the presence

of the p53 gene in the PP vector of transformed colonies, these colonies were placed to grow in

3 mL of LB during 12 hours at 37 ºC with agitation of 250 rpm. PP-p53 was isolated by miniprep

extraction, used for a final PCR test to confirm the integrity and presence of p53 fragment in

the PP-p53 vector, and both assays were analyzed by 0.8 % agarose gel electrophoresis, before

being used in next steps (Figure 20).

M C- C+ 1 2 3 4 5 6 7 8 9 10 11

55

Figure 20. (A) Agarose gel electrophoresis of PP-p53 miniprep extraction; Lane 4-6 - PP-p53 miniprep

extraction corresponding to the colonies 4,5,6 respectively. (B) Agarose gel electrophoresis of PP-p53

PCR. M - Molecular weight marker; C– - Negative control of PCR; C+ - Positive control of PCR; Lane 4-6 –

PCR amplification of PP-p53 miniprep extraction.

Since the 3 PP-p53 vectors presented the fragment corresponding to the p53 gene,

only the PP-p53 corresponding to colony 4 was sequenced. Three sequencings were performed

by STABVIDA: two with the primers designed to recognize the p53 encoding gene, previously

used, and one with the commercial primer that recognize the CMV site present in the PP (Table

9) (Figure 21).

Table 9. Primer for PP-p53 sequencing.

Primer

CMV Fw 5’-CGC AAA TGG GCG GTA GGC GTG-3’

M C- C+ 4 5 6

4 5 6

(A)

(B)

p53 fragment (1.2 kbp)

sc PP-p53 (8.26 kbp)

56

Figure 21. DNA sequence alignment of p53 gene and p53-cloned PP.

By analysis of sequencing results, it was conclued that PP-p53 contains the coding

sequence of p53 tumor suppressor protein. So, E. coli ZYCY10P3S2T strain was transformed with

this PP-p53 vector by heat shock, because this strain allows the plasmid recombination through

the activation of serine phiC31 recombinase that acts on the attB and attP sites to form mcDNA

and miniplasmid species, after induction with L-arabinose during cell growth [52]. Also in this

case, isolated colonies were replicated to another agar plate and, at the same time,

resuspended in 10 µL of 20mM NaOH, lysed at 100 ºC for 5 minutes and used for PCR test to

confirm p53 fragment presence. After this, samples were analyzed by 0.8 % agarose gel

electrophoresis (Figure 22).

57

Figure 22. Agarose gel electrophoresis of colony PCR. M - Molecular weight marker; C– - Negative control

of PCR; C+ - Positive control of PCR; Lane 1 – PCR amplification of colony.

In Figure 22, the pDNA-FLAG-p53 vector was used as PCR positive control, and one

transformed colony was tested by PCR and it was confirmed the presence of the p53 fragment.

After this, it was created and cryopreserved bacterial banks with this strain of E. coli

containing the PP-p53, for further production studies.

4.2 Optimization of mcDNA-p53 Production

As mentioned before, E. coli ZYCY10P3S2T strain allows the parental plasmid

recombination to form mcDNA and miniplasmid species by induction with L-arabinose during

cell growth. Therefore, it was initially considered that it was important to test the conditions

already established for another vector, where it was studied the intramolecular recombination

promoted by using two L-arabinose percentages (0.01 % and 0.1 %), in which the content of

mcDNA and contaminants (mP and PP residues) were evaluated along 5 hours. So, the

conditions applied for induction of mcDNA were a temperature of 32 ºC during 3 hours, with

agitation of 250 rpm. Thus, after the initial PP production stage (250 rpm at 42 ºC), the mcDNA

production process was started with addition of 125 mL of inducer mixture composed by 25 g/L

LB medium and 1.0 M NaOH at pH=7, into a 125 mL of medium fermentation. To this mixture it

was also added an inducer, 0.01 % L-arabinose to promote the serine recombinase phiC31

expression, allowing the production of mcDNA and mP. Simultaneously, to promote the

elimination of residual mP and PP, the I-SceI endonuclease cleaves specific sites in these

biomolecules.

Another important strategy to facilitate the induction step is measuring the OD600nm

from hour to hour during the fermentation, in order to guarantee the beginning of the

M C- C+ 1

p53 fragment (1.2kbp)

58

induction at the most appropriate moment, which is at the end of the log phase, when there is

a higher cell density associated with less metabolic stress.

Subsequently, the mcDNA sample was recovered and obtained with a modified NZYTech

kit, described in 4.3 and sample was analyzed by horizontal electrophoresis by using 0.8 %

agarose gel stained with 0.06 µL of GreenSafe (Figure 23).

Figure 23. Agarose gel electrophoresis of mixture of nucleic acids maxiprep extraction: mcDNA samples 1

and 2 purified by NZYTech purification modified kit.

The existence of high quantity of PP in the sample is a consequence of a less efficient

recombination that in turn leads to a low production of mcDNA, such as it is observed in Figure

23. Comparing with the mcDNA induction already described, this can occur given that the PP-

p53 vector increased of size due to the presence of 1200 bases of p53 gene, and taking into

account that the goal was to produce large amounts of mcDNA-p53, it was required to perform

an optimization in the induction process.

In order to improve the yield of mcDNA obtained after induction, which it will have a

significant impact on the downstream process, other induction conditions were also tested: the

inductor concentration and time of induction. In the literature there are several recommended

percentages of inductor, such as 0.01 % [53] and 2 % [64], thus, in this work, three

concentrations of L-arabinose were also tested: 0.001 %, 0.01 % and 0.1 %, in order to try a

lower concentration and a higher concentration compared to that already tested previously. At

the same time, different induction times were also tested: 2, 3 and 4 hours. With the studied

conditions, it could be observed whether the concentration and time initially tested was

insufficient to promote efficient recombination or whether it would be excessive and could

carry some cellular toxicity. Thus, the samples (containing mcDNA and PP species) were

recovered and obtained with a modified NZYTech kit in the end of induction, and analyzed by

horizontal electrophoresis using 0.8 % agarose gel stained with 0.06 µL of GreenSafe. It was

oc PP sc PP sc mcDNA-p53

1 2

59

injected the same amount of sample (2µg) in all wells of agarose gel electrophoresis (Figure

24).

Figure 24. Agarose gel electrophoresis of mixture of nucleic acids maxiprep extraction. PP – PP control

sample; Lane 1, 2 – maxiprep extraction after 2 h of induction with 0.001 % of L-arabinose; Lane 3, 4 –

maxiprep extraction after 2h of induction with 0.01% of L-arabinose; Lane 5, 6 – maxiprep extraction after

2 h of induction with 0.1 % of L-arabinose; Lane 7, 8 – maxiprep extraction after 3 h of induction with

0.001 % of L-arabinose; Lane 9, 10 – maxiprep extraction after 3h of induction with 0.01 % of L-arabinose;

Lane 11, 12 – maxiprep extraction after 3 h of induction with 0.1 % of L-arabinose; Lane 13, 14 – maxiprep

extraction after 4h of induction with 0.01 % of L-arabinose; Lane 15, 16 – maxiprep extraction after 4 h of

induction with 0.1 % of L-arabinose.

From maxiprep extraction after 2 h of induction with 0.001 % of L-arabinose

represented by the lane 1 and 2 it was obtained good efficiency of recombination (lane 1) but it

was not reproducible (lane 2). In the same way, after 3 h of induction with 0.1 % of L-

arabinose, it was obtained good efficiency of recombination (lane 11) but it was not

reproducible (lane 12). It was achieved a good recombination efficiency by using 2 h of

induction with 0.01 % of L-arabinose, represented by lane 3 and 4. A low recombination

efficiency was obtained when it was used 2 h of induction with 0.1 % of L-arabinose (lane 5 and

6), 3h of induction with 0.001 % of L-arabinose (lane 7 and 8), 3h of induction with 0.01 % of L-

arabinose (lane 9 and 10), 4 h of induction with 0.01 % of L-arabinose (lane 13 and 14), and,

and finally, 4 h of induction with 0.1 % of L-arabinose (lane 15 and 16). In general, it can be

concluded that for lower concentrations of L-arabinose there was low recombination efficiency

at different induction times. However, the mcDNA sample represented by lane 1 showed good

efficiency but was not reproducible. This may suggest that this concentration was insufficient

to promote efficient recombination. On the other hand, it can be concluded that for higher

concentrations of L-arabinose there was also low recombination efficiency at different

induction times. Nevertheless, the mcDNA sample represented by lane 11 showed good

PP 1 2 3 4 5 6 7 8 9 10 11 12 13 14 15 16 oc PP-p53 sc PP-p53 oc mcDNA-p53 sc mcDNA-p53

60

efficiency but was not reproducible which may be due to a possible cellular toxicity that the

inducer performs and/or due to saturation of the cellular receptors. The intermediate

concentration of inductor L-arabinose has shown the best recombination efficiency with

reduces the induction time.

Briefly, the best results of mcDNA production were obtained through 2 h of induction

with 0.01 % of L-arabinose. The conditions applied have advantages compared to other studies.

Namely the use of a lower concentration of inducer, in this case 0.01 % of L-arabinose, makes

the induction process cost-effective and more advantageous for industrial application,

compared to the 1% and 2% used in a previous studies [65, 64]. On the other hand, by using

lower induction times provides advantages by reducing process time to obtain the target

biomolecule, which is an important characteristic to apply this process at industrial scale. In

this case, when it was used 2 h of induction, it was reduced to half of time applied in other

studies. The used conditions are associated with higher yields of mcDNA accompanied by fewer

contaminants, namely PP. However, the complexity of the sample obtained at the end of

induction is one of the factors that difficult the mcDNA purification.

4.3 mcDNA-p53 Purification

In order to be possible the application of the mcDNA-p53 vector into a therapeutic

approach, it is necessary to purify the sc isoform, due to the fact that this isoform present the

highest bioactivity. For that, it was studied a new chromatographic column in order to explore

the simultaneous affinity character of two amino acid ligands (arginine and lysine) immobilized

in the same functional group (triazine) under ionic and hydrophobic binding/elution conditions.

This agarose column functionalized with triazine has already been studied but with another

purpose of application, namely, the recombinant proteins purification [67, 68]. This matrix,

being a functionalized agarose with triazine, brings some advantages, due to the fact that

matrix functionalization with two different amino acids that allows exploiting different type of

combinations. With these combinations it is possible to study diverse interactions between the

target biomolecule and the column. These columns also arise interest because they present fast

and simple manufacture and, one of the most important characteristic, is that they are much

more cost-effective. Thus, the chromatographic matrix preparation was performed according to

the protocol already described in 3.2.11.

After the ligands immobilization, the matrix was characterized by energy dispersive X-

ray spectroscopy (EDX) and zeta potential. It was evaluated the percentage of different atomic

elements, such as Carbon, Oxygen and Nitrogen by EDX in order to compare the agarose matrix

and triazine-agarose matrix functionalized with arginine and lysine. It was obtained a

percentage of 54.72 % of Carbon and 43.52 % of Oxygen for the agarose matrix (Table 10) and

61

for the triazine-agarose functionalized with the amino acids was obtained 50.73 % of Carbon,

43.20 % of Oxygen and 6.07 % of Nitrogen (Table 11).

Table 10. Agarose matrix analysed by energy dispersive X-ray spectroscopy.

Table 11. Triazine-agarose matrix functionalized with arginine and lysine amino acids analysed by energy

dispersive X-ray spectroscopy.

Through EDX results, it was concluded that the functionalization was successful due to

the fact that functionalized matrix contains nitrogen atoms associated with the amines of

amino acid ligands. On the other hand, comparing the result concerning the agarose matrix

with the functionalized matrix, the amount of carbon and oxygen atoms remains constant,

taking into account the associated errors.

The matrix was also analyzed by zeta potential to verify the overall load on the surface

of both matrices, the functionalized and the non-functionalized. For the agarose matrix was

obtained a zeta potential of -0,523, and for the triazine-agarose functionalized with arginine

and lysine was obtained a zeta potential of -16,225 (Table 12).

Element C Normal [wt.%] C Atomic [at.%] Error (2 Sigma) [wt.%]

Carbon 46.99 54.72 11.19 Oxygen 49.78 43.52 12.05 Sodium 1.92 1.17 0.31 Phosphorus 1.31 0.59 0,16

Total: 100.00 100.00

Element C Normal [wt.%] C Atomic [at.%] Error (2 Sigma) [wt.%]

Carbon 43.98 50.73 9.49 Oxygen 49.88 43.20 10.87 Nitrogen 6.14 6.07 1.76

Total: 100.00 100.00

62

Table 12. Zeta potential measurment of different matrices.

The results obtained in the Zeta potential shows that the agarose without

functionalization did not present an effective superficial charge, being the obtained values

near zero. However, the triazine-agarose functionalized with arginine and lysine ligands

obtained a negative zeta potential, possibly due to the fact of triazine contains an aromatic

ring, which can confer this overall result of charges even though arginine and lysine being two

positive amino acids [60].

For the chromatographic tests, a pre-purified mcDNA-p53 sample was used to give an

idea of the retention and elution profile of various components present in the sample. Firstly,

the binding and elution profile of the column was evaluated by using conditions that mainly

promote ionic or hydrophobic interactions. The chromatographic assays were performed in this

functionalized triazine-agarose column, with flow rate of 1.0 mL/min. In the study of ionic

conditions, the column was equilibrated with 10mM Tris buffer and after injection of 200 µL of

sample occurred the elution of a peak in the flowthgrough. Subsequently, an elution step was

performed with a stepwise gradient by increasing salt to 2 M NaCl at pH 8.0, and a second peak

was eluted (Figure 25A). By the analysis of the agarose gel electrophoresis of the fractions

collected from both peaks it was verified that the first peak corresponded to the mcDNA-p53

lysate elution and the second peak was the effect of salt increasing or the effect of impurities

such as proteins and endotoxins (Figure 25B). On the other hand, in the study of hydrophobic

conditions, the column was equilibrated with 3 M (NH4)2SO4 and after injection of 200 µL of

sample, occurred the elution of a small peak in the flowthgrough. Subsequently, an elution step

was performed with a stepwise gradient by decreasing the ionic strength to 10 mM Tris buffer

at pH 8.0, and a second peak was eluted (Figure 25C). By the analysis of the agarose gel

electrophoresis of the fractions collected from both peaks, it was verified that the first peak

corresponded to the ammonium sulfate presence or, as before, the effect of impurities and the

second peak was the mcDNA-p53 lysate elution (Figure 25D).

Zeta Potential

1 2 3 4 𝐗

Agarose Matrix -0,475 -0,571 - - -0,523

Triazine-Agarose functionalized with Arginine and Lysine -16,4 -13 -18,2 -17,3 -16,225

63

Figure 25. (A) Chromatographic profile of ionic conditions test. Elution was performed at 1.0mL/min by

applying a NaCl stepwise gradient from 10mM Tris buffer to 2 M NaCl (pH 8.0), as represented by the % B.

(B) Agarose gel electrophoresis of samples collected at the column outlet. Fractions corresponding to

peaks (1) and (2) are shown in lanes 1 and 2, respectively. (C) Chromatographic profile of hydrophobic

conditions test. Elution was performed at 1.0 mL/min by decreasing (NH4)2SO4 stepwise gradient from 3 M

(NH4)2SO4 to 10 mM Tris buffer (pH 8.0), as represented by the % B. (D) Agarose gel electrophoresis of

samples collected at the column outlet. Fractions corresponding to peaks (3), (4) and (5) are shown in

lanes 3-5, respectively.

The results of agarose gel electrophoresis showed that for the test of ionic condition,

the mcDNA sample did not bind to the matrix with Tris buffer, but using the hydrophobic

condition assay the mcDNA sample was bound to the matrix with 3 M (NH4)2SO4 and was eluted

with Tris buffer. Thus, as in the first case, the sample did not bind to the matrix it can be

concluded that there is not much influence of electrostatic interactions for the binding

conditions studied. On the other hand, the results indicate the involvement of hydrophobic

interactions between the species present in the sample and the ligands of the matrix because

only when ammonium sulfate was applied in the equilibrium buffer, it was observed the sample

binding to the matrix. Therefore, these interactions were weakened when Tris buffer was used,

being promoted the elution and recovery of the species retained in the column.

Arginine and lysine ligands have been already studied in the purification of pDNA by

affinity chromatography, being observed mainly the involvement of electrostatic interactions

[69, 70]. However, the versatility of these ligands was further explored for the isolation of

microRNAs through different elution strategies, among which successfully ammonium sulfate

was applied to promote the retention and elution of the different species present in the

1

2

1 2

0

50

100

150

200

250

300

350

400 mAU

0

20

40

60

80

100 %B

0.0 2.0 4.0 6.0 8.0 10.0 12.0 14.0 mL

(B)

(A)

3 4 5

0.0 5.0 10.0 15.0 20.0

0

50

100

150

200

250

300

350

400 mAU

0

20

40

60

80

100 %B

mL

3

4

5

(D)

(C)

64

sample. A similar behavior was observed in the present work when ammonium sulfate was used,

suggesting the involvement of hydrophobic interactions with the aliphatic chains of arginine

and lysine amino acids [60,61]. In addition, the aromatic ring of triazine group can establish п-п

stacking interactions with the nucleic acids bases [71, 72]. Moreover, the absence of

electrostatic interactions and the prevalence of hydrophobic interactions under the binding

studied conditions can also be justified by the zeta potential results that showed a negative

overall charge of the functionalized matrix, which can cause repulsion by nucleic acids.

Therefore, several elution gradients with ammonium sulfate were tested in order to

improve the mcDNA isolation. Initially, it was performed the total mcDNA sample binding into

the column, followed by elution and recovery of different components present in the sample.

So, the chromatographic assay was accomplished at a flow rate of 1.0 mL/min, the column was

equilibrated with 3 M (NH4)2SO4 and after the injection of 200 µL of sample the binding/elution

of different biomolecules occurred. For the elution step, a decreasing stepwise gradient was

applied to 1.5 M (NH4)2SO4, and to 10 mM Tris buffer at pH 8.0 (Figure 26A). One more time,

samples collected at the column outlet were analyzed by 0.8 % agarose gel electrophoresis.

(Figure 26B).

Figure 26. (A) Chromatographic profile of lysate using hydrophobic conditions. Elution was performed at

1.0 mL/min by decreasing stepwise gradient from 3 M (NH4)2SO4 to 1.5M (NH4)2SO4, and finally to 10 mM

Tris buffer (pH 8.0), as represented by the % B. (B) Agarose gel electrophoresis of samples collected at the

column outlet. Fractions corresponding to peaks (1)-(5) are shown in lanes 1-5, respectively. Lane S,

mcDNA-p53 sample injected onto the column.

0

50

100

150

200 mAU

0

20

40

60

80

100 %B

0.0 5.0 10.0 15.0 20.0 25.0 mL

1

2

3

4 5

(A)

S 1 2 3 4 5

(B)

oc PP-p53

oc mcDNA-p53 sc mcDNA-p53

sc PP-p53

65

In the previous result, we can observe that the sample completely bound to the column

with 3 M of ammonium sulfate. However, the decrease of salt concentration in stepwise

gradient did not allow good selectivity to isolate the mcDNA, being present in peaks 2, 3 and 4

eluted at different salt concentrations. Thus, in order to obtain the selectivity between PP and

mcDNA several tests were carried out. Taking into account the previous result, it was tested a

decreasing salt concentration in the binding step to 2.4 M (NH4)2SO4, still maintaining the same

procedure with stepwise gradient for half concentration of salt (1.2M (NH4)2SO4) at a flow rate

of 1.0 mL/min. So, after the column equilibration with 2.4 M (NH4)2SO4, 200 µL of sample was

injected and a first peak was obtained during the flowthrough. The bound species were eluted

in two peaks by decreasing the salt concentration to 1.2 M (NH4)2SO4 and 10 mM Tris buffer at

pH 8.0 (Figure 27A). Likewise, samples collected at the column outlet were analyzed by 0.8 %

agarose gel electrophoresis (Figure 27B).

Figure 27. (A) Chromatographic profile of lysate. Elution was performed at 1.0 mL/min by decreasing

(NH4)2SO4 stepwise gradient from 2.4 M (NH4)2SO4 to 1.2 M (NH4)2SO4, and finally to 10 mM Tris buffer (pH

8.0), as represented by the % B. (B) Agarose gel electrophoresis of samples collected at the column outlet.

Fractions corresponding to peaks (1), (2) and (3) are shown in lanes 1-3, respectively. Lane S, mcDNA-p53

sample injected onto the column. Lane PP, PP sample.

The previous assay shows that by decreasing of salt concentration in the binding step to

2.4 M (NH4)2SO4, the mixture of mcDNA did not bind to the column and was partially eluted in

the flowtrough (peak (1) and lane 1), and some PP was retained, being eluted in peak (2) as it

was observed in lane 2 of the agarose electrophoresis. The previous result seems promising and

so, it was decided to decrease the salt concentration in order to improve the column selectivity

1

0

20

40

60

80

100

120

140 mAU

0

20

40

60

80

%B

0.0 5.0 10.0 15.0 20.0 25.0 30.0 35.0 40.0 mL

2

3

S PP 1 2 3

oc PP-p53 sc PP-p53 oc mcDNA-p53 sc mcDNA-p53

(A) (B)

66

and to see if the mcDNA would elute completely in the first peak but maintaining the binding of

the PP. Therefore, the next chromatographic test was performed by using 2.1 M (NH4)2SO4 in

the equilibrium buffer at 1 mL/min and after the injection of 200 µL of sample, the first peak

was obtained in the flowthgrough. Afterwards, the ionic strength was decreased to 0.9 M

(NH4)2SO4 and to 10mM Tris buffer at pH 8.0 (Figure 28A). The samples collected at the column

outlet were analyzed by 0.8 % agarose gel electrophoresis. (Figure 28B).

Figure 28. (A) Chromatographic profile of lysate only with decreasing salt concentration. Elution was

performed at 1.0 mL/min by decreasing (NH4)2SO4 stepwise gradient from 2.1 M (NH4)2SO4 to 0.9 M

(NH4)2SO4 and finally to 10 mM Tris buffer (pH 8.0), as represented by the % B. (B) Agarose gel

electrophoresis of samples collected at the column outlet. Fractions corresponding to peaks (1), (2) and

(3) are shown in lanes 1-3, respectively. Lane S, mcDNA-p53 sample injected onto the column. Lane PP,

PP sample.

This chromatographic separation was more satisfactory than previous ones, being

achieved the total elution of mcDNA in the first peak with 2.1 M (NH4)2SO4, and the retained PP

was afterwards eluted with 0.9 M (NH4)2SO4. However, some contaminants of higher molecular

weight were also eluted together with the mcDNA, revealing that the complete isolation of

mcDNA was not accomplished. Another observed problem was the retention of some species in

the column that were only eluted during the column regeneration. This regeneration step was

conducted by using a flow rate of 0.5 mL/min with 0.1 M NaOH in 30 % isopropanol (v/v) and,

finally, Mili-Q water.

Nevertheless, since it is important to obtain the isolated sc mcDNA isoform for future

therapeutic applications, it was necessary to try other approaches in order to obtain more

satisfactory results and to improve the column selectivity. For that, different salt

0

100

200

300

400 mAU

0

20

40

60

80 %B

0.0 5.0 10.0 15.0 20.0 25.0 30.0 35.0 mL

1

2

3

S PP 1 2 3

oc mcDNA-p53 sc mcDNA-p53

sc PP-p53

oc PP-p53

(B) (A)

67

concentrations were tested along pH variations. Thus, a chromatographic assay was performed

by equilibrating the column with 3 M (NH4)2SO4 at pH 6.0 at 1 mL/min and after the injection of

200 µL of sample the binding/elution of the different biomolecules occurred. For the elution

step, a linear gradient was applied during 10 min by decreasing the ionic strength and

simultaneously increasing the pH from 3 M (NH4)2SO4 at pH 6.0 to 2.4 M (NH4)2SO4 at pH 8.0.

Finally, a stepwise gradient was applied by decreasing only the salt concentration to 0.7M

(NH4)2SO4 at pH 8.0 and to 10 mM Tris buffer at pH 8.0 (Figure 29A), being eluted one peak in

each step. The samples collected at the column outlet were analyzed by 0.8 % agarose gel

electrophoresis. (Figure 29B).

Figure 29. (A) Chromatographic profile of lysate with salt and pH variations. Elution was performed at

1.0 mL/min by decreasing (NH4)2SO4 linear gradient from 3 M (NH4)2SO4 (pH 6.0) to 2.4 M (NH4)2SO4 (pH

8.0), followed by decreasing (NH4)2SO4 stepwise gradient from 2.4 M (NH4)2SO4 (pH 8.0) to 0.7 M (NH4)2SO4

(pH 8.0), and finally to 10 mM Tris buffer (pH 8.0), as represented by the % B. (B) Agarose gel

electrophoresis of samples collected at the column outlet. Fractions corresponding to peaks (1)-(4) are

shown in lanes 1-4, respectively. Lane S, mcDNA-p53 sample injected onto the column. Lane PP, PP

sample.

With the last strategy, it was possible to obtain the highest yield of sc mcDNA in peak

(3), although it still contains some contaminants as it was observed in lane 3 of agarose

electrophoresis. This chromatographic profile can be justified by the variation of pH beyond the

decrease of ionic strength. Specifically, the acidic pH used in the equilibrium buffer could

increase the positive character of arginine and lysine ligands [70], which have basic pKas,

favoring the establishment of additional interactions between the sample and the matrix, such

as electrostatic interactions, cation-π interactions, hydrogen bonds and hydrogen-π

interactions [73]. Thus, it is suggested that the use of pH 6.0 can increase the effective bind of

the sc mcDNA to the column, due to the establishment of multiple interactions that are favored

with this molecule because of its more compact structure, which increases the charge density,

S PP 1 2 3 4

oc PP-p53 sc PP-p53 sc mcDNA-p53 sc mcDNA-p53

(B) (A)

0

50

100

150

200 mAU

0

20

40

60

80

100 %B

0.0 10.0 20.0 30.0 40.0 mL

1

2

3

4

0.0

2.0

4.0

6.0

8.0

10.0 pH

68

and the supercoiling phenomenon, which increase the aromatic bases exposition and

availability [66]. On the other hand, the increase of pH to 8.0 simultaneously with the decrease

of the salt concentration may have weakened the multiple interactions previously referred,

allowing a more effective elution of the sc mcDNA as it was observed in this result.

To summarize, from the obtained results we can suggest that the equilibrium strategy

with lower concentration of salt seems to favor the selectivity of the column, obtaining a

sample of sc mcDNA-p53 with lower content of impurities, although the total recovery of the

injected sample has been sacrificed. On the other hand, by using the strategy of effective

binding of the sample to the column and manipulating the pH seems to favor the recovery of sc

mcDNA-p53 despite containing some impurities. However, the results were not totally

satisfactory for future applications, because sc mcDNA was not completely isolated from other

contaminants. It is important to improve the purification strategy of this biomolecule since

mcDNA technology is recent and has not yet been widely explored and studied, being then a

promising alternative to pDNA.

4.4 In vitro transfection studies

The principle behind gene therapy relies on successful transfection of cells with nucleic

acids, which contain genetic information encoding a particular protein. Therefore, transfection

efficiency studies are extremely important in order to preliminary assess the ability of nucleic

acids to entre into the cells. For that, after transfection of HeLa cells with PP-p53 and mcDNA-

p53 obtained by NZYTech extraction kit, immunocytochemistry, PCR and western blot

techniques were performed with the intent of assessing the transfection efficiency, gene

transcription and protein expression.

4.4.1 Transfection efficiency analysis

To assess the transfection efficiency of different DNA vectors, the GFP fluorescence

was evaluated by immunocytochemistry. The GFP gene is frequently used as an expression

reporter and it is present in both DNA vectors (PP-p53 and mcDNA-p53). Thus, it was possible to

observe the cells transfected with these vectors because GFP exhibits bright green fluorescence

when exposed to UV light. Figure 30 presents different images taken from cultured cells, which

were transfected with different DNA vectors.

69

Figure 30. HeLa cells immunocytochemistry images for PP-p53 and mcDNA-p53 staining. The cell nuclei of

transfected cells with PP-p53 (48h) and mcDNA-p53 (48h) and non-transfected cells (Control)(48h) were

staining with DAPI and transfection efficiency was evaluated through GFP fluorescence.

In Figure 30, it is possible to visualize cell nuclei staining with DAPI. In the cases where

there is GFP staining, it is possible to confirm that HeLa cells were transfected with PP-p53 and

mcDNA-p53, although a low level of transfection efficiency is notorious. This occurs because

48h of incubation after transfection may not be enough to evaluate the GFP protein expression

or because the transfection agent used do not present a high efficiency at inducing cells

transfection with DNA vectors. Nevertheless, it can be suggested that mcDNA-p53 had higher

transfection efficiency than PP-p53, which is in accordance to the studies and advantages

presented for the mcDNA vector. This behavior probably occurs because mcDNA is a smaller

DAPI

GFP

MERGE

mcD

NA

-p53

PP

-p53

Cont

rol

70

vector than PP vector and devoid of bacterial sequences and antibiotic resistance that allows it

to have higher transfection efficiency compared to other vectors [52].

4.4.2 p53 gene transcription

In order to verify the transcription efficiency of p53 gene present into PP and mcDNA

vectors, PCR was performed. After 24 and 48 hours of transfection, transfected and non-

transfected cells were used for data comparison and the amplification of p53 transcripts was

performed with specifically designed primers. After this, samples were analyzed by 1 % agarose

gel electrophoresis (Figure 31).

Figure 31. Agarose gel electrophoresis of PCR amplification from HeLa transfected cells study. M- Marker;

C- - Negative control of PCR; Lane 1 – Non-transfected cells (24h); Lane 2- Transfected cells with PP-p53

(24h); Lane 3- Transfected cells with mcDNA-p53 (24h); Lane 4 – Non-transfected cells (48h); Lane 5 -

Transfected cells with PP-p53 (48h); Lane 6 - Transfected cells with mcDNA-p53 (48h).

As depicted in Figure 31, p53 transcripts were found in transfected cells for 24 h and 48

h. Both electrophoretic bands correspond to the intended amplification molecular weight, 286

bp. These data suggest that the transfection was successfully, occurring the p53 gene

transcription with both DNA vectors. It should be noted that cells transfected at 24 h had

M C- 1 2 3 4 5 6

71

higher amplification than at 48 h, probably due to the fact that these cells were already

translating some p53-mRNA transcripts into the respective protein or some mRNA was degraded

after 48 h since it is an instable molecule. On the other hand, no significant differences were

observed between the p53-mRNA transcripts of cells transfected with PP-p53 or with mcDNA-

p53 either 24 or 48 hours.

4.4.3 p53 protein expression

After p53 transcripts detection, the correct translation of the transcript into the

respective protein was evaluated. Following 72 hours of transfection, transfected and non-

transfected cells were submitted at protein extraction to verify p53 protein expression. Making

use of western blot technique, a comparison between PP-p53 and mcDNA-p53 transfected cells

and non-transfected cells was performed (Figure 33).

Figure 32. Western Blot of p53 and β-actin expression. Lane 1, 2 – Non-transfected cells (72h); Lane 3, 4 -

Transfected cells with PP-p53 (72h); Lane 5, 6 - Transfected cells with mcDNA-p53 (72h). C+ - Positive

control with prostate cancer cell line (DU145).

As shown in Figure 32, it can be observed that the staining p53 protein is identical for

cells transfected with both DNA vectors, while no band is presented in the control group (non-

transfected cells), as previously suggested by RT-PCR data. These results confirm the

expression of p53 protein in cervix cells (HeLa) transfected with PP-p53 and mcDNA-p53, which

present low expression or almost absent of the p53 tumor suppressor in the non-transfected

cells. It was also used a positive control to p53 expression through DU145 prostate cancer cell

line. After the confirmation of the p53 protein presence in transfected cells, normalization

with β-actin housekeeping was performed, by using the same electroblotting membrane. The β-

53 kDa

p53

C+ 1 2 3 4 5 6

42 kDa

β-actin

72

actin expression was equal between non-transfected and transfected cells. So, normalization

with β-actin allowed to verify the increased p53 protein expression in transfected cells,

compared to non-transfected cells. Likewise, as before it was used a positive control to p53

expression by using DU145 prostate cancer cell line.

To summarize, through transfection studies it was possible to evaluate the transfection

efficiency and subsequent gene transcription and translation of PP-p53 and mcDNA-p53

obtained by kit extraction. Firstly, by immunocytochemistry it was observed the PP-p53 and

mcDNA-p53 transfection, being more efficient with the mcDNA vector. By RT-PCR it was

evaluated the presence of p53 mRNA transcripts into HeLa transfected cells. However, in order

to achieve a correct and rigorous comparison between the p53 transcripts resulting from Hela

cells transfected with the different used expression vectors, real time PCR should be

considered. Finally, p53 protein translation/expression was confirmed by Western blot. Also in

this case, additional experiments should be performed in order to increase the replicates and

accomplish a significant and statistical evaluation of the produced protein from the cells

transfected with PP and mcDNA vectors. In addition, to make a correct comparison of

transfection efficiency, p53 transcription and expression between different vectors, it is

required the use of the purified sc mcDNA-p53 isoform, since the sample used in previous

studies was obtained from a commercial kit and is composed by PP and oc mcDNA molecules

beyond the required sc mcDNA.

73

CHAPTER V

74

75

Chapter V – Conclusions and Future Perspectives Nowadays, millions of people die each year from incurable diseases, because often

patients are resistant to drugs or no efficient therapies are available. Particularly, cervical

cancer caused by HPV infection kills a lot of women worldwide per year. This situation leads to

a great need for new therapeutic strategies, namely based on DNA delivery. Gene therapy has

appeared as a potential therapeutic approach, being a good solution to overcome some

problems and help to try fighting many diseases, namely several types of cancer. This approach

is based on the insertion of genetic material of interest into the cells that can correct a genetic

defect or supplement the level of a given protein that is not correctly produced.

However, for pDNA administration, it is necessary to meet the requirements imposed

by regulatory agencies, which recommend a homogeneity higher than 97% of sc pDNA, and for

that, several chromatographic techniques have been developed in order to achieve a strategy

that allows the application of this technology in therapies. This therapeutic biomolecule is

obtained by using recombinant organisms. However, these plasmids contain elements necessary

for production in bacteria that cause some adverse effects, already described in the literature.

In this context, mcDNA arises as useful alternative because it is constituted exclusively by the

part of plasmid that contains the eukaryotic expression genes, necessary for therapeutic gene

expression.

Thus, the present work was aimed to construct a mcDNA vector encoding p53 to

reestablish the levels of this tumor suppressor protein in cervical cancer cells and to induce

apoptosis. For that, initially, the mcDNA-p53 construction was started by cloning the p53-

encoding sequence into a parental plasmid (PP), and then E. coli ZYCY10P3S2T strain was

transformed by heat shock with the PP-p53 vector. This strain of E. coli was used because it

allows the PP recombination in mcDNA and miniplasmid. The mcDNA-p53 production was

optimized by variation the conditions of recombination step. A highest mcDNA-p53/PP-p53 ratio

was achieved by optimizing the recombination step using 0.01% of L-Arabinose and 2h of

induction.

After the production, a new chromatographic column was studied in order to try the

sc mcDNA-p53 purification from the other contaminants obtained in the recombination process.

For that, it was explored the simultaneous affinity character of two ligands, arginine and

lysine, immobilized in the same functional group, triazine. Firstly, ionic and hydrophobic

conditions were tested in this matrix, but the best results of purification were obtained by

mainly exploiting hydrophobic binding and elution conditions. One of the best obtained results

was achieved with equilibrium of the column with 2.1M (NH4)2SO4, being eluted a sample in the

flowthrough with a good content of mcDNA, and at the same time, part of the PP was retained

to the column being eluted with 0.9M (NH4)2SO4. However, the complete separation of mcDNA

from the remaining contaminants was not accomplished, although it showed some selectivity

76

between PP and mcDNA. On the other hand, the second best result was carried out by

decreasing the ionic strength and simultaneously increasing the pH from pH 6.0 to pH 8.0. This

assay allows the elution of a sample with a very good recovery of sc mcDNA-p53, although the

sample still presents some contaminants.

Afterwards, in vitro transfection studies were conducted by using HeLA cells, in

order to evaluate the transfection efficiency of PP and mcDNA vectors and the p53 expression.

Firstly, immunocytochemistry was performed and it was concluded that the transfection with

PP and mcDNA has occurred, being more efficient with mcDNA. Then, RT-PCR was performed to

evaluate the presence of p53 mRNA transcripts in transfected cells. Finally, p53 protein

expression was confirmed by Western blot, also in transfected cells.

In a future perspective, it is necessary to optimize the purification process of this

biomolecule, requiring a further characterization of this new chromatographic column through

the study of interactions established between the sample and this new chromatographic matrix

by using the Surface Plasmon Resonance and Nuclear Magnetic Resonance. These studies can

allow to explore new conditions in order to guarantee a better selectivity for the mcDNA. It is

also necessary to evaluate the purity of the purified sample by determination of proteins by the

Bicinchoninic Acid assay (BCA), endotoxins by Limulus Amebocyte Lysate assay (LAL), and gDNA

by real time PCR. Finally, it will be important to implement an analytical method to evaluate

the percentage of the sc isoform of mcDNA and the recovery obtained in the purification

strategy.

Since mcDNA-p53 is a vector with a therapeutic gene for future application, more in

vitro transfection studies in cervical cancer cells are required by using the purified sc mcDNA-

p53 isoform to evaluate the differences of transfection efficiency between this biomolecule and

PP. Furthermore, real time PCR and more western blot experiments were necessary to carry

out in order to be possible a realistic and statistical evaluation and comparison of the p53

transcription and expression in function of different vectors. Finally, flow cytometry studies

may also be performed to evaluate the biological effect of the p53 level conferred by the

mcDNA vector on cervical cancer cells, namely the apoptosis induction.

To conclude, with this work it was possible to construct a mcDNA vector with a

therapeutic gene, optimizing its production, revealing potential to be developed a gene

therapy in the future, and thus treat cervical cancer.

77

CHAPTER VI

78

79

Chapter VI – Bibliography 1. Hung, C.-F., Monie, A., Alvarez, R. D., & Wu, T.-C. (2007). DNA vaccines for cervical

cancer: from bench to bedside. Experimental and Molecular Medicine, 39, 679–689.

2. Frazer, I. H. (2004). Prevention of cervical cancer through papillomavirus vaccination.

Nature Reviews. Immunology, 4, 46–54.

3. Doorbar, J. (2006). Molecular biology of human papillomavirus infection and cervical

cancer. Clinical Science, 110, 525–541.

4. Doorbar, J., Egawa, N., Heather, G., Kranjec, C., & Murakami, I. (2015). Human

papillomavirus molecular biology and disease association. Reviews in Medical Virology,

25, 2–23.

5. Sanclemente, G., & Gill, D. K. (2002). Human papillomavirus molecular biology and

pathogenesis. Journal of the European Academy of Dermatology and Venereology, 16,

231–40.

6. Horner, S. M., Defilippis, R. A., Manuelidis, L., & Dimaio, D. (2004). Repression of the

Human Papillomavirus E6 Gene Initiates p53-Dependent, Telemorase-Independent

Senescence and Apoptosis in HeLa Cervical Carcinoma Cells. Journal of Virology, 78,

4063–4073.

7. Pang, C. L., & Thierry, F. (2013). Human papillomavirus proteins as prospective

therapeutic targets. Microbial Pathogenesis, 58, 55–65.

8. Vande Pol, S. B., & Klingelhutz, A. J. (2013). Papillomavirus E6 oncoproteins. Virology,

445, 115–137.

9. Park, T. -W, Fujiwara, H., & Wright, T. C. (1995). Molecular biology of cervical cancer

and its precursors. Cancer, 76, 1902–1913.

10. DeFilippis, R. A., Goodwin, E. C., Wu, L., & DiMaio, D. (2003). Endogenous human

papillomavirus E6 and E7 proteins differentially regulate proliferation, senescence, and

apoptosis in HeLa cervical carcinoma cells. Journal of Virology, 77, 1551–1563.

11. Bouchet, B. P., de Fromentel, C. C., Puisieux, A., & Galmarini, C. M. (2006). P53 As a

Target for Anti-Cancer Drug Development. Critical Reviews in Oncology/Hematology, 58,

190–207.

12. Junttila, M. R., & Evan, G. I. (2009). p53--a Jack of all trades but master of none.

Nature Reviews. Cancer, 9, 821–829.

13. Lane, D. P., Cheok, C. F., & Lain, S. (2010). p53-based Cancer Therapy. Cold Spring

Harbor Perspectives in Biology, 2, a001222–a001222.

14. Valente, J. F. A., Sousa, A., Queiroz, J. A., & Sousa, F. (2014). Selective purification of

supercoiled p53-encoding pDNA with l-methionine-agarose matrix. Analytical

Biochemistry, 459, 61–69.

80

15. Wang, T., Upponi, J. R., & Torchilin, V. P. (2012). Design of multifunctional non-viral

gene vectors to overcome physiological barriers: Dilemmas and strategies. International

Journal of Pharmaceutics, 427, 3–20.

16. Patil, S. D., Rhodes, D. G., & Burgess, D. J. (2005). DNA-based therapeutics and DNA

delivery systems: a comprehensive review. The American Association of Pharmaceutics

Scientists Journal, 7, E61–E77.

17. Grigsby, C. L., & Leong, K. W. (2010). Balancing protection and release of DNA  : tools to

address a bottleneck of non-viral gene delivery. Journal of the Royal Society Interface,

7, 67–82.

18. Wang, Q., Jiang, W., Chen, Y., Liu, P., Sheng, C., Chen, S., … Huang, W. (2014). In vivo

electroporation of minicircle DNA as a novel method of vaccine delivery to enhance HIV-

1-specific immune responses. Journal of Virology, 88, 1924–1934.

19. Stryjewska, A., Kiepura, K., Librowski, T., Lochyński, S., Lochynski, S., & Lochyñski, S.

(2013). Biotechnology and genetic engineering in the new drug development. Part II.

Monoclonal antibodies, modern vaccines and gene therapy. Pharmacological Reports,

65, 1086–1101.

20. Saade, F., & Petrovsky, N. (2012). Technologies for enhanced efficacy of DNA vaccines.

Expert Review of Vaccines, 11, 189–209.

21. Xu, Y., Yuen, P., & Lam, J. K. (2014). Intranasal DNA Vaccine for Protection against

Respiratory Infectious Diseases: The Delivery Perspectives. Pharmaceutics, 6, 378–415.

22. Monie, A., Tsen, S.-W. D., Hung, C.-F., & Wu, T.-C. (2010). Therapeutic HPV DNA

vaccines. Expert Review of Vaccines, 8, 1221–1235.

23. Li, Y.-L., Qi, X.-H., Shen, C., Liu, J.-N., & Zhang, J. (2010). Vaccination of full-length

HPV16 E6 or E7 protein inhibits the growth of HPV16 associated tumors. Oncology

Reports, 24, 1323–1329.

24. Ghanem, A., Healey, R., & Adly, F. G. (2013). Current trends in separation of plasmid

DNA vaccines: A review. Analytica Chimica Acta, 760, 1–15.

25. Ibraheem, D., Elaissari, A., & Fessi, H. (2014). Gene therapy and DNA delivery systems.

International Journal of Pharmaceutics, 459, 70–83.

26. Edelstein, M. L., Abedi, M. R., & Wixon, J. (2008). Gene transfer into guinea pig cochlea

using adeno-associated virus vectors. The Journal of Gene Medicine, 10, 610–618.

27. Prazeres, D. M. F., & Ferreira, G. N. M. (2004). Design of flowsheets for the recovery

and purification of plasmids for gene therapy and DNA vaccination. Chemical

Engineering and Processing: Process Intensification, 43, 615–630.

28. Nafissi, N., Alqawlaq, S., Lee, E. A., Foldvari, M., Spagnuolo, P. A., & Slavcev, R. A.

(2014). DNA ministrings: highly safe and effective gene delivery vectors. Molecular

therapy. Nucleic Acids, 3, e165.

29. Gao, X., Kim, K.-S., & Liu, D. (2007). Nonviral gene delivery: what we know and what is

next. The American Association of Pharmaceutics Scientists Journal, 9, 92–104.

81

30. Bouard, D., Alazard-Dany, D., & Cosset, F. L. (2009). Viral vectors: from virology to

transgene expression. British Journal of Pharmacology, 157, 153–165.

31. Rubanyi, G. M. (2001). The future of human gene therapy. Molecular Aspects of

Medicine, 22, 113–142.

32. Phillips, A. J. (2001). The challenge of gene therapy and DNA delivery. Journal of

Pharmacy and Pharmacology, 53, 1169–1174.

33. Liu, F., & Huang, L. (2002). Development of non-viral vectors for systemic gene

delivery. Journal of Controlled Release, 78, 259–266.

34. Mody, V., Siwale, R., Singh, A., & Mody, H. (2010). Introduction to metallic

nanoparticles. Journal of Pharmacy and Bioallied Sciences, 2, 282–289.

35. Slivac, I., Guay, D., Mangion, M., Champeil, J., & Gaillet, B. (2017). Non-viral nucleic

acid delivery methods. Expert Opinion on Biological Therapy, 17, 105–118.

36. Carnes, A. E., & Williams, J. a. (2007). Plasmid DNA manufacturing technology. Recent

Patents on Biotechnology, 1, 151–166.

37. Sousa, A., Tomaz, C. T., Sousa, F., & Queiroz, J. A. (2011). Successful application of

monolithic innovative technology using a carbonyldiimidazole disk to purify supercoiled

plasmid DNA suitable for pharmaceutical applications. Journal of Chromatography A,

1218, 8333–8343.

38. Oliveira, P. H., & Mairhofer, J. (2013). Marker-free plasmids for biotechnological

applications - implications and perspectives. Trends in Biotechnology, 31, 539–547.

39. Silva, F., Passarinha, L., Sousa, F., Queiroz, J. A., & Domingues, F. C. (2008). Influence

of Growth Conditions on Plasmid DNA Production. Journal of Microbiology

Biotechnology, 11, 1408–1414.

40. Sousa, A., Sousa, F., & Queiroz, J. A. (2010). Differential interactions of plasmid DNA,

RNA and genomic DNA with amino acid-based affinity matrices. Journal of Separation

Science, 33, 2610–2618.

41. Ferreira, G. N. M., Monteiro, G. A., Prazeres, D. M. F., & Cabral, J. M. S. (2000).

Downstream processing of plasmid DNA for gene therapy and DNA vaccine applications.

Trends in Biotechnology, 18, 380–388.

42. Šimčíková, M., Prather, K. L. J., Prazeres, D. M. F., & Monteiro, G. A. (2015). Towards

effective non-viral gene delivery vector. Biotechnology and Genetic Engineering

Reviews, 31, 82–107.

43. Liu, M. A., & Ulmer, J. B. (2005). Human Clinical Trials of Plasmid DNA Vaccines.

Advances in Genetics, 55, 25–40.

44. Diogoa, M. M., Queiroz, J. A., & Prazeresa, D. M. F. (2005). Chromatography of Plasmid

DNA. Journal of Chromatography A, 1069, 3–22.

45. Prazeres, D. M. F., Ferreira, G. N. M., Monteiro, G. A., Cooney, C. L., & Cabral, J. M. S.

(1999). Large-scale production of therapy  : problems and bottlenecks. Trends in

Biotechnology, 17, 169–174.

82

46. Sousa, F., Prazeres, D. M. F., & Queiroz, J. A. (2008). Affinity chromatography

approaches to overcome the challenges of purifying plasmid DNA. Trends in

Biotechnology, 26, 518–525.

47. Sousa, F., Passarinha, L., & Queiroz, J. A. (2009). Biomedical application of plasmid DNA

in gene therapy  : A new challenge for chromatography Biomedical. Biotechnology and

Genetic Engineering Reviews, 26, 83–116.

48. Almeida, A. M., Queiroz, J. A., Sousa, F., & Sousa, A. (2015). Optimization of

supercoiled HPV-16 E6/E7 plasmid DNA purification with arginine monolith using design

of experiments. Journal of Chromatography B, 978–979, 145–150.

49. Kobelt, D., Schleef, M., Schmeer, M., Aumann, J., Schlag, P. M., & Walther, W. (2013).

Performance of high quality minicircle DNA for in vitro and in vivo gene transfer.

Molecular Biotechnology, 53, 80–89.

50. Gracey Maniar, L. E., Maniar, J. M., Chen, Z.-Y., Lu, J., Fire, A. Z., & Kay, M. a. (2013).

Minicircle DNA vectors achieve sustained expression reflected by active chromatin and

transcriptional level. Molecular Therapy  : The Journal of the American Society of Gene

Therapy, 21, 131–138.

51. Cozzarelli, B. Y. N. R., Kelly, R. B., & Kornberg, A. (1968). A minute circular DNA from

Escheria coli 15*. Biochemistry, 60, 992–999.

52. Gaspar, V., Melo-Diogo, D. De, Costa, E., Moreira, A., Queiroz, J., Pichon, C., … Sousa,

F. (2015). Minicircle DNA vectors for gene therapy: advances and applications. Expert

Opinion on Biological Therapy, 15, 353–379.

53. Gaspar, V. M., Maia, C. J., Queiroz, J. a., Pichon, C., Correia, I. J., & Sousa, F. (2013).

Improved Minicircle DNA Biosynthesis for Gene Therapy Applications. Human Gene

Therapy Methods, 25, 93–105.

54. Darquet, A., Cameron, B., Wils, P., Scherman, D., & Crouzet, J. (1997). A new DNA

vehicle for nonviral gene delivery  : supercoiled minicircle. Gene Therapy, 4, 1341–1349.

55. Nafissi, N., & Slavcev, R. (2014). Bacteriophage recombination systems and biotechnical

applications. Applied Microbiology and Biotechnology, 98, 2841–2851.

56. Gaspar, V. M., Cruz, C., Queiroz, J. a., Pichon, C., Correia, I. J., & Sousa, F. (2017).

Highly selective capture of minicircle DNA biopharmaceuticals by a novel zinc-histidine

peptide conjugate. Separation and Purification Technology, 174, 417–424.

57. Alves, C. P. A., Simcíková, M., Brito, L., Monteiro, G. A., & Prazeres, D. M. F. (2016).

Development of a nicking endonuclease-assisted method for the purification of

minicircles. Journal of Chromatography A, 1443, 136–144.

58. Mayrhofer, P., Blaesen, M., Schleef, M., & Jechlinger, W. (2008). Minicircle-DNA

production by site specific recombination and protein-DNA interaction chromatography.

The Journal of Gene Medicine, 10, 1253–69.

59. Inoue, H., Nojima, H., & Okayama, H. (1990). Optimization of transformation of

Escherichia coli with plasmids. Gene, 96, 23–28.

83

60. Batalha, I. L., Zhou, H., Lilley, K., Lowe, C. R., & Roque, A. C. A. (2016). Mimicking

nature  : Phosphopeptide enrichment using combinatorial libraries of affinity ligands.

Journal of Chromatography A, 1457, 76–87.

61. O’Kennedy, R. D., Ward, J. M., & Keshavarz-Moore, E. (2003). Effects of fermentation

strategy on the characteristics of plasmid DNA production. Biotechnology and Applied

Biochemistry, 37, 83–90.

62. Tu, Z., He, G., Li, K. X., Chen, M. J., Chang, J., Chen, L., … Wu, X. (2005). An improved

system for competent cell preparation and high efficiency plasmid transformation using

different Escherichia coli strains. Electronic Journal of Biotechnology, 8, 114–120.

63. Zhong, C., You, C., Wei, P., & Zhang, Y. P. (2017). Simple Cloning by Prolonged Overlap

Extension-PCR with Application to the Preparation of Large-Size Random Gene

Mutagenesis Library in Escherichia coli. Synthetic DNA: Methods and Protocols, Methods

in Molecular Biology, 1472, 49–61.

64. Chang, T. Y., Chung, C. Y., Chuang, W. M., Li, L. Y., Jeng, L. Bin, & Ma, W. L. (2014).

Durable expression of minicircle DNA-liposome-delivered androgen receptor cDNA in

mice with hepatocellular carcinoma. BioMed Research International, 2014, 1–9.

65. Chen, Z.-Y., He, C.-Y., & Kay, M. a. (2005). Improved production and purification of

minicircle DNA vector free of plasmid bacterial sequences and capable of persistent

transgene expression in vivo. Human Gene Therapy, 16, 126–131.

66. Sousa, A., Sousa, F., & Queiroz, J. A. (2011). Impact of lysine-affinity chromatography

on supercoiled plasmid DNA purification. Journal of Chromatography B, 879, 3507–3515.

67. Pina, A. S., Dias, A. M. G. C., Ustok, F. I., El Khoury, G., Fernandes, C. S. M., Branco, R.

J. F., … Roque, A. C. A. (2015). Mild and cost-effective green fluorescent protein

purification employing small synthetic ligands. Journal of Chromatography A, 1418, 83–

93.

68. Sofia, A., Carvalho, S., Margarida, A., Dias, G. C., Guilherme, M., Pereira, A. S., …

Lowe, C. R. (2016). Tryptophan tags and de novo designed complementary affinity

ligands for the expression and purification of recombinant proteins. Journal of

Chromatography A, 1472, 55–65.

69. Soares, a., Queiroz, J. a., Sousa, F., & Sousa, A. (2013). Purification of human

papillomavirus 16 E6/E7 plasmid deoxyribonucleic acid-based vaccine using an arginine

modified monolithic support. Journal of Chromatography A, 1320, 72–79.

70. Almeida, A. M., Queiroz, J. A., Sousa, F., & Sousa, A. (2015). Optimization of

supercoiled HPV-16 E6 / E7 plasmid DNA purification with arginine monolith using design

of experiments. Journal of Chromatography B, 978–979, 145–150.

71. Sousa, A., Almeida, A. M., Cernigoj, U., Sousa, F., & Queiroz, J. A. (2014). Histamine

monolith versatility to purify supercoiled plasmid. Journal of Chromatography A, 1355,

125–133.

84

72. Amorim, L. F. A., Gaspar, R., Pereira, P., Cernigoj, U., Sousa, F., Queiroz, J. A., &

Sousa, Â. (2017). Chromatographic HPV-16 E6/E7 plasmid vaccine purification

employing. Electrophoresis Journal, 0, 1–6.

73. Sousa, Â., Pereira, P., Sousa, F., & Queiroz, J. A. (2014). Binding mechanisms for

histamine and agmatine ligands in plasmid deoxyribonucleic acid purifications. Journal

of Chromatography A, 1366, 110–119-


Recommended