68
minifacts about Norway 2015
minifacts about
Norway2015
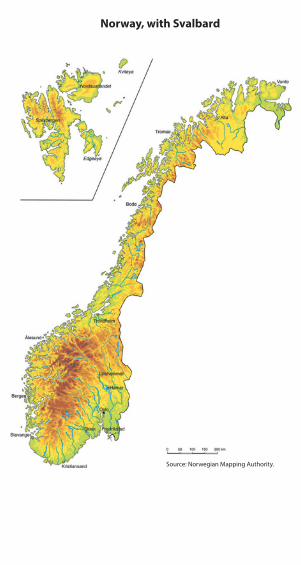
Norway, with Svalbard
Source: Norwegian Mapping Authority.
1
1. Government and elected representatives 2
2. Geography, climate and environment 6
3. Demographics, health and crime 10
4. Living conditions and consumption 19
5. Work and pay 21
6. Care services and social welfare 25
7. Education 27
8. Media and culture 32
9. Tourism and transportation 37
10. Industries 40
11. Energy 48
12. The economy 51
13. Norway abroad 55
14. The EEA and Norway Grants 57
15. Development cooperation 58
16. Foreign trade 60
17. Official flag days and public holidays in Norway 63
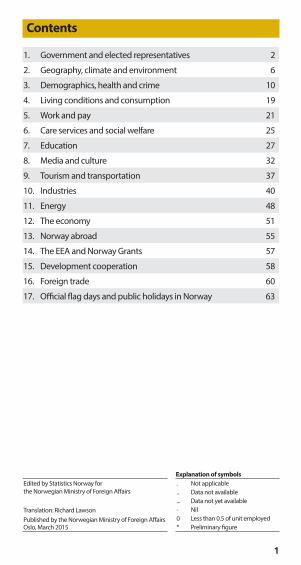
Contents
Explanation of symbols
. Not applicable
.. Data not available
... Data not yet available- Nil0 Less than 0.5 of unit employed* Preliminary figure
Edited by Statistics Norway for the Norwegian Ministry of Foreign Affairs
Translation: Richard LawsonPublished by the Norwegian Ministry of Foreign AffairsOslo, March 2015
2
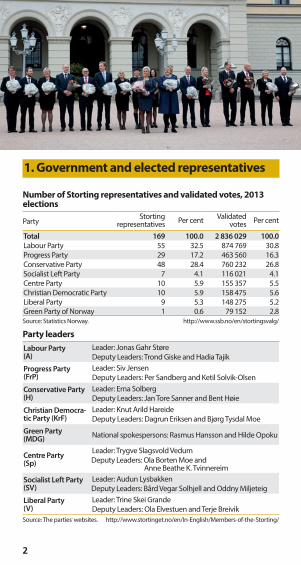
1. Government and elected representatives
Number of Storting representatives and validated votes, 2013 elections
PartyStorting
representatives Per cent Validated votes Per cent
Total 169 100.0 2 836 029 100.0
Labour Party 55 32.5 874 769 30.8Progress Party 29 17.2 463 560 16.3Conservative Party 48 28.4 760 232 26.8Socialist Left Party 7 4.1 116 021 4.1Centre Party 10 5.9 155 357 5.5Christian Democratic Party 10 5.9 158 475 5.6Liberal Party 9 5.3 148 275 5.2Green Party of Norway 1 0.6 79 152 2.8Source: Statistics Norway. http://www.ssb.no/en/stortingsvalg/
Party leaders
Labour Party (A)
Leader: Jonas Gahr StøreDeputy Leaders: Trond Giske and Hadia Tajik
Progress Party (FrP)
Leader: Siv JensenDeputy Leaders: Per Sandberg and Ketil Solvik-Olsen
Conservative Party (H)
Leader: Erna SolbergDeputy Leaders: Jan Tore Sanner and Bent Høie
Christian Democra-tic Party (KrF)
Leader: Knut Arild HareideDeputy Leaders: Dagrun Eriksen and Bjørg Tysdal Moe
Green Party (MDG)
National spokespersons: Rasmus Hansson and Hilde Opoku
Centre Party (Sp)
Leader: Trygve Slagsvold VedumDeputy Leaders: Ola Borten Moe and
Anne Beathe K. TvinnereimSocialist Left Party (SV)
Leader: Audun LysbakkenDeputy Leaders: Bård Vegar Solhjell and Oddny Miljeteig
Liberal Party (V)
Leader: Trine Skei GrandeDeputy Leaders: Ola Elvestuen and Terje Breivik
Source: The parties, websites. http://www.stortinget.no/en/In-English/Members-of-the-Storting/
3
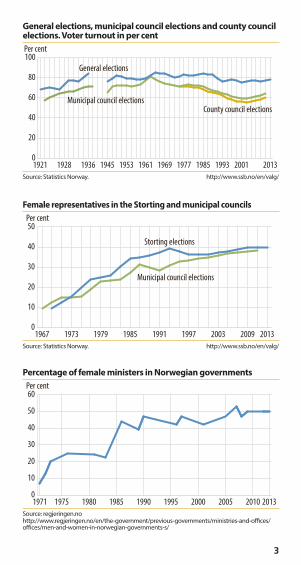
General elections, municipal council elections and county council elections. Voter turnout in per cent
Per cent
0
20
40
60
80
100
201320011993198519771969196119531945193619281921
County council electionsMunicipal council elections
General elections
Source: Statistics Norway. http://www.ssb.no/en/valg/
Female representatives in the Storting and municipal councils
Per cent
0
10
20
30
40
50
201320092003199719911985197919731967
Municipal council elections
Storting elections
Source: Statistics Norway. http://www.ssb.no/en/valg/
Percentage of female ministers in Norwegian governments
Per cent
0
10
20
30
40
50
60
2013201020052000199519901985198019751971
Source: regjeringen.no http://www.regjeringen.no/en/the-government/previous-governments/ministries-and-offices/offices/men-and-women-in-norwegian-governments-s/
4
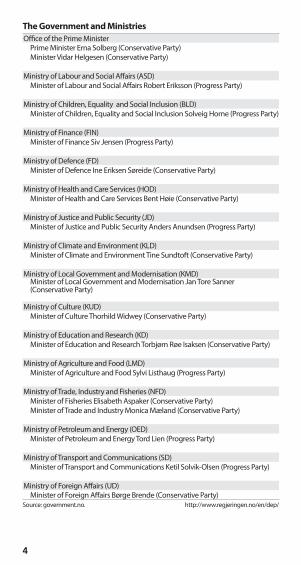
The Government and Ministries
Office of the Prime MinisterPrime Minister Erna Solberg (Conservative Party)Minister Vidar Helgesen (Conservative Party)
Ministry of Labour and Social Affairs (ASD)Minister of Labour and Social Affairs Robert Eriksson (Progress Party)
Ministry of Children, Equality and Social Inclusion (BLD)Minister of Children, Equality and Social Inclusion Solveig Horne (Progress Party)
Ministry of Finance (FIN)Minister of Finance Siv Jensen (Progress Party)
Ministry of Defence (FD)Minister of Defence Ine Eriksen Søreide (Conservative Party)
Ministry of Health and Care Services (HOD)Minister of Health and Care Services Bent Høie (Conservative Party)
Ministry of Justice and Public Security (JD)Minister of Justice and Public Security Anders Anundsen (Progress Party)
Ministry of Climate and Environment (KLD)Minister of Climate and Environment Tine Sundtoft (Conservative Party)
Ministry of Local Government and Modernisation (KMD)Minister of Local Government and Modernisation Jan Tore Sanner (Conservative Party)
Ministry of Culture (KUD)Minister of Culture Thorhild Widwey (Conservative Party)
Ministry of Education and Research (KD)Minister of Education and Research Torbjørn Røe Isaksen (Conservative Party)
Ministry of Agriculture and Food (LMD)Minister of Agriculture and Food Sylvi Listhaug (Progress Party)
Ministry of Trade, Industry and Fisheries (NFD)Minister of Fisheries Elisabeth Aspaker (Conservative Party)Minister of Trade and Industry Monica Mæland (Conservative Party)
Ministry of Petroleum and Energy (OED)Minister of Petroleum and Energy Tord Lien (Progress Party)
Ministry of Transport and Communications (SD)Minister of Transport and Communications Ketil Solvik-Olsen (Progress Party)
Ministry of Foreign Affairs (UD)Minister of Foreign Affairs Børge Brende (Conservative Party)
Source: government.no. http://www.regjeringen.no/en/dep/
5
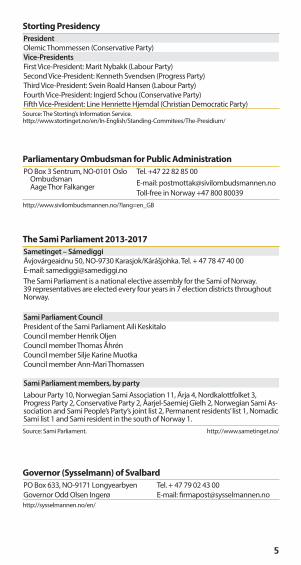
Storting Presidency
President
Olemic Thommessen (Conservative Party)Vice-Presidents
First Vice-President: Marit Nybakk (Labour Party)Second Vice-President: Kenneth Svendsen (Progress Party)Third Vice-President: Svein Roald Hansen (Labour Party)Fourth Vice-President: Ingjerd Schou (Conservative Party)Fifth Vice-President: Line Henriette Hjemdal (Christian Democratic Party)Source: The Storting’s Information Service. http://www.stortinget.no/en/In-English/Standing-Commitees/The-Presidium/
The Sami Parliament 2013-2017
Sametinget – Sámediggi
Ávjovárgeaidnu 50, NO-9730 Karasjok/Kárášjohka. Tel. + 47 78 47 40 00E-mail: [email protected] Sami Parliament is a national elective assembly for the Sami of Norway. 39 representatives are elected every four years in 7 election districts throughout Norway.
Sami Parliament Council
President of the Sami Parliament Aili KeskitaloCouncil member Henrik OljenCouncil member Thomas ÅhrénCouncil member Silje Karine MuotkaCouncil member Ann-Mari Thomassen
Sami Parliament members, by party
Labour Party 10, Norwegian Sami Association 11, Árja 4, Nordkalottfolket 3, Progress Party 2, Conservative Party 2, Åarjel-Saemiej Gïelh 2, Norwegian Sami As-sociation and Sami People’s Party’s joint list 2, Permanent residents’ list 1, Nomadic Sami list 1 and Sami resident in the south of Norway 1.Source: Sami Parliament. http://www.sametinget.no/
Parliamentary Ombudsman for Public Administration
PO Box 3 Sentrum, NO-0101 Oslo Tel. +47 22 82 85 00Ombudsman Aage Thor Falkanger E-mail: [email protected]
Toll-free in Norway +47 800 80039http://www.sivilombudsmannen.no/?lang=en_GB
Governor (Sysselmann) of Svalbard
PO Box 633, NO-9171 Longyearbyen Tel. + 47 79 02 43 00Governor Odd Olsen Ingerø E-mail: [email protected]://sysselmannen.no/en/
6
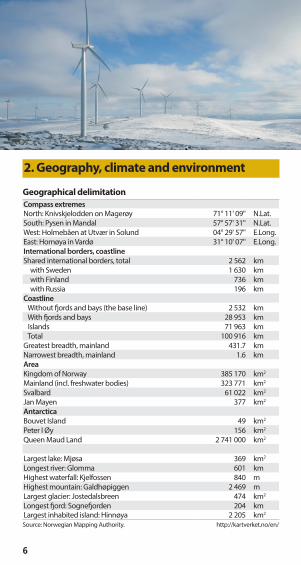
Geographical delimitation
Compass extremes
North: Knivskjelodden on Magerøy 71° 11' 09'' N.Lat.South: Pysen in Mandal 57° 57' 31'' N.Lat.West: Holmebåen at Utvær in Solund 04° 29' 57'' E.Long.East: Hornøya in Vardø 31° 10' 07'' E.Long.International borders, coastline
Shared international borders, total 2 562 kmwith Sweden 1 630 kmwith Finland 736 kmwith Russia 196 km
Coastline
Without fjords and bays (the base line) 2 532 km With fjords and bays 28 953 km Islands 71 963 km Total 100 916 kmGreatest breadth, mainland 431.7 kmNarrowest breadth, mainland 1.6 kmArea
Kingdom of Norway 385 170 km2
Mainland (incl. freshwater bodies) 323 771 km2
Svalbard 61 022 km2
Jan Mayen 377 km2
Antarctica
Bouvet Island 49 km2
Peter I Øy 156 km2
Queen Maud Land 2 741 000 km2
Largest lake: Mjøsa 369 km2
Longest river: Glomma 601 kmHighest waterfall: Kjelfossen 840 mHighest mountain: Galdhøpiggen 2 469 mLargest glacier: Jostedalsbreen 474 km2
Longest fjord: Sognefjorden 204 kmLargest inhabited island: Hinnøya 2 205 km2
Source: Norwegian Mapping Authority. http://kartverket.no/en/
2. Geography, climate and environment
7
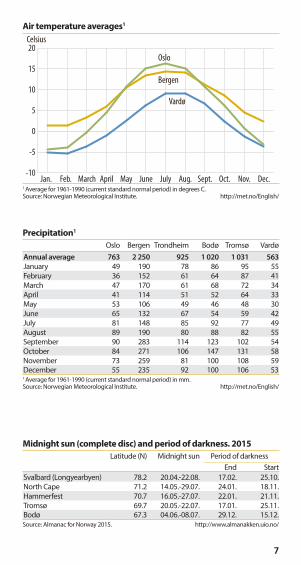
Air temperature averages1
Celsius
-10
-5
0
5
10
15
20
Dec.Nov.Oct.Sept.Aug.JulyJuneMayAprilMarchFeb. Jan.
Oslo
Bergen
Vardø
1 Average for 1961-1990 (current standard normal period) in degrees C. Source: Norwegian Meteorological Institute. http://met.no/English/
Precipitation1
Oslo Bergen Trondheim Bodø Tromsø VardøAnnual average 763 2 250 925 1 020 1 031 563
January 49 190 78 86 95 55February 36 152 61 64 87 41March 47 170 61 68 72 34April 41 114 51 52 64 33May 53 106 49 46 48 30June 65 132 67 54 59 42July 81 148 85 92 77 49August 89 190 80 88 82 55September 90 283 114 123 102 54October 84 271 106 147 131 58November 73 259 81 100 108 59December 55 235 92 100 106 531 Average for 1961-1990 (current standard normal period) in mm.Source: Norwegian Meteorological Institute. http://met.no/English/
Midnight sun (complete disc) and period of darkness. 2015
Latitude (N) Midnight sun Period of darknessEnd Start
Svalbard (Longyearbyen) 78.2 20.04.-22.08. 17.02. 25.10.North Cape 71.2 14.05.-29.07. 24.01. 18.11.Hammerfest 70.7 16.05.-27.07. 22.01. 21.11.Tromsø 69.7 20.05.-22.07. 17.01. 25.11.Bodø 67.3 04.06.-08.07. 29.12. 15.12.Source: Almanac for Norway 2015. http://www.almanakken.uio.no/
8
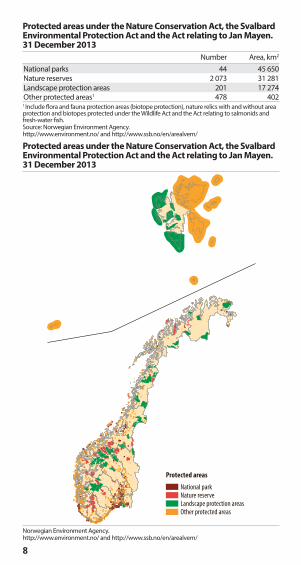
Protected areas under the Nature Conservation Act, the Svalbard Environmental Protection Act and the Act relating to Jan Mayen. 31 December 2013
Number Area, km2
National parks 44 45 650Nature reserves 2 073 31 281Landscape protection areas 201 17 274Other protected areas1 478 4021 Include flora and fauna protection areas (biotope protection), nature relics with and without area protection and biotopes protected under the Wildlife Act and the Act relating to salmonids and fresh-water fish. Source: Norwegian Environment Agency. http://www.environment.no/ and http://www.ssb.no/en/arealvern/
Protected areas under the Nature Conservation Act, the Svalbard Environmental Protection Act and the Act relating to Jan Mayen. 31 December 2013
Protected areas
National parkNature reserveLandscape protection areasOther protected areas
Norwegian Environment Agency. http://www.environment.no/ and http://www.ssb.no/en/arealvern/
9
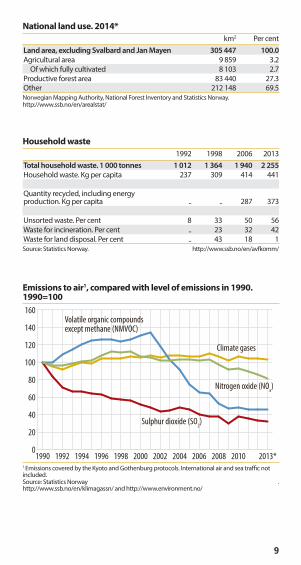
National land use. 2014*
km2 Per centLand area, excluding Svalbard and Jan Mayen 305 447 100.0
Agricultural area 9 859 3.2Of which fully cultivated 8 103 2.7
Productive forest area 83 440 27.3Other 212 148 69.5Norwegian Mapping Authority, National Forest Inventory and Statistics Norway.http://www.ssb.no/en/arealstat/
Household waste
1992 1998 2006 2013Total household waste. 1 000 tonnes 1 012 1 364 1 940 2 255
Household waste. Kg per capita 237 309 414 441
Quantity recycled, including energy production. Kg per capita .. .. 287 373
Unsorted waste. Per cent 8 33 50 56Waste for incineration. Per cent .. 23 32 42Waste for land disposal. Per cent .. 43 18 1Source: Statistics Norway. http://www.ssb.no/en/avfkomm/
Emissions to air1, compared with level of emissions in 1990. 1990=100
0
20
40
60
80
100
120
140
160
2013*20102008200620042002200019981996199419921990
Volatile organic compounds except methane (NMVOC)
Sulphur dioxide (SO2)
Climate gases
Nitrogen oxide (NOx)
1 Emissions covered by the Kyoto and Gothenburg protocols. International air and sea traffic not included.Source: Statistics Norway . http://www.ssb.no/en/klimagassn/ and http://www.environment.no/
10
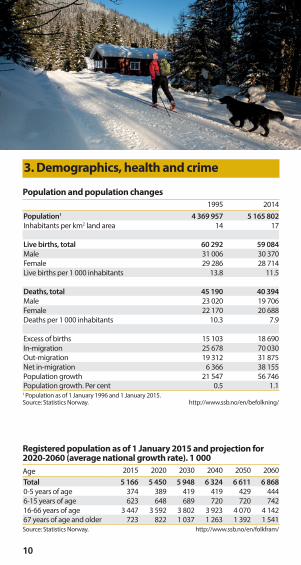
3. Demographics, health and crime
Population and population changes
1995 2014Population1 4 369 957 5 165 802
Inhabitants per km2 land area 14 17
Live births, total 60 292 59 084
Male 31 006 30 370Female 29 286 28 714Live births per 1 000 inhabitants 13.8 11.5
Deaths, total 45 190 40 394
Male 23 020 19 706Female 22 170 20 688Deaths per 1 000 inhabitants 10.3 7.9
Excess of births 15 103 18 690In-migration 25 678 70 030Out-migration 19 312 31 875Net in-migration 6 366 38 155Population growth 21 547 56 746Population growth. Per cent 0.5 1.11 Population as of 1 January 1996 and 1 January 2015. Source: Statistics Norway. http://www.ssb.no/en/befolkning/
Registered population as of 1 January 2015 and projection for 2020-2060 (average national growth rate). 1 000
Age 2015 2020 2030 2040 2050 2060Total 5 166 5 450 5 948 6 324 6 611 6 868
0-5 years of age 374 389 419 419 429 4446-15 years of age 623 648 689 720 720 74216-66 years of age 3 447 3 592 3 802 3 923 4 070 4 14267 years of age and older 723 822 1 037 1 263 1 392 1 541Source: Statistics Norway. http://www.ssb.no/en/folkfram/
11
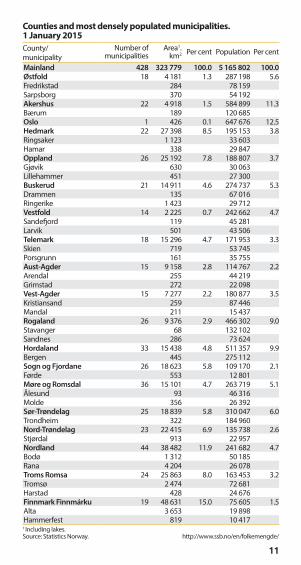
Counties and most densely populated municipalities. 1 January 2015
County/municipality
Number of municipalities
Area1. km2 Per cent Population Per cent
Mainland 428 323 779 100.0 5 165 802 100.0
Østfold 18 4 181 1.3 287 198 5.6Fredrikstad 284 78 159Sarpsborg 370 54 192Akershus 22 4 918 1.5 584 899 11.3Bærum 189 120 685Oslo 1 426 0.1 647 676 12.5Hedmark 22 27 398 8.5 195 153 3.8Ringsaker 1 123 33 603Hamar 338 29 847Oppland 26 25 192 7.8 188 807 3.7Gjøvik 630 30 063Lillehammer 451 27 300Buskerud 21 14 911 4.6 274 737 5.3Drammen 135 67 016Ringerike 1 423 29 712Vestfold 14 2 225 0.7 242 662 4.7Sandefjord 119 45 281Larvik 501 43 506Telemark 18 15 296 4.7 171 953 3.3Skien 719 53 745Porsgrunn 161 35 755Aust-Agder 15 9 158 2.8 114 767 2.2Arendal 255 44 219Grimstad 272 22 098Vest-Agder 15 7 277 2.2 180 877 3.5Kristiansand 259 87 446Mandal 211 15 437Rogaland 26 9 376 2.9 466 302 9.0Stavanger 68 132 102Sandnes 286 73 624Hordaland 33 15 438 4.8 511 357 9.9Bergen 445 275 112Sogn og Fjordane 26 18 623 5.8 109 170 2.1Førde 553 12 801Møre og Romsdal 36 15 101 4.7 263 719 5.1Ålesund 93 46 316Molde 356 26 392Sør-Trøndelag 25 18 839 5.8 310 047 6.0Trondheim 322 184 960Nord-Trøndelag 23 22 415 6.9 135 738 2.6Stjørdal 913 22 957Nordland 44 38 482 11.9 241 682 4.7Bodø 1 312 50 185Rana 4 204 26 078Troms Romsa 24 25 863 8.0 163 453 3.2Tromsø 2 474 72 681Harstad 428 24 676Finnmark Finnmárku 19 48 631 15.0 75 605 1.5Alta 3 653 19 898Hammerfest 819 10 417
1 Including lakes. Source: Statistics Norway. http://www.ssb.no/en/folkemengde/
12
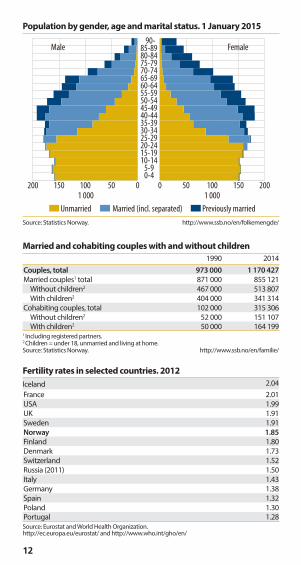
Population by gender, age and marital status. 1 January 2015
1 000 1 000200 150 100 50 0 0 50 100 150 200
0-4 5-910-1415-1920-2425-2930-3435-3940-4445-4950-5455-5960-6465-6970-7475-7980-8485-89 90-
Male Female
Married (incl. separated)Unmarried Previously married
Source: Statistics Norway. http://www.ssb.no/en/folkemengde/
Married and cohabiting couples with and without children
1990 2014Couples, total 973 000 1 170 427
Married couples1 total 871 000 855 121Without children2 467 000 513 807With children2 404 000 341 314
Cohabiting couples, total 102 000 315 306Without children2 52 000 151 107With children2 50 000 164 199
1 Including registered partners. 2 Children = under 18, unmarried and living at home.Source: Statistics Norway. http://www.ssb.no/en/familie/
Fertility rates in selected countries. 2012
Iceland 2.04France 2.01USA 1.99UK 1.91Sweden 1.91Norway 1.85
Finland 1.80Denmark 1.73Switzerland 1.52Russia (2011) 1.50Italy 1.43Germany 1.38Spain 1.32Poland 1.30Portugal 1.28Source: Eurostat and World Health Organization. http://ec.europa.eu/eurostat/ and http://www.who.int/gho/en/
13
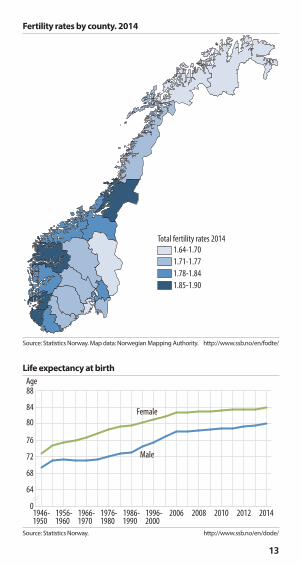
Life expectancy at birth
Age
0
64
68
72
76
80
84
88
201420122010200820061996-2000
1986-1990
1976-1980
1966-1970
1956-1960
1946-1950
Male
Female
Source: Statistics Norway. http://www.ssb.no/en/dode/
Fertility rates by county. 2014
1.64-1.70
1.71-1.77
1.78-1.84
1.85-1.90
Total fertility rates 2014
Source: Statistics Norway. Map data: Norwegian Mapping Authority. http://www.ssb.no/en/fodte/
14
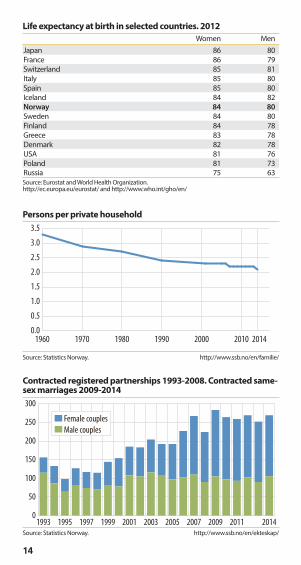
Life expectancy at birth in selected countries. 2012
Women MenJapan 86 80France 86 79Switzerland 85 81Italy 85 80Spain 85 80Iceland 84 82Norway 84 80
Sweden 84 80Finland 84 78Greece 83 78Denmark 82 78USA 81 76Poland 81 73Russia 75 63Source: Eurostat and World Health Organization. http://ec.europa.eu/eurostat/ and http://www.who.int/gho/en/
Persons per private household
1960 1970 1980 1990 2000 2010 20140.0
0.5
1.0
1.5
2.0
2.5
3.0
3.5
Source: Statistics Norway. http://www.ssb.no/en/familie/
Contracted registered partnerships 1993-2008. Contracted same-sex marriages 2009-2014
0
50
100
150
200
250
300
20142011200920072005200320011999199719951993
Female couples
Male couples
Source: Statistics Norway. http://www.ssb.no/en/ekteskap/
15
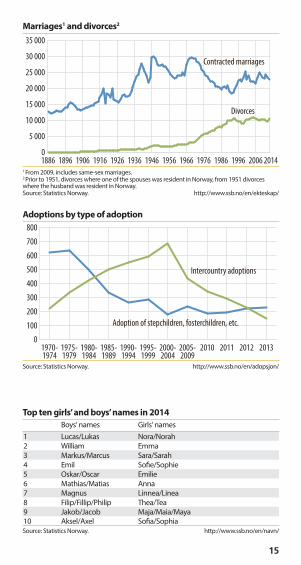
Marriages1 and divorces2
0
5 000
10 000
15 000
20 000
25 000
30 000
35 000
20142006199619861976196619561946193619261916190618961886
Divorces
Contracted marriages
1 From 2009, includes same-sex marriages.2 Prior to 1951, divorces where one of the spouses was resident in Norway, from 1951 divorces where the husband was resident in Norway.Source: Statistics Norway. http://www.ssb.no/en/ekteskap/
Adoptions by type of adoption
0
100
200
300
400
500
600
700
800
20132012201120102005-2009
2000-2004
1995-1999
1990-1994
1985-1989
1980-1984
1975-1979
1970-1974
Adoption of stepchildren, fosterchildren, etc.
Intercountry adoptions
Source: Statistics Norway. http://www.ssb.no/en/adopsjon/
Top ten girls’ and boys’ names in 2014
Boys' names Girls' names1 Lucas/Lukas Nora/Norah2 William Emma3 Markus/Marcus Sara/Sarah4 Emil Sofie/Sophie5 Oskar/Oscar Emilie6 Mathias/Matias Anna7 Magnus Linnea/Linea8 Filip/Fillip/Philip Thea/Tea9 Jakob/Jacob Maja/Maia/Maya10 Aksel/Axel Sofia/SophiaSource: Statistics Norway. http://www.ssb.no/en/navn/
16
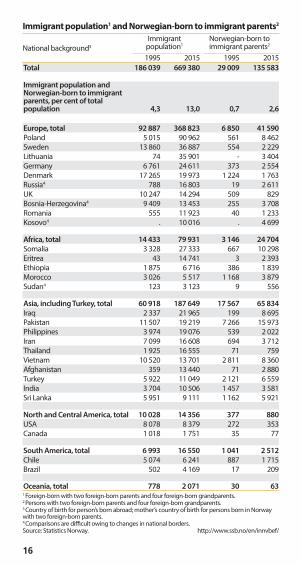
Immigrant population1 and Norwegian-born to immigrant parents2
National background3
Immigrant population1
Norwegian-born to immigrant parents2
1995 2015 1995 2015Total 186 039 669 380 29 009 135 583
Immigrant population and Norwegian-born to immigrant parents, per cent of total population 4,3 13,0 0,7 2,6
Europe, total 92 887 368 823 6 850 41 590
Poland 5 015 90 962 561 8 462Sweden 13 860 36 887 554 2 229Lithuania 74 35 901 - 3 404Germany 6 761 24 611 373 2 554Denmark 17 265 19 973 1 224 1 763Russia4 788 16 803 19 2 611UK 10 247 14 294 509 829Bosnia-Herzegovina4 9 409 13 453 255 3 708Romania 555 11 923 40 1 233Kosovo4 . 10 016 . 4 699
Africa, total 14 433 79 931 3 146 24 704
Somalia 3 328 27 333 667 10 298 Eritrea 43 14 741 3 2 393 Ethiopia 1 875 6 716 386 1 839 Morocco 3 026 5 517 1 168 3 879 Sudan4 123 3 123 9 556
Asia, including Turkey, total 60 918 187 649 17 567 65 834
Iraq 2 337 21 965 199 8 695Pakistan 11 507 19 219 7 266 15 973Philippines 3 974 19 076 539 2 022Iran 7 099 16 608 694 3 712Thailand 1 925 16 555 71 759Vietnam 10 520 13 701 2 811 8 360Afghanistan 359 13 440 71 2 880Turkey 5 922 11 049 2 121 6 559India 3 704 10 506 1 457 3 581Sri Lanka 5 951 9 111 1 162 5 921
North and Central America, total 10 028 14 356 377 880
USA 8 078 8 379 272 353Canada 1 018 1 751 35 77
South America, total 6 993 16 550 1 041 2 512
Chile 5 074 6 241 887 1 715Brazil 502 4 169 17 209
Oceania, total 778 2 071 30 631 Foreign-born with two foreign-born parents and four foreign-born grandparents.2 Persons with two foreign-born parents and four foreign-born grandparents.3 Country of birth for person’s born abroad; mother’s country of birth for persons born in Norway with two foreign-born parents.4 Comparisons are difficult owing to changes in national borders. Source: Statistics Norway. http://www.ssb.no/en/innvbef/
17
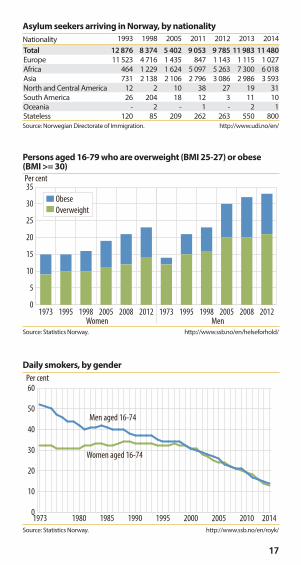
Asylum seekers arriving in Norway, by nationality
Nationality 1993 1998 2005 2011 2012 2013 2014Total 12 876 8 374 5 402 9 053 9 785 11 983 11 480
Europe 11 523 4 716 1 435 847 1 143 1 115 1 027Africa 464 1 229 1 624 5 097 5 263 7 300 6 018Asia 731 2 138 2 106 2 796 3 086 2 986 3 593North and Central America 12 2 10 38 27 19 31South America 26 204 18 12 3 11 10Oceania - 2 - 1 - 2 1Stateless 120 85 209 262 263 550 800Source: Norwegian Directorate of Immigration. http://www.udi.no/en/
Persons aged 16-79 who are overweight (BMI 25-27) or obese (BMI >= 30)
0
5
10
15
20
25
30
35
201220082005199819951973201220082005199819951973
Obese
Overweight
Per cent
Women MenSource: Statistics Norway. http://www.ssb.no/en/helseforhold/
Daily smokers, by gender
Per cent
0
10
20
30
40
50
60
201420102005200019951990198519801973
Men aged 16-74
Women aged 16-74
Source: Statistics Norway. http://www.ssb.no/en/royk/
18
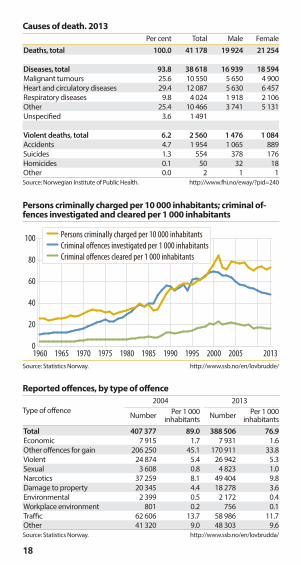
Causes of death. 2013
Per cent Total Male FemaleDeaths, total 100.0 41 178 19 924 21 254
Diseases, total 93.8 38 618 16 939 18 594
Malignant tumours 25.6 10 550 5 650 4 900Heart and circulatory diseases 29.4 12 087 5 630 6 457Respiratory diseases 9.8 4 024 1 918 2 106Other 25.4 10 466 3 741 5 131Unspecified 3.6 1 491
Violent deaths, total 6.2 2 560 1 476 1 084
Accidents 4.7 1 954 1 065 889Suicides 1.3 554 378 176Homicides 0.1 50 32 18Other 0.0 2 1 1Source: Norwegian Institute of Public Health. http://www.fhi.no/eway/?pid=240
Persons criminally charged per 10 000 inhabitants; criminal of-fences investigated and cleared per 1 000 inhabitants
0
20
40
60
80
100
20132005200019951990198519801975197019651960
Persons criminally charged per 10 000 inhabitants
Criminal offences investigated per 1 000 inhabitants
Criminal offences cleared per 1 000 inhabitants
Source: Statistics Norway. http://www.ssb.no/en/lovbrudde/
Reported offences, by type of offence
2004 2013Type of offence
Number Per 1 000 inhabitants Number Per 1 000
inhabitantsTotal 407 377 89.0 388 506 76.9
Economic 7 915 1.7 7 931 1.6Other offences for gain 206 250 45.1 170 911 33.8Violent 24 874 5.4 26 942 5.3Sexual 3 608 0.8 4 823 1.0Narcotics 37 259 8.1 49 404 9.8Damage to property 20 345 4.4 18 278 3.6Environmental 2 399 0.5 2 172 0.4Workplace environment 801 0.2 756 0.1Traffic 62 606 13.7 58 986 11.7Other 41 320 9.0 48 303 9.6Source: Statistics Norway. http://www.ssb.no/en/lovbrudda/
19
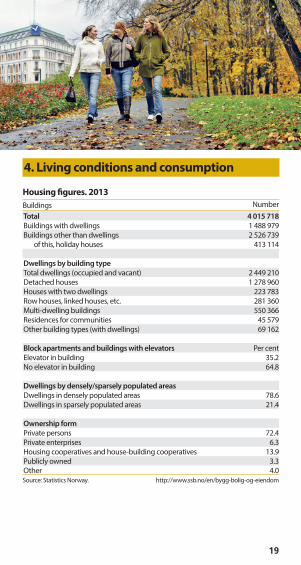
4. Living conditions and consumption
Housing figures. 2013
Buildings NumberTotal 4 015 718
Buildings with dwellings 1 488 979Buildings other than dwellings 2 526 739 of this, holiday houses 413 114
Dwellings by building type
Total dwellings (occupied and vacant) 2 449 210Detached houses 1 278 960Houses with two dwellings 223 783Row houses, linked houses, etc. 281 360Multi-dwelling buildings 550 366Residences for communities 45 579Other building types (with dwellings) 69 162
Block apartments and buildings with elevators Per centElevator in building 35.2No elevator in building 64.8
Dwellings by densely/sparsely populated areas
Dwellings in densely populated areas 78.6Dwellings in sparsely populated areas 21.4
Ownership form
Private persons 72.4Private enterprises 6.3Housing cooperatives and house-building cooperatives 13.9Publicly owned 3.3Other 4.0Source: Statistics Norway. http://www.ssb.no/en/bygg-bolig-og-eiendom
20
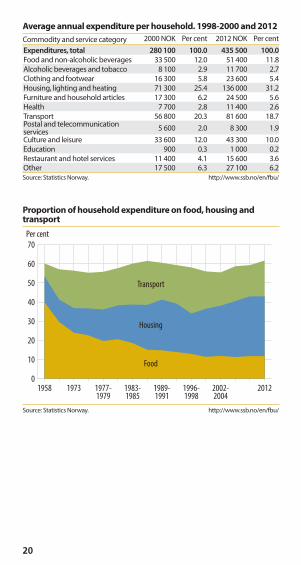
Average annual expenditure per household. 1998-2000 and 2012
Commodity and service category 2000 NOK Per cent 2012 NOK Per centExpenditures, total 280 100 100.0 435 500 100.0
Food and non-alcoholic beverages 33 500 12.0 51 400 11.8Alcoholic beverages and tobacco 8 100 2.9 11 700 2.7Clothing and footwear 16 300 5.8 23 600 5.4Housing, lighting and heating 71 300 25.4 136 000 31.2Furniture and household articles 17 300 6.2 24 500 5.6Health 7 700 2.8 11 400 2.6Transport 56 800 20.3 81 600 18.7Postal and telecommunication services 5 600 2.0 8 300 1.9Culture and leisure 33 600 12.0 43 300 10.0Education 900 0.3 1 000 0.2Restaurant and hotel services 11 400 4.1 15 600 3.6Other 17 500 6.3 27 100 6.2Source: Statistics Norway. http://www.ssb.no/en/fbu/
Proportion of household expenditure on food, housing and transport
Per cent
0
10
20
30
40
50
60
70
20122002-2004
1996-1998
1989-1991
1983-1985
1977-1979
19731958
Transport
Housing
Food
Source: Statistics Norway. http://www.ssb.no/en/fbu/
21
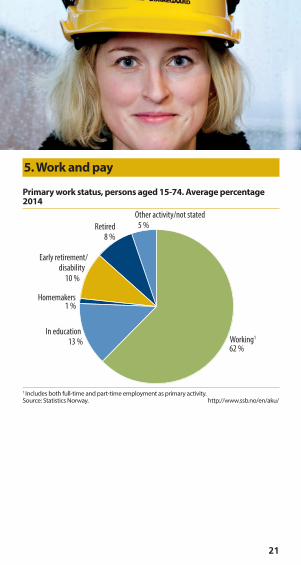
Primary work status, persons aged 15-74. Average percentage 2014
Other activity/not stated
Retired
Early retirement/disability
Homemakers
In educationWorking1 62 %
13 %
1 %
10 %
8 %
5 %
1 Includes both full-time and part-time employment as primary activity. Source: Statistics Norway. http://www.ssb.no/en/aku/
5. Work and pay
22
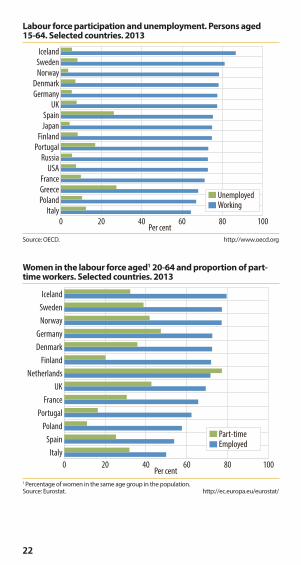
Labour force participation and unemployment. Persons aged 15-64. Selected countries. 2013
0 20 40 60 80 100
Italy
Poland
Greece
France
USA
Russia
Portugal
Finland
Japan
Spain
UK
Germany
Denmark
Norway
Sweden
Iceland
Per cent
UnemployedWorking
Source: OECD. http://www.oecd.org
Women in the labour force aged1 20-64 and proportion of part-time workers. Selected countries. 2013
0 20 40 60 80 100
Italy
Spain
Poland
Portugal
France
UK
Netherlands
Finland
Denmark
Germany
Norway
Sweden
Iceland
Per cent
Part-time Employed
1 Percentage of women in the same age group in the population. Source: Eurostat. http://ec.europa.eu/eurostat/
23
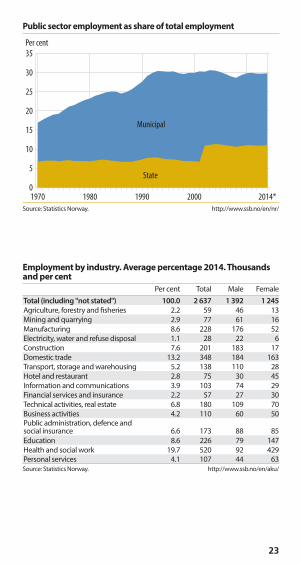
Public sector employment as share of total employment
Per cent
0
5
10
15
20
25
30
35
2014*2000199019801970
State
Municipal
Source: Statistics Norway. http://www.ssb.no/en/nr/
Employment by industry. Average percentage 2014. Thousands and per cent
Per cent Total Male FemaleTotal (including "not stated") 100.0 2 637 1 392 1 245
Agriculture, forestry and fisheries 2.2 59 46 13Mining and quarrying 2.9 77 61 16Manufacturing 8.6 228 176 52Electricity, water and refuse disposal 1.1 28 22 6Construction 7.6 201 183 17Domestic trade 13.2 348 184 163Transport, storage and warehousing 5.2 138 110 28Hotel and restaurant 2.8 75 30 45Information and communications 3.9 103 74 29Financial services and insurance 2.2 57 27 30Technical activities, real estate 6.8 180 109 70Business activities 4.2 110 60 50Public administration, defence and social insurance 6.6 173 88 85Education 8.6 226 79 147Health and social work 19.7 520 92 429Personal services 4.1 107 44 63Source: Statistics Norway. http://www.ssb.no/en/aku/
24
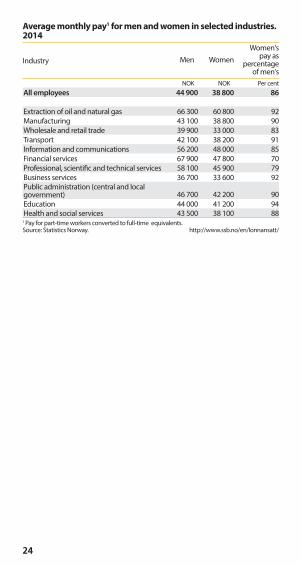
Average monthly pay1 for men and women in selected industries. 2014
Industry Men WomenWomen's
pay as percentage
of men'sNOK NOK Per cent
All employees 44 900 38 800 86
Extraction of oil and natural gas 66 300 60 800 92Manufacturing 43 100 38 800 90Wholesale and retail trade 39 900 33 000 83Transport 42 100 38 200 91Information and communications 56 200 48 000 85Financial services 67 900 47 800 70Professional, scientific and technical services 58 100 45 900 79Business services 36 700 33 600 92Public administration (central and local government) 46 700 42 200 90Education 44 000 41 200 94Health and social services 43 500 38 100 881 Pay for part-time workers converted to full-time equivalents. Source: Statistics Norway. http://www.ssb.no/en/lonnansatt/
25
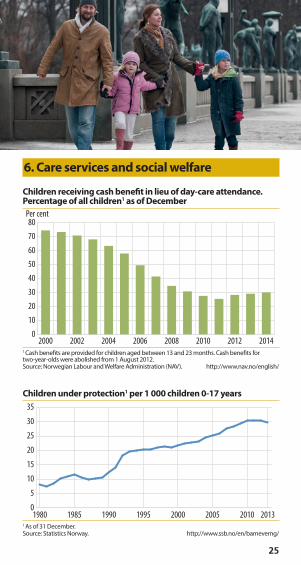
6. Care services and social welfare
Children receiving cash benefit in lieu of day-care attendance. Percentage of all children1 as of December
0
10
20
30
40
50
60
70
80
20142012201020082006200420022000
Per cent
1 Cash benefits are provided for children aged between 13 and 23 months. Cash benefits for two-year-olds were abolished from 1 August 2012.Source: Norwegian Labour and Welfare Administration (NAV). http://www.nav.no/english/
Children under protection1 per 1 000 children 0-17 years
0
5
10
15
20
25
30
35
201320102005200019951990198519801 As of 31 December. Source: Statistics Norway. http://www.ssb.no/en/barneverng/
26
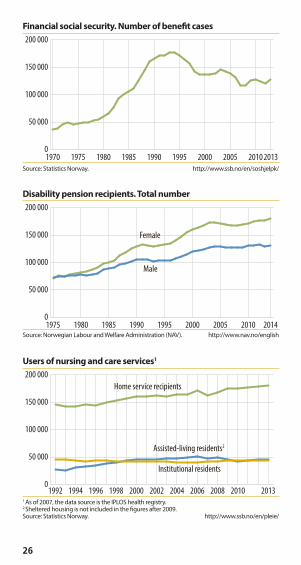
Financial social security. Number of benefit cases
0
50 000
100 000
150 000
200 000
2013201020052000199519901985198019751970
Source: Statistics Norway. http://www.ssb.no/en/soshjelpk/
Disability pension recipients. Total number
0
50 000
100 000
150 000
200 000
201420102005200019951990198519801975
Female
Male
Source: Norwegian Labour and Welfare Administration (NAV). http://www.nav.no/english
Users of nursing and care services1
0
50 000
100 000
150 000
200 000
20132010200820062004200220001998199619941992
Home service recipients
Institutional residents
Assisted-living residents2
1 As of 2007, the data source is the IPLOS health registry.2 Sheltered housing is not included in the figures after 2009.Source: Statistics Norway. http://www.ssb.no/en/pleie/
27
Kindergarten coverage1
0
10
20
30
40
50
60
70
80
90
100
20132010200520001995199019851980
Ages 1-2
Ages 1-5
Ages 3-5
Per cent
1 Proportion of children in kindergartens as percentage of children in corresponding age group.Source: Statistics Norway. http://www.ssb.no/en/barnehager/
7. Education
Pupils attending after-school care facilities
2000 2005 2014Total 121 867 133 282 158 139
Year 1 38 440 44 937 51 067Year 2 35 895 38 677 46 702Year 3 29 779 31 421 37 888Year 4 16 478 16 739 20 835Years 5 to 7 1 275 1 508 1 647Source: The information system for primary and lower secondary education. http://www.gsi.udir.no
28
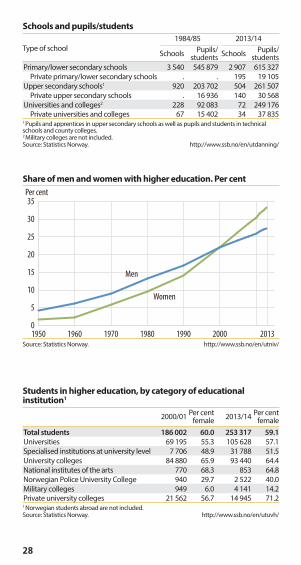
Schools and pupils/students
1984/85 2013/14Type of school
Schools Pupils/students Schools Pupils/
studentsPrimary/lower secondary schools 3 540 545 879 2 907 615 327
Private primary/lower secondary schools . . 195 19 105Upper secondary schools1 920 203 702 504 261 507
Private upper secondary schools . 16 936 140 30 568Universities and colleges2 228 92 083 72 249 176
Private universities and colleges 67 15 402 34 37 8351 Pupils and apprentices in upper secondary schools as well as pupils and students in technical schools and county colleges. 2 Military colleges are not included. Source: Statistics Norway. http://www.ssb.no/en/utdanning/
Share of men and women with higher education. Per cent
Per cent
1950 1960 1970 1980 1990 2000 20130
5
10
15
20
25
30
35
Women
Men
Source: Statistics Norway. http://www.ssb.no/en/utniv/
Students in higher education, by category of educational institution1
2000/01 Per cent female 2013/14 Per cent
femaleTotal students 186 002 60.0 253 317 59.1
Universities 69 195 55.3 105 628 57.1Specialised institutions at university level 7 706 48.9 31 788 51.5University colleges 84 880 65.9 93 440 64.4National institutes of the arts 770 68.3 853 64.8Norwegian Police University College 940 29.7 2 522 40.0Military colleges 949 6.0 4 141 14.2Private university colleges 21 562 56.7 14 945 71.21 Norwegian students abroad are not included. Source: Statistics Norway. http://www.ssb.no/en/utuvh/
29
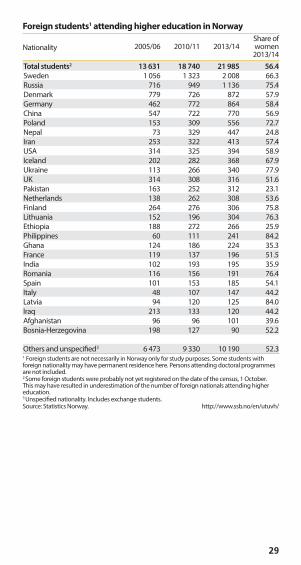
Foreign students1 attending higher education in Norway
Nationality 2005/06 2010/11 2013/14Share of women 2013/14
Total students2 13 631 18 740 21 985 56.4
Sweden 1 056 1 323 2 008 66.3Russia 716 949 1 136 75.4Denmark 779 726 872 57.9Germany 462 772 864 58.4China 547 722 770 56.9Poland 153 309 556 72.7Nepal 73 329 447 24.8Iran 253 322 413 57.4USA 314 325 394 58.9Iceland 202 282 368 67.9Ukraine 113 266 340 77.9UK 314 308 316 51.6Pakistan 163 252 312 23.1Netherlands 138 262 308 53.6Finland 264 276 306 75.8Lithuania 152 196 304 76.3Ethiopia 188 272 266 25.9Philippines 60 111 241 84.2Ghana 124 186 224 35.3France 119 137 196 51.5India 102 193 195 35.9Romania 116 156 191 76.4Spain 101 153 185 54.1Italy 48 107 147 44.2Latvia 94 120 125 84.0Iraq 213 133 120 44.2Afghanistan 96 96 101 39.6Bosnia-Herzegovina 198 127 90 52.2
Others and unspecified3 6 473 9 330 10 190 52.31 Foreign students are not necessarily in Norway only for study purposes. Some students with foreign nationality may have permanent residence here. Persons attending doctoral programmes are not included. 2 Some foreign students were probably not yet registered on the date of the census, 1 October. This may have resulted in underestimation of the number of foreign nationals attending higher education.3 Unspecified nationality. Includes exchange students.Source: Statistics Norway. http://www.ssb.no/en/utuvh/
30
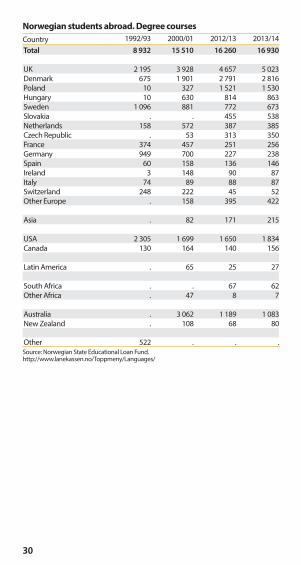
Norwegian students abroad. Degree courses
Country 1992/93 2000/01 2012/13 2013/14Total 8 932 15 510 16 260 16 930
UK 2 195 3 928 4 657 5 023Denmark 675 1 901 2 791 2 816Poland 10 327 1 521 1 530Hungary 10 630 814 863Sweden 1 096 881 772 673Slovakia . . 455 538Netherlands 158 572 387 385Czech Republic . 53 313 350France 374 457 251 256Germany 949 700 227 238Spain 60 158 136 146Ireland 3 148 90 87Italy 74 89 88 87Switzerland 248 222 45 52Other Europe . 158 395 422
Asia . 82 171 215
USA 2 305 1 699 1 650 1 834Canada 130 164 140 156
Latin America . 65 25 27
South Africa . . 67 62Other Africa . 47 8 7
Australia . 3 062 1 189 1 083New Zealand . 108 68 80
Other 522 . . .Source: Norwegian State Educational Loan Fund. http://www.lanekassen.no/Toppmeny/Languages/
31
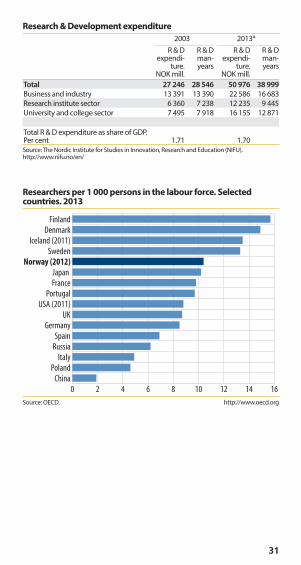
Research & Development expenditure
2003 2013*R & D
expendi-ture.
NOK mill.
R & D man-years
R & D expendi-
ture. NOK mill.
R & D man-years
Total 27 246 28 546 50 976 38 999
Business and industry 13 391 13 390 22 586 16 683Research institute sector 6 360 7 238 12 235 9 445University and college sector 7 495 7 918 16 155 12 871
Total R & D expenditure as share of GDP. Per cent 1.71 1.70Source: The Nordic Institute for Studies in Innovation, Research and Education (NIFU). http://www.nifu.no/en/
Researchers per 1 000 persons in the labour force. Selected countries. 2013
0 2 4 6 8 10 12 14 16
China
Poland
Italy
Russia
Spain
Germany
UK
USA (2011)
Portugal
France
Japan
Norway (2012)Sweden
Iceland (2011)
Denmark
Finland
Source: OECD. http://www.oecd.org
32
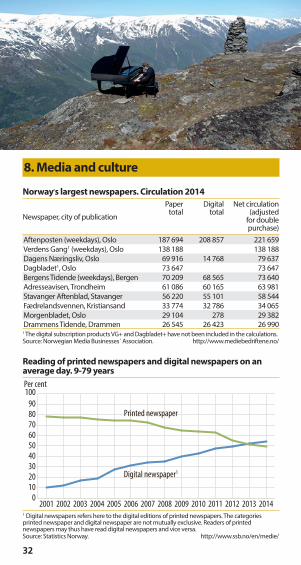
8. Media and culture
Norway,s largest newspapers. Circulation 2014
Newspaper, city of publication
Paper total
Digital total
Net circulation (adjusted
for double purchase)
Aftenposten (weekdays), Oslo 187 694 208 857 221 659Verdens Gang1 (weekdays), Oslo 138 188 138 188Dagens Næringsliv, Oslo 69 916 14 768 79 637Dagbladet1, Oslo 73 647 73 647Bergens Tidende (weekdays), Bergen 70 209 68 565 73 640Adresseavisen, Trondheim 61 086 60 165 63 981Stavanger Aftenblad, Stavanger 56 220 55 101 58 544Fædrelandsvennen, Kristiansand 33 774 32 786 34 065Morgenbladet, Oslo 29 104 278 29 382Drammens Tidende, Drammen 26 545 26 423 26 9901 The digital subscription products VG+ and Dagbladet+ have not been included in the calculations.Source: Norwegian Media Businesses΄ Association. http://www.mediebedriftene.no/
Reading of printed newspapers and digital newspapers on an average day. 9-79 years
0
10
20
30
40
50
60
70
80
90
100
20142013201220112010200920082007200620052004200320022001
Digital newspaper1
Printed newspaper
Per cent
1 Digital newspapers refers here to the digital editions of printed newspapers. The categories printed newspaper and digital newspaper are not mutually exclusive. Readers of printed newspapers may thus have read digital newspapers and vice versa.Source: Statistics Norway. http://www.ssb.no/en/medie/
33
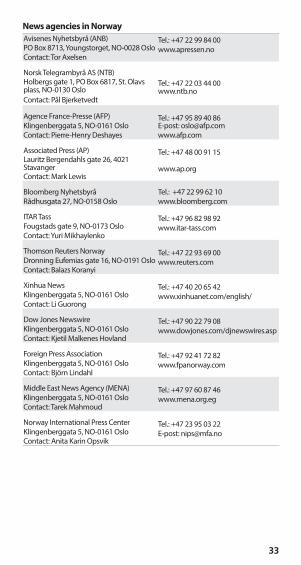
News agencies in Norway
Avisenes Nyhetsbyrå (ANB) Tel.: +47 22 99 84 00PO Box 8713, Youngstorget, NO-0028 Oslo www.apressen.noContact: Tor Axelsen
Norsk Telegrambyrå AS (NTB)Holbergs gate 1, PO Box 6817, St. Olavs plass, NO-0130 Oslo
Tel.: +47 22 03 44 00 www.ntb.no
Contact: Pål Bjerketvedt
Agence France-Presse (AFP) Tel.: +47 95 89 40 86Klingenberggata 5, NO-0161 Oslo E-post: [email protected]: Pierre-Henry Deshayes www.afp.com
Associated Press (AP) Tel.: +47 48 00 91 15Lauritz Bergendahls gate 26, 4021 Stavanger www.ap.orgContact: Mark Lewis
Bloomberg Nyhetsbyrå Tel.: +47 22 99 62 10Rådhusgata 27, NO-0158 Oslo www.bloomberg.com
ITAR Tass Tel.: +47 96 82 98 92Fougstads gate 9, NO-0173 Oslo www.itar-tass.comContact: Yuri Mikhaylenko
Thomson Reuters Norway Tel.: +47 22 93 69 00Dronning Eufemias gate 16, NO-0191 Oslo www.reuters.comContact: Balazs Koranyi
Xinhua News Tel.: +47 40 20 65 42Klingenberggata 5, NO-0161 Oslo www.xinhuanet.com/english/Contact: Li Guorong
Dow Jones Newswire Tel.: +47 90 22 79 08Klingenberggata 5, NO-0161 Oslo www.dowjones.com/djnewswires.aspContact: Kjetil Malkenes Hovland
Foreign Press Association Tel.: +47 92 41 72 82 Klingenberggata 5, NO-0161 Oslo www.fpanorway.comContact: Björn Lindahl
Middle East News Agency (MENA) Tel.: +47 97 60 87 46Klingenberggata 5, NO-0161 Oslo www.mena.org.egContact: Tarek Mahmoud
Norway International Press Center Tel.: +47 23 95 03 22Klingenberggata 5, NO-0161 Oslo E-post: [email protected]: Anita Karin Opsvik
34
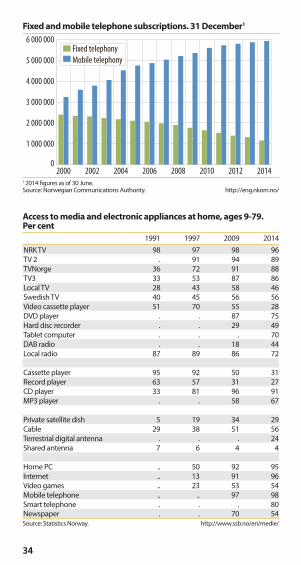
Fixed and mobile telephone subscriptions. 31 December1
0
1 000 000
2 000 000
3 000 000
4 000 000
5 000 000
6 000 000
20142012201020082006200420022000
Fixed telephony
Mobile telephony
1 2014 figures as of 30 June.Source: Norwegian Communications Authority. http://eng.nkom.no/
Access to media and electronic appliances at home, ages 9-79. Per cent
1991 1997 2009 2014NRK TV 98 97 98 96TV 2 . 91 94 89TVNorge 36 72 91 88TV3 33 53 87 86Local TV 28 43 58 46Swedish TV 40 45 56 56Video cassette player 51 70 55 28DVD player . . 87 75Hard disc recorder . . 29 49Tablet computer . . . 70DAB radio . . 18 44Local radio 87 89 86 72
Cassette player 95 92 50 31Record player 63 57 31 27CD player 33 81 96 91MP3 player . . 58 67
Private satellite dish 5 19 34 29Cable 29 38 51 56Terrestrial digital antenna . . . 24Shared antenna 7 6 4 4
Home PC .. 50 92 95Internet .. 13 91 96Video games .. 23 53 54Mobile telephone .. .. 97 98Smart telephone . . . 80Newspaper . . 70 54Source: Statistics Norway. http://www.ssb.no/en/medie/
35
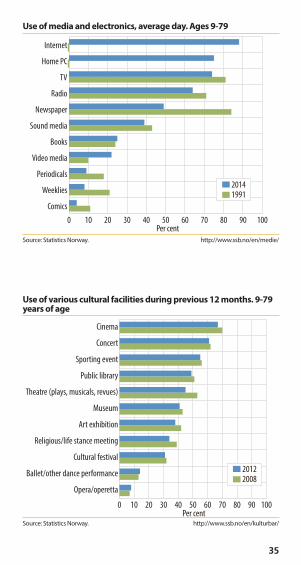
Use of media and electronics, average day. Ages 9-79
0 10 20 30 40 50 60 70 80 90 100
Comics
Weeklies
Periodicals
Video media
Books
Sound media
Newspaper
Radio
TV
Home PC
Internet
Per cent
20141991
Source: Statistics Norway. http://www.ssb.no/en/medie/
Use of various cultural facilities during previous 12 months. 9-79 years of age
0 10 20 30 40 50 60 70 80 90 100
Opera/operetta
Ballet/other dance performance
Cultural festival
Religious/life stance meeting
Art exhibition
Museum
Theatre (plays, musicals, revues)
Public library
Sporting event
Concert
Cinema
Per cent
20122008
Source: Statistics Norway. http://www.ssb.no/en/kulturbar/
36
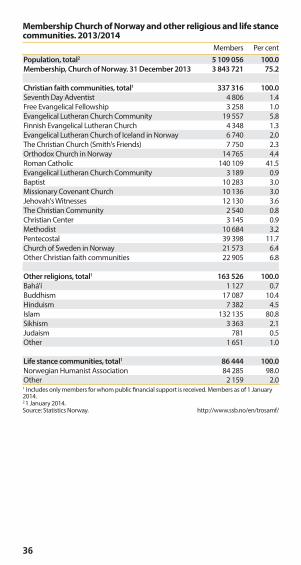
Membership Church of Norway and other religious and life stance communities. 2013/2014
Members Per centPopulation, total2 5 109 056 100.0
Membership, Church of Norway. 31 December 2013 3 843 721 75.2
Christian faith communities, total1 337 316 100.0
Seventh Day Adventist 4 806 1.4Free Evangelical Fellowship 3 258 1.0Evangelical Lutheran Church Community 19 557 5.8Finnish Evangelical Lutheran Church 4 348 1.3Evangelical Lutheran Church of Iceland in Norway 6 740 2.0The Christian Church (Smith's Friends) 7 750 2.3Orthodox Church in Norway 14 765 4.4Roman Catholic 140 109 41.5Evangelical Lutheran Church Community 3 189 0.9Baptist 10 283 3.0Missionary Covenant Church 10 136 3.0Jehovah's Witnesses 12 130 3.6The Christian Community 2 540 0.8Christian Center 3 145 0.9Methodist 10 684 3.2Pentecostal 39 398 11.7Church of Sweden in Norway 21 573 6.4Other Christian faith communities 22 905 6.8
Other religions, total1 163 526 100.0
Bahá'í 1 127 0.7Buddhism 17 087 10.4Hinduism 7 382 4.5Islam 132 135 80.8Sikhism 3 363 2.1Judaism 781 0.5Other 1 651 1.0
Life stance communities, total1 86 444 100.0
Norwegian Humanist Association 84 285 98.0Other 2 159 2.01 Includes only members for whom public financial support is received. Members as of 1 January 2014.2 1 January 2014.Source: Statistics Norway. http://www.ssb.no/en/trosamf/
37
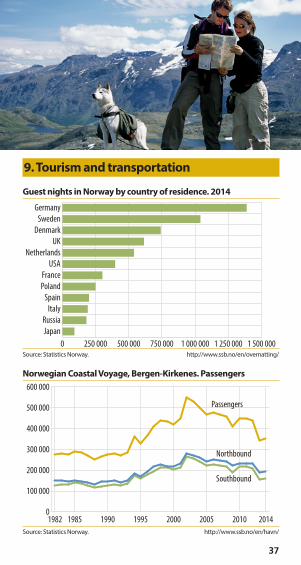
9. Tourism and transportation
Guest nights in Norway by country of residence. 2014
0 250 000 500 000 750 000 1 000 000 1 250 000 1 500 000
Japan
Russia
Italy
Spain
Poland
France
USA
Netherlands
UK
Denmark
Sweden
Germany
Source: Statistics Norway. http://www.ssb.no/en/overnatting/
Norwegian Coastal Voyage, Bergen-Kirkenes. Passengers
0
100 000
200 000
300 000
400 000
500 000
600 000
20142010200520001995199019851982
Northbound
Southbound
Passengers
Source: Statistics Norway. http://www.ssb.no/en/havn/
38
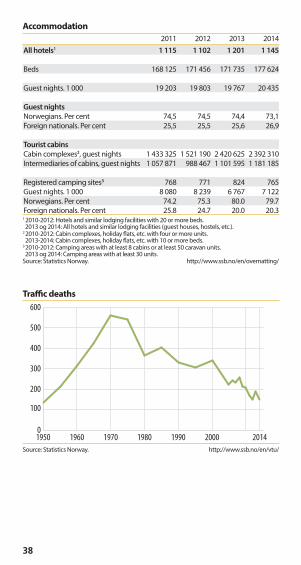
Accommodation
2011 2012 2013 2014All hotels1 1 115 1 102 1 201 1 145
Beds 168 125 171 456 171 735 177 624
Guest nights. 1 000 19 203 19 803 19 767 20 435
Guest nights
Norwegians. Per cent 74,5 74,5 74,4 73,1Foreign nationals. Per cent 25,5 25,5 25,6 26,9
Tourist cabins
Cabin complexes2, guest nights 1 433 325 1 521 190 2 420 625 2 392 310Intermediaries of cabins, guest nights 1 057 871 988 467 1 101 595 1 181 185
Registered camping sites3 768 771 824 765Guest nights. 1 000 8 080 8 239 6 767 7 122Norwegians. Per cent 74.2 75.3 80.0 79.7Foreign nationals. Per cent 25.8 24.7 20.0 20.31 2010-2012: Hotels and similar lodging facilities with 20 or more beds. 2013 og 2014: All hotels and similar lodging facilities (guest houses, hostels, etc.).2 2010-2012: Cabin complexes, holiday flats, etc. with four or more units. 2013-2014: Cabin complexes, holiday flats, etc. with 10 or more beds.3 2010-2012: Camping areas with at least 8 cabins or at least 50 caravan units. 2013 og 2014: Camping areas with at least 30 units.Source: Statistics Norway. http://www.ssb.no/en/overnatting/
Traffic deaths
1950 1960 1970 1980 1990 2000 20140
100
200
300
400
500
600
Source: Statistics Norway. http://www.ssb.no/en/vtu/
39
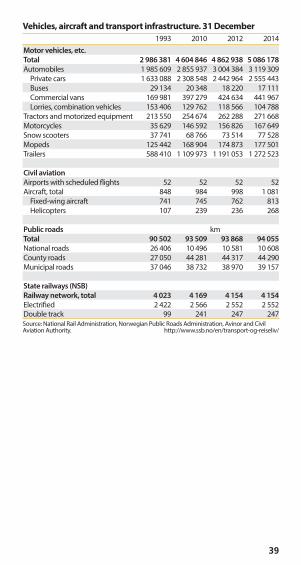
Vehicles, aircraft and transport infrastructure. 31 December
1993 2010 2012 2014Motor vehicles, etc.
Total 2 986 381 4 604 846 4 862 938 5 086 178
Automobiles 1 985 609 2 855 937 3 004 384 3 119 309Private cars 1 633 088 2 308 548 2 442 964 2 555 443Buses 29 134 20 348 18 220 17 111Commercial vans 169 981 397 279 424 634 441 967Lorries, combination vehicles 153 406 129 762 118 566 104 788
Tractors and motorized equipment 213 550 254 674 262 288 271 668Motorcycles 35 629 146 592 156 826 167 649Snow scooters 37 741 68 766 73 514 77 528Mopeds 125 442 168 904 174 873 177 501Trailers 588 410 1 109 973 1 191 053 1 272 523
Civil aviation
Airports with scheduled flights 52 52 52 52Aircraft, total 848 984 998 1 081
Fixed-wing aircraft 741 745 762 813Helicopters 107 239 236 268
Public roads kmTotal 90 502 93 509 93 868 94 055
National roads 26 406 10 496 10 581 10 608County roads 27 050 44 281 44 317 44 290Municipal roads 37 046 38 732 38 970 39 157
State railways (NSB)
Railway network, total 4 023 4 169 4 154 4 154
Electrified 2 422 2 566 2 552 2 552Double track 99 241 247 247Source: National Rail Administration, Norwegian Public Roads Administration, Avinor and Civil Aviation Authority. http://www.ssb.no/en/transport-og-reiseliv/
40
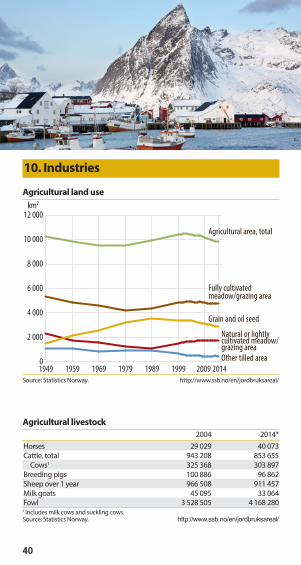
10. Industries
Agricultural land use
20141949 1959 1969 1979 1989 1999 20090
2 000
4 000
6 000
8 000
10 000
12 000km2
Other tilled area
Agricultural area, total
Fully cultivated meadow/grazing area
Grain and oil seed
Natural or lightly cultivated meadow/grazing area
Source: Statistics Norway. http://www.ssb.no/en/jordbruksareal/
Agricultural livestock
2004 2014*Horses 29 029 40 073Cattle, total 943 208 853 655
Cows1 325 368 303 897Breeding pigs 100 886 96 862Sheep over 1 year 966 508 911 457Milk goats 45 095 33 064Fowl 3 528 505 4 168 2801 Includes milk cows and suckling cows. Source: Statistics Norway. http://www.ssb.no/en/jordbruksareal/
41
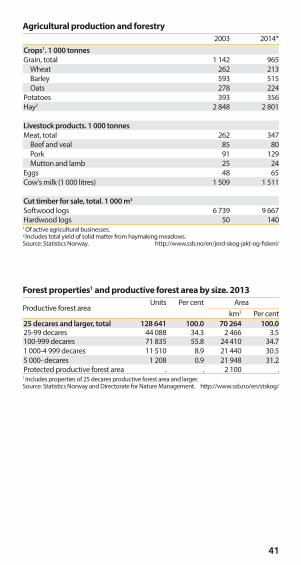
Agricultural production and forestry
2003 2014*Crops1. 1 000 tonnes
Grain, total 1 142 965Wheat 262 213Barley 593 515Oats 278 224
Potatoes 393 356Hay2 2 848 2 801
Livestock products. 1 000 tonnes
Meat, total 262 347Beef and veal 85 80Pork 91 129Mutton and lamb 25 24
Eggs 48 65Cow's milk (1 000 litres) 1 509 1 511
Cut timber for sale, total. 1 000 m3
Softwood logs 6 739 9 667Hardwood logs 50 1401 Of active agricultural businesses.2 Includes total yield of solid matter from haymaking meadows.Source: Statistics Norway. http://www.ssb.no/en/jord-skog-jakt-og-fiskeri/
Forest properties1 and productive forest area by size. 2013
Productive forest areaUnits Per cent Area
km2 Per cent25 decares and larger, total 128 641 100.0 70 264 100.025-99 decares 44 088 34.3 2 466 3.5100-999 decares 71 835 55.8 24 410 34.71 000-4 999 decares 11 510 8.9 21 440 30.55 000- decares 1 208 0.9 21 948 31.2Protected productive forest area . . 2 100 .1 Includes properties of 25 decares productive forest area and larger. Source: Statistics Norway and Directorate for Nature Management. http://www.ssb.no/en/stskog/
42
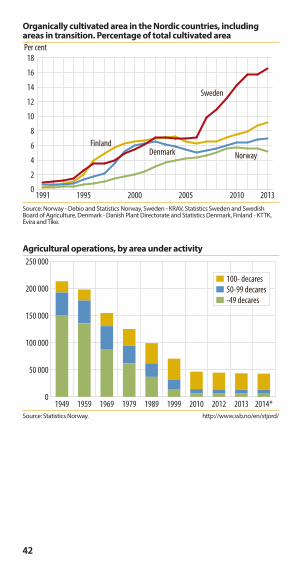
Organically cultivated area in the Nordic countries, including areas in transition. Percentage of total cultivated area
Per cent
0
2
4
6
8
10
12
14
16
18
201320102005200019951991
Denmark Norway
Finland
Sweden
Source: Norway - Debio and Statistics Norway, Sweden - KRAV, Statistics Sweden and Swedish Board of Agriculture, Denmark - Danish Plant Directorate and Statistics Denmark, Finland - KTTK, Evira and Tike.
Agricultural operations, by area under activity
0
50 000
100 000
150 000
200 000
250 000
2014*201320122010199919891979196919591949
100- decares
50-99 decares
-49 decares
Source: Statistics Norway. http://www.ssb.no/en/stjord/
43
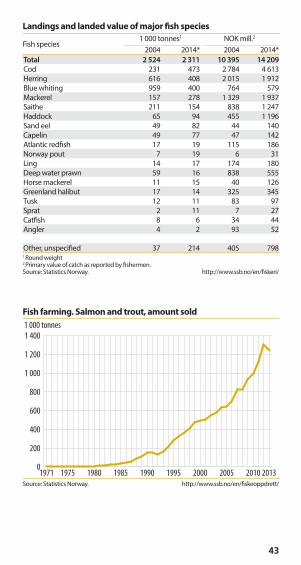
Landings and landed value of major fish species
Fish species1 000 tonnes1 NOK mill.2
2004 2014* 2004 2014*Total 2 524 2 311 10 395 14 209
Cod 231 473 2 784 4 613Herring 616 408 2 015 1 912Blue whiting 959 400 764 579Mackerel 157 278 1 329 1 937Saithe 211 154 838 1 247Haddock 65 94 455 1 196Sand eel 49 82 44 140Capelin 49 77 47 142Atlantic redfish 17 19 115 186Norway pout 7 19 6 31Ling 14 17 174 180Deep water prawn 59 16 838 555Horse mackerel 11 15 40 126Greenland halibut 17 14 325 345Tusk 12 11 83 97Sprat 2 11 7 27Catfish 8 6 34 44Angler 4 2 93 52
Other, unspecified 37 214 405 7981 Round weight2 Primary value of catch as reported by fishermen.Source: Statistics Norway. http://www.ssb.no/en/fiskeri/
Fish farming. Salmon and trout, amount sold
1 000 tonnes
0
200
400
600
800
1 000
1 200
1 400
2013201020052000199519901985198019751971Source: Statistics Norway. http://www.ssb.no/en/fiskeoppdrett/
44
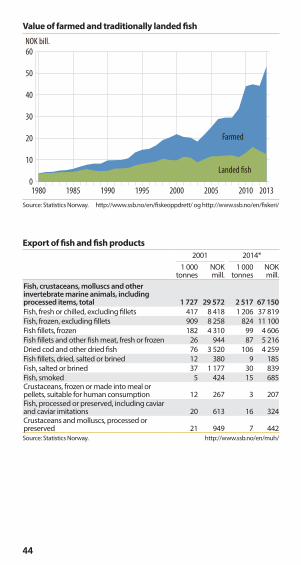
Value of farmed and traditionally landed fish
NOK bill.
0
10
20
30
40
50
60
20132010200520001995199019851980
Landed fish
Farmed
Source: Statistics Norway. http://www.ssb.no/en/fiskeoppdrett/ og http://www.ssb.no/en/fiskeri/
Export of fish and fish products
2001 2014*1 000
tonnesNOK mill.
1 000 tonnes
NOK mill.
Fish, crustaceans, molluscs and other invertebrate marine animals, including processed items, total 1 727 29 572 2 517 67 150
Fish, fresh or chilled, excluding fillets 417 8 418 1 206 37 819Fish, frozen, excluding fillets 909 8 258 824 11 100Fish fillets, frozen 182 4 310 99 4 606Fish fillets and other fish meat, fresh or frozen 26 944 87 5 216Dried cod and other dried fish 76 3 520 106 4 259Fish fillets, dried, salted or brined 12 380 9 185Fish, salted or brined 37 1 177 30 839Fish, smoked 5 424 15 685Crustaceans, frozen or made into meal or pellets, suitable for human consumption 12 267 3 207Fish, processed or preserved, including caviar and caviar imitations 20 613 16 324Crustaceans and molluscs, processed or preserved 21 949 7 442Source: Statistics Norway. http://www.ssb.no/en/muh/
45
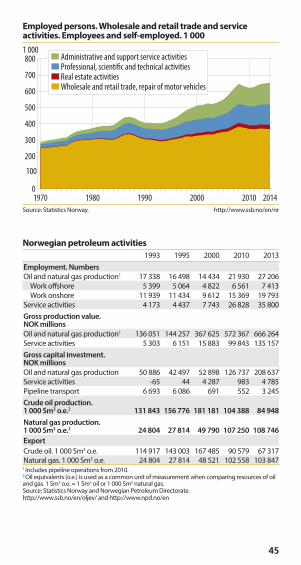
Employed persons. Wholesale and retail trade and service activities. Employees and self-employed. 1 000
1 000
0
100
200
300
400
500
600
700
800
201420102000199019801970
Administrative and support service activitiesProfessional, scientific and technical activitiesReal estate activitiesWholesale and retail trade, repair of motor vehicles
Source: Statistics Norway. http://www.ssb.no/en/nr
Norwegian petroleum activities
1993 1995 2000 2010 2013Employment. Numbers
Oil and natural gas production1 17 338 16 498 14 434 21 930 27 206Work offshore 5 399 5 064 4 822 6 561 7 413Work onshore 11 939 11 434 9 612 15 369 19 793
Service activities 4 173 4 437 7 743 26 828 35 800Gross production value. NOK millions
Oil and natural gas production1 136 051 144 257 367 625 572 367 666 264Service activities 5 303 6 151 15 883 99 843 135 157Gross capital investment. NOK millions
Oil and natural gas production 50 886 42 497 52 898 126 737 208 637Service activities -65 44 4 287 983 4 785Pipeline transport 6 693 6 086 691 552 3 245Crude oil production. 1 000 Sm3 o.e.2 131 843 156 776 181 181 104 388 84 948
Natural gas production. 1 000 Sm3 o.e.2 24 804 27 814 49 790 107 250 108 746
Export
Crude oil. 1 000 Sm3 o.e. 114 917 143 003 167 485 90 579 67 317Natural gas. 1 000 Sm3 o.e. 24 804 27 814 48 521 102 558 103 8471 Includes pipeline operations from 2010.2 Oil equivalents (o.e.) is used as a common unit of measurement when comparing resources of oil and gas. 1 Sm3 o.e. = 1 Sm3 oil or 1 000 Sm3 natural gas.Source: Statistics Norway and Norwegian Petroleum Directorate. http://www.ssb.no/en/oljev/ and http://www.npd.no/en
46
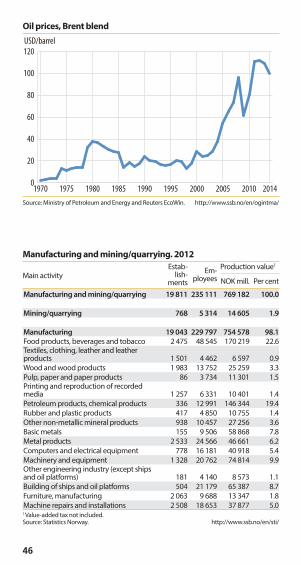
Oil prices, Brent blend
USD/barrel
0
20
40
60
80
100
120
2014201020052000199519901985198019751970
Source: Ministry of Petroleum and Energy and Reuters EcoWin. http://www.ssb.no/en/ogintma/
Manufacturing and mining/quarrying. 2012
Main activityEstab-
lish-ments
Em-ployees
Production value1
NOK mill. Per cent
Manufacturing and mining/quarrying 19 811 235 111 769 182 100.0
Mining/quarrying 768 5 314 14 605 1.9
Manufacturing 19 043 229 797 754 578 98.1
Food products, beverages and tobacco 2 475 48 545 170 219 22.6Textiles, clothing, leather and leather products 1 501 4 462 6 597 0.9Wood and wood products 1 983 13 752 25 259 3.3Pulp, paper and paper products 86 3 734 11 301 1.5Printing and reproduction of recorded media 1 257 6 331 10 401 1.4Petroleum products, chemical products 336 12 991 146 344 19.4Rubber and plastic products 417 4 850 10 755 1.4Other non-metallic mineral products 938 10 457 27 256 3.6Basic metals 155 9 506 58 868 7.8Metal products 2 533 24 566 46 661 6.2Computers and electrical equipment 778 16 181 40 918 5.4Machinery and equipment 1 328 20 762 74 814 9.9Other engineering industry (except ships and oil platforms) 181 4 140 8 573 1.1Building of ships and oil platforms 504 21 179 65 387 8.7Furniture, manufacturing 2 063 9 688 13 347 1.8Machine repairs and installations 2 508 18 653 37 877 5.01 Value-added tax not included. Source: Statistics Norway. http://www.ssb.no/en/sti/
47
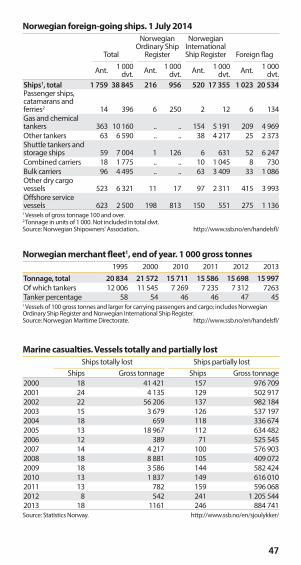
Norwegian foreign-going ships. 1 July 2014
Total
Norwegian Ordinary Ship
Register
Norwegian International Ship Register Foreign flag
Ant. 1 000 dvt. Ant. 1 000
dvt. Ant. 1 000 dvt. Ant. 1 000
dvt.Ships1, total 1 759 38 845 216 956 520 17 355 1 023 20 534Passenger ships, catamarans and ferries2 14 396 6 250 2 12 6 134Gas and chemical tankers 363 10 160 .. .. 154 5 191 209 4 969Other tankers 63 6 590 .. .. 38 4 217 25 2 373Shuttle tankers and storage ships 59 7 004 1 126 6 631 52 6 247Combined carriers 18 1 775 .. .. 10 1 045 8 730Bulk carriers 96 4 495 .. .. 63 3 409 33 1 086Other dry cargo vessels 523 6 321 11 17 97 2 311 415 3 993Offshore service vessels 623 2 500 198 813 150 551 275 1 1361 Vessels of gross tonnage 100 and over.2 Tonnage in units of 1 000. Not included in total dwt. Source: Norwegian Shipowners' Association.. http://www.ssb.no/en/handelsfl/
Norwegian merchant fleet1, end of year. 1 000 gross tonnes
1995 2000 2010 2011 2012 2013Tonnage, total 20 834 21 572 15 711 15 586 15 698 15 997
Of which tankers 12 006 11 545 7 269 7 235 7 312 7263Tanker percentage 58 54 46 46 47 451 Vessels of 100 gross tonnes and larger for carrying passengers and cargo; includes Norwegian Ordinary Ship Register and Norwegian International Ship Register. Source: Norwegian Maritime Directorate. http://www.ssb.no/en/handelsfl/
Marine casualties. Vessels totally and partially lost
Ships totally lost Ships partially lostShips Gross tonnage Ships Gross tonnage
2000 18 41 421 157 976 7092001 24 4 135 129 502 9172002 22 56 206 137 982 1842003 15 3 679 126 537 1972004 18 659 118 336 6742005 13 18 967 112 634 4822006 12 389 71 525 5452007 14 4 217 100 576 9032008 18 8 881 105 409 0722009 18 3 586 144 582 4242010 13 1 837 149 616 0102011 13 782 159 596 0682012 8 542 241 1 205 5442013 18 1161 246 884 741 Source: Statistics Norway. http://www.ssb.no/en/sjoulykker/
48
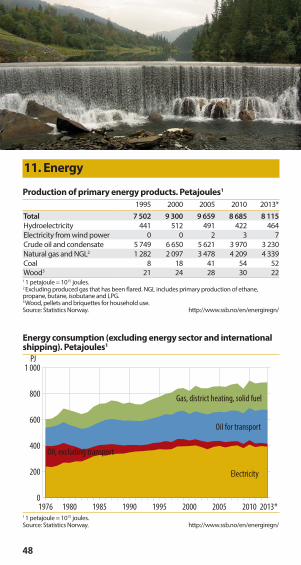
11. Energy
Production of primary energy products. Petajoules1
1995 2000 2005 2010 2013*Total 7 502 9 300 9 659 8 685 8 115
Hydroelectricity 441 512 491 422 464Electricity from wind power 0 0 2 3 7Crude oil and condensate 5 749 6 650 5 621 3 970 3 230Natural gas and NGL2 1 282 2 097 3 478 4 209 4 339Coal 8 18 41 54 52Wood3 21 24 28 30 221 1 petajoule = 1015 joules.2 Excluding produced gas that has been flared. NGL includes primary production of ethane, propane, butane, isobutane and LPG.3 Wood, pellets and briquettes for household use.Source: Statistics Norway. http://www.ssb.no/en/energiregn/
Energy consumption (excluding energy sector and international shipping). Petajoules1
PJ
0
200
400
600
800
1 000
2013*20102005200019951990198519801976
Electricity
Oil for transport
Gas, district heating, solid fuel
Oil, excluding transport
1 1 petajoule = 1015 joules.Source: Statistics Norway. http://www.ssb.no/en/energiregn/
49
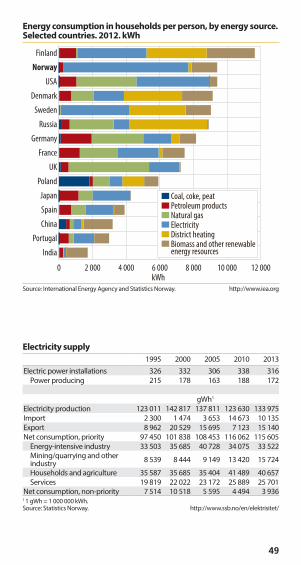
Energy consumption in households per person, by energy source. Selected countries. 2012. kWh
0 2 000 4 000 6 000 8 000 10 000 12 000
India
Portugal
China
Spain
Japan
Poland
UK
France
Germany
Russia
Sweden
Denmark
USA
Norway
Finland
kWh
Coal, coke, peatPetroleum productsNatural gasElectricityDistrict heatingBiomass and other renewable energy resources
Source: International Energy Agency and Statistics Norway. http://www.iea.org
Electricity supply
1995 2000 2005 2010 2013Electric power installations 326 332 306 338 316
Power producing 215 178 163 188 172
gWh1
Electricity production 123 011 142 817 137 811 123 630 133 975Import 2 300 1 474 3 653 14 673 10 135Export 8 962 20 529 15 695 7 123 15 140Net consumption, priority 97 450 101 838 108 453 116 062 115 605
Energy-intensive industry 33 503 35 685 40 728 34 075 33 522Mining/quarrying and other industry 8 539 8 444 9 149 13 420 15 724
Households and agriculture 35 587 35 685 35 404 41 489 40 657Services 19 819 22 022 23 172 25 889 25 701
Net consumption, non-priority 7 514 10 518 5 595 4 494 3 9361 1 gWh = 1 000 000 kWh.Source: Statistics Norway. http://www.ssb.no/en/elektrisitet/
50
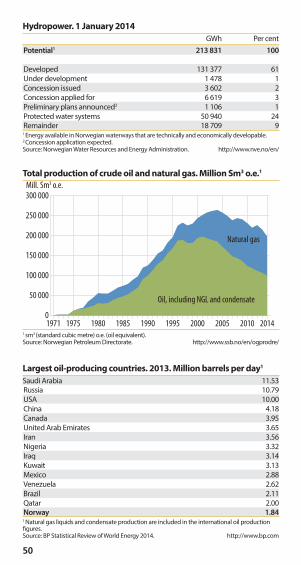
Hydropower. 1 January 2014
GWh Per centPotential1 213 831 100
Developed 131 377 61Under development 1 478 1Concession issued 3 602 2Concession applied for 6 619 3Preliminary plans announced2 1 106 1Protected water systems 50 940 24Remainder 18 709 91 Energy available in Norwegian waterways that are technically and economically developable.2 Concession application expected.Source: Norwegian Water Resources and Energy Administration. http://www.nve.no/en/
Total production of crude oil and natural gas. Million Sm3 o.e.1
Mill. Sm3 o.e.
0
50 000
100 000
150 000
200 000
250 000
300 000
2014201020052000199519901985198019751971
Oil, including NGL and condensate
Natural gas
1 sm3 (standard cubic metre) o.e. (oil equivalent). Source: Norwegian Petroleum Directorate. http://www.ssb.no/en/ogprodre/
Largest oil-producing countries. 2013. Million barrels per day1
Saudi Arabia 11.53Russia 10.79USA 10.00China 4.18Canada 3.95United Arab Emirates 3.65Iran 3.56Nigeria 3.32Iraq 3.14Kuwait 3.13Mexico 2.88Venezuela 2.62Brazil 2.11Qatar 2.00Norway 1.841 Natural gas liquids and condensate production are included in the international oil production figures.Source: BP Statistical Review of World Energy 2014. http://www.bp.com
51
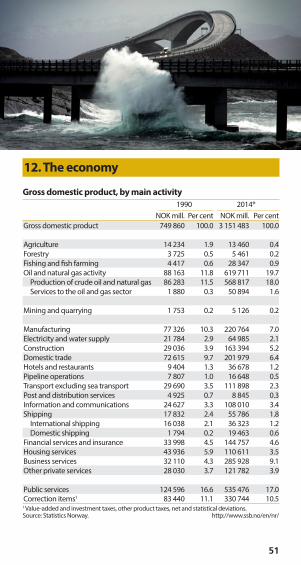
12. The economy
Gross domestic product, by main activity
1990 2014*NOK mill. Per cent NOK mill. Per cent
Gross domestic product 749 860 100.0 3 151 483 100.0
Agriculture 14 234 1.9 13 460 0.4Forestry 3 725 0.5 5 461 0.2Fishing and fish farming 4 417 0.6 28 347 0.9Oil and natural gas activity 88 163 11.8 619 711 19.7
Production of crude oil and natural gas 86 283 11.5 568 817 18.0Services to the oil and gas sector 1 880 0.3 50 894 1.6
Mining and quarrying 1 753 0.2 5 126 0.2
Manufacturing 77 326 10.3 220 764 7.0Electricity and water supply 21 784 2.9 64 985 2.1Construction 29 036 3.9 163 394 5.2Domestic trade 72 615 9.7 201 979 6.4Hotels and restaurants 9 404 1.3 36 678 1.2Pipeline operations 7 807 1.0 16 648 0.5Transport excluding sea transport 29 690 3.5 111 898 2.3Post and distribution services 4 925 0.7 8 845 0.3Information and communications 24 627 3.3 108 010 3.4Shipping 17 832 2.4 55 786 1.8
International shipping 16 038 2.1 36 323 1.2Domestic shipping 1 794 0.2 19 463 0.6
Financial services and insurance 33 998 4.5 144 757 4.6Housing services 43 936 5.9 110 611 3.5Business services 32 110 4.3 285 928 9.1Other private services 28 030 3.7 121 782 3.9
Public services 124 596 16.6 535 476 17.0Correction items1 83 440 11.1 330 744 10.51 Value-added and investment taxes, other product taxes, net and statistical deviations.Source: Statistics Norway. http://www.ssb.no/en/nr/
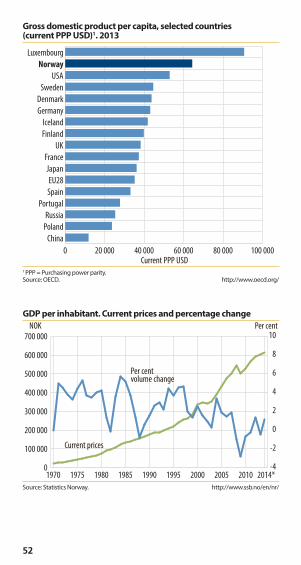
52
Gross domestic product per capita, selected countries (current PPP USD)1. 2013
0 20 000 40 000 60 000 80 000 100 000
China
Poland
Russia
Portugal
Spain
EU28
Japan
France
UK
Finland
Iceland
Germany
Denmark
Sweden
USA
NorwayLuxembourg
Current PPP USD1 PPP = Purchasing power parity. Source: OECD. http://www.oecd.org/
GDP per inhabitant. Current prices and percentage change
NOK
0
100 000
200 000
300 000
400 000
500 000
600 000
700 000
2014*201020052000199519901985198019751970
Current prices
Per cent
-4
-2
0
2
4
6
8
10
Per cent volume change
Source: Statistics Norway. http://www.ssb.no/en/nr/
53
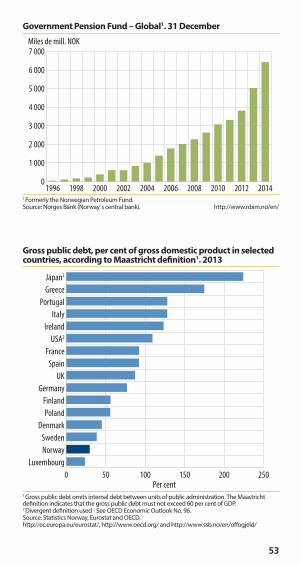
Government Pension Fund – Global1. 31 December
0
1 000
2 000
3 000
4 000
5 000
6 000
7 000
2014201220102008200620042002200019981996
Miles de mill. NOK
1 Formerly the Norwegian Petroleum Fund. Source: Norges Bank (Norway΄s central bank). http://www.nbim.no/en/
Gross public debt, per cent of gross domestic product in selected countries, according to Maastricht definition1. 2013
0 50 100 150 200 250
Luxembourg
Norway
Sweden
Denmark
Poland
Finland
Germany
UK
Spain
France
USA2
Ireland
Italy
Portugal
Greece
Japan2
Per cent1 Gross public debt omits internal debt between units of public administration. The Maastricht definition indicates that the gross public debt must not exceed 60 per cent of GDP.2 Divergent definition used - See OECD Economic Outlook No. 96.Source: Statistics Norway, Eurostat and OECD. http://ec.europa.eu/eurostat/, http://www.oecd.org/ and http://www.ssb.no/en/offogjeld/
54
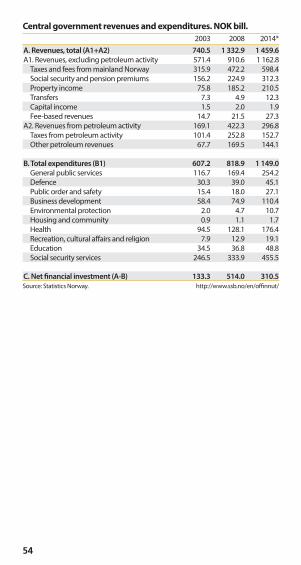
Central government revenues and expenditures. NOK bill.
2003 2008 2014*A. Revenues, total (A1+A2) 740.5 1 332.9 1 459.6
A1. Revenues, excluding petroleum activity 571.4 910.6 1 162.8Taxes and fees from mainland Norway 315.9 472.2 598.4Social security and pension premiums 156.2 224.9 312.3Property income 75.8 185.2 210.5Transfers 7.3 4.9 12.3Capital income 1.5 2.0 1.9Fee-based revenues 14.7 21.5 27.3
A2. Revenues from petroleum activity 169.1 422.3 296.8Taxes from petroleum activity 101.4 252.8 152.7Other petroleum revenues 67.7 169.5 144.1
B. Total expenditures (B1) 607.2 818.9 1 149.0
General public services 116.7 169.4 254.2Defence 30.3 39.0 45.1Public order and safety 15.4 18.0 27.1Business development 58.4 74.9 110.4Environmental protection 2.0 4.7 10.7Housing and community 0.9 1.1 1.7Health 94.5 128.1 176.4Recreation, cultural affairs and religion 7.9 12.9 19.1Education 34.5 36.8 48.8Social security services 246.5 333.9 455.5
C. Net financial investment (A-B) 133.3 514.0 310.5
Source: Statistics Norway. http://www.ssb.no/en/offinnut/
55
13. Norway abroad
Foreign Service
Ministry of Foreign Affairs
Street address: 7. juni-plassen / Victoria TerrassePostal address: Postboks 8114 Dep., NO-0032 OsloTel.: + 47 23 95 00 00Fax: + 47 23 95 00 99E-mail: [email protected]
Diplomatic and Consular Missions
102 diplomatic and consular missions, of which85 embassies9 consulates general7 missions/delegations1 embassy branch office
Approximately 355 honorary consulates
Ministry personnel
Approximately 835 posts
At diplomatic and consular missions
Approximately 640 including approx. 85 special envoysApproximately 1 000 locally employed staffhttp://www.regjeringen.no/en/dep/ud/ and http://www.norway.info/
56
Innovation Norway
Innovation Norway is the Norwegian national and regional authorities’ instrument for realising value-creating commercial and industrial development throughout Norway. The goal of Innovation Norway is to encourage financially and socio-economically profitable commercial and industrial development while fostering the industrial potential of the regions. This is to be achieved by increasing the number of capable entrepreneurs, growth-oriented enterprises and innovative industrial environments.
Innovation Norway is a global organization. In addition to being represented in every Norwegian county, it has offices in more than 30 countries. In countries where Innovation Norway has no offices, Norwegian embassies provide access to international networks. The employees' wide knowledge of local and international conditions helps clients to convert their ideas into successful businesses.
Street address in Oslo: Akersgata 13, OsloTelephone: + 47 22 00 25 00Telefax: + 47 22 00 25 01E-mail: [email protected]
Postal address:Innovation NorwayPO Box 448 SentrumNO-0104 Oslohttp://www.innovasjonnorge.no/no/Contact-us/
The Norwegian Seamen’s Mission – Norwegian Church Abroad
The Norwegian Seamen’s Mission/Norwegian Church Abroad is a volunteer organisation affiliated with the Church of Norway. It serves as a religious, cultural and social meeting place for all Norwegians abroad. It also offers emergency services, interpersonal networking and relationship counselling. There are 31 seamen’s churches abroad, but the organisation is represented in 80 countries throughout the world.
Street address: Strandgt. 198Postal address: Postboks 2007, NO-5817 BergenTelephone: + 47 55 55 22 55E-mail: [email protected]: www.facebook.com/sjomannskirkenSource: Norwegian Seamen’s Mission. http://www.sjomannskirken.no/english
57
EEA and Norway Grants – Solidarity and cooperation
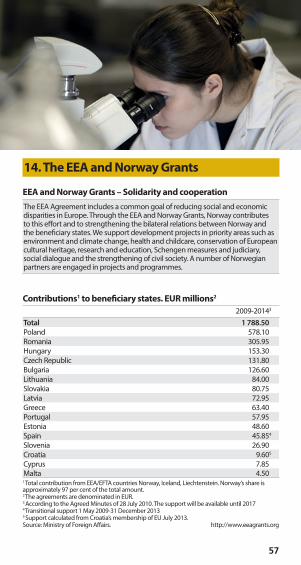
The EEA Agreement includes a common goal of reducing social and economic disparities in Europe. Through the EEA and Norway Grants, Norway contributes to this effort and to strengthening the bilateral relations between Norway and the beneficiary states. We support development projects in priority areas such as environment and climate change, health and childcare, conservation of European cultural heritage, research and education, Schengen measures and judiciary, social dialogue and the strengthening of civil society. A number of Norwegian partners are engaged in projects and programmes.
14. The EEA and Norway Grants
Contributions1 to beneficiary states. EUR millions2
2009-20143 Total 1 788.50
Poland 578.10Romania 305.95Hungary 153.30Czech Republic 131.80Bulgaria 126.60Lithuania 84.00Slovakia 80.75Latvia 72.95Greece 63.40Portugal 57.95Estonia 48.60Spain 45.854
Slovenia 26.90Croatia 9.605
Cyprus 7.85Malta 4.501 Total contribution from EEA/EFTA countries Norway, Iceland, Liechtenstein. Norway’s share is approximately 97 per cent of the total amount.2 The agreements are denominated in EUR.3 According to the Agreed Minutes of 28 July 2010. The support will be available until 20174 Transitional support 1 May 2009-31 December 20135 Support calculated from Croatia’s membership of EU July 2013.Source: Ministry of Foreign Affairs. http://www.eeagrants.org
58
Development assistance, public expenditures. NOK mill.
2009 2010 2011 2012 2013Development aid expenditures, total (gross aid) 25 624 26 424 26 653 27 638 32 807
Per cent of GNP 1.06 1.05 0.96 0.93 1.07
Bilateral assistance 17 940 18 508 18 363 18 947 23 588Directly bilateral 12 132 12 357 12 674 12 835 16 693Administered by multilateral organizations (multi-bi) 5 808 6 151 5 689 6 112 6 896Multilateral assistance 6 296 6 464 6 787 7 154 7 439Administration 1 387 1 452 1 503 1 537 1 780
Bilateral assistance by type of recipient organisation
Non-profit organizations, total 5 436 5 616 5 918 5 948 6 700Of which Norwegian non-profit organizations 3 566 3 620 3 518 3 710 4 252Local non-profit organizations 744 799 899 959 981International non-profit organizations 1 125 1 197 1 501 1 279 1 467Other, total 12 505 12 892 12 445 12 999 16 888
Total bilateral assistance 17 940 18 508 18 363 18 947 23 588
Total assistance by topic area
Economic development and trade 3 374 3 612 3 944 3 307 3 531Emergency relief 1 398 2 161 2 115 1 949 2 538Environment and energy 2 366 3 172 3 204 4 752 7 024Good governance 3 896 3 865 3 941 3 863 4 369Education 1 759 1 602 1 515 1 612 1 690Health and social sector 2 277 1 724 1 804 1 814 2 582Costs in Norway and unspecified costs 4 258 3 823 3 343 3 187 3 635Multilateral assistance 6 296 6 464 6 787 7 154 7 439Source: NORAD - Norwegian Agency for Development Cooperation. http://www.norad.no/en/front/toolspublications/norwegian-aid-statistics/
15. Development cooperation
59
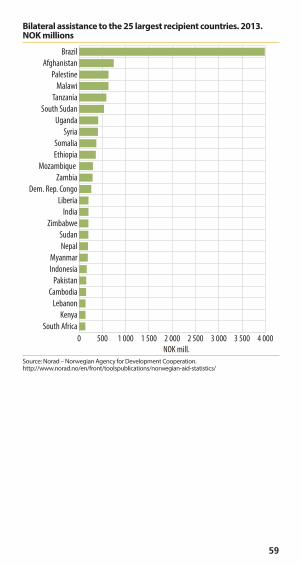
Bilateral assistance to the 25 largest recipient countries. 2013. NOK millions
0 500 1 000 1 500 2 000 2 500 3 000 3 500 4 000
South Africa
Kenya
Lebanon
Cambodia
Pakistan
Indonesia
Myanmar
Nepal
Sudan
Zimbabwe
India
Liberia
Dem. Rep. Congo
Zambia
Mozambique
Ethiopia
Somalia
Syria
Uganda
South Sudan
Tanzania
Malawi
Palestine
Afghanistan
Brazil
NOK mill.
Source: Norad – Norwegian Agency for Development Cooperation. http://www.norad.no/en/front/toolspublications/norwegian-aid-statistics/
60
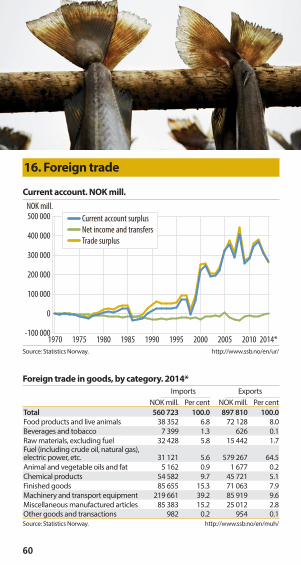
16. Foreign trade
Current account. NOK mill.
-100 000
0
100 000
200 000
300 000
400 000
500 000
2014*201020052000199519901985198019751970
Current account surplus
Net income and transfers
Trade surplus
NOK mill.
Source: Statistics Norway. http://www.ssb.no/en/ur/
Foreign trade in goods, by category. 2014*
Imports ExportsNOK mill. Per cent NOK mill. Per cent
Total 560 723 100.0 897 810 100.0
Food products and live animals 38 352 6.8 72 128 8.0Beverages and tobacco 7 399 1.3 626 0.1Raw materials, excluding fuel 32 428 5.8 15 442 1.7Fuel (including crude oil, natural gas), electric power, etc. 31 121 5.6 579 267 64.5Animal and vegetable oils and fat 5 162 0.9 1 677 0.2Chemical products 54 582 9.7 45 721 5.1Finished goods 85 655 15.3 71 063 7.9Machinery and transport equipment 219 661 39.2 85 919 9.6Miscellaneous manufactured articles 85 383 15.2 25 012 2.8Other goods and transactions 982 0.2 954 0.1Source: Statistics Norway. http://www.ssb.no/en/muh/
61
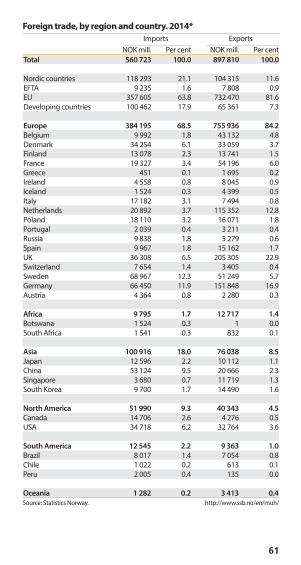
Foreign trade, by region and country. 2014*
Imports ExportsNOK mill. Per cent NOK mill. Per cent
Total 560 723 100.0 897 810 100.0
Nordic countries 118 293 21.1 104 315 11.6EFTA 9 235 1.6 7 808 0.9EU 357 605 63.8 732 470 81.6Developing countries 100 462 17.9 65 361 7.3
Europe 384 195 68.5 755 936 84.2
Belgium 9 992 1.8 43 132 4.8Denmark 34 254 6.1 33 059 3.7Finland 13 078 2.3 13 741 1.5France 19 327 3.4 54 196 6.0Greece 451 0.1 1 695 0.2Ireland 4 558 0.8 8 045 0.9Iceland 1 524 0.3 4 399 0.5Italy 17 182 3.1 7 494 0.8Netherlands 20 892 3.7 115 352 12.8Poland 18 110 3.2 16 071 1.8Portugal 2 039 0.4 3 211 0.4Russia 9 838 1.8 5 279 0.6Spain 9 967 1.8 15 162 1.7UK 36 308 6.5 205 305 22.9Switzerland 7 654 1.4 3 405 0.4Sweden 68 967 12.3 51 249 5.7Germany 66 450 11.9 151 848 16.9Austria 4 364 0.8 2 280 0.3
Africa 9 795 1.7 12 717 1.4
Botswana 1 524 0.3 1 0.0South Africa 1 541 0.3 832 0.1
Asia 100 916 18.0 76 038 8.5
Japan 12 596 2.2 10 112 1.1China 53 124 9.5 20 666 2.3Singapore 3 680 0.7 11 719 1.3South Korea 9 700 1.7 14 490 1.6
North America 51 990 9.3 40 343 4.5
Canada 14 706 2.6 4 276 0.5USA 34 718 6.2 32 764 3.6
South America 12 545 2.2 9 363 1.0
Brazil 8 017 1.4 7 054 0.8Chile 1 022 0.2 613 0.1Peru 2 005 0.4 135 0.0
Oceania 1 282 0.2 3 413 0.4
Source: Statistics Norway. http://www.ssb.no/en/muh/
62
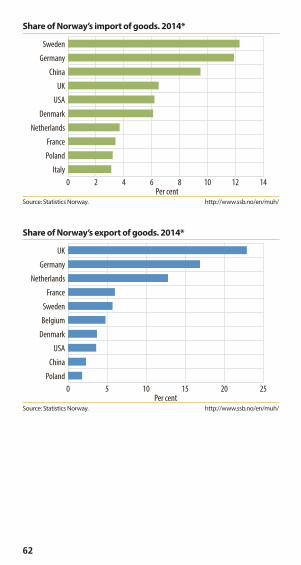
Share of Norway’s import of goods. 2014*
Per cent0 2 4 6 8 10 12 14
Italy
Poland
France
Netherlands
Denmark
USA
UK
China
Germany
Sweden
Source: Statistics Norway. http://www.ssb.no/en/muh/
Share of Norway’s export of goods. 2014*
Per cent0 5 10 15 20 25
Poland
China
USA
Denmark
Belgium
Sweden
France
Netherlands
Germany
UK
Source: Statistics Norway. http://www.ssb.no/en/muh/
63
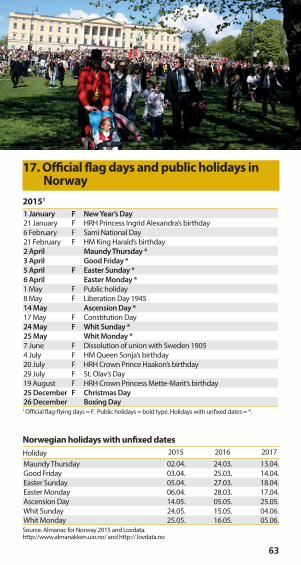
17. Official flag days and public holidays in Norway
20151
1 January F New Year’s Day
21 January F HRH Princess Ingrid Alexandra’s birthday6 February F Sami National Day21 February F HM King Harald’s birthday2 April Maundy Thursday *
3 April Good Friday *
5 April F Easter Sunday *
6 April Easter Monday *
1 May F Public holiday8 May F Liberation Day 194514 May Ascension Day *
17 May F Constitution Day24 May F Whit Sunday *
25 May Whit Monday *
7 June F Dissolution of union with Sweden 19054 July F HM Queen Sonja’s birthday20 July F HRH Crown Prince Haakon’s birthday29 July F St. Olav’s Day19 August F HRH Crown Princess Mette-Marit’s birthday25 December F Christmas Day
26 December Boxing Day1 Official flag-flying days = F. Public holidays = bold type. Holidays with unfixed dates = *.
Norwegian holidays with unfixed dates
Holiday 2015 2016 2017Maundy Thursday 02.04. 24.03. 13.04.Good Friday 03.04. 25.03. 14.04.Easter Sunday 05.04. 27.03. 18.04.Easter Monday 06.04. 28.03. 17.04.Ascension Day 14.05. 05.05. 25.05.Whit Sunday 24.05. 15.05. 04.06.Whit Monday 25.05. 16.05. 05.06.Source: Almanac for Norway 2015 and Lovdata.http://www.almanakken.uio.no/ and http:// lovdata.no
64
Picture credits
Cover: The Stegastein viewpoint. Photo: Per Ritzler / National Tourist Routes
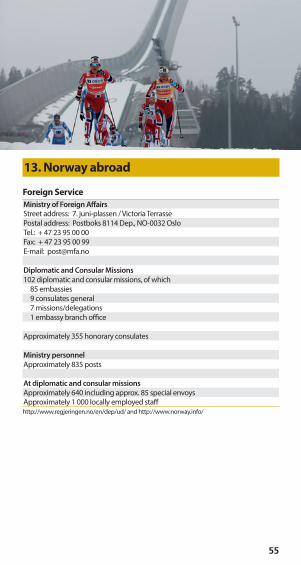
1: The new government in front of the Royal Palace in Oslo on 16 October 2013. Erlend Aas / NTB scanpix / SMK
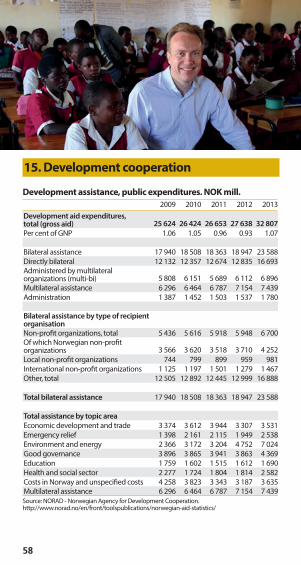
2: The Kjøllefjord Wind Farm, Finnmark. Photo: Kristian Løksa/ Statkraft3: Skiing trip to Oppkuven. Photo: Tore Nedrebø/MFA4: Marius E. Hauge5: Guri Dahl / tinagent.com6: The Vigeland Park, Oslo. Photo: CH - Visitnorway.com / Vigeland Museum / BONO7: Matti Bernitz - Visitnorway.com8: Anette Berentsen / NRK9: Anders Gjengedal / Innovation Norway10: Kai Jensen / NTB scanpix11: John Petter Reinertsen / Statkraft12: Rolf Jarle Ødegaard / NTB scanpix13: Holmenkollen. Photo: Magnus Nyløkken14: Guri Dahl / tinagent.com15: Prime Minister Erna Solberg and Minister of Foreign Affairs Børge Brende
visited Nthulu primary school in Malawi on 2 July 2014 in connection with Norway's new focus on education in developing countries. Photo: Ministry of Foreign Affairs / Astrid Sehl
16: Berit Roald / NTB scanpix
17: Constitution Day 17 May, Royal Palace, Oslo. Marta B. Haga / MFA Norway
Facts about Norway
Official name
Kingdom of Norway
System of government
Constitutional monarchyParliamentary democracy
The Royal House of Norway
Harald V, King of Norway, born 21 February 1937Sonja, Queen of Norway, born 4 July 1937Haakon, Crown Prince of Norway, born 20 July 1973Mette-Marit, Crown Princess of Norway, born 19 August 1973 Ingrid Alexandra, Princess of Norway, born 21 January 2004Sverre Magnus, Prince of Norway, born 3 December 2005
Population
5 165 802 inhabitants as of 1 January 2015Norway has an indigenous Sami population as well as five national minorities, defined as groups with a long association with Norway.
Official languages
Norwegian (the two forms Bokmål and Nynorsk)
Sami (three Sami languages, North Sami, Lule Sami and South Sami), which have the same status as Norwegian in the municipalities of Kautokeino, Karasjok, Tana, Porsanger and Nesseby in Finnmark; Kåfjord and Lavangen in Troms; Tysfjord in Nordland and Røyrvik and Snåsa in Nord-Trøndelag.
In addition, Kven, Romani and Romanes are recognised as minority languages. Norwegian Sign Language also has an official status, primarily through the provisions of the Education Act.
Currency
Norwegian kroner, NOK1 EUR = NOK 8.64 as of March 20151 USD = NOK 7.98 as of March 2015
Published by the Norwegian Ministry of Foreign Affairs
www.norway.info
www.regjeringen.no/en/dep/ud
www.ssb.no/en/minifakta/
ENG


