Minimally Immersive Flow Visualization David S. Ebert, Member, IEEE, and Christopher D. Shaw Abstract—This paper describes a minimally immersive interactive system for flow visualization of multivariate volumetric data. The system, SFA, uses perceptually motivated rendering to increase the quantity and clarity of information perceived. Proprioception, stereopsis, perceptually motivated shape visualization, and three-dimensional interaction are combined in SFA to allow the three- dimensional volumetric visualization, manipulation, navigation, and analysis of multivariate, time-varying flow data. Index Terms—SFA–Stereoscopic Field Analyzer, flow visualization, two-handed interaction, 3D volumetric interaction, desktop virtual environments, glyph rendering, superquadric surfaces. æ 1 INTRODUCTION T HE simultaneous visualization of multidimensional flow data is a difficult task. The goal is not only the display of multidimensional data, but the comprehensible display of the flow data. Glyph, or iconic, visualization allows multiple data values to be encoded in the parameters of the icons [14]. The shape, color, 3D size, transparency, and orienta- tion of the glyph can be used to visualize data values. Glyph rendering [14], [15], [9] is an extension to the use of glyphs and icons in numerous fields, including cartography, logic, semiotics, and pictorial information systems. This paper describes our system, SFA (Stereoscopic Field Analyzer), for the interactive display of volumetric data which utilizes the capabilities of the human perception system to increase the information perceived from the visualization system. As described in [7], the system provides a minimally immersive interactive visualization tool to increase the understanding of volumetric data while being affordable on desktop workstations. We have ex- tended this work to develop a perceptually motivated visualization system that harnesses the power of the human perceptual system to increase the quantity of information conveyed from our system. Our system takes advantage of the priority structure of human visual perception [6], [3], stereopsis, motion, and proprioception (the brain’s uncon- scious awareness of the sense of body in space) to create meaningful visualizations from scientific data. SFA uses a glyph’s location, 3D size, color, orientation, and opacity to encode up to eight attributes of flow data per glyph. We have developed new techniques for automatic glyph shape generation that allow perceptualization of data through shape variation. Location, color, size, orientation, and opacity are more significant perceptual cues than shape [6]; however, shape variation can also be effectively used to convey related scalar flow parameters, especially in an interactive system. Several researchers have examined the use of virtual reality environments for visualization. Examples include Bryson and Levit’s Virtual Windtunnel [4], the University of North Carolina at Chapel Hill’s work on the topics of exploratory molecular visualization [2], and real-time exploration of atomic scale phenomena [20]. Goble et al. [10] built a two-handed 3D neurosurgical visualization system where the user sits in front of a high- resolution monitor and manipulates the scene using two 3D magnetic trackers. The left hand holds the brain model, represented by a tracker mounted inside a doll’s head, and the right hand manipulates a cutting plane, represented by a flat plate connected to a second tracker. The user moves the cutting plane to interactively generate cutaway views of the brain. New users immediately understand how the manipulation works and need essentially no training to use the system. Most previous techniques for interactive visualization of volumetric flow data use 2D interfaces or immersive head mounted displays. Our approach to interactive visualiza- tion combines glyph-based volume rendering with a perceptually motivated minimally immersive interaction metaphor to provide interactive visualization, manipula- tion, and exploration of multivariate, volumetric data. Careful data value mapping to glyph rendering attributes allows better comprehension of the multivariate data than can be achieved using isosurfaces or direct volume rendering. The rendering techniques used in our system are briefly described first, followed by a description of our procedural glyph generation. We then discuss the two-handed metaphor for interaction and show the results of applying these new techniques to flow visualization. Finally, we describe future directions for research in this area. 2 RENDERING WITHIN SFA SFA allows the visualization of both regular and irregular grids of volumetric data through the use of a glyph at each grid point [14], [15]. SFA also provides the ability to render more than one set of volumetric data using the same grid. It IEEE TRANSACTIONS ON VISUALIZATION AND COMPUTER GRAPHICS, VOL. 7, NO. 4, OCTOBER-DECEMBER 2001 343 . D.S. Ebert is with the School of Electrical and Computer Engineering, 1285 EE Bldg., Purdue University, West Lafayette, IN 47907-1285. E-mail: [email protected]. . C.D. Shaw is with the GVU Center, College of Computing, Georgia Institute of Technology, 801 Atlantic Dr., Atlanta, GA 30322-0280. E-mail: [email protected]. Manuscript received 13 June 2000; revised 15 Nov. 2000; accepted 17 Nov. 2000. For information on obtaining reprints of this article, please send e-mail to: [email protected], and reference IEEECS Log Number 112268. 1077-2626/01/$10.00 ß 2001 IEEE
Transcript
Minimally Immersive Flow VisualizationDavid S. Ebert, Member, IEEE, and Christopher D. Shaw
AbstractÐThis paper describes a minimally immersive interactive system for flow visualization of multivariate volumetric data. The
system, SFA, uses perceptually motivated rendering to increase the quantity and clarity of information perceived. Proprioception,
stereopsis, perceptually motivated shape visualization, and three-dimensional interaction are combined in SFA to allow the three-
dimensional volumetric visualization, manipulation, navigation, and analysis of multivariate, time-varying flow data.
Index TermsÐSFA±Stereoscopic Field Analyzer, flow visualization, two-handed interaction, 3D volumetric interaction, desktop virtual
THE simultaneous visualization of multidimensional flowdata is a difficult task. The goal is not only the display of
multidimensional data, but the comprehensible display of theflow data. Glyph, or iconic, visualization allows multipledata values to be encoded in the parameters of the icons[14]. The shape, color, 3D size, transparency, and orienta-tion of the glyph can be used to visualize data values. Glyphrendering [14], [15], [9] is an extension to the use of glyphsand icons in numerous fields, including cartography, logic,semiotics, and pictorial information systems.
This paper describes our system, SFA (Stereoscopic FieldAnalyzer), for the interactive display of volumetric datawhich utilizes the capabilities of the human perceptionsystem to increase the information perceived from thevisualization system. As described in [7], the systemprovides a minimally immersive interactive visualizationtool to increase the understanding of volumetric data whilebeing affordable on desktop workstations. We have ex-tended this work to develop a perceptually motivatedvisualization system that harnesses the power of the humanperceptual system to increase the quantity of informationconveyed from our system. Our system takes advantage ofthe priority structure of human visual perception [6], [3],stereopsis, motion, and proprioception (the brain's uncon-scious awareness of the sense of body in space) to createmeaningful visualizations from scientific data. SFA uses aglyph's location, 3D size, color, orientation, and opacity toencode up to eight attributes of flow data per glyph.
We have developed new techniques for automatic glyphshape generation that allow perceptualization of datathrough shape variation. Location, color, size, orientation,and opacity are more significant perceptual cues than shape[6]; however, shape variation can also be effectively used to
convey related scalar flow parameters, especially in aninteractive system.
Several researchers have examined the use of virtualreality environments for visualization. Examples includeBryson and Levit's Virtual Windtunnel [4], the University ofNorth Carolina at Chapel Hill's work on the topics ofexploratory molecular visualization [2], and real-timeexploration of atomic scale phenomena [20].
Goble et al. [10] built a two-handed 3D neurosurgicalvisualization system where the user sits in front of a high-resolution monitor and manipulates the scene using two 3Dmagnetic trackers. The left hand holds the brain model,represented by a tracker mounted inside a doll's head, andthe right hand manipulates a cutting plane, represented bya flat plate connected to a second tracker. The user movesthe cutting plane to interactively generate cutaway views ofthe brain. New users immediately understand how themanipulation works and need essentially no training to usethe system.
Most previous techniques for interactive visualization ofvolumetric flow data use 2D interfaces or immersive headmounted displays. Our approach to interactive visualiza-tion combines glyph-based volume rendering with aperceptually motivated minimally immersive interactionmetaphor to provide interactive visualization, manipula-tion, and exploration of multivariate, volumetric data.Careful data value mapping to glyph rendering attributesallows better comprehension of the multivariate data thancan be achieved using isosurfaces or direct volumerendering. The rendering techniques used in our systemare briefly described first, followed by a description ofour procedural glyph generation. We then discuss thetwo-handed metaphor for interaction and show theresults of applying these new techniques to flowvisualization. Finally, we describe future directions forresearch in this area.
2 RENDERING WITHIN SFA
SFA allows the visualization of both regular and irregulargrids of volumetric data through the use of a glyph at eachgrid point [14], [15]. SFA also provides the ability to rendermore than one set of volumetric data using the same grid. It
IEEE TRANSACTIONS ON VISUALIZATION AND COMPUTER GRAPHICS, VOL. 7, NO. 4, OCTOBER-DECEMBER 2001 343
. D.S. Ebert is with the School of Electrical and Computer Engineering, 1285EE Bldg., Purdue University, West Lafayette, IN 47907-1285.E-mail: [email protected].
. C.D. Shaw is with the GVU Center, College of Computing, GeorgiaInstitute of Technology, 801 Atlantic Dr., Atlanta, GA 30322-0280.E-mail: [email protected].
Manuscript received 13 June 2000; revised 15 Nov. 2000; accepted 17 Nov.2000.For information on obtaining reprints of this article, please send e-mail to:[email protected], and reference IEEECS Log Number 112268.
1077-2626/01/$10.00 ß 2001 IEEE
has many of the advantages of volume rendering, whileavoiding the limitations and difficulties of iso-surfacerendering. An additional feature of SFA is the ability tointeractively visualize and manipulate time-varying multi-variate volumetric data.
Because of the need to resample the space, standardvoxel-based techniques for visualization are not appropriatewhen the sample points occur on an irregular grid, as iscommon in flow visualization. Certain assumptions must bemade about the underlying physical properties of the spacebeing rendered that may not be true for the particular dataset in question, potentially resulting in a meaningless ormisleading visualization.
2.1 User Control
Within the basic framework of SFA, the user may easilycontrol the visualization in numerous ways, includingselection of data sets mapped to glyph color, opacity, size,shape, and orientation. To avoid the clutter induced bydisplaying insignificant data, the user may select the dataranges to be displayed, which may be a collection of disjointintervals.
As a further aid in reducing visual clutter, the usermay select maximum and minimum grid extents todisplay in each dimension. The user may choose toconcentrate on a particular subset of the volume, cullingthe unwanted outlying glyphs. Similarly, the user maychoose to display only every nth grid point along eachdimension. These two controls serve to reduce thenumber of glyphs drawn, thereby reducing the amountof time taken to draw the scene.
To create a good 3D impression, SFA renders the sceneusing either opaque or translucent glyphs and performingstandard Z-buffer hidden-surface removal. The scene maybe drawn in stereo using a pair of Liquid Crystal ShutterGlasses. We use the standard parallel camera model torender the 3D scene, which is identical in all respects exceptthat it must be rendered twice, once for each eye. Stereopsisis a very important visual cue for 3D depth perception inmost users.
3 SHAPE VISUALIZATION
Cleveland [6] cites experimental evidence that shows themost accurate method to visually decode a quantitativevariable in 2D is to display position along a scale. This isfollowed, in decreasing order of accuracy by interval length,slope angle, area, volume, and color. Bertin offers a similarhierarchy in his treatise on thematic cartography [3].However, these orderings of visual effectiveness are basedon two-dimensional visualization systems. Some recentwork has been performed on three-dimensional perceptionof shape, indicating that shading based on shape isperceptually significant [12].
SFA employs glyph position in 3D, 3D scale (corre-sponding to Cleveland's length, area, and volume) andcolor, and in the vector-based flow visualization, slopeangle. The next opportunity for encoding values is shape.One of the most difficult problems in glyph visualizationis the design of meaningful glyphs. Glyph shape variationmust be able to convey changes in associated data values
in a comprehensible manner [14]. This difficulty is some-times avoided by adopting a single base shape and scalingit nonuniformly in three dimensions. However, the lack of amore general shape interpolation method has precluded theuse of shape beyond the signification of categorical values[3]. We have chosen the procedural generation of glyphshapes using superquadrics [1] because superquadrics offerthe required shape interpolation mechanism.
Because of the need for meaningful glyph design and thecomplexity of the problem, we opted for a proceduralapproach, which allows flexibility, data abstraction, andfreedom from specification of detailed shapes [8]. Our goalfor glyph design was to allow the automatic mapping ofdata to shape in a comprehensible, easily controllablemanner. Superquadrics are a natural choice to satisfy thisgoal. Superquadrics, first introduced to computer graphicsby Barr [1], are extensions of quadric surfaces where thetrigonometric terms are each raised to exponents. Super-quadrics come in four main families: hyperboloid of onesheet, hyperboloid of two sheets, ellipsoid, and toroid. Forour initial implementation, we have chosen superellipsesdue to their familiarity, but the system can be easilyextended to use other types of superquadrics as well ascombinations of types. For example, supertoroids could beused for negative values and superellipsoids for positivevalues.
In the case the of superellipsoids, the trigonometric termsare assigned exponents as follows
x��; !� �a1 cos�1 � cos�2 !a2 cos�1 � cos�2 !
a3 sin�1 �
24 35; ÿ�=2 � � � �=2ÿ� � ! < pi:
�1�
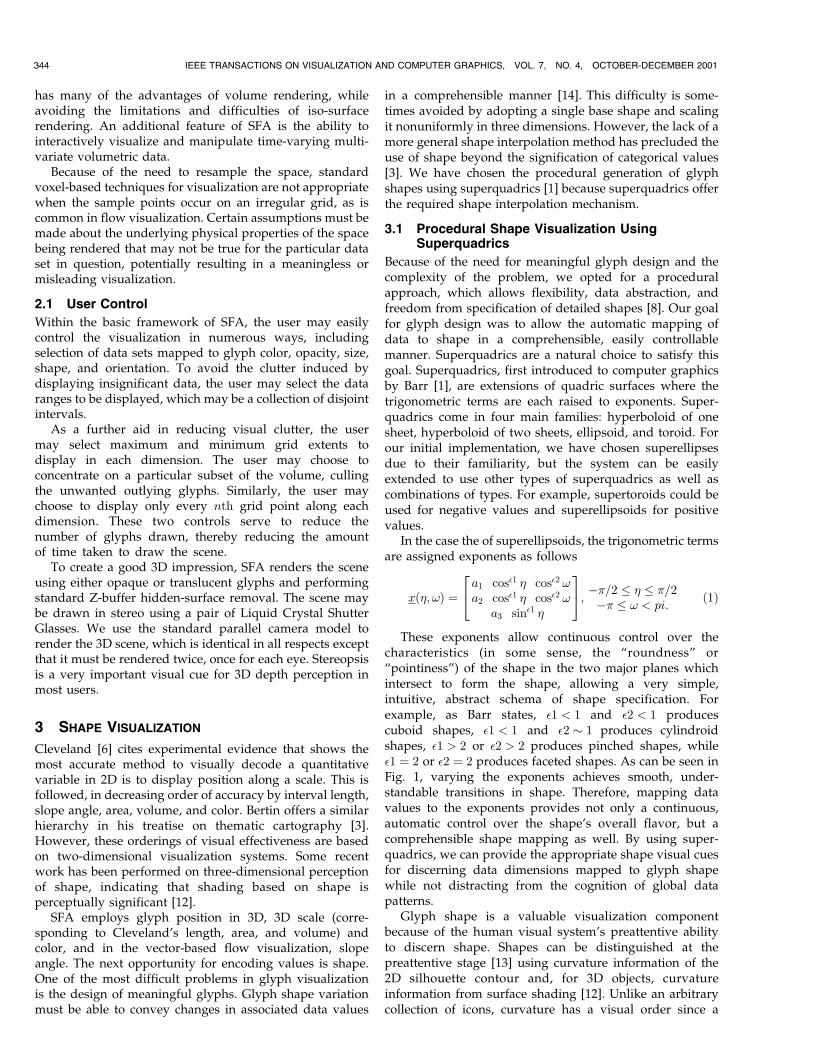
These exponents allow continuous control over thecharacteristics (in some sense, the ªroundnessº orªpointinessº) of the shape in the two major planes whichintersect to form the shape, allowing a very simple,intuitive, abstract schema of shape specification. Forexample, as Barr states, �1 < 1 and �2 < 1 producescuboid shapes, �1 < 1 and �2 � 1 produces cylindroidshapes, �1 > 2 or �2 > 2 produces pinched shapes, while�1 � 2 or �2 � 2 produces faceted shapes. As can be seen inFig. 1, varying the exponents achieves smooth, under-standable transitions in shape. Therefore, mapping datavalues to the exponents provides not only a continuous,automatic control over the shape's overall flavor, but acomprehensible shape mapping as well. By using super-quadrics, we can provide the appropriate shape visual cuesfor discerning data dimensions mapped to glyph shapewhile not distracting from the cognition of global datapatterns.
Glyph shape is a valuable visualization componentbecause of the human visual system's preattentive abilityto discern shape. Shapes can be distinguished at thepreattentive stage [13] using curvature information of the2D silhouette contour and, for 3D objects, curvatureinformation from surface shading [12]. Unlike an arbitrarycollection of icons, curvature has a visual order since a
344 IEEE TRANSACTIONS ON VISUALIZATION AND COMPUTER GRAPHICS, VOL. 7, NO. 4, OCTOBER-DECEMBER 2001
surface of higher curvature looks more jagged than asurface of low curvature. Therefore, generating glyphshapes by maintaining control of their curvature willmaintain a visual order. This allows us to generate a rangeof glyphs which interpolate between extremes of curvature,thereby allowing the user to read scalar values from theglyph's shape. Preattentive shape recognition allows quickanalysis of shapes and provides useful dimensions forcomprehensible visualization.
Our use of glyphs is related to the idea of marks as themost primitive component that can encode useful informa-tion [3]. Senay and Ignatius point out that shape, size,texture, orientation, transparency, hue, saturation, bright-ness, and transparency are retinal properties of marks thatcan encode information [16], [17]. To produce understand-able, intuitive shapes, we are relying on the ability ofsuperquadrics to create graphically distinct, yet related,shapes. We are encoding two data dimensions to glyphshape in a manner that allows the easy separation of theshape characteristics.
Since size and spatial location are more significant cuesthan shape, the importance mapping of data values shouldbe done in a corresponding order. In decreasing order ofdata importance, data values were mapped to location, size,color, and shape. In our experience, shape is very useful forlocal area comparisons among glyphs: seeing local patterns,rates of change, outlyers, anomalies. We chose to map eitherone independent variable to both glyph exponents or tworelated variables to each glyph exponent to ensure theunderstandability of the shapes.
4 TWO-HANDED MINIMALLY IMMERSIVE INTERFACE
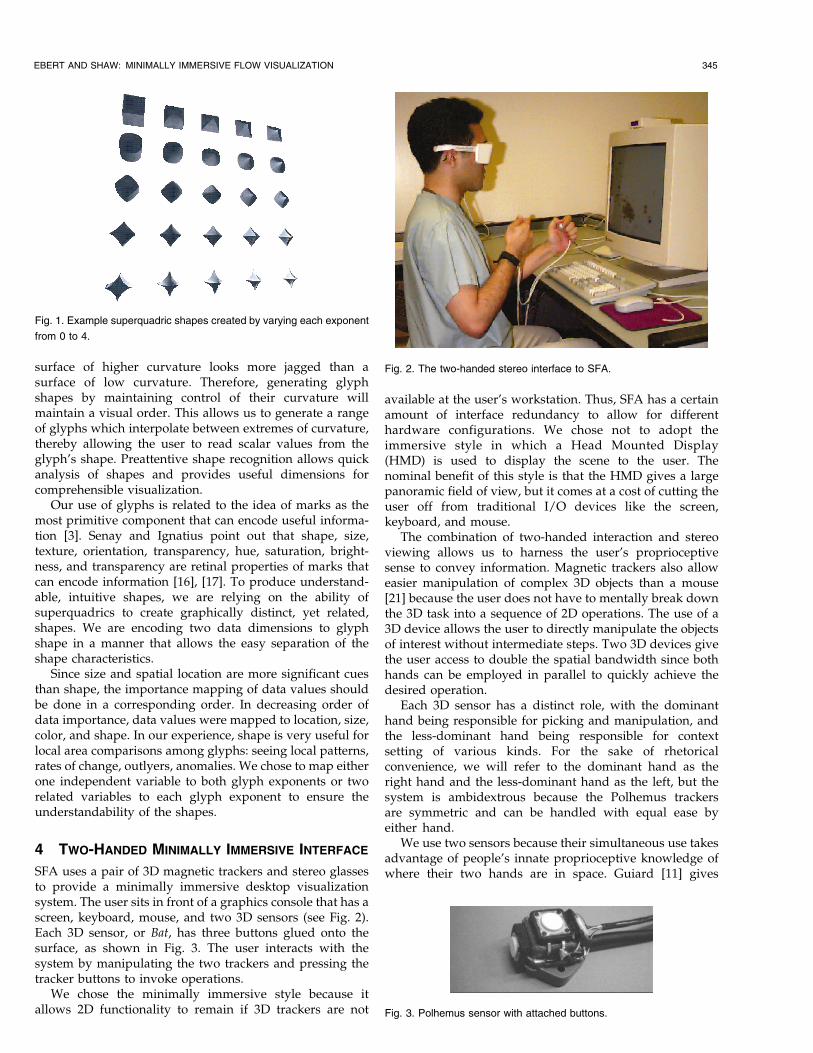
SFA uses a pair of 3D magnetic trackers and stereo glassesto provide a minimally immersive desktop visualizationsystem. The user sits in front of a graphics console that has ascreen, keyboard, mouse, and two 3D sensors (see Fig. 2).Each 3D sensor, or Bat, has three buttons glued onto thesurface, as shown in Fig. 3. The user interacts with thesystem by manipulating the two trackers and pressing thetracker buttons to invoke operations.
We chose the minimally immersive style because itallows 2D functionality to remain if 3D trackers are not
available at the user's workstation. Thus, SFA has a certainamount of interface redundancy to allow for differenthardware configurations. We chose not to adopt theimmersive style in which a Head Mounted Display(HMD) is used to display the scene to the user. Thenominal benefit of this style is that the HMD gives a largepanoramic field of view, but it comes at a cost of cutting theuser off from traditional I/O devices like the screen,keyboard, and mouse.
The combination of two-handed interaction and stereoviewing allows us to harness the user's proprioceptivesense to convey information. Magnetic trackers also alloweasier manipulation of complex 3D objects than a mouse[21] because the user does not have to mentally break downthe 3D task into a sequence of 2D operations. The use of a3D device allows the user to directly manipulate the objectsof interest without intermediate steps. Two 3D devices givethe user access to double the spatial bandwidth since bothhands can be employed in parallel to quickly achieve thedesired operation.
Each 3D sensor has a distinct role, with the dominanthand being responsible for picking and manipulation, andthe less-dominant hand being responsible for contextsetting of various kinds. For the sake of rhetoricalconvenience, we will refer to the dominant hand as theright hand and the less-dominant hand as the left, but thesystem is ambidextrous because the Polhemus trackersare symmetric and can be handled with equal ease byeither hand.
We use two sensors because their simultaneous use takesadvantage of people's innate proprioceptive knowledge ofwhere their two hands are in space. Guiard [11] gives
EBERT AND SHAW: MINIMALLY IMMERSIVE FLOW VISUALIZATION 345
Fig. 1. Example superquadric shapes created by varying each exponent
from 0 to 4.
Fig. 2. The two-handed stereo interface to SFA.
Fig. 3. Polhemus sensor with attached buttons.
psychophysical evidence for the idea that the left and righthands quite often act as elements in a kinematic chain. Forright-handed people, the left hand acts as the base link ofthe chain. The right hand's motions are based on this linkand the right hand finds its spatial references in the resultsof motion of the left hand. Also, the right and left hands areinvolved in asymmetric temporal-spatial scales of motion(right hand for high frequency, left hand for lowfrequency).1 The Two-Handed interface to SFA uses thisnatural division of manual labor by assigning the (low-frequency) setting of spatial context to the left hand and the(high-frequency) selection and picking operations to theright.
This interface is similar to one designed by Shaw andGreen for free-form surface modeling [18] and some of theinteraction techniques are derived from it. Goble et al.'ssystem [10] offers a similar assignment of hand roles, butthere is intentionally only a very limited set of interactiontechniques. Other work at the University of Virginia [19]has further explored the idea of two-handed interfacesusing an object, or prop, attached to each sensor.
4.1 Left Hand Operations
In SFA, the left hand has three tasks to perform:
. Manipulate the position and orientation of the entirescene.
. Select the drawing context from a 3D tracker-basedhierarchical menu.
. Select the constraint axis for bounding-boxadjustment.
Repositioning the scene is initiated by clicking the left batbutton 3 (the button near the wire). Clicking button 3attaches the volume to the left cursor and clicking it againleaves the volume in place. This clutching mechanismallows the user to spend a large amount of time moving theworkpiece around without the burden of continuous buttonpressure.
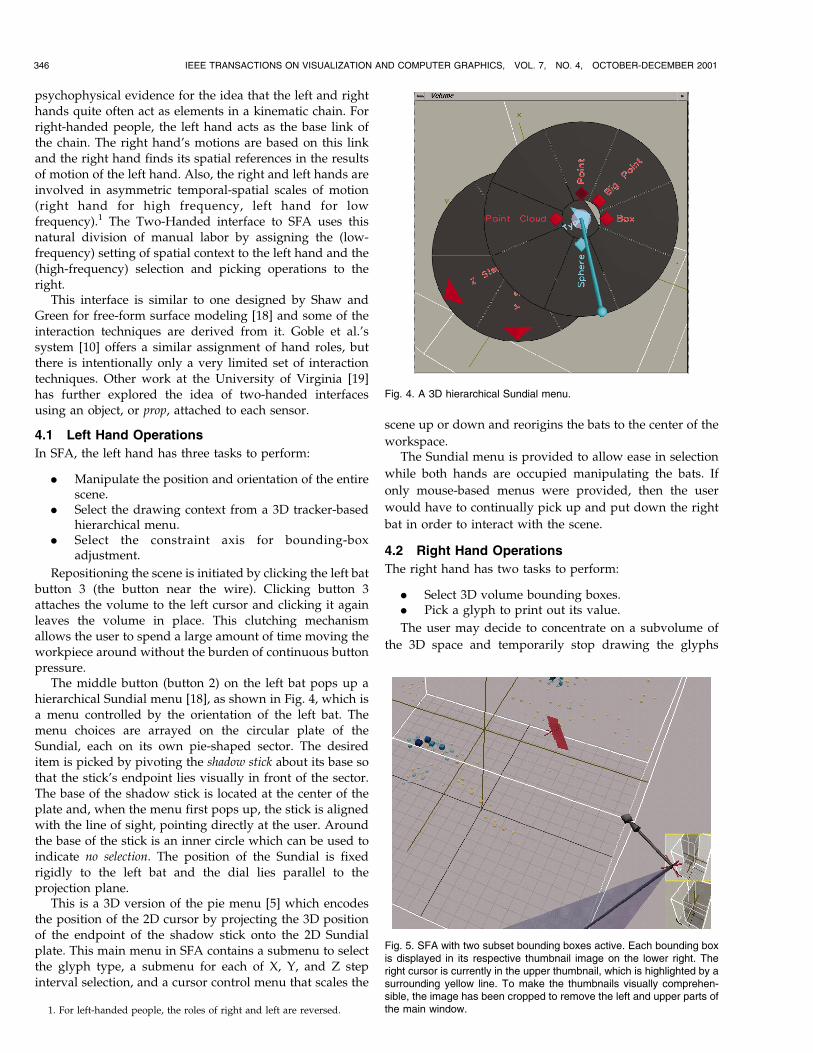
The middle button (button 2) on the left bat pops up ahierarchical Sundial menu [18], as shown in Fig. 4, which isa menu controlled by the orientation of the left bat. Themenu choices are arrayed on the circular plate of theSundial, each on its own pie-shaped sector. The desireditem is picked by pivoting the shadow stick about its base sothat the stick's endpoint lies visually in front of the sector.The base of the shadow stick is located at the center of theplate and, when the menu first pops up, the stick is alignedwith the line of sight, pointing directly at the user. Aroundthe base of the stick is an inner circle which can be used toindicate no selection. The position of the Sundial is fixedrigidly to the left bat and the dial lies parallel to theprojection plane.
This is a 3D version of the pie menu [5] which encodesthe position of the 2D cursor by projecting the 3D positionof the endpoint of the shadow stick onto the 2D Sundialplate. This main menu in SFA contains a submenu to selectthe glyph type, a submenu for each of X, Y, and Z stepinterval selection, and a cursor control menu that scales the
scene up or down and reorigins the bats to the center of the
workspace.The Sundial menu is provided to allow ease in selection
while both hands are occupied manipulating the bats. If
only mouse-based menus were provided, then the user
would have to continually pick up and put down the right
bat in order to interact with the scene.
4.2 Right Hand Operations
The right hand has two tasks to perform:
. Select 3D volume bounding boxes.
. Pick a glyph to print out its value.
The user may decide to concentrate on a subvolume of
the 3D space and temporarily stop drawing the glyphs
346 IEEE TRANSACTIONS ON VISUALIZATION AND COMPUTER GRAPHICS, VOL. 7, NO. 4, OCTOBER-DECEMBER 2001
1. For left-handed people, the roles of right and left are reversed.
Fig. 4. A 3D hierarchical Sundial menu.
Fig. 5. SFA with two subset bounding boxes active. Each bounding boxis displayed in its respective thumbnail image on the lower right. Theright cursor is currently in the upper thumbnail, which is highlighted by asurrounding yellow line. To make the thumbnails visually comprehen-sible, the image has been cropped to remove the left and upper parts ofthe main window.
outside this subvolume. To select this subvolume, the user
presses button 1 (furthest from the wire) on the right bat to
place one corner of the subvolume bounding box, drags the
right bat to the opposite corner, then releases the button.
While the button is pressed, the bounding box is drawn as a
semitransparent box, allowing the user to see which glyphs
will be enclosed by the bounding box as it is dragged out.
The bounding box disappears when the button is released
and SFA draws only the glyphs that were within the
bounding box. The user may restate the bounding volume
at any time by sweeping out a new bounding box.
4.2.1 Multiple Subvolumes
SFA actually makes up to eight bounding boxes available
and displays the glyphs in the union of these boxes. Each
bounding box can be individually resized, reshaped, or
deleted as the user sees fit. This bounding box control is
provided by a menu of thumbnails in a column on the right
of the main window (Fig. 5). Each thumbnail always shows
its respective semitransparent bounding box lying in the
main volume. Glyphs are not drawn in the thumbnails to
allow quick rendering. The currently selected bounding box
has its thumbnail highlighted and the user can restate the
currently selected bounding box by sweeping out a new box
in the main window. When the user moves the right cursor
into a thumbnail, the thumbnail highlights and the user
may select one of four bounding box operations from a
partial sundial menu by pressing right button 1. Thumbnail
intersection is actually a 2D operation where the projected
location of the cursor is intersected with the little thumbnail
window, allowing users to more easily select the thumbnail.The four bounding box operations available from the
thumbnail are:
. Restate the current bounding box.
. Add a new bounding box.
. Delete the current bounding box.
. Edit the current bounding box.
The restate operation is the default if right button 1 is
pressed in the main window. The new bounding box
operation will add a bounding box to the current set when
right button 1 is used to sweep out a bounding box. When
the sweep-out starts, a new thumbnail is added to show the
new bounding box. Delete simply removes the current
EBERT AND SHAW: MINIMALLY IMMERSIVE FLOW VISUALIZATION 347
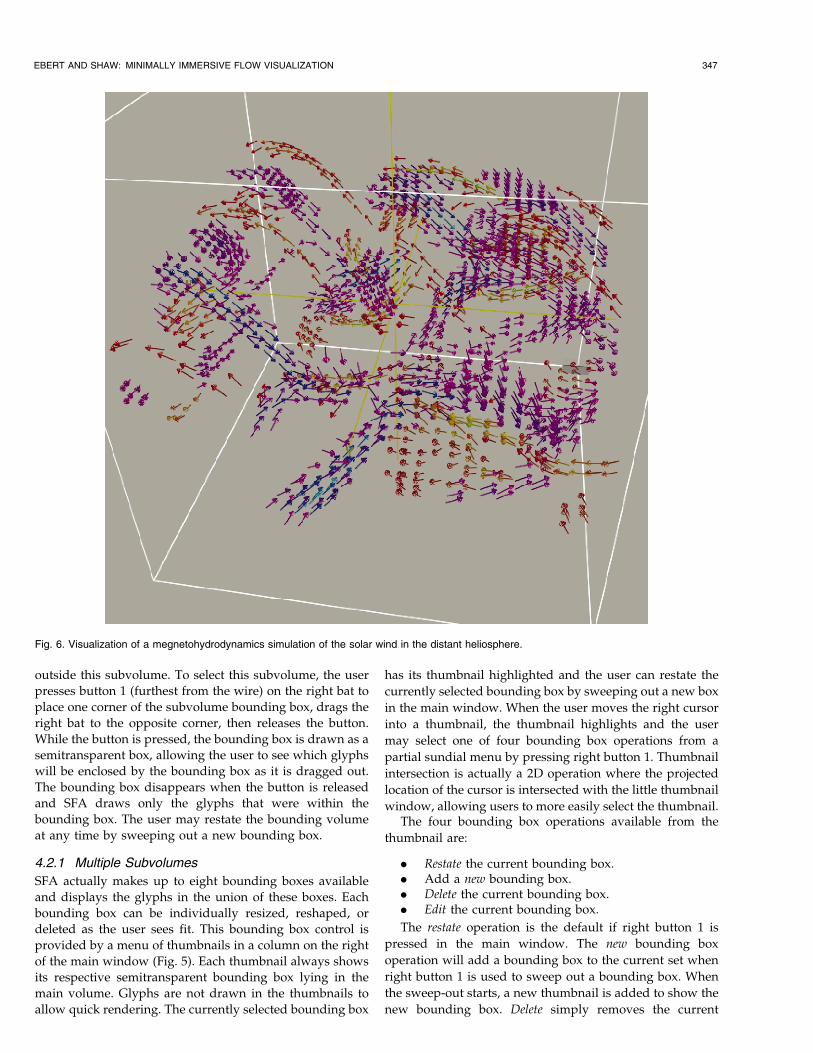
Fig. 6. Visualization of a megnetohydrodynamics simulation of the solar wind in the distant heliosphere.
bounding box from the list and its corresponding thumbnaildisappears.
The edit operation allows constrained editing of thecurrent bounding box. When edit is selected, thesemitransparent bounding box is drawn in the mainwindow, with one of its faces highlighted to indicate thatit is to be moved. This highlighting is determined by acombination of information from the left and right bats.The orientation of the left bat is used to state the axisalong which the bounding box will be edited. The rightbat's position with respect to the bounding box's centerdetermines which face is to be moved. The closest face tothe right cursor along the constraint axis is the onehighlighted for editing. Thus, while the left bat isgeometrically stating the constraint axis, the right batcan be selecting a face and starting the edit operation.
To effect the edit, the user presses right button 1, dragsthe highlighted face along the constraint axis (perpendicu-lar to the face), and releases right button 1. In order to avoidany inadvertent changes in snap axis, the constraint axisremains fixed while the edit operation takes place, so theleft hand does not need to hold a steady orientation duringediting.
The axis that is chosen by the left bat is the canonical axisclosest to the bat's Z vector. Both cursors change their shapeto reflect constrained edit mode, with the left cursorchanging to a short pole through a square and the right
cursor adding a short pole that snaps to the currentconstraint axis. The left cursor does not snap, but remainstied to the left bat because the canonical axis closest to thebat's Z vector (the pole axis in the left cursor) determinesthe constraint axis. The purpose of constrained editing is toallow the user fine control over bounding box shapewithout completely restating it from scratch. The userperceives an investment of effort in stating a bounding boxand editing allows the user to preserve that investment.
4.2.2 Glyph Selection
To select a glyph, the user orients a probe into the volumeand the closest glyph has its value printed and optionallypassed through a socket connection to software to allowcloser examination of this data point. A probe, representedby a narrow cylindrical shaft, is attached to the right cursorand the user controls the position and orientation of theprobe with the right bat. The distance from this probe iscomputed for each control point using a specializeddistance metric, called the probe metric [7], and the gridpoint generating the smallest probe metric value is the onepicked. The probe metric is designed to allow easy selectionof objects that are small and/or far away.
Because the user is selecting among many objects, theprobe axis is drawn to some arbitrary length and atranslucent cone is drawn. The probe is the cone axis anda spotlight is attached to the cursor that has identical visual
348 IEEE TRANSACTIONS ON VISUALIZATION AND COMPUTER GRAPHICS, VOL. 7, NO. 4, OCTOBER-DECEMBER 2001
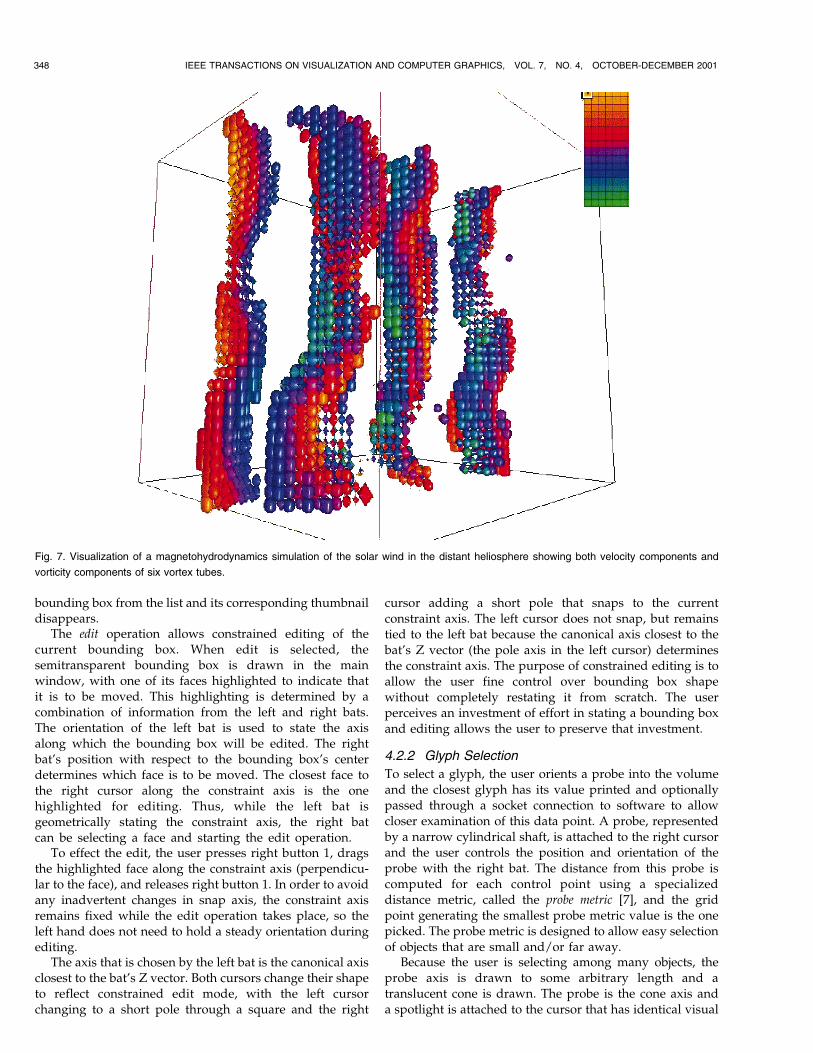
Fig. 7. Visualization of a magnetohydrodynamics simulation of the solar wind in the distant heliosphere showing both velocity components and
vorticity components of six vortex tubes.
geometry to the translucent cone. As the user sweeps theprobe about the scene, the objects that fall within the coneintersect visually with the cone wall and are highlighted bythe spotlight. This is purely a visual cue to help the userlocate the cone in 3D visual space.
5 RESULTS AND CONCLUSIONS
SFA is a perceptually motivated, minimally immersivevisualization system that allows multidimensional flowdata to be visualized, analyzed, and manipulated moreeasily than traditional visualization systems.
In terms of rendering, the glyph approach does not sufferthe initial costs of isosurface rendering or voxel-basedvolume rendering and, at the same time, offers thecapability of viewing the entire space. Thus, SFA allowsthe user to immediately examine and explore the data.
SFA has been used to visualize many scientific data sets,including gas plasma vortex data and other magnetofluidsimulations. Fig. 6 shows a visualization of a magnetohy-drodynamics simulation of the solar wind in the distantheliosphere (20 times the distance of the Earth to the Sun).The simulation data is a 33� 33� 33 grid containing thevector vorticity for the simulation.
The power of shape visualization can be seen in Fig. 7,which is another magnetohydrodynamics simulation of thesolar wind in the distant heliosphere. In this simulation, thedata is a 64� 64� 64 grid containing the vector vorticityand velocity for the simulation. Opacity is used to representvorticity in the j direction so that the six vortex tubes (only
four are visible) represent zones in space where thisvorticity is somewhat larger than zero. Glyph shape isbased inversely on the velocity in the j direction. Positivevelocities are displayed as larger, rounder-to-cuboid shapesand negative velocities are displayed as spiky, star-likeshapes. Zero velocity is represented by the diamond shape.The overall columnar pattern of the data is not disturbed bythe introduction of the shape mapping, but the velocityvariation can still be seen as we traverse the lengths of thetubes. In this case, values close to zero in terms of j vorticity(still fluid) have been masked out.
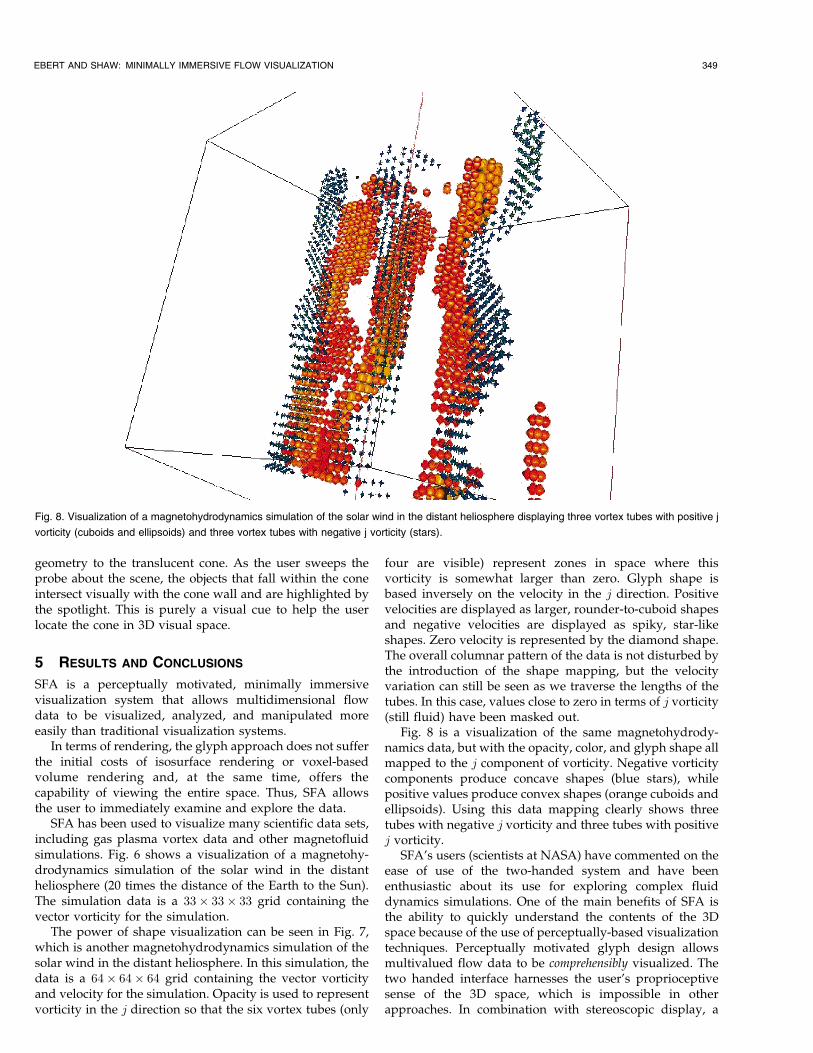
Fig. 8 is a visualization of the same magnetohydrody-namics data, but with the opacity, color, and glyph shape allmapped to the j component of vorticity. Negative vorticitycomponents produce concave shapes (blue stars), whilepositive values produce convex shapes (orange cuboids andellipsoids). Using this data mapping clearly shows threetubes with negative j vorticity and three tubes with positivej vorticity.
SFA's users (scientists at NASA) have commented on theease of use of the two-handed system and have beenenthusiastic about its use for exploring complex fluiddynamics simulations. One of the main benefits of SFA isthe ability to quickly understand the contents of the 3Dspace because of the use of perceptually-based visualizationtechniques. Perceptually motivated glyph design allowsmultivalued flow data to be comprehensibly visualized. Thetwo handed interface harnesses the user's proprioceptivesense of the 3D space, which is impossible in otherapproaches. In combination with stereoscopic display, a
EBERT AND SHAW: MINIMALLY IMMERSIVE FLOW VISUALIZATION 349
Fig. 8. Visualization of a magnetohydrodynamics simulation of the solar wind in the distant heliosphere displaying three vortex tubes with positive j
vorticity (cuboids and ellipsoids) and three vortex tubes with negative j vorticity (stars).
powerful 3D impression can be given to the user. Our
ulation, navigation, and analysis of multivariate, time-
varying volumetric data, increasing the quantity and clarity
of the information conveyed from the visualization system.
6 FUTURE EXTENSIONS
Several extensions can be made to the current system,
including further optimization of the rendering algorithms
to increase the performance of the system and the use of
texture memory to provide annotations to glyphs and help
distinguish glyph types.
ACKNOWLEDGMENTS
This project was supported by the US National Science
Foundation under grant CCR-9409243 and by US National
Aeronautics and Space Administration (NASA) under grant
NAG 5-2893.
REFERENCES
[1] A. Barr, ªSuperquadrics and Angle-Preserving Transformations,ºIEEE Computer Graphics and Applications, vol. 1, no. 1, pp. 11-23,1981.
[2] L.D. Bergman, J.S. Richardson, D.C. Richardson, and F.P.Brooks Jr., ªVIEWÐAn Exploratory Molecular VisualizationSystem with User-Definable Interaction Sequences,º ComputerGraphics (SIGGRAPH '93 Proc.), J.T. Kajiya, ed., vol. 27, pp. 117-126, Aug. 1993.
[3] J. Bertin, Semiology of Graphics. Univ. of Wisconsin Press, 1983.[4] S. Bryson and C. Levit, ªThe Virtual Wind Tunnel,º IEEE Computer
Graphics and Applications, vol. 12, no. 4, pp. 25-34, July 1992.[5] J. Callahan, D. Hopkins, M. Weiser, and B. Shneiderman, ªAn
Empirical Comparison of Pie vs. Linear Menus,º Proc. ACMCHI '88 Conf. Human Factors in Computing Systems, pp. 95-100,1988.
[6] W.S. Cleveland, The Elements of Graphing Data. Monterey, Calif.:Wadsworth Advanced Books and Software, 1985.
[7] D. Ebert, C. Shaw, A. Zwa, and C. Starr, ªTwo-Handed InteractiveStereoscopic Visualization,º Proc. IEEE Visualization '96, Oct. 1996.
[8] D.S. Ebert, ªAdvanced Geometric Modeling,º The Computer Scienceand Eng. Handbook, A. Tucker Jr., ed., chapter 56. CRC Press, 1997.
[9] J.D. Foley and C.F. McMath, ªDynamic Process Visualization,ºIEEE Computer Graphics and Applications, vol. 6, no. 3, pp. 16-25,Mar. 1986.
[10] J.C. Goble, K. Hinckley, R. Pausch, J.W. Snell, and N.F. Kassel,ªTwo-Handed Spatial Interface Tools for Neurosurgical Plan-ning,º Computer, vol. 28, no. 7, pp. 20-26, 1995.
[11] Y. Guiard, ªAsymmetric Division of Labor in Human SkilledBimanual Action: The Kinematic Chain as a Model,º J. MotorBehavior, vol. 19, no. 4, pp. 486-517, 1987.
[12] V. Interrante, P. Rheingans, J. Ferwerda, R. Gossweiler, and T.Filsinger, ªPrinciples of Visual Perception and Its Applications inComputer Graphics,º SIGGRAPH 97 Course Notes, No. 33, Aug.1997.
[13] A.J. Parker, C. Christou, B.G. Cumming, E.B. Johnston, M.J.Hawken, and A. Zisserman, ªThe Analysis of 3D Shape:Psychophysical Principles and Neural Mechanisms,º Understand-ing Vision, G.W. Humphreys, ed., chapter 8. Blackwell, 1992.
[14] F.J. Post, T. van Walsum, F.H. Post, and D. Silver, ªIconicTechniques for Feature Visualization,º Proc. Visualization '95,pp. 288-295, Oct. 1995.
[15] W. Ribarsky, E. Ayers, J. Eble, and S. Mukherjea, ªGlyphmaker:Creating Customized Visualizations of Complex Data,º Computer,vol. 27, no. 7, pp. 57-64, July 1994.
[16] H. Senay and E. Ignatius, ªA Knowledge-Based System forVisualization Design,º IEEE Computer Graphics and Applications,vol. 14, no. 6, pp. 36-47, Nov. 1994.
[17] H. Senay and E. Ignatius, ªRules and Principles of Scientific DataVisualization,º ACM SIGGRAPH HyperVis Project, http://homer.cs.gsu.edu/classes/percept/visrules.htm, 1996.
[18] C. Shaw and M. Green, ªTHRED: A Two-Handed DesignSystem,º Multimedia Systems J., vol. 3, no. 6, Nov. 1995.
[19] R. Stoakley, M.J. Conway, and R. Pausch, ªVirtual Reality on aWIM: Interactive Worlds in Miniature,º Proc. ACM CHI '95 Conf.Human Factors in Computing Systems, vol. 1, pp. 265-272, May 1995.
[20] R.M. Taylor, II, W. Robinett, V.L. Chi, F.P. Brooks Jr., W.V. Wright,R.S. Williams, and E.J. Snyder, ªThe Nanomanipulator: A VirtualReality Interface for a Scanning Tunnelling Microscope,º ComputerGraphics (SIGGRAPH '93 Proc.), J.T. Kajiya, ed., vol. 27, pp. 127-134, Aug. 1993.
[21] C. Ware and D.R. Jessome, ªUsing the Bat: A Six-DimensionalMouse for Object Placement,º IEEE Computer Graphics andApplications, vol. 8, no. 6, pp. 65-70, Nov. 1988.
David S. Ebert received the BS, MS, and PhDdegrees in computer and information sciencefrom the Ohio State University in 1986, 1988,and 1991, respectively. He is an associateprofessor in the School of Electrical and Com-puter Engineering at Purdue University. Hisresearch interests include scientific, information,and medical visualization, realistic rendering andanimation of gases, and procedural modelingand animation. He is a member of the IEEE and
the IEEE Computer Society.
Christopher D. Shaw received the PhD andMSc degrees in computing science from theUniversity of Alberta in 1997 and 1988,respectively, and the BMath degree in com-puter science from the University of Waterlooin 1986. He is a research scientist at theGVU Center in the College of Computing atthe Georgia Institute of Technology. Hisresearch interests are in virtual reality (VR)and two-handed 3D user interfaces for
scientific and information visualization and 3D CAD. He haspublished more than 40 papers on these topics. He is coarchitectof the MR Toolkit, VR software which is licensed by more than 600research institutions worldwide. He is papers cochair for ACM VRST2001 and panels chair for SIGGRAPH 2002.
. For more information on this or any computing topic, please visitour Digital Library at http://computer.org/publications/dlib.
350 IEEE TRANSACTIONS ON VISUALIZATION AND COMPUTER GRAPHICS, VOL. 7, NO. 4, OCTOBER-DECEMBER 2001