Minimum fluidization velocity, bubble behaviour and pressure drop in fluidized beds with a range of particle sizes
B. M. Halvorsen1,2 & B. Arvoh1
1Institute of Process, Energy and Environmental Technology, Telemark University College, Norway 2Telemark Technological R&D Centre (Tel-Tek), Norway
Abstract
Fluidized beds are used in the production of pure silicon for solar cells. The particles are fully consumed during the reaction and the particles in the reactor have a large range of diameters. When the range of particle sizes is wide, the particles have a tendency to segregate. A series of experiments are performed to study the particle segregation and the influence of particle segregation on the bubble formation and flow behaviour. Experiments are performed in a two dimensional bed. The minimum fluidization velocity and the pressure drop have been measured. Spherical glass particles with different ranges of particle sizes are used in the experiments. Superficial gas velocities well above the minimum fluidization velocities are used in the study of segregation and bubble formation. Corresponding simulations are performed by using the commercial CFD code Fluent 6.3. The computational results are compared to the experimental data and the discrepancies are discussed. Keywords: fluidized bed, minimum fluidization velocity, particle size, pressure drop, particle segregation, fluent.
1 Introduction
Fluidized beds are widely used in industrial operations due to their large contact area between phases, which enhances chemical reactions, heat transfer and mass transfer. The efficiency of a fluidized bed reactor is highly dependent on the flow conditions which also control the mixing of the bed. Particle sizes, range of
particle sizes, particle size distribution and superficial gas velocity are influencing on the flow behaviour and mixing. Fluidized bed reactors are used in production of silicon for solar cells. The gas-particle reaction is a continuous process where the particles are fully consumed during the reaction and the particles in the reactor may therefore have particle diameters that range from 0 to about 500 µm. In a reactor like this, the temperature becomes very high and it is therefore extremely important to keep the particles fluidized and well mixed. The aim of this work is to study how the range of particle sizes and the particle size distribution influence on the flow behaviour in fluidized bed. When the powders have a large range of particle sizes, the chance of segregation is significant. Segregation and low degree of mixing may give very high temperatures in parts of the bed, and the consequence may be melting of the reactor. Knowledge about mixing and segregation are therefore essential.
2 Fluidized bed dynamics
2.1 Characterization of particles
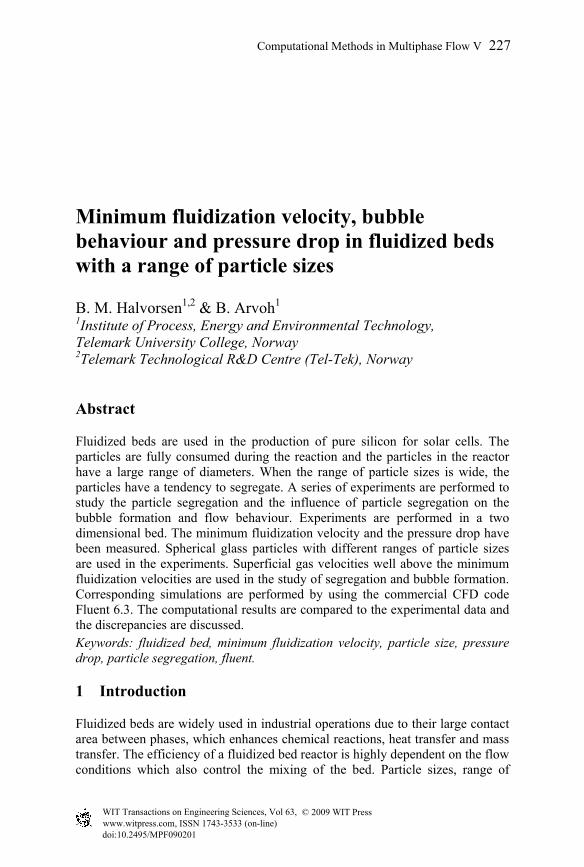
Computational studies have been performed on a two dimensional fluidized bed. Spherical particles with a mean diameter of 154 µm, 488 µm and 960 µm and a density of 2485 kg/m3 are used. The behaviour of particles in fluidized beds depends on a combination of the particle size and density. Geldart fluidization diagram [1], shown in Figure 1, is used to identify characteristics associated with fluidization of powders. The dots represent the powders used in this study. The powder with mean diameter of 154 µm is close to group A particles, whereas the powder with mean diameter of 960 µm is close to group D particles. The fluidization properties for these groups of particles differ significantly from each other.
Figure 1: Geldart classification of particles [1].
Particles characterized in group A are easily fluidized and the bed expands considerably before bubbles appear. This is due to inter-particle forces that are present in group A powders [2]. For group B particles the inter-particle forces are negligible and bubbles are formed as the gas velocity reaches the minimum fluidization velocity. The bed expansion is small compared to group A particles. Geldart group D describes large and/or dense particle powders. These powders need a large amount of gas to get fluidized, and bubbles may occur if the gas velocity is kept close to the minimum fluidization velocity. Group D powders give low degree of solid mixing and gas back-mixing compared to group A and B powders [3].
2.2 Model
Computational studies have been performed on a two dimensional fluidized bed. The computational work is performed by using the commercial CFD code Fluent 6.3. The model is based on an Eulerian description of the gas and the particle phases. The combinations of models that are used in this work are presented in Table 1:
Solid pressure Ma-ahmadi In a bubbling fluidized bed the concentration of particles varies from very low to very high. In dilute regions, the kinetic of the particles will dominate the solids viscosity, and the solid pressure will be close to zero. In regions with higher concentration of particles, the collisions between particles will dominate the solids viscosity, and the solid pressure will increase. At very high concentration of particles, the frictional stresses dominate the solid viscosity. The drag describes the momentum exchange between phases and is expressed by the drag coefficient in the momentum equation. The Syamlal & O’Brien drag model is expressed by [4]:
sr
sgggsDsg dv
UUC 24
3 −=Φ
ρεε (1)
where εg and εs are the gas and solid fractions, ρg is the gas density, Ug and Us are the gas and solid velocities and ds is the particle diameter. The terminal velocity correlation for the solid phase, vr, is a function of void fraction and Reynolds number. An empirical equation for vr is developed by Garside and Al Dibuouni [5]. The drag factor is proposed by Dalla Valle [6] and is expressed by:
The minimum fluidization velocity can be developed from the buoyant-equals-drag balance:
( )( ) )(1 sgg
sggsg uug −
Φ=−−
ερρε (3)
where the drag coefficient is developed by Syamlal & O’Brien. The equation for minimum fluidization velocity is [7]:
( )( )sg
gsmfmfmf
gU
Φ
−−=
ρρεε 12 (4)
Multiple particle phases are used in the simulations to account for the particle size distribution. The model, Syamlal-O’Brien-symmetric, is used to express the particle-particle momentum exchange [8]. The radial distribution function included in the Syamlal-O’Brien-symmetric equation is expressed by Ma and Ahmadi [9].
3 Results
Flow behaviour in a two dimensional bed with a uniform air distribution is studied experimentally and computationally. The purpose of this work is to study minimum fluidization velocity, particle segregation, bubble activity and pressure drop on a simple well-defined model. The experimental results are used to validate the CFD model that is used in the simulations.
3.1 Experimental set-up
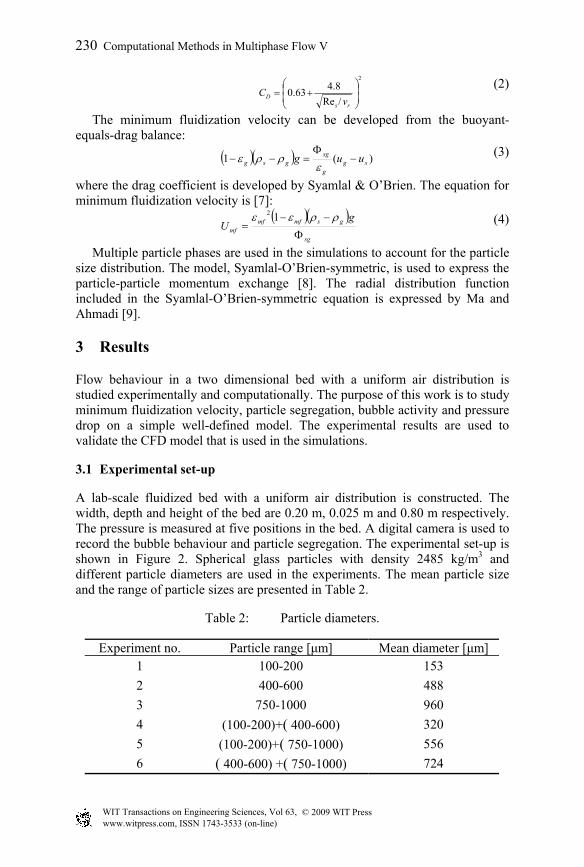
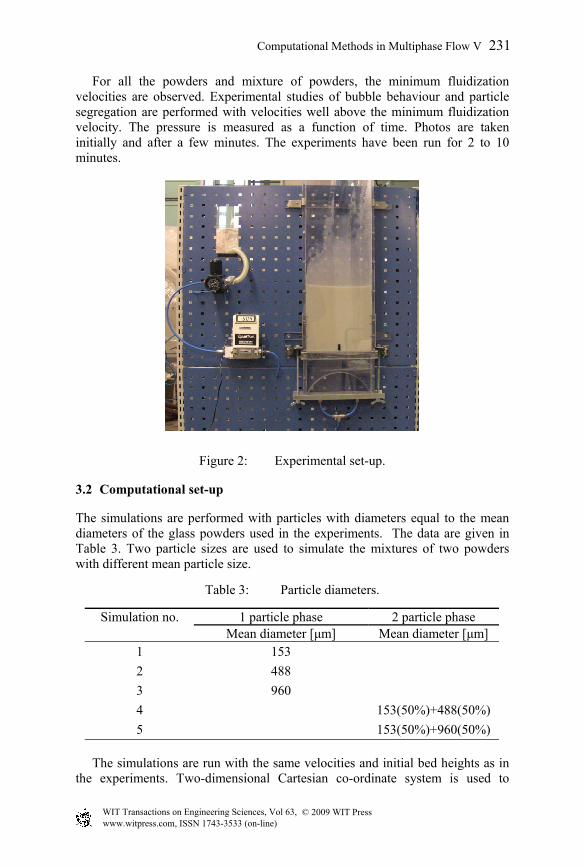
A lab-scale fluidized bed with a uniform air distribution is constructed. The width, depth and height of the bed are 0.20 m, 0.025 m and 0.80 m respectively. The pressure is measured at five positions in the bed. A digital camera is used to record the bubble behaviour and particle segregation. The experimental set-up is shown in Figure 2. Spherical glass particles with density 2485 kg/m3 and different particle diameters are used in the experiments. The mean particle size and the range of particle sizes are presented in Table 2.
For all the powders and mixture of powders, the minimum fluidization velocities are observed. Experimental studies of bubble behaviour and particle segregation are performed with velocities well above the minimum fluidization velocity. The pressure is measured as a function of time. Photos are taken initially and after a few minutes. The experiments have been run for 2 to 10 minutes.
Figure 2: Experimental set-up.
3.2 Computational set-up
The simulations are performed with particles with diameters equal to the mean diameters of the glass powders used in the experiments. The data are given in Table 3. Two particle sizes are used to simulate the mixtures of two powders with different mean particle size.
Table 3: Particle diameters.
1 particle phase 2 particle phase Simulation no. Mean diameter [µm] Mean diameter [µm]
The simulations are run with the same velocities and initial bed heights as in the experiments. Two-dimensional Cartesian co-ordinate system is used to
describe the geometry. The grid is uniform in both horizontal and vertical direction, and the grid size is 0.5x0.5 mm. The models used are given in Table 1. The simulations have been run for 10 to 30 s.
3.3 Results
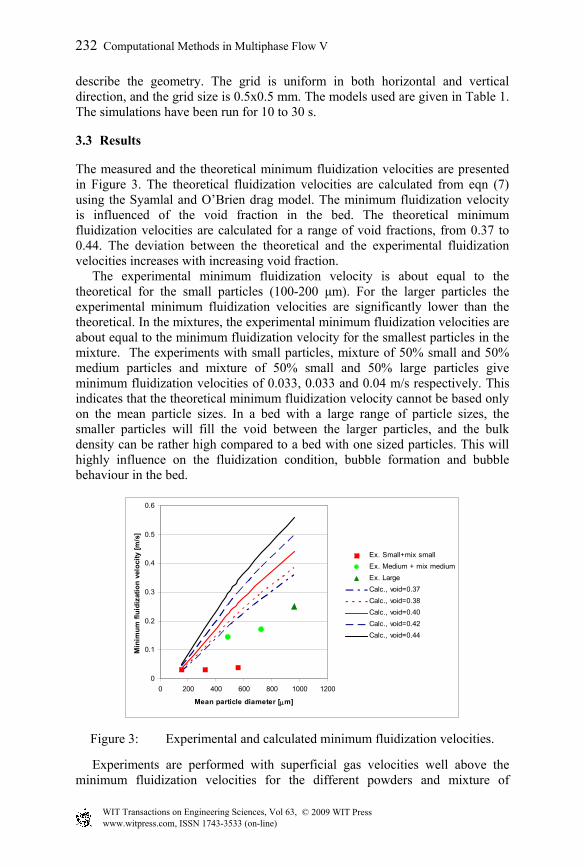
The measured and the theoretical minimum fluidization velocities are presented in Figure 3. The theoretical fluidization velocities are calculated from eqn (7) using the Syamlal and O’Brien drag model. The minimum fluidization velocity is influenced of the void fraction in the bed. The theoretical minimum fluidization velocities are calculated for a range of void fractions, from 0.37 to 0.44. The deviation between the theoretical and the experimental fluidization velocities increases with increasing void fraction. The experimental minimum fluidization velocity is about equal to the theoretical for the small particles (100-200 µm). For the larger particles the experimental minimum fluidization velocities are significantly lower than the theoretical. In the mixtures, the experimental minimum fluidization velocities are about equal to the minimum fluidization velocity for the smallest particles in the mixture. The experiments with small particles, mixture of 50% small and 50% medium particles and mixture of 50% small and 50% large particles give minimum fluidization velocities of 0.033, 0.033 and 0.04 m/s respectively. This indicates that the theoretical minimum fluidization velocity cannot be based only on the mean particle sizes. In a bed with a large range of particle sizes, the smaller particles will fill the void between the larger particles, and the bulk density can be rather high compared to a bed with one sized particles. This will highly influence on the fluidization condition, bubble formation and bubble behaviour in the bed.
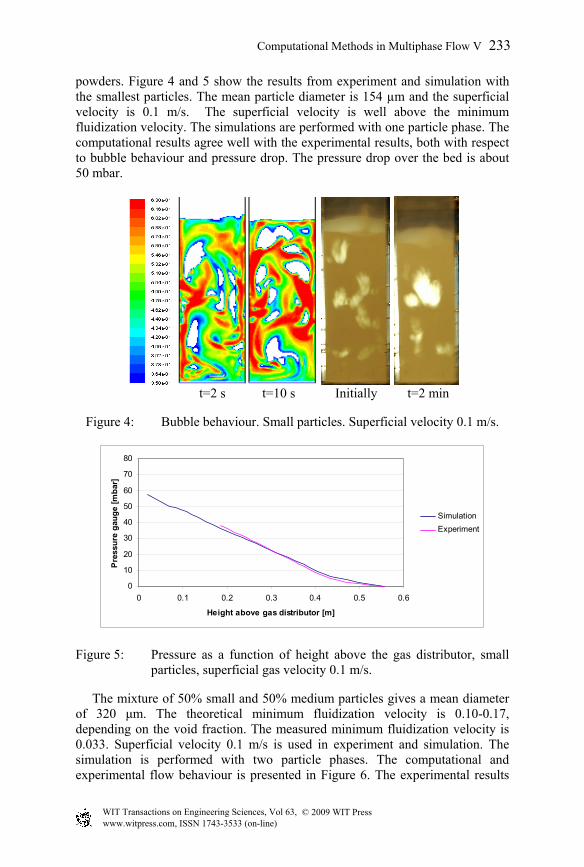
powders. Figure 4 and 5 show the results from experiment and simulation with the smallest particles. The mean particle diameter is 154 µm and the superficial velocity is 0.1 m/s. The superficial velocity is well above the minimum fluidization velocity. The simulations are performed with one particle phase. The computational results agree well with the experimental results, both with respect to bubble behaviour and pressure drop. The pressure drop over the bed is about 50 mbar.
t=2 s t=10 s Initially t=2 min
Figure 4: Bubble behaviour. Small particles. Superficial velocity 0.1 m/s.
0
10
20
30
40
50
60
70
80
0 0.1 0.2 0.3 0.4 0.5 0.6
Height above gas distributor [m]
Pres
sure
gau
ge [m
bar]
SimulationExperiment
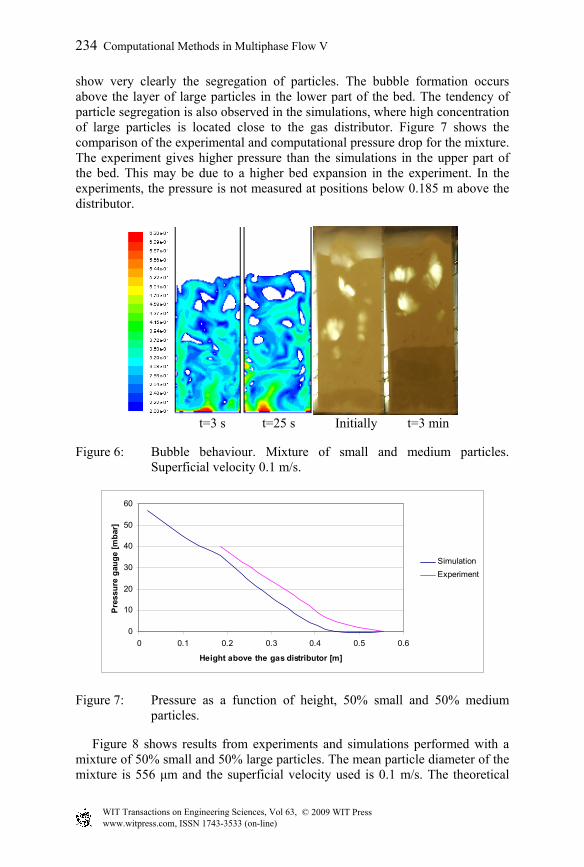
Figure 5: Pressure as a function of height above the gas distributor, small particles, superficial gas velocity 0.1 m/s.
The mixture of 50% small and 50% medium particles gives a mean diameter of 320 µm. The theoretical minimum fluidization velocity is 0.10-0.17, depending on the void fraction. The measured minimum fluidization velocity is 0.033. Superficial velocity 0.1 m/s is used in experiment and simulation. The simulation is performed with two particle phases. The computational and experimental flow behaviour is presented in Figure 6. The experimental results
show very clearly the segregation of particles. The bubble formation occurs above the layer of large particles in the lower part of the bed. The tendency of particle segregation is also observed in the simulations, where high concentration of large particles is located close to the gas distributor. Figure 7 shows the comparison of the experimental and computational pressure drop for the mixture. The experiment gives higher pressure than the simulations in the upper part of the bed. This may be due to a higher bed expansion in the experiment. In the experiments, the pressure is not measured at positions below 0.185 m above the distributor.
t=3 s t=25 s Initially t=3 min
Figure 6: Bubble behaviour. Mixture of small and medium particles. Superficial velocity 0.1 m/s.
0
10
20
30
40
50
60
0 0.1 0.2 0.3 0.4 0.5 0.6
Height above the gas distributor [m]
Pres
sure
gau
ge [m
bar]
SimulationExperiment
Figure 7: Pressure as a function of height, 50% small and 50% medium particles.
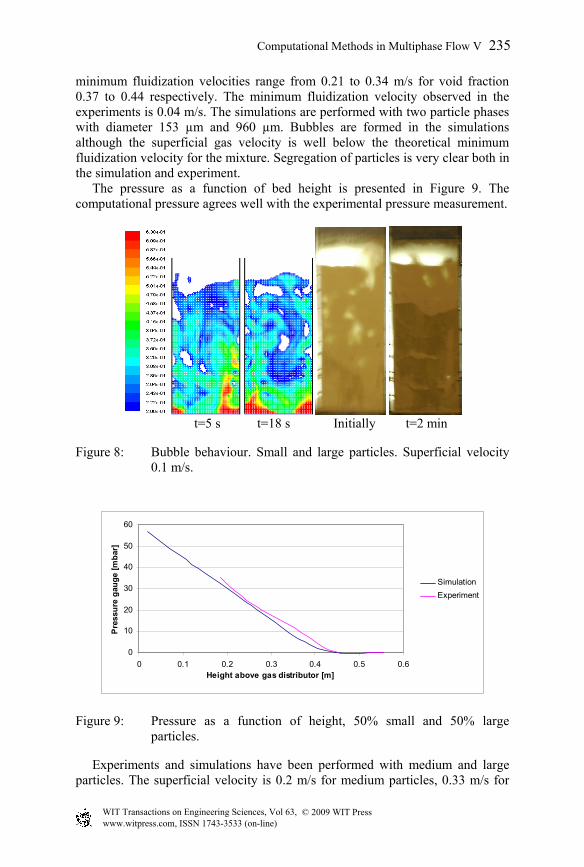
Figure 8 shows results from experiments and simulations performed with a mixture of 50% small and 50% large particles. The mean particle diameter of the mixture is 556 µm and the superficial velocity used is 0.1 m/s. The theoretical
minimum fluidization velocities range from 0.21 to 0.34 m/s for void fraction 0.37 to 0.44 respectively. The minimum fluidization velocity observed in the experiments is 0.04 m/s. The simulations are performed with two particle phases with diameter 153 µm and 960 µm. Bubbles are formed in the simulations although the superficial gas velocity is well below the theoretical minimum fluidization velocity for the mixture. Segregation of particles is very clear both in the simulation and experiment. The pressure as a function of bed height is presented in Figure 9. The computational pressure agrees well with the experimental pressure measurement.
t=5 s t=18 s Initially t=2 min
Figure 8: Bubble behaviour. Small and large particles. Superficial velocity 0.1 m/s.
Figure 9: Pressure as a function of height, 50% small and 50% large particles.
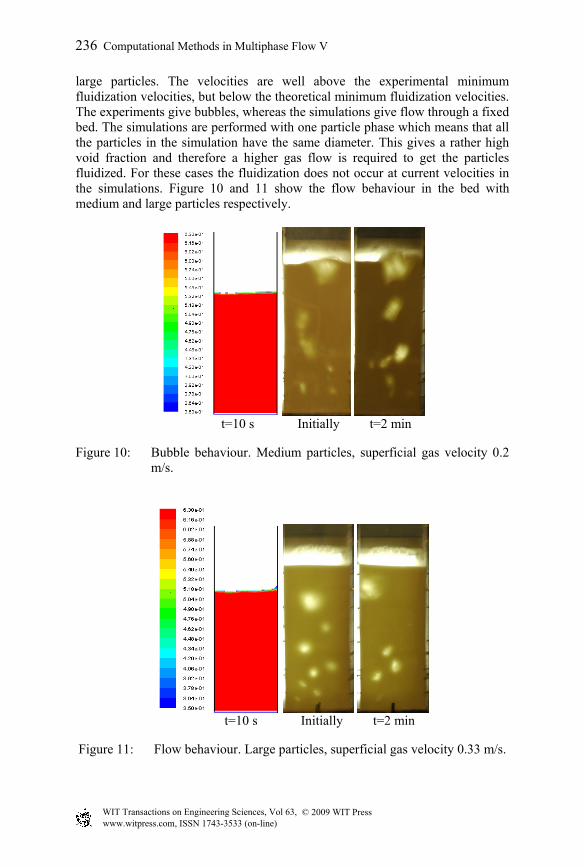
Experiments and simulations have been performed with medium and large particles. The superficial velocity is 0.2 m/s for medium particles, 0.33 m/s for
large particles. The velocities are well above the experimental minimum fluidization velocities, but below the theoretical minimum fluidization velocities. The experiments give bubbles, whereas the simulations give flow through a fixed bed. The simulations are performed with one particle phase which means that all the particles in the simulation have the same diameter. This gives a rather high void fraction and therefore a higher gas flow is required to get the particles fluidized. For these cases the fluidization does not occur at current velocities in the simulations. Figure 10 and 11 show the flow behaviour in the bed with medium and large particles respectively.
t=10 s Initially t=2 min
Figure 10: Bubble behaviour. Medium particles, superficial gas velocity 0.2 m/s.
t=10 s Initially t=2 min
Figure 11: Flow behaviour. Large particles, superficial gas velocity 0.33 m/s.
Flow behaviour in a two dimensional bed with a uniform air distribution is studied experimentally and computationally. The experiments are performed with spherical glass particles with different particle sizes and range of particle sizes. The minimum fluidization velocity is measured for all the different powders. The pressure is measured at different heights of the bed. The bubble behaviour is observed by using a digital camera. Corresponding simulations are performed by using the commercial CFD code Fluent 6.3. The model is based on a multi-fluid Eulerian description of the phases. The measured minimum fluidization velocities are compared to theoretical minimum fluidization velocities. The theoretical minimum fluidization velocities are developed from the buoyant-equals-drag balance by using Syamlal & O’Brien drag coefficient. The theoretical minimum fluidization velocity is significantly higher than the observed experimental velocity except for the smallest particles. This may be due to the particle size distribution and range of particle sizes in the experimental powder which influence on the void fraction and fluidization properties. The theoretical minimum fluidization velocity is based on a mean particle diameter. Powders with mono-sized particles have a significantly higher void fraction than powders with a particle size distribution. 50%-50% mixtures of two powders has a about the same minimum fluidization velocity as the smallest particles in the mixture. Comparison of computational and experimental bubble behaviour is performed, and the results show good agreement according to bubble formation, pressure drop and particle segregation for the small and mixtures of small and larger particles. Simulations with medium and large particles give no fluidization, whereas fluidization and bubbles are obtained in the corresponding experiments. This indicates that more than one particle phase is needed in the simulation to account for the particle size distribution in the powder.
References
[1] Geldart, D., Types of Gas Fluidization, Powder Technology, 7, pp. 285-295, 1973.
[2] Geldart, D., Gas Fluidization Technology, John Wiley & Sons Ltd., 1986. [3] Kunii, D., Levenspiel, O., Fluidization Engineering, Second Edition,
Butterworth-Heinemann, Newton, US, 1991. [4] Syamlal, M., O’Brien, T.J., A Generalized Drag Correlation for Multi-
particle Systems, Morgantown Energy Technology Center, 1987. [5] Garside, J. & Al Dibuouni, M.R., Velocity-Voidage Relationships for
Fluidization and Sedimentation, I&EC Process Des. Dev., 16, pp. 206-214, 1977
[6] Dalla Valle, J.M., Micromeritics, Pitman, London, 1948. [7] Gidaspow, D., Multiphase Flow and Fluidization, Academic Press, Boston,
[8] Syamlal, M., The Particle-Particle Drag Term in a Multiparticle Model of Fluidization., National Technical Information Service, Springfield, VA, 1987.
[9] Ma, D., Ahmadi, G., Thermodynamical Formulation for Dispersed Multi-phase Turbulent Flows, Int. J. Multiphase Flow, 16, pp. 323-351, 1990.