Page 1
Minimum Wages for Those with Alternate Rates in
British ColumbiaFarm Workers Paid by Piece Rate
Liquor Servers
Live-in Home Support Workers
Resident Caretakers
Live-in Camp Leaders
BC FAIR WAGES COMMISSION REPORT AND RECOMMENDATIONS TO THE MINISTER OF LABOUR
Marjorie Griffin Cohen, Chair | Ivan Limpright, Member | Ken Peacock, Member
Second Report March 2018
Page 2
2
British Columbia Fair Wages Commission
An Independent Commission Appointed by the Minister of Labour
March 12, 2018
Honourable Harry Bains
Minister of Labour
Government of British Columbia
Dear Minister Bains:
The BC Fair Wages Commission began its work in October 2017 and its first report, The Transition
to a $15 Minimum Wage and Subsequent Increases, was delivered in January 2018.
I am pleased to present this second report, Minimum Wages for Those with Alternative Rates in British
Columbia: Farm Workers Paid by Piece Rate, Liquor Servers, Live-in Home Support Workers, Resident
Caretakers, Live-in Camp Leaders.
This report makes recommendations for increasing the alternative minimum wages for these five
groups of workers.
Our third report on the recommendations for reconciling the discrepancy between the minimum
wage and a liveable wage will be available later in 2018.
Sincerely,
Marjorie Griffin Cohen
Chair, BC Fair Wages Commission
Page 3
3
Minimum Wages for Those with Alternative Rates in British Columbia:
Farm Workers Paid by Piece Rate, Liquor Servers, Live-in Home Support
Workers, Resident Caretakers, Live-in Camp Leaders
BC Fair Wages Commission Report and Recommendations to the Minister of Labour
Signed this 12th day of March, 2018.
Chair, Marjorie Griffin Cohen
Signed this 12th day of March, 2018.
Member, Ken Peacock
Signed this 12th day of March, 2018.
Member, Ivan Limpright
Page 4
4
Acknowledgments
THIS SECOND REPORT of the BC Fair Wages Commission (FWC) has benefited from the advice and
research of individuals we would like to acknowledge and extend our thanks.
The material from public consultations helped us to understand the issue from the different perspectives
of workers, employers, and those in the broader community. This required a great deal of effort on
the part of those who participated in the public consultations, wrote research briefs, and made other
representations. We very much appreciate the time and effort involved.
The FWC was established in October 2018 by the BC Ministry of Labour as a commission that is separate
and distinct from government. This meant that the FWC alone determined its method of enquiry,
research approaches, and pathways to making decisions. We did rely on the Ministry for various logistics
that were crucial for our deliberations. These included the Ministry staff involved in travel logistics; the
research staff that helped track down documents and tried to answer questions about past decision-
making; the communications staff who helped with the website, coordinated the large amount of material
communicated to the FWC through the website, and performed other communications issues; and the
finance staff who managed research contracts and other expense issues. The FWC also acknowledges
the considerable help from the Deputy Minister, Trevor Hughes, in facilitating meetings and contact with
other Ministry staff, and the Minister, Harry Bains, for his support throughout the process.
This report on the alternative minimum wages relied heavily on specific research reports. We very much
appreciate the work of the experts who took on these tasks and agreed to complete them in a very short
time period. Mark Thompson provided the report on the farm workers piece rates, Fiona MacPhail
provided the report on liquor servers, and Kendra Strauss provided the report on live-in home support
workers. These three excellent reports have greatly informed our deliberations.
Jessica Knowler worked as the project coordinator on both reports of the FWC. The FWC benefited from
her talent and abilities. As the only staff person, this meant she had to engage in a wide range of activities
but in all she demonstrated a high degree of professionalism and skill.
Page 5
5
Table of contents
ACKNOWLEDGMENTS ..............................................................................................................................................................4
EXECUTIVE SUMMARY ..........................................................................................................................................8
Recommendations ............................................................................................................................................................. 9
Farm workers paid by piece rate ...................................................................................................................... 9
Liquor servers ....................................................................................................................................................... 10
Live-in home support workers ....................................................................................................................... 11
Resident caretakers ........................................................................................................................................... 11
Live-in camp leaders .......................................................................................................................................... 12
Permanent fair wages commission .............................................................................................................. 13
1 INTRODUCTION ............................................................................................................................................... 14
Methods used to inform recommendations ......................................................................................................... 16
Research ................................................................................................................................................................. 17
Consultations ........................................................................................................................................................ 17
Context ................................................................................................................................................................................ 19
2 FARM WORKERS PAID BY PIECE RATE ................................................................................................... 20
Context ................................................................................................................................................................................ 20
Findings from consultations ........................................................................................................................................ 21
Public consultations ........................................................................................................................................... 21
Research findings ............................................................................................................................................................ 26
History of piece rates in BC ............................................................................................................................. 26
Changes in piece rates and general minimum wage .............................................................................. 30
Other jurisdictions .............................................................................................................................................. 32
Characteristics of piece rate workers ......................................................................................................... 33
Conclusions and recommendations ......................................................................................................................... 33
Page 6
6
3 LIQUOR SERVERS ............................................................................................................................................ 36
Context ................................................................................................................................................................................ 36
Findings from public consultations........................................................................................................................... 38
Employers ............................................................................................................................................................... 39
Workers, trade unions, and community groups ...................................................................................... 40
Research findings ............................................................................................................................................................ 41
Characteristics of liquor servers in BC ....................................................................................................... 41
Changes to liquor server minimum wages ................................................................................................ 43
Analysis of liquor servers’ wages and working conditions .............................................................................. 44
Tipping ..................................................................................................................................................................... 44
Sexual harassment of liquor servers ............................................................................................................ 46
Hours of work and income............................................................................................................................... 46
Comparison with other jurisdictions ........................................................................................................... 47
Conclusions and recommendations ......................................................................................................................... 48
4 LIVE-IN HOME SUPPORT WORKERS ....................................................................................................... 50
Context ................................................................................................................................................................................ 50
Findings ............................................................................................................................................................................... 51
History of minimum wage for home support workers ......................................................................... 51
Other provinces ................................................................................................................................................... 53
Characteristics of home support workers ................................................................................................. 54
Wages for general category of home care workers ............................................................................... 54
Information from public consultations ....................................................................................................... 55
Conclusions and recommendations ......................................................................................................................... 56
5 RESIDENT CARETAKERS ............................................................................................................................... 57
Context ................................................................................................................................................................................ 57
Comparisons with other provinces .............................................................................................................. 58
Findings from consultations ........................................................................................................................................ 59
Conclusions and recommendations ......................................................................................................................... 59
6 LIVE-IN CAMP LEADERS ............................................................................................................................... 61
Context ................................................................................................................................................................................ 61
Comparisons with other provinces .............................................................................................................. 62
Findings from consultations ........................................................................................................................................ 62
Conclusions and recommendations ......................................................................................................................... 63
Page 7
7
7 PERMANENT FAIR WAGES COMMISSION ............................................................................................ 65
8 SUMMARY OF RECOMMENDATIONS ..................................................................................................... 67
Farm workers paid by piece rate ............................................................................................................................... 67
Liquor servers ................................................................................................................................................................... 68
Live-in home support workers .................................................................................................................................... 69
Resident caretakers ........................................................................................................................................................ 69
Live-in camp leaders ....................................................................................................................................................... 70
Permanent fair wages commission ........................................................................................................................... 70
APPENDICES
Appendix I. Terms of Reference for the Fair Wages Commission ........................................................ 71
Appendix II. BC minimum wage legislation ..................................................................................................... 74
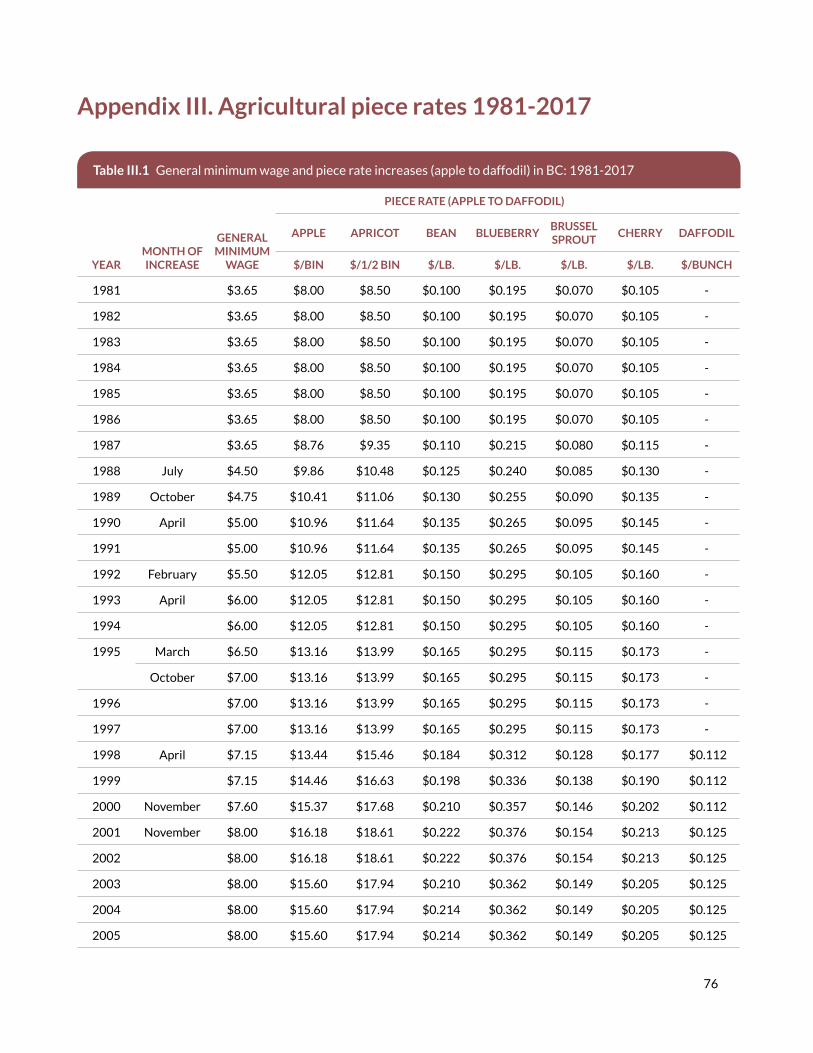
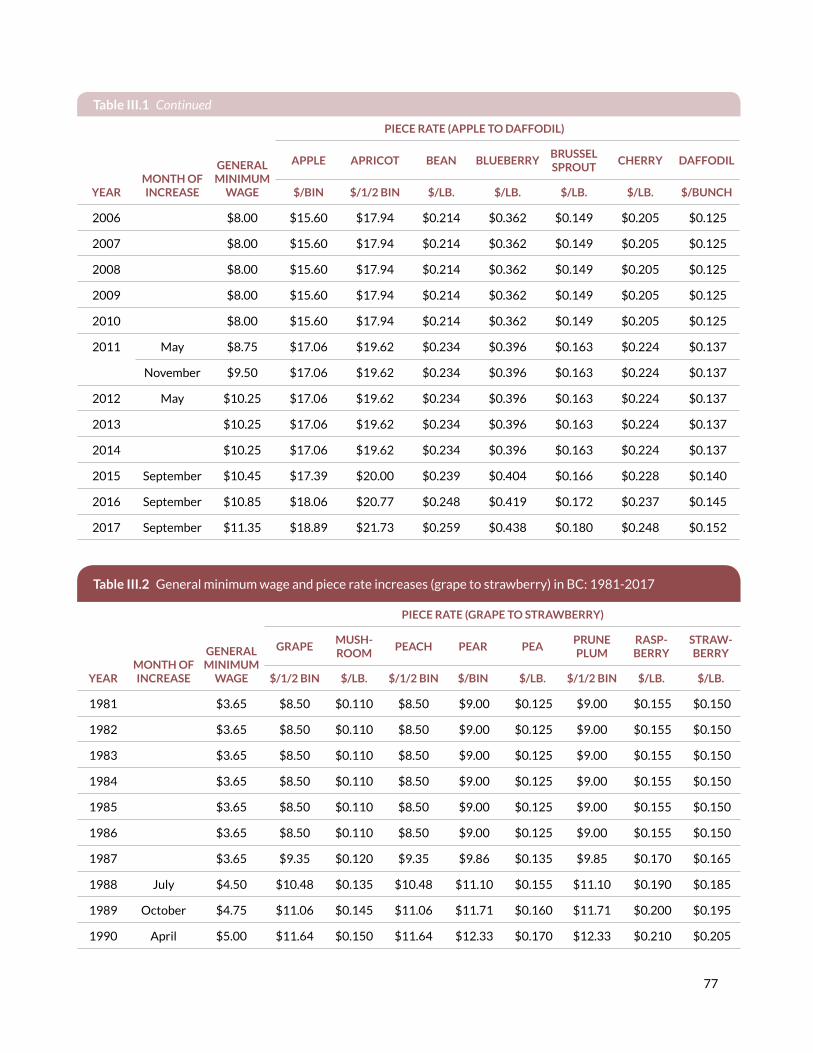
Appendix III. Agricultural piece rates 1981-2017 ......................................................................................... 76
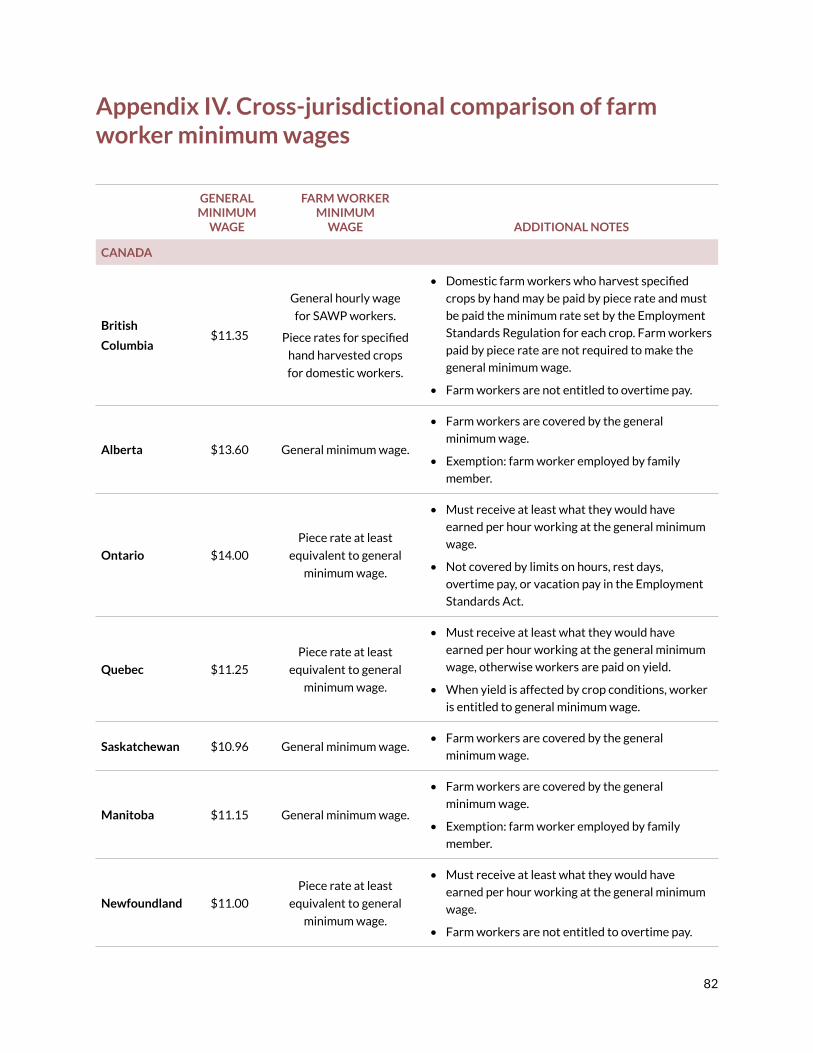
Appendix IV. Cross-jurisdictional comparison of farm worker minimum wages .............................. 82
Appendix V. Share of liquor servers in BC by job characteristics: 2016 ............................................. 84
Appendix VI. Share of liquor servers in BC by hourly wage and weekly household earnings: 2016 .................................................................................................................................. 85
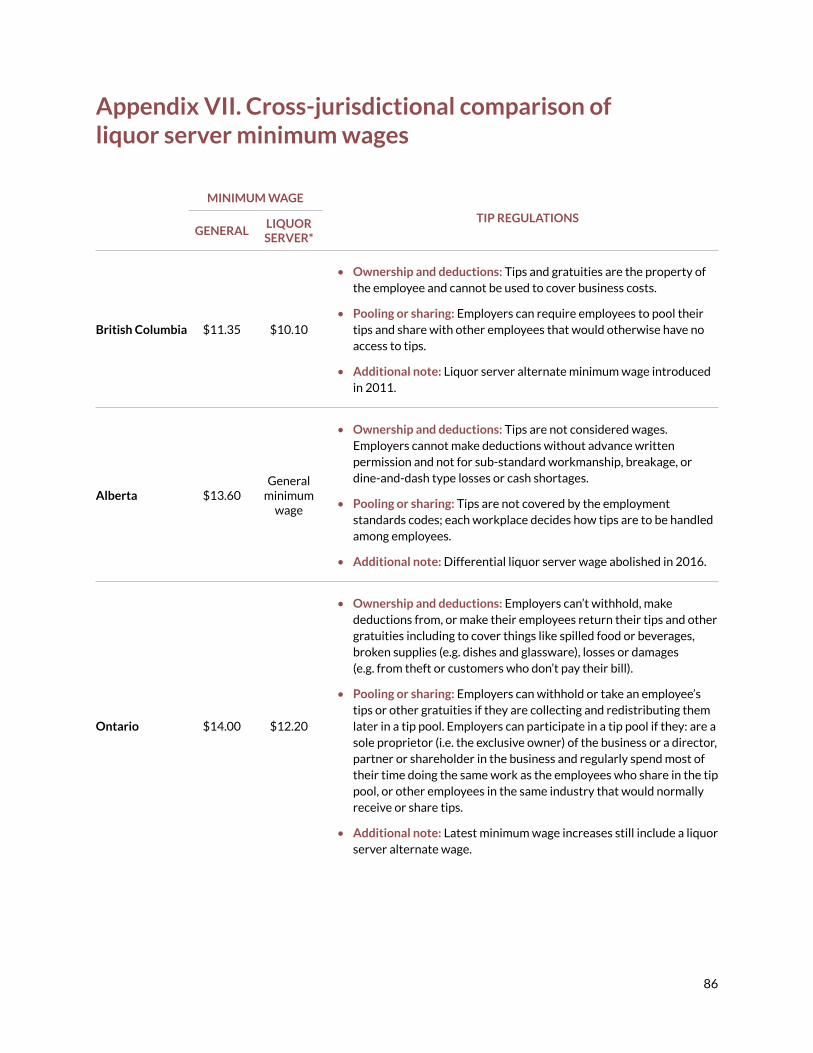
Appendix VII. Cross-jurisdictional comparison of liquor server minimum wages ............................. 86
Appendix VIII. Cross-jurisdictional comparison of live-in caregivers and equivalents ..................... 89
LIST OF TABLES
Table 1. Examples of those who made representations about the alternative minimum wages to the FWC ..................................................................................................................................... 18
Table 2. Percent increases of minimum wages for piece rates and general minimum wage: 1990–2017 .................................................................................................................................................. 31
Table 3. Liquor servers in BC by gender, age, and work status: 2016 ................................................... 42
Table 4. Increases in the general minimum wage and liquor server minimum wage: 2010–2017 .................................................................................................................................................. 43
LIST OF FIGURES
Figure 1. Increases to the general minimum wage and the average piece rate minimum wage, 1992–2017 .................................................................................................................................................. 30
Page 8
8
Executive summary
THE ALTERNATE MINIMUM WAGES IN BC are under scrutiny through a review of the BC general
minimum wage to increase it to at least $15/hour. The first report of the Fair Wages Commission made
recommendations to the Minister of Labour about changes to the general minimum wage over time and
how to proceed in the future.
This second report examines the five alternative minimum wages that provide distinct minimum wages
for farm workers paid by piece rate, liquor servers, live-in home support workers, resident caretakers, and
live-in camp leaders.
These alternate minimum wages are complex and because some have been in place for many years,
understanding the rationale for why they were initiated and why they continue to exist is a focus for this
report. The analyses we have undertaken are framed by the following principles.
• Ensure that workers receive equal minimum wage protection across different types of
employment.
• Ensure that the minimum wage regime is comprehensive and easy to understand.
• Ensure that workers and employers have consistency in minimum wage increases over time.
• Ensure that the point of a minimum wage, specifically that it establishes the lowest wage
that an employer is allowed to pay a worker, is not avoided through other employment
arrangements.
The findings are distinct for each alternative minimum wage. Some, such as the farm workers piece rate
system, have been in place for over 40 years; others, such as the liquor server wage, were brought in
relatively recently. In each case the FWC has tried to understand why the alternate wage was initiated and
its implications over time for both workers and employers.
Page 9
9
BC is an anomaly among jurisdictions in Canada in the type and extent of the alternative minimum wages
that replace the general minimum wage. No other provinces have distinct minimum wages for live-in home
support workers, resident caretakers, or live-in camp leaders.
BC is also distinct with regard to the piece rates established for farm workers, specifically with regard to
the large number of crops that are identified, and the ability of this piece rate system to provide less than
the general minimum wage in some cases. The FWC also found significant gender distinctions among the
alternate minimum wage workers who tend to earn less than the general minimum. Females predominate
among those farm workers that pick low-rate crops and among liquor servers with the lower minimum
wage. The recommendations will ensure that over time these workers will be paid a minimum wage rate
equal to the general minimum wage.
The alternative minimum wage for live-in home support workers appears to no longer be applicable. The
information about the other two groups, resident caretakers and live-in camp leaders, did not enable
the FWC to closely examine the effects of the alternate minimum wage and its significance for either
employers or workers. The recommendation is for an interim increase until an in-depth examination can
be undertaken.
Recommendations
Farm workers paid by piece rate
• The FWC recognizes the significance of piece rates as an incentive system and recommends
that it be maintained, but not in the way it currently operates. The minimum wage should be
a floor and piece rates should be available as an incentive.
o The FWC recommends a phase in of the general minimum wage to give employers time
to adjust:
■ 15% increase to all piece rates on June 1, 2018; and
■ Institute the general minimum wage on June 1, 2019.
• The FWC recommends that all farm workers receive at least the general minimum wage by
June 1, 2019. This means if workers do not receive the equivalent of the general minimum
wage for picking at piece rates their remuneration will be increased to equal the general
minimum wage.
Page 10
10
• The FWC recommends that in the future, once the general minimum wage is fully
implemented, piece rates as an incentive be reviewed by a permanent FWC, in consultation
with industry and workers. This would be to determine whether it should be government
or employers who should set the piece rates that are used as an incentive system above the
general minimum wage.
• The FWC recommends that a more thorough review of employment standards be
undertaken to review the requirements for detailed and accurate time and payment records.
This will be important for transparency regarding working times and remuneration.
• The FWC understands that the changes being recommended are substantial. We therefore
recommend that the permanent FWC review this new system after a reasonable amount of
time, to ensure that it is functioning appropriately for both workers and employers.
Liquor servers
• The FWC recommends that the minimum wage for liquor servers be raised to equal the
general minimum wage. This should be raised incrementally in order to give employers
time to adjust. This incremental increase will ensure that liquor servers receive the general
minimum wage of $15.20/hour by 2021. We recommend that the liquor server wage
increase on June 1 each year, beginning in 2018, with the following amounts:
Year $ increase Minimum wage
2018 $1.30 $11.40
2019 $1.30 $12.70
2020 $1.25 $13.95
2021 $1.25 $15.20
• The FWC recommends that a future employment standards review examine tipping
practices in BC. This should examine standards to determine when tips are considered
wages, review the practice of using tips to enhance the wages of non-tipped workers, and
ensure that tipping practices are transparent.
Page 11
11
Live-in home support workers
This category covers very few or no workers. This is because the definition of a live-in home support
worker is very restricted and applies only to those who are employed through a government funded
program and all of these workers are unionized. It appears that in the past there have been private
providers who have used this alternative minimum wage, but an Employment Standards Tribunal ruling
found this not to be lawful.
• The FWC recommends that the alternate minimum wage for live-in home support workers
be abolished.
Resident caretakers
The FWC had little information about why this alternative minimum wage was initiated or how it
functions currently. Our attention was drawn to some practices that appear to contravene the spirit of the
minimum wage.
• An employment standards review should examine the regulations around contracting out
for resident caretakers to understand if this practice should be regulated.
• An employment standards review might consider making the treatment of rent separate
from the payment of the wages of the resident caretaker.
• In the near future, the permanent FWC should undertake original research in order to
understand the relevance of this alternative minimum wage.
• The FWC recommends that on June 1, 2018 the alternate minimum wage for resident
caretakers increase at the same rate as the general minimum wage for the two categories of
resident caretaker units. The specific rates will be:
2018 11.5% increase
9-60 units = $759.32 (+ 30.43/unit)
61+ units = $2,586.40
2019 9.5% increase
9-60 units = $831.45 (+ 33.32/unit)
61+ units = $2,832.11
Page 12
12
2020 5.4% increase
9-60 units = $876.35 (+ 35.12/unit)
61+ units = $2,985.04
2021 4.1% increase
9-60 units = $912.28 (+ 36.56/unit)
61 + units = $3,107.42
Live-in camp leaders
The FWC had little information about this group of workers, who are employed by a charity or non-profit
seasonal camp for those under 19 years of age. The alternative minimum wage is $90.80/day on a 24 hour
basis with no regulations stipulating rest time or days off.
• The FWC recommends that the alternate minimum wage for live-in camp leaders increase at
the same percent each year as the general minimum wage, beginning June 1, 2018:
Year % increase Minimum wage
2018 11.5% $101.24
2019 9.5% $110.87
2020 5.4% $116.86
2021 4.1% $121.65
• The FWC recommends an employment standards review to establish regulations regarding
time off and rest periods.
• The FWC recommends that the future permanent FWC conduct an investigation with
original research into the merits of this alternate minimum wage.
Page 13
13
Permanent fair wages commission
This report has identified areas that should be added as tasks to the potential work of a permanent fair
wages commission that was recommended in the first report of the Commission. These recommendations
are as follows:
• Conduct a review of all of the alternative wage categories in this report, after a suitable
period of time, to ensure that they are functioning appropriately for both workers and
employers.
• Initiate original research on two areas identified in this report for which there is currently
little or no information to inform an adequate evaluation of the efficacy of the alternative
minimum wage. These are resident caretakers and live-in camp leaders.
• Undertake examination of areas indicated in the general recommendations in this report.
• Conduct reviews of occupations that are currently completely exempt from minimum wage
coverage.
Page 14
14
1 Introduction
THIS IS THE SECOND REPORT of the BC Fair Wages Commission (FWC) on how to raise the minimum
wage in this province. The first report, The Transition to a $15 Minimum Wage and Subsequent Increases,
was completed in January 2018.1 Its recommendations pertain to increases to the general minimum wage
to reach $15/hour, and the subsequent ways to deal with minimum wage increases once $15/hour is
reached.
This second report gives advice to the government on how to raise the minimum wage of the five groups
of employees who do not receive the general minimum wage and who have an alternative rate. These are
farm workers paid by piece rates, liquor servers, live-in home support workers, resident caretakers, and
live-in camp leaders.
There will be a third report later in 2018 that will examine ways to deal with the discrepancy between the
minimum wage and liveable wages.
The FWC was appointed by the BC Minister of Labour, Harry Bains, in October 2017 to advise the
government on how to deal with increasing the minimum wage. It is a three-person commission designed
to reflect the interests of employers, workers, and the general public.
• Chair, Marjorie Griffin Cohen, Professor Emeritus, Simon Fraser University.
• Ivan Limpright, President of the United Food and Commercial Workers Local 1518, member
representing workers’ interests.
• Ken Peacock, Chief Economist and Vice-President of the BC Business Council, member
representing employers’ interests.
1 Marjorie Griffin Cohen, Ivan Limpright and Ken Peacock, The Transition to a $15 Minimum Wage and Subsequent
Increases, BC Fair Wages Commission, January 2018, https://engage.gov.bc.ca/app/uploads/sites/237/2018/02/
Report-1_BC-Fair-Wages-Commission_Jan-2018.pdf
Page 15
15
The major tasks of the FWC, which are detailed in the Terms of Reference in Appendix I, are as follows:
• Advise the government on how to establish timelines and increases to a minimum wage of at
least $15/hour.
• Advise the government on when and how to raise the minimum wage rates for five groups of
workers whose minimum wage is different from the general minimum wage. These include
farm workers paid by piece rate, liquor servers, live-in home support workers, resident
caretakers, and live-in camp leaders.
• Advise the government on how increases to the minimum wage should be treated once $15/
hour is reached.
• Advise the government on strategies to address the discrepancy between the minimum
wage and liveable wages.
• Consult widely with people throughout the province and receive submissions from
interested stakeholders.
The FWC is under the auspices of the Ministry of Labour, but its methods of inquiry, findings, and reports
are independent of government.
As was noted in the first report, the minimum wage is the focus for investigation in BC for several reasons.
One relates to the problems that have arisen in the past because of the unpredictability of increases and
the lack of a regular method for determining its value. Other significant reasons relate to the very high
cost of living in BC (which means that people working at the minimum wage, full-time, full-year are living
in poverty), and the general problem of low wages in BC, where average wages have been below the
national average since 2003.
Minimum wage increases in BC in the past could be described as volatile and unpredictable, which
created problems for both workers and employers. At times workers experienced very long periods
without increases to the minimum wage, and not keeping pace with increases in the cost of living eroded
the protection the minimum wage gives workers.2 The long periods without increases inevitably meant
fairly large and rapid rises when they did occur, which were difficult for some employers to absorb. Both
business and labour groups would like to see regular and relatively predictable increases to the minimum
wage in the future.
2 There was no increase in the minimum wage from November 2001 to May 2011. See Appendix V: History of the
minimum wage and unemployment rates in BC 1979-2017 in the BC Fair Wages Commission first report (Cohen,
Limpright and Peacock 2017, supra note 1).
Page 16
16
The FWC is guided in its recommendations about the minimum wage by the objectives defined in its Terms
of Reference. We have specifically undertaken our deliberations with the following principles in mind:
• Provide increased wage protection for workers without large negative employment effects.
• Provide consistency in minimum wage protection, over time and among workers.
• Provide evidence-based understanding of the minimum wage within the context of the
economic climate.
• Provide reasonable and predictable increases as a goal for the future.
This second report of the FWC analyzes the minimum wages for the five groups of workers who have had
an alternate minimum wage rate that is distinct from the general minimum wage (see BC minimum wage
legislation in Appendix II). Each of these categories have been initiated for different reasons. The intent
in this analysis is to understand why the alternate minimum wage was initiated, the relationship between
the regular minimum wage and these alternative minimum wages, the kind of protection this offers the
workers in these categories, how other jurisdictions treat these categories of workers, and how the
workers themselves and those who employ them understand the need and effectiveness of these distinct
minimum wages.
This report also makes recommendations about how to deal with the alternative minimum wages in the
future.
Methods used to inform recommendations
The rationale for having an alternate minimum wage for certain groups of workers is not always clear. In
some cases, the alternate minimum wage was instituted many years ago and has not changed much over
time to reflect changing circumstances. It is also unclear to what extent the occasional reviews of these
distinct minimum wages tried to understand if they are still relevant, or if their value is appropriate.
The analyses by the FWC of the five distinct minimum wages are informed in a variety of ways, including
from statistical research and three commissioned studies. We also relied on consultations of different
types with employers, employer groups, individual workers, trade unions, academics, and groups
representing community interests. The information on some of the alternative minimum wages gives good
insight into their current implications, but for others the information is incomplete.
Page 17
17
Research
Three reports were provided by academic researchers who were asked to examine the existing research
pertaining to specific groups. They were also asked to examine other issues, including to compare the
alternate minimum wage with that in other provinces in Canada, to explain how the minimum wage for
this group compares with the special arrangements paid to temporary foreign workers if applicable, and if
possible to provide information about the characteristics of the workers in these occupations.
• Dr. Fiona MacPhail, Chair and Professor of Economics at the University of Northern British
Columbia, provided the study on liquor servers’ minimum wage.
• Dr. Kendra Strauss, Director and Associate Professor in the Labour Studies Program and the
Morgan Centre for Labour Research at Simon Fraser University, provided the study on live-
in home support workers’ minimum wage.
• Dr. Mark Thompson, Professor Emeritus in the Organizational Behaviour and Human
Resource Division at the Sauder School of Business, University of British Columbia, provided
an examination of the minimum wage for farm workers paid by a piece rate.
The FWC also used information from Statistics Canada, BC Stats, government documents in various
jurisdictions in Canada, and the research staff in the Ministry of Labour. These sources provided
information about the history of the minimum wage for each group receiving an alternative minimum
wage, comparisons with other jurisdictions, and where possible the characteristics of the labour force in
the minimum wage group.
Consultations
The FWC consulted with people in BC in several different ways that were facilitated through a website at
the BC Ministry of Labour.3 The website encouraged contact with the Commission on a range of subjects
related to the minimum wage, including specific questions related to experiences or information about
the five alternative minimum wages. Information could be given to the FWC in person at one of the
consultations held throughout the province, through answering a questionnaire on the website, through
submitting a research brief to the FWC, or by making a comment. In addition to the information from the
public consultations, the FWC received 109 research briefs or responses to the questionnaire.
3 This website can be accessed through https://engage.gov.bc.ca/fairwagescommission.
Page 18
18
Public consultations were held in eight cities throughout the province in November and early December
2017. These occurred in Abbotsford (Nov. 16), Nanaimo (Nov. 17), Kelowna (Nov. 21) Vancouver (Nov. 23),
Prince George (Nov. 28), Victoria (Nov. 29) Surrey (Nov. 30), and Cranbrook (Dec. 7). A total of 178 people
presented at these consultations, and many in addition to the presenters were present in the audience.
A wide variety of people were heard over the timeframe for soliciting people’s experiences and opinions.
In addition to the types of organizations, businesses, and community groups that presented and sent
written comments to the FWC, specific interests were represented within these groups. In particular, the
BUSINESS GROUPS TRADE UNIONS
Farm associations: BC Greenhouse Growers’
Association, BC Blueberry Council, BC Agriculture
Council, BC Raspberry Growers Association, United
Flower Growers, BC Cherry Association, BC Fruit
Growers’ Association
Restaurant associations: Alliance of Beverage Licensees,
Restaurants Canada
Panorama Mountain Resort
Living wage farm employer
Farms: Van Belle Nursery, Phoenix Perennials
Restaurant owners
BC Chambers of Commerce
BC Federation of Labour
UNIFOR
Nanaimo Duncan District Labour Council
Hospital Employees’ Union
UNITE HERE! Local 40
BCGEU
BC Teachers’ Federation
Student unions: Camosun College,
College of New Caledonia
COMMUNITY GROUPS INDIVIDUALS
Sanctuary Health
Abbotsford Community Services Legal Advocacy
Family Services of Greater Vancouver
West Coast Domestic Workers’ Association
Retail Action Network
Together Against Poverty Society
BC Employment Standards Coalition
BC Poverty Reduction Coalition (Okanagan Region)
Community Social Planning Council
Columbia Outdoor School
Former ministry workers
Domestic farm worker
Temporary foreign farm worker
Former live-in caregiver
Former live-in home support worker at a youth
group home
Line cook
Liquor server
Barista
Individual residents
Table 1. Examples of those who made representations about the alternative minimum wages to the FWC
Page 19
19
FWC heard of the concerns and ideas from those who are traditionally marginalized in the labour force
and are over-represented among low-wage workers. These included women, young people, immigrants,
visible minorities, temporary foreign workers, older workers, those who identify with the LGBTQ
community, those with disabilities, and those who identify as Indigenous.
Members of the FWC were also informed through discussions with researchers, economists, community
activists, employers, and those who have had experience with changes in the minimum wage in other
jurisdictions.
Context
In the first report of the FWC we outlined the economic outlook for BC for the near future and concluded
that the economic conditions were favourable and the labour market was strong. Low unemployment
rates and solid economic growth rates provide a more favourable environment for increasing the general
minimum wage. The recommendation to the government for increasing the general minimum wage is for
four incremental increases, with the increases more heavily weighted in the first two years. This would
begin in June 2018 and reach $15.20/hour in June 2021.4
The alternate minimum wages for each of these groups of workers were instituted at different times.
Agricultural piece rates, live-in home support workers (originally called live-in homeworkers), and
resident caretakers’ alternate minimum wage rates have been in place since 1981. The current live-in
home support worker definition was established in 1995. The alternate rate for live-in camp leaders at
charitable camps for children under 19 years was established in 1997 and the minimum wage for liquor
servers came into effect in 2011.
Minimum wages should be examined over time to ensure not only that they adequately reflect what is
reasonable for both employers and workers, but what is considered fair in the context of the time.
The following sections analyze the minimum wage rates for each alternative group, with
recommendations for dealing with the minimum wage in the immediate future and over time. The major
issue is to assess the fairness of the alternate minimum wage for each group and how it compares with
the general minimum wage. It will also be important to understand whether it is appropriate to apply
the percent increase recommended for the general minimum wage to these alternative groups, or to
recommend some other approach.
4 There is a provision in the recommendation for a higher minimum wage in 2021 if economic conditions are
favourable. This means in 2021 the general minimum wage could be between $0.15 and $0.20 higher, with a
possibility of reaching $15.40/hour.
Page 20
20
2 Farm workers paid by piece rate
Context
The minimum wage rates and changes over time for farm workers who do hand harvesting and are paid
by piece rate is seen in Table 2 on page 31. The agricultural labour market in BC is complex and especially
for the horticulture sector, where a great deal of the work is seasonal. Most of the work is located around
the Fraser Valley, Okanagan region, Vancouver Island, and Metro Vancouver. The labour force that is
paid by piece rate varies considerably depending on the region and type of crop being picked. The biggest
distinctions are between those working in the Fraser Valley and the Okanagan, the two largest agricultural
regions. These regions have distinct climates, focus on different crops, and hire employees working as
hand harvesters who have different characteristics.
Material in this section comes from wide-ranging consultations with the public, including specific
individuals and groups closely connected to the industries and workers affected. We also relied on a
report provided by Professor Mark Thompson, BC Pickers: A Report on Piece Rates in Agriculture, that was
undertaken specifically for the FWC.5 The Ministry of Labour research group provided details about
decisions made over the years for changing the rate for various crops and about issues that pertain to
specific groups. Also important for understanding the treatment of piece rates over time were documents
related to reports for the government on this subject since the 1990s.
5 Mark Thompson, BC Pickers: A Report on Piece Rates in Agriculture, prepared for the Fair Wages Commission, 2018,
www.sfu.ca/labour/fairwagescommission/FairWagesCommissionReports.html
Page 21
21
Findings from consultations
The FWC heard detailed opinions on the minimum wage for piece rates in public events in Abbotsford,
Kelowna, and Vancouver.6 We also received written research briefs and comments on this issue.
Public consultations
The information at the public consultations came from workers’ advocates and employers from both small
and large farm operations. The consultations were held in November and December, which is outside
the growing season, so we did not hear directly at the public consultations from any farm workers who
were paid by the piece rate system (although we did receive some written comments from current and
former farm workers). This lack of worker participation at the public events was probably because hand
harvesting is seasonal work and the workers often do not reside in the areas where the work occurs; they
are over-represented in some areas by immigrant and older populations who might have more difficulty
attending an event like the consultation; and they are not in trade unions, so did not have the benefit of
help in organizing their participation.
A general observation by both employers and workers’ advocates in the farming regions is that there are
serious labour shortages for both small and large farms. Hand-harvested crops require intense work and
long hours at the height of the growing season and, depending on the crop, a different kind of workload
when harvesting occurs at the end of the season.7
Employers’ concerns
In each farming community, there was a slightly different focus because of the difference in the nature
of the crops, the type of labour employed, and the significance of piece rate payment in the region. In
Abbotsford, we heard from employers and agricultural organizations representing both large-scale
and smaller specialty farms. Some employers who presented feel the minimum wage is an intrusion on
the correct working of the market for labour and that increasing the minimum wage will disadvantage
workers in the form of reduced hours, reduced fringe benefits, and reduced on-the-job training.
6 Agricultural wages were discussed at the Surrey consultation with regard to the general minimum wage and the
Seasonal Agricultural Worker Program.
7 Many farmers do not use the piece rate system, primarily those with greenhouse productions, those who employed
people for year-round work, and those who paid above the minimum wage.
Page 22
22
Some employers feel that the piece work system of pay is to the advantage of most workers because they
can make more than if they worked at the general minimum wage. These employers want to retain the
piece rate system because it gives workers an incentive to work harder and eliminates the need for close
supervision.
We heard from some farm worker employers that the piece rate system works in the Fraser Valley
because it is done normally by workers who are not the main family breadwinners. The employers
describe these workers as being elderly, predominately female, and usually living with their adult children
who are the main earners. We were told that 85-90% of the large-scale farm workers in the berry industry
are in this category. The belief is that these workers are willing to work at the piece rate because they are
slower workers and would not get employment otherwise.
The employers focused on the economic problems that would be created if the piece rate system is
removed. One large-scale berry farmer talked about the problems of being a price-taker in international
markets. “If you hike wages by 32%, I will have nothing left. I have 200-300 hand pickers and I will tell them
to go home.” Currently 65% of his crop is hand-picked, and he said he would have to increase the use of
machines if the minimum wage increases.
In contrast, another Abbotsford farmer is a living wage employer and talked about a couple he has
employed for 10 years: “if we paid them the piece rate they would earn $5.18/hour to pick beans. We pay
them $14.20/hour plus benefits.”
In Kelowna, we heard presentations from large-scale farmers, growers’ associations, and worker
advocates. Here both employers and worker advocates agreed that employment regulations needed
better enforcement, and that more should be invested in inspections and follow-up to make sure workers
are getting fair pay and treatment. The workforce in this region tends to be temporary foreign workers,
retired workers, or young people from Quebec.
The employers like the piece rate system because it provides incentives to work hard. Some maintain that
workers can easily make more than the minimum wage under the system, although they acknowledge that
this depends on the time of year and changes with the seasons. According to a very large cherry producer,
cherry pickers are all paid by piece rates, but they can switch to hourly. A different employer warned that
if piece rates increase too rapidly they will end up paying more like $21/hour because cherries are now
grown differently and are bigger than they used to be. His point is that the piece rate is sometimes too
high and this can happen when the crop changes and they are easier to pick. Cherries are one crop where
workers cannot be substituted by machinery. It was stressed by employers that most workers make more
than the minimum wage and if changes occur they should not be instituted quickly.
Page 23
23
The written submissions from employers who focused on the piece rate system were all in favour of it
continuing, and while some felt the increases should go up the same percentage as the general minimum
wage, others wanted changes that were not so uniform.
A brief from a tree fruit farmer who grows cherries and apples in the Okanagan gave examples of how
much pickers earned in 2017.
• His main point is that the minimum piece rates should not “increase by the same percentage as
the hourly wage when most piece rate workers are already being paid a premium over the hourly
minimum wage.”
• Currently, a qualified picker should be able to pick at least 60 lbs/hour at $0.248/lb. This average
worker would earn a minimum of $14.88/hour. He provided charts showing that his cherry pickers
(not including new workers) earn between $16.52 and $19.91/hour, so he feels it is not necessary
to raise the minimum wage for cherry pickers.
• The average apple picker can pick one bin in an hour and a half at $19/bin, so earns $12.67/hour.
His summary showed his apple pickers earned between $13.02 and $13.86/hour (experienced
workers), so he felt the “piece rate for apples would need a modest increase, but not at the same
rate as the hourly minimum wage.” These figures are based on the work of a “qualified picker.”
• The recommendation from this employer is that “wages remain comparable to jurisdictions like
Washington State and Oregon: only adjust minimum piece rates when a typical farm employee can
no longer earn the hourly minimum wage.”
According to the BC Agriculture Council one of the major reasons farmers prefer the piece rate system is
because it enables workers to “self-manage productivity.”
• Since the work is spread out over large work areas, the workers are difficult to supervise. Workers
also prefer this payment structure because they can earn significantly more than the general
minimum wage.
• This organization also says changes in production practices change how much can be picked
an hour, so the government periodically reviews production practices “to ensure that rates are
comparable to prevailing minimum wage rates for an average employee (time-motion studies).”
Page 24
24
Concerns of workers and workers’ advocates
Workers and workers’ advocates are against alternate minimum wages of any kind, and argue that the
alternative minimum wages should be eliminated for all categories and all workers should receive the
same protection of the general minimum wage. This was the message from trade unions, other groups and
individuals supporting workers’ rights, and some employers.
Some focused specifically on the piece rate system and understood that the alternative minimum wages
often were providing remuneration below the general minimum wage in certain categories and did not
offer appropriate wage protection for the most vulnerable workers.
Worker advocates in Abbotsford understood the reason for the dependence of elderly people on their
children differently from that expressed by employers. These community groups feel that the piece rate
system keeps earnings very low, so elderly people just cannot live on their own. But they also felt that the
large influx of foreign temporary workers, who work for the general minimum wage, keeps all the wages
down and that workers aren’t making enough money to get by, creating a dependency on their kids. These
worker advocates also noted that sometimes workers paid the piece rate are working alongside Seasonal
Agricultural Worker Program (SAWP) workers, who get the minimum wage (which is higher) for the same
work.8
Worker advocacy groups in Kelowna want the piece rate system abolished. They claim the larger farms
tend to have the most flagrant illegal practices and smaller farms are more likely to pay fairly or the
minimum wage. They claim that often employers will switch between the minimum wage and the piece
rate system, depending on which will result in paying less. They also claim that the piece rate system is
dangerous because workers are pressured to work faster without safety precautions.
Written submissions on the piece rate system came from farm employers’ associations, individual
employers, two former Ministry of Labour workers, a farm worker, and farm worker advocates.
Former Ministry employees provided information about the establishment and use of the piece rate
system.
• One brief maintains that the original values of the piece rate system were established on the
advice of an economist who did a time-motion study in the early 1980s before the system was first
instituted. This study was based on the work of able bodied harvesters at peak harvest times, which
does not reflect the reality of much of the hand harvesting labour force and the conditions for
picking. This determination of piece rates has not been revisited.
8 The federal Seasonal Agricultural Worker Program (SAWP) brings foreign workers to Canada on a temporary basis
for agricultural work. Most of those who come to BC are from Mexico.
Page 25
25
• The addition of daffodils to the piece rate system was based on the request of one grower in the
Saanich Peninsula who claimed the viability of his business demanded this.
• Subsequent changes to piece rates have been based on consultations with “stakeholders,” but these
do not include workers or worker advocates.
The information was corroborated by another former Ministry employee who had worked as an Industrial
Relations Officer and later as a Regional Manager.
• He said “it is hard to see farm worker piece rates as anything other than racist and abusive.”
• He found that in recent years the vulnerability of workers has increased because of the large
increases in temporary foreign workers employed in agriculture.
• He pointed out that incentive-type remuneration exists in other occupations (factory piece work,
flat rate automobile repair shops, commission sales, silviculture, to name a few). But
“all these employees are entitled to the hourly minimum wage – why not farm workers?”
A worker support group focused on the vulnerability of workers paid by piece rates: “piece rates weaken
the defense of workers against wage theft.” This is particularly problematic when appropriate records
are not kept.9 The submission goes on to say that “there are ways to incentivize productivity while still
ensuring workers get paid at least the minimum wage.” These could be in the form of production bonuses,
but “there is nothing similar to the farm worker piece rate system in any other sector.”
Another worker support group questioned the rationale for the inclusion of specific crops, the failure of
the piece rates to reflect increases in the general minimum wage, the exclusion of farm workers from other
worker protections, and the difficulties in enforcing the hand harvesting piece rate system.
• There is no logical explanation of why some hand harvested crops, such as cabbage, lettuce,
spinach, carrots, are covered by the minimum hourly wage provision and others are covered by the
minimum piece rate provision.
• There is no correlation between the minimum hourly wage and the minimum piece rates. This
group pointed out that since 1992 the general minimum wage has increased 106.5%. Hand
harvester rates increased by between 48.5% for blueberries and 72.7% for beans, with the average
increase at 61.8%.
9 The FWC heard of several problems with inadequate record keeping on the part of labour contractors that resulted
in a lack of transparency with regard to the amounts picked and time at work. This results in what workers refer to
as wage theft.
Page 26
26
• Farm workers are excluded from the hours of work and overtime provisions of the Employment
Standards Act, and are therefore not entitled to overtime pay even though at the peak of the season
they are typically required to work 10 to 12 hour days, six or seven days a week.
• Hand harvesters may earn as much as the general minimum wage during the peak of a harvest
season, but receive much lower pay during bad weather and during the early and late ends of the
season.
• There is no adequate monitoring or enforcement of either the Employment Standards Act or of
payments.
• Requiring all farm workers to be paid at least the general hourly minimum wage does not prevent
farm employers of farm labour contractors from paying production bonuses or incentives to hand
harvesters.
A submission from an individual female farm worker tied the very low wages in the industry to the SAWP
program, “in case you weren’t sure why an industry with supposedly such severe labour shortages pay
such low wages with no benefits, no overtime, no mandated breaks, sometimes for the whole season of
eight months or more without a single day off.” She claims that the ability to get foreign labour at low
rates affects all workers because it keeps general wages so low. She also raised the problems of costs in
rural areas, where there is little rental housing for low income families or individuals, and poor public
transportation.
Research findings
History of piece rates in BC
The current system of regulated piece rates for agricultural workers who hand harvest certain crops
was established in 1981. It appears that this resulted from the urging of the Canadian Farmworkers
Union (CFU) to have farm workers included in employment standards legislation, including the minimum
wage. Both the CFU and the BC Federation of Agriculture (BCFA) agreed that minimum wages should be
extended to farm workers, but there was no consensus on how this would occur, with the CFU advocating
for general minimum wage coverage and the BCFA supporting minimum piece rates for crops where the
system was already used.10
10 Thompson 2018 (supra note 5); Colin Aykroyd Research & Planning, Application of the Minimum Wage to Farm
Labour, February 1981.
Page 27
27
The Ministry of Labour Research and Planning commissioned a 1981 study by Colin Aykroyd to
examine agricultural wages with the purpose of finding a system for a minimum wage that would be
administratively feasible.11 Aykroyd’s review of the positions of the various interests at the time gives
some sense of the politics behind making the piece rate system the basis for the agricultural minimum
wage for certain specific crops.
• Legislative Select Standing Committee on Labour and Justice: “Industry reasons for desiring
maintenance of piece rates seem to depend heavily on their use of a secondary labour force,
especially the aged and the very young, whose individual production capacities may be
considerably below average. The Committee sees no objection to the maintenance of piece
rates as an incentive system above and beyond the minimum standards which should be
guaranteed to all workers.” (underlined in the original)
• BC Federation of Agriculture: “The idea would be to develop an average – what the average
workers would earn in the field with piece work – and then try and develop some sort of
minimum wage level based on that.”
• BC Ministry of Agriculture: Favours minimum wage in principle, but recognizes the desire of
industry to retain piece rates, especially for younger workers.
• Canadian Farmworkers Union: “It is absolutely essential that farm workers be given an
hourly minimum wage, without any qualifications whatsoever.”
Aykroyd did not have information from the workers themselves, but in considering the positions of the
interested parties he made recommendations that included the following:
• Establish a scale of minimum piece rates for fruit and vegetable crops “customarily
harvested by piece rates such that a worker of ‘reasonable skill and diligence’ can earn the
minimum wage.”
• Piece work earnings should be averaged over the whole period of employment by five days
or 40 hours and should be adjusted to ensure that employees are earning the minimum
wage.
• A limited spot check of harvest productivity should be carried out in the field to correct or
extend the results presented in this report and the initial piece rate schedule.
11 Aykroyd 1981.
Page 28
28
The government decided that the general minimum wage would not be extended to all agricultural
workers and that a piece rate system would be established for those picking eleven crops: raspberries,
blueberries, strawberries, cherries, apples, pears, apricots, peaches, prunes, grapes, and brussel sprouts.
This list was later extended to include beans, peas, mushrooms, and daffodils.
There appears to be no record of how the averaging of hours was implemented at the outset, nor at any
time has there been any specified criteria for the piece rate minimum. The original recommendation is that
the piece rate should be set so that workers of ‘reasonable skill and ability’ should receive the equivalent
of the hourly minimum wage, but this recommendation has not formally guided the piece rate since it was
initiated in 1981.
Two dedicated reports to review the piece rate system have been undertaken since the system was
initiated: the Malatest report in 1995 and the Zbeetnoff & McTavish report in 2011.12 Both were
undertaken by private consulting firms, and in each case the discrepancy between the piece rates and the
general minimum wage is noted.
The Malatest report was commissioned by the government as a result of a 1994 review of employment
standards by Mark Thompson that recommended the elimination of the exemption of farm workers
from the general minimum wage requirements.13 Their exemption from the regular minimum wage
and the existence of the piece rate minimum wage was seen by Thompson as denying farm workers
basic wage protection. As he pointed out, this would not make paying piece rates illegal, but would do
away with the rates that were substitutes for the minimum wage. Thompson listed many reasons for
his recommendation that related to timing and amounts paid to workers by farm contractors and the
problems of counting this work for unemployment insurance. But the main issue was the lack of wage
protection for the most vulnerable workers in the province, workers who received much less than
the regular minimum wage. According to the report, these are a large group of workers, “dominated
numerically by visible minorities and women, whose earnings are among the lowest of all workers in
British Columbia [and who] are denied the most basic employment standards protection, a minimum wage
for their work.”14
The Malatest review of 1995 appears to be the only study that actually looked at the workers while they
were working. This report found variations in the ability of workers to make the minimum wage depending
12 R.A. Malatest & Associates Ltd., Summary Report Minimum Government Approved Piece Rate Study, prepared for the
Ministry of Skills, Training and Labour and the Ministry of Agriculture, Fisheries and Food, December 1994; Darrell
M. Zbeetnoff and R. Bruce McTavish, Review of Regulated Minimum Piece Rates for Agricultural Hand Harvesters in BC,
prepared for BC Ministry of Labour, Citizens’ Services and Open Government, December 2011.
13 Mark Thompson, Rights and Responsibilities in a Changing Workplace: A Review of Employment Standards in British
Columbia, BC Ministry of Skills, Training and Labour, 1994.
14 Ibid, p. 46.
Page 29
29
on the crop harvested. The piece rates for harvesting raspberries, strawberries, blueberries, apricots, and
brussel sprouts were too low to assure that some proportion of the workers received the minimum wage.
This amounted to about 50 to 75% of the labour force. The piece rate for peaches, cherries, prune plums,
grapes, and pears enabled most workers to earn as much or more than the minimum wage. This report
estimated that the minimum piece rates for raspberries, strawberries, and blueberries, “would have to
be increased by 47.5%, 32.4%, and 48.1% respectively in order to ensure that 50% of workers earned the
minimum wage of $6.50/hour.”15 The general minimum wage rose to $7.00 in 1996, a 7.7% increase, but
the minimum piece rate for blueberries increased by 3.39%, raspberries 7.84%, and strawberries 7.29%.
The important point to take from this is that there was no attempt to ensure that the minimum piece rate
would produce earnings equivalent to the general minimum wage.
A 2011 report prepared by Darrell M. Zbeetnoff and R. Bruce McTavish also found variations in the ability
to earn the equivalent of the general minimum wage that depended on the type of crop harvested. The
three major crops reviewed were cherries, apples, and blueberries.16 Altogether the report had problems
with very limited data, farmers who were reluctant to cooperate, and very small samples provided by the
employers who participated.17 The cherry and apple workers earned at least the minimum hourly wage
and many earned considerably more. It was different for blueberry and other pickers in the Fraser Valley.
About 48% of the labour force earned less than the minimum wage. The crops that tended to provide at
least the equivalent of minimum wage work were dominated by male workers, while those crops where
workers did not earn the equivalent of the general minimum wage were dominated by females.
The broad conclusion is that the lower-paid crops are those where the labour force is dominated by
older females – specifically the berry crops in the Fraser Valley. Cherries and apples produce the highest
earnings, although the cherry harvest is brief. This report did not interview workers or observe their work.
The results of the Zbeetnoff & McTavish review at the end of 2011 did not result in any changes in the way
the piece rate minimum wage for specific crops were calculated nor were there any increases to these
piece rate minimum wages. It should be noted there had been two increases in the general minimum wage
in 2011: one in May of 9.38% and one in November of 8.57%, and then another increase in 2012 of 7.89%.
The only increase to the piece rate was earlier in 2011 (about 9.3%) and then not again until 2015.
It is worth reviewing this history because the initial recommendations for establishing the piece
rate minimum wage — that it should at least provide protection equal to the minimum wage for most
workers — was not how the original rates were set. The subsequent treatment of increases appears to be
15 R.A. Malatest & Associates Ltd. (supra note 12), p. v.
16 There was also some discussion of peaches, pears, raspberries, and vegetable crops, but this was less in-depth.
17 Earlier revisions to the Employment Standards Act eliminated the need for labour contractors and employers in
agriculture to maintain payroll records. This makes any review that relies on employer information inadequate.
Page 30
30
arbitrary and have not attempted to ensure that the rates for each crop provide income equivalent to the
general minimum wage.
Changes in piece rates and general minimum wage
The general understanding is that increases in the alternative minimum wage for farm workers mirrors the
general minimum wage increases. While this occurs at times, there have been general wage increases with
no corresponding increase in the piece rates and also times when the increases vary for the general rate.
The result is that the alternate minimum wage for farm workers has not kept its value with regard to its
relationship to the increases in the general minimum wage. The magnitude of the discrepancy varies with
the crop.
Figure 1 gives a visual glimpse of the general minimum wage increases since 1992 and the corresponding
average increases for the minimum piece rates. A more detailed view of the percent increases in piece
rates compared with percent increases in the general minimum wage paid is set out in Table 2. A list of the
actual rates by crop since 1981, the year the piece rate minimum wage began, can be found in Appendix II.
For the past 25 years, the minimum piece rates were increased by approximately the same as the general
minimum wage for five of the 11 changes to the piece rate.
Figure 1. Increases to the general minimum wage and the average piece rate minimum wage, 1992–2017
Sources: Malatest 1994 (supra note 12); BC Ministry of Labour.
Increases to the general minimum wage Increases to the average piece rate minimum wage
Page 31
31
19
90
19
92
19
95
19
96
19
98
19
99
20
00
20
01
20
03
20
11
20
15
20
16
20
17
PE
RC
EN
T
INC
RE
ASE
1
99
0–
20
17
PE
R C
EN
T IN
CR
EA
SE
Gen
eral
m
inim
um
w
age
10
.00
%0
.10
%1
8.1
8%
7.6
9%
2.1
4%
0.0
0%
6.2
9%
5.2
6%
0.0
0%
18
.75
%1
0.0
0%
3.8
3%
4.6
1%
12
7.0
0%
Ap
ple
s5
.28
%9
.95
%9
.21
%0
.00
%2
.13
%7
.59
%6
.29
%5
.27
%-3
.58
%9
.36
%1
.93
%3
.85
%4
.60
%7
2.3
5%
Ap
rico
ts5
.24
%1
0.0
5%
9.2
1%
8.2
2%
2.1
1%
7.5
7%
6.3
1%
5.2
6%
-3.6
0%
9.3
6%
1.9
4%
3.8
5%
4.6
2%
86
.68
%
Bea
ns
3.8
5%
11
.11
%1
0.0
0%
9.0
9%
2.2
2%
7.6
1%
6.0
6%
5.7
1%
-3.6
0%
9.3
5%
2.1
4%
3.7
7%
4.4
4%
91
.85
%
Blu
eber
ries
3.9
2%
11
.32
%0
.00
%3
.39
%2
.30
%7
.69
%6
.25
%5
.32
%-3
.72
%9
.39
%2
.02
%3
.71
%4
.53
%6
5.2
8%
Bru
ssel
sp
rou
ts5
.56
%1
0.5
3%
9.5
2%
8.7
0%
2.4
0%
7.8
1%
5.8
0%
5.4
8%
-3.2
5%
9.4
0%
1.8
4%
3.6
1%
4.6
5%
89
.47
%
Ch
erri
es7
.41
%1
0.3
4%
8.1
2%
0.0
0%
2.3
1%
7.3
4%
6.3
2%
5.4
5%
-3.7
6%
9.2
7%
1.7
9%
3.9
5%
4.6
4%
71
.03
%
Daf
fod
ils0
.00
%0
.00
%0
.00
%0
.00
%1
.82
%0
.00
%0
.00
%1
1.6
1%
0.0
0%
9.6
0%
2.1
9%
3.5
7%
4.8
3%
38
.18
%
Gra
pes
5.2
4%
10
.05
%9
.21
%0
.00
%2
.14
%7
.63
%6
.24
%5
.26
%-3
.60
%9
.35
%1
.93
%3
.84
%4
.59
%7
2.4
2%
Mu
shro
om
s3
.45
%1
0.0
0%
9.7
0%
0.0
0%
2.2
1%
7.5
7%
6.5
3%
5.1
9%
-3.5
9%
9.3
0%
2.1
3%
3.7
5%
4.4
2%
73
.33
%
Pea
ches
5.2
4%
10
.05
%9
.21
%0
.00
%2
.14
%7
.63
%6
.24
%5
.26
%-3
.60
%9
.35
%1
.93
%3
.84
%4
.59
%7
2.4
2%
Pea
rs5
.29
%9
.98
%9
.22
%0
.00
%2
.16
%7
.60
%6
.27
%5
.32
%-3
.62
%9
.40
%1
.93
%3
.83
%4
.62
%7
2.5
1%
Pea
s6
.25
%1
1.7
6%
8.4
2%
9.2
2%
2.2
2%
7.3
9%
6.4
8%
5.3
2%
-3.6
1%
9.3
6%
2.0
5%
3.6
9%
4.5
3%
90
.00
%
Pru
ne
plu
ms
5.2
9%
9.9
8%
9.2
2%
0.0
0%
2.1
6%
7.6
0%
6.2
7%
5.3
2%
-3.6
2%
9.4
0%
1.9
3%
3.8
3%
4.6
2%
72
.51
%
Ras
pb
erri
es5
.00
%1
1.9
0%
8.5
1%
7.8
4%
2.1
8%
7.4
7%
6.2
9%
5.3
0%
-3.5
5%
9.5
1%
1.9
6%
3.8
5%
4.5
0%
88
.10
%
Stra
wb
erri
es5
.13
%9
.76
%9
.78
%7
.29
%2
.26
%7
.75
%6
.16
%5
.16
%-3
.68
%9
.24
%2
.04
%3
.71
%4
.68
%8
5.3
7%
Tab
le 2
. P
erce
nt
incr
ease
s o
f min
imu
m w
ages
for
pie
ce r
ates
an
d g
ener
al m
inim
um
wag
e: 1
99
0–
20
17
Page 32
32
Since 1990 the general minimum wage has increased by over 127%, while the crop with the highest
increase (beans) increased by 92%. Some crops increased very little, for example daffodils by 38% and
blueberries by 65%. The average increase for the 15 crops since 1992 is 76%. For many years when there
was an increase in the general minimum wage, there was none for the piece rate workers.
Two years stand out in the way the piece rate was changed. In 1999 the average piece rate increased by
about 7.6% in a year to include vacation pay and holiday pay to the piece rate. Farm workers had been
exempt from these provisions in the Employment Standards Act. In 2003 the average piece rate was
reduced by 3.6%, when farm workers again were excluded from statutory holiday pay in employment
standards changes.18
The rationale for piece rate minimum wage increases has never been officially stated, and it appears to
have reflected employers concerns that increased productivity in the sector meant that at least some
workers achieved earnings well above the minimum wage. But it is clear that no crops that are covered
by the alternate minimum wage increased at a rate comparable to the increases in the general minimum
wage. The consultations that have occurred to specifically examine the piece rates after the 1995
Malatest report have relied heavily on employer information with little to no consultation with workers or
worker support organizations.
Other jurisdictions
British Columbia is distinct in its specification of an alternate minimum wage for a wide variety of crops.
Quebec is the only other province in Canada to have piece rates specified by crop and these are only for
strawberries and raspberries. Piece rates exist in five provinces, although in a distinct way from BC. Most
of these provinces require that workers receive wages through the piece rate system that is at least equal
to the general minimum wage. Nova Scotia is the exception and does not require any specific relationship
to the minimum wage. It is not clear when or how the piece rate system is used in these provinces. (A
cross-jurisdictional comparison of farm worker minimum wages is provided in Appendix IV.)
In the United States, workers covered by federal legislation (workers that produce goods for interstate
commerce) are paid at least the minimum wage, including farm workers. When states set the minimum
wage they need to be at least equal or above the federal standards. In all cases that refer to piece rate
systems, the workers must receive at least the equivalent of the general minimum wage.
18 This did not include daffodils, which never included either vacation pay or statutory holiday pay. There appears to
be no record of these exclusion for daffodil harvesters.
Page 33
33
Characteristics of piece rate workers
There is no recent or accurate information about the characteristics of agricultural workers in BC who
are paid piece rates. It appears that about 12,000 people worked at harvesting in BC in 2014, but the
proportion that work for the piece rate is not known.
The information in both the Malatest report and the Zbeetnoff & McTavish report describe piece rate
workers as being different depending on where they are working and what is being harvested. Those
harvesting tree fruits in the Okanagan were likely to be younger than those in the Fraser Valley harvesting
bushes or picking at ground level. The Okanagan workforce was also predominately male, while in the
Fraser Valley it was more likely to be female. The workers who are most disadvantaged in the Fraser
Valley are the berry pickers, who are predominately older workers and immigrants from South Asian
backgrounds.
The Okanagan depends on local older workers, young workers from Quebec, and temporary foreign
workers. In the Fraser Valley, the eight blueberry farmers surveyed for the Zbeetnoff & McTavish 2011
report said the majority of pickers (56%) were females over 55 years old, followed by males (33 %) with
only 12% under 55 years. Overall 64% of the workforce was female and predominately Indo-Canadian.
It appears that the characteristics of the labour force have been relatively stable over time, with the
exception of the arrival of SWAP workers from Mexico. According to the BC Fruit Growers’ Association
about 5,500 Mexican SWAP workers were in BC in 2016. Of these, 2,100 were in the Okanagan and 3,400
were in the Fraser Valley. These workers are paid the hourly minimum wage rate.
Conclusions and recommendations
The BC government has set piece rates for farm workers who harvest specific fruits and vegetables since
1981. The general minimum wage applies to farm workers and temporary foreign workers (TFWs), but
a separate minimum wage is set for piece work that over time has expanded to include 15 fruits and
vegetables.
The only major review of the piece rate system that closely examined the work itself was undertaken in
1995 under the review of Malatest & Associates. The last review of the piece rate system occurred in
2011 (Zbeetnoff & McTavish), but there was limited data available from employers, primarily because
employers and contractors have not been required to retain employee records. The work itself was not
examined.
Page 34
34
Every report that has been conducted for the government over time has noted that workers picking some
crops are not regularly able to earn the equivalent of the minimum wage. Malatest noted between 50
and 75% of the workers involved in some crops cannot earn the minimum wage. Despite knowing this, no
appropriate adjustments have been made to the amount paid for picking these crops.
On examining relevant government documents and reports to government, it is not at all clear how and
why changes to the individual piece rates have occurred in the past. Employers like this system because
it gives incentives to workers to work quickly and productively. Workers and their advocates feel it is
often exploitative, particularly for those who do not earn the equivalent of the general minimum wage. It
appears the continuation of the system in recent years has been primarily a result of inertia and continued
with little or no consultation with workers or their advocates. Over time, the value of the minimum wage
for piece rates has not increased with the value of the general minimum wage.
No other jurisdiction in Canada is as proscriptive as BC in setting agricultural piece rates. Also, it should
be noted that nowhere do governments set piece rates for any other form of work. This piece rate system
is an anomaly, both in BC and in Canada. BC proscribes the minimum wage for 15 crops: only Quebec
provides rates per crop and these are for only two crops. Most jurisdictions in Canada and the US require
(if a piece rate system exists) that all workers must receive at least the equivalent of the general minimum
wage.
The evidence suggests that the workforce of piece rate workers is highly gendered, with males
predominating in picking fruits that are able to provide remuneration at least equal to and often higher
than the minimum wage, and older immigrant females overly represented among workers who are picking
crops for which they are less likely to earn the minimum wage. These lower waged workers are those
picking berries, while the better paid workers are more likely to be picking tree fruit. In this, the current
piece rate system appears to be discriminatory.
Alternate minimum wages are seen by the government as taking away benefits and protections conferred
through the general minimum wage. Under these circumstances it seems important that a clear and
consistent rationale exist for initiating and then maintaining an alternate minimum wage. Throughout the
history of the farm workers piece rate system the rationale for the system has not been clearly articulated,
nor have the original rates or the changes to the individual rates been explained or justified.
Page 35
35
Recommendations
• The FWC recognizes the significance of piece rates as an incentive system and recommends
that it be maintained, but not in the way it currently operates. The minimum wage should be
a floor and piece rates should be available as an incentive.
o The FWC recommends a phase in of the general minimum wage to give employers time
to adjust:
■ 15% increase to all piece rates on June 1, 2018; and
■ Institute the general minimum wage on June 1, 2019.
o The FWC recommends that all farm workers receive at least the general minimum
wage by June 1, 2019. This means if workers do not receive the equivalent of the
general minimum wage for picking at piece rates their remuneration will be increased
to equal the general minimum wage.
• The FWC recommends that the piece rate system as it is currently constructed be
continued, in the short term, in order to maintain an incentive system in piece rates.
• The FWC recommends that in the future, once the general minimum wage is fully
implemented, piece rates as an incentive be reviewed by a permanent FWC, in consultation
with industry and workers. This would be to determine whether it should be government
or employers who should set the piece rates that are used as an incentive system above the
general minimum wage.
• The FWC recommends that a more thorough review of employment standards be
undertaken to review the requirements for detailed and accurate time and payment records.
This will be important for transparency regarding working times and remuneration.
• The FWC understands that the changes being recommended are substantial. We therefore
recommend that the permanent FWC review this new system after a reasonable amount of
time, to ensure that it is functioning appropriately for both workers and employers.
Page 36
36
3 Liquor servers
Context
An alternate minimum wage for liquor servers came into effect in BC on May 1, 2011. This alternate
minimum wage is currently $1.25 lower than the general minimum wage and applies to all employees
defined in the Employment Standards Regulation as liquor servers.
Before 2011 liquor servers were protected by the general minimum wage. A separate minimum wage
exists in two other provinces (Ontario and Quebec), although it is treated differently in each province.
In all other provinces, the general minimum wage applies to liquor servers.
The stated rationale for the introduction of the liquor server minimum wage is that it is designed to
protect jobs in the service sector while allowing the minimum wage to grow.19 The 2011 Summary Report
on the consultations the government held before changes to the minimum wage that year gives insight
into positions of both employers’ and workers’ groups as this was being considered.
• Employers strongly supported having a lower minimum wage for those receiving tips. They
citied economic conditions that hit the restaurant industry particularly hard, including the
HST, changes to drinking and driving laws, and the recent economic recession. They noted
that those who serve liquor earn more than other workers through tips, so if they received a
lower minimum wage, this would help the restaurant and bar owners in paying workers who
do not receive tips.
19 BC Ministry of Labour communication to the FWC, 2018. See also Stephanie Cadieux, Minister of Labour, Citizens’
Services and Open Government comments related to note 20.
Page 37
37
• Worker groups opposed a lower minimum wage for liquor servers both because it would
disadvantage workers who do not work in high-end restaurants and bars, and because there
would be practical difficulties in fairly administering the system. They noted particularly
that gratuities are largely unregulated in the Employment Standards Act, which means that
employers often require workers to pool tips to share with other workers. If a liquor server
minimum wage were to occur, they felt it would be necessary to enact regulations to ensure
that servers could keep all they receive in tips or to set rules about how the tips should be
allocated within a tip pool. 20
The introduction of the alternate minimum wage for liquor servers supported the employers’ argument
that they needed cost reduction in wages, and that liquor servers earned substantially more than other
workers through tips. It appears that liquor servers themselves were not consulted and that the change
favoured the position of the business lobby. The Minister at the time responded to questions in the
legislature by saying:
Liquor servers do earn a significant proportion of their income through gratuities, as bills that include
liquor are significantly higher. Our goal is to strike a fair balance with the needs of the job-creating
employers such as White Spot so that we can make sure that we continue to have jobs for all of
our citizens and ensure that they’re earning a wage where they can support themselves and their
families.21
It is important to note that while the intention appears have been to capture those liquor servers who
earn tips, the actual definition of who is covered in the alternate minimum wage includes all liquor
servers, whether they earn tips or not. The definition of a liquor server under the Employment Standard
Regulation are employees
(a) whose primary duties are as a server of food and drink or both, and
(b) who, as a regular part of his or her employment, serves liquor directly to customers,
guests, members or patrons in premises for which a license to sell liquor has been issued
under the Liquor Control and Licensing Act.22 (See minimum wage legislation in Appendix II.)
There is no requirement that only the servers who earn tips will be subject to the lower minimum wage,
only that they serve liquor.
20 BC Ministry of Labour, Citizens’ Services and Open Government, Summary Report on Employment Standards
Stakeholder Engagement Process, March 2011.
21 Stephanie Cadieux, Minister of Labour, Citizens’ Services and Open Government, Official Report of Debates of the
Legislative Assembly, Third Session, 39th Parliament, May 9, 2011, Vol. 21, No. 4, 6808.
22 BC Employment Standards Regulation s. 18.1 (1).
Page 38
38
Over the years the concept of what constitutes the actual wage for liquor servers has become an issue in a
variety of ways. Problems arise because of the complexities of tipping and the different ways it is treated
by employers. This lack of consistency and transparency regarding what constitutes the actual wage
the employee receives affects how tips, as a part of the wage, are interpreted for various programs that
calculate benefits based on the wage, such as Employment Insurance (EI) and the Canada Pension Plan
(CPP). Various legal challenges have occurred as a result. In what follows these issues will be considered in
addition to the other findings from the consultations and research.
This analysis of the liquor server rate is informed by a special research paper commissioned by the
FWC that was provided by Professor Fiona MacPhail, Chair of Economics at the University of Northern
British Columbia, Report on the minimum wage for liquor servers in British Columbia.23 Information on the
characteristics of liquor servers in BC is from a special custom data tabulation using a 2016 Statistics
Canada Labour Force Survey confidential file. The FWC also gained information from consultations with
those doing similar research in other provinces, the research department of the Ministry of Labour, and
from the public consultations and written comments sent to the FWC.
Findings from public consultations
The FWC consulted people through public hearings throughout the province, through the submission
of research briefs, and through other written comments. As occurred in the government consultation
related to this issue in 2010-11, the information received by the FWC showed great differences between
employers and workers in their opinions about the liquor server minimum wage. The employers want to
retain it (with a few exceptions) and the employees and their supporters want it abolished.
One issue where there is agreement is on the problem of shortages of labour for restaurants and bars,
although there is no agreement on how to remedy the shortage. Another area of agreement is the need for
predictable and consistent increases in the minimum wage in the future.
23 Fiona MacPhail, Report on the minimum wage for liquor servers in British Columbia, prepared for the Fair Wages
Commission, 2018, www.sfu.ca/labour/fairwagescommission/FairWagesCommissionReports.html
Page 39
39
Employers
Most employers and employer groups feel the wage differential between liquor servers and the general
minimum wage needs to be maintained because of the economics of the industry. The following are
employers’ comments at the consultations.
• It is a highly competitive, labour intensive, low margin industry with low levels of profitability.
• Wages constitute about 30% of the costs and increasing this wage rapidly will jeopardize the
viability of some businesses.
• With the liquor server differential, employers are able to provide higher wages to non-gratuity
earning staff who are more difficult to attract and retain. These workers tend to earn less than
those who receive gratuities.
• With the lower minimum wage for liquor servers, employers are able to keep food and drink prices
lower, which draws people into the business. Customers have a hard time adjusting to higher menu
prices.
Other comments by employers and employer groups are specifically related to the workers:
• Servers do not mind the $1.25 difference from the general minimum wage because they make well
above the minimum wage because of tips.
• The North American culture is very much tip-based because it affects, in a beneficial way, the
service provided.
• The differential is key to attracting the right, service-oriented staff and further acts as an incentive
to always put the customer’s needs first.
• The vast majority of minimum wage earners are young, first-time employees who voluntarily work
part time and do not rely on their minimum wage income for their livelihood.
Some employers did not support the lower liquor server wage and paid all workers at least the minimum
wage. These employers were adamant that the regular minimum wage not increase too quickly. Other
employers managed to pay the living wage, but they said it is hard for restaurant owners who want to
pay more to do it if there is a low wage floor. The major associations representing employers favoured
retaining the lower liquor server minimum wage.
Page 40
40
Most employers did not discuss how the liquor server minimum wage should be increased in the future
and seemed to assume the differential would remain the same dollar amount. A few did say the increase in
the minimum wage for this group should reflect increases in the cost of living in the future.
Workers, trade unions, and community groups
Workers and their supporters want the liquor server alternate minimum wage abolished. The major
problems relate to the irregular way tips are treated, and the precariousness of the circumstances of
work. They questioned why it should be only liquor servers who are singled out, and not other workers
who earn gratuities. This is seen by many as discriminatory in that it affects primarily female workers.
They also point out that there was no meaningful consultation with workers before this came into effect
and it was a result of pressure on government from employers.
One crucial issue these groups raised is the precarious nature of liquor servers’ work, where hours are
unpredictable and tipping practices are unregulated. The following are some of the issues and examples
we heard during the regional consultations:
• One single mother says she earns the liquor server wage although she mostly does prep work.
Despite three jobs and living in supported housing she can’t get out of a debt cycle. One of her
children has special needs.
• Tips are a voluntary payment from the customer. Some employers calculate tips for ‘tipping out’ as
a percent of the total bill of a customer, whether a tip is paid or not. Transparency of the tips are a
problem.
• This work is precarious in that getting full-time work is difficult; hours aren’t guaranteed; employers
demand flexibility so most employees work part time and irregularly; last minute and split shifts are
common.
• The liquor server wage is discriminatory and contravenes provincial pay equity protections.
One brief submitted talked about the unregulated nature of tips in BC and that this province is behind
other provinces that do regulate tips. “Without clear regulations and guidelines that are shared with
employers and employees, workers’ tips are unprotected and open to employer abuse and misuse.”
Another issue frequently raised in both the consultations and written briefs is the problem with relying on
tips because of the assumptions about the service to the customer. This is what we heard:
• Sexual harassment is a common experience for women workers in restaurants and a main
contributing factor is relying on tips.
Page 41
41
• Women working ‘front-of-house’ as servers, bartenders, and hostesses are expected to cope with
sexual harassment to avoid the loss of tips and the promise of greater tips often inspires the
insistence of provocative dress codes by employers.
• One server was told by her supervisor that she could not back away from the harasser because she
would be offending the customer.
• The lower liquor server wage exacerbates the reliance on tips.
Other issues mentioned were the inability under certain circumstances to have tips counted as wages for
the purpose of CPP and EI. The complexities of this is discussed below.
Research findings
The assumption behind a lower minimum wage for liquor servers is that they receive considerably more
money in tips than other servers because of the cost liquor adds to the customer’s bill. Since their total
income from their work would be greater than the general minimum wage, this level of protection is
assumed not to be needed.
This assumption about earnings from tips is reasonable in certain cases, particularly when a server works
full time in a place where serving liquor is a normal occurrence over the course of the shift. This, however,
appears not to be a regular condition for liquor servers and there is considerable variability in income
among these servers. In general, the work of liquor servers can be considered precarious work, primarily
because of the general low wages among this group of workers and the irregular nature of the conditions
of work.
Characteristics of liquor servers in BC
Based on the narrow definition of liquor servers, liquor servers are 1.2% of total employees aged 19 and
over in BC.24 This small proportion of the labour force means that little data is publicly available about who
they are and what they earn. A special tabulation based on 2016 data from a Statistics Canada Labour
24 There are a variety of ways used to define this group under Statistics Canada information. The definition used for
this tabulation is the restricted definition and relates to bartenders or food/beverage servers in either drinking
places or full-service restaurants/limited service eating places if they usually receive tips. The more expanded
definitions do not alter the overall picture, but increase the proportion working to 1.28% of the total.
Page 42
42
Table 3. Liquor servers in BC by gender, age, and work status: 2016
Force Survey confidential file provides some insight into this, as can be seen in Table 3 and in Appendix V
and VI.
A very large majority of liquor servers are women (almost 82%) and about half are over 25 years of age
with the other half being between 19 and 24. Compared with all other workers, these workers have very
low trade union coverage with fewer than 3% being a member of a trade union or covered by a collective
agreement (compared to about 30% for all workers). This contributes to the precarious nature of the
work, compared with other workers, because there is little support for complaints against employers.
Liquor servers are less likely to have permanent jobs than other workers, are more likely to work part time
(66% compared with about 21% for all employed), and are less likely to stay in their jobs at least five years
(less than 15% for liquor servers and over 46% for all employees). (See also job characteristics of liquor
servers in Appendix V.)
SHARE OF LIQUOR
SERVERS
SHARE OF TOTAL BC
EMPLOYEES
NUMBER OF LIQUOR
SERVERS (IN ’000s)
NUMBER OF TOTAL BC
EMPLOYEES(IN ’000s)
GENDER
Women 81.8% 49.8% 15.7 939.2
Men 18.8% 50.2% 3.6 945.4
Total 100.5% 100.0% 19.2 1,884.6
AGE
19 to 24 years 51.0% 13.1% 9.8 247.4
25 years and older 49.0% 86.9% 9.4 1,637.2
Total 19 and older 100.0% 100.0% 19.2 1,884.6
WORK STATUS
Full-time 33.9% 82.2% 6.5 1,548.4
Part-time 66.7% 17.8% 12.8 336.2
Total 100.5% 100.0% 19.2 1,884.6
Source: Statistics Canada custom tabulation using a 2016 Labour Force Survey confidential file.
Notes: Numbers may not add up to 100% due to rounding; definition of liquor server: employees who are employed in
the occupation of bartender or food/beverage server in the industries of either drinking places (alcoholic beverages) or
full-service restaurants and limited seating eating places and if employees usually receive tips; liquor server and total
employees refer to those over 19 years of age; work status refers to the status of the liquor server’s main job.
Page 43
43
Liquor servers are overrepresented in the low hourly wage categories as well. About 16% earned less
than $10.85/hour, which includes tips (the minimum wage in 2016), compared with 4.6% of all employees.
About 68% earned less than $15/hour, including tips, compared with 22.4% of all workers. Altogether,
almost 92% earned less than $21/hour, compared with 43.7% for all workers. (Appendix VI.)
Liquor servers are also more likely to be poorer than most workers. Well over half of liquor servers live in
households that are the bottom quintile of earnings in BC. This is a much higher rate of those who live in
very low income households when compared with all workers (at about 19%). (Appendix VI.)
Changes to liquor server minimum wages
The general minimum wage has increased 41.8% since 2010, while the increase for those serving liquor
has been 26.3%. When the general minimum wage went up $0.75 for the first time in about a decade in
May 2011, the increase for liquor servers was $0.50, creating an initial $0.25 difference at the time the
alternative minimum wage was established. With the subsequent increases to the general minimum wage
the liquor server wage increased $0.25 until the gap between the two was $1.25. The $1.25 differential
has been maintained between the general minimum wage and the liquor server minimum wage since May
2012.
YEARMONTH OF INCREASE
GENERAL MINIMUM
WAGE
LIQUOR SERVER
$ INCREASE % INCREASE
GENERAL MINIMUM
WAGE
LIQUOR SERVER
GENERAL MINIMUM
WAGE
LIQUOR SERVER
2010 $8.00 - - - 0% -
2011 May $8.75 $8.50 $0.75 $0.50 9.38% 6.3%
November $9.50 $8.75 $0.75 $0.25 8.57% 2.9%
2012 May $10.25 $9.00 $0.75 $0.25 7.89% 2.9%
2013 $10.25 $9.00 $0 $0 0% 0.0%
2014 $10.25 $9.00 $0 $0 0% 0.0%
2015 September $10.45 $9.20 $0.20 $0.20 1.95% 2.2%
2016 September $10.85 $9.60 $0.40 $0.40 3.83% 4.3%
2017 September $11.35 $10.10 $0.50 $0.50 4.61% 5.2%
Source: MacPhail 2018 (supra note 23), Table 1, p. 26.
Table 4. Increases in the general minimum wage and liquor server minimum wage: 2010–2017
Page 44
44
Analysis of liquor servers’ wages and working conditions
Research on the work of liquor servers indicates four main issues to be considered. One is the high
variation in the tip income for liquor servers across the sector. This arises in part from the problems that
arise from tip pooling or ‘tipping out’ arrangements and this relates to the second issue, which is when
and how tips are treated as part of the wage, and the implications this has for wage-related income
support programs. The third is that employment is precarious for many, including frequent problems
with uncertainty regarding assigned shifts and hours of work. The fourth main issue is the prevalence of
sexual harassment. Specific research indicates that one way this sexualized environment is normalized,
supported, and encouraged is in relation to the wage and tipping systems.25
Tipping
The basis for a lower minimum wage for liquor servers is the prevalence of tipping as a regular practice
and an important source of additional income for these workers. There is no reliable information about
what servers receive in tips or how tips for liquor servers differ from other servers. The assumption is that
higher customer bills occur when liquor is served and that would increase the amounts received in tips.
Tips are treated by employers in a variety of different ways. These include establishments where servers
keep all the tips; those where tips are shared in a server controlled pool with other servers receiving tips;
and those that are employer controlled and that may use some form of tipping-out. This tipping-out can
occur as an informal practice among servers, or can be managed by the employer who takes a proportion
of the total tips and distributes this among all workers, including those who do not regularly receive tips.
It appears that few servers keep all of their tips.26 When tip pools exist they can be calculated for each
server on a percent of the daily total sales, a percent of tips directly received, or added directly to the bill
of customers, something that is more regularly done for large groups or banquets. When servers have to
tip out based on a percent of the daily total sales, the amount may be higher than the tips they actually
received, if it was a slow day. There can be circumstances where the server ends up paying ‘out of pocket’
to the tip pool. There are also shifts where servers are busy and make above average tips.
25 See Kaitlyn Matulewicz, “Customers, Tips, and the Law: Gender and the Precariousness of Work in BC Restaurants,”
paper presented at the Labour Law Research Network Inaugural Conference, Barcelona, June 2013. This paper
discusses the Faux and Marcello cases and how the decisions are conflicting.
26 This information is based on research in MacPhail’s report to the FWC. An Ontario study found that only 8% kept
the tips given to them. (MacPhail 2018, supra note 23, p. 7.)
Page 45
45
The significance of these differences is that there is considerable variation in the ability of liquor servers
to keep tips earned and it is a practice that is not currently regulated in BC. The problem with this is
that often the employer’s policy on the collection and distribution of the tip pool is not transparent and
because there is no way to monitor it, it can be a source of wage theft with the employer taking a part of
the pool.
In BC, the Employment Standards Act is silent on tip pools, but the Interpretation Guidelines say a tip
pool does not contravene the Act. However, two legal cases provide conflicting decisions (Fauk and
Marcello).27 The Faux case involved a server who was required to contribute a percent of his daily sales to
a tip pool which was then distributed to the kitchen staff. The adjudicator concluded that the tip pool did
not contravene the Act. In another similar case, the adjudicator also decided that the tip pool itself did not
contravene the Act; however, the adjudicator found that if part of the pool is distributed to non-tipped
workers using a criterion such as hours worked, it does contravene the Act.
Complications arise from whether tips (gratuities) are considered wages and this can affect how tips
are treated for wage-related benefits. Wages are “salaries, commissions or money, paid or payable by an
employer to an employee for work” and ”money that is paid or payable by an employer as an incentive and
relates to hours of work, production of efficiency.” Wages do not include gratuities.28
The definition of gratuities in the Employment Standards interpretation guidelines says that “gratuities
are not wages unless used to pay an employer’s business costs.”29 However, the guidelines continue by
saying “under s.21(3), an employer may not use tips to cover a business cost. Gratuities used to pay an
employer’s business costs are deemed by this section to be wages under the Act.” Since the employer can
use the tip pool to pay other workers (a clear business expense) these tips are considered wages.30
The complicating part is that tips are considered wages for income tax purposes, but not necessarily for
pensionable and insurable earnings. It all depends on whether the tips were ‘direct’ or ‘controlled’ tips,
according to the Canada Revenue Agency, and several court cases have focused on these distinctions. The
CRA considers controlled tips (tips controlled by the employer) as wages and those that are directly paid
to the server are not wages, so not calculated for EI or CPP. There is no clarity of how tips are treated for
provincially determined vacation pay and severance pay, since there is silence on this issue in provincial
27 See Matulewicz 2013 (supra note 25); also MacPhail 2018 (supra note 23), p. 14.
28 BC Employment Standards Act, s. 1.
29 Interpretation Guidelines Manual British Columbia Employment Standards Act and Regulations, ESA Section 1 –
Definitions – Wages, https://www2.gov.bc.ca/gov/content/employment-business/employment-standards-advice/
employment-standards/igm/esa-definitions/esa-def-wages
30 The Marcello case argues that the tip pool contravenes the Act because the employer distributed tip pool money
(collected through a percentage of sales) to non-tipped workers using a criterion such as a hours worked. The
Tribunal concluded “that the mandated contribution to the house tip was simply a way of passing on some of the
payroll costs to the servers.” (MacPhail 2018, supra note 23, p. 16.)
Page 46
46
regulations. However, one case on this issue decided that gratuities should be used to determine vacation
pay.31
Sexual harassment of liquor servers
The practice of tipping appears to both perpetuate and exacerbate a sexualized work environment for
liquor servers. The loss of tips, especially when they are in part a substitute for a wage, makes servers
more vulnerable to harassing behaviour. It appears that the sexualization of the workplace that begins
with hiring practices and extends to dress codes and demands servers’ tolerance of customer unwanted
behaviour is related to the system of relying on tips for a part of the wage.32 MacPhail found that in the US,
in states where the gap between the general and tipped minimum wage is higher than in BC, servers were
twice as likely to experience sexual harassment as women in states that pay the same minimum wage to all
workers.
The tipping system is certainly a larger problem for issues of sexual harassment than related to the
minimum wage; nonetheless, the lower minimum wage to liquor servers tends to reinforce their reliance
on tip earnings.
Hours of work and income
The major premise of a separate minimum wage for liquor servers is that incomes exceed the minimum
wage, so the standard minimum wage is not necessary. The literature on this issue shows that tip income is
often variable, precarious, and as a result, insecure. The voluntary nature of tipping makes it susceptible to
fluctuations, it is often unclear how much will be made on a given shift, and it can vary considerably from
one shift to another. Tips also vary considerably between types of establishments, meal price, time of day,
and day of the week.
Hours of work also tend to be less stable. The majority of liquor servers (67%) work part time, and of these
22% are involuntarily working part time. This means that the person is working part time because either
they couldn’t find full-time work or did not look for full-time work because of business conditions do so.
Frequently shift schedules are not known until the last minute and a scheduled shift may be shortened
if business is slow. Split-shifts are common, and calls to work can be for as little as two hours. This is
extremely challenging for most workers, but particularly those who have responsibilities for children or
31 See MacPhail 2018 (supra note 23) for details.
32 Kaitlyn Matulewicz, “Law and the Construction of Institutionalized Sexual Harassment in Restaurants,” Canadian
Journal of Law and Society 30 (3) 2015, 401-419.
Page 47
47
caring for other family members. As was explained earlier in this section, liquor servers in BC have low
hourly wages, and tend to live in low-wage households. (Appendix VI.)
While clearly some liquor servers do work full time and receive tips that more than make up for the lower
minimum wage, this is not necessarily prevalent among all liquor servers.
Comparison with other jurisdictions
Two other jurisdictions in Canada exempt liquor servers from the provisions of the general minimum wage
and provide separate minimum wages: Ontario and Quebec. In all other provinces, liquor servers are
covered by the general minimum wage. (See the cross-jurisdictional comparison of liquor server minimum
wages in Appendix VII.)
Quebec has an alternate minimum wage for all those who receive gratuities, not only liquor servers.
Alberta abolished the liquor server wage in 2016 in order to make the minimum wage system more simple
and consistent for all workers.
Ontario, Quebec, PEI, Newfoundland and Labrador, and New Brunswick all have laws regulating tips
and tip pooling. In Quebec, non-tipped workers cannot participate in the tip pool. In PEI, the employer
must advise employees of the tip pooling practices, and tips can be treated as additional wages, which is
important for the calculation of CPP and EI. In BC, tips are largely unregulated. Without clear guidelines
about how tips are shared between employees and employers, workers are unprotected and the use of
tips is not transparent.
In the US, in states where a separate minimum wage for servers occurs, the gap between that and the
general minimum wage tends to be large.33 Under the federal jurisdiction, the minimum wage is $7.25,
while for tipped workers it is $2.13/hour. The big difference is that the employer must ensure that the
employees’ tips amount to at least the difference between the tipped minimum wage and the general
minimum wage. Known as a ‘tip credit,’ this is to ensure that the employee makes at least the general
minimum wage. Under the federal jurisdiction, mandatory tip pooling is also allowed, but it is restricted to
workers who usually receive tips and cannot include those who usually don’t, such as dishwashers, cooks,
chefs, and janitors.
33 See MacPhail 2018 (supra note 23), p. 12. Seven US states do not have a separate tipped minimum wage and
workers are covered by the general minimum wage. These states (which include Washington and California) have
higher minimum wages than the US federal minimum wage.
Page 48
48
How tips are treated in other US jurisdictions varies widely, but the common base is that the federal
tipped minimum wage provision applies unless a state has a higher provision.34
Tips are less regularly part of the culture in Europe and other OECD countries, so it is not surprising that
there are not records of separate minimum wage rates for tipped workers in these jurisdictions.
Conclusions and recommendations
The liquor server wage came into effect in May 2011 and is currently $1.25 lower than the general
minimum wage. This lower minimum wage for liquor servers is unusual in that it applies to only one
category of workers who receives tips in BC. No other tipped workers have a lower minimum wage. This
alternate minimum wage involves all who serve liquor, whether they earn tips or not.
The lower minimum wage for liquor servers disproportionately affects women, who are the overwhelming
majority of liquor servers. Liquor servers are, on average, low-wage earners and are more likely than the
average worker to live in poor households.
The relatively recent introduction of this lower minimum wage for liquor servers was instituted at the
request of employers. Employers argued that those earning tips from serving liquor earn much more than
the minimum wage, so protection equal to the general minimum wage is not necessary. Employers also
argued that the lower minimum wage was needed to improve the pay of their other workers who do not
receive tips. Lowering the liquor server minimum wage was especially important in 2011, according to the
employers, because they had been adversely affected by the economic recession, the HST, and changes to
laws for drinking and driving.
The FWC understands that many liquor servers can earn more than the minimum wage, but it is also
clear that there is a high degree of variation and uncertainty in tip income. This can occur for a variety of
reasons including when business is slow or workers are required to share tips with non-tipped employees
based on a proportion of sales, rather than on the actual tips received.
Tipping regimes are complex, varied, and are usually determined by the employer. Also, the distinction
between wages and tips is not straightforward and under certain circumstances this can disadvantage the
liquor server with regard to insurable and pensionable earnings. The regulation of tipping is much more
limited in BC than in other provinces. Clear regulation is needed particularly with regard to definitions of
34 See MacPhail 2018 (supra note 23) for references to US Department of Labor material related to lower minimum
wages.
Page 49
49
wages and tips; control of the tip pool; participants in the tip pool; deductions from tips; and transparency
of the tip pool procedures. In BC, the distinction between wages and tips is not straightforward, but has
important implications for how tips are treated in relationship to insurable and pensionable earnings.
Most provinces to not have a lower minimum wage for liquor servers and the general minimum wage
applies. Quebec has a lower minimum wage for all workers who receive tips. Ontario has a liquor server
minimum wage, but has regulations regarding tips and tip pooling that are stronger than those in BC. The
lower liquor server minimum wage was abolished in Alberta in 2016. In the US, the employer must ensure
that employees’ tips are at least equal to the difference between the liquor server minimum wage and the
general minimum wage. Also, tips cannot be used to pay non-tipped workers’ wages.
Recommendations
The FWC understands the minimum wage to be the lowest wage an employer can pay a worker and
that the reason for this is to protect low wage workers. The minimum wage for liquor servers should be
equal in protection to that received by other workers. The recommendation is for two initial increases
to be about the same as that for the increases to the general minimum wage, and subsequent increases
provided to allow employers time to adjust to the elimination of this alternate minimum wage.
• The FWC recommends that the minimum wage for liquor servers be raised to equal the
general minimum wage. This should be raised incrementally in order to give employers
time to adjust. This incremental increase will ensure that liquor servers receive the general
minimum wage of $15.20/hour by 2021. We recommend that the liquor server wage
increase on June 1 each year, beginning in 2018, with the following amounts:
Year $ increase Minimum wage
2018 $1.30 $11.40
2019 $1.30 $12.70
2020 $1.25 $13.95
2021 $1.25 $15.20
• The FWC recommends that a future employment standards review examine tipping
practices in BC. This should examine standards to determine when tips are considered
wages, review the practice of using tips to enhance the wages of non-tipped workers, and
ensure that tipping practices are transparent.
Page 50
50
4 Live-in home support workers
Context
This is an unusual minimum wage category in that it appears there are very few, and possibly no workers
who receive this alternative minimum wage. The restricted definition of the category means that only
those paid through a government funded program meet this criterion. These workers are all unionized and
their wages are covered by collective agreements that are above this minimum wage. When a collective
agreement is in place the provisions of the collective agreement apply.
A live-in home support worker is defined in legislation as a person who:
• Is employed by an agency, business or other employer providing, through a government
funded program, home support services for anyone with an acute or chronic illness or
disability not requiring admission to a hospital; and
• Provides those services on a 24 hour per day live-in basis without being charged for room
and board.35
Government funding includes payments from BC’s health authorities and from Veterans Affairs Canada,
but does not include funding from ICBC, WorkSafeBC, old age security, or the guaranteed income
supplement.
35 Employment Standards Act Regulation, Part 1, Definitions.
Page 51
51
A live-in home support worker differs from other groups such as in-home caregivers, domestic workers,
night attendants, sitters, and residential care workers.36
As the interpretation guidelines for the Employment Standards Act and Employment Standards
Regulation notes, definitions under the Regulation are interpreted narrowly because they take away
benefits and protections conferred by the Act. That means that all employment conditions described in
the definition must be met in order to qualify as a live-in home support worker.37
For a home support service to be considered a government funded program, as required in the definition,
it must receive the majority of its funding either directly from the government through a contractual
arrangement for these services, or it must be received indirectly by money that has been designated by
government specifically for the purchase of home support services.
As is explained below, these conditions either no longer apply, or workers are all unionized and paid on
different arrangements by collective agreements.
The information for this analysis comes from a detailed research report for the FWC undertaken
by Professor Kendra Strauss, Director of the Simon Fraser University Labour Studies Program, The
Alternative Minimum Wage for Live-in Home Support Workers in B.C.: An Analysis. The FWC also received
information from the Ministry of Labour, public consultations, written submissions, and Statistics Canada.
Findings
History of minimum wage for home support workers
The category of live-in home support worker came into effect in BC in 1995. The change in name was
a result of a recommendation from a review of employment standards in 1994.38 This review also
recommended that the exclusion from hours of work provisions of the Employment Standards Act (ESA)
continue for these workers, but that they should be paid for 12 hours during a 24-hour period (according
36 See definitions in Kendra Strauss, The Alternative Minimum Wage for Live-in Home Support Workers in B.C.:
An Analysis, prepared for the Fair Wages Commission, 2018, www.sfu.ca/labour/fairwagescommission/
FairWagesCommissionReports.html
37 Interpretation Guidelines Manual British Columbia Employment Standards Act and Regulations, Part I, Section 1,
Definitions – Live-Home Support Worker.
38 Thompson 1994 (supra note 13), p. 70-72.
Page 52
52
to regulations for premium pay for above a regular day), and if they worked longer they should be paid for
an additional three hours or the time actually worked at their regular rate.
Not all of the recommendations of the 1994 review were implemented. In 1995, the BC government set
the alternate minimum wage for live-in home support workers at a daily wage 10 times the minimum wage
rate, at $65/day. Since then the daily rate has increased at the same rate as the general minimum wage.
The current rate is $113.50 for each day or part day worked. Live-in home support workers are excluded
from the hours of work and overtime provisions of the ESA.
The daily rate for live-in home support workers is applied to all hours of work within a 24 hour period,
whether below or above the normal eight-hour day, and workers are not charged room and board. As
Strauss explains, this group is treated in different ways in legislation from other categories of caregivers.39
This can have important implications for pay in that the daily minimum wage for live-in home support
workers could provide a lower total pay than other similar categories if more than the standard eight-hour
day occurs. A worker in this category who worked a 12-hour shift at $113.50/day would be paid 71% of
the normal pay of a domestic worker and 43% of the normal pay of an in-home caregiver.40 That is, a live-in
home support worker does not receive overtime pay for hours above those for the normal working day in
BC and the alternative minimum wage is only equivalent to 10 hours of pay at the general minimum wage.
In the past the Ministry of Labour in consultation with the Ministry of Health has had discussions with
industry associations and other stakeholders to consider a range of options for dealing with this alternate
minimum wage. Since live-in home support workers who provide services through a government-funded
program that is covered by the ESA legislation are used very rarely, if at all, this minimum wage appears
to be irrelevant. The discussions about dealing with this category involved a range of considerations from
abolishing the category altogether to revising and extending it so that it is not limited to only workers
employed through government funded programs.41
It appears that this process began in April 2016 following a BC Employment Standards Tribunal ruling
that asserted that the current standard for live-in home support workers cannot be applied to non-
government funded home support service providers.42 This tribunal occurred because some private
home care providers were paying their employees as though this alternate minimum wage applied. The
39 See Strauss 2018 (supra note 36), p. 5, for details about the distinctions for various other categories of caregivers in
the home and how they are treated in the ESA in BC.
40 Strauss 2018 (supra note 36), Table I.
41 Communication from the Ministry of Labour.
42 Government funding includes BC’s health authorities and from Veterans Affairs Canada, but does not include
funding from ICBC, WorkSafeBC, old age security, or the guaranteed income supplement. These definitions are a
result of Employment Standards Tribunal decisions.
Page 53
53
organization that represents the employers of live-in domestic workers would like the law to be changed
so that it covers the workers they hire who live-in while providing care.43
Since there is a possibility that this legislation could be revised to expand the definition of live-in home
support workers to include non-government paid home support service providers, information about
how these workers are treated in other jurisdictions, the characteristics of the workers, and the normal
remuneration of workers in this broad category will be examined. The information received on this issue
from public consultations will also be considered.
Other provinces
The BC approach in using the specific category of live-in home support worker is not used in other
provinces. But most provinces have exemptions and alternative minimum wages for similar categories of
domestic workers and caregivers. A brief review indicates some of the variations from BC practices. (For
details see Appendix VIII.)
• Domestic workers are exempt from minimum wage legislation in New Brunswick, Nova
Scotia, the Northwest Territories, and the Yukon.
• In Quebec, Newfoundland and Labrador, and Prince Edward Island domestic workers must
be paid the minimum wage.
• Live-in domestic workers in Alberta are paid a minimum of $2,582 per month with
stipulations about the number of hours worked. Domestic employees are exempt from
overtime compensation and restrictions on maximum hours of work, but are not exempt
from requirements for rest periods and days of rest.
• In Saskatchewan, live-in caregivers must be paid the general minimum wage for the first
eight hours worked.
• In Ontario, homecare workers are usually entitled to up to 12 hours at the prevailing
minimum wage rate.
• In Manitoba, domestic workers, including those who live-in and who work more than 12
hours per week, must be paid at least the minimum wage.
43 Letter from BC Care Providers Association to the Minister of Labour, November 29, 2017.
Page 54
54
Characteristics of home support workers
The broad category of home support workers is primarily female and over-represented by immigrant and
racialized workers. The average age of community health workers in BC was 47, with one third aged 55 or
over. These are characteristics that broadly mirror international evidence on live-in caregivers and home
support workers.
The Health Employers Association of BC (HEABC) provides information about the Community Subsector
of care workers, which can give an indication of who is doing this type of work. HEABC indicates that in
the entire Community Subsector (in 2013) there were 15,200 workers with 22% working full time, 12%
part time, 23% regular workers, and 43% casual. Men accounted for only 5.2% of the workers in 2017.
Within this broad category there are 8,000 community health workers in BC who care for clients in a
variety of publicly-funded health care settings. Most of these (74%) work for home support agencies and
community mental health services (19%). It appears that part-time and casual work is increasing in this
area, with more split shifts and less time per client. This is probably related to indications of an increase in
workers holding multiple jobs, going from about 6% in 1987 to over 22% in 2017.
The four main unions in community care are the BC Government and Service Employees’ Union (BCGEU),
which in 2014 organized 70% of the workers, the Hospital Employees’ Union (HEU), the United Food and
Commercial Workers (UFCW), and the Health Sciences Association (HSA).
Wages for general category of home care workers
Since the BC category of live-in home support worker does not correspond to the main occupational or
industrial classification systems used by Statistics Canada, finding wage data needs to rely on workers
in similar categories. Because all the workers who provide publicly-funded home support services are
unionized, the wages in this sector are above the minimum wage.44 The occupational category that comes
closest to live-in home support workers includes home support workers, housekeepers, and related
occupations.45
The federal Job Bank, which collects information about the prevailing wage for low-wage positions under
the Temporary Foreign Worker Program, determines the low, median, and high wages for home support
44 It should be noted that under the BC ESA where a collective agreement is in place, most of the provisions of the
collective agreement apply instead of the minimum standard set out in the Act and Regulations.
45 This is Statistics Canada occupational classification NOC 441. See Strauss 2018 (supra note 36) at pp. 8-11 for a full
discussion of these categories.
Page 55
55
workers, housekeepers, and related occupations across Canada. The 2015-16 median wage in BC is
around $17.35/hour, the low wage is $11.35, and the high wage is $23.00. There are other measure that
give different results, so wage figures need to be treated with caution. From what exists, it appears that
public sector wages for this broad category are higher than private sector wages.
The requirements regarding hours of work and rest times in collective bargaining contracts are higher
than the current alternate minimum wage regulations for this group. The collective agreement of the
Health Employers Association of BC and the Health Services and Support – Community Subsector
Association of Bargaining Agents prescribes the following regarding live-in and overnight shifts:
• Live-in shifts are to be paid at a minimum of 13 hours or more, at the employee’s regular rate
of pay. All hours paid will be used to determine benefit entitlement and seniority. Employees
shall receive two consecutive days off after five consecutive days worked in a week.
• Overnight shifts shall be paid at a minimum of 10 hours or more, at the employee’s regular
rate of pay.
The pay for the hours of work actually performed under trade union contracts is higher than that provided
for in the existing minimum wage.
The proposals of the BC Care Providers Association for extending the alternative minimum wage for live-
in caregivers also makes recommendations for amending the legislation. It argues that having these non-
government workers receive pay at the general minimum wage is prohibitively expensive. The revisions
proposed would deal with expanding the definition of a live-in home support worker to include those
paid privately, extending the client base to anyone with a chronic illness or disability, and setting new
minimums for daily rates and hours of work.46
Information from public consultations
The FWC received information about the minimum wage as related to the general conditions of those
doing care work from workers, trade unions, and groups supporting care workers. Only a few specifically
dealt with the very limited category for which the alternative minimum wage applies. There were no
specific comments from employers on this issue.
The main themes we heard from the consultations in Nanaimo, Victoria, Vancouver, and Prince George
was that live-in domestic workers have difficult working conditions without appropriate compensation.
46 BC Care Providers Association letter to the Minister of Labour, November 29, 2017.
Page 56
56
These included the following comments and observations:
• These live-in workers are only paid minimum wage for 10 hours of work. They are unable to earn
overtime rates, even if their eight-hour rest period is interrupted.
• On-call should be deemed to be part of working hours. Live-in home support workers are sometimes
on-call for 24 hours a day without pay or overtime pay.
• The different classes of domestic workers in the ESA and Regulation serve to confer different rights
for workers who do essentially the same work.
• Regulations are complicated and discourage workers from filing complaints when their rights are
violated.
• The work is highly gendered and racialized, and it seems that adequate value is not placed on care
work for those who are elderly or disabled.
Conclusions and recommendations
This category covers few or no workers. This is because the definition of a live-in home support worker
is very restricted. It applies only to those who are employed through a government funded program,
providing home support services for anyone with an acute or chronic illness or disability not requiring
hospitalization. Other provinces do not have this specific classification of home support worker.
All of the workers who are employed through a government funded program are unionized, so no workers
would be receiving this alternative minimum wage, if the service is supplied. It appears that in the past
there have been private providers who have used this alternative minimum wage, but an Employment
Standards Tribunal ruling found this not to be lawful.
There is a proposal to the Ministry of Labour from the BC Care Providers Association for extending this
alternative minimum wage to private sector workers. This appears to be beyond the scope of the FWC,
and something that would need to be discussed between various other ministries for a decision to occur.
Since these workers are currently covered by the general minimum wage, this would incur a reduction in
their wage protection.
Recommendation
• The FWC recommends that the alternate minimum wage for live-in home support workers
be abolished.
Page 57
57
5 Resident caretakers
Context
An alternate minimum wage for resident caretakers in BC has been in effect since at least 1981. A resident
caretaker is defined as someone who lives in an apartment building that has more than eight residential
suites and is also employed as a caretaker, custodian, janitor, or manager of a building that meets the
definition of apartment.47
The minimum wage is calculated as a monthly amount and varies depending on the number of units
involved:
• 9 to 60 units: $681.00/month plus $26.29 for each suite (for example, if someone manages
42 units, including their own suite, the wage would be $1,827.18); and
• 61 or more units: $2,319.65/month.
If a person works less than a full month, the above rates are prorated based on the number of days worked.
Resident caretakers’ wages may be less than the general minimum wage if they work a regular 40-hour
work week, since the pay per hour can be highly variable based on the number of units and the hours of
work required. For example, a resident caretaker who takes care of 42 units and works 40 hours/week
for the month would be paid about $10.83/hour and much less if working full time in a smaller building. If
a resident caretaker takes care of 61 units and works 40 hours/week for the month, the wage would be
$13.85/hour.
47 Employment Standards Regulation, Part 1, Definitions.
Page 58
58
Resident caretakers must be designated as occupying that role by their employer in writing; otherwise
they are entitled to be covered by the general minimum wage. There may be more than one designated
resident caretaker for a building. If a relief caretaker is employed for weekends and vacations, this person
is paid the regular minimum wage.
Live-in caretakers are not entitled to daily or weekly overtime pay, but are entitled to 32 consecutive
hours free from work each week and eight consecutive hours a day. Overtime pay is only necessary if
they are required to work during their 32 hours of rest time. This is one and a half times the regular wage.
This group of workers is covered by statutory holiday and annual vacation provisions of the Employment
Standards Act.
Rent is sometimes deducted from pay or in lieu of pay. This is permitted for live-in caretakers, but only
with written authorization from the employee. The Interpretation Guidelines Manual for the ESA is quite
explicit that it is not acceptable for the employer to assume this arrangement, because the law explicitly
prohibits it unless permission is given in writing.48
The alternate minimum wage for resident caretakers has increased at roughly the same rate (75%) as the
general minimum wage since 1994.49
It is unclear how many people the alternate minimum wage for resident caretakers covers or has covered
in the past. It is also unclear how many hours they generally work, how much they typically earn, or the
characteristics of this group of workers. There appears to have been no examination of this particular
group in BC in the past, and statistical information is not available.
Comparisons with other provinces
BC is the only province that prescribes an alternate minimum wage for resident caretakers, also referred
to as ‘building services providers’ or ‘residential-service facility workers’ in other provinces and territories.
It is unclear why this alternate minimum wage was initially established in BC. In every other jurisdiction in
Canada, residential caretakers are protected by the general minimum wage, although they are not always
protected by other employment standards regulations. In Saskatchewan and Nova Scotia they are exempt
from overtime pay. In Manitoba they are exempt from ‘day of rest’ legislation. In the Northwest Territories
rent cannot be clawed back from the minimum wage.
48 Interpretation Guidelines, ESR Section 17 – Minimum Wage – Resident caretakers.
49 The Ministry of Labour provided the resident caretaker alternate minimum wages from 1994 to 2017.
Page 59
59
Findings from consultations
The FWC consulted people through public hearings throughout the province, through the submission
of briefs, and through other written comments. The commission did not hear from any employers or
landlords, nor any former or current resident caretakers themselves, and only one community group
specifically discussed resident caretakers.
Community groups, trade unions, and some individuals feel that all alternate minimum wage categories
should be abolished. This includes the alternate resident caretaker wage. Both at in-person consultations
and through written submissions, they argued that no exceptions to general minimum wage protection
should exist for any worker. One community group raised the issue of the lack of protection in the
enforcement of how rent is treated as part of the wage. It appears that in some cases this occurs
without the explicit permission of the employee. This appears to be an issue related to enforcement of
employment standards regulations.
The only other major issue that was brought to the attention of the FWC was the practice of avoiding
the minimum wage provisions for this group of workers through the practice of hiring a caretaker as
an independent contractor. It appears to be not uncommon for property managers to designate the
live-in caretaker, or caregiver couple, as a contractor and pay below the alternate minimum wage rates,
or to waive the rent as a form of remuneration. This issue, and the one related to how rent is treated,
are enforcement issues related to employment standards regulations that should be examined in any
employment standards review.
Conclusions and recommendations
The alternate minimum wage for resident caretakers has existed since 1981 and BC is the only jurisdiction
in Canada with an alternate minimum wage for this group of workers.
It appears there has been no review or examination of this minimum wage since it began. Statistics Canada
does not have a specific category for this group, so the characteristics of these workers are also not
known.
The issues that came to the attention of the FWC relate to how the regulations regarding the minimum
wage are treated by employers. It appears that the regulations that currently exist regarding how rent is
treated as part of the wage is not necessarily followed and that the rent is either treated as the equivalent
Page 60
60
of the minimum wage, or deducted as a matter of course for the wage. Also, it appears that the minimum
wage is circumvented by off-site building managers or owners, by hiring live-in caretakers on contract.
Recommendations
• An employment standards review should examine the regulations around contracting out
for resident caretakers to understand if this practice should be regulated.
• An employment standards review might consider making the treatment of rent separate
from the payment of the wages of the resident caretaker.
• In the near future, the permanent FWC should undertake original research in order to
understand the relevance of this alternative minimum wage.
• The FWC recommends that on June 1, 2018 the alternate minimum wage for resident
caretakers increase at the same rate as the general minimum wage for the two categories of
resident caretaker units. The specific rates will be:
2018 11.5% increase
9-60 units = $759.32 (+ 30.43/unit)
61+ units = $2,586.40
2019 9.5% increase
9-60 units = $831.45 (+ 33.32/unit)
61+ units = $2,832.11
2020 5.4% increase
9-60 units = $876.35 (+ 35.12/unit)
61+ units = $2,985.04
2021 4.1% increase
9-60 units = $912.28 (+ 36.56/unit)
61 + units = $3,107.42
Page 61
61
6 Live-in camp leaders
Context
An alternate minimum wage came into effect in 1997 for live-in camp leaders in BC and they are currently
entitled to $90.80/day. ‘Live-in camp leaders’ refers to those employed by a charity or non-profit seasonal
camp and who provide instruction or counselling to campers under the age of 19. They are also defined
in BC’s Employment Standards Regulation as providing their service on a 24-hour basis without being
charged for room and board.
The definition of live-in camp leader minimum wage applies only to those working in charities or non-
profits. Live-in camp leaders working in for-profit camps are protected by the general minimum wage.
Before 1997, live-in camp leaders working in non-profits were protected by the general minimum wage
and it is unclear why this alternate minimum wage was initially established.
The daily rate for live-in camp leaders has gone from $56.00/day in 1997 to the current rate of $90.80/day
or part day worked. This is an increase of $34.80 or 62.1%, which is equivalent to the percent increase for
the general minimum wage for the same time period.
The current rate of $90.80/day would mean that live-in camp leaders are being paid equivalent to the
general minimum wage if they work a regular eight-hour day. However, the much longer hours in their
work schedules results in live-in camp leaders making less than the general minimum wage. They are also
exempt from overtime pay.
It is unclear how many people the alternate minimum wage for live-in camp leaders covers or has covered
in the past, nor is there information on the characteristics of workers who hold these jobs. It is also unclear
how many hours they generally work or how much they typically earn in a season. This class of worker
is very specific and as a result, there is not specific information about how many or who is employed in
general labour force statistics.
Page 62
62
Comparisons with other provinces
BC is not the only province that allows live-in camp leaders, or sometimes workers in non-profits, to be
paid less than the general minimum wage. However, BC is the only province that prescribes a set alternate
minimum wage for these workers. Other provinces either cover all live-in camp leaders under general
minimum wage protection (Ontario) or they exclude camp leaders at non-profits (Alberta, Quebec,
Manitoba, New Brunswick), or non-profit workers more generally (Saskatchewan, PEI). Nova Scotia also
excludes live-in camp leaders from overtime pay.
Findings from consultations
The FWC consulted people through public hearings throughout the province, through the submission of
briefs, and through other written comments. The commission heard from very few individuals who had
experience either employing or working as live-in camp leaders, although both an employer and former
live-in camp leader spoke at a consultation. There is a marked distinction between employers who want
to keep the lower alternate minimum wage whereas community groups, trade unions, and former live-in
camp leaders would like to see it abolished.
An employer that ran a non-profit based summer camp argued that the minimum wage needs to be low so
that the youth who can’t otherwise afford camp still have the opportunity to go. They argued that non-
profit summer camps will be dramatically impacted in their ability to offer affordable camps that provide
programming for low income youth. The employer stressed that most live-in camp leaders are youth in an
entry level position. They are generally seasonal staff, between 17 and 18 years old. The employer felt that
being a live-in camp leader provides teenagers with extensive training and can be career setting for some,
at which point they can move up in the organization and make more than $20/hour.
Community groups and trade unions held the relatively unanimous opinion to abolish alternate minimum
wages altogether, including the live-in camp leader wage. Both at in-person consultations and through
written submissions, they argued that no exceptions to general minimum wage protection should exist
for any worker. If the alternate minimum wage for live-in camp leaders was abolished, those working at
non-profits camps would be covered by general minimum wage protection like their peers who work at
for-profit camps.
The former live-in camp leader who spoke at a FWC consultation reinforced that he was not compensated
for overtime hours despite being on-call on a 24-hour basis. Camp leaders often receive food but do not
get regularly scheduled breaks and lack regulatory protection. In this case, room and board was provided
Page 63
63
for a $5/day nominal amount, which is inconsistent with regulations that state room and board is to be
included in the alternate minimum wage.
The experience of a former live-in camp leader points to the need for a review and better enforcement
of employment standards regulations regarding overtime pay, break time, and protection against illegal
deductions which is beyond the scope of this commission.
Conclusions and recommendations
Live-in camp leaders receiving the alternative minimum wage are those employed by a charity or non-
profit seasonal camp for campers under 19 years of age. The minimum wage is $90.80/day on a 24-hour
basis with no regulations stipulating any rest time or days off.
No other jurisdiction in Canada has a similar alternative minimum wage and no other charities have
alternate minimum wages for their workers.
The FWC had no information from workers in this category during the consultations, and one camp leader
talked to us about the significance of this lower wage for maintaining a camp. The assumption is that these
workers are very young and gain valuable experience. There is no data available from Statistics Canada
about this group of workers.
There is also no information about how the alternate minimum wage for live-in camp leaders is carried
out, what conditions are like for these workers especially regarding breaks, and what kind of living
situations they find themselves in. It appears this issue has not been examined by the government at any
time. The lack of rest periods or days off is especially troubling, considering the probable age of most of
these workers.
Recommendations
• The FWC recommends that the alternate minimum wage for live-in camp leaders increase at
the same percent each year as the general minimum wage, beginning June 1, 2018:
Year % increase Minimum wage
2018 11.5% $101.24
2019 9.5% $110.87
2020 5.4% $116.86
2021 4.1% $121.65
Page 64
64
• The FWC recommends an employment standards review to establish regulations regarding
time off and rest periods.
• The FWC recommends that the future permanent FWC conduct an investigation with
original research into the merits of this alternate minimum wage.
Page 65
65
7 Permanent fair wages commission
IN THE FIRST REPORT OF THE FWC a recommendation was made that a permanent commission be
established to make recommendations about increasing the minimum wage in the future. At that time we
indicated that the two additional phases of the work of the FWC would likely give more insight into the
tasks that a permanent commission could undertake.
The tasks that were identified in the first report were the following:
• Establish a permanent commission with a staff to examine issues related to low wages in BC
and to give advice on increases to the minimum wage.
• Provide for a permanent research function for the commission so that it can examine the
changing nature of the labour market and how well new forms of work are protected with
existing minimum wage coverage.
• Establish a predictable indicator that is the basis for future minimum wage increases.
• Establish a way to ensure that the advice to the commission is representative of community
interests.
This report has identified areas that should be added as tasks to the potential work of a permanent
fair wages commission that was recommended in the first report of the Commission. These additional
recommendations are as follows:
• Conduct a review of all of the alternative wage categories in this report, after a suitable
period of time, to ensure that they are functioning appropriately for both workers and
employers.
Page 66
66
• Initiate original research on two areas identified in this report for which there is currently
little or no information to inform an adequate evaluation of the efficacy of the alternative
minimum wage. These are resident caretakers and live-in camp leaders.
• Undertake an examination of areas indicated in the general recommendations in this report.
• Conduct reviews of occupations that are currently completely exempt from minimum wage
coverage.
The third report of the FWC, which will deal with how to reconcile the difference between the minimum
wage and a liveable wage, will undoubtedly uncover other issues that could be reviewed in the future by a
permanent fair wages commission.
Page 67
67
8 Summary of recommendations
Farm workers paid by piece rate
Recommendations
• The FWC recognizes the significance of piece rates as an incentive system and recommends
that it be maintained, but not in the way it currently operates. The minimum wage should be
a floor and piece rates should be available as an incentive.
o The FWC recommends a phase in of the general minimum wage to give employers time
to adjust:
■ 15% increase to all piece rates on June 1, 2018; and
■ Institute the general minimum wage on June 1, 2019.
o The FWC recommends that all farm workers receive at least the general minimum
wage by June 1, 2019. This means if workers do not receive the equivalent of the
general minimum wage for picking at piece rates their remuneration will be increased
to equal the general minimum wage.
• The FWC recommends that the piece rate system as it is currently constructed be
continued, in the short term, in order to maintain an incentive system in piece rates.
Page 68
68
• The FWC recommends that in the future, once the general minimum wage is fully
implemented, piece rates as an incentive be reviewed by a permanent FWC, in consultation
with industry and workers. This would be to determine whether it should be government
or employers who should set the piece rates that are used as an incentive system above the
general minimum wage.
• The FWC recommends that a more thorough review of employment standards be
undertaken to review the requirements for detailed and accurate time and payment records.
This will be important for transparency regarding working times and remuneration.
• The FWC understands that the chances being recommended are substantial. We therefore
recommend that the permanent FWC review this new system after a reasonable amount of
time, to ensure that it is functioning appropriately for both workers and employers.
Liquor servers
Recommendations
• The FWC recommends that the minimum wage for liquor servers be raised to equal the
general minimum wage. This should be raised incrementally in order to give employers
time to adjust. This incremental increase will ensure that liquor servers receive the general
minimum wage of $15.20/hour by 2021. We recommend that the liquor server wage
increase on June 1 each year, beginning in 2018, with the following amounts:
Year $ increase Minimum wage
2018 $1.30 $11.40
2019 $1.30 $12.70
2020 $1.25 $13.95
2021 $1.25 $15.20
• The FWC recommends that a future employment standards review examine the tipping
practices in BC. This should examine standards to determine when tips are considered
wages, review the practice of using tips to enhance the wages of non-tipped workers, and
ensure that tipping practices are transparent.
Page 69
69
Live-in home support workers
Recommendation
• The FWC recommends that the alternate minimum wage for live-in home support workers
be abolished.
Resident caretakers
Recommendations
• An employment standards review should examine the regulations around contracting out
for resident caretakers to understand if this practice should be regulated.
• An employment standards review might consider making the treatment of rent separate
from the payment of the wages of the resident caretaker.
• In the near future, the permanent FWC should undertake original research in order to
understand the relevance of this alternative minimum wage.
• The FWC recommends that on June 1, 2018 the alternate minimum wage for resident
caretakers increase at the same rate as the general minimum wage for the two categories of
resident caretaker units. The specific rates will be:
2018 11.5% increase
9-60 units = $759.32 (+ 30.43/unit)
61+ units = $2,586.40
2019 9.5% increase
9-60 units = $831.45 (+ 33.32/unit)
61+ units = $2,832.11
2020 5.4% increase
9-60 units = $876.35 (+ 35.12/unit)
61+ units = $2,985.04
2021 4.1% increase
9-60 units = $912.28 (+ 36.56/unit)
61 + units = $3,107.42
Page 70
70
Live-in camp leaders
Recommendations
• The FWC recommends that the alternate minimum wage for live-in camp leaders increase at
the same percent each year as the general minimum wage, beginning June 1, 2018:
Year % increase Minimum wage
2018 11.5% $101.24
2019 9.5% $110.87
2020 5.4% $116.86
2021 4.1% $121.65
• The FWC recommends an employment standards review to establish regulations regarding
time off and rest periods.
• The FWC recommends that the future permanent FWC conduct an investigation with
original research into the merits of this alternate minimum wage.
Permanent fair wages commission
This current report has identified areas that should be added as tasks to the potential work of a
permanent fair wages commission that was recommended in the first report of the Commission.
Recommendations
• Conduct a review of all of the alternative wage categories in this report, after a suitable
period of time, to ensure that they are functioning appropriately for both workers and
employers.
• Initiate original research on two areas identified in this report for which there is currently
little or no information to inform an adequate evaluation of the efficacy of the alternative
minimum wage. These are resident caretakers and live-in camp leaders.
• Undertake examination of areas indicated in the general recommendations in this report.
• Conduct reviews of occupations that are currently completely exempt from minimum wage
coverage.
Page 71
71
Appendix I. Terms of Reference for the Fair Wages Commission
FINAL Terms of Reference
FAIR WAGES COMMISSION
Whereas the general minimum wage in British Columbia is $11.35/hour and the liquor server minimum
wage is $10.10/hour as of September 15, 2017;
And whereas among Canadian provinces, minimum wages range from $10.72 to $12.20/hour as of August
2017, although Alberta has announced a commitment to be at $15/hour by October 2018 while Ontario
has plans to reach $15/hour by January 2019;
And whereas with the cost of living in BC, a person working full-time in a minimum wage job cannot make
ends meet or support a family;
And whereas in contrast to the minimum wage, a living wage is designed to reflect what earners in a family
need to bring home based on the actual costs of living in a specific community;
And whereas government intends to increase the minimum wage to $15/hour as part of a plan to create
good jobs, fair wages and build a sustainable economy in every sector and in every corner of the province,
including indexing it to inflation in the future so as not to fall behind;
And whereas the Confidence and Supply Agreement from May 2017 contains the following commitment
at Section 2 (e): “Immediately establish an at-arm’s-length Fair Wages Commission that will be tasked with
establishing a pathway to a minimum wage of at least $15 per hour and overseeing regular rate reviews. The
commission will bring forward recommendations regarding strategies to address the discrepancy between
minimum wages and livable wages. The commission will make its first report on a new minimum wage within 90
days of its first meeting.”
Now, therefore, the Minister directs the establishment of an impartial Fair Wages Commission as follows:
1. The Commission will consist of a Chair, one representative of employer interests and one
representative of worker interests. These three Commission members will be appointed by
the Minister of Labour. The Minister may add two members (one who represents employer
interests and one who represents worker interests) to the Commission if needed after the
first report is submitted (as per item 4 below) to address the complexities of the discrepancy
between minimum wages and living wages.
Page 72
72
2. The budget for the Commission will come from the Ministry of Labour. Payment for the
Commission Chair and its members will be in accordance with government policy. The
Ministry will provide administrative support for the Commission, including research and
website support.
3. The Commission will determine its own procedures, including the format for reporting
to the Minister and communications. It is expected that the Commission will engage in
consultations with and receive submissions from interested stakeholders from all regions
of the province including but not limited to representatives of economists, trade unions, the
technology sector, small business, and youth.
4. The Commission will make its first report on a new minimum wage within 90 days of its first
meeting. The first meeting of the Commission will take place on or before October 1, 2017
to enable a first report no later than December 31, 2017. The report should be in writing to
the Minister of Labour and address the issues in items 5 to 7, inclusive, below. The timing for
items 8 and 9 are for discussion with the Minister but are not required to be included in the
first report to the Minister.
5. The Commission must prepare recommendations on the general minimum wage that will
result in a series of increases over time to reach a $15/hour minimum wage. Where possible,
the recommendations should support the principles of regular, measured, and predictable
increases over time to allow employers an appropriate notice period to plan for the changes
on the way to a $15/hour minimum wage.
6. The Commission should consider the impact of minimum wage increases in other
jurisdictions including those jurisdictions that have committed to achieving $15/hour.
Consideration should be given to the prevailing views on the impact of minimum wage
increases on employment.
7. The Commission must consider and make recommendations on the other minimum wage
rates under the Employment Standards Regulation.
8. The Commission must prepare recommendations related to regular rate reviews once the
$15/hour minimum wage is achieved, including the Commission’s role in overseeing regular
rate reviews. The Commission should give consideration to the BC consumer price index and
other factors (e.g., economic and labour market conditions), and provide recommendations
on when and how the increases beyond the $15/hour minimum wage should be determined.
Page 73
73
9. The Commission will review the issue of what constitutes a “living wage” and the elements
that make up determining a “living wage”, including a jurisdictional scan of the issue in BC
and across Canada. Recognizing rapid changes occurring in the economy, the Commission
will make recommendations regarding strategies to address the discrepancy between the
minimum wage and a “living wage”.
10. The Minister of Labour will make the Commission’s reports public after a reasonable period
of time to review and consider them. The Minister will also provide the reports to Cabinet.
Given under my hand this 29 day of September, 2017.
Honourable Harry Bains, Minister of Labour
Page 74
74
Appendix II. BC minimum wage legislation
Employment Standards Act
EMPLOYMENT STANDARDS REGULATION
[includes amendments up to B.C. Reg. 158/2017, September 15, 2017]
Part 4 — Minimum Wages
Minimum hourly wage
15 Subject to sections 16 to 18.1, the minimum wage is $11.35 an hour.
Minimum daily wage
16 (1) The minimum daily wage for a live-in home support worker is $113.50 for each day or part day
worked.
(2) The minimum daily wage for a live-in camp leader is $90.80 for each day or part day worked.
Minimum wage — resident caretakers
17 The minimum wage for a resident caretaker is,
(a) for an apartment building containing 9 to 60 residential suites, $681.00 a month plus $27.29 for each
suite, and
(b) for an apartment building containing 61 or more residential suites, $2 319.65.
Minimum wage — farm workers
18 (1) The minimum wage, including 4% of gross earnings vacation pay, for farm workers who are employed
on a piece work basis and hand harvest the following berry, fruit or vegetable crops, is, for the gross volume
or weight picked, as follows:
(a) apples $18.89 a bin (27.1 ft3 / 0.767 m3);
(b) apricots $21.73 a 1/2 bin (13.7 ft3 / 0.388 m3);
(c) beans $0.259 a pound / $0.571 a kg;
(d) blueberries $0.438 a pound / $0.966 a kg;
(e) brussel sprouts $0.180 a pound / $0.397 a kg;
(f) cherries $0.248 a pound / $0.547 a kg;
(g) grapes $20.07 a 1/2 bin (13.7 ft3 / 0.388 m3);
(h) mushrooms $0.260 a pound / $0.573 a kg;
Page 75
75
(i) peaches $20.07 a 1/2 bin (12.6 ft3 / 0.357 m3);
(j) pears $21.27 a bin (27.1 ft3 / 0.767 m3);
(k) peas $0.323 a pound / $0.712 a kg;
(l) prune plums $21.27 a 1/2 bin (13.7 ft3 / 0.388 m3);
(m) raspberries $0.395 a pound / $0.871 a kg;
(n) strawberries $0.380 a pound / $0.838 a kg.
(1.1) The minimum wage for farm workers who are employed on a piece work basis and hand harvest
daffodils is $0.152 a bunch (10 stems) for gross number picked.
(2) Each employer of farm workers must display, in a location where they can be read by all employees,
notices stating the following:
(a) the volume of each picking container being used;
(b) the volume or weight of fruit, vegetables or berries required to fill each picking container;
(c) the resulting piece rate.
(3) Farm workers described in subsection (1), and their employers, are exempted from section 58 of
the Act on condition that the farm workers receive not less than the minimum wage described in
subsection (1).
(4) A farm labour contractor must keep records of the following information:
(a) the name of each worker;
(b) the work site location and dates worked by each worker;
(c) the fruit, vegetable, berry or flower crop picked in each day by each worker;
(d) the volume or weight picked in each day by each worker.
(5) The records required by subsection (4) must
(a) be in English,
(b) be kept at the employer’s principal place of business in British Columbia, and
(c) be retained by the employer for 2 years after the employment terminates.
Minimum wage — liquor servers
18.1 (1) In this section, “liquor server” means an employee
(a) whose primary duties are as a server of food or drink or both, and
(b) who, as a regular part of his or her employment, serves liquor directly to customers, guests,
members or patrons in premises for which a licence to sell liquor has been issued under
the Liquor Control and Licensing Act.
(2) The minimum wage for a liquor server is $10.10 an hour.
Page 76
76
Appendix III. Agricultural piece rates 1981-2017
YEARMONTH OF INCREASE
GENERAL MINIMUM
WAGE
PIECE RATE (APPLE TO DAFFODIL)
APPLE APRICOT BEAN BLUEBERRYBRUSSEL SPROUT
CHERRY DAFFODIL
$/BIN $/1/2 BIN $/LB. $/LB. $/LB. $/LB. $/BUNCH
1981 $3.65 $8.00 $8.50 $0.100 $0.195 $0.070 $0.105 -
1982 $3.65 $8.00 $8.50 $0.100 $0.195 $0.070 $0.105 -
1983 $3.65 $8.00 $8.50 $0.100 $0.195 $0.070 $0.105 -
1984 $3.65 $8.00 $8.50 $0.100 $0.195 $0.070 $0.105 -
1985 $3.65 $8.00 $8.50 $0.100 $0.195 $0.070 $0.105 -
1986 $3.65 $8.00 $8.50 $0.100 $0.195 $0.070 $0.105 -
1987 $3.65 $8.76 $9.35 $0.110 $0.215 $0.080 $0.115 -
1988 July $4.50 $9.86 $10.48 $0.125 $0.240 $0.085 $0.130 -
1989 October $4.75 $10.41 $11.06 $0.130 $0.255 $0.090 $0.135 -
1990 April $5.00 $10.96 $11.64 $0.135 $0.265 $0.095 $0.145 -
1991 $5.00 $10.96 $11.64 $0.135 $0.265 $0.095 $0.145 -
1992 February $5.50 $12.05 $12.81 $0.150 $0.295 $0.105 $0.160 -
1993 April $6.00 $12.05 $12.81 $0.150 $0.295 $0.105 $0.160 -
1994 $6.00 $12.05 $12.81 $0.150 $0.295 $0.105 $0.160 -
1995 March $6.50 $13.16 $13.99 $0.165 $0.295 $0.115 $0.173 -
October $7.00 $13.16 $13.99 $0.165 $0.295 $0.115 $0.173 -
1996 $7.00 $13.16 $13.99 $0.165 $0.295 $0.115 $0.173 -
1997 $7.00 $13.16 $13.99 $0.165 $0.295 $0.115 $0.173 -
1998 April $7.15 $13.44 $15.46 $0.184 $0.312 $0.128 $0.177 $0.112
1999 $7.15 $14.46 $16.63 $0.198 $0.336 $0.138 $0.190 $0.112
2000 November $7.60 $15.37 $17.68 $0.210 $0.357 $0.146 $0.202 $0.112
2001 November $8.00 $16.18 $18.61 $0.222 $0.376 $0.154 $0.213 $0.125
2002 $8.00 $16.18 $18.61 $0.222 $0.376 $0.154 $0.213 $0.125
2003 $8.00 $15.60 $17.94 $0.210 $0.362 $0.149 $0.205 $0.125
2004 $8.00 $15.60 $17.94 $0.214 $0.362 $0.149 $0.205 $0.125
2005 $8.00 $15.60 $17.94 $0.214 $0.362 $0.149 $0.205 $0.125
Table III.1 General minimum wage and piece rate increases (apple to daffodil) in BC: 1981-2017
Page 77
77
YEARMONTH OF INCREASE
GENERAL MINIMUM
WAGE
PIECE RATE (APPLE TO DAFFODIL)
APPLE APRICOT BEAN BLUEBERRYBRUSSEL SPROUT
CHERRY DAFFODIL
$/BIN $/1/2 BIN $/LB. $/LB. $/LB. $/LB. $/BUNCH
2006 $8.00 $15.60 $17.94 $0.214 $0.362 $0.149 $0.205 $0.125
2007 $8.00 $15.60 $17.94 $0.214 $0.362 $0.149 $0.205 $0.125
2008 $8.00 $15.60 $17.94 $0.214 $0.362 $0.149 $0.205 $0.125
2009 $8.00 $15.60 $17.94 $0.214 $0.362 $0.149 $0.205 $0.125
2010 $8.00 $15.60 $17.94 $0.214 $0.362 $0.149 $0.205 $0.125
2011 May $8.75 $17.06 $19.62 $0.234 $0.396 $0.163 $0.224 $0.137
November $9.50 $17.06 $19.62 $0.234 $0.396 $0.163 $0.224 $0.137
2012 May $10.25 $17.06 $19.62 $0.234 $0.396 $0.163 $0.224 $0.137
2013 $10.25 $17.06 $19.62 $0.234 $0.396 $0.163 $0.224 $0.137
2014 $10.25 $17.06 $19.62 $0.234 $0.396 $0.163 $0.224 $0.137
2015 September $10.45 $17.39 $20.00 $0.239 $0.404 $0.166 $0.228 $0.140
2016 September $10.85 $18.06 $20.77 $0.248 $0.419 $0.172 $0.237 $0.145
2017 September $11.35 $18.89 $21.73 $0.259 $0.438 $0.180 $0.248 $0.152
YEARMONTH OF INCREASE
GENERAL MINIMUM
WAGE
PIECE RATE (GRAPE TO STRAWBERRY)
GRAPEMUSH-ROOM
PEACH PEAR PEAPRUNE PLUM
RASP-BERRY
STRAW-BERRY
$/1/2 BIN $/LB. $/1/2 BIN $/BIN $/LB. $/1/2 BIN $/LB. $/LB.
1981 $3.65 $8.50 $0.110 $8.50 $9.00 $0.125 $9.00 $0.155 $0.150
1982 $3.65 $8.50 $0.110 $8.50 $9.00 $0.125 $9.00 $0.155 $0.150
1983 $3.65 $8.50 $0.110 $8.50 $9.00 $0.125 $9.00 $0.155 $0.150
1984 $3.65 $8.50 $0.110 $8.50 $9.00 $0.125 $9.00 $0.155 $0.150
1985 $3.65 $8.50 $0.110 $8.50 $9.00 $0.125 $9.00 $0.155 $0.150
1986 $3.65 $8.50 $0.110 $8.50 $9.00 $0.125 $9.00 $0.155 $0.150
1987 $3.65 $9.35 $0.120 $9.35 $9.86 $0.135 $9.85 $0.170 $0.165
1988 July $4.50 $10.48 $0.135 $10.48 $11.10 $0.155 $11.10 $0.190 $0.185
1989 October $4.75 $11.06 $0.145 $11.06 $11.71 $0.160 $11.71 $0.200 $0.195
1990 April $5.00 $11.64 $0.150 $11.64 $12.33 $0.170 $12.33 $0.210 $0.205
Table III.2 General minimum wage and piece rate increases (grape to strawberry) in BC: 1981-2017
Table III.1 Continued
Page 78
78
YEARMONTH OF INCREASE
GENERAL MINIMUM
WAGE
PIECE RATE (GRAPE TO STRAWBERRY)
GRAPEMUSH-ROOM
PEACH PEAR PEAPRUNE PLUM
RASP-BERRY
STRAW-BERRY
$/1/2 BIN $/LB. $/1/2 BIN $/BIN $/LB. $/1/2 BIN $/LB. $/LB.
1991 $5.00 $11.64 $0.150 $11.64 $12.33 $0.170 $12.33 $0.210 $0.205
1992 February $5.50 $12.81 $0.165 $12.81 $13.56 $0.190 $13.56 $0.235 $0.225
1993 April $6.00 $12.81 $0.165 $12.81 $13.56 $0.190 $13.56 $0.235 $0.225
1994 $6.00 $12.81 $0.165 $12.81 $13.56 $0.190 $13.56 $0.235 $0.225
1995
March $6.50 $13.99 $0.181 $13.99 $14.81 $0.206 $14.81 $0.255 $0.247
October $7.00 $13.99 $0.181 $13.99 $14.81 $0.206 $14.81 $0.255 $0.247
1996 $7.00 $13.99 $0.181 $13.99 $14.81 $0.206 $14.81 $0.255 $0.247
1997 $7.00 $13.99 $0.181 $13.99 $14.81 $0.206 $14.81 $0.255 $0.247
1998 April $7.15 $14.29 $0.185 $14.29 $15.13 $0.230 $15.13 $0.281 $0.271
1999 $7.15 $15.38 $0.199 $15.38 $16.28 $0.247 $16.28 $0.302 $0.292
2000 November $7.60 $16.34 $0.212 $16.34 $17.30 $0.263 $17.30 $0.321 $0.310
2001 November $8.00 $17.20 $0.223 $17.20 $18.22 $0.277 $18.22 $0.338 $0.326
2002 $8.00 $17.20 $0.223 $17.20 $18.22 $0.277 $18.22 $0.338 $0.326
2003 $8.00 $16.58 $0.215 $16.58 $17.56 $0.267 $17.56 $0.326 $0.314
2004 $8.00 $16.58 $0.215 $16.58 $17.56 $0.267 $17.56 $0.326 $0.314
2005 $8.00 $16.58 $0.215 $16.58 $17.56 $0.267 $17.56 $0.326 $0.314
2006 $8.00 $16.58 $0.215 $16.58 $17.56 $0.267 $17.56 $0.326 $0.314
2007 $8.00 $16.58 $0.215 $16.58 $17.56 $0.267 $17.56 $0.326 $0.314
2008 $8.00 $16.58 $0.215 $16.58 $17.56 $0.267 $17.56 $0.326 $0.314
2009 $8.00 $16.58 $0.215 $16.58 $17.56 $0.267 $17.56 $0.326 $0.314
2010 $8.00 $16.58 $0.215 $16.58 $17.56 $0.267 $17.56 $0.326 $0.314
2011
May $8.75 $18.13 $0.235 $18.13 $19.21 $0.292 $19.21 $0.357 $0.343
November $9.50 $18.13 $0.235 $18.13 $19.21 $0.292 $19.21 $0.357 $0.343
2012 May $10.25 $18.13 $0.235 $18.13 $19.21 $0.292 $19.21 $0.357 $0.343
2013 $10.25 $18.13 $0.235 $18.13 $19.21 $0.292 $19.21 $0.357 $0.343
2014 $10.25 $18.13 $0.235 $18.13 $19.21 $0.292 $19.21 $0.357 $0.343
2015 September $10.45 $18.48 $0.240 $18.48 $19.58 $0.298 $19.58 $0.364 $0.350
2016 September $10.85 $19.19 $0.249 $19.19 $20.33 $0.309 $20.33 $0.378 $0.363
2017 September $11.35 $20.07 $0.260 $20.07 $21.27 $0.323 $21.27 $0.395 $0.380
Table III.2 Continued
Page 79
79
YEAR
GENERAL MINIMUM
WAGE % INCREASE
% INCREASE TO PIECE RATE (APPLE TO DAFFODIL)
APPLE APRICOT BEAN BLUEBERRYBRUSSEL SPROUT
CHERRY DAFFODIL
1981 0.0% - - - - - - -
1982 0.0% 0.0% 0.0% 0.0% 0.0% 0.0% 0.0% -
1983 0.0% 0.0% 0.0% 0.0% 0.0% 0.0% 0.0% -
1984 0.0% 0.0% 0.0% 0.0% 0.0% 0.0% 0.0% -
1985 0.0% 0.0% 0.0% 0.0% 0.0% 0.0% 0.0% -
1986 0.0% 0.0% 0.0% 0.0% 0.0% 0.0% 0.0% -
1987 0.0% 9.5% 10.0% 10.0% 10.3% 14.3% 9.5% -
1988 23.3% 12.6% 12.1% 13.6% 11.6% 6.3% 13.0% -
1989 5.6% 5.6% 5.5% 4.0% 6.3% 5.9% 3.8% -
1990 10.0% 5.3% 5.2% 3.8% 3.9% 5.6% 7.4% -
1991 0.0% 0.0% 0.0% 0.0% 0.0% 0.0% 0.0% -
1992 10.0% 9.9% 10.1% 11.1% 11.3% 10.5% 10.3% -
1993 9.9% 0.0% 0.0% 0.0% 0.0% 0.0% 0.0% -
1994 0.0% 0.0% 0.0% 0.0% 0.0% 0.0% 0.0% -
19958.3% 9.2% 9.2% 10.0% 0.0% 9.5% 8.1% -
7.7% 0.0% 0.0% 0.0% 0.0% 0.0% 0.0% -
1996 0.0% 0.0% 0.0% 0.0% 0.0% 0.0% 0.0% -
1997 0.0% 0.0% 0.0% 0.0% 0.0% 0.0% 0.0% -
1998 10.0% 2.1% 10.5% 11.5% 5.8% 11.3% 2.3% 1.8%
1999 0.0% 7.6% 7.6% 7.6% 7.7% 7.8% 7.3% 0.0%
2000 6.3% 6.3% 6.3% 6.1% 6.2% 5.8% 6.3% 0.0%
2001 5.3% 5.3% 5.3% 5.7% 5.3% 5.5% 5.4% 11.6%
2002 0.0% 0.0% 0.0% 0.0% 0.0% 0.0% 0.0% 0.0%
2003 0.0% -3.6% -3.6% -5.4% -3.7% -3.2% -3.8% 0.0%
2004 0.0% 0.0% 0.0% 1.9% 0.0% 0.0% 0.0% 0.0%
2005 0.0% 0.0% 0.0% 0.0% 0.0% 0.0% 0.0% 0.0%
2006 0.0% 0.0% 0.0% 0.0% 0.0% 0.0% 0.0% 0.0%
2007 0.0% 0.0% 0.0% 0.0% 0.0% 0.0% 0.0% 0.0%
2008 0.0% 0.0% 0.0% 0.0% 0.0% 0.0% 0.0% 0.0%
Table III.3 Percent increases for general minimum wage and piece rates (apple to daffodil) in BC: 1981 – 2017
Page 80
80
YEAR
GENERAL MINIMUM
WAGE % INCREASE
% INCREASE TO PIECE RATE (APPLE TO DAFFODIL)
APPLE APRICOT BEAN BLUEBERRYBRUSSEL SPROUT
CHERRY DAFFODIL
2009 0.0% 0.0% 0.0% 0.0% 0.0% 0.0% 0.0% 0.0%
2010 0.0% 0.0% 0.0% 0.0% 0.0% 0.0% 0.0% 0.0%
20119.4% 9.4% 9.4% 9.3% 9.4% 9.4% 9.3% 9.6%
8.6% 0.0% 0.0% 0.0% 0.0% 0.0% 0.0% 0.0%
2012 7.9% 0.0% 0.0% 0.0% 0.0% 0.0% 0.0% 0.0%
2013 0.0% 0.0% 0.0% 0.0% 0.0% 0.0% 0.0% 0.0%
2014 0.0% 0.0% 0.0% 0.0% 0.0% 0.0% 0.0% 0.0%
2015 2.0% 1.9% 1.9% 2.1% 2.0% 1.8% 1.8% 2.2%
2016 3.8% 3.9% 3.9% 3.8% 3.7% 3.6% 3.9% 3.6%
2017 4.6% 4.6% 4.6% 4.4% 4.5% 4.7% 4.6% 4.8%
YEAR
GENERAL MINIMUM
WAGE % INCREASE
% INCREASE TO PIECE RATE (GRAPE TO STRAWBERRY)
GRAPE MUSH-ROOM
PEACH PEAR PEAPRUNE PLUM
RASP-BERRY
STRAW-BERRY
1981 0.0% - - - - - - - -
1982 0.0% 0.0% 0.0% 0.0% 0.0% 0.0% 0.0% 0.0% 0.0%
1983 0.0% 0.0% 0.0% 0.0% 0.0% 0.0% 0.0% 0.0% 0.0%
1984 0.0% 0.0% 0.0% 0.0% 0.0% 0.0% 0.0% 0.0% 0.0%
1985 0.0% 0.0% 0.0% 0.0% 0.0% 0.0% 0.0% 0.0% 0.0%
1986 0.0% 0.0% 0.0% 0.0% 0.0% 0.0% 0.0% 0.0% 0.0%
1987 0.0% 10.0% 9.1% 10.0% 9.6% 8.0% 9.4% 9.7% 10.0%
1988 23.3% 12.1% 12.5% 12.1% 12.6% 14.8% 12.7% 11.8% 12.1%
1989 5.6% 5.5% 7.4% 5.5% 5.5% 3.2% 5.5% 5.3% 5.4%
1990 10.0% 5.2% 3.4% 5.2% 5.3% 6.3% 5.3% 5.0% 5.1%
1991 0.0% 0.0% 0.0% 0.0% 0.0% 0.0% 0.0% 0.0% 0.0%
1992 10.0% 10.1% 10.0% 10.1% 10.0% 11.8% 10.0% 11.9% 9.8%
1993 9.9% 0.0% 0.0% 0.0% 0.0% 0.0% 0.0% 0.0% 0.0%
1994 0.0% 0.0% 0.0% 0.0% 0.0% 0.0% 0.0% 0.0% 0.0%
Table III.3 Continued
Table III.4 Percent increases for general minimum wage and piece rates (grape to strawberry) in BC: 1981 – 2017
Page 81
81
YEAR
GENERAL MINIMUM
WAGE % INCREASE
% INCREASE TO PIECE RATE (GRAPE TO STRAWBERRY)
GRAPE MUSH-ROOM
PEACH PEAR PEAPRUNE PLUM
RASP-BERRY
STRAW-BERRY
1995 8.3% 9.2% 9.7% 9.2% 9.2% 8.4% 9.2% 8.5% 9.8%
7.7% 0.0% 0.0% 0.0% 0.0% 0.0% 0.0% 0.0% 0.0%
1996 0.0% 0.0% 0.0% 0.0% 0.0% 0.0% 0.0% 0.0% 0.0%
1997 0.0% 0.0% 0.0% 0.0% 0.0% 0.0% 0.0% 0.0% 0.0%
1998 10.0% 2.1% 2.2% 2.1% 2.2% 11.7% 2.2% 10.2% 9.7%
1999 0.0% 7.6% 7.6% 7.6% 7.6% 7.4% 7.6% 7.5% 7.7%
2000 6.3% 6.2% 6.5% 6.2% 6.3% 6.5% 6.3% 6.3% 6.2%
2001 5.3% 5.3% 5.2% 5.3% 5.3% 5.3% 5.3% 5.3% 5.2%
2002 0.0% 0.0% 0.0% 0.0% 0.0% 0.0% 0.0% 0.0% 0.0%
2003 0.0% -3.6% -3.6% -3.6% -3.6% -3.6% -3.6% -3.6% -3.7%
2004 0.0% 0.0% 0.0% 0.0% 0.0% 0.0% 0.0% 0.0% 0.0%
2005 0.0% 0.0% 0.0% 0.0% 0.0% 0.0% 0.0% 0.0% 0.0%
2006 0.0% 0.0% 0.0% 0.0% 0.0% 0.0% 0.0% 0.0% 0.0%
2007 0.0% 0.0% 0.0% 0.0% 0.0% 0.0% 0.0% 0.0% 0.0%
2008 0.0% 0.0% 0.0% 0.0% 0.0% 0.0% 0.0% 0.0% 0.0%
2009 0.0% 0.0% 0.0% 0.0% 0.0% 0.0% 0.0% 0.0% 0.0%
2010 0.0% 0.0% 0.0% 0.0% 0.0% 0.0% 0.0% 0.0% 0.0%
2011 9.4% 9.3% 9.3% 9.3% 9.4% 9.4% 9.4% 9.5% 9.2%
8.6% 0.0% 0.0% 0.0% 0.0% 0.0% 0.0% 0.0% 0.0%
2012 7.9% 0.0% 0.0% 0.0% 0.0% 0.0% 0.0% 0.0% 0.0%
2013 0.0% 0.0% 0.0% 0.0% 0.0% 0.0% 0.0% 0.0% 0.0%
2014 0.0% 0.0% 0.0% 0.0% 0.0% 0.0% 0.0% 0.0% 0.0%
2015 2.0% 1.9% 2.1% 1.9% 1.9% 2.1% 1.9% 2.0% 2.0%
2016 3.8% 3.8% 3.8% 3.8% 3.8% 3.7% 3.8% 3.8% 3.7%
2017 4.6% 4.6% 4.4% 4.6% 4.6% 4.5% 4.6% 4.5% 4.7%
Table III.4 Continued
Page 82
82
Appendix IV. Cross-jurisdictional comparison of farm worker minimum wages
GENERAL MINIMUM
WAGE
FARM WORKER MINIMUM
WAGE ADDITIONAL NOTES
CANADA
British
Columbia$11.35
General hourly wage
for SAWP workers.
Piece rates for specified
hand harvested crops
for domestic workers.
• Domestic farm workers who harvest specified
crops by hand may be paid by piece rate and must
be paid the minimum rate set by the Employment
Standards Regulation for each crop. Farm workers
paid by piece rate are not required to make the
general minimum wage.
• Farm workers are not entitled to overtime pay.
Alberta $13.60 General minimum wage.
• Farm workers are covered by the general
minimum wage.
• Exemption: farm worker employed by family
member.
Ontario $14.00
Piece rate at least
equivalent to general
minimum wage.
• Must receive at least what they would have
earned per hour working at the general minimum
wage.
• Not covered by limits on hours, rest days,
overtime pay, or vacation pay in the Employment
Standards Act.
Quebec $11.25
Piece rate at least
equivalent to general
minimum wage.
• Must receive at least what they would have
earned per hour working at the general minimum
wage, otherwise workers are paid on yield.
• When yield is affected by crop conditions, worker
is entitled to general minimum wage.
Saskatchewan $10.96 General minimum wage.• Farm workers are covered by the general
minimum wage.
Manitoba $11.15 General minimum wage.
• Farm workers are covered by the general
minimum wage.
• Exemption: farm worker employed by family
member.
Newfoundland $11.00
Piece rate at least
equivalent to general
minimum wage.
• Must receive at least what they would have
earned per hour working at the general minimum
wage.
• Farm workers are not entitled to overtime pay.
Page 83
83
GENERAL MINIMUM
WAGE
FARM WORKER MINIMUM
WAGE ADDITIONAL NOTES
Nova Scotia $10.85 Piece rate.
• Farm workers paid on a piece rate basis for
harvesting fruit, vegetables, and tobacco and are
not required to make the general minimum wage.
• Farm workers under 16 are exempt from general
minimum wage.
• Exempt from overtime, holiday pay, and day of rest.
New Brunswick $11.00
Piece rate at least
equivalent to general
minimum wage.
• Must receive at least what they would have
earned per hour working at the general minimum
wage.
Prince
Edward Island$11.25 General minimum wage.
• Farm workers are covered by the general
minimum wage.
UNITED STATES
Washington
Makes reference
to piece rates; no
established piece rates.
• Must receive at least what they would have
earned per hour working at the general minimum
wage if working on commission or piece rate basis.
Business must keep track of actual hours worked
and the piece rate units; employers must make up
the difference each week if piece rate units do not
equal amount equivalent to minimum wage.
• Employers must pay farm workers separate rate
of pay for rest breaks in addition to piece rate
wage agreements; pay must be equivalent to
regular rate of pay or minimum wage, whichever
is greater.
• Farm workers not entitled to overtime pay.
California
Makes reference
to piece rates; no
established piece rates.
• Must receive at least what they would have
earned per hour working at the general minimum
wage.
New Jersey
Makes reference
to piece rates; no
established piece rates.
• Must receive at least what they would have
earned per hour working at the general state
minimum wage.
• Farm workers not entitled to overtime pay.
Michigan
Makes reference
to piece rates; no
established piece rates.
• Must receive at least what they would have
earned per hour working at the general state
minimum wage; covers youth 16 and over and
farms with more than two employees.
Appendix IV Continued
Page 84
84
Appendix V. Share of liquor servers in BC by job characteristics: 2016
SHARE OF LIQUOR SERVERS
SHARE OF TOTAL EMPLOYEES
NUMBER OF LIQUOR SERVERS
(IN ’000s)
NUMBER OF TOTAL EMPLOYEES
(IN ’000s)
NUMBER OF JOBS
Single job 89.6% 93.9% 17.2 1,769.1
Multiple jobs 10.4% 6.1% 2.0 115.5
Total 100.0% 100.0% 19.2 1,884.6
UNION COVERAGE
None 97.4% 70.3% 18.7 1,324.4
Coverage 29.7% 560.2
TYPE OF JOB
Permanent 70.8% 87.7% 13.6 1,653.7
Temporary 29.2% 12.3% 5.6 230.9
Total 100.0% 100.0% 19.2 1,884.6
JOB TENURE
1 – 6 months 19.3% 12.4% 3.7 234.1
7 – 12 months 17.2% 8.7% 3.3 163.7
13 – 60 months 49.0% 32.5% 9.4 612.4
61+ months 14.6% 46.4% 2.8 874.4
Total 100.0% 100.0% 19.2 1,884.6
REASON PART-TIME
Voluntary 78.1% 75.7% 10.0 254.5
Involuntary 21.9% 24.3% 2.8 81.7
Total part-time 100.0% 100.0% 12.8 336.2
Total 19.2 1,884.6
Source: Statistics Canada custom tabulation using a 2016 Labour Force Survey confidential file. Note: Numbers may not
add up to 100% due to rounding; definition of liquor server: employees who are employed in the occupation of bartender
or food/beverage server in the industries of either drinking places (alcoholic beverages) or full-service restaurants and
limited seating eating places and if employees usually receive tips; liquor server and total employees refer to those over
19 years of age.
Page 85
85
Appendix VI. Share of liquor servers in BC by hourly wage and weekly household earnings: 2016
SHARE OF LIQUOR SERVERS
SHARE OF TOTAL EMPLOYEES
NUMBER OF LIQUOR SERVERS
(IN ’000s)
NUMBER OF TOTAL EMPLOYEES
(IN ’000s)
HOURLY WAGE
≤ $10.85 16.1% 4.6% 3.1 86.6
$10.86-$15.00 52.1% 17.8% 10.0 334.8
$15.01-$21.00 23.4% 21.3% 4.5 401.9
≥$21.01 8.3% 56.3% 1.6 1,061.4
Total 100.0% 100.0% 19.2 1,884.6
WEEKLY HOUSEHOLD EARNINGS
Quintile 1:
$600.00 - $740.0051.6% 19.2% 9.9 361.7
Quintile 2:
$740.01 - $1,200.0016.1% 19.4% 3.1 364.7
Quintile 3 & 4*:
$1,200.01 - $2,384.5022.4% 38.6% 4.3 727.5
Quintile 5:
$2,384.51 - $10,9809.9% 22.9% 1.9 430.7
Total 100.0% 100.1% 19.2 1,884.6
Source: Statistics Canada custom tabulation using a 2016 Labour Force Survey confidential file. Notes: Quintiles 3 &
4 are combined due to low numbers; numbers may not add up to 100% due to rounding; definition of liquor server:
employees who are employed in the occupation of bartender or food/beverage server in the industries of either drinking
places (alcoholic beverages) or full-service restaurants and limited seating eating places and if employees usually receive
tips; liquor server and total employees refer to those over 19 years of age.
Page 86
86
Appendix VII. Cross-jurisdictional comparison of liquor server minimum wages
MINIMUM WAGE
TIP REGULATIONSGENERAL
LIQUOR SERVER*
British Columbia $11.35 $10.10
• Ownership and deductions: Tips and gratuities are the property of the employee and cannot be used to cover business costs.
• Pooling or sharing: Employers can require employees to pool their tips and share with other employees that would otherwise have no access to tips.
• Additional note: Liquor server alternate minimum wage introduced in 2011.
Alberta $13.60General
minimum wage
• Ownership and deductions: Tips are not considered wages. Employers cannot make deductions without advance written permission and not for sub-standard workmanship, breakage, or dine-and-dash type losses or cash shortages.
• Pooling or sharing: Tips are not covered by the employment standards codes; each workplace decides how tips are to be handled among employees.
• Additional note: Differential liquor server wage abolished in 2016.
Ontario $14.00 $12.20
• Ownership and deductions: Employers can’t withhold, make deductions from, or make their employees return their tips and other gratuities including to cover things like spilled food or beverages, broken supplies (e.g. dishes and glassware), losses or damages (e.g. from theft or customers who don’t pay their bill).
• Pooling or sharing: Employers can withhold or take an employee’s tips or other gratuities if they are collecting and redistributing them later in a tip pool. Employers can participate in a tip pool if they: are a sole proprietor (i.e. the exclusive owner) of the business or a director, partner or shareholder in the business and regularly spend most of their time doing the same work as the employees who share in the tip pool, or other employees in the same industry that would normally receive or share tips.
• Additional note: Latest minimum wage increases still include a liquor server alternate wage.
Page 87
87
MINIMUM WAGE
TIP REGULATIONSGENERAL
LIQUOR SERVER*
Quebec $11.25$9.45 for
any tipped workers
• Ownership and deductions: An employer who collects tips must remit them in full to the employee who provided the service. Tips include service charges added to the customer’s bill, but do not include the administration charges added to the bill.
• Pooling or sharing: An employee receiving tips has the right to participate in a tip-sharing arrangement. This arrangement, whether verbal or in writing, must result from the free and voluntary consent of the employees who are entitled to the tips. The employer cannot impose such an arrangement on employees or intervene in the reaching of such an arrangement. Employees who participate in a tip-sharing arrangement may ask their employer to manage the application of the arrangement and to distribute the tips among all of the participants. An employee hired in an establishment where a tip-sharing arrangement already exists is required to take part in this arrangement. Tipped workers cannot participate in the tip pool.
• Additional note: Lower minimum wage for any tipped workers, including liquor servers. Tips must be recorded by the employee and employer for reporting purposes and the provision of benefits, such as EI and CPP.
New Brunswick $11.00General
minimum wage
• Ownership and deductions: Tips and service charges are the properties of the employee; employer cannot withhold or deduct from tips as wages or partial wages.
• Pooling or sharing: Employer may adopt tip pooling practices to the benefit of some or all of the employees, but the employer cannot take some of the tips for themselves.
Prince
Edward Island$11.25
General minimum
wage
• Ownership and deductions: Tips and service charges are the properties of the employee; employer cannot withhold or deduct from tips as the wages or partial wages of the employee unless previously agreed upon. If tips are taken by the employer, they must be returned within 60 days. Tips can be calculated as additional wages for the purposes of CPP and EI.
• Pooling or sharing: No employer can require an employee to share their tips with other employees or the employer. Employer may adopt tip pooling practices to the benefit of some or all of the employees, but the employer cannot take some of the tips for themselves. Employees must be notified in writing at the time of hire of any tip pooling practices.
Nova Scotia $10.85General
minimum wage
• Ownership and deductions: Tips are not considered wages. Tips and gratuities are not protected by employment standards code.
• Additional note: No liquor server differential but experience differential: $10.85/hour for experienced workers, $10.35/hour for inexperienced workers.
Appendix VII Continued
Page 88
88
MINIMUM WAGE
TIP REGULATIONSGENERAL
LIQUOR SERVER*
Newfoundland $11.00General
minimum wage
• Ownership and deductions: Tips and service charges are the properties of the employee and employees cannot be required to share the tip with an employer, manager, or supervisor.
Saskatchewan $10.96General
minimum wage
• Ownership and deductions: Tips are not considered wages. Tips are not protected from employers.
Manitoba $11.15General
minimum wage
• Ownership and deductions: Tips are not considered wages.
Yukon $11.32General
minimum wage
• Ownership and deductions: Tips are not considered wages.
Northwest
Territories$12.50
General minimum
wage• Ownership and deductions: Tips are not considered wages.
Nunavut $13.00General
minimum wage
• Ownership and deductions: Tips are not considered wages.
Sources: Employment standards acts and regulations, provincial and territorial government websites. Note: *Liquor
server or tipped worker.
Appendix VII Continued
Page 89
89
Appendix VIII. Cross-jurisdictional comparison of live-in caregivers and equivalents
PROVINCEMINIMUM
HOURLY WAGE (as at Oct. 1, 2017)
LIVE-IN CAREGIVER DEFINITION
LIVE-IN CAREGIVER WAGE
Alberta
$13.60
A scheduled
minimum wage
increase is set
for Oct. 1, 2018
to $15.00.
A domestic employee is a person
employed to work in the employer’s
residence, for the care, comfort and
convenience of members of that
residence.
For domestic employees who live
in: $2,582/month.
For domestic employees who
don’t live in: $13.60 per hour.
Saskatchewan $10.96*
A care provider is someone hired
primarily for the care and supervision of
an immediate family member in either
the home of the employer or the home
of the family member requiring care.
There are two types of care providers:
come-in care providers (do not live in
the home of the employer); and live-in
care providers.
Come-in care providers are
exempt from minimum wage.
For live-in care providers, the
hourly rate during the first eight
hours is always at least the
minimum wage.
Manitoba $11.15
Employees who live in homes to take
care of, or supervise, a member of the
employer’s household, while residing in
the employer’s residence are domestic
workers (including live-in nannies).
Domestic workers who work
more than 12 hours per week
must make at least minimum
wage.
Ontario
$11.60
The minimum
wage will rise
to $14.00 in
January 2018
and $15.00 in
January 2019.
Domestic workers are hired to work
in a private home. They do things such
as housekeeping, or provide care,
supervision or personal assistance to
children or people who are elderly, ill
or disabled. An employee who is hired
by a business, agency or any person
other than the householder to perform
homemaking services for a householder
is classified as a ‘homemaker.’
Domestic workers are covered
by the Ontario Employment
Standards Act on payment of
wages.
Home care workers
(homemakers) are generally
entitled to minimum wage for up
to 12 hours per day.
Quebec $11.25
A domestic is an employee in the
employ of a person and whose main
function is the performance of domestic
duties in the dwelling of that person,
including an employee whose main
function is to take care of or provide
care to a child or to a sick, handicapped
or aged person.
General minimum wage.
Page 90
90
PROVINCEMINIMUM
HOURLY WAGE (as at Oct. 1, 2017)
LIVE-IN CAREGIVER DEFINITION
LIVE-IN CAREGIVER WAGE
Newfoundland
and Labrador$11.00 No formal definition in law. General minimum wage.
New Brunswick $11.00
No definition, but the provincial
Employment Standards Act “does
not include a person having control
or direction of or being responsible,
directly or indirectly, for the
employment of persons in or about
his private home.” The excludes
domestic workers from minimum wage
legislation.
Persons employed in a private
home are exempt from the
minimum wage.
Nova Scotia $10.85
The provincial minimum wage does not
apply to employees who do domestic
service for or give personal care to
an immediate family member in a
private home and are working for the
householder or to employees who do
domestic service for or give personal
care in a private home and are working
for the householder for 24 hours or less
per week.
Domestic service and personal
care workers employed in a
private home are exempt from the
minimum wage.
Prince
Edward Island$11.25 No definition. General minimum wage.
North West
Territories
$12.50
The minimum
wage will rise
to $13.46 on
April 1, 2018.
An employee employed in domestic
work in a private residence in which his
or her employer ordinarily resides.
Exempt from the minimum the
wage.
Yukon $11.32*
Domestics are persons employed to
provide cooking, cleaning, gardening,
maintenance, chauffeuring, sitting,
nursing, tutoring or other services to
household.
Domestics are exempted
from Part 2, Hours of Work
and Overtime, of the Yukon
Employment Standards Act. If
domestics are not paid an hourly
rate, then their minimum wage
is eight hours multiplied by the
current minimum wage rate to
calculate the minimum amount
for each day or part day worked.
Nunavut $13.00
The Labour Standards Act and
provincial minimum wage applies
to domestic workers when
defined by regulation.
*These provinces have annual rate increases based on changes in the Consumer Price Index.
Appendix VII Continued