17
Mining and Metals commodity briefcase Aluminium, Coal, Copper, Iron Ore, Nickel, Steel, Zinc & Lead May, 2016

Mining and Metals commodity briefcase Aluminium, Coal, Copper, Iron Ore, Nickel, Steel, Zinc & Lead May, 2016
Aluminium
This publication contains information in summary form and is therefore intended for general guidance only. It is not intended to be a substitute for detailed research or the exercise of professional judgment. Neither EYGM Limited nor any other member of the global Ernst & Young organization can accept any responsibility for loss occasioned to any person acting or refraining from action as a result of any material in this publication. On any specific matter, reference should be made to the appropriate advisor.

Price Chart
Industry Snapshot
Prices remain low despite supply cuts due to the belief that China idled capacity is not permanent and may restart at any time.
The market is expected to be in deficit in 2016 with high demand from the automotive sector and ongoing global production cuts. However, the deficit is highly dependent on the actual reductions in China’s production capacity and if subsidies are removed.
The Indian, the US and European Governments have taken protectionism steps against Chinese exports by providing subsidies to domestic producers or imposing import taxes. The industry may continue to receive increased government support to keep the smelters running amid depressed prices.
Sector Overview Aluminium prices seen resisting supply cuts There has been significant price uncertainty over the last year. In January 2016, aluminium prices fell to the lowest level since 2009 at $1,460/t down 14% y-o-y before recovering to US$1,500/t in March 2016. Aluminium prices will remain under pressure despite supply cuts in both the US and China, as producers are wary that China may restart idled capacity at any time and continue the construction of new smelters in China. New capacity additions will mostly come from north-west provinces including Xinjiang and Inner Mongolia, where captive coal power plants have significantly lowered production costs for smelters.1 Price Outlook Global production growth will slow as prices remain low. Aluminium prices will average US$1,575/t over the next few months, before a combination of factors such as the weakening of the US$ and a slow erosion of the global aluminium surplus will act to gradually push prices back up. Prices are expected to increase to US$1,675/t in the subsequent four years, but will still be below the 2014 average of US$1,896/t.2
Despite all the bad news, demand is set to increase in the long term3
Long-term aluminium demand looks positive with strong demand from the automotive markets. Demand is set to increase by 24mt to 78mt by 2025.4
1 “Primary aluminium prices at LME sink to six-year low in August 2015,” CMIE,
http://www.cmie.com/kommon/bin/sr.php?kall=wclrdhtm&nvdt=20150921142535806&nvpc=099000000000&nvtype=TIDINGS, 21 September 2015
2 “Aluminum prices seen resisting supply cuts,” American Metal Market, 19 March 2016 via FACTIVA
3 “Metals & Mining: 2Q16 Commodity Outlook,” Deutsche Bank, 22 March 2016 via ThomsonOne
4 “Aluminum demand to rise to 78 million tonnes by 2025 -Rio Tinto,” Reuters News, 22 September 2015 via FACTIVA
EY aluminium commodity briefcase April 2016

Coal
This publication contains information in summary form and is therefore intended for general guidance only. It is not intended to be a substitute for detailed research or the exercise of professional judgment. Neither EYGM Limited nor any other member of the global Ernst & Young organization can accept any responsibility for loss occasioned to any person acting or refraining from action as a result of any material in this publication. On any specific matter, reference should be made to the appropriate advisor.
EY coal commodity briefcase February 2016
Price Chart
Industry Snapshot
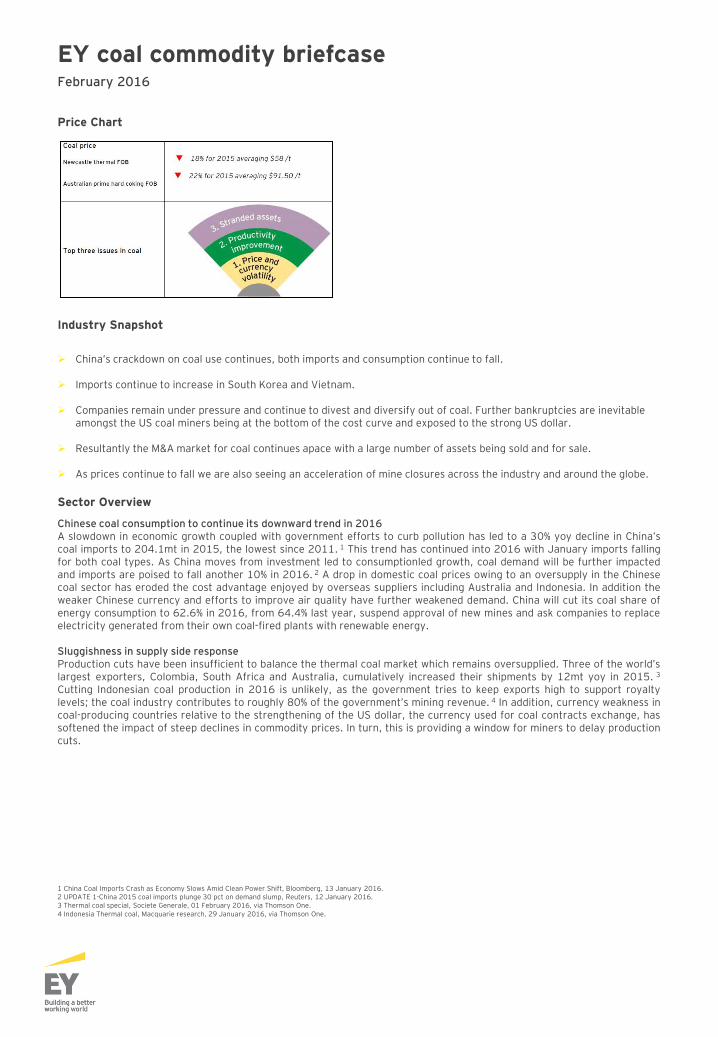
China’s crackdown on coal use continues, both imports and consumption continue to fall.
Imports continue to increase in South Korea and Vietnam.
Companies remain under pressure and continue to divest and diversify out of coal. Further bankruptcies are inevitable
amongst the US coal miners being at the bottom of the cost curve and exposed to the strong US dollar.
Resultantly the M&A market for coal continues apace with a large number of assets being sold and for sale.
As prices continue to fall we are also seeing an acceleration of mine closures across the industry and around the globe.
Sector Overview
Chinese coal consumption to continue its downward trend in 2016 A slowdown in economic growth coupled with government efforts to curb pollution has led to a 30% yoy decline in China’s coal imports to 204.1mt in 2015, the lowest since 2011. 1 This trend has continued into 2016 with January imports falling for both coal types. As China moves from investment led to consumptionled growth, coal demand will be further impacted and imports are poised to fall another 10% in 2016. 2 A drop in domestic coal prices owing to an oversupply in the Chinese coal sector has eroded the cost advantage enjoyed by overseas suppliers including Australia and Indonesia. In addition the weaker Chinese currency and efforts to improve air quality have further weakened demand. China will cut its coal share of energy consumption to 62.6% in 2016, from 64.4% last year, suspend approval of new mines and ask companies to replace electricity generated from their own coal-fired plants with renewable energy. Sluggishness in supply side response Production cuts have been insufficient to balance the thermal coal market which remains oversupplied. Three of the world’s largest exporters, Colombia, South Africa and Australia, cumulatively increased their shipments by 12mt yoy in 2015. 3 Cutting Indonesian coal production in 2016 is unlikely, as the government tries to keep exports high to support royalty levels; the coal industry contributes to roughly 80% of the government’s mining revenue. 4 In addition, currency weakness in coal-producing countries relative to the strengthening of the US dollar, the currency used for coal contracts exchange, has softened the impact of steep declines in commodity prices. In turn, this is providing a window for miners to delay production cuts.
1 China Coal Imports Crash as Economy Slows Amid Clean Power Shift, Bloomberg, 13 January 2016. 2 UPDATE 1-China 2015 coal imports plunge 30 pct on demand slump, Reuters, 12 January 2016. 3 Thermal coal special, Societe Generale, 01 February 2016, via Thomson One. 4 Indonesia Thermal coal, Macquarie research, 29 January 2016, via Thomson One.

Copper
This publication contains information in summary form and is therefore intended for general guidance only. It is not intended to be a substitute for detailed research or the exercise of professional judgment. Neither EYGM Limited nor any other member of the global Ernst & Young organization can accept any responsibility for loss occasioned to any person acting or refraining from action as a result of any material in this publication. On any specific matter, reference should be made to the appropriate advisor.
Price Chart
Industry Snapshot
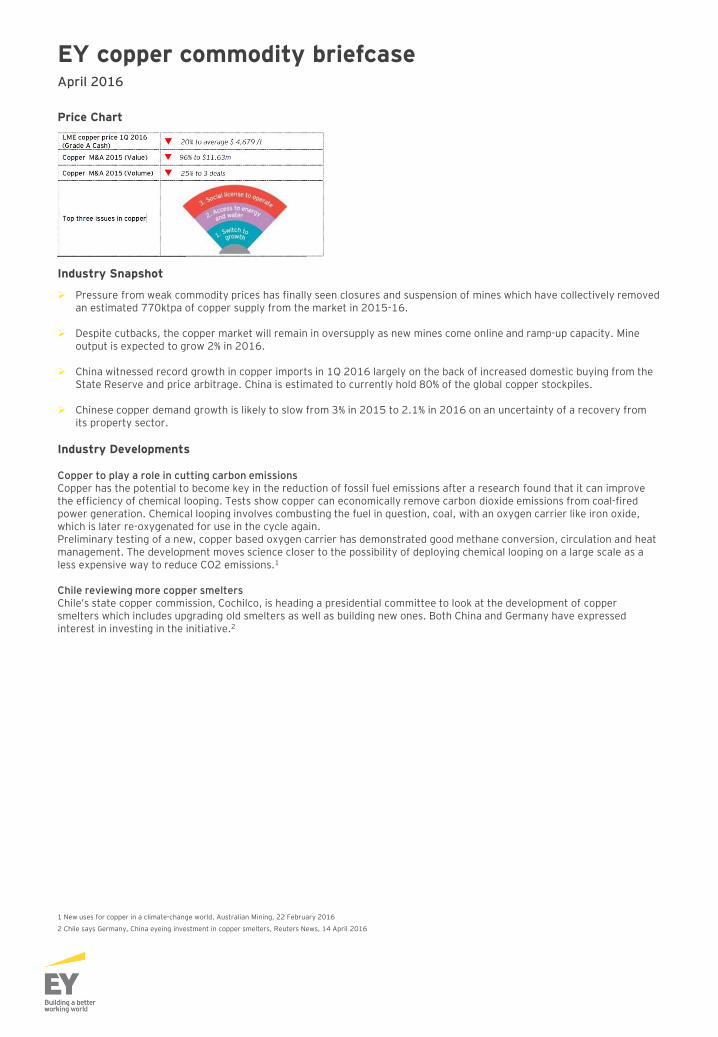
Pressure from weak commodity prices has finally seen closures and suspension of mines which have collectively removed an estimated 770ktpa of copper supply from the market in 2015-16.
Despite cutbacks, the copper market will remain in oversupply as new mines come online and ramp-up capacity. Mine output is expected to grow 2% in 2016.
China witnessed record growth in copper imports in 1Q 2016 largely on the back of increased domestic buying from the State Reserve and price arbitrage. China is estimated to currently hold 80% of the global copper stockpiles.
Chinese copper demand growth is likely to slow from 3% in 2015 to 2.1% in 2016 on an uncertainty of a recovery from its property sector.
Industry Developments Copper to play a role in cutting carbon emissions Copper has the potential to become key in the reduction of fossil fuel emissions after a research found that it can improve the efficiency of chemical looping. Tests show copper can economically remove carbon dioxide emissions from coal-fired power generation. Chemical looping involves combusting the fuel in question, coal, with an oxygen carrier like iron oxide, which is later re-oxygenated for use in the cycle again. Preliminary testing of a new, copper based oxygen carrier has demonstrated good methane conversion, circulation and heat management. The development moves science closer to the possibility of deploying chemical looping on a large scale as a less expensive way to reduce CO2 emissions.1
Chile reviewing more copper smelters Chile’s state copper commission, Cochilco, is heading a presidential committee to look at the development of copper smelters which includes upgrading old smelters as well as building new ones. Both China and Germany have expressed interest in investing in the initiative.2
1 New uses for copper in a climate-change world, Australian Mining, 22 February 2016
2 Chile says Germany, China eyeing investment in copper smelters, Reuters News, 14 April 2016
EY copper commodity briefcase April 2016

Iron Ore
This publication contains information in summary form and is therefore intended for general guidance only. It is not intended to be a substitute for detailed research or the exercise of professional judgment. Neither EYGM Limited nor any other member of the global Ernst & Young organization can accept any responsibility for loss occasioned to any person acting or refraining from action as a result of any material in this publication. On any specific matter, reference should be made to the appropriate advisor.

Price Chart
Industry Snapshot
Price rally: A 20% price rally in early March surprised the sector but appears to be a short lived sentimental reaction rather
than a fundamental change.
Samarco: A compensation deal was reached following the November 2015 disaster, with production expected to start
again by year end.
Vale/Fortescue: Significant blending deal signed between two major players to supply China with new premium product.
Sector Overview Prices
The supply glut saw iron ore prices fall to $38.30/t on 9 December 2015, a decade low, but experienced an almost 20% rally in early in March, the highest one day gain on record. The spurt appears be short lived and most believe that it was an unsustainable reaction to news of China’s railway and infrastructure plans, moves which usually suggest an increase in steel (and hence iron ore) demand. The overall worsening outlook for Chinese steel has led to cuts in the iron ore price forecast to $38/t in 2017.1 Some suggest the price could simply follow the cost of production down, meaning lows of $29-$35/t are a distinct possibility.2 Prices currently sit around $54/t with most forecasts predicting $41-$46/t average for the remainder of this year. Supply and demand
The recent lift in prices could incentivize miners to return to the market. Producers who would have struggled to break even at last year’s $40/t might be tempted to produce at $55/t, thus reversing some of last year’s supply cuts from high-cost miners. This is also likely to put a cap on how much further prices will increase in coming months.3 Despite pro-growth rhetoric and recent policy measures aimed to restructure Chinese steel industry, steel production is expected to grow at just 0.2% until 2020. Chinese demand will actually need to increase by an estimated 5% to balance expected iron ore supply. While forecast supply growth has moderated, it remains significant over the next two years, particularly in the face of a declining demand environment. A 6% increase in seaborne supply is expected this year to 80mt and a further increase to 94mt in 2017.4
Speculative buying
The recent price rally has received attention because of the possibility that iron ore buying could become ‘sentimental’, with speculators entering the market, instead of prices being fundamentally driven. While announcements (and consequently optimism) around Chinese fiscal spending and development often have a surge impact on iron ore prices, the sharp increase in futures trading volume recently suggest speculative investors are pushing prices higher.5
Market share
Australia and Brazil remain the two top suppliers of iron ore to China, both gaining market share in 2015, but they have not completely removed competition from smaller producing nations yet. South Arica and Ukraine, for example, have both increased their market share in the last 12 months, up 4% and 9% respectively. This is significant as it shows smaller miners can cling on for longer than expected through their own cost-cutting, high-grading and usage of cash reserves.6 1 “Weak demand hits iron price,” The Australian, 1 December 2015.
2 “BHP, Rio calm as prices slide to $US4o,” Australian Financial Review, 7 December 2015.
3 “Iron ore falls below $US56,” Business Spectator, 29 March 2016.
4 “Iron ore rally presents chance to short Rio, BHP, Liberum says,”
5 “Iron ore is having an enormous rally – but one explanation why is deeply concerning,” Business Insider, 31 March 2016.
6 “Australia, Brazil boost China iron ore import share, but not enough: Russell,” Reuters, 27 January 2016.
EY iron ore commodity briefcase Enero – Marzo 2016

Nickel
This publication contains information in summary form and is therefore intended for general guidance only. It is not intended to be a substitute for detailed research or the exercise of professional judgment. Neither EYGM Limited nor any other member of the global Ernst & Young organization can accept any responsibility for loss occasioned to any person acting or refraining from action as a result of any material in this publication. On any specific matter, reference should be made to the appropriate advisor.
Price Chart
Industry Snapshot
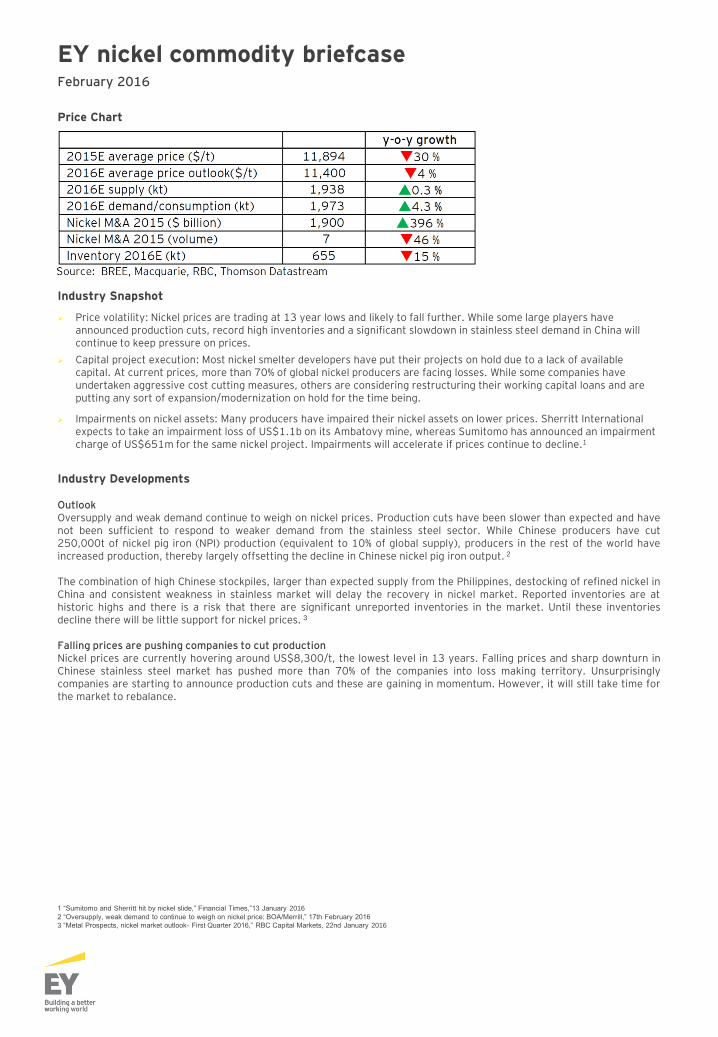
Price volatility: Nickel prices are trading at 13 year lows and likely to fall further. While some large players have announced production cuts, record high inventories and a significant slowdown in stainless steel demand in China will continue to keep pressure on prices.
Capital project execution: Most nickel smelter developers have put their projects on hold due to a lack of available capital. At current prices, more than 70% of global nickel producers are facing losses. While some companies have undertaken aggressive cost cutting measures, others are considering restructuring their working capital loans and are putting any sort of expansion/modernization on hold for the time being.
Impairments on nickel assets: Many producers have impaired their nickel assets on lower prices. Sherritt International expects to take an impairment loss of US$1.1b on its Ambatovy mine, whereas Sumitomo has announced an impairment charge of US$651m for the same nickel project. Impairments will accelerate if prices continue to decline.1
Industry Developments Outlook Oversupply and weak demand continue to weigh on nickel prices. Production cuts have been slower than expected and have not been sufficient to respond to weaker demand from the stainless steel sector. While Chinese producers have cut 250,000t of nickel pig iron (NPI) production (equivalent to 10% of global supply), producers in the rest of the world have increased production, thereby largely offsetting the decline in Chinese nickel pig iron output. 2 The combination of high Chinese stockpiles, larger than expected supply from the Philippines, destocking of refined nickel in China and consistent weakness in stainless market will delay the recovery in nickel market. Reported inventories are at historic highs and there is a risk that there are significant unreported inventories in the market. Until these inventories decline there will be little support for nickel prices. 3 Falling prices are pushing companies to cut production Nickel prices are currently hovering around US$8,300/t, the lowest level in 13 years. Falling prices and sharp downturn in Chinese stainless steel market has pushed more than 70% of the companies into loss making territory. Unsurprisingly companies are starting to announce production cuts and these are gaining in momentum. However, it will still take time for the market to rebalance. 1 “Sumitomo and Sherritt hit by nickel slide,” Financial Times,”13 January 2016
2 “Oversupply, weak demand to continue to weigh on nickel price: BOA/Merrill,” 17th February 2016
3 “Metal Prospects, nickel market outlook- First Quarter 2016,” RBC Capital Markets, 22nd January 2016
EY nickel commodity briefcase February 2016

Steel
This publication contains information in summary form and is therefore intended for general guidance only. It is not intended to be a substitute for detailed research or the exercise of professional judgment. Neither EYGM Limited nor any other member of the global Ernst & Young organization can accept any responsibility for loss occasioned to any person acting or refraining from action as a result of any material in this publication. On any specific matter, reference should be made to the appropriate advisor.

EY steel commodity briefcase March 2016
Price Chart
Industry Snapshot
2016 demand outlook: Finished steel consumption is expected to grow by only 0.7% y-o-y in 2016. Chinese demand is likely to contract by 2% y-o-y, but steel demand in India and Europe may support an overall increase in global steel consumption.1
Chinese steel exports: Exports from China down 5.3% y-o-y in January and down 8.6% from December 2015 as a result of new measures.2 Chinese steel production has also declined by 7.1% in January which is likely to have a flow on effect on exports.
Raw material price outlook: Iron ore and met coal prices may average US$41/t and US$82.8/t in 2016, a y-o-y decline of 21% and 13% respectively.3
Trade protectionism: A Minimum Import Price (MIP) has been imposed in on 173 products Imported into India. The EU has also imposed significant duties on cold-rolled flat products coming in from Russia and China. The United States has imposed preliminary duties on cold-rolled products from 7 countries including a massive 266% duty on Chinese products.
Industry Update
Outlook for 2016 Chinese GDP growth: Chinese GDP growth slowed from 7.3% in 2014 to 6.9% in 2015, the lowest rate of growth since 1990. The International Monetary Fund (IMF) projects Chinese GDP to slow to 6.3% in 2016, indicating a further slowdown in Chinese steel consumption. Global economic growth: The IMF has lowered its 2016 global economic growth forecast to 3.4%. Advanced economies are expected to continue their modest albeit uneven recovery whereas some large emerging and developing economies may continue to remain in economic distress. Steel consumption: The steel industry is expected to experience another year of low growth and this is likely to continue until developing nations of sufficient size and strength produce another major growth cycle. Steel production: Global steel production declined for the first time in five years in 2015. Despite this, China’s share of world output increased by 0.2% to 49.5%, due to an increase in steel exports. In 2015, the declining rate of production was reflected in steel capacity utilization which dropped to 69.7% from 73.4% in 2014.4 A further decline of 2.6% in steel output is expected in 2016. However, deeper cuts to capacity are likely to take time as steel mills seek to maintain market share while the market rebalances.5
1 World Steel Association
2. “China Jan iron ore imports rise on year ago, steel exports fall,” Reuters, 14 February 2016
3. “Metals quarterly Q12016,” HSBC, January 2016
4. “World steel output drops after 5 years rise,” Industry week, 25 January 2016
5. “World’s top steel industry shrinks for the first time since 1991”, Bloomberg via Mineweb.com, 19th January 2016

Zinc and Lead
This publication contains information in summary form and is therefore intended for general guidance only. It is not intended to be a substitute for detailed research or the exercise of professional judgment. Neither EYGM Limited nor any other member of the global Ernst & Young organization can accept any responsibility for loss occasioned to any person acting or refraining from action as a result of any material in this publication. On any specific matter, reference should be made to the appropriate advisor.

EY zinc and lead commodity briefcase April 2016
Price Chart
Industry Snapshot
Zinc prices improve on supply adjustments: After a continuous decline in 2015, zinc prices rallied in February- March 2016 on an anticipated supply shortage in near term.
Market moves towards deficit: Supply cuts and closure of major mines have led to tightening of supplies in the global zinc market. Miners including Glencore and Nyrstar announced capacity cuts of 500ktpa and 50ktpa. In addition closure of major mines including MMG’s Century mine and Vedanta’s Lisheen mine as they reached end of mine life further cut down the oversupply in the market.
Pipeline shrinkage: New upcoming mine supply may not be sufficient to match demand growth in near term. Only 400kt
of new capacity is committed over the next two years and an additional 900kt over 2018-2020.
Key issues facing the sector The zinc market heads towards deficit as supply is cut Excess supply in the concentrate market has been significantly reduced following supply cuts through the depletion of ore reserves, price-induced production cuts and reduced capital spending. In 2015, about 1.2mt of contained zinc was cut from the zinc market. 1 These supply adjustments widened the supply demand gap, reducing the overall inventory levels and pushing the market towards deficit. Chinese zinc smelters announce output cuts in anticipation of concentrate deficit As a result of the anticipated reduction in concentrate availability, China's major zinc smelters pledged to cut 500,000t of production in 2016, a move aimed at controlling overcapacity. These cuts account for 3.5% of the world's total refined zinc output which is estimated at 14mt in 2016. Although, zinc prices did improve by 10% following this announcement, but, the increase was short-lived.2 However, these smelter cuts will do little to tighten refined zinc supply as the mining supply cuts and resultant concentrate deficit would have eventually led to a cut in refined metal output. Pipeline shrinkage: additional capacity required to replace mine closures A long period of low prices and capex reductions following the global economic downturn has forced zinc majors to defer capex spending, thus leading to current pipeline shrinkage. Only 400kt of new capacity is committed over the next two years and an additional 900kt over 2018-2020.3 A few big projects are in the pipeline, including the Mehdiabad project in Iran, one of the world's largest undeveloped zinc mine, forecast to produce 400ktpa. However, the timing and viability of the operations remains in question. With mine closures and production cuts, the forecast concentrate deficit will arrive earlier than expected. According to International Lead and Zinc Study Group (ILZSG), the zinc market moved into a deficit of 60,000t in 2H 2015 after reporting a surplus of 183,000t during the first half of the year.4 In addition, persistent weakness in zinc prices will impact investment and capital project decisions. 1 “Zinc supply cuts won’t lift prices until 2017,” American metal market, 31 December 2015
2 “China's zinc output cut to provide brief respite for prices,” Mining Weekly, 20 November 2015
3 “New zine mine capacity needed to match demand - ILZSG,” Metal Bulletin, 23 February 2016, via FACTIVA
4 “Zinc market moved into deficit in H2 2015 – ILZSG,” Metal Bulletin, 16 February 2016, via FACTIVA

Contacts Peru Víctor Burga Assurance Services Tel: +51 1 411 4419 [email protected] Marcial García Tax Services Tel: +51 1 411 4424 [email protected] Rafael Huamán Advisory Services Tel: +51 1 411 4443 [email protected] Enrique Oliveros Transactions & Corporate Finance Services Tel: +51 1 411 4417 [email protected] Marco Antonio Zaldívar Risk Management Tel: +51 1 411 4450 [email protected]

EY | Assurance | Tax | Transactions | Advisory About EY EY is the global leader in assurance, tax, transaction and advisory services. The insights and quality services we deliver help to build trust and confidence in the capital markets and in economies the world over. We develop outstanding leaders who team to deliver on our promises to all of our stakeholders. In so doing, we play a critical role in building a better working world for our people, for our clients and for our communities. For more information about our organization, please visit ey.com/pe © 2016 EY All Rights Reserved.


