Mining Significant Associations in Large Scale Text Corpora Prabhakar Raghavan Verity Inc. [email protected]Panayiotis Tsaparas Department of Computer Science University of Toronto [email protected]Abstract Mining large-scale text corpora is an essential step in ex- tracting the key themes in a corpus. We motivate a quanti- tative measure for significant associations through the dis- tributions of pairs and triplets of co-occurring words. We consider the algorithmic problem of efficiently enumerat- ing such significant associations and present pruning algo- rithms for these problems, with theoretical as well as empir- ical analyses. Our algorithms make use of two novel mining methods: (1) matrix mining, and (2) shortened documents. We present evidence from a diverse set of documents thatour measure does in fact elicit interesting co-occurrences. 1 Overview In this paper we (1) motivate and formulate a fundamen- tal problem in text mining; (2) use empirical results on the statistical distributions of term associations to derive con- crete measures of “interesting associations”; (3) develop fast algorithms for mining such text associations using new prun- ing methods; (4) analyze these algorithms, invoking the dis- tributions we observe empirically; and (5) study the perfor- mance of these algorithms experimentally. Motivation: A major goal of text analysis is to extract, group, and organize the concepts that recur in the corpus. Mining significant associations from the corpus is a key step in this process. In the automatic classification of text docu- ments each document is a vector in a high-dimensional “fea- ture space”, with each axis (feature) representing a term in the lexicon. Which terms from the lexicon should be used as features in such classifiers? This “feature selection” problem is the focus of substantial research. The use of significant as- sociations as features can improve the quality of automatic text classification [18]. Clustering significant terms and as- sociations (as opposed to all terms) is shown [8, 14] to yield clusters that are purer in the concepts they yield. This work was conducted while the author was visiting Verity Inc. Text as a domain: Large-scale text corpora are intrinsically different from structured databases. First, it is known [15, 22] that terms in text have skewed distributions. How can we exploit these distributional phenomena? Second, as shown by our experiments, co-occurrences of terms themselves have interesting distributions; how can one exploit these to mine the associations quickly? Third, many statistically sig- nificant text associations are intrinsically uninteresting, be- cause they mirror well-known syntactic rules (e.g., the fre- quent co-occurrence of the words “of” and “the”); one of our contributions is to distill relatively significant associations. 2 Background and contributions 2.1 Related previous work Database mining: Mining association rules in databases was studied by Agrawal et al. [1, 2]. These papers intro- duced the support/confidence framework as well as the a pri- ori pruning paradigm that is the basis of many subsequent mining algorithms. Since then it has been applied to a num- ber of different settings, such as mining of sequential pat- terns and events. Brin, Motwani and Silverstein [6] gen- eralize the a priori framework by establishing and exploit- ing closure properties for the statistic. We show in Sec- tion 3.2 that the test does not work well for our domain. Brin et al. [5] extend the basic association paradigm in two ways: they provide performance improvements based on a new method of enumerating large itemsets and additionally propose the notion of implication rules as an alternative to association rules, introducing the notion of conviction. Ba- yardo et al. [4] and Webb [20] propose branch and bound algorithms for searching the space of possible associations. Their algorithms apply pruning rules that do not rely solely on support (as in the case of a priori algorithms). Cohen et al. [7] propose an algorithm for fast mining of associations with high confidence without support pruning. In the case of text data, their algorithm favors pairs of low support. Fur- thermore, it is not clear how to extend it to associations of more than two terms.
Transcript
Mining Significant Associations in Large Scale Text Corpora
Mining large-scale text corpora is an essential step in ex-tracting the key themes in a corpus. We motivate a quanti-tative measure for significant associations through the dis-tributions of pairs and triplets of co-occurring words. Weconsider the algorithmic problem of efficiently enumerat-ing such significant associations and present pruning algo-rithms for these problems, with theoretical as well as empir-ical analyses. Our algorithms make use of two novel miningmethods: (1) matrix mining, and (2) shortened documents.We present evidence from a diverse set of documents that ourmeasure does in fact elicit interesting co-occurrences.
1 Overview
In this paper we (1) motivate and formulate a fundamen-tal problem in text mining; (2) use empirical results on thestatistical distributions of term associations to derive con-crete measures of “interesting associations”; (3) develop fastalgorithmsfor mining such text associations using new prun-ing methods; (4) analyze these algorithms, invoking the dis-tributions we observe empirically; and (5) study the perfor-mance of these algorithms experimentally.
Motivation: A major goal of text analysis is to extract,group, and organize the concepts that recur in the corpus.Mining significant associations from the corpus is a key stepin this process. In the automatic classification of text docu-ments each document is a vector in a high-dimensional “fea-ture space”, with each axis (feature) representing a term inthe lexicon. Which terms from the lexicon should be used asfeatures in such classifiers? This “feature selection” problemis the focus of substantial research. The use of significant as-sociations as features can improve the quality of automatictext classification [18]. Clustering significant terms and as-sociations (as opposed to all terms) is shown [8, 14] to yieldclusters that are purer in the concepts they yield.�This work was conducted while the author was visiting Verity Inc.
Text as a domain: Large-scale text corpora are intrinsicallydifferent from structured databases. First, it is known [15,22] that terms in text have skewed distributions. How can weexploit these distributional phenomena? Second, as shownby our experiments, co-occurrences of terms themselveshave interesting distributions; how can one exploit these tomine the associations quickly? Third, many statistically sig-nificant text associations are intrinsically uninteresting, be-cause they mirror well-known syntactic rules (e.g., the fre-quent co-occurrence of the words “of” and “the”); one of ourcontributions is to distill relatively significant associations.
2 Background and contributions
2.1 Related previous work
Database mining: Mining association rules in databaseswas studied by Agrawal et al. [1, 2]. These papers intro-duced the support/confidence framework as well as the a pri-ori pruning paradigm that is the basis of many subsequentmining algorithms. Since then it has been applied to a num-ber of different settings, such as mining of sequential pat-terns and events. Brin, Motwani and Silverstein [6] gen-eralize the a priori framework by establishing and exploit-ing closure properties for the ��� statistic. We show in Sec-tion 3.2 that the ��� test does not work well for our domain.Brin et al. [5] extend the basic association paradigm in twoways: they provide performance improvements based on anew method of enumerating large itemsets and additionallypropose the notion of implication rules as an alternative toassociation rules, introducing the notion of conviction. Ba-yardo et al. [4] and Webb [20] propose branch and boundalgorithms for searching the space of possible associations.Their algorithms apply pruning rules that do not rely solelyon support (as in the case of a priori algorithms). Cohen etal. [7] propose an algorithm for fast mining of associationswith high confidence without support pruning. In the case oftext data, their algorithm favors pairs of low support. Fur-thermore, it is not clear how to extend it to associations ofmore than two terms.
Extending database mining: Ahonen et al. [3] build on theparadigm of episode mining (see [16] and references therein)to define a text sequence mining problem. Where we de-velop a new measure that directly mines semantically usefulassociations, their approach is to first use a “generic” episodemining algorithm (from [16]) then post-filter to eliminateuninteresting associations. They do not report any perfor-mance/scaling figures (their reported experiments are on 14documents), which is an area we emphasize. Their work isinspired by the similar work of Lent et al. [13]. Feldman etal. describe the KDT system [10, 12] and Document Ex-plorer [11]. Their approach, however, requires prior label-ing (through some combination of manual and automatedmethods) using keywords from a given ontology, and can-not directly be used on general text. DuMouchel and Predi-gibon [9] propose a statistically motivated metric, and ap-ply empirical Bayes methodology for mining associations intext. Their work has similar motivation to ours. The authorsdo not report on efficiency and scalability issues.
Statistical natural language processing: The problem offinding associations between words (often referred to as col-locations) has been studied extensively in the field of Statis-tical Natural Language Processing (SNLP) [17]. We brieflyreview some of this literature here, but expand in Section 3.1on why these measures fail to address our needs.
Frequency is often used as a measure of interestingness,together with a part-of-speech filter to discard syntactic col-locations like “of the”. Another standard practice is to ap-ply some statistical test that, given a pair of words, evalu-ates the null hypothesis that this pair is generated by pickingtwo words independently at random. The interestingness ofthe pair is measured by the deviation from the null hypoth-esis. The � test and the ��� test are statistical tests frequentlyused in SNLP. There is a qualitative difference between col-locations and the associations that we are interested in. Col-locations include patterns of words that tend to appear to-gether (e.g. phrasal verbs – “make up”, or common expres-sions like “strong tea”), while we are mostly interested in as-sociations that convey some latent concept (e.g. “chaptersindigo” – this pertains to the recent acquisition of Chapters,then Canada’s largest bookstore, by the Indigo corporation).
2.2 Main contributions and guided tour
1. We develop a notion of semantic as opposed to syntac-tic text associations, together with a statistical measurethat mines such associations (Section 3.3). We pointout that simple statistical frequency measures such asthe � � test and mutual information (as well as variants)will not suffice (Section 3.2).
2. Our measure for associations lacks the monotonicityand closure properties exploited by prior work in as-sociation mining. We therefore require novel pruning
techniques to achieve scalable mining. To this end wepropose two new techniques: (i) matrix mining (Sec-tion 4.2) and (ii) shortened documents (Section 4.3).
3. We analyze the pruning resulting from these tech-niques. A novel aspect of this analysis: to our knowl-edge, it is the first time that the Zipfian distribution ofterms and pairs is used in the analysis of mining algo-rithms. We combine these pruning techniques into twoalgorithms (Section 4 and Theorem 1).
4. We give results of experiments on three test corpora forthe pruning achieved in practice. These results suggestthat the pruning is more efficient than our (conserva-tive) analytical prediction and that our methods shouldscale well to larger corpora (Section 4.4).
We report results on three test corpora taken from newsagencies: the CBC corpus, the CNN corpus and the Reuterscorpus. More statistics on the corpora are given in Sec-tion 4.4.
3 Statistical basis for associations
In this section we develop our measure for significant as-sociations. We begin (Section 3.1) by discussing qualita-tively the desiderata for significant text associations. Next,we give a detailed study of pair occurrences in our test cor-pora (Section 3.2). Finally, we bring these ideas together inSection 3.3 to present our new measure for interesting asso-ciations.
3.1 Desiderata for significant text associations
We first experimented with naive support measures suchas document pair frequency, sentence pair frequency and theproduct of the individual sentence term frequencies. Weomit the detailed results here due to space constraints. As ex-pected, the highest ranking associations are mostly syntacticones, such as (of,the) and (in,the), conveying little informa-tion about the dominant concepts. Furthermore, it is clearthat the document level is too granular to mine useful asso-ciations – two terms could co-occur in many documents fortemplate (rather than semantic) reasons; for example, asso-ciations such as (business, weather), and (corporate, enter-tainment) in the CBC corpus.
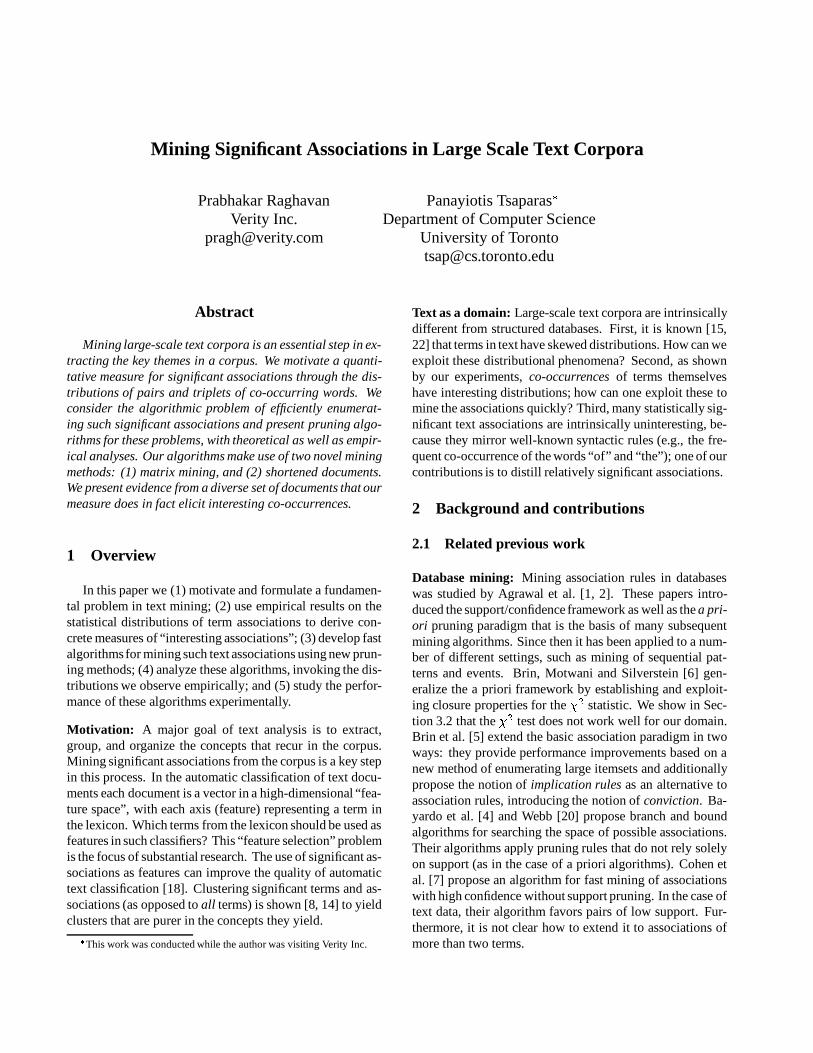
We also experimented with well known measures fromSNLP such as the � � test and mutual information as well asthe conviction measure, a variation of the well known con-fidence measure defined in [6]. We modified the measureslightly so that it is symmetric. Table 1 shows the top asso-ciations for the CNN corpus for these measures. The num-ber next to each pair indicates the number of sentences in
rank � � conviction mutual information weighted MI1 afghani libyan :2 afghani libyan :2 allowances child-care :1 of the :400732 antillian escudo :2 antillian escudo :2 alanis morissette :1 the to :415043 algerian angolan :2 algerian angolan :2 americanas marisa :1 in the :347504 allowances child-care :1 allowances child-care :1 charming long-stem :1 click here :135945 alanis morissette :1 alanis morissette :1 cane stalks :1 and the :303976 arterial vascular :2 arterial vascular :2 hk$116.50 hk$53.50 :1 a the :320887 americanas marisa :1 americanas marisa :1 ill.,-based pyrex :1 a to :282118 balboa rouble :2 balboa rouble :2 boston.it grmn :1 call market :110619 bolivian lesotho :2 bolivian lesotho :2 barbed inventive :1 latest news :1174010 birr nicaraguana :2 birr nicaraguan :2 160kpns telias :1 a of :23362
Table 1. Top associations from the CNN corpus under different measures.
which this pair appears. Although these measures avoid syn-tactic associations, they emphasize on pairs of words withvery low sentence frequency. If two words � and � appearonly a few times but they always appear in the same sen-tence, then the pair � ������� scores highly for all of these mea-sures, since it deviates significantly from the independenceassumption. This is especially true for the mutual informa-tion measure [17]. We also experimented with a weightedversion of the mutual information measure [17], where weweight the mutual information of a pair by the sentence fre-quency of the pair. However, in this case the weight of thesentence pair frequency dominates the measure. As a result,the highly ranked associations are syntactic ones.
It appears that any statistical test that compares againstthe independence hypothesis (such as the ��� test, the � test,or mutual information) falls prey of the same problem: it fa-vors associations of low support. One might try to addressthis problem by applying a pruning step before computingthe various measures: eliminate all pairs that have sentencepair frequency below a predefined threshold. However, thisapproach just masks the problem. The support threshold di-rectly determines the pairs that will be ranked higher.
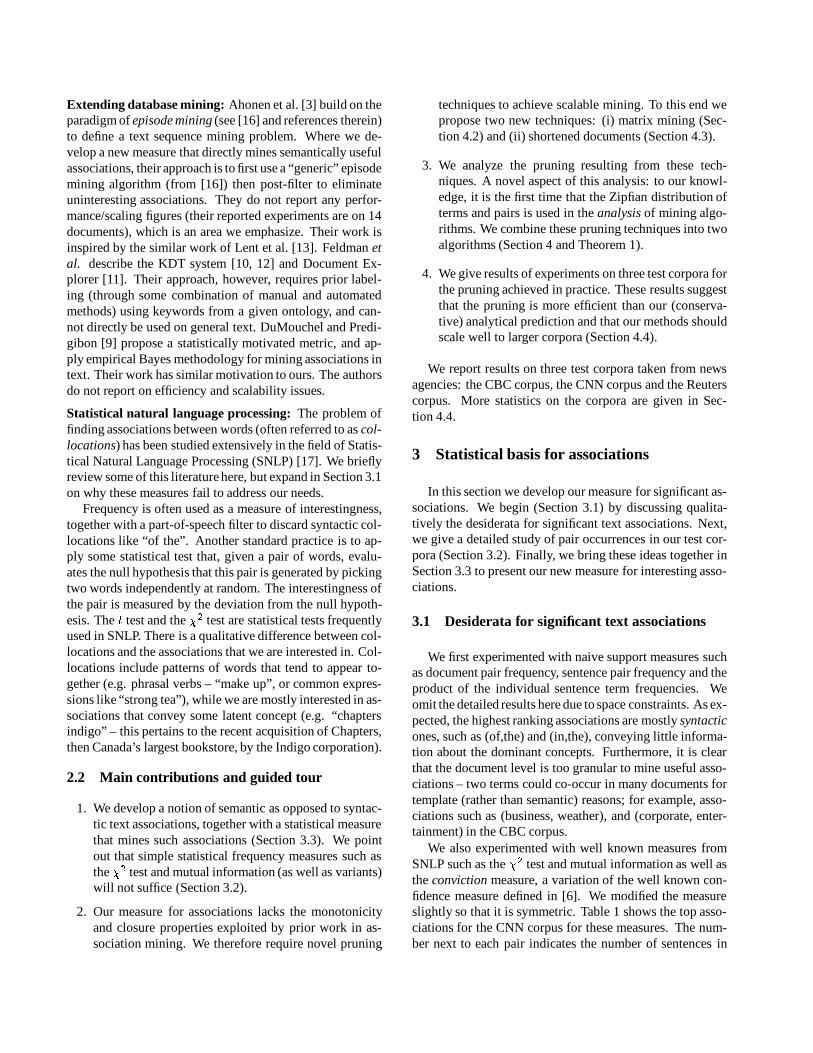
3.2 Statistics of term and pair occurrences
We made three measurements for each of our corpora: thedistributions of corpus term frequencies (the fraction of allwords in the corpus that are term � ), sentence term frequen-cies (fraction of sentences containing term � ) and documentterm frequencies (fraction of documents containing term � ).We also computed the distribution of the sentence pair fre-quencies (fraction of sentences that contain a pair of terms).We observed that the Zipfian distribution essentially holds,not only for corpus frequencies but also for document andsentence frequencies, as well as for sentence pair frequen-cies. Figure 1 presents the sentence term frequencies andthe sentence pair frequencies for the CNN corpus. We usethese observations for the analysis of the pruning algorithmsin Section 4. The plots for the other test corpora are essen-tially the same as those for CNN.
-14
-12
-10
-8
-6
-4
-2
1 2 3 4 5 6 7 8 9 10 11
log
sf
log rank
log sf
-14
-13
-12
-11
-10
-9
-8
-7
-6
-5
-4
4 6 8 10 12 14 16
log
spf
log rank
spf
(a) Sentence Term Frequencies (b) Sentence Pair Frequencies
Figure 1. Statistics for the CNN corpus
3.3 The new measure
Intuitivelywe seek pairs of terms that co-occur frequentlyin sentences, while eliminating pairs resulting from very fre-quent terms. This bears a strong analogy to the concept ofweighting term frequencies by inverse document frequency( � � ) in text indexing.
Notation: Given a corpus of documents � , let ��� denotethe number of documents in � , let ��� denote the number ofsentences in � and let ��� denote the the number of distinctterms in � . For a set of terms ����� ����� � � ��������� � ��� , for �! "
, let # �%$ �&�'� � � �����&� � �'( denote the number of documents in �that contain all terms in � and let #)� $ �&��� � � �������*� � �%( denotethe number of sentences in � that contain all terms in � . Wedefine the document frequency of � as � $ � � � � � ��������� � � (+�#,� $ � � � � � ������� � � (.-��/� , and the sentence frequency of the set� as 0�� $ � � � � � ��������� � � (1�2# � $ � � � � � ��������� � � ( -�� � . If �3�4, we will sometimes use �56� and 075'� to denote the doc-
ument and sentence pair frequencies. For a single term � ,we define the inverse document frequency of � , � � $ �*(��8:9�; $ � � -�# �%$ �*( ( and the inverse sentence frequency <0<� $ �*(=�8:9�; $ �/��-%#,� $ �*(.( . In typical applications the base of the loga-rithm is immaterial since it is the relative values of the � �that matter. The particular formula for �.� owes its intuitivejustification to the underlying Zipf distribution on terms; thereader is referred to [17, 21] for details.
Based on the preceding observations, the following idea
rank ��������������� �� ��������������������� �������������� �� ������������������� ������ ��1 deutsche telekom click here danmark espaol conde nast2 hong kong of the espaol svenska mph trains3 chevron texaco the to danmark svenska allegheny lukens4 department justice in the espaol travelcenter allegheny teledyne5 mci worldcom and the danmark travelcenter newell rubbermaid6 aol warner a the svenska travelcenter hummer winblad
7 aiff wav call market espaol norge hauspie lernout8 goldman sachs latest news danmark norge bethlehem lukens9 lynch merrill a to norge svenska globalstar loral10 cents share a of norge travelcenter donuts dunkin
Table 2. Top associations for variants of our measure for the CNN corpus.
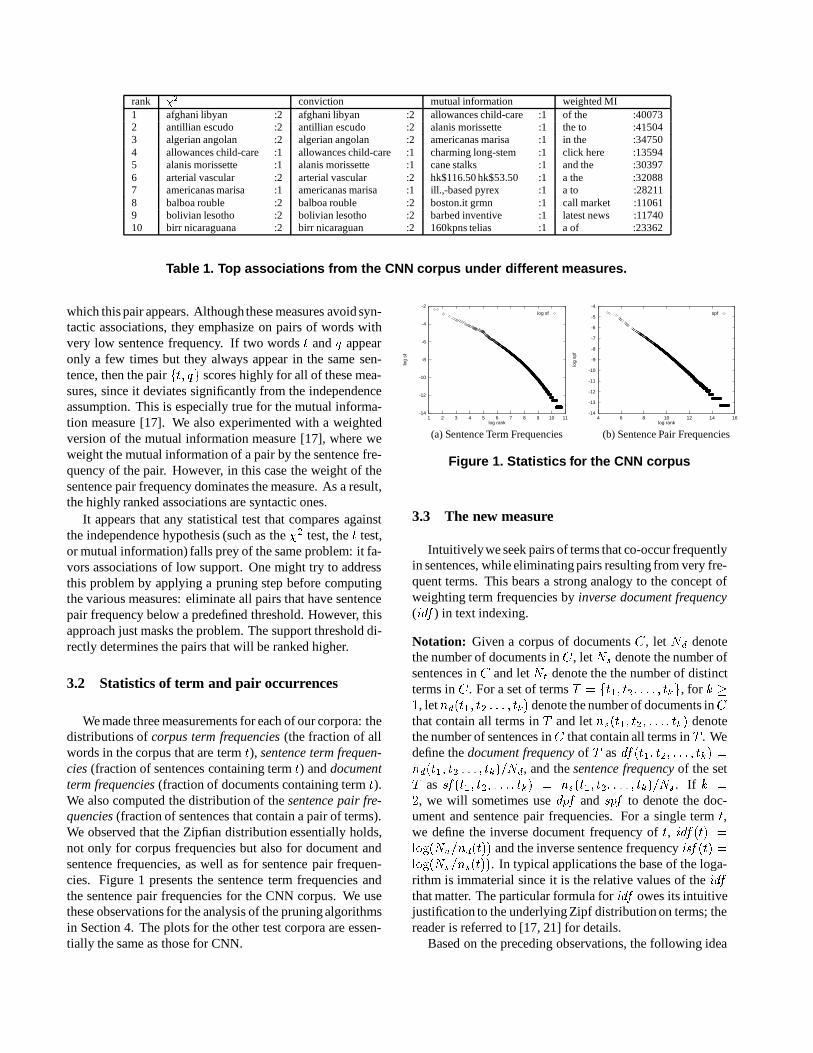
suggests itself: weight the frequency of a pair by the (prod-uct of the) � � ’s of the constituent terms. The generalizationbeyond pairs to � -tuples is obvious. We state below the for-mal definition of our new measure for arbitrary � .
Definition 1 For terms � � � � � �������*� � � , the measure for theassociation � � � � � � ��������� � � � is
Variants of the measure: We experimented with severalvariants of our measure and settled on using � � rather than:0�� , and 075'� rather than 5'� . Table 2 gives a brief summaryfrom the CNN corpus to give the reader a qualitative idea.Replacing �.� with <0<� introduces more syntactical associa-tions. This is due to the fact that the sentence frequency ofwords like “the” and “of” is lower than their document fre-quency, so the impact of the <0<� as a dampening factor is re-duced. This allows the sentence frequency to take over. Asimilar phenomenon occurs when we replace 0 56� with 5'� .The impact of 5'� is too strong, causing uninteresting asso-ciations to appear. We also experimented with
8:9%; $ 0756� ( , anidea that we plan to investigate further in the future.
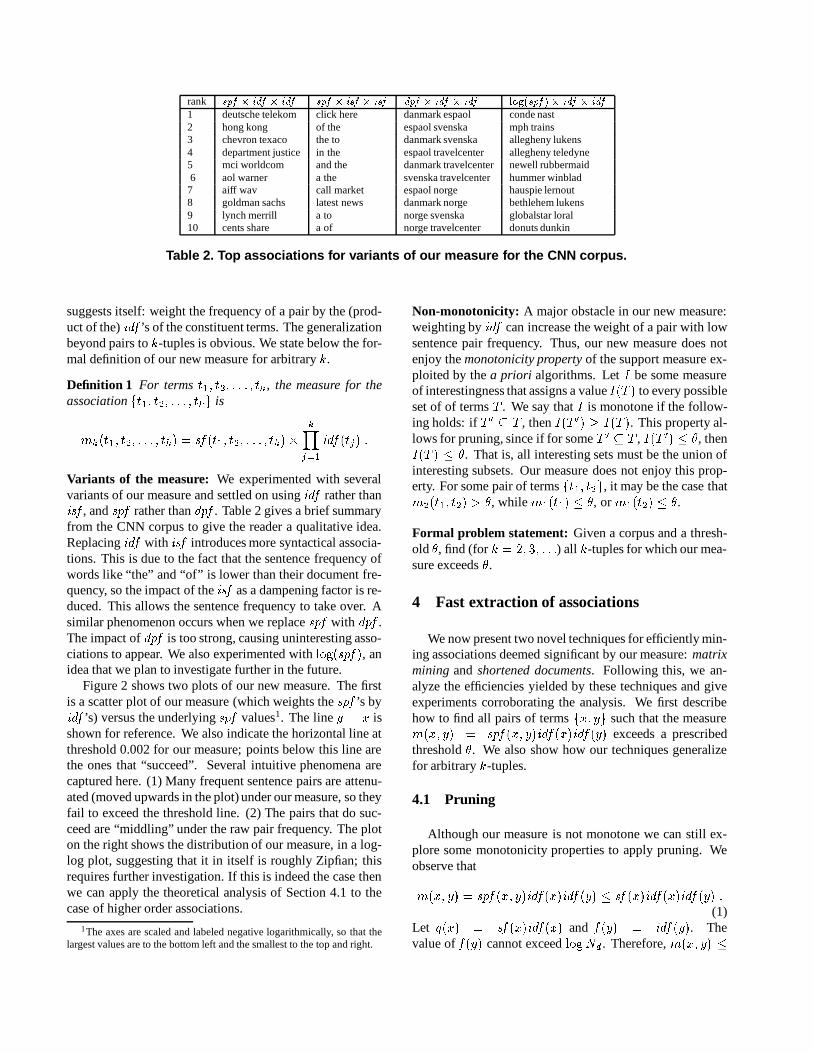
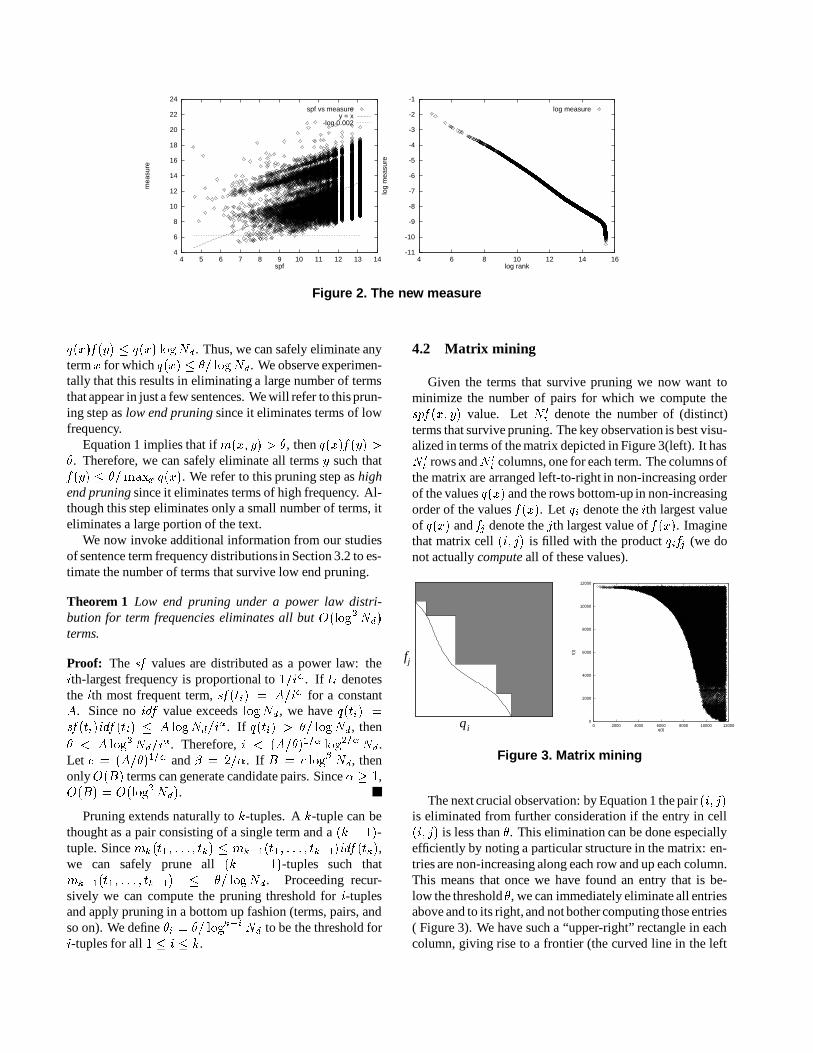
Figure 2 shows two plots of our new measure. The firstis a scatter plot of our measure (which weights the 0 56� ’s by� � ’s) versus the underlying 0756� values1. The line % �'& isshown for reference. We also indicate the horizontal line atthreshold 0.002 for our measure; points below this line arethe ones that “succeed”. Several intuitive phenomena arecaptured here. (1) Many frequent sentence pairs are attenu-ated (moved upwards in the plot) under our measure, so theyfail to exceed the threshold line. (2) The pairs that do suc-ceed are “middling” under the raw pair frequency. The ploton the right shows the distribution of our measure, in a log-log plot, suggesting that it in itself is roughly Zipfian; thisrequires further investigation. If this is indeed the case thenwe can apply the theoretical analysis of Section 4.1 to thecase of higher order associations.
1The axes are scaled and labeled negative logarithmically, so that thelargest values are to the bottom left and the smallest to the top and right.
Non-monotonicity: A major obstacle in our new measure:weighting by � � can increase the weight of a pair with lowsentence pair frequency. Thus, our new measure does notenjoy the monotonicity property of the support measure ex-ploited by the a priori algorithms. Let ( be some measureof interestingness that assigns a value ( $ � ( to every possibleset of of terms � . We say that ( is monotone if the follow-ing holds: if �*),+1� , then ( $ �-)�( .( $ � ( . This property al-lows for pruning, since if for some �/)0+ � , ( $ �-)�( 132 , then( $ � (4152 . That is, all interesting sets must be the union ofinteresting subsets. Our measure does not enjoy this prop-erty. For some pair of terms � � � � � � � , it may be the case that�� $ � � � � � (7632 , while � � $ � � ( 182 , or � � $ � � (7132 .
Formal problem statement: Given a corpus and a thresh-old 2 , find (for ��� 4 �:9 ������� ) all � -tuples for which our mea-sure exceeds 2 .
4 Fast extraction of associations
We now present two novel techniques for efficiently min-ing associations deemed significant by our measure: matrixmining and shortened documents. Following this, we an-alyze the efficiencies yielded by these techniques and giveexperiments corroborating the analysis. We first describehow to find all pairs of terms �;&)�:%�� such that the measure� $ & �<%�( � 0756� $ &)�:%%( � � $ & ( � � $ %%( exceeds a prescribedthreshold 2 . We also show how our techniques generalizefor arbitrary � -tuples.
4.1 Pruning
Although our measure is not monotone we can still ex-plore some monotonicity properties to apply pruning. Weobserve that
� $ & (�� $ %%(*1 � $ & ( 8 9�; � � . Thus, we can safely eliminate anyterm & for which � $ & (71 26- 8:9�; � � . We observe experimen-tally that this results in eliminating a large number of termsthat appear in just a few sentences. We will refer to this prun-ing step as low end pruning since it eliminates terms of lowfrequency.
Equation 1 implies that if � $ &)�:%%(*6 2 , then � $ & ( � $ %%(*62 . Therefore, we can safely eliminate all terms % such that� $ %�(-1326- ������� � $ & ( . We refer to this pruning step as highend pruning since it eliminates terms of high frequency. Al-though this step eliminates only a small number of terms, iteliminates a large portion of the text.
We now invoke additional information from our studiesof sentence term frequency distributions in Section 3.2 to es-timate the number of terms that survive low end pruning.
Theorem 1 Low end pruning under a power law distri-bution for term frequencies eliminates all but
� $ 8:9%; � �/�6(terms.
Proof: The 0�� values are distributed as a power law: theth-largest frequency is proportional to
" - � . If � � denotesthe
th most frequent term, 0�� $ ��� ( ��� - � for a constant
� . Since no � � value exceeds8 9�; � � , we have � $ � � (1�
Pruning extends naturally to � -tuples. A � -tuple can bethought as a pair consisting of a single term and a $ ��� " ( -tuple. Since � � $ �&�6������� � � �%(-1 � ��� � $ �&�6�������*� � � �)� (&�.� $ � �%( ,we can safely prune all $ �!� " ( -tuples such that� � �)� $ �&�'��������� � � �)� ( 1 26- 8:9%; � � . Proceeding recur-sively we can compute the pruning threshold for
-tuples
and apply pruning in a bottom up fashion (terms, pairs, andso on). We define 2"� �.26- 8 9�; ��� � �/� to be the threshold for-tuples for all
" 1 11� .
4.2 Matrix mining
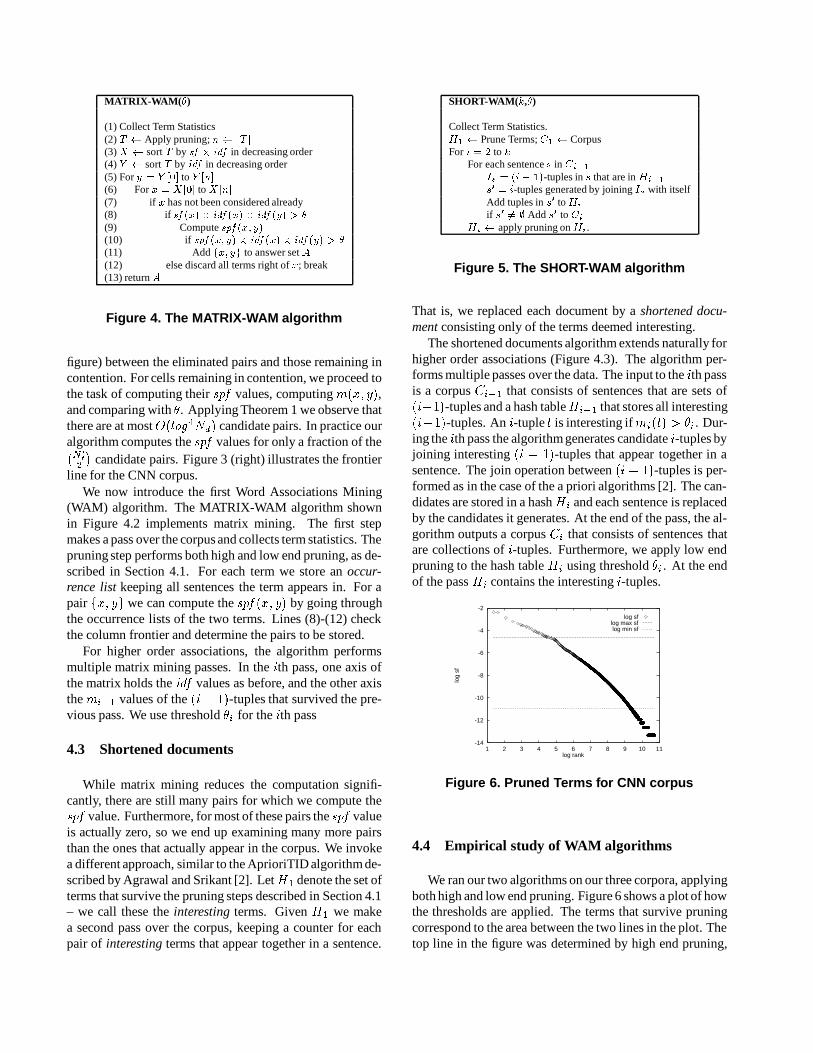
Given the terms that survive pruning we now want tominimize the number of pairs for which we compute the0756� $ & �:%%( value. Let � )� denote the number of (distinct)terms that survive pruning. The key observation is best visu-alized in terms of the matrix depicted in Figure 3(left). It has� )� rows and � )� columns, one for each term. The columns ofthe matrix are arranged left-to-right in non-increasing orderof the values � $ & ( and the rows bottom-up in non-increasingorder of the values � $ & ( . Let �#� denote the
th largest value
of � $ & ( and � " denote the $ th largest value of � $ & ( . Imaginethat matrix cell $ ��$ ( is filled with the product �%� � " (we donot actually compute all of these values).
qi
fj
0
2000
4000
6000
8000
10000
12000
0 2000 4000 6000 8000 10000 12000
f(t)
q(t)
"CNN_frontierArea.sm"
Figure 3. Matrix mining
The next crucial observation: by Equation 1 the pair $ ��$ (is eliminated from further consideration if the entry in cell$ ��$%( is less than 2 . This elimination can be done especiallyefficiently by noting a particular structure in the matrix: en-tries are non-increasing along each row and up each column.This means that once we have found an entry that is be-low the threshold 2 , we can immediately eliminate all entriesabove and to its right, and not bother computing those entries( Figure 3). We have such a “upper-right” rectangle in eachcolumn, giving rise to a frontier (the curved line in the left
MATRIX-WAM( � )(1) Collect Term Statistics(2) ��� Apply pruning; ����� ���(3) � sort � by ��������� in decreasing order(4) ��� sort � by � �� in decreasing order(5) For ������ ��� to ��� ���(6) For ������ ��� to �� ���(7) if � has not been considered already(8) if ��� ����������� �����0����� �� ��! ��(9) Compute ����� ���#"$ ��(10) if ����� ���#"$ ��0��� �� ����� ��� �� �� ��% ��(11) Add &��#"$ (' to answer set )(12) else discard all terms right of � ; break(13) return )Figure 4. The MATRIX-WAM algorithm
figure) between the eliminated pairs and those remaining incontention. For cells remaining in contention, we proceed tothe task of computing their 075'� values, computing � $ & �<%�( ,and comparing with 2 . Applying Theorem 1 we observe thatthere are at most
� $$*,+.-#/ � � ( candidate pairs. In practice ouralgorithm computes the 075'� values for only a fraction of the021�34�65 candidate pairs. Figure 3 (right) illustrates the frontier
line for the CNN corpus.We now introduce the first Word Associations Mining
(WAM) algorithm. The MATRIX-WAM algorithm shownin Figure 4.2 implements matrix mining. The first stepmakes a pass over the corpus and collects term statistics. Thepruning step performs both high and low end pruning, as de-scribed in Section 4.1. For each term we store an occur-rence list keeping all sentences the term appears in. For apair �;&)�:%�� we can compute the 075'� $ & �:%%( by going throughthe occurrence lists of the two terms. Lines (8)-(12) checkthe column frontier and determine the pairs to be stored.
For higher order associations, the algorithm performsmultiple matrix mining passes. In the
th pass, one axis of
the matrix holds the � � values as before, and the other axisthe � � � � values of the $ � " ( -tuples that survived the pre-vious pass. We use threshold 2%� for the
th pass
4.3 Shortened documents
While matrix mining reduces the computation signifi-cantly, there are still many pairs for which we compute the0 56� value. Furthermore, for most of these pairs the 075'� valueis actually zero, so we end up examining many more pairsthan the ones that actually appear in the corpus. We invokea different approach, similar to the AprioriTID algorithm de-scribed by Agrawal and Srikant [2]. Let 7 � denote the set ofterms that survive the pruning steps described in Section 4.1– we call these the interesting terms. Given 7 � we makea second pass over the corpus, keeping a counter for eachpair of interesting terms that appear together in a sentence.
SHORT-WAM( 8 , � )Collect Term Statistics.9;: � Prune Terms; < : � CorpusFor =#�?> to 8
For each sentence @ in <%A�B :CED � ��=GF�H:� -tuples in @ that are in9 A�B :@JI#��= -tuples generated by joiningCKD
with itselfAdd tuples in @ I to
9 Aif @ IML��N Add @ I to <%A9 AO� apply pruning on
9 A .Figure 5. The SHORT-WAM algorithm
That is, we replaced each document by a shortened docu-ment consisting only of the terms deemed interesting.
The shortened documents algorithm extends naturally forhigher order associations (Figure 4.3). The algorithm per-forms multiple passes over the data. The input to the
th pass
is a corpus � � �)� that consists of sentences that are sets of$ � " ( -tuples and a hash table 7 � � � that stores all interesting$ � " ( -tuples. An
-tuple � is interesting if � �&$ �*( 682 � . Dur-
ing theth pass the algorithm generates candidate
-tuples by
joining interesting $ � " ( -tuples that appear together in asentence. The join operation between $ � " ( -tuples is per-formed as in the case of the a priori algorithms [2]. The can-didates are stored in a hash 7 � and each sentence is replacedby the candidates it generates. At the end of the pass, the al-gorithm outputs a corpus � � that consists of sentences thatare collections of
-tuples. Furthermore, we apply low end
pruning to the hash table 7 � using threshold 2 � . At the endof the pass 7 � contains the interesting
-tuples.
-14
-12
-10
-8
-6
-4
-2
1 2 3 4 5 6 7 8 9 10 11
log
sf
log rank
log sflog max sflog min sf
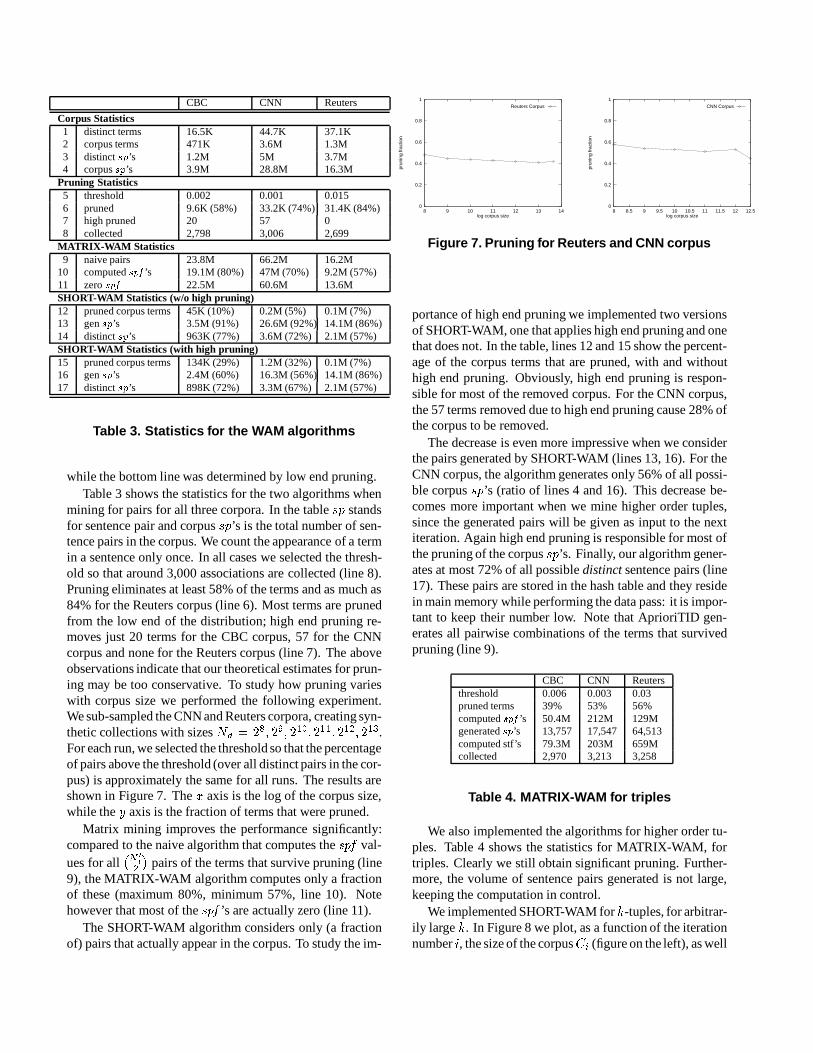
Figure 6. Pruned Terms for CNN corpus
4.4 Empirical study of WAM algorithms
We ran our two algorithms on our three corpora, applyingboth high and low end pruning. Figure 6 shows a plot of howthe thresholds are applied. The terms that survive pruningcorrespond to the area between the two lines in the plot. Thetop line in the figure was determined by high end pruning,
CBC CNN Reuters
Corpus Statistics1 distinct terms 16.5K 44.7K 37.1K2 corpus terms 471K 3.6M 1.3M3 distinct @�� ’s 1.2M 5M 3.7M4 corpus @�� ’s 3.9M 28.8M 16.3M
while the bottom line was determined by low end pruning.Table 3 shows the statistics for the two algorithms when
mining for pairs for all three corpora. In the table ��� standsfor sentence pair and corpus ��� ’s is the total number of sen-tence pairs in the corpus. We count the appearance of a termin a sentence only once. In all cases we selected the thresh-old so that around 3,000 associations are collected (line 8).Pruning eliminates at least 58% of the terms and as much as84% for the Reuters corpus (line 6). Most terms are prunedfrom the low end of the distribution; high end pruning re-moves just 20 terms for the CBC corpus, 57 for the CNNcorpus and none for the Reuters corpus (line 7). The aboveobservations indicate that our theoretical estimates for prun-ing may be too conservative. To study how pruning varieswith corpus size we performed the following experiment.We sub-sampled the CNN and Reuters corpora, creating syn-thetic collections with sizes � � � 4�� � 4� � 4 �� � 4 ��� � 4 � � � 4 � � .For each run, we selected the threshold so that the percentageof pairs above the threshold (over all distinct pairs in the cor-pus) is approximately the same for all runs. The results areshown in Figure 7. The & axis is the log of the corpus size,while the % axis is the fraction of terms that were pruned.
Matrix mining improves the performance significantly:compared to the naive algorithm that computes the 0 56� val-ues for all
0 1 34�65 pairs of the terms that survive pruning (line
9), the MATRIX-WAM algorithm computes only a fractionof these (maximum 80%, minimum 57%, line 10). Notehowever that most of the 075'� ’s are actually zero (line 11).
The SHORT-WAM algorithm considers only (a fractionof) pairs that actually appear in the corpus. To study the im-
0
0.2
0.4
0.6
0.8
1
8 9 10 11 12 13 14
prun
ing
frac
tion
log corpus size
Reuters Corpus
0
0.2
0.4
0.6
0.8
1
8 8.5 9 9.5 10 10.5 11 11.5 12 12.5
prun
ing
frac
tion
log corpus size
CNN Corpus
Figure 7. Pruning for Reuters and CNN corpus
portance of high end pruning we implemented two versionsof SHORT-WAM, one that applies high end pruning and onethat does not. In the table, lines 12 and 15 show the percent-age of the corpus terms that are pruned, with and withouthigh end pruning. Obviously, high end pruning is respon-sible for most of the removed corpus. For the CNN corpus,the 57 terms removed due to high end pruning cause 28% ofthe corpus to be removed.
The decrease is even more impressive when we considerthe pairs generated by SHORT-WAM (lines 13, 16). For theCNN corpus, the algorithm generates only 56% of all possi-ble corpus ��� ’s (ratio of lines 4 and 16). This decrease be-comes more important when we mine higher order tuples,since the generated pairs will be given as input to the nextiteration. Again high end pruning is responsible for most ofthe pruning of the corpus ��� ’s. Finally, our algorithm gener-ates at most 72% of all possible distinct sentence pairs (line17). These pairs are stored in the hash table and they residein main memory while performing the data pass: it is impor-tant to keep their number low. Note that AprioriTID gen-erates all pairwise combinations of the terms that survivedpruning (line 9).
We also implemented the algorithms for higher order tu-ples. Table 4 shows the statistics for MATRIX-WAM, fortriples. Clearly we still obtain significant pruning. Further-more, the volume of sentence pairs generated is not large,keeping the computation in control.
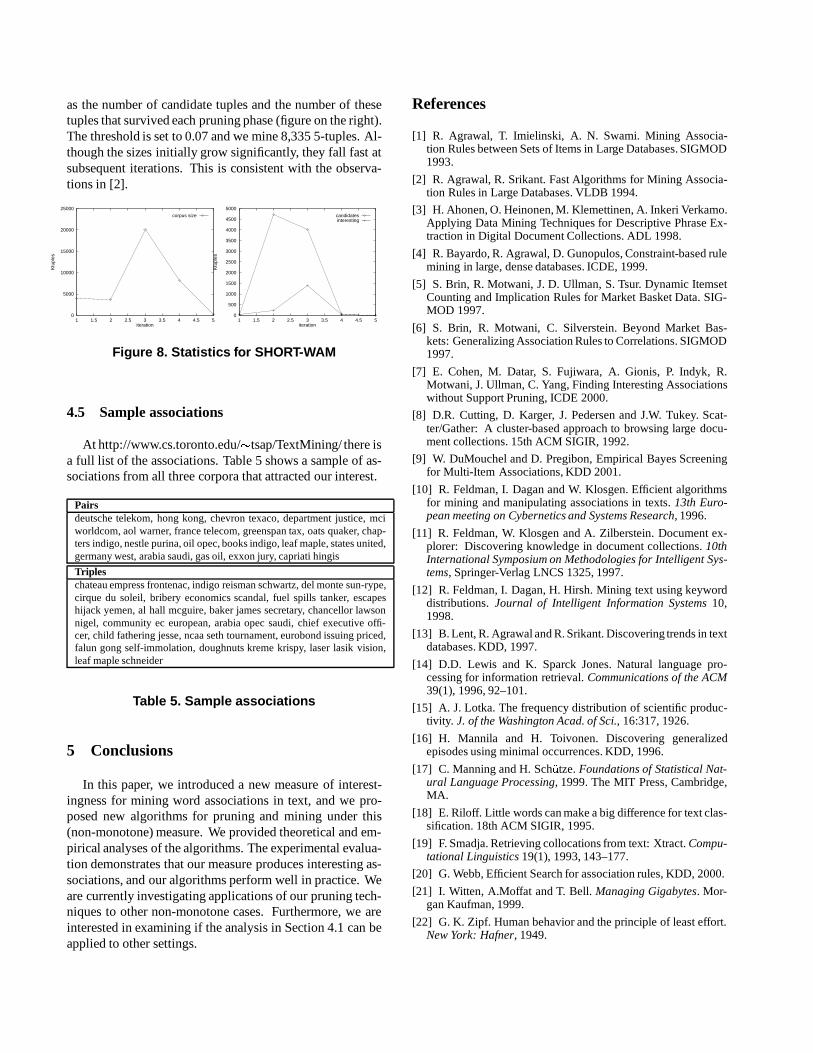
We implemented SHORT-WAM for � -tuples, for arbitrar-ily large � . In Figure 8 we plot, as a function of the iterationnumber
, the size of the corpus � � (figure on the left), as well
as the number of candidate tuples and the number of thesetuples that survived each pruning phase (figure on the right).The threshold is set to 0.07 and we mine 8,335 5-tuples. Al-though the sizes initially grow significantly, they fall fast atsubsequent iterations. This is consistent with the observa-tions in [2].
0
5000
10000
15000
20000
25000
1 1.5 2 2.5 3 3.5 4 4.5 5
Ktu
ples
iteration
corpus size
0
500
1000
1500
2000
2500
3000
3500
4000
4500
5000
1 1.5 2 2.5 3 3.5 4 4.5 5
Ktu
ples
iteration
candidatesinteresting
Figure 8. Statistics for SHORT-WAM
4.5 Sample associations
At http://www.cs.toronto.edu/ � tsap/TextMining/ there isa full list of the associations. Table 5 shows a sample of as-sociations from all three corpora that attracted our interest.
Pairsdeutsche telekom, hong kong, chevron texaco, department justice, mciworldcom, aol warner, france telecom, greenspan tax, oats quaker, chap-ters indigo, nestle purina, oil opec, books indigo, leaf maple, states united,germany west, arabia saudi, gas oil, exxon jury, capriati hingis
Tripleschateau empress frontenac, indigo reisman schwartz, del monte sun-rype,cirque du soleil, bribery economics scandal, fuel spills tanker, escapeshijack yemen, al hall mcguire, baker james secretary, chancellor lawsonnigel, community ec european, arabia opec saudi, chief executive offi-cer, child fathering jesse, ncaa seth tournament, eurobond issuing priced,falun gong self-immolation, doughnuts kreme krispy, laser lasik vision,leaf maple schneider
Table 5. Sample associations
5 Conclusions
In this paper, we introduced a new measure of interest-ingness for mining word associations in text, and we pro-posed new algorithms for pruning and mining under this(non-monotone) measure. We provided theoretical and em-pirical analyses of the algorithms. The experimental evalua-tion demonstrates that our measure produces interesting as-sociations, and our algorithms perform well in practice. Weare currently investigating applications of our pruning tech-niques to other non-monotone cases. Furthermore, we areinterested in examining if the analysis in Section 4.1 can beapplied to other settings.
References
[1] R. Agrawal, T. Imielinski, A. N. Swami. Mining Associa-tion Rules between Sets of Items in Large Databases. SIGMOD1993.
[2] R. Agrawal, R. Srikant. Fast Algorithms for Mining Associa-tion Rules in Large Databases. VLDB 1994.
[3] H. Ahonen, O. Heinonen, M. Klemettinen, A. Inkeri Verkamo.Applying Data Mining Techniques for Descriptive Phrase Ex-traction in Digital Document Collections. ADL 1998.
[4] R. Bayardo, R. Agrawal, D. Gunopulos, Constraint-based rulemining in large, dense databases. ICDE, 1999.
[5] S. Brin, R. Motwani, J. D. Ullman, S. Tsur. Dynamic ItemsetCounting and Implication Rules for Market Basket Data. SIG-MOD 1997.
[6] S. Brin, R. Motwani, C. Silverstein. Beyond Market Bas-kets: Generalizing Association Rules to Correlations. SIGMOD1997.
[7] E. Cohen, M. Datar, S. Fujiwara, A. Gionis, P. Indyk, R.Motwani, J. Ullman, C. Yang, Finding Interesting Associationswithout Support Pruning, ICDE 2000.
[8] D.R. Cutting, D. Karger, J. Pedersen and J.W. Tukey. Scat-ter/Gather: A cluster-based approach to browsing large docu-ment collections. 15th ACM SIGIR, 1992.
[9] W. DuMouchel and D. Pregibon, Empirical Bayes Screeningfor Multi-Item Associations, KDD 2001.
[10] R. Feldman, I. Dagan and W. Klosgen. Efficient algorithmsfor mining and manipulating associations in texts. 13th Euro-pean meeting on Cybernetics and Systems Research, 1996.
[11] R. Feldman, W. Klosgen and A. Zilberstein. Document ex-plorer: Discovering knowledge in document collections. 10thInternational Symposium on Methodologies for Intelligent Sys-tems, Springer-Verlag LNCS 1325, 1997.
[12] R. Feldman, I. Dagan, H. Hirsh. Mining text using keyworddistributions. Journal of Intelligent Information Systems 10,1998.
[13] B. Lent, R. Agrawal and R. Srikant. Discovering trends in textdatabases. KDD, 1997.
[14] D.D. Lewis and K. Sparck Jones. Natural language pro-cessing for information retrieval. Communications of the ACM39(1), 1996, 92–101.
[15] A. J. Lotka. The frequency distribution of scientific produc-tivity. J. of the Washington Acad. of Sci., 16:317, 1926.
[16] H. Mannila and H. Toivonen. Discovering generalizedepisodes using minimal occurrences. KDD, 1996.
[17] C. Manning and H. Sch�� tze. Foundations of Statistical Nat-
ural Language Processing, 1999. The MIT Press, Cambridge,MA.
[18] E. Riloff. Little words can make a big difference for text clas-sification. 18th ACM SIGIR, 1995.
[19] F. Smadja. Retrieving collocations from text: Xtract. Compu-tational Linguistics 19(1), 1993, 143–177.
[20] G. Webb, Efficient Search for association rules, KDD, 2000.
[21] I. Witten, A.Moffat and T. Bell. Managing Gigabytes. Mor-gan Kaufman, 1999.
[22] G. K. Zipf. Human behavior and the principle of least effort.New York: Hafner, 1949.