Journal of Intelligent Information Systems 10, 281–300 (1998) c 1998 Kluwer Academic Publishers. Manufactured in The Netherlands. Mining Text Using Keyword Distributions RONEN FELDMAN [email protected]IDO DAGAN [email protected]Department of Mathematics and Computer Science Department, Bar-Ilan University, Ramat-Gan, ISRAEL HAYM HIRSH [email protected]Deptartment of Computer Science, Rutgers University, Piscataway, NJ USA 08855 Abstract. Knowledge Discovery in Databases (KDD) focuses on the computerized exploration of large amounts of data and on the discovery of interesting patterns within them. While most work on KDD has been concerned with structured databases, there has been little work on handling the huge amount of information that is available only in unstructured textual form. This paper describes the KDT system for Knowledge Discovery in Text, in which documents are labeled by keywords, and knowledge discovery is performed by analyzing the co-occurrence frequencies of the various keywords labeling the documents. We show how this keyword-frequency approach supports a range of KDD operations, providing a suitable foundation for knowledge discovery and exploration for collections of unstructured text. Keywords: data mining, text mining, text categorization, distribution comparison, trend analysis 1. Introduction Traditional databases store large collections of information in the form of structured records, and provide methods for querying the database to obtain all records whose content satisfies the user’s query. More recently, however, researchers in Knowledge Discovery in Databases (KDD) have provided a new family of tools for accessing information in databases (e.g., Anand and Khan, 1993; Brachman et al., 1993; Frawley et al., 1991; Kloesgen, 1992; Kloesgen, 1995b; Ezawa and Norton, 1995). The goal of such work, often called data mining, has been defined as “the nontrivial extraction of implicit, previously unknown, and potentially useful information from given data” (Piatetsky-Shapiro and Frawley, 1991). Work in this area includes applying machine-learning and statistical-analysis techniques towards the automatic discovery of patterns in databases, as well as providing user-guided environments for exploration of data. However, although the goal of KDD work is to provide access to patterns and information in online information collections, most efforts have focused on knowledge discovery in structured databases, despite the tremendous amount of online information that appears only in collections of unstructured text. This paper addresses the problem of Knowledge Discovery from Text, and describes the KDT system, which provides for text the kinds of KDD operations previously provided for structured databases. Our approach is, first, to label documents with keywords taken from a controlled vocabulary that is organized into some meaningful hierarchical structure. Next, the keywords and higher-level entities in the
Transcript
P1: VBI
Journal of Intelligent Information Systems KL568-01-Feldman April 1, 1998 10:50
RONEN FELDMAN [email protected] DAGAN [email protected] of Mathematics and Computer Science Department, Bar-Ilan University, Ramat-Gan, ISRAEL
HAYM HIRSH [email protected] of Computer Science, Rutgers University, Piscataway, NJ USA 08855
Abstract. Knowledge Discovery in Databases (KDD) focuses on the computerized exploration of large amountsof data and on the discovery of interesting patterns within them. While most work on KDD has been concernedwith structured databases, there has been little work on handling the huge amount of information that is availableonly in unstructured textual form. This paper describes the KDT system for Knowledge Discovery in Text, inwhich documents are labeled by keywords, and knowledge discovery is performed by analyzing the co-occurrencefrequencies of the various keywords labeling the documents. We show how this keyword-frequency approachsupports a range of KDD operations, providing a suitable foundation for knowledge discovery and exploration forcollections of unstructured text.
Keywords: data mining, text mining, text categorization, distribution comparison, trend analysis
1. Introduction
Traditional databases store large collections of information in the form of structured records,and provide methods for querying the database to obtain all records whose content satisfiesthe user’s query. More recently, however, researchers inKnowledge Discovery in Databases(KDD) have provided a new family of tools for accessing information in databases (e.g.,Anand and Khan, 1993; Brachman et al., 1993; Frawley et al., 1991; Kloesgen, 1992;Kloesgen, 1995b; Ezawa and Norton, 1995). The goal of such work, often calleddatamining, has been defined as “the nontrivial extraction of implicit, previously unknown,and potentially useful information from given data” (Piatetsky-Shapiro and Frawley, 1991).Work in this area includes applying machine-learning and statistical-analysis techniquestowards the automatic discovery of patterns in databases, as well as providing user-guidedenvironments for exploration of data.
However, although the goal of KDD work is to provide access to patterns and informationin online information collections, most efforts have focused on knowledge discovery instructured databases, despite the tremendous amount of online information that appearsonly in collections of unstructured text. This paper addresses the problem of KnowledgeDiscovery from Text, and describes the KDT system, which provides for text the kinds ofKDD operations previously provided for structured databases. Our approach is, first, tolabel documents with keywords taken from a controlled vocabulary that is organized intosome meaningful hierarchical structure. Next, the keywords and higher-level entities in the
P1: VBI
Journal of Intelligent Information Systems KL568-01-Feldman April 1, 1998 10:50
282 FELDMAN, DAGAN AND HIRSH
hierarchy are used to support a range of KDD operations on the documents, to index intointeresting subcollections, as well as to access and understand the various documents in acollection through keyword co-occurrence frequencies. A key insight in this work is that thefrequency of occurrence of keywords can provide the foundation for a wide range of KDDoperations on collections of textual documents, including analysis tools that allow a user tofind patterns across sets of documents (such as tools for finding sets of documents whosekeyword distributions differ significantly from the full collection, other related collections,or collections from other points in time) and presentation tools that allow a user to viewthe documents and information underlying them in convenient forms (such as tools forbrowsing a collection, viewing sets of underlying patterns in a structured way, or exploringthe documents on which a pattern is based).
The focus of this paper is on analysis and presentation tools based on keyword co-occurrence frequencies. In particular, we do not concern ourselves in this paper with theinitial step of labeling documents with keywords: in many commercial and scientific textcollections and information feeds documents are already labeled with keywords taken froma hierarchy of controlled-vocabulary terms, to assist and augment free-text searching (e.g.,the Dialog service of Knight Ridder Information Inc., the First service of Individual Inc.,and the Medical Subject Heading (MeSH) hierarchy), and further, there is also a large bodyof work on automatically labeling documents with keywords (Lewis, 1992; Jacobs, 1992;Iwayama and Tokunaga, 1994; Apte et al., 1994; Lewis and Catlett, 1994). For example, theReuters data used as a running example through this paper has been labeled with keywordsfrom a controlled vocabulary through a combination of manual and automated methods.The work described in this paper begins with collections already labeled with keywords,showing how to use such keywords as the basis for knowledge discovery and explorationof collections of text.
The general architecture of the KDT system is shown in figure 1. The system takestwo inputs: a collection of keyword-labeled documents, and a hierarchy with keywords asterminal nodes. The keyword hierarchy is a directed acyclic graph (DAG) of terms, whereeach of the terms is identified by a unique name. Figure 2 shows a portion of the keywordhierarchy used in our experiments with the Reuters data. In such a hierarchy, an arc fromA to B denotes that A is a more general term than B (i.e.,countries→G7→ Japan). Weuse a general DAG rather then a tree structure so that a keyword may belong to severalparent nodes (e.g., Germany is under bothEuropean-Communityand G7 in the hierar-chy). Internal nodes in the hierarchy are used in two ways. First, each can be viewed as akeyword itself, labeling a document if any of the terms below it in the hierarchy label thedocument. Thus, for example, a document in the Reuters data may be thought of as beinglabeled by theG7 term if it is labeled with one or more of keywords that appear below theG7node in the keyword hierarchy. In this context internal nodes can be viewed as keywordsthemselves. Second, internal nodes also serve as ways to specify sets of keywords. Forexample, we might be interested in computing the proportion of documents labeled bygold for eachG7 country. Rather than explicitly enumerating theG7 countries, the tokenG7 would be used to specify this set.1 These two uses of internal nodes will usually beclear from context, although we try to identify which is being used when there is risk ofconfusion.
P1: VBI
Journal of Intelligent Information Systems KL568-01-Feldman April 1, 1998 10:50
MINING TEXT 283
Figure 1. KDT system architecture.
Figure 2. KDT display of part of the keyword hierarchy for Reuters data.
P1: VBI
Journal of Intelligent Information Systems KL568-01-Feldman April 1, 1998 10:50
284 FELDMAN, DAGAN AND HIRSH
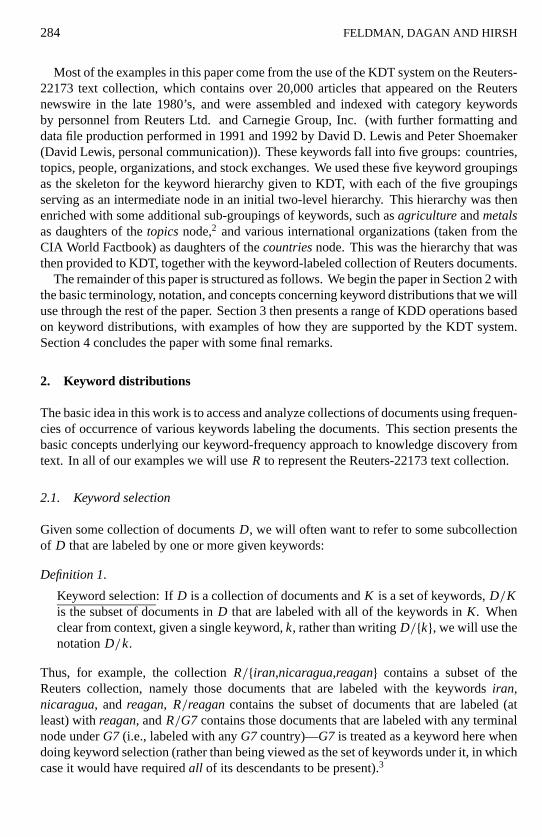
Most of the examples in this paper come from the use of the KDT system on the Reuters-22173 text collection, which contains over 20,000 articles that appeared on the Reutersnewswire in the late 1980’s, and were assembled and indexed with category keywordsby personnel from Reuters Ltd. and Carnegie Group, Inc. (with further formatting anddata file production performed in 1991 and 1992 by David D. Lewis and Peter Shoemaker(David Lewis, personal communication)). These keywords fall into five groups: countries,topics, people, organizations, and stock exchanges. We used these five keyword groupingsas the skeleton for the keyword hierarchy given to KDT, with each of the five groupingsserving as an intermediate node in an initial two-level hierarchy. This hierarchy was thenenriched with some additional sub-groupings of keywords, such asagricultureandmetalsas daughters of thetopicsnode,2 and various international organizations (taken from theCIA World Factbook) as daughters of thecountriesnode. This was the hierarchy that wasthen provided to KDT, together with the keyword-labeled collection of Reuters documents.
The remainder of this paper is structured as follows. We begin the paper in Section 2 withthe basic terminology, notation, and concepts concerning keyword distributions that we willuse through the rest of the paper. Section 3 then presents a range of KDD operations basedon keyword distributions, with examples of how they are supported by the KDT system.Section 4 concludes the paper with some final remarks.
2. Keyword distributions
The basic idea in this work is to access and analyze collections of documents using frequen-cies of occurrence of various keywords labeling the documents. This section presents thebasic concepts underlying our keyword-frequency approach to knowledge discovery fromtext. In all of our examples we will useR to represent the Reuters-22173 text collection.
2.1. Keyword selection
Given some collection of documentsD, we will often want to refer to some subcollectionof D that are labeled by one or more given keywords:
Definition 1.
Keyword selection: If D is a collection of documents andK is a set of keywords,D/Kis the subset of documents inD that are labeled with all of the keywords inK. Whenclear from context, given a single keyword,k, rather than writingD/{k}, we will use thenotationD/k.
Thus, for example, the collectionR/{iran,nicaragua,reagan} contains a subset of theReuters collection, namely those documents that are labeled with the keywordsiran,nicaragua, and reagan, R/reagancontains the subset of documents that are labeled (atleast) withreagan, andR/G7 contains those documents that are labeled with any terminalnode underG7 (i.e., labeled with anyG7 country)—G7 is treated as a keyword here whendoing keyword selection (rather than being viewed as the set of keywords under it, in whichcase it would have requiredall of its descendants to be present).3
P1: VBI
Journal of Intelligent Information Systems KL568-01-Feldman April 1, 1998 10:50
MINING TEXT 285
2.2. Keyword proportions
We will also often want to know what proportion of a set of documents are labeled with aparticular keyword.
Definition 2.
Keyword proportion: If D is a collection of documents andK is a set of keywords,f (D, K ) is the fraction of documents inD that are labeled with all of the keywords inKi.e., f (D, K )= (|D/K |)/(|D|). Given one keyword,k, rather than writingf (D, {k}),we will use the notationf (D, k). WhenD is clear from context, we will drop it andwrite f (k).
Thus, for example,f (R,{iran,nicaragua,reagan}) (which we can write asf ({iran,nicarag-ua,reagan}) since all of our examples concern the Reuters collectionR) is the fractionof documents in the Reuters collection that are labeled withiran, nicaragua, andreagan,f (reagan) is the proportion of the collection labeled with the keyword reagan, andf (G7)is the proportion labeled with anyG7country.
Given these definitions of selection and proportion we can already begin defining usefulquantities for analyzing a set of documents. For example, the proportion of those documentslabeled withK2 that are also labeled byK1 is designated byf (D/K2, K1). This occursoften enough that we give it an explicit name and notation:
Definition 3.
Conditional keyword proportion: If D is a collection of documents andK1 andK2 aresets of keywords,f (D, K1 | K2) is the proportion of all those documents inD that arelabeled withK2 that are also labeled withK1, i.e., f (D, K1 | K2) = f (D/K2, K1).WhenD is clear from context, we will write this asf (K1 | K2).
Thus, for example,f (reagan| iran) is the proportion of all documents that are labeled byiran that are also labeled byreagan.
2.3. Keyword-proportion distributions
The operations supported by the KDT system are based on analyzing the distributionsof keywords within sets of documents. For example, we may be interested in analyzingthe distribution of keywords that denote economical topics—that is, descendants of thetopicsnode in the keyword hierarchy. In particular, we will talk about various forms ofdistributions over sets of keywords. We will usePK (x) to refer to such distributions—itwill assign to any keywordx in K a value between 0 and 1—and we will call thesekeyworddistributions. (Note, however (as will be discussed shortly), wedo notrequire the valuesto add up to 1.) In this subsection and the next we present a number of specific examplesof suchPK (x) distributions that will be used throughout this paper.
P1: VBI
Journal of Intelligent Information Systems KL568-01-Feldman April 1, 1998 10:50
286 FELDMAN, DAGAN AND HIRSH
One particularly important keyword distribution that we will use is a keyword proportiondistribution, which gives the proportion of documents in some collection that are labeledwith each of a number of selected keywords:
Definition 4.
Keyword-proportion distribution: If D is a collection of documents andK is a set ofkeywords,FK (D, x) is the proportion of documents inD that are labeled withx for anyx in K . WhenD is clear from context, we will write this asFK (x).
Note the distinction betweenPK (x) andFK (x). We will use the former to refer genericallyto any function that is a keyword distribution. The latter is a specific keyword distributiondefined by a particular keyword-labeled set of documents. Thus, for exampleFtopics(R, x)would represent the proportions of documents inR that are labeled with keywords under thetopicsnode in the keyword hierarchy. Observe thattopicsis used as shorthand for referring toa set of keywords, namely all those that occur undertopics, rather than explicitly enumeratingthem all. Also, note thatF{k}(D, k) = f (D, k), namelyFK subsumes the earlier-definedfwhen it is applied to a single keyword. However, unlikef , FK is restricted to only refer tothe proportion of occurrences ofindividualkeywords (those occurring in the set K).4 Thusf andF are incomparable.
As mentioned earlier, mathematically speaking,F is not a true frequency distribution,since each document may be labeled by multiple items in the setK . Thus, for example,a given document may be labeled by two (or more)G7 countries, since occurrences ofkeywords are not disjoint events. Thus the sum of values inFG7 may be greater than one.In the worst case, if all keywords inK label all documents, the sum of the values in adistribution F can be as large as|K |. Furthermore, since some documents may containnone of the keywords in a givenK , the sum of frequencies inF might also be smaller thanone—in the worst case, 0 even. Nonetheless, we use the term “distribution” forF , sincemany of the connotations this term suggests still hold here.
Just as was the case for keyword proportions, we can consider conditional keyword-proportion distributions, which will be one of the central keyword distributions that weuse:
Definition 5.
Conditional keyword-proportion distribution: If D is a collection of documents andKandK ′ are sets of keywords,FK (D, x | K ′) is the proportion of those documents inDlabeled with all the keywords inK ′ that are also labeled with keywordx (with x in K ),i.e., FK (D, x | K ′) = FK (D/K ′, x). We will often write this asFK (x | K ′), whenD isclear from context.
Thus, for example,Ftopics(x |Argentina)assigns any keywordx undertopicsin the hierarchywith the proportion of documents labeled byx within the set of all documents labeledby the keywordArgentina, andFtopics(x | {UK,USA}) is the similar distribution for thosedocuments labeled with both theUK andUSAkeywords.
P1: VBI
Journal of Intelligent Information Systems KL568-01-Feldman April 1, 1998 10:50
MINING TEXT 287
2.4. Average keyword distributions
Finally, when we compare distributions, one of the baseline distributions that we con-sider is the average distribution over a set of sibling nodes in the hierarchy. For exam-ple, when looking at the proportions ofloan within South American countries such asf (R, loan|Argentina), f (R, loan|Brazil), and f (R, loan|Columbia), the user may beinterested in the average of all proportions of this form for all the South American countries,that is, the average of all proportions of the formf (R, loan| k), wherek ranges over allSouth American countries.
Definition 6.
Average keyword proportion: Given a collection of documentsD, a keywordk, and aninternal node in the hierarchyn, anaverage keyword proportion, denoted bya(D, k | n),is the average value off (D, k | k′) wherek′ ranges over all immediate children ofn,i.e., a(D, k | n) = Avg{k′ is a child ofn}{ f (D, k | k′)}. WhenD is clear from context, thiswill be writtena(k | n).
For example,a(loan|South America) is the average keyword proportion off (loan| k′)ask′ varies over each child of the nodeSouth Americain the keyword hierarchy, i.e., itis the average conditional keyword proportion forloan within South American countries.Note that this quantity doesnot average the values weighted by the number of documentslabeled by each child ofn. Instead, it represents equally each descendant ofn, and shouldbe viewed as summary of what a typical keyword proportion is for a child ofn.
And, as before, the user may be interested in the distribution of averages for each economictopic within South American countries. This is just another keyword distribution:
Definition 7.
Average keyword distribution: Given a collection of documentsD, and two internalnodes in the hierarchynandn′, anaverage keyword distribution, denoted byAn(D, x | n′)is the distribution that, for anyx that is a child ofn, averagesx’s proportions over allchildren ofn′, i.e., An(D, x | n′) = Avg{k′ is a child ofn′}{Fn(D, x | k′)}. When clear fromcontext, this will be writtenAn(x | n′).
Consider for exampleAtopics(x |South America) (which can be read as “The average dis-tribution of topics within South American countries”). For any topicx this gives its averageproportion within all South-American countries.
2.5. Comparing keyword distributions
In addition to allowing a user to request particular keyword distributions, we would also liketo identify distributions that are likely to be “interesting” for the user in some context. Wequantify the potential degree of “interest” in some piece of information by comparing it toa given “expected” model, which serves as a baseline for the investigated distribution. For
P1: VBI
Journal of Intelligent Information Systems KL568-01-Feldman April 1, 1998 10:50
288 FELDMAN, DAGAN AND HIRSH
example, we may want to compare the data regarding IBM to an averaged model constructedfor a group of computer manufacturers. Alternatively, we may want to compare the dataregarding IBM in the last year to a model constructed from the data regarding IBM inprevious years.
Since we use keyword proportions and distributions to describe the data, we thereforeneed measures for quantifying the distance between an investigated distribution to anotherdistribution that serves as a baseline model. Since our distributions are discrete, we simplyuse sum-of-squares to measure the distance between two models:
D(p′ ‖ p) =∑
x
(p′(x)− p(x))2,
where the target distribution is designated byp and the approximating distribution byp′,and thex in the summation is taken over all objects in the domain. This measure is alwaysnon-negative and is 0 if and only ifp′ = p.
Given this measure, we can now use it as a heuristic device for judging keyword-distributionsimilarities:
Definition 8.
Keyword distribution distance: Given two keyword distributionsP′K (x) andPK (x), thedistanceD(P′K ‖ PK ) between them is defined by:
D(P′K (x) ‖ PK (x)) =∑x∈K
(P′K (x)− PK (x))2.
We will also sometimes be interested in the value of the difference between two distributionsat a particular point:
Definition 9.
Keyword proportion distance: Given two keyword distributionsP′K (x) andPK (x), anda keywordk in K , the distanced(P′K (k) ‖ PK (k)) between them is defined by:
d(P′K (k) ‖ PK (k)) = P′K (k)− PK (k).
Thus another way to stateD(P′K ‖ PK ) is∑
x∈K [d(PK (x) ‖ PK (x))]2. As an example, thedistance between the distribution oftopicswithin Argentinaand the distribution oftopicswithin Brazil would be written asD(Ftopics(x |Argentina) ‖ Ftopics(x |Brazil)), and the dis-tance between the distribution oftopicswithin Argentinaand the average distribution oftop-icswithin South-Americais written asD(Ftopics(x |Argentina)‖Atopics(x |South America)).
3. Mining text using keyword distributions
Given the various concepts and definitions of the previous section concerning keyworddistributions, we can begin considering various knowledge-discovery tasks that they support.
P1: VBI
Journal of Intelligent Information Systems KL568-01-Feldman April 1, 1998 10:50
MINING TEXT 289
Figure 3. Graphical representation of the topic distribution of Argentina.
This section demonstrates a number of knowledge-discovery operations made possible byconsidering keyword distributions, and how they are supported by the KDT system.
3.1. Conditional keyword-proportion distributions
The most basic operation using keyword distributions that the KDT system supports isthe display of conditional keyword-proportion distributions. For example, a user may beinterested in seeing the proportion of documents labeled with each child oftopicsfor allthose documents labeled by the keyword Argentina, i.e., what proportion ofArgentinadocuments are labeled with each topic keyword. This distribution would be designatedby Ftopics(R, x |Argentina), and the graphical display of this distribution that would begenerated by KDT is given in figure 3. The distribution is presented as a bar-chart: 12articles among all articles ofArgentinaare annotated withsorghum, 20 with corn, 32with grain, etc., providing a summary of the areas of economical activity of Argentina, asreflected in the text collection. KDT presents distributions in several forms, graphical (e.g.,pie-chart) or alphanumeric, listing absolute counts or proportions.
Conditional keyword-proportion distributions can also be conditioned onsetsof key-words. Figure 4 shows the result KDT would give for the keyword distributionFtopics(x |{UK,USA})—the distribution of proportions for eachtopicsamongst documents labeledwith both theUK andUSAkeywords. Here the user has chosen to display the distributionin tabular form. The distribution itself is presented in the lower right window of the screen,with the distribution request specified to its left. This form of display also allows a user to
P1: VBI
Journal of Intelligent Information Systems KL568-01-Feldman April 1, 1998 10:50
290 FELDMAN, DAGAN AND HIRSH
Figure 4. Viewing the topic distribution ofUSAand theUK.
access documents based on the displayed distribution—for example, by clicking on any ofthe keywords in the distribution to see the articles that are so labeled. Here, for example,the user chose to click on the 24 documents annotated with trade, which led to the display ofall titles of these documents (those annotated byUK, USA, and trade) in the upper windowof the screen.
In some sense this type of operation can be viewed as a more refined form of traditionalkeyword-based retrieval. Rather than simply requesting all documents labeled by Argentinaor by bothUK andUSA, the user can see the documents at a higher level, by requestingdocuments labeled by Argentina, for example, and first seeing what proportions are labeledby keywords from some secondary set of keywords that are of interest, with the user beingable to access the documents through this more fine-grained grouping of Argentina-labeleddocuments.
3.2. Comparing to average distributions
Consider a conditional proportion of the formFK (D, x | k), the distribution overK of alldocuments labeled with some keywordk (not necessarily inK ). It is natural to expectthat this distribution would be similar to other distributions of this form, over conditioningeventsk′ that are siblings ofk. When they differ substantially it is a sign that the documentslabeled with the conditioning keywordk may be of interest.
KDT supports this kind of comparison of keyword-labeled documents to the average ofthose labeled with the keyword and its siblings. A user can specify two internal nodesof the hierarchy, and compare individual distributions of keywords under one of the nodesconditioned on the keyword set under the other node, i.e., computeD(Fn(x | k) ‖ An(x | n′))for eachk that is a child ofn′.
Figure 5 demonstrates this type of comparison, between the topic distribution of eachG7country and the average distribution of topics for allG7 countries, i.e.,D((Ftopics(x | k) ‖Atopics(x |G7)) for each keywordk that is a child of theG7 node in the hierarchy. In the
P1: VBI
Journal of Intelligent Information Systems KL568-01-Feldman April 1, 1998 10:50
MINING TEXT 291
Figure 5. Comparison of the topic distribution of members of theG7 organization vs. the average topic distri-butions of theG7.
large box in the upper half of the figure countries are sorted in decreasing order of theirdistance to the average distribution (column 2), revealing that USA is the most “atypical”G7 country (with respect to its topic distribution) while Italy is the most typical one. Foreach countryk, the topicsk′ that made the largest contributions to the distance are alsodisplayed (column 3), i.e., they are sorted byd(Ftopics(k′ | k) ‖ Atopics(k′ |G7)). The usercan then click on any class member and get an expanded view of the comparison betweenthe topic distribution of this member and the average distribution. In figure 5, we haveexpanded the topic list of theUK (at the bottom-right listbox), displayingFtopics(x |UK).The first column there shows topic names. The second column shows the contribution ofthe topic to the distance. The third column shows, respectively, the proportion ofUK-labeled documents also labeled with that topic keyword( f (k′ |UK) for each topic) withthe corresponding absolutely number of documents in column four. The final two columnsdisplay the comparable figures for the average distribution(a(k′ |UK)). In addition totheir value in finding possible interesting keyword labelings, comparisons of this type alsoprovide a hierarchical browsing mechanism for keyword co-occurrence distributions. Forexample, an analyst that is interested in studying the topic distribution in articles dealing withG7countries may first browse the average class distribution forG7, using a presentation asin figures 3 and 4. This reveals the major topics that are generally common forG7countries.Then, the presentation of figure 5 could then be used to reveal the major characteristics thatare specific for each country.
P1: VBI
Journal of Intelligent Information Systems KL568-01-Feldman April 1, 1998 10:50
292 FELDMAN, DAGAN AND HIRSH
Figure 6. Country-topic associations.
KDT also allows a user to see this information by listing pairs of conditioning and condi-tioned keywords that contribute significantly to the above distance measure. For example,figure 6 lists (in the box in the upper half of the figure) those country/topic pairs whose termsare largest in their distribution’s distance (they are sorted in decreasing order of their con-tribution to the distance from the topic distribution of the given country to the average topicdistribution of all countries (third column)—i.e., byd(Ftopics(k | k′) ‖ Atopics(k | countries))for each topick and countryk′). The remaining columns display the same information asin the final four columns at the bottom of figure 5. When the line for any pair of keywordsis selected, as is shown in the figure forSouth Koreaandtrade, KDT gives the conditionalkeyword distribution from which it comes (in absolute-frequency form) in the lower-rightpart of the display.
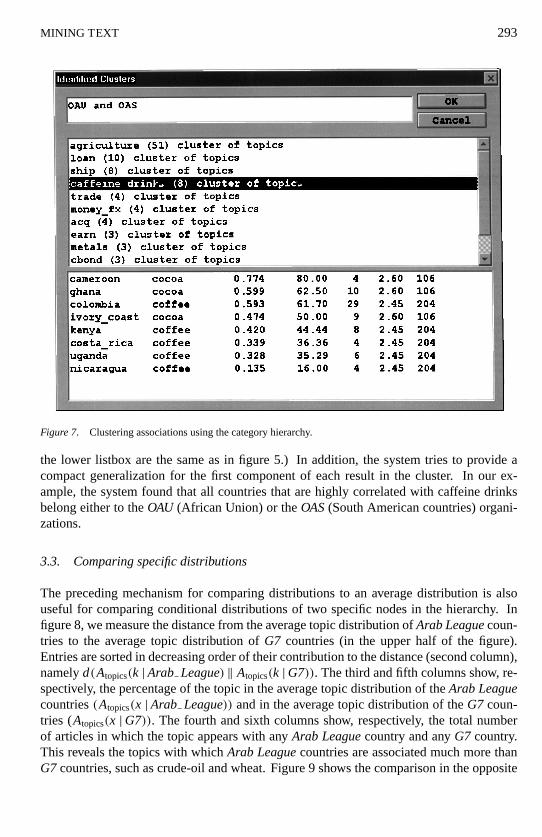
Finally, in many cases KDT can generate a large number such results. To summarizethe information, the system uses the keyword hierarchy to group together results whosesecond component falls under the same node in the hierarchy. Figure 7 shows the clus-ters that were formed by the system when grouping the results of figure 6, along withtheir sizes (in parentheses). For example, in 43 cases the second component was a daugh-ter of the node agriculture. The user can examine any cluster and see the specific itemsthat it contains (lower listbox, for the selected cluster caffeine-drinks). (The columns of
P1: VBI
Journal of Intelligent Information Systems KL568-01-Feldman April 1, 1998 10:50
MINING TEXT 293
Figure 7. Clustering associations using the category hierarchy.
the lower listbox are the same as in figure 5.) In addition, the system tries to provide acompact generalization for the first component of each result in the cluster. In our ex-ample, the system found that all countries that are highly correlated with caffeine drinksbelong either to theOAU (African Union) or theOAS(South American countries) organi-zations.
3.3. Comparing specific distributions
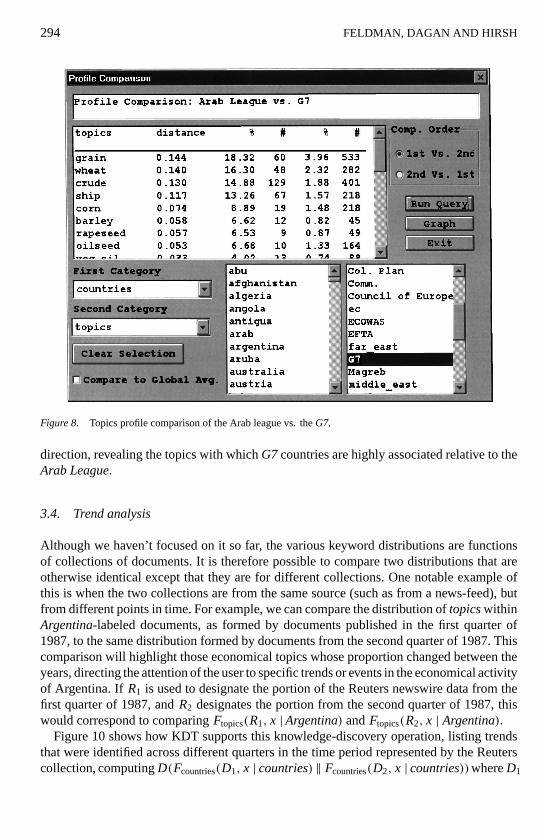
The preceding mechanism for comparing distributions to an average distribution is alsouseful for comparing conditional distributions of two specific nodes in the hierarchy. Infigure 8, we measure the distance from the average topic distribution ofArab Leaguecoun-tries to the average topic distribution ofG7 countries (in the upper half of the figure).Entries are sorted in decreasing order of their contribution to the distance (second column),namelyd(Atopics(k |Arab League) ‖ Atopics(k |G7)). The third and fifth columns show, re-spectively, the percentage of the topic in the average topic distribution of theArab Leaguecountries(Atopics(x |Arab League)) and in the average topic distribution of theG7 coun-tries (Atopics(x |G7)). The fourth and sixth columns show, respectively, the total numberof articles in which the topic appears with anyArab Leaguecountry and anyG7 country.This reveals the topics with whichArab Leaguecountries are associated much more thanG7 countries, such as crude-oil and wheat. Figure 9 shows the comparison in the opposite
P1: VBI
Journal of Intelligent Information Systems KL568-01-Feldman April 1, 1998 10:50
294 FELDMAN, DAGAN AND HIRSH
Figure 8. Topics profile comparison of the Arab league vs. theG7.
direction, revealing the topics with whichG7countries are highly associated relative to theArab League.
3.4. Trend analysis
Although we haven’t focused on it so far, the various keyword distributions are functionsof collections of documents. It is therefore possible to compare two distributions that areotherwise identical except that they are for different collections. One notable example ofthis is when the two collections are from the same source (such as from a news-feed), butfrom different points in time. For example, we can compare the distribution oftopicswithinArgentina-labeled documents, as formed by documents published in the first quarter of1987, to the same distribution formed by documents from the second quarter of 1987. Thiscomparison will highlight those economical topics whose proportion changed between theyears, directing the attention of the user to specific trends or events in the economical activityof Argentina. If R1 is used to designate the portion of the Reuters newswire data from thefirst quarter of 1987, andR2 designates the portion from the second quarter of 1987, thiswould correspond to comparingFtopics(R1, x |Argentina) andFtopics(R2, x | Argentina).
Figure 10 shows how KDT supports this knowledge-discovery operation, listing trendsthat were identified across different quarters in the time period represented by the Reuterscollection, computingD(Fcountries(D1, x | countries) ‖ Fcountries(D2, x | countries))whereD1
P1: VBI
Journal of Intelligent Information Systems KL568-01-Feldman April 1, 1998 10:50
MINING TEXT 295
Figure 9. Topics profile comparison of theG7vs. the Arab league.
Figure 10. Trends in co-occurrence of Arab league countries with other countries.
P1: VBI
Journal of Intelligent Information Systems KL568-01-Feldman April 1, 1998 10:50
296 FELDMAN, DAGAN AND HIRSH
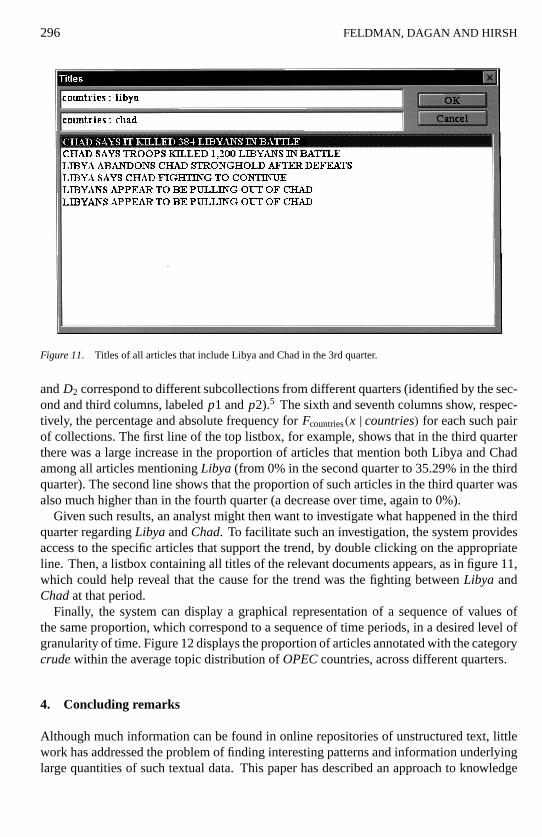
Figure 11. Titles of all articles that include Libya and Chad in the 3rd quarter.
andD2 correspond to different subcollections from different quarters (identified by the sec-ond and third columns, labeledp1 andp2).5 The sixth and seventh columns show, respec-tively, the percentage and absolute frequency forFcountries(x | countries) for each such pairof collections. The first line of the top listbox, for example, shows that in the third quarterthere was a large increase in the proportion of articles that mention both Libya and Chadamong all articles mentioningLibya (from 0% in the second quarter to 35.29% in the thirdquarter). The second line shows that the proportion of such articles in the third quarter wasalso much higher than in the fourth quarter (a decrease over time, again to 0%).
Given such results, an analyst might then want to investigate what happened in the thirdquarter regardingLibya andChad. To facilitate such an investigation, the system providesaccess to the specific articles that support the trend, by double clicking on the appropriateline. Then, a listbox containing all titles of the relevant documents appears, as in figure 11,which could help reveal that the cause for the trend was the fighting betweenLibya andChadat that period.
Finally, the system can display a graphical representation of a sequence of values ofthe same proportion, which correspond to a sequence of time periods, in a desired level ofgranularity of time. Figure 12 displays the proportion of articles annotated with the categorycrudewithin the average topic distribution ofOPECcountries, across different quarters.
4. Concluding remarks
Although much information can be found in online repositories of unstructured text, littlework has addressed the problem of finding interesting patterns and information underlyinglarge quantities of such textual data. This paper has described an approach to knowledge
P1: VBI
Journal of Intelligent Information Systems KL568-01-Feldman April 1, 1998 10:50
MINING TEXT 297
Figure 12. Crude proportion in the topic distribution of OPEC across quarters.
discovery for text that begins with documents labeled by keywords selected from a hierarchyof keywords. A user can then explore potentially interesting collections of documents byexploring the distribution of labels on the documents. We have described how this approachcan support a range of mining operations, as well as how they are instantiated within KDT, animplemented system for knowledge discovery from text. This includes tools for comparingthe distribution of keywords under some node in the keyword hierarchy for subcollections ofthe full set of documents (selected via the keywords as well) to average distributions, as wellas comparing distributions for collections from different points in time. The KDT systemalso provides a range of display methods for presenting such distributions and accessingthe documents that give rise to them.
Our work here focuses on comparisons of keyword distributions for different subsetsof a document collection. In contrast, our related work on the FACT system (Feldmanand Hirsh, 1996) focuses on finding associations (e.g., Agrawal et al., 1993; Mannilaet al., 1994; Toivonen et al., 1995) between the keywords labeling a single collection ofdocuments. Our work is also related to efforts in the information-retrieval community tostructure and display collections of documents to help a user browse the collection and todisplay additional structures hidden in the documents (e.g., Salton, 1989; Cutting et al.,1993; Williamson and Shneiderman, 1992; Hearst, 1995). Here we use a different sourceof power to support such functionality—keyword co-occurrence frequency. Further, ratherthan simply presenting a tool for structuring and displaying documents, a higher-level pointof this paper is that a keyword-frequency approach supports a range of useful knowledgediscovery operations (in addition to those that have simply been implemented in our system).Our use of hierarchies to structure the values being explored by our discovery tools is similarto the work of Srikant and Agrawal (1995) and Han and Fu (1995), where a taxonomy is
P1: VBI
Journal of Intelligent Information Systems KL568-01-Feldman April 1, 1998 10:50
298 FELDMAN, DAGAN AND HIRSH
imposed on the items that occur in transactions and knowledge discovery attempts to findassociations between items at any level of the taxonomy. Given a hierarchy over items intransactions, the KDT approach would also apply. However, KDT would additionally usethe hierarchy as a “vocabulary” of useful sets of keywords for structuring a user’s discoveryoperations. Finally, Kloesgen (1995a, 1995b) also uses distribution comparisons in theEXPLORA system, to discovery interesting statements in a database.
Our focus in this work has been on the development of tools particularly well-suited tocollections of keyword-labeled textual documents. In future we plan to explore the devel-opment of similar tools for structured databases, exploring distributions of attribute valuesamongst various (sub)sets of records in a database. We also plan to investigate possiblesynergistic relationships between automatic keyword labeling and discovery methods thatuse such keyword labels, in the hope of developing keyword-labeling algorithms that aretailored to keyword-based knowledge discovery from text. Complementary to this, we alsoplan to use the KDT approach when the “keywords” labeling documents represent the pres-ence or absence of selected words or phrases in a document, with the goal of performingknowledge discovery using both forms of keywords. Finally, we plan to continue our devel-opment of presentation tools for displaying the results of our distribution-based discoverytools, such as through more sophisticated use of clustering methods.
Acknowledgments
This research was supported by NSF grant IRI-9509819 and by grant 8615-1-96 from theIsraeli Ministry of Science. The authors would like to thank the reviewers for helpfulcomments given on drafts of this paper.
Notes
1. Moreover, in many contexts in the KDT system sets of keywords may only be specified through the use ofinternal nodes in the hierarchy. The assumption is that the hierarchy maintains those subsets of the keywordsthat are interesting, by virtue of the fact that they have been placed under a single node in the hierarchy. Tospecify additional groups of keywords a user must add an internal node for them in the hierarchy, through ahierarchy editor included with the system—it is a simple graphical user interface for constructing and editingkeyword hierarchies, supporting additions, deletions and modifications of nodes and links. Indeed, figure 2 isa screen dump of this hierarchy maintenance editor.
2. It is unfortunate that, although all keywords in some sense represent topics that might arise in documents inthe collection, the tokentopicswas used by Reuters to designate those keywords that are economical topics,and for consistency we maintain its use in that way here as well.
3. Throughout this paper we primarily consider subsets of a collection of documents that are selected by whetherthey are labeled with particular keywords. Although all our definitions generally apply to arbitrary setsof documents—indeed, we exploit this fact when comparing documents from different points of time inSection 3.4—we focus primarily on keyword-selected document sets.
4. Although it is quite simple to define a similar notion forsetsof keywords (for example, by computing theproportions for each subset of a setK ), we have not found it necessary for any of the operations supported byKDT.
5. Although this is our first example doing this, it is quite fair to ask for a distributionFK (x | K ), which an-alyzes the co-occurrences of different keywords under the same node of the hierarchy. Thus, for example,Fcountries(x | countries) would analyze the co-occurrences of country labels on the various documents.
P1: VBI
Journal of Intelligent Information Systems KL568-01-Feldman April 1, 1998 10:50
MINING TEXT 299
References
Agrawal, R., Imielinski, T., and Swami, A. Mining association rules between sets of items in large databases. InProceedings of the ACM SIGMOD Conference on Management of Data(pp. 207–216).
Anand, T. and Kahn, G. (1993). Opportunity explorer: Navigating large databases using knowledge discoverytemplates. InProceedings of the 1993 workshop on Knowledge Discovery in Databases.
Apte, C., Damerau, F., and Weiss, S. (1994). Towards language independent automated learning of text catego-rization models. InProceedings of ACM-SIGIR Conference on Information Retrieval.
Brachman, R., Selfridge, P., Terveen, L., Altman, B., Borgida, A., Halper, F., Kirk, T., Lazar, A., McGuinness,D., and Resnick, L. (1993). Integrated Support for Data Archeology.International Journal of Intelligent andCooperative Information Systems.
Cover, T.M. and Thomas, J.A. (1991).Elements of Information Theory, John Wiley and Sons.Cutting, C., Karger, D., and Pedersen, J. (1993). Constant interaction-time scatter/gather browsing of very large
document collections. InProceedings of ACM-SIGIR Conference on Information Retrieval.Dagan, I., Pereira, F., and Lee, L. (1994). Similarity-based estimation of word co-occurrence probabilities. In
Proceedings of the Annual Meeting of the ACL(pp. 272–278).Dagan, I., Feldman, R., and Hirsh, H. (1996). Keyword-based browsing and analysis of large document sets.
To appear InProceedings of the Fifth Annual Symposium on Document Analysis and Information Retrieval(SDAIR-96). Las Vegas.
Ezawa, K. and Norton, S. (1995). Knowledge discovery in telecommunication services data using BayesianNetwork Models. InProceedings of the First International Conference on Knowledge Discovery (KDD-95).
Feldman, R. (1996). The KDT system—using prolog for KDD. To appear InProceedings of PAP’96 (PracticalApplications of Prolog). London, UK.
Feldman, R. and Dagan, I. (1995). KDT—Knowledge discovery in texts. InProceedings of the First InternationalConference on Knowledge Discovery (KDD-95).
Feldman, R., Dagan, I., and Kl¨oesgen, W. KDD tools for mining associations in textual databases. To appear. InProceedings of the 9th International Symposium on Methodologies for Intelligent Systems.
Feldman, R., Dagan, I., and Kl¨oesgen, W. (1996). Efficient algorithms for mining and manipulating associationsin texts. To appear,Research and Cybernetics.
Finch, S. (1994). Exploiting sophisticated representations for document retrieval. InProceedings of the 4th Con-ference on Applied Natural Language Processing.
Frawley, W.J., Piatetsky-Shapiro, G., and Matheus, C.J. (1991). Knowledge Discovery in Databases: An Overview.In G. Piatetsky-Shapiro and W.J. Frawley (Eds.),Knowledge Discovery in Databases. MIT Press, pp. 1–27.
Han, J. and Fu, Y. (1995). Discovery of multiple-level association rules from large databases. InProc. of 1995 Int.Conf. on Very Large Data Bases (VLDB’95)(pp. 420–431). Z¨urich, Switzerland.
Hearst, M. (1995). Tilebars: Visualization of term distribution information in full text information access. InProceedings of the ACM SIGCHI Conference on Human Factors in Computing Systems. Denver, CO: ACM.
Iwayama, M. and Tokunaga, T. (1994). A probabilistic model for text categorization based on a single randomvariable with multiple values. InProceedings of the 4th Conference on Applied Natural Language Processing.
Jacobs, P. (1992). Joining statistics with NLP for text categorization. InProceedings of the 3rd Conference onApplied Natural Language Processing.
Kl osgen, W. (1992). Problems for Knowledge Discovery in Databases and Their Treatment in the StatisticsInterpreter EXPLORA,International Journal for Intelligent Systems, 7(7), 649–673,
Kl osgen, W. (1995a). EXPLORA: A Multipattern and Multistrategy Discovery Assistant. In U. Fayyad, G.Piatetsky-Shapiro, and R. Smyth (Eds.),Advances in Knowledge Discovery and Data Mining. Cambridge,MA: MIT Press, pp. 2249–271.
Kl osgen, W. (1995b). Efficient Discovery of Interesting Statements in Databases,Journal of Intelligent Informa-tion Systems, 4, 53–69.
Lewis, D. (1992). An evaluation of phrasal and clustered representations on a text categorization problem. InProceedings of ACM-SIGIR Conference on Information Retrieval.
Lewis, D. and Catlett, J. (1994). Heterogeneous uncertainty sampling for supervised learning. InProceedings ofthe 11th International Conference on Machine Learning.
P1: VBI
Journal of Intelligent Information Systems KL568-01-Feldman April 1, 1998 10:50
300 FELDMAN, DAGAN AND HIRSH
Mannila, H., Toivonen, H., and Verkamo, A. Efficient algorithms for discovering association rules. InKDD-94:AAAI workshop on Knowledge Discovery in Databases(pp. 181–192).
Salton, G. (1989).Automatic Text Processing, Addison-Wesley Publishing Company.Srikant, R. and Agrawal, R. 1995. Mining generalized association rules. InProc. of the 21st Int’l Conference on
Very Large Databases. Zurich, Switzerland, Sept. 1995. Expanded version available as IBM Research ReportRJ 9963.
Toivonen, H., Klemettinen, M., Ronkainen, P., Hatonen, K., and Mannila, H., Pruning and grouping discoveredassociation rules. InWorksop Notes Statistics, Machine Learning and Knowledge Discovery in Databases,ECML-95.
Williamson, C. and Shneiderman, B. (1992). The dynamic HomeFinder: Evaluating dynamic queries in a real-estate information exploration system. InProceedings of ACM-SIGIR.