Ministry for the Coordination of Environmental Affairs (MICOA) Poverty and Environment Initiative (PEI) ENVIRONMENTAL ECONOMIC ANALYSIS OF NATURAL RESOURCES MANAGEMENT IN MOZAMBIQUE LINKS BETWEEN POVERTY & ENVIRONMENT Final report, 22 th January 2012 Prepared by: With the support of:
Transcript
Ministry for the Coordination of Environmental Affairs (MICOA) Poverty and Environment Initiative (PEI)
ENVIRONMENTAL ECONOMIC ANALYSIS OF NATURAL
RESOURCES MANAGEMENT IN MOZAMBIQUE
LINKS BETWEEN POVERTY & ENVIRONMENT
Final report, 22th January 2012
Prepared by: With the support of:
Prepared by sba-Ecosys p. 2 January 2012
FOREWORD
The report "Environmental Economic Analysis of Natural Resources Management in Mozambique" has been prepared by sba-Ecosys in the framework of the Poverty Environment Initiative (PEI) implemented in Mozambique by the Ministry for Coordination of Environmental Affairs (MICOA) with the support of UNDP and UNEP.
The authors of this report are (alphabetic order):
Dr. Romana Rombe Bandeira: Forestry and related issues
Dr. Eulalia Esperança Lucas Macome: Agriculture and related issues
Dr. David Maradan: Economic Analysis of the costs of environmental damages and remediation and related issues
Dr. Vasco Nhabinde: Analysis of the environmental contribution to the economy and related issues
Karim Zein: Sustainable development
The whole team of experts has formulated conclusions and recommendations.
Prepared by sba-Ecosys p. 3 January 2012
CONTENT
LIST OF TABLES .......................................................................................................... 5
LIST OF FIGURES ......................................................................................................... 5
LIST OF BOXES ............................................................................................................ 6
ABBREVIATIONS AND ACRONYMS ............................................................................... 7
Table 5 : Budgeting models according to the sectors under review ................................................... 39
Table 6 : Total fee revenue for forest exploitation (in MZN) ............................................................. 46
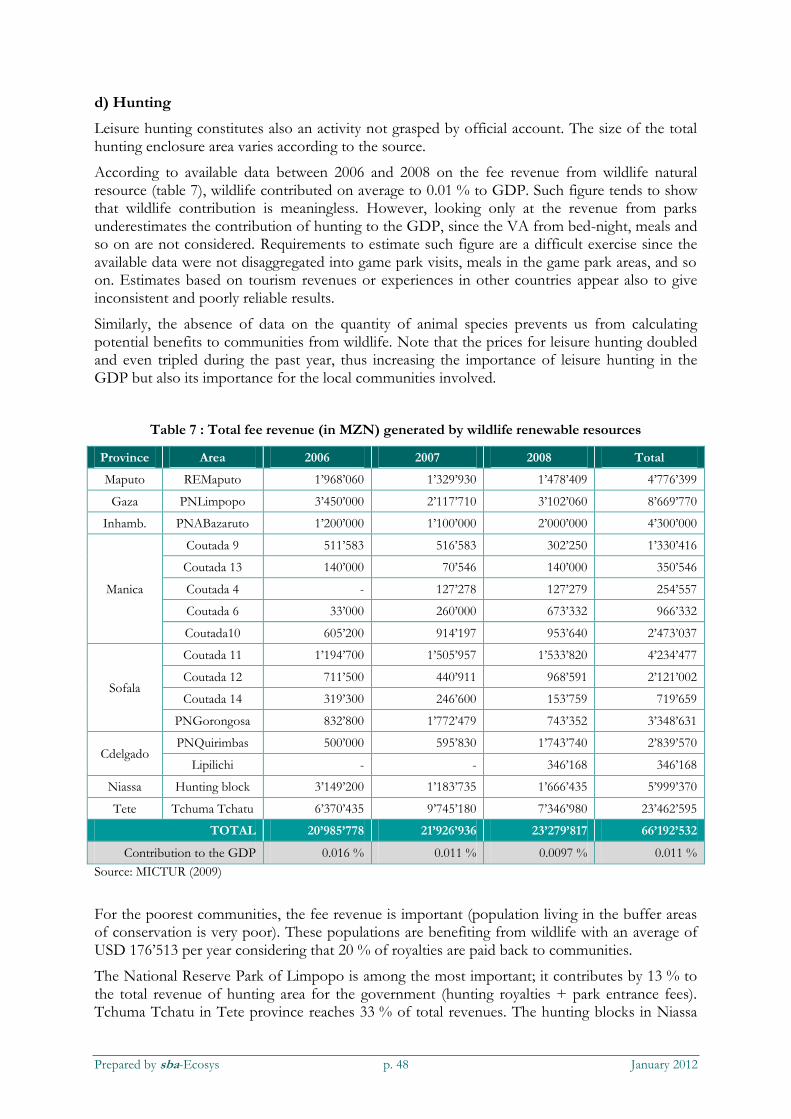
Table 7 : Total fee revenue (in MZN) generated by wildlife renewable resources ........................... 48
Table 8 : Contribution to GDP (in % of GDP) as well as employment statistics (based on data from 2005 - 2010) ....................................................................................................................................... 49
Table 9 : Sample of the survey ................................................................................................................. 50
Table 10 : Distributive effect - Main categories ..................................................................................... 52
PARPA Action Plan for the Reduction of Absolute Poverty
PPP Purchasing Power Parity
PRSP Poverty Reduction Strategy Papers
PM Particulate Matter
UN United Nations
UNDP United Nations Development Programme
UNEP United Nations Environmental Programme
UNFCCC United Nations Framework Convention on Climate Chance
USD United States dollar
VA Value Added
WHO World Health Organisation
WTP Willingness to pay
y Year
Prepared by sba-Ecosys p. 9 January 2012
EXECUTIVE SUMMARY
This report provides quantitative evidences on the links between poverty and environment in Mozambique. More specifically, the report offers:
an assessment of the contribution of the environment to the Mozambican economy,
an assessment of the economic costs of environmental degradation and inefficient use of natural resources in Mozambique,
quantitative analysis identifying the types of environmental degradation which affect the hardest particularly the poorest households in Mozambique.
On the basis of the findings of this study, the report also provides a list of recommendations.
1 Contribution of the environment to the Mozambican economy
The contribution of renewable natural resources to Mozambican economy is very significant but is not adequately captured in official statistics. Subsistence agriculture, forestry and fisheries are indeed not accounted for in official national accounts, neither is informal (and illegal) logging.
According to available data and extrapolation (see Table S1), the contribution of natural resources to the economy ranges between 47% and 50% of its GDP. More than 82% of the jobs available in the country depend directly on natural resources. The sound management of natural resources is a key to poverty alleviation in the country.
Table S1: Contribution to GDP (in % of GDP) and employment statistics (data from 2005 - 2010)
Official Statistics
Unaccounted (subsistence production)
Total contribution
to GDP Employment
Agriculture 23.8 10.6 34.4 79.8
Forestry 2.2 - 4 0.1 - 0.4 2.3 - 4.4 0.2 - 5.4%
Illegal logging 4 4
Fishery 1.4 0.9 - 1.4 2.3 - 2.8 2
Mining 1.1 1.1 0.6
Total contribution to GDP 28.5-30.3 44.1 - 46.7 82.6- 87.8%
Game hunting 0.01 0.01
Tourism 3.2
Total 28.5-30.3 47.3- 49.9
2 Cost of environmental damages and most efficient remediation opportunities
Table S2 reflects the economic costs of environmental damages and inefficiencies (or wasteful use of natural resources) in Mozambique. The results show that the economic loss due to degradation of natural resources (loss of soils, deforestation, water pollution, lack of access to safe water and sanitation, indoor and outdoor air pollution, etc.) as well as the inefficient use of natural resources, materials and energy represent a yearly cost equivalent to 17% of the GDP (around 45 billions MZN). Lack of access to safe water, water pollution and soil degradation, as well as inefficient use of natural resources create the highest costs to Mozambican economy.
Prepared by sba-Ecosys p. 10 January 2012
Illness and death caused by lack of access to clean water alone causes an estimated annual costs of 3.7 billion MZM or more than 100 million USD. Agricultural soil degradation causes an estimated annual damage of 4 billion MZM or some 108 million USD due to reduced productivity.
Excluding inefficiencies (estimated using a number of assumptions, not data collected on the ground) and comparing with other existing studies, we can assess that the environmental degradation costs Mozambican economy between 6 % and 11 % of the GDP. Or if we put it in other words, by avoiding environmental degradation, every 10-20 years Mozambique could be able to produce one additional gross domestic product!
These results confirm the necessity to improve environmental management and protection in Mozambique. However, to prioritise the environmental investments it is important to look not only at the environmental damages, but to compare them with the cost of avoiding or mitigating the damages (i.e. the cost of environmental remediation). The most efficient actions are those where the benefits (the avoided environmental damages) override the costs of remediation by the largest amount.
Table S2: Cost of environmental damages and inefficiencies in Mozambique
Figure S3 compares the benefits (environmental damages costs to be avoided) to the costs (environmental remediation costs) by computing Benefits/Costs ratios (or CDI/CR ratios).
The overall ratio equals to 1.8, indicating that for each 1 MZN invested in environmental protection, on average 1.8 MZN are gained because of the resulting reduction of the costs. This is a win-win situation in which environmental damages will be reduced and at the same time funds will be raised to be invested in the Mozambican economy and public services. This serves
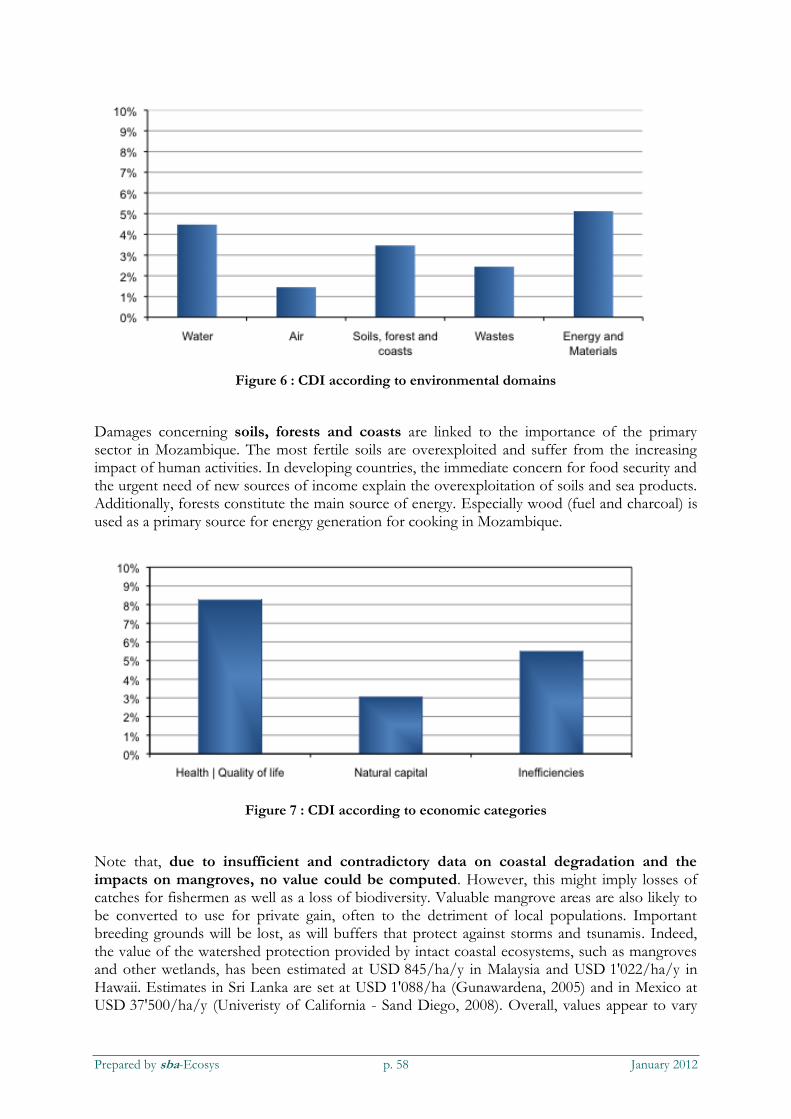
Environmental domains Value
% of the GDP USD MZN
Water 4.5% 326,363,970 12,042,830,487
Air 1.4% 105,751,246 3,902,220,985
Soils, forest and coasts 3.5% 253,054,799 9,337,722,092
Wastes 2.4% 178,006,124 6,568,425,959
Energy and Materials 5.1% 373,920,149 13,797,653,480
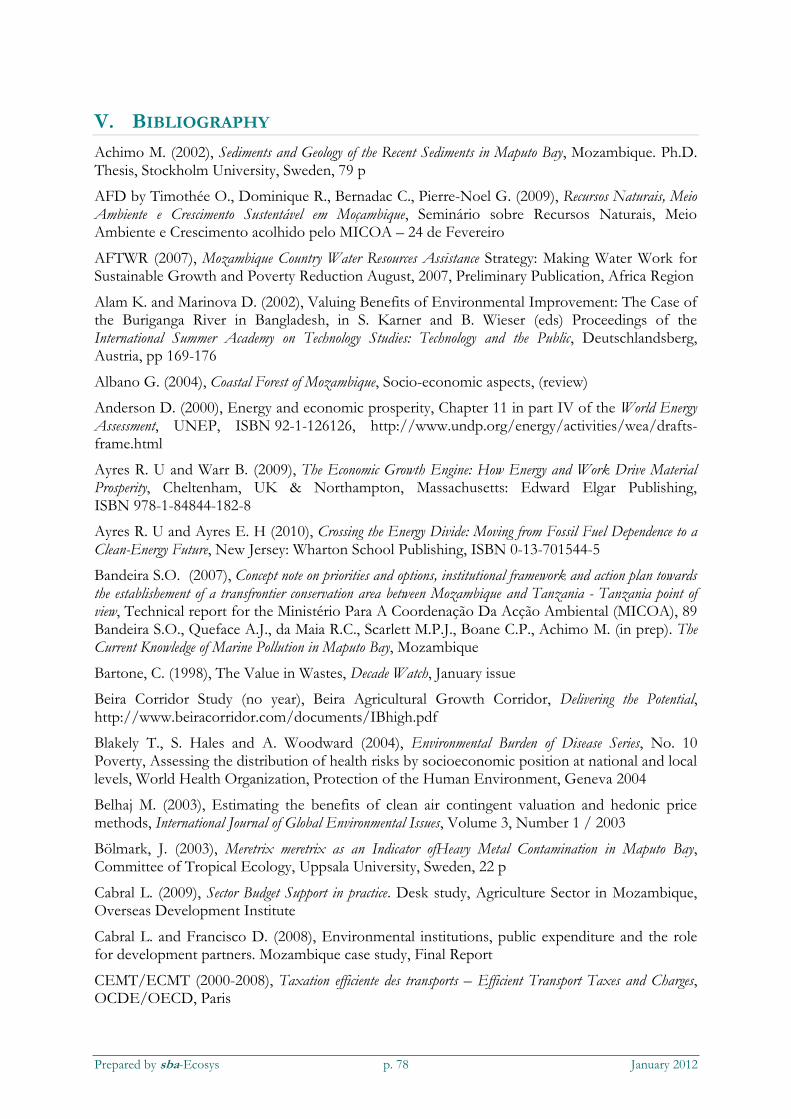
Health | Quality of life 8.3% 606,493,645 22,379,615,496
Natural capital 3.1 % 225,770,557 8,330,933,563
Inefficiencies 5.5 % 404,832,085 14,938,303,943
Total I 17.5% 1,280,321,831 47,243,875,556
Prepared by sba-Ecosys p. 11 January 2012
as a compelling economic evidence for environmental protection in Mozambique, as environmental protection can no longer be considered as a source of costs, but is instead a benefit for the whole country.
By comparing potential costs and benefits, the environmental economic analysis identifies the priorities for environmental investments in Mozambique and helps policy makers to set recommendations. Our analysis shows that investments to reduce soil degradation, deforestation and to enhance coastal protection will bring the highest returns to the Mozambican economy (2.3) and should thus constitute the main priority for action. Investments in improved access to clean water and reduction of water pollution, air pollution and waste management are slightly less beneficial, though the Benefits/Costs ratios in these areas are above 1.
Note that the high B/C ratio for energy-material (3) should be interpreted carefully since this result does not rely on existing data but on hypothesis.
Figure S3: CDI/CR ratios
3 How are the poorest households affected by environmental degradation?
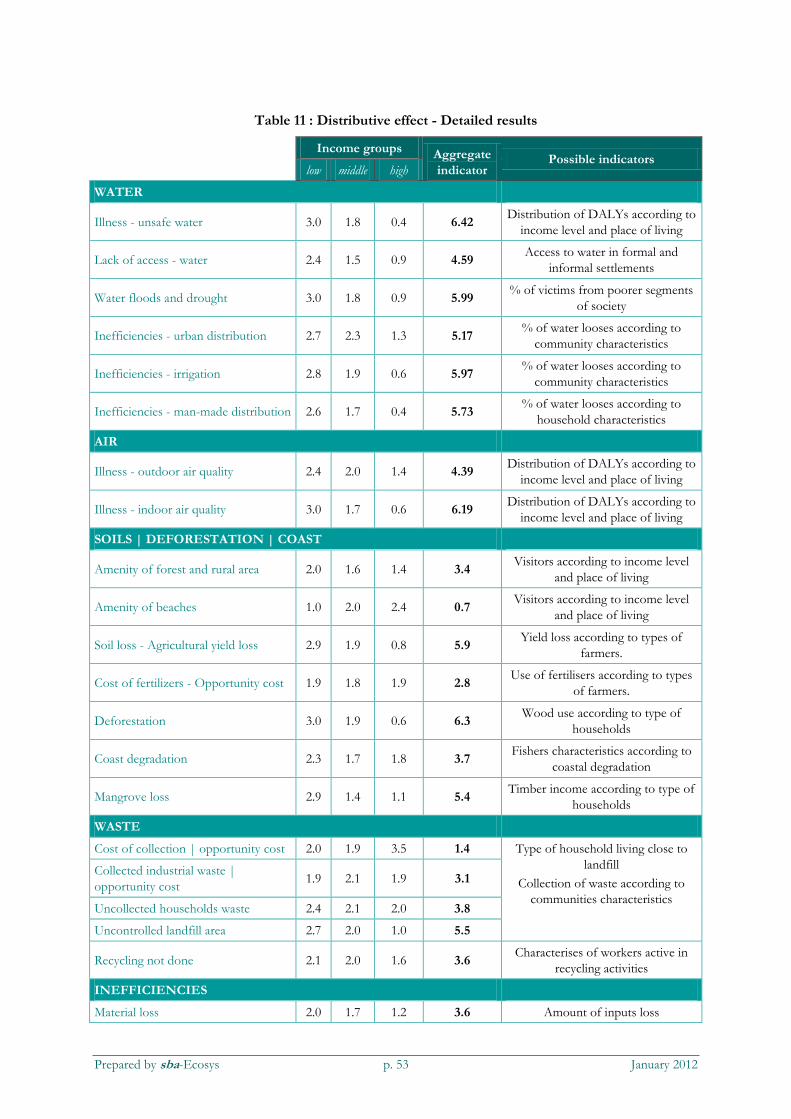
No standardised methodology exists for measuring quantitatively the links between the environment and poverty. Thus, we examine the findings available in the existing literature and compare them to the results of an opinion survey aiming at identifying how environmental degradation affects the welfare (health, income, consumption possibilities) of the poor in Mozambique. The table S4 presents the results. The distributive indicator quantifies the link between the environment and poverty; it might vary from 1 to 6, where 1 indicates that environmental degradation and inefficient use of resources have a stronger impact on the richest class of society and not so strong impact on the poor, while 6 indicates that the impacts are particularly strong on the poor.
Table S4: Distributive effect - Main categories
Categories Distributive indicator
Health effect 5.7
Inefficiency - water 5.6
Prepared by sba-Ecosys p. 12 January 2012
Natural resources degradation 5.3
Waste 3.4
Amenity 3.0
Inefficiencies - energy and materials 1.7
4 Linking the costs of environmental damages with poverty
The table S5 links the distributive indicator with the costs from damages and inefficiencies (CDI) and the cost / benefit ratios (CDI/CR). The figure S6 graphically illustrates the results; the size of the bubbles represents the value of the CDI/CR ratios while the X-axis set the CDI (in % of the GDP) and the Y-axis the distributive indicator, so the higher you are in the Y-axis, the stronger the effect is on the poorest.
Table S5 : Linking the costs of environmental damages with poverty
Distributive
indicator CDI
CDI/CR
ratios
WATER 5.6 4.5 % 1.7
AIR 5.1 1.4 % 1.4
SOILS | DEFORESTATION | COAST 4.0 3.5 % 2.3
WASTE 3.5 2.4 % 1.1
ENERGY and MATERIALS 3.2 5.1 % 3.0
The following conclusions may be drawn:
o Water (mainly water pollution and lack of access to safe water) presents a high damage cost. Furthermore, increasing access to safe water would reduce damages that are particularly affecting the poor. Therefore, measures to reduce water pollution and improve access to safe water clearly constitute a priority. It is however a rather costly remediation action.
o Soil degradation and deforestation also constitute a priority. Damages are relatively high, and the consequences on the poor are stronger than average. Finally, the CDI/CR ratios are significant, indicating the high economic returns of the remediation. Much can be done at a relatively low cost.
o Waste management and air pollution may appear to be a less urgent issue. Both the damages and the CDI/CR ratio are relatively low. However, indoor air pollution has a strong negative impact mainly on women and children in poor communities. Furthermore, our analysis did not link waste management to the economic potential of income generation through collection and recycling. Investing in waste collection services and recycling activities seems to be more beneficial to poor communities since their inhabitants have developed good competences in waste management.
Prepared by sba-Ecosys p. 13 January 2012
o Results concerning losses of energy and materials are purely indicative here. However, if the assumptions about the degree of inefficiencies are correct, it makes economic sense to invest to avoid them. However, inefficiencies mainly concern well-off people, not so much the poorest. Note also that some inefficiencies (as post harvest loss and bycatch) could not be valued precisely. Efforts are required in those areas since their potential impact on poverty is strong.
Figure S6 : Linking the costs of environmental damages with poverty
Recommendations
The results clearly show that improved environmental management represent an important opportunity for poverty reduction and economic growth in Mozambique. In order to tap this opportunity the following four elements are critical:
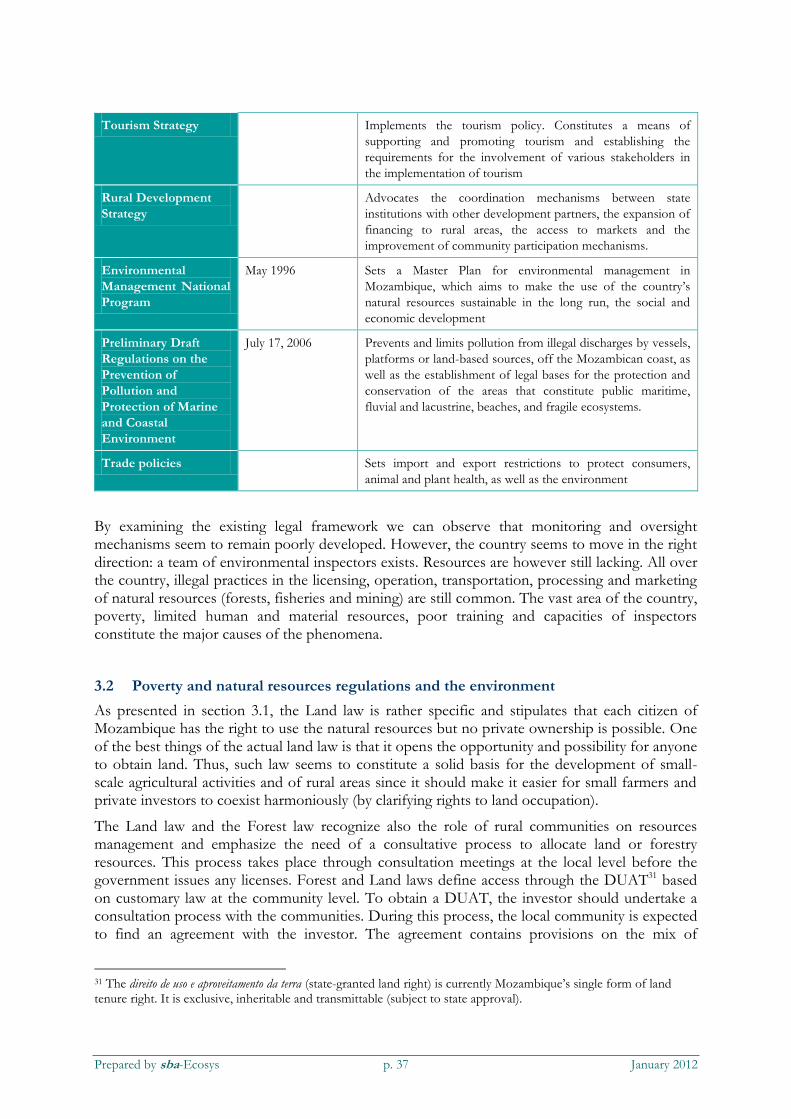
First, actual public budget devoted to environmental protection and better natural resources management practices should be clearly increased with a particular focus on the development of water-related infrastructures. The economic evidence shows that investing in water related infrastructure now, Mozambique will actually save 1.7 million MZM every year, making it a high priority area for intervention. Moreover, it is the type of environmental damage that is most negatively affecting the poor. Furthermore, programs that monitor sustainable management practices in agriculture, forestry and fishery should be established. The increase in public budgets could be met through prioritizing expenditures from existing funds and, in long term, by implementing ecological taxation and environmental fiscal reforms.
Second, there is a need to implement and reform existing policies. Particular efforts should be made to improve the coordination of plans and programs which have clear environmental impacts and to control the exploration and use of the country’s natural resources. Further policies are required to increase earmarked financial resources for environment. Our analysis also suggests that there is a clear need to improve the way how local communities are consulted on topics related to use of the local natural resources and on development projects that may lead to degradation of local environment. From the perspective of poverty alleviation through improved
Prepared by sba-Ecosys p. 14 January 2012
natural resources management, it is important to strengthen policies that foster the development of financial services in rural and poor communities and provide for small investment possibilities for rural households.
Third, there is a need to increase competencies and knowledge about environmental protection and management. The accelerating development of technologies, including production technologies means that knowledge of these technologies is a key to enable policy makers to design the right policy instruments which would ensure that Mozambique's development is sustainable. Therefore awareness of policy makers and decision makers about the newest technological developments are crucial. As such, acquisition and dissemination of information also constitute a key variable in the relationship between economic growth, environmental needs and the acceptability of environmental policies. Therefore there is a need for developing a mechanism to enable easy access to the information about newest scientific and technological developments, including a communication and dissemination system, which can adapt flexibly to the changing economic situation and ICT infrastructure in Mozambique. Building on access to the knowledge on most recent scientific developments, it is important to continue and expand awareness campaigns, since many environmental problems are caused simply due to ignorance and can be prevented by demonstrating the benefits of more sustainable ways of using natural resources. Such awareness campaigns, among others, will aid to ensure that environmental policies are accepted by all stakeholders involved.
Fourth, this study revealed that there is a significant lack of information on the links between poverty and the environment. This is highly problematic as far as such information constitutes a prerequisite to demonstrate the need for interventions, to select most appropriate actions and subsequently to manage and monitor them
Hence, a strategy has to be elaborated to reconstitute missing data according to the most urgent needs identified (informal activities, illegal practices, income distribution, degradation of soils, forests, etc.). In this regard, strengthening existing institutions by providing a national body to collect, analyze and disseminate the most relevant data linking environmental, social and economic issues is a prerequisite in order to deepen research on the links between poverty alleviation and environmental degradation in Mozambique. It is also essential to create a statistical framework in the national accounting system for integrating environmental information in the main economic indicators of Mozambique. The Millennium Development Goals report grasps such opportunities.
Prepared by sba-Ecosys p. 15 January 2012
I. INTRODUCTION
1. Motivations of the Study
Mozambique possesses great natural resources, as well as a highly diverse fauna and flora. Its ecosystems are of particular importance. However, the importance of sustainable management practices of these resources to national and local development is just partly understood, especially regarding budget allocations at the national level, management decisions at the companies’ level and daily practices at individual levels. This is problematic since Mozambique’s economic development significantly depends on the exploitation of its natural resources. Nevertheless, the implementation of environmentally friendly practices and policies, as well as the provision of environmental services is crucial for the long-term economic growth and for the improvement of living conditions. Therefore, in light of this context, natural resources must be managed sustainably. As the report will further show, the majority of the population in Mozambique, as elsewhere in Sub-Saharan Africa, depends on natural resources for their daily needs. Poverty and environmental degradation are closely linked, since poor environmental and natural resources management reinforces poverty and vice versa.
The Government of Mozambique has identified poverty as the main development priority and prepared in 2006 the Action Plan for the Reduction of Absolute Poverty - PARPA II - as a general strategy for guiding development priorities. Its main goal is to reduce the incidence of food insecurity by 20% by 2014. Environmental management is also defined as one of the priority areas of the PARPA II.
A new Poverty Reduction Action Plan (PARP), published in May 2011, represents the continuation of the PARPA II for the period of 2011-2014 and is aligned with the vision of Agenda 2025, designed to achieve the Millennium Development Goals (MDG). More particularly, the PARP aims at (i) increasing the output and productivity in the agriculture and fisheries sectors; (ii) promoting employment; and (iii) fostering human and social development, while maintaining a joint focus on (iv) governance and (v) macroeconomic affairs and fiscal management.
The Government of Mozambique is currently implementing the Poverty Environment Initiative (PEI) developed by the United Nations Development Programme (UNDP) and the United Nations Environment Program (UNEP). The first phase of the PEI (2005 - 2007) focused on exploring the links between poverty and environment, capacity building and training in order to integrate environmental issues in national development plans. It also facilitated the training of teachers and media professionals and the formulation and implementation of micro-projects. The current and second phase of the PEI aims at improving poverty and environmental mainstreaming into the policies, planning and budgeting processes at national, sectorial and district levels to support the implementation of PARPA II and the Environmental Strategy for Sustainable Development. The project is being jointly implemented by the Ministry for the Coordination of Environmental Affairs (MICOA), and the Ministry of Planning and Development (MPD).
The necessity to present reliable and valid data and assessments to key decision and policy makers on the importance of Environment and Natural Resources (ENR) and their contribution to national economy and poverty reduction has been recognised both by MICOA and its development partners. In view of this, the AFD (French Development Agency) assisted the Government of Mozambique with the preparation of an in-depth assessment of the ENR
Prepared by sba-Ecosys p. 16 January 2012
contribution to national wealth and the impact of environmental degradation and pollution on Mozambique’s economic growth. The results of the study provided inputs to sector specific environmental analysis notes to stimulate policy dialogue on key environment related development issues in Mozambique.
In recognition of the importance of the AFD study but also in recognition of some of its limitations in terms of assessing the poverty perspective of ENR management and of stakeholders participation, PEI Phase II aims at supporting the present background study that will lead to a more thorough understanding of the roles that sustainable management of natural resources and ecosystems can play in poverty reduction in Mozambique.
1. Objectives
Overall, the objectives of the present analysis are:
to identify the linkages between the environment and social and economic development and assessing to what extent sustainable management of natural resources can contribute to economic growth and poverty reduction in Mozambique.
to assess the economic costs and benefits of sustainable and unsustainable natural resources use in Mozambique.
to reveal how natural resource management practices influence economic performance and how they are linked with poverty reduction.
to set recommendations in order to encourage key decision-makers and planners to consider environmental sustainability in policy setting and budgeting.
2. Expected Outcomes and Beneficiaries
According to the ToR, the present analysis is expected to:
Provide a strategic assessment for grasping the objectives of poverty reduction and sustainable resources management in Mozambique
Provide a series of arguments, empirical evidence and concrete examples to prove the legitimacy, necessity and efficiency of the proposed assessment
Indicate how the proposed assessment has considered the past actions in Mozambique and how it is positioned relative to them (what were the drawbacks and success of past actions, how the assessment is based on the knowledge obtained from them)
Propose the way to implement recommendations by examining concrete case studies.
Provide understanding and explanation on the research and methodological tool used to undertake the assessment
More particularly, this report will indicate:
The value of the environment and of the use of natural resources in Mozambique. Such value will be assessed in monetary units in order to grasp its importance for the economy of Mozambique.
The distribution of the previous values. In other words, the analysis will indicate who will benefit from the sustainable management of natural resources in Mozambique and how the welfare of the poorest groups of society may be improved.
Prepared by sba-Ecosys p. 17 January 2012
Some actions and projects that could preserve the natural environment. For this, the report is supported by 3 separate case study reports (on agriculture, fisheries and health).
The main beneficiaries of the study are:
Decision-makers in Mozambique: the results of the study and case studies will shed light on new dimensions and will provide essential information for taking decisions. Such information has proven to be useful in numerous cases for convincing people and taking actions relative to environmental protection.
The population and more particularly the poorest population of Mozambique. The study demonstrates that environmental damages and unsustainable practices have larger impacts on the poorest part of society since poverty limits the possibility to escape environmental constraints and since the poorest people are highly dependent on environmental goods and services and are thus more affected by environmental degradation. Thus, the proposed recommendations are especially focused on the needs of the poorest parts of Mozambican society. This study, will therefore indirectly benefit the poorest population of Mozambique.
The local experts and other people that participated in the study. Their competencies in environmental economics and related tools were developed by the trainings and by participating in the development of this study.
3. NCC meeting
The methodology, the results and the recommendations of this study have been revised by the National Consultative Committee (NCC). The committee represents national decision makers, civil society and development partners in Mozambique. The National Consultative Committee has a crucial role as it validates and accepts accomplished work and analyses. Two meetings were arranged with the NCC:
The first meeting took place during the study (at the end of the data collection phase), it aimed at presenting the methodology of the study and the expected results. Note that training in environmental economics took place in order to provide part of the background knowledge and information to the members of the NCC meeting. The first meeting has been held in Maputo in February 2011 (6-9th).
The second meeting took place at the end of the study, when results and recommendations were ready to be discussed and challenged. The second meeting was held in Maputo in November 2011 (15-16th). This version of the report includes the modifications proposed by NCC members.
The National Consultative Committee includes the following institutions:
Ministry for the Coordination of Environmental Affairs, Directorate for Studies - MICOA DPE
Center for Investment promotion - CPI
Ministry of Science and Technology - MCT
Ministry of Finance MF/DNO
United Nations Development Program
Prepared by sba-Ecosys p. 18 January 2012
United Nations Environmental Program
Mozambican Ministry of Women and Social Action - MMAS
Ministry of Minerals Resources - MIREM
Rural Association for Mutual Support - ORAM
Ministry of Planning and Development - MPD
National Disasters Management Institute - INGC
National institute of Statistics - INE-DEBA
4. Outline of the report
The study "Environmental Economic Analysis of Natural Resources Management in
Mozambique" constitutes an analysis of the complex interlinkages between the environment, poverty reduction and economic development in Mozambique. This study is divided in five parts.
Part I presents the context, the objectives, the expected results of the studies, the beneficiaries and the outline of the report.
Part II presents raw figures on the main environmental issues in Mozambique. More particularly, it shows how natural resources contribute to the Mozambican economy and how natural resources are linked to poverty. Part II also reviews the institutional setting and environmentally related legislation in Mozambique.
Part III provides a quantitative analysis of the previous relationships between the environment, economy and poverty in Mozambique. More particularly, it estimates the contribution of the environment to the economy and the cost of environmental degradation in Mozambique. It aims at identifying the most cost effective options for remediation. Those results set priorities for preserving natural resources and reducing environmental degradation and provide compelling arguments for increasing budgets and investing in environmentally related infrastructures, for promoting more efficient and less polluting technologies as well as for setting environmental incentives and legislations. Part III integrates the dimension of poverty in the analysis by examining which socio-economic class of the population is more particularly impacted by the environmental damages. To our knowledge, such quantitative analysis of the distributive effects of environmental degradation has not been made before.
Part IV proposes recommendations for decision-makers in Mozambique.
For a quick read of the report, parts III and IV should receive the highest attention as well as the Executive summary at the beginning of the report).
Prepared by sba-Ecosys p. 19 January 2012
II. FACT AND FIGURES ON MOZAMBIQUE
1. Socio-economic aspects of Mozambique
Since the end of the civil war in 1992, the Government of Mozambique, in partnership with the international community, engaged in an economic, social and political rehabilitation of the country. Today, Mozambique has achieved a considerable recovery. The average growth rate of GDP amounted to 8.3% per year between 1996 and 2005. This growth rate is among the highest compared to other African countries, only exceeded by three African oil-exporting countries: Equatorial Guinea, Chad and Angola. The 2007 African Development Indicators (World Bank, 2007) indeed lists Mozambique as one of the fastest growing African economies. Furthermore, external debt was reduced to levels below 35% of GDP, a situation that many developed economies would envy and inflation rates were kept low.
According to the PARP 2011-2014, Mozambique also significantly increased school enrolment, literacy rates and the percentage of the population with access to health services. Infant mortality also dropped by 41% between 1997 and 2008 (from more than 240 deaths per 1000 live births to 138).
However, despite these performances, Mozambique remains one of the poorest nations in Africa. Indeed, the country's economic development remains low with a per capita income of USD 240 (USD 900 per capita income in purchasing power parity). Moreover, Mozambique was among the 10 lowest ranked countries in 2009 according to the HDI.
Disparities and economic inequalities remain also high. About 38% of the population lives on less than USD 1.08 a day at 1993 international prices (equivalent to USD 1 in 1985 prices, adjusted for purchasing power parity) while 78% of the population live with less than USD 2 per day (in 1985 prices).
Income distribution is skewed since 46% of the total income is earned by the richest 20% of the population, while the 20% of the poorest gain only 6% of the total income. According to UN data, the Gini coefficient1 is 0.47 in 2002, slightly lower than the African average (0.51)2. The PARP 2011-2014 confirms the high inequality and poverty rates in Mozambique. It indicates an even lower Gini coefficient (0.42 in 2002-03 and 0.41 2008-2009), which demonstrates that inequality increased slightly in urban area (Table 1). This situation is explained by the fact that living conditions are very harsh in rural areas and towns have thus attracted people promising them better economic and living conditions. As a consequence, poverty increased in urban areas. Furthermore, rural migration generates other negative consequences on the living conditions since increasing urban population puts pressure on the already weak urban infrastructures (homes, energy and water network, waste facilities) and increases social problems.
However, as far as poverty and living conditions are concerned, the situation is still most severe in rural areas. The results of the third Poverty Assessment indicate indeed that rural poverty did not decrease since 2005. Low productivity in agriculture, the vulnerability of the agricultural sector to climate shocks and seasonal variation and the worsening of the terms of trade explain this.
1 The Gini index measures the extent to which the distribution of income (or in some cases consumption expenditure) among individuals or households within an economy deviates from a perfectly equal distribution. A Gini index score of 0 implies perfect equality while a score of 1 implies perfect inequality. 2 Eleven countries had a Gini coefficient greater than 0.51: Swaziland 0.62, South Africa 0.53, Central African Republic 0.51, Kenya 0.48, Ethiopia 0.48, Zambia 0.48, Guinea-Bissau 0.47, Madagascar 0.46, Burkina Faso 0.45, Uganda 0.45, Gambia 0.44.
Prepared by sba-Ecosys p. 20 January 2012
Table 1 : Incidence of Poverty and Inequality, Urban-Rural and National: 1996-2009
Zone Poverty Incidence Gini coefficient
1996-97 2002-03 2008-09 1996-97 2002-03 2008-09
Urban 62.0 51.5 49.6 0.47 0.48 0.48
Rural 71.3 55.3 56.9 0.37 0.37 0.37
National 69.4 54.1 54.7 0.40 0.42 0.41
Source: 3rd Poverty assessment and PARPA 2011-2014
A few mega-projects have been launched in order to develop the country and modernize its economy3. Even if these mega-projects have been generating huge revenues, they had very little impact on alleviating poverty in the country. According to Sonne-Schmidt et al. (2009), those mega-projects accounted for more than 10% of value added (VA) in 2006 and their direct contribution to growth was estimated to vary between 0.8% and 1.1% per year.
Mozambique remains largely dependent on development aid. The official development assistance received was of USD 2 billion in 2008, according to the World Bank (2008). This represents around 27% of GDP. The trend has been decreasing compare to the 90's. At this time, official development assistance got to even 80% of GNI (in 1992). Since 2004 (around 32%), it decreases slightly.
Looking at existing reports and recommendations on Mozambique, it is obvious that the country has to pursue its massive investment program in infrastructures related to basic services (water, energy), education, health, communication and transportation. Mozambique needs also to improve its institutions and the way public expenditures are allocated and managed since it faces difficulties in identifying and monitoring the needed reforms.
2. The economy, poverty and the environment in Mozambique
This section will identify the major links between the economy, poverty and the environment in Mozambique. It starts with a general description of the economic functions of the environment and determines, on this basis, the main interactions between the environment and poverty. It then focuses on specific economic sectors (agriculture, forestry, fishery, etc.) in order to delve in the details of the environment - poverty connection in Mozambique.
2.1. Economic functions of the environment
The environment provides three significant “services” to the economy: it is a resource base, it assimilates waste and pollution and provides amenities4. The previous economic functions of the environment are central to the growth of Mozambique and are strongly linked with poverty and social issues:
3 Mega-projects are the Mozal aluminium smelter in Maputo province, the gas extraction and pipeline project (the
Temane gas projects in Inhambane), the titanium ore or heavy sands project (Moma in Nampula). Mega-projects are also devoted to the realization of public infrastructures such as roads construction (N4 or Maputo-WitBank) and electrification projects (the Cahora Bassa Hydroelectric plant). 4 Direct benefits linked to enjoying the environment as observing a nice landscape or benefiting from pristine areas.
Prepared by sba-Ecosys p. 21 January 2012
1. The quality of natural resources such as wood, water, soil nutrients and access to them are essential for the development of the economy. The importance of the primary sector5 in Mozambique (around 25% to 50 % of the GDP, around 80% of the active population, see part III) confirms this statement.
2. The capacity of the environment to assimilate the waste and pollution is a precondition for maintaining the quality of life and attractiveness of a territory. At the same time, a level of pollution above the assimilative capacities of the environment decreases the quality of life and thus affects the maintenance of a healthy environment. Therefore, there are strong linkages between the economic activities and environmental services. For example, excessive amounts of untreated wastewater may pollute rivers; their water could become undrinkable. Similarly, waste and air emissions might decrease crops productivity6.
3. Finally, amenities play a crucial role in the development of leisure activities and related economic activities (tourism, catering).
Determining the economic functions of the environment allows for the identification of the conflicts between alternative uses and non-uses of the natural resources, i.e. situations where use and/or non-use values of the environment oppose one another. For example, the extraction of minerals destroys amenities and decreases soil fertility. Similarly, the exploitation of wood destroys the amenities provided by forests.
In Mozambique, such conflicts of uses are apparent. For example, local communities’ interests might be in conflict with international investors’ priorities in the mineral industries and local fishermen’s interests might be opposed to the one of the industries in the Maputo bay. Use and non-use might involve groups whose interests are economically and politically weaker (such as the poor, the women and the unemployed) or even non-existent (future generations). In such situations, the authorities set rules (authorisations and limits) or provide compensatory payments among the involved groups (see environmental policies in Mozambique, see 3.1).
2.2. Linkages with Poverty
The main instruments that Mozambique has implemented to fight poverty are the Poverty Reduction Strategy Papers (PRSP or PARPA)7. Such strategies present and confirm the crucial role of the environment. They call for the proper use and management of natural resources such as forests, savannas, wildlife, and marine resources. The new PARP 2011-2014 (May 2011) confirms the importance of managing environmental resources in a sustainable way : the sustainable management of natural resource is considered as a key issue for boosting output and productivity in agriculture and fishery.
While it identifies the environment as a challenge, the PARP does not present it as a new opportunity for growth. As stated by the Green Economy Report (UNEP, 2011), environmental protection and management are also a significant source of employment,
5 The primary sector involves changing natural resources into primary products. Most products from this sector are considered raw materials for other industries. Major businesses in this sector include agriculture, agribusiness,
fishing, forestry and all mining and quarrying industries.
6 Gaseous uptake of the pollutant by vegetation results in internal cellular damage or changes to biochemical or physiological processes. SO2 and NOx contribute to acidification of sensitive soils, which may be accompanied by a depletion of base cations, affecting the local vegetation over relatively long timescales (e.g. Grennfelt et al., 1994). NOx and ammonia emissions cause long-term eutrophication of nutrient-poor terrestrial ecosystems, although the additional nitrogen deposition may also lead to short-term stimulation of growth.
7 It is also called the Action Plan for the Reduction of Absolute Poverty (PARPA).
innovation and, hence, growth. There is no avoidable trade-off between environmental sustainability and economic progress and there is evidence that the greening of economies neither inhibits wealth creation and employment opportunities nor constitutes a luxury only wealthy countries can afford.
Part III of the report will estimate the importance (in monetary units) of the environment for the Mozambican economy and particularly for the income of the poorest class of society. Such work rests however on the proper identification of the linkages between environment and poverty in Mozambique.
Five links between poverty and the environment are central:
1. The first one is health. Environment and poverty appear to be strongly linked as far as the health status of the population is concerned. Water quality and availability as well as the lack of water-related infrastructures are responsible for sickness and deaths8 and have thus strong economic incidences. Infant mortality due to diarrhoea is still very high (8% to 10% in 2010) and life expectancy (41 to 50 years old) is relatively low globally.. The lack of access to safe water is also a major factor of illness and lowered work productivity in developing countries. Mozambique counts more than 580'000 water related DALYs9 per year due to waterborne diseases.
Focusing on health, the consequences are usually stronger for the poor since they have less available income for reducing the risk (buying alternative products or moving to safer place) or undergoing treatment. Their capacity to work is decreased, thus reducing their potential for escaping poverty. The PARP clearly acknowledges the importance of developing water infrastructures as an essential factor to reduce poverty. The government estimates that over half of the population, more particularly the rural and urban poor, do not have access to safe water.
Health conditions in Mozambique are also strongly influenced by social issues (i.e. illiteracy,
especially among women, malnutrition and poor housing conditions). Garcia et al., (2009)
confirmed that health impacts are generally higher among poor communities since their access to
medical services is lower. Malaria, as one of the most serious and common tropical diseases and
which is endemic throughout the country and a major cause of morbidity and mortality, accounts
for about 40% of consultations. The rural and poor communities are the most affected by the
disease partly due to the lack of knowledge and prevention methods, high transmission rate and
difficulty in accessing health services. Environmental management responses, such as appropriate
waste management, drainage, land use planning and zoning and land levelling can substantially
contribute to the control of malaria by reducing the areas favourable for mosquito breeding.
Cholera is more frequent during floods and droughts; and is influenced by factors such as poor
and insufficient sanitary conditions or inappropriate treatment and storage of food.
2. The second link between poverty and the environment lies in the overutilization of natural resources and the uncontrolled pollution levels (beyond the assimilative capacity of the environment). Between 60% and 70%10 of the population (however, over 80% of the total labor
8 The major waterborne diseases are bacterial and protozoal diarrhea, hepatitis A, and typhoid fever. The major water contact disease is schistosomiasis. The vectorborne diseases (malaria and plague) are also related to water. 9 “DALYs” is an indicator adjusting, in terms of the number of years in a person’s life, all consequences (from lost days to lost years) due to illnesses and premature death resulting from water related diseases in a country per year. This indicator was developed by the WHO and the World Bank with the collaboration of international experts in order to provide a harmonised measure of the impacts of environmental degradation on human health. .
10 Note that such figure is not contradictory with 80% of the active population working in agriculture.
Prepared by sba-Ecosys p. 23 January 2012
force involved in agriculture, World Bank 2007) lives in rural areas and relies heavily on natural resources to provide much of their economic livelihood and food security. The availability and quality of the environment are thus particularly important for the poor. Environmental degradation has therefore a disproportionate impact on the poorest. According to the World Bank (2007), the rural poor, who are largely dependent upon rain-fed subsistence agriculture, are particularly vulnerable to water shocks. Unsustainable agricultural practices degrade also the quality of soils, uses fresh water resources and pollutes rivers with fertilizers and pesticides (as shown in the case study). Extractive activities result in deforestation, degradation of soils and depletion of ecosystems. Illegal logging may extract too much wood from forests11; in this respect, destruction of mangroves ultimately leads to a reduction of fish captures and reduced coastal protection.
In the Zambezia province, forest management is being affected by illegal logging where many different actors are in conflict with each other in the same area to exploit the same resource at the rate that, according to Mackenzie (2006), will deplete the resource in about five to ten years. This action is compromising the development of the Mozambican economy and is increasing the gap between the rich and the poor. Similarly, if fisheries overexploit the fish stock, future captures will be lower which has also a long term effect on Mozambican economy.
Economic activities as mining and forestry may also require the building of infrastructure in pristine natural areas. For example, Indian state mining company JSPL Mozambique Minerais, a subsidiary of Jindal Steel and Power Ltd has called for a public debate in May 2011 to discuss the environmental impact assessment of its implementation in the area of Chirodozi. JSPL will operate the mine as an open cast mine and will bring changes to the environment, altering the landscape, air and water quality.
The principal victims of the unsustainable use of natural resources again seem to be the poorest farmers or fishermen, who depend primarily on natural resources and the environment for their living and for whom technical solutions are too costly and alternative ways of living are not affordable. Poor people also lack the reliable information and are not able to anticipate the need to adapt to changing environmental conditions. Therefore, their ability to meaningfully participate in any public debates under processes such as EIA is limited. Rural people rely on natural resources to get food, shelter, water and energy for cooking as well as for heating. Consequently their degradation and increased scarcity has a greater impact on the poor. In agriculture for example, poor farmers cannot access easily new agricultural lands or buy fertilizers to improve soil quality and yields. Note however that farmers are not only victims of land degradation as they can also take part in activities that are damaging to the envioronment. For example, slash and burn techniques for land preparation increase the loss of topsoil.
3. The third link is rapid urbanization. The low productivity of agriculture (and, in the future, the potential reduction of fish stock in Mozambique) increases urban migration. Mozambican cities experienced a rapid growth during the last two decades12 since cities appear to promise
better living conditions. Such migration has caused an anarchic urban development in informal settlements leading to sanitary problems, lack of public services and poor living conditions. Basic environmental services such as water supply and sanitation are not available thus increasing the morbidity of poor people13 (health issues mentioned above). In major Mozambican cities,
11 The process of wood harvesting, transportation, purchasing, processing or sale of timber is in violation of the country's laws (World Bank 2008; FAO 2008a; FAO 2008b; Del Gatto 2003). 12 The urban migration between the 1980s and 1990s was caused by the civil war when people were looking for safety. After the peace agreement in 1992, the movement continued as people were looking for employment, higher wage, and public services such as education, sanitation and health care facilities.
13 The National Institute of Statistics (2004) indicates that the lack of such services has a strong influence on the rate of infant mortality mainly caused by malaria, diarrhoea and cholera.
Prepared by sba-Ecosys p. 24 January 2012
80% of people living in slum areas do not have access to piped water and sewage facilities (Figures 1 and 2). In the city of Maputo, the deterioration and poor maintenance of housing, the deterioration of plumbing services, water shortages in some cases and poor sanitation have a larger impact on the health of the poorest class of the society.
Even though great efforts have been made towards building and implementing public infrastructures, better living conditions and housing in Mozambique14, a tremendous amount remains to be done, particularly in rural water supply and sanitation.
Figure 1 : Number and percentage of people living in formal (left bar) and informal houses (right bar)
14 According to PARP 2011-2013, possession of durable goods rose by 8.3 % in urban zones versus 4.7 % in rural areas. With respect to housing, on average, there were improvements in all housing characteristics between 2002-3 and 2008-9: the proportion of families in dwellings with durable roofing material (concrete slab, zinc or fibrous cement (“lusalite”) rose by around 4.4 %, and the proportion using electricity, a generator or solar energy for lighting nearly doubled from 6.9 %to 13.3 %. The overall rate of safe drinking water use went up from 36 % in 2004 to 43 % in 2008. However, there are still disparities in the use of safe drinking water between urban and rural areas – 70 % versus 30 %, respectively – according to 2008 data.
Prepared by sba-Ecosys p. 25 January 2012
Figure 2 : Access to services for people living in informal settlements
4. Energy is the fourth link. Access to energy is a highly sensitive and crosscutting issue when poverty is taken into account. About 90 % of the rural population and the majority of urban dwellers rely on firewood and charcoal for domestic uses15 and don’t count on any other viable alternatives. The use of wood and charcoal by households leads to deforestation and generates high levels of indoor air pollution, whose victims might predominantly be women and children.
Identifying low-cost energy saving technologies to supply urban households in order to reduce wood consumption constitutes a key challenge. The National Energy Fund (Fundo Nacional de Energia) for example tested renewable sources of energy, such as solar and wind in a few communities. Note that in other developing countries such as Mali or Burkina Faso, local surveys have shown that the use of modern fuel (butane for example) was strongly and positively correlated to the place of living (urban) and the level of income. Poverty reduction thus seems to constitute a pre-condition to a more sustainable use of energy source (forest exploitation) as well as to the development of a more efficient and modern energy generation (electrification, natural gas).
5. Poor people are generally also more exposed to natural disasters. This is an important issue in Mozambique, since the country is one of the most vulnerable African countries to extreme weather events16 (cyclones, floods, droughts). Areas near rivers and along the coast (South and Centre parts of the country) are most concerned. These areas attract large populations, and more particularly the poorest ones, so that natural disasters have large impact on the poorest classes of society (see Box 1).
Since 2007, extreme climatic events might have killed 38 people and destroyed 2000 ha of crop fields (in 2011 in the Zambezi valley). The Government of Mozambique has strengthened the implementation of specific policies for managing disasters and mitigation actions. The disaster management has been incorporated as a crosscutting issue in the 2005-2009 five-year plan and
15
In Mozambique, it appears that, among the urban consumers, the shares of charcoal and firewood for cooking are respectively 51.2 % and 9.9 %. 16
Climate change generates more frequent and larger natural disasters.
Prepared by sba-Ecosys p. 26 January 2012
the 2006-2009 Action Plan for the Reduction of Absolute Poverty (PARPA) II. The PARP 2011-2014 considers measures to reduce disaster risks as a priority.
Box 1 : Environment and poverty distribution in Mozambique
Table 2 indicates how population, households and poverty are distributed on the coastal districts. Larger population seems to be correlated with a higher availability of environmental resources and a better climate. The coastline offers indeed more natural resources such as timber from mangroves as well as fish to supplement their living as source of income. The rivers offer agriculture potentialities, including irrigated agriculture.
Table 2 : Poverty in the coastal Districts of Mozambique
Overall, the proper management of natural resources appears to be crucial since the income and living conditions of the rural population directly depends upon the exploitation of free and abundant natural resources (soil, water, forest and fish). Access to environmental resources as well as their use and non-use values have thus to be managed and controlled.
Prepared by sba-Ecosys p. 27 January 2012
The difficulty for recognizing and taking actions according to the previous linkages between environment, poverty and the economy lies in the fact that such interactions are not measured in economic terms and correspond to some “physical or non-monetary” incomes. The present report will shed light on this issue and part II will propose a value for the environment and natural resources in Mozambique. It will more particularly demonstrate that the benefits (avoided damage costs) of environmental preservation exceed its remediation costs. It will also try to identify when such actions are more profitable to the poor.
2.3. Agriculture
a) Increasing agricultural production and productivity
Agriculture is a major economic activity in Mozambique and contributes largely to the VA created in the country. 80 % of the active population17 works in agriculture. Of these, about 90 % to 95 % work in the family farms and 5 % to 10 % in state owned and commercial farms. In 2006, Mozambique counted around 3.5 million family farmers working on small production area (lower than 1 hectare on average). Agriculture plays an important role as a source of income for around 80 % of the population. As already indicated, this population is poor and subsistence agriculture constitutes a significant and necessary source of food for them.
The potential for agricultural growth is significant. Agriculture disposes of large areas of arable land (36 million ha); around 7.5 millions ha (20%) are under cultivation (Marzoli, 2007). There is thus a large potential for developing agricultural production in Mozambique by increasing the cultivated areas and increasing efficiency in agricultural practices. Growth is possible for all cash crops (cotton, tobacco, and cashew) and food crops (maize trade with Malawi, rice trade in the subcontinent, horticulture to United Arab Emirates). One of the general objectives of the PARP 2011-2014 is to increase agricultural production and productivity, in order to secure the food supply and reduce the incidence of poverty. Four main reasons explain the currently low agricultural production and productivity.
The first reason of the actual low production lies in the lack of competitiveness of the Mozambican agriculture. Investing in agricultural commercial activities is thus not economically attractive (see the study on the Beira corridor, 2010). Low competitiveness is explained by:
1. High transportation costs (at least in the Beira region where they are transported at nearly 10 cents/USD/km); they are significantly higher than in other parts of the world and relatively high even by African standards).
2. Expensive agricultural inputs (improved seeds, fertilizers, insecticides and breeding stock and feed rations). Moreover, there are no supply chains for them due to the low demand.
3. Lack of access to affordable infrastructure services (electricity grid connections, water supply for irrigation and feeder roads).
4. Expensive base lending rate at above 5 %, on top of which commercial banks typically charge a 3 to 5 % margin for agricultural loans. Few small and medium sized early stage farming ventures are able to pay 18–20 % per annum for finance and be able to generate a profit.
5. Finally, the lack of skilled farm workers and experienced farm managers creates a demand for outsourcing supervisory staff thus the resulting costs are very high.
17
This seems to contradict the statement that 70 % of the population lives in rural areas. Such data inconsistencies are typical of the context of a developing country. However, it seems that when reports evoke 80 % of people active in agriculture, they consider the active population (and not the whole population) as the denominator.
Prepared by sba-Ecosys p. 28 January 2012
The second reason is that agricultural production is characterized by low yields per hectare, estimated at around 1.3 t/ha for maize for example, while, according to FAO statistics, it reaches 2.8 t/ha on average in developing countries for 2002. Such figures can be explained:
1. By low mechanisation and previously mentioned low use of fertilizers. The low use of agricultural inputs, such as tractors and ploughs, fertilizers and pesticides since only 5 % of the farmers apply them. On average, less than 8 kg/ha of fertilisers (against 100 kg/ha as a basic reference) are used. However, some excessive use of fertilizers has been reported.
2. In general, soils can be classified as having low to moderate natural fertility (Maris et al., 2009). Soils are indeed low in effective exchange capacity, moderate in organic matter, moderate to strongly acidic, moderately weathered, and moderate to high in mineral absorption capacity.
The third reason is that the potential for agricultural growth is also challenged by soil degradation, which constitutes the main issue in many African countries. According to FAO (2005), 20 % of total agricultural land has been severely degraded in Africa. The current status of land degradation in Mozambique doesn’t seem to be alarming. However, this statement rests on the fact that only a small proportion of available land is used annually for agriculture. It is not based on the state of degradation of the used land.
Mozambique is affected by several types of land degradation: erosion due to water and wind, overgrazing and increased salinity; however, no monitoring is done. The erosion control strategy aiming at identifying sensitive areas is still under preparation. In Mozambique, the vast majority of soils are indeed sensitive to erosion as they are either alluvial soils resulting from salt deposits or sodic soils18 from lake and river origin. Additionally, a INGC (2009) study states that the level of salinization caused by marine water intrusion will worsen in coastal areas.
The North and Central zones, which are the most promising areas for agricultural development in term of climate, also appear to be the most sensitive to erosion. A land management program is thus highly needed, otherwise soil losses will continuously jeopardize agricultural yield and food security. Note also that the use of pesticide and fertilizers might be not only part of the solution but might also generate new problems. Examining the use of pesticides, the Cotton Institute concludes that pesticides were poorly handled in Mozambique by farmers due to lack of training. The Ministry of Agriculture (MINAG) submitted a new pesticide regulation proposal that aims to improve pesticide registration system and avoid accumulation19.
Finally, agricultural practices are also inefficient. Slash and burn practices for soil preparation cause soil loss and ecosystem degradation (deforestation and loss of species). Between 2000 and 2002, agricultural practices have been the main source of deforestation, around 8 % (or 4.4 millions ha) of the 54.8 millions ha covered by forests and woody vegetation (Zucula, 2003)20.
18 Soils with high levels of exchangeable sodium and low levels of total salts are called sodic soils. Sodic soils may impact plant growth by: 1.) Specific toxicity to sodium sensitive plants; 2.) Nutrient deficiencies or imbalances; 3.) High pH; and 4.) Spread of soil particles that causes poor physical condition of the soil. Sodic soils are poorly drained and tend to crust. They respond to continued use of good irrigation water, good irrigation methods, and good cropping practices. 19 In the 1980s and 1990s, the civil war affected agricultural production and resulted in an accumulation of unused pesticides which became obsolete. In 2000, the Ministry of Agriculture (MINAG) commissioned a project to identify and eliminate obsolete pesticides; about 334 tons out of 384 identified were eliminated (32 tons of DDT, dangerous and banned pesticide, were eliminated).
20 Uncontrolled fires lead not only to deforestation but also to high air emissions. Tyson et. al. (1996) and Swap et. al. (2002) found that the regional interest in monitoring aerosols (i.e. particles) in the Southern Africa region has increased due to recognition of large-scale recirculation patterns of aerosols in the subcontinent and also due to the existence of stable layers which, according to Cosijn & Tyson (1996), resulted in accumulation of a substantial layer of aerosols in the subcontinent. Cumbana (2003) noted that biomass burning was the main source of aerosols in the
Prepared by sba-Ecosys p. 29 January 2012
%
%
%
%
%
%
%%
%
%
%
%
%
%
%
%
%
%
%
%
%
%
%
%
%
%
%
%
%
%
%
%
%
%%
%
%%
%
%
%
%
%
%
%
%
%
%
%
%
%
%
%
%
%%
%
%
%
%
%
%
%
%
%
%
%
%
%%
%
%
%%
%%
%
%
%
%
%
%
%
%
%
%
%
%
%
%
%
%
%
%
%
%
%
%
%
%
%
%
%
%
%
%
%
%
%
%
%
%
%
%
%
%
%
%
%
%
%
%
%
%
%
%
%
%
%
%
%
% % %
%
%
%
%
%
%
%
%
%
%
%
%
%
%
%
%
%
%
%
%
%
%
%
%
%
%
%
%
%
%
%
%
%
%
%
%
%
%%
%
%
%
%
%
%
%
%
%
%
%
%
%
%
%
%
%
%
%
%
%
%
%
%
%
%
%%
%
%
%
%
%
%
%
%
%
%
%
%
%
%
%
%
%
%
%
%
%
%
%
%
%
%
%
%
%
%
%
%
%
%%
%
%
%%
%
%
%
%
%
%
%
%
%
%
%
%
%
%
%
%
%
%
%
%
%
%
%
%
%
%
%
%
%
%
%
%
%
%
%
%%
%
%
%
%
%%%
%
%
%
%
%
%
%
%
%
%
%
%
%
%
%
%
%
%
%
%
%
%
%%
%
%
N
60 0 60 120 Kilom eters
Risco de erosão
Baixo
Médio
Alto
Subfactores de erosão% Declive% Erosidibilidade do solo% Erosão pluv ial
Costa
Fronteira
Limite da província
% Capital do país
% Capital provinc ial
Fonte: E rosion Hazard Ma p, 1:2 00 0 0 00, 19 86
Inhambane
Maputo
Tete
Lichinga
Matola
Nampula
Pemba
Quelimane
Beira
Chimoio
Xai - Xai
Figure 3 : Soil erosion in Mozambique
atmosphere followed by industrial activities. Cumbana (2003) and Schwela (2007) point to uncontrolled fires in rural areas, mainly in the northern region (which includes Niassa, Cabo Delgado and Nampula provinces) and central region (covering the provinces of Zambézia, Tete, Sofala and Manica), as a major source of emissions of air pollutants into the atmosphere. In a study conducted over the Inhaca Island, southern Mozambique, Queface et al. (2003) suggest a high contribution of biomass burning in air pollution content in the study area. However, as far as WHO statistic are concerned, outdoor air pollution has rather low consequences on the health of the population in Mozambique.
Prepared by sba-Ecosys p. 30 January 2012
Figure 4 : Agriculture potential in Mozambique
Agriculture is thus considered as representing a significant growth potential for Mozambique and also a potentially significant source of environmental damage. Caution is needed since increasing agricultural production and productivity might exacerbate environmental impact and thus deteriorate agricultural productivity in the medium term. Resources for monitoring the impact of agricultural practices on soil productivity and deforestation as well as identifying the most cost-efficient techniques for preserving soils and decreasing costs (crop rotation21; for example) are thus highly needed.
21 Crop rotation avoids a decrease in soil fertility, as growing the same crop in the same place for many years in a row disproportionately depletes the soil of certain nutrients. It is a type of cultural control that is also used to control pests and diseases that can become established in the soil over time. The changing of crops in a sequence tends to decrease the population level of pests. It thus decreases the need of fertilizers and pesticides.
Mozambique possesses large amount of mineral resources including ilmenite (Corridor Sands and Moma projects), tantalite (Marropino and Morrua mines), coal (Chipanga IX and Moatize mines), bauxite, gold, and gemstones. (Mozambique has also natural gas, exported via pipelines to South Africa). The potential of developing mining activities remains large in Mozambique. Actually, most of minerals are exported without processing, leading to significant losses in jobs and value added (VA) for Mozambique.
Under Mozambique’s mining regulations, foreign and national companies can apply for licences to engage in prospecting and research and ultimately obtain mining concessions. Mining certificates for small-scale activities are reserved to Mozambicans. Concessions are also reserved to Mozambicans engaged in artisanal activity and areas are set aside for this purpose.
Mining generates significant income in rural areas. It does not however generate much income for the poor population. It rather negatively impacts the rural population by changing their way of living and polluting their immediate environment. Mining is also affecting other potential sources of income such as tourism and agriculture. It requires indeed clearing forests, followed by burning of vegetation in order to build necessary infrastructure such as roads.
Coal mining activities generate air pollution. Gold mining generates considerable water pollution due to the use of mercury. The Mussapa and Pungue rivers in Manica are reported to be polluted. Negative effects on public health and on the activities downstream of these rivers (especially on agriculture) are potentially high and of long term. Mercury level in Munhena miners’ breath in the Manica Province was 8.23 g/m3 in average, with some reaching more than 50 g/m3, that is 50 times higher than the established WHO guideline for maximum public exposure to mercury vapour (Global Mercury Project 2005).
Solutions exist in the form of clean technologies or better topographic demarcation of exploration places. However, mining remains difficult to control since informal mining constitutes around 70 % of the sector activity22 and due to a weak institutional framework there is no strong monitoring of mining activities.
According to the law, mining activities have to comply with specific environmental impact assessment regulations, which cover resettlement aspects. For example, communities have been compensated when the gas pipeline to South Africa was built. It however remains unclear if the affected communities have been compensated correctly. In Tete city, a resettlement program is underway following the development of coal mining activities. Resettlements have proven to be failing their objectives as many people see their socio-economic situation worsening after resettlement.
In Mozambique, no documenting nor monitoring of the benefits (employment, public service, better transportation) and the costs (pollution, rising price) of mining activities can be done with enough precision due to insufficient and incomplete data. There is thus a need not only to strengthen the environmental constraints for the sector but also to monitor more closely the mining activities considering its economic (output, VA), social (employment, resettlements, wage rates, compensation payments) and environmental (use of chemical products, wastewater facilities, deforestation) dimensions.
2.5 Fisheries
Mozambique has abundant marine resources. Fish constitutes a source of income and food for rural people living along the coastline and near rivers. Fishing comprises subsistence, small-scale
22 USAID Land Tenure and Property Rights Portal at http://usaidlandtenure.net/
artisanal fishermen as well as commercial fishing companies. Official statistics tend thus to underestimate the importance of fishing in Mozambique (see part III, section 2.3).
Officially, the fisheries sector contributes around 2.4 % to GDP. In 2008, official numbers23 indicate an industrial and semi-industrial production of 15’978 tons, representing USD 63’077’00024. Artisanal fishing represents in 2008 USD 236'127'000. Applying the unit prices of industrial and semi-industrial fishing, artisanal fishing could reach approximately 60'000 t/y. The largest contribution comes from shrimp fishing in shallow waters (79 %).
These figures however are not capturing informal fishing. Fishing, as agriculture, directly benefits households since small-scale fishing (including informal and artisanal production) accounts for 84 % of catches while industrial fishing accounts for around 15 %. It remains however not clear where semi-industrial production belongs to. The emerging aquaculture activity accounts for around 1 %.
Since the population living near water bodies and along the coastal belt is large (nearly half the total population), we may fear that such high density along coastal areas is putting pressure on the natural resources.
Unsustainable fishing methods (such as drag-net fishery) contribute to the destruction of marine resources; they have negative consequences on the balance of species and fish stocks due to the indiscriminate catch of all fish including juveniles. A number of studies indicate disruption in the food chain and fish population dynamics with consequences on reduced reproductive efficiency (Bandeira, 2007). Mota et al. (2002) found out that coral reefs in the Quirimbas Archipelago and Mozambique Island were severely affected by the 1997-1998 bleaching from storms and cyclones that occurred in the aftermath of El Nino. As a result, they observed substantial amounts of dead corals. These authors report that when coral reefs are in poor condition they bear less fish.
Mangroves are already heavily exploited for the use of timber for cooking, building and charcoal production, which also negatively affects the functioning of the ecosystem in these areas and the fish capture. For example, the degradation of mangroves along Maputo bay has resulted in a drastic reduction of fish stocks. Such statement does not concern however all the coastline of Mozambique. Coastal activities might also affect the protection of coral reef, facilitate sedimentation (siltation) and increase erosion (UNEP and IISD, 2005; Norfolk, 2004 and Albano, 2004). Comparing heavily degraded reefs and protected sites, Mota et al. (2000) found out that the degradation of coral reefs increased over time with signs of fishing pressure such as the dominance of small size catch and relatively more herbivore fish. According to Wilkinson & Buddemeier, the human dependency on reefs for food, materials and income is high and tends to increase (Wilkinson & Buddemeier, 1994). Studying the role of marine resources, Hill (2005) found out that they play a role in livelihood varying from being a source of nutrition, to being a source of cash for subsistence and a social function by balancing households’ inequalities.
Already in 1988, the UNEP report considered the marine environment in Mozambique as under serious threat of degradation (as reported in Moyo et al. 1993). Research regarding marine ecosystems pollution is scarce. Bandeira et al. (in prep.) show that there is bacteriological pollution through sewage, heavy metals, oil, and aerosol hydrocarbons in rivers and along the coastline near Maputo. According to Louro & Pereira (2004), levels of microbiological pollution remain negligible in main Maputo recreation beaches except for the Costa do Sol. Böhlmark (2003) found out that the levels of heavy metals detected in the Maputo bay are low according to
23 A Pesca em Moçambique http://www.revistade marinha.com/index
24 Ministério das Pescas, Direcção nacional de Economia Pesqueira/Instituto Nacional de Estatística
agreed healthy limits (cadmium and lead). However, concentrations of iron and chromium are respectively 3 and 15 times higher than standard.
2.6 Industry
The degree of industrialization of Mozambique is low despite the recent and rapid growth of this sector. The manufacturing industry leads with large-scale projects and several processing industries, representing 74 % of national export value. The contribution of industries to the GDP has reached 12 % of GDP in 2008, with a slight increase principally due to the Mozal mega-project25 (an aluminium smelter project). MICOA (2010) states that about 90 % of the companies operating in the manufacturing sector are small-scale enterprises counting less than 25 employees26 and located around main cities27. They mainly work in the manufacturing of sugar, flour, beer, mineral water, cement, soap, certain galvanized steel products, and cigarettes.
Industries tend to offer higher wages than agriculture and fishing. It appears thus to be a viable solution to poverty reduction. However, the prospection of better wages attracted many people to move near cities, while only a small proportion of them will effectively get access to a job. This strengthens urban migration and the development of informal settlements (as exposed earlier).
Environmental impacts by industries are observed in rather small areas located around large cities such as Maputo, Tete city, Beira and Matola. However, there are no detailed studies to determine the magnitude of pollution. There is some evidence that the cement factory in Matola has faced difficulties with its filtering systems. In addition to that, the government authorized Mozal in 2010 to perform emissions based on the by-pass system in order to allow technology change in its filter system. According to experts' opinions, industrial pollution is due to the use of out-dated equipment and technologies and weak regulation and control on hazardous wastes.
Closely related to industries, transportation activities constitute another main source of environmental concern. The Mozambique Channel is indeed the route of large oil tankers and there is neither control for tank cleaning nor a contingency plan for oil spills. In the sea, "accidental" discharges of oils as well as the illegal cleaning of tanks are indeed a source of oil pollution (see Haapkyla et al., 2007). Spillages of hazardous cargo by ships in the port areas have also been reported in the dredging activities and operations of cargo handling. According to Dove (2003), the oil spill that occurred in 1992 near the Bay of Maputo contaminated seafood (it was noted that the levels of oils reached 27 micrograms/g in clams; values above 2 micrograms/g are considered as abnormal). As seen above, there are conflicting evidences on the levels of water pollutants in the Maputo Bay. Maia (1999) noted that there is apparently an increased concentration of metals at the points of sewage discharge in the Maputo port area. Citing Fernandes (1995) and Anon Mozambique (2006), UNEP-GEF (2007) reported that heavy metals (particularly lead) has been found in the Maputo Port and in Nacala Bay, Nampula Province. However, Achimo (2002) states that the Maputo Bay is clean and unpolluted with regards to aluminium, iron, cobalt, chromium, copper, nickel and zinc. Furthermore, Bandeira et al. (in prep.) states that the coastal area on the outskirts of Maputo has high levels of seaweeds. According to Lobban & Harrison (1997), the socio-economic consequences of microbiological contamination and eutrophication in the West Indian region (of which Mozambique is part) include human health risk by contact during recreation, through ingestion of polluted seafood and reduction in tourism opportunities due to loss of aesthetic value and risks to humans.
25 In 2005, the authorities estimated that 2/3 of industrial activity resulted from Mozal
26 There are a total of more than 8000 registered companies: 9 companies rank as large-scale project; 59 are classified as medium scale; 577 are classified as small scale and more than 7’800 are classified as micro scale industries.
27 The city and province of Maputo account for 44 % of the sector and Tete for 11 %.
Prepared by sba-Ecosys p. 34 January 2012
Actual evidence on pollution levels is clearly contradictory and information is lacking in Mozambique. A closer monitoring is thus again required. The authorities clearly understood the relevance of this issue as they drafted the Preliminary Regulations on the Prevention of Pollution and Protection of Marine and Coastal Environment in 200628.
2.7. Tourism
Mozambique’s tourism potential is largely untapped (in relation to other destinations in the Indian Ocean)29, but is developing rapidly30. Tourism is attracting substantial levels of foreign direct investment, with close to USD 1 billion in investment projects approved in 2007. Tourism could constitute a promising activity for poverty reduction since it concerns also rural areas along the coastline. It creates jobs and it is possible to minimise environmental impacts by applying appropriate measures. Tourism requires however the development of infrastructure (transport) and skilled people.
Regarding mass tourism activities, they could rather be linked to a greater burden on natural areas and habitats. However, analyses (see, for example, the meso-projects realized by the Swiss development cooperation from 2001 to 2008, see www.meso-platform.org) tend to show that tourism, compared to industrial activities, lead to relatively lower environmental damages compared to the generated income. Furthermore, sustainable tourism has to be pursued by limiting the impact of tourism activities on the ecosystem. In such perspective, ecotourism should be encouraged.
3. The institutional context
This section first reviews the environmental regulations in Mozambique, secondly examines their linkages with poverty and finally, focuses on the way public sector resources are allocated for the environment.
3.1 Review of regulations on natural resources and the environment
The Mozambican Constitution states that the people have a right to live in a clean environment and to use the natural resources for their benefit without harming their availability and quality for the next generation. In order to guarantee the previous statement an institutional and legal framework had to be adopted.
In 1995, the Ministry for Coordination of Environmental Affairs (Ministério para a Coordenação da Acção Ambiental - MICOA) and a National Environmental Management Program (NEMP) were established. In 1997, the Environmental law (Law Nº 20/97) was passed. It provided the legal framework for managing the use of natural resources and the outflows of pollutants into the environment. It also aimed at ensuring the sustainable development of Mozambique.
28 They aim at preventing pollution from illegal discharges by vessels, platforms or land-based sources as well as the establishment of legal bases for the protection and conservation of public maritime, fluvial and lacustrine ecosystems. 29 The direct contribution of tourism to Mozambique’s economy was estimated by the authorities at 2.5 % of GDP in 2003. In comparison, tourism’s share of GDP is about 6.9 % on average in sub-Saharan Africa, 8 % in South Africa, and 10.2 % worldwide.
30 USAID (2004).
Prepared by sba-Ecosys p. 35 January 2012
The Land law (Law Nº 19/97) constitutes another important regulation for the management of natural resources. It more particularly contributes to the protection and management of the environment as it regulates the use of land and natural resources. It states that all Mozambican have a right to use the land. In accordance, land cannot be bought or sold and all natural resources in Mozambique belong to the State. In other words, no private ownership on resources is possible. The land law does however recognise the rights of people or communities to use the land and sell assets on it. The only possibility of conferring ownership over the right of use on a land is given by the State through renewable concession titles, which are also transferable.
The Land law designates also areas for special protection and conservation (total and partial protection zones). Total protection zones are those for nature conservation or preservation activities and those for state security. Partial protection zones are located in the interior water banks and cover the strip of 100 meters from the natural sources of water. Thus, activities along the rivers or natural sources of water should be carried out respecting this law. More detailed explanation of land law is made in section 2.2.
The Forestry Law regulates the use of forest resources. The Forest and Wildlife Act (Nº 10/99) promotes the conservation, protection and sustainable use of forest and wildlife resources. The Water law (Nº 16/90) regulates the use of watercourses both at the national and regional scale. The Fishery Law provides the management, licensing and control mechanisms for this activity. Environmentally related regulations are also concerned with mining and maritime activities. Table 3 proposes a summary of the major environmental regulations in Mozambique.
Sets the legal framework for an appropriate use and
management of the environment and its components with a
view to establish a sustainable development path in the
country.
Land Law Act No. 19 of 10.01.1997
Establishes regulates access to land use, and therefore is the
basic document guiding the use of space and ownership. It also
designates special protection and conservation zones.
Forestry Law Act n° 10 of 1999 Regulates the use of forest resources
Forestry and Wildlife
Regulation
Regulation n° 12 of
2002
Regulates the use of forest and wild life resources including
delegation of powers to local communities. Sets that 20 % of
forest exploration has to benefit the communities living in the
areas of exploration.
Water Law Act nº 16 de 3-08-
90
Controls the inland waters
Fisheries Law Act No. 3 of 26-11-
90
Regulates the fishing industry. Provides the management,
licensing and control mechanisms of this activity.
Decree for the creation
of the National Service
for Sea Administration
and Supervision
Decree No. 34 of
11.01.1991
Rearranges the maritime authority structure in the country.
Updates the Portuguese administration legislation on the
matter
Sea Act Act No. 4 of
01/04/1996
Regulates the maritime activity in the country and defines the
competent and relevant legal forums
Prepared by sba-Ecosys p. 36 January 2012
Relevant Laws and
Policies Decree Number Some Considerations
Maritime Courts Law Act n° 5 of 04-01-
96
Regulates the maritime activity in the country and defines the
competent and relevant legal forums on the issue
Law of Mines Act No. 14 of 06.26.2002
Recommends that mining activity must be exercised in
compliance with the principles of management and use of
mineral resources as well as environmental protection,
including social, economic and cultural aspects
Local Governments Law Act n° of 18-02-97 Deals with the organization and powers of local governments,
regulating the decentralized functioning of the administration.
It also indicates the rights and duty of local community and
thus concerns the environment.
Local Government Act Act No. 07 of 2003 Enhances the decentralization of decision-making bodies to
provincial and district level. It also indicates the rights and duty
of local community and thus concerns the environment.
The main environmental policies, strategies or programme are presented in the Table 4.
Table 4 : Relevant environmental policy issues
National Environment
Policy
Resolution No. 5 /
95 of 08.03.1995
Ensuring an appropriate quality of life for Mozambican
citizens by ensuring that environmental and natural resources
management is done in such a way that allows these to
maintain their functional and productive capacity in order to
satisfy the present and future generations
National Water Policy Resolution No. 7 /
95 of 08.08.1995
Ensuring a better use of available water resources for all
purposes through the sustainable planning of their use, aiming
to satisfy the needs of the communities and development of the
national economy
Agricultural Policy Resolution No.
11/95 of
10/31/1995
Recommends sustainable use of natural resources, particularly
of land resources, enhancing biodiversity conservation,
participation of local authorities and communities in
conservation related activities, control and production of those
activities and the participation of agricultural sector in water
resource management
National Land Policy Resolution No.
10/95 of
10/17/1995
Revives food production. Creates conditions favouring the
development of small-scale (family) agriculture. Promotes
private sector investment
Fisheries Policy Resolution No.
11/96 of
28/05/1996
Integrates fishing activities in the country’s economic
development framework since the fishing sector is
economically important
Forest and Wildlife
Policy and Strategy
Resolution No. 8 /
97, 01/04/1997
Sets guidelines for the coordination of efforts of all
stakeholders contributing to the socio-economic and ecological
development of the country through the protection,
conservation and sustainable use of forest and wildlife
resources
Tourism Policy Resolution No. 14,
4/4/2003
Establishes the institutional approach, planning and control
mechanisms, promotes public-private partnerships and
integration into development policies, and promotes tourism,
cultural preservation, training and other aspects.
Prepared by sba-Ecosys p. 37 January 2012
Tourism Strategy Implements the tourism policy. Constitutes a means of
supporting and promoting tourism and establishing the
requirements for the involvement of various stakeholders in
the implementation of tourism
Rural Development
Strategy
Advocates the coordination mechanisms between state
institutions with other development partners, the expansion of
financing to rural areas, the access to markets and the
improvement of community participation mechanisms.
Environmental
Management National
Program
May 1996 Sets a Master Plan for environmental management in
Mozambique, which aims to make the use of the country’s
natural resources sustainable in the long run, the social and
economic development
Preliminary Draft
Regulations on the
Prevention of
Pollution and
Protection of Marine
and Coastal
Environment
July 17, 2006 Prevents and limits pollution from illegal discharges by vessels,
platforms or land-based sources, off the Mozambican coast, as
well as the establishment of legal bases for the protection and
conservation of the areas that constitute public maritime,
fluvial and lacustrine, beaches, and fragile ecosystems.
Trade policies Sets import and export restrictions to protect consumers,
animal and plant health, as well as the environment
By examining the existing legal framework we can observe that monitoring and oversight mechanisms seem to remain poorly developed. However, the country seems to move in the right direction: a team of environmental inspectors exists. Resources are however still lacking. All over the country, illegal practices in the licensing, operation, transportation, processing and marketing of natural resources (forests, fisheries and mining) are still common. The vast area of the country, poverty, limited human and material resources, poor training and capacities of inspectors constitute the major causes of the phenomena.
3.2 Poverty and natural resources regulations and the environment
As presented in section 3.1, the Land law is rather specific and stipulates that each citizen of Mozambique has the right to use the natural resources but no private ownership is possible. One of the best things of the actual land law is that it opens the opportunity and possibility for anyone to obtain land. Thus, such law seems to constitute a solid basis for the development of small-scale agricultural activities and of rural areas since it should make it easier for small farmers and private investors to coexist harmoniously (by clarifying rights to land occupation).
The Land law and the Forest law recognize also the role of rural communities on resources management and emphasize the need of a consultative process to allocate land or forestry resources. This process takes place through consultation meetings at the local level before the government issues any licenses. Forest and Land laws define access through the DUAT31 based on customary law at the community level. To obtain a DUAT, the investor should undertake a consultation process with the communities. During this process, the local community is expected to find an agreement with the investor. The agreement contains provisions on the mix of
31 The direito de uso e aproveitamento da terra (state-granted land right) is currently Mozambique’s single form of land tenure right. It is exclusive, inheritable and transmittable (subject to state approval).
Prepared by sba-Ecosys p. 38 January 2012
payments to the individual right holders whose land lies within the area requested and jobs and social infrastructure to benefit the whole community. The individual payments are termed “compensations”. The investor does not pay the individual right holders for the land, but compensates them for the loss of crops and assets located on it. Assets are mainly fruit trees (planted) and houses.
If not properly managed and applied, the law presents the danger that land becomes concentrated in the hands of few influential and powerful groups of landlords inducing thus a massive rural exodus, aggravating poverty, and increasing the gap between rich and poor. According to Suca (2001), what is however happening is that the private sector is offering money to poor “owner” of fertile areas located near cities and villages to get their concessions. Poor peasants sell thus "their" land and will have to go further away from infrastructures and face stronger difficulties for creating new agricultural activities. Access to natural resources (land, forests, water, fisheries, pastures, etc.) is however essential for poverty reduction. The livelihoods of rural people without access (or with very limited access) to natural resources are vulnerable, because they face difficulties in obtaining food, accumulating assets, and recovering after natural or market shocks or misfortunes.
Looking at poverty, the problem in Mozambique is not the Land law but its implementation. Again, the country is moving in the right direction but the pace of implementation is slow. Studies confirm also that the process of consultation has been weak in providing a room for the disadvantaged groups (often the poorest one also) to influence decision-making. The legal mechanisms adopted by the government under the Land and Forest acts are not clear on how these groups will be involved in processes of consultation. For example, women do not actively participate in the process. Tanner et al. (2006) refer that “the hierarchies of gender manifest themselves in sometimes unnoticed ways, where for example, it is notable that in all meetings women sat on the ground, talking little and in a low voice in the presence of men. It was observed that in the presence of men, women even stated that they did not speak Portuguese in order not to be encouraged to get involve, but in the absence of men, they expressed themselves quite well, several even acting as translators in the meetings. Traditionally, women are not right holders; they have no “ownership” over the right of using land and resources. Their position is very similar to that of the community in general, vis-à-vis the State – they have a use right acquired by the act of marrying into a specific family. This right is not comparable with “ownership”, and the husband acts like the State, as holder of the “radical title”.
Note that a right acquired through customary channels (historical occupation) is however equivalent to a State-attributed DUAT. This indicates that DUATs acquired through customary occupation by the rural majority must be made visible and real through forms of formalization other than their legal recognition. Women as members of the community have full co-title rights to participate in all decisions about how the community land is used and disposed of (in a consultation for example). Tunner et al. (2004) in their study however state that “women do not exercise rights of co-title together with their husbands, including management of and access to decision making process”. The studies have shown that rural women are not aware of the specific rights they enjoy in the context of the Land law and its constitutional backdrop. This question is of critical importance in a situation where the customary rights of women are obtained through key male figures and/or their membership in family groups, and are immediately put at risk when these males die at an early age (as the HIV/AIDS pandemic takes hold across the country).
Prepared by sba-Ecosys p. 39 January 2012
3.3. Resource allocation for the environment in the public sector
The level of resource allocation provides a crucial basis for measuring the degree of importance given to the environment. As a crosscutting component, the environmental dimension concerns all sectors’ strategies, especially in the implementation, monitoring and evaluation phases where there is a direct link to the levels of resource allocation. These resources may be human, material and financial. A study of the PEI is currently addressing the question of the public environmental expenditure (definition and measurement).
In Mozambique, it appears that when environmental expenditures are not financed separately or through specific departments and administrative units, or through vertical funds or projects, they tend to be listed in the action plans but then face difficulties in being materialized. The State budget is indeed scarce and the way it is structured does not favour the link between activities and resources, particularly at provincial and district levels. Budgeting guidelines do not capture properly environmental issues. The environmental management actions are thus not considered as priorities when it comes to financing. The health sector at the district level offers rich examples to illustrate this phenomenon. It is only when funds for environmental management are somehow vertical or in the form of defined projects that the actual allocation increases. However, the vertical funds and projects can be viewed as not facilitating integration between sectors.
Another difficulty rests in the fact that Mozambique is characterized by a multiplicity of budgeting systems, as well as several promotion funds handled by different stakeholders (government, donors, NGOs, etc.). Some of the funds have been more conducive to the implementation of the environmental agenda but others have been of little or no value. There are however hopes that problems related to the budget structure (and that hinder the link between activities and resource allocations) are in process of being solved due to the adoption of the "program budgeting"32. Table 5 presents an overview of the models used for budgeting.
Table 5 : Budgeting models according to the sectors under review
Sectors Budgeting Models Comments
Energy It is using part of the budget of the
National Directorate.
Difficulty of separation by the
Economic Classifier to the % of the
budget to be applied to the environment
sector.
Vertical funds with an environmental
component for specific projects e.g. of
great dimension in the energy sector,
CDM, etc.
Vertical funds tend to offer greater assurance than
the funds allocated which will actually be used for the
environmental component. Funds from the State
Budget presented problems, mainly related to the
classification of spending and revenue that does not
facilitate the connection of planned activities and
resource allocations, especially at provincial and
district levels.
Mines Department’s own budget, 100% for
planned activities in the field of
environment
It would be beneficial to have a specific department
for the environment and a budget unit. The allocation
of resources in itself seems to be scanty (mainly just
to sustain the monitoring of ESIAs.
Health The department at the central level is
also a budget unit. The same is not true
at provincial and district levels
At the central level, the funds are for the
environmental component. At provincial and district
levels, there is the problem of classification, i.e. the
difficulty of making a direct link between planned
activities and resources.
32 It is called SISTAFE and is almost already in place at the central level, in the consolidation process at the
provincial level and it will then be transferred to the district level.
Prepared by sba-Ecosys p. 40 January 2012
Sectors Budgeting Models Comments
Tourism The sub-sector of conservation areas has
its own budget which facilitates the
allocation of resources.
The other sub-sectors are also subject to the problem
of classification.
Agriculture Areas with environmental weight
(especially forests) have their own
budget.
Besides the general shortage of funds even for areas
of high environmental burden, other areas (e.g.
agriculture extension, livestock, etc.) suffer from the
classification problem. The end result is that there is a
tendency of doing very little in the environmental
area or it competes with other priorities and winning
is not guaranteed.
Public Works
and Housing
For roads and water supply projects the
budget tends to have its own funds for
environmental management (especially
ESIAs and the monitoring and
evaluation)
The vertical funds for sub-sectors favour greater
consistency to the consideration of environmental
issues in the interventions of these sub-sectors but
these tend to be scanty and associated with specific
projects. Roads and water (urban) have indications of
spending more on strengthening comprehensive and
strategic actions (studies, systems development,
procedures, training / coaching, etc.)
Fisheries Areas with higher environmental burden
have their own budget, mainly to cover
the standards, control and surveillance
areas.
Given the paucity of resources, the use of funds for
the environment suffers from the problem of the
classifier.
Mozambique has developed the "General Budget Support (GBS)"33. This monitoring framework provides a mechanism for strategic dialogue between government and development partners over the policy and reform processes which should be prioritised. This offers the prospect of placing environmental policy and sustainable natural resource management more firmly amongst the policy priorities of the Developing Countries receiving GBS. In Mozambique, the annual budget, the quarterly budget execution reports and the annual accounts have thus become major subjects of dialogue between governments and their GBS partners. This is promising.
However, such dialogue is undertaken within technical working groups and is conducted in a relatively informal way, not directly linked to decisions on annual GBS disbursements but it is nevertheless an influential dialogue, which puts information on public spending into the public domain and helps to ensure greater consistency between stated priorities and actual spending. Mozambique has been relatively successful in organising a tripartite (Government-Development Partner-Civil Society) sector working group under the leadership of MICOA.
Pursuing the integration of environmental needs into the budgeting cycle is essential in Mozambique and constitutes a critical factor of success. This requires: carrying out strategic environmental assessment in the key sectors and policies, establishing working groups in cross-sectoral domains in order to identify the most suitable approach to mainstreaming the environment into policy debates and planning processes. Equally important is the establishment of a systematic use of main and sub categories of the budget classifications to track environment-related revenues, expenditures and activities.
33 This is seen as the aid modality which is most inherently aligned to national policies and systems. Its increased use holds the promise of addressing the problem of financing environmental objectives in a more creative way. Budget support can provide substantially increased and highly flexible funding for public sector budgets, through mechanisms which are low in transaction costs, serve to strengthen national financial management and accountability systems and give the beneficiary country a high degree of control over the use of the resources.
Prepared by sba-Ecosys p. 41 January 2012
III. ANALYZING AND MEASURING THE LINKS BETWEEN THE
ENVIRONMENT AND THE ECONOMY
1. Introduction
Environmental degradation and unsustainable use of natural resources have a direct negative impact not only on the economic activity and overall efficiency but also on the health and quality of life of the population. Such consequences are twofold:
First, the impacts of environmental use and abuse have distributive consequences. Segments of the population are indeed more likely to benefit from environmental resources and amenities while others are more likely to cause environmental degradation. Global environmental problems (as climate change) may also have differentiated impacts on people depending on the place of living or the types of economic activities. Such unfair distributive impacts may concern income classes, genders, place of living (rural, urban) and different generations.
The following analysis of the distributive impacts of environmental degradation and natural resources uses in Mozambique will focus on poverty and aims at answering the following two questions:
To what extent is the use of environmental resources more or less favourable to the poorest among the Mozambican population?
To what extent, the poorest among the Mozambican population are concerned by environmental degradation throughout the country?
As we will see, the distributive consequences of environmental degradation are well known. However, the magnitude (or the relative weight) of theses consequences remains poorly identified in the case of Mozambique. In part III of this report, we will propose and apply a methodology based on the confrontation of the existing literature and the opinions of local stakeholders and experts for quantifying the major linkages between poverty and the environment in Mozambique.
Second, environmental degradation and natural resource use generate welfare loss for the population. Such allocative issues address the question of the magnitude of environmental damages, the relative costs and benefits associated with environmental preservation and the sustainable use of natural resources. It addresses two research questions:
What is the importance of the environment for the Mozambican economy? In other words, what is the contribution of environmental resources to the Mozambican economy?
What are the consequences of environmental degradation on the population and on the economy of the country? What is the welfare loss in relation to pollution levels and natural resources degradation in Mozambique?
These questions are related to the economic appraisal or evaluation of the environment in Mozambique. An economic (monetary) evaluation of the environment is in essence an evaluation of the environmental contribution to the economy and of the economic consequences (costs)
Prepared by sba-Ecosys p. 42 January 2012
that environmental degradation incurs. No value is put on the natural environment itself, i.e. on Nature. Environmental degradation costs are thus linked to economic losses due to their impact on health, lower work productivity or losses of revenue due to soil erosion, air or water pollution. A value (either a benefit or an advantage) will then be linked to an improved environmental quality, to productivity gains and to a higher quality of well-being for the inhabitants. These benefits or advantages will be the result of corrective measures (appraised by the related remediation costs) applied to the environmental degradation observed.
Hence, in real terms, an environmental cost will result from an increase in economic consequences due to a heavier environmental deterioration. Similarly, an economic benefit will be brought on by an improvement in well-being due to a healthier environment. These are then "marginal" values and costs. To make things practical, these definitions of marginality are left out in such a way that the evaluation of the cost of environmental degradation is reported to the "year" rather than to the "margin". The hypothesis of an increasing impact remains, but the economic analysis is undertaken in terms of annual costs of environmental degradation. These degradation costs are opposed to the costs of the corrective measures. Their comparison results in an order of magnitude of the economic advantages or benefits ensuing from adopted actions for the future.
The estimates of the contribution of the environment to the economy as well as the estimates of the costs of environmental degradation (the costs of damages and inefficiencies) and of the corrective measures destined to protect the environment and restore its quality (the costs of remediation) must be considered by order of magnitude. The numbers are neither complete (basic data might be insufficient) nor final (the process of evaluation is continuous and the prospects are provisionally set). Nevertheless, estimates provided allow the representation of the level of gravity of environmental degradation (quantitatively) and the deduction of an economic rationale in order to improve the urban community’s management in its relationship with the environment, identify priority actions and carry out relevant simulations involving these actions.
Part III is organized as follows. First, the distributive consequences of environmental degradation and natural resources uses in Mozambique are analyzed and appraised. Second, the contribution of the environment to the Mozambican economy is estimated. Third, the environmental damages and remediation cost are measured in economic terms. This allows setting priority for environmental policies and expenditure in Mozambique by providing empirical proofs on the net benefit of environmental remediation opportunities. Finally, the results of the distributive and allocative analyses are grouped in a common setting. To our knowledge, such integration of both types of analysis has not been done before in Africa. We will thus assign space to present the methodology.
2. The contribution of the environment to the economy
2.1 Methodology
In similar studies (see for example, the PEI studies34 in Mali, Burkina Faso or Mauritania), the contribution of the environment to the economy is captured by measuring the value added generated by the primary sector. This is due to the fact that the primary sector is strongly related to the environment as it directly uses environmental inputs in its production process (soils, rain, sun, minerals). The primary sector is defined as the activities that extract or harvest products from the earth. Activities associated with the primary sector include agriculture (both subsistence
34
www.unpei.org
Prepared by sba-Ecosys p. 43 January 2012
and commercial), mining, forestry, farming, grazing, hunting and gathering, fishing, and quarrying.
It is however clear that the contribution of the environment to the economy is not limited to the primary sector and other activities might rest on the environment. For example, tourism also appears to be strongly related to the environment in Mozambique. We could even argue that all economic activities rest on some environmental goods and services, at least indirectly. Accordingly, the whole economic output (100 % of the GDP) could be considered as being linked to the environment. Therefore, an important question to be addressed concerns the impact on welfare (and/or economic output) that a decrease in the availability or the quality of environmental goods and services generates. The estimates of environmental damages done in section 4 intend to answer this question.
Measuring the contribution of the primary sector to the Mozambican economy is straightforward. Examining national statistics will provide relevant information and no further data collection is thus needed. However, official statistics underestimates the importance of the primary sector since they do not consider the volume and value of subsidence activities, which are very important in developing countries (even if no statistics exist on the issue). We will thus propose an estimate of the part of the economic activities that do give place to market transactions. Such analysis is particularly relevant as far as poverty is taken into consideration, it appears indeed that the contribution of the environment is more direct and is less captured in economic transactions when the poorest people are implicated. Subsistence farming for example is a way of reducing the high budget share of food (around 60 % to 80 %) for the poorest households in Africa35.
2.2. The size of the primary sector
The figure 5 below gives a detailed picture of the sources of the VA (sector contribution to GDP) in Mozambique. Figure 1 is built on the basis of official statistics from the Direcção Nacional de Estudos e Análise de Politicas.
The figure below puts in evidence the large contribution of the primary sector, accounting for 25 % of the GDP when agriculture, livestock, fishery and mineral extraction are considered and around 30 % of the GDP when water and electricity production are added to the picture. Looking at time series, the contribution of the primary sector to the GDP amounts approximately to 26.8 % over a period of eleven years (since 1999), of which 24 % is the contribution from agriculture and forestry, 1.8 % from fishery and 1 % from mineral extraction. The contribution of mineral extraction remains rather low but has increased recently due to mega-projects in the mining sector.
The previous results seem in line with other economies of the region. Agriculture represents indeed about 30 % of the GDP in Africa and South Asia; about 20 % in East Asia & Pacific; and about 10 % in Central Asia, Latin America & Caribbean.
Looking at employment, statistics show that more than 80 % of total employment in Mozambique is in the agriculture sector. Fishing counts for around 2 %, forestry 0.8 % and mineral extraction for 0.6 % of total employment. The statistical information on employment remains however lacking.
35 Baiphethi and Jacobs P (2009) quote Ruel et al (1998) as saying that food expenditures can be as much as 60- 80 % of the total income of low-income households. It makes it very difficult to survive on the remaining portion of the income.
Prepared by sba-Ecosys p. 44 January 2012
Figure 5 : GDP composition (in %) in Mozambique
The lack of statistics hinders conducting a proper assessment of the contribution of natural resources to the GDP. For example, the amount of firewood used per household in rural and urban areas is not known in Mozambique.
2.3. Additional estimates
As mentioned in the introduction, official statistics underestimate the size of the primary sector as they do not consider non-market and black market transactions. In this section, we try to provide complementary estimates for filling this gap.
a) Subsistence agriculture and post harvest loss
Subsistence agriculture is a mode of agriculture in which a plot of land produces food to feed the family or the small community working it. Such situation might also happen for fisheries (catching fish for its own consumption) and forestry (wood for its own consumption).
There is no "universal" methodology for calculating the importance of subsistence activities in agriculture, forestry and fishery. Ideally, a survey should be conducted. In absence of such a survey for the purpose of the current study we have made the following assumptions in order to estimate the importance of subsistence agriculture: (i) 80 % of the Mozambican population live in rural areas and live from subsistence farming; (ii) 60 % of them consume maize and 40 % rice36, (iii) The WHO daily recommended kcal per day for each of the crops have been used to estimate the quantities consumed for subsistence, and finally (iv) market prices have been used to estimate their monetary value.
36 This assumption relies on the fact that most of the population in centre and north and the Gaza province in the south have maze as the base of their consumption.
Using these assumptions, the size of informal agriculture is estimated to be 10.4 % of the GDP in 2009. This result is not surprising if we believe that a high percentage of the population lives in rural areas and their living is based on subsistence agriculture.
Another issue is post-harvest grain losses. Losses occur when grain decays or is infested by pests, fungi or microbes, and physical losses are only part of the equation. Losses can also be economic, resulting from low prices and lack of access to markets for poor quality grain, arising from nutritional loss or contaminated food. According to estimates provided by the African Postharvest Losses Information System, physical grain losses prior to processing can range from 10 to 20 %. In Eastern and Southern Africa alone, food losses are valued at USD 1.6 billion per year, or about 13.5 % of the total value of grain production. This could represent 3 % to 7 % of agriculture’s contribution to GDP. However, such losses cannot be considered as a contribution of nature to the economy. In fact, such loss happens because the economic agents do not value such loss sufficiently or because it remains badly informed. Losses are not useful (they do not give utility) for economic agents; they are costs. It would thus be wrong to add it up to the contribution of the environment as we did for subsistence agriculture.
b) Subsistence fisheries and bycatches
Since 2000, fisheries account for 1.5-2% of the GDP and for 2.4% of exportation.
For subsistence fishing, the Ministry of Fishery indicates that artisanal fishing represents 90 % of total fishing in Mozambique of which 80 % is fishing for subsistence (including fishing in interior water). Subsistence fishing concerns thus around 288'000 persons. Assuming that each of them feeds a family of 6 members, then the Mozambican population depending on fishing counts approximately 1'728'000 people.
If the quantity of fish consumed is, according to recommendations from the World Health Organization and supported by the Ministry of Fishery, 7 to 8 kg per capita per year, the seize of subsistence fishing amounts around 0.96 % to 1.47 % of the GDP.
This would also mean that the employment of the sector is underestimated. The fishing sector employs approximately 400'000 people, including those employed in the commercialization related activities. Considering subsistence fishing, this number could be doubled.
Bycatches constitute another issue. It designates the unwanted marine creatures caught in the nets while fishing for other species. No data allow proposing an estimate of the value of bycatches for Mozambique. Furthermore, it was not possible to transfer data from other countries since bycatches vary according to fish species, the infrastructure and the technology used.
c) Forestry and illegal logging
The forest sub-sector’s contribution to the GDP lies between 2.2% and 4% according to recent sources. 2.2 % is indicated by official INE statistics37 and 4.4% by the FAO (2008b). According to older statistics, the contribution from the forestry sector is set about 8.9 % of the GDP in 1989 (FAO, 2000). Of this percentage, 0.2 % represented contribution from forest industry, whereas 8.7 % were earned from non-industrial forestry. In 1983, the forest sector was found to contribute with about 7 % to GDP (Nakala, 1997).
Examining employment, Nhancale et. al. (2009) noted that, excluding fuel wood, charcoal producers and sawn timber producers based in urban areas, the subsector of forest employs
directly about 200,000 persons or 600,000 (between 1.8% and 5.4% of active population) if various forest product harvesters from rural communities, middlemen involved in the timber and non-timber forest products transportation, wholesalers and retailers are included. This represents a substantial proportion of Mozambique man-power. National statistics (INE) evokes 0.2% of active population.
According to the latest data published by the INE (base documents, 2010) and the National Directorate of Land and Wildlife (2009), the fee paid for forest exploitation between 2006 and 2009 amounted to 0.6 % of GDP. 20 % should be given back to the local community.
Table 6 : Total fees revenue for forest exploitation (in MZN)
C. Delgado 6’857’800 73’429 16’851’340 20’953’750 250’000 8’127’300
Total 54’777’670 80’165’218 100’953’297 95’553’614 78’213’913 390’319’951
% to the GDP 0.03 % 0.04 % 0.04 % 0.04 % N.A. 0.06 %
Source: MINAG (DNTerras, 2010); INE (base documents, 2010)
Forestry also seems to provide around 80 % of the country’s needs in energy (Chaposa, 1999). However, according to expert's opinion, some provincial Government Departments seems to badly report the figures on forestry due to institutional weakness. This means that the amount of resources being exploited may be well beyond the actual level of exploration. This may imply that resources are being exploited without being accounted for in the national statistics misleading policy decisions and analysis for poverty reduction and environmental measures.
Furthermore, illegal logging activities are also not accounted for in the GDP. Furtive and illegal forest exploration biases the actual numbers downward. The presence of 500 containers of wood issued for illegal logging in the Pemba port (Cabo Delgado) attests the existence of those practices. According to the forthcoming 2010 ‘Child Poverty and Disparities Study’ carried out by UNICEF Mozambique, commercial logging has increased dramatically, and often illegally, in recent years. Some analysts estimate that tropical hardwoods from slow-growing, semi-arid and dry tropical forests are being depleted at a rate that could see resources exhausted in 5 to 10 years. One 2006 study by ORAM conducted by a researcher concludes that “Asian timber buyers, local business people and members of the Government and their forest services are colluding to strip precious tropical hardwoods, with large quantities of illegal, unprocessed hardwoods being exported through Nacala port in northern Mozambique. The same study estimates that illegal logging is at least as large in scale as legal logging. Based on this, we thus consider illegal logging to account for 4 % of the GDP in Mozambique. Of course, such evidences have to be verified. They clearly show however that the issue of illegal logging have to be examined closely.
Prepared by sba-Ecosys p. 47 January 2012
Furthermore, looking at charcoal production in more details, part of it is not taken into consideration (similar situation as subsistence agriculture and fishery). Using data form the National Directorate of Land and Forest (DNTF) and of the FAO, the amount not accounted for has been estimated to be around 0.11 % and 0.41 % of the GDP.
Finally, non woody products are also part of nature’s contribution to the national economy. According to data (FAO 2000), it is not clear if non-woody products are already included in official statistics. Anyway, no reliable figure of the value of non-woody product could be estimated.
Prepared by sba-Ecosys p. 48 January 2012
d) Hunting
Leisure hunting constitutes also an activity not grasped by official account. The size of the total hunting enclosure area varies according to the source.
According to available data between 2006 and 2008 on the fee revenue from wildlife natural resource (table 7), wildlife contributed on average to 0.01 % to GDP. Such figure tends to show that wildlife contribution is meaningless. However, looking only at the revenue from parks underestimates the contribution of hunting to the GDP, since the VA from bed-night, meals and so on are not considered. Requirements to estimate such figure are a difficult exercise since the available data were not disaggregated into game park visits, meals in the game park areas, and so on. Estimates based on tourism revenues or experiences in other countries appear also to give inconsistent and poorly reliable results.
Similarly, the absence of data on the quantity of animal species prevents us from calculating potential benefits to communities from wildlife. Note that the prices for leisure hunting doubled and even tripled during the past year, thus increasing the importance of leisure hunting in the GDP but also its importance for the local communities involved.
Table 7 : Total fee revenue (in MZN) generated by wildlife renewable resources
Contribution to the GDP 0.016 % 0.011 % 0.0097 % 0.011 %
Source: MICTUR (2009)
For the poorest communities, the fee revenue is important (population living in the buffer areas of conservation is very poor). These populations are benefiting from wildlife with an average of USD 176’513 per year considering that 20 % of royalties are paid back to communities.
The National Reserve Park of Limpopo is among the most important; it contributes by 13 % to the total revenue of hunting area for the government (hunting royalties + park entrance fees). Tchuma Tchatu in Tete province reaches 33 % of total revenues. The hunting blocks in Niassa
Prepared by sba-Ecosys p. 49 January 2012
(9 %) and Reserve Park in Maputo (7 %) are also good contributors. 20 % of the total revenue is given back to the communities.
e) Overall contribution of the environment to the Mozambican economy
Table 8 summarizes the contribution of the environment to the Mozambican economy including informal activities. Results show that such contribution represents almost half of the yearly value added in the country (49 % of GDP). By accounting only for primary sector activity, the contribution of the environment to the economy reaches 47-50 % of GDP.
Note that the figures showed here are rather conservative, since the value for the wood and non-woody products directly consumed by households could not be estimated. The forestry contribution is thus a lower benchmark.
Looking at employment, data show that the primary sector contributes to more than 82 % of the jobs inside the country. However, data on employment are incomplete and it remains unclear how partial and seasonal employment have been computed. However, there is enough evidence to conclude that most of the labour force in Mozambique is directly linked to the use or the exploitation of natural resources. Considering the importance of these jobs, a sound management of natural resources in Mozambique is crucial.
Table 8 : Contribution to GDP (in % of GDP) as well as employment statistics (based on data from 2005 - 2010)
Official Statistics
Unaccounted (subsistence production)
Total contribution
to GDP Employment
Agriculture 23.8 10.6 34.4 79.8
Forestry 2.2 - 4 0.1 - 0.4 2.3 - 4.4 0.2 - 5.4%
Illegal logging 4 4
Fishery 1.4 0.9 - 1.4 2.3 - 2.8 2
Mining 1.1 1.1 0.6
Total contribution to GDP 28.5-30.3 44.1 - 46.7 82.6- 87.8%
Game hunting 0.01 0.01
Tourism 3.2
Total 28.5-30.3 47.3- 49.9
Note that according to AFD (2009), the exploitation of natural capital (renewable and non-renewable natural resources) is however unsustainable since the net genuine saving accounts for 14 %. The AFD (2009) study also indicates that natural resources account for 47-50 % of total Mozambican wealth. This is high compared to the average of other African countries (24 %). According to these results, the population living in rural areas will suffer if renewable natural resources are not properly managed.
Prepared by sba-Ecosys p. 50 January 2012
3. Distributives consequences of environmental degradation and natural resources uses
3.1 Methodology
In order to analyze and monitor quantitatively the link between the environment and poverty, no "universal" and "easy to apply" methodology exists. We thus aim at linking both general findings available in the existing literature (see part I) and the results from an opinion survey aiming at identifying the stringency of the links between poverty and the environment in Mozambique.
3.2. Survey design
The survey’s objective is to appraise the relative relevance of these channels in the case of Mozambique. The survey was addressed to local stakeholders and experts with the aim of identifying their opinions on the distributive impact of environmental degradation in Mozambique. Respondents consisted in people who are professionally involved with the management of the environment and/or poverty in Mozambique.
The aim of this procedure is to:
Confirm the previous "general" findings, i.e. is findings coming from evidence set in other countries or based on theories.
Evaluate the effective importance of each environment poverty linkage.
The survey is based on a questionnaire which asks participants to value the importance of the environmental degradation for each income class (poor, middle, and high). For each type of environmental damage, the participants have to judge if the effect is weak (1), important (3) or in-between (2). The table below gives an example.
Table 9 : Sample of the survey
Effect on Aggregate
indicator low-income middle-income high-income
Lack of access to safe water Coefficient
1, 2 or 3
Coefficient
1, 2 or 3
Coefficient
1, 2 or 3
Lack of sanitation
etc.
For each category of damages, an aggregated indicator has been built according to the following formula:
tcoefficien incomehigh * 0.5 -t coefficien income middle + 2*t coefficien income Low
The criterion was to give greater importance to damage that has an impact on low-income categories, so that a weight of 2 is given to the low-income and 1 to the middle-income while a weight of minus 0.5 is allocated to the high-income category. Different formulas have been tested. Interviewed experts could also propose their own aggregated indicator.
Prepared by sba-Ecosys p. 51 January 2012
3.3. Methodology of the data collection
The survey has been completed by experts in the field (9) as well as by local stakeholders (26). Overall, 35 questionnaires have been filled out38.
The survey design faced several difficulties. First, the intention was to propose broad categories to avoid influencing respondents. For example, we preferred to state "lack of access - water" instead of describing more extensively the damages. This has caused however difficulties as far as some respondents did not exactly know how to interpret the damages. This prevented us from using some of the answers. We could easily identify the problematic element since some respondents pointed out the difficulties in the questionnaire (writing down some clarifications) or asked questions.
The number of completed questionnaires is not sufficient to obtain representative results. Hence, more interviews are needed and further work in this area should complement the evidence. However, the survey should not be considered as the best available methodology for grasping the distributive effects of environmental degradation in Mozambique. We proceeded this way since no local data or indicators allowed us to measure and identify the size and relative importance of these effects.
In order to deepen and improve the analysis, one could develop indicators that would show the distributive consequences of the degradation of the environment in Mozambique. This would constitute a more positive (less subjective) and more scientific method. It would clearly replace the actual analysis. However, such analysis requires an exhaustive data collection in order to specify already available information according to individual’s and community characteristics (income, employment, education, housing, place of living, location, availability of environmental resources, etc.). It also requires a large budget. Table 11 indicates which type of data would be necessary.
The survey offers indeed rapid and preliminary evidences on the stringency of the link between poverty and environment in Mozambique. We believe that such information was better than none. It however should not constitute a reason for not going further on building evidence on this issue. Note that collecting data and complementary evidence is a costly task. Past experiences have shown that, on average, between USD 50’000 and 80’000 per environmental domain is necessary for building a representative data sample.
For the previous reasons, the results of the "distributive" analysis have to be interpreted with caution.
3.4. Results
The results confirm the conclusions issued from the literature review and previous analysis made in Mozambique. However, the survey offers also evidences on the relative importance of the distributive effects. The table 10 presents the aggregated results according to some homogenous categories; table 11 presents them in details.
38 A few responses are still expected.
Prepared by sba-Ecosys p. 52 January 2012
Table 10 : Distributive effect - Main categories
Categories Aggregate indicator
Health effect 5.7
Inefficiency - water 5.6
Natural resources degradation 5.3
Waste 3.4
Amenity 3.0
Inefficiencies - energy and materials 1.7
The conclusions are the following:
There is a large consensus among the persons interviewed. In most cases, the answers are homogeneous. Two exceptions have however been noticed. For indoor and outdoor air pollution, around 25 % of the answers were clearly different stating that the impact of air pollution concerns the whole population while the rest of the sample considering that the impact was larger for poor income groups. The economic literature provides evidence in favour of the second opinion as far as pollution levels are one of the determinants of the values/rents of houses (homes located in polluted areas have lower values).
Health effects as well as economic loss due to natural resource degradation (quality of the resource and access to it) have the largest negative distributive effect (strongest impact on the poor). The survey confirms thus that the health and income of the poorest depend more on environmental quality and resources. Furthermore, people agree to say that this is due to lower access to health services and to palliative measures (for example, the opportunity cost of fertilizer - see Table 11 - is less in disfavour of the low income class).
Inefficiencies in energy and material have no strong impacts on the poor. The survey seems to confirm that the poorest people have no access yet to electricity and many materials so that increasing price due to pervasive inefficiencies (lower available quantity) does not have an impact on them. However, this is not the case for water. The inefficient use of water and the subsequent water loss are judged as having a large impact on the poor.
Waste has also no stronger impacts on the poor but poor people are seen as being more exposed to the negative consequences of landfill. The survey did however not grasp the fact that landfill related activities (collecting and recycling) could be a source of employment and income for local poor communities.
Finally, the loss of amenities is a lower distributive concern. This is especially the case for the beaches. For forest and rural area, the answers are less homogeneous. For beaches, two explanations may be given: First, only rich people can devote time for enjoying the beach. Second, income from tourism benefits more the high-income categories.
Prepared by sba-Ecosys p. 53 January 2012
Table 11 : Distributive effect - Detailed results
Income groups Aggregate
indicator Possible indicators
low middle high
WATER
Illness - unsafe water 3.0 1.8 0.4 6.42 Distribution of DALYs according to
income level and place of living
Lack of access - water 2.4 1.5 0.9 4.59 Access to water in formal and
informal settlements
Water floods and drought 3.0 1.8 0.9 5.99 % of victims from poorer segments
of society
Inefficiencies - urban distribution 2.7 2.3 1.3 5.17 % of water looses according to
community characteristics
Inefficiencies - irrigation 2.8 1.9 0.6 5.97 % of water looses according to
community characteristics
Inefficiencies - man-made distribution 2.6 1.7 0.4 5.73 % of water looses according to
household characteristics
AIR
Illness - outdoor air quality 2.4 2.0 1.4 4.39 Distribution of DALYs according to
income level and place of living
Illness - indoor air quality 3.0 1.7 0.6 6.19 Distribution of DALYs according to
income level and place of living
SOILS | DEFORESTATION | COAST
Amenity of forest and rural area 2.0 1.6 1.4 3.4 Visitors according to income level
and place of living
Amenity of beaches 1.0 2.0 2.4 0.7 Visitors according to income level
and place of living
Soil loss - Agricultural yield loss 2.9 1.9 0.8 5.9 Yield loss according to types of
farmers.
Cost of fertilizers - Opportunity cost 1.9 1.8 1.9 2.8 Use of fertilisers according to types
of farmers.
Deforestation 3.0 1.9 0.6 6.3 Wood use according to type of
households
Coast degradation 2.3 1.7 1.8 3.7 Fishers characteristics according to
coastal degradation
Mangrove loss 2.9 1.4 1.1 5.4 Timber income according to type of
households
WASTE
Cost of collection | opportunity cost 2.0 1.9 3.5 1.4 Type of household living close to
landfill
Collection of waste according to
communities characteristics
Collected industrial waste |
opportunity cost 1.9 2.1 1.9 3.1
Uncollected households waste 2.4 2.1 2.0 3.8
Uncontrolled landfill area 2.7 2.0 1.0 5.5
Recycling not done 2.1 2.0 1.6 3.6 Characterises of workers active in
recycling activities
INEFFICIENCIES
Material loss 2.0 1.7 1.2 3.6 Amount of inputs loss
Prepared by sba-Ecosys p. 54 January 2012
Income groups Aggregate
indicator Possible indicators
low middle high
Energy loss 1.7 1.8 1.6 2.8 Amount of energy loss according to
income level
4. The environmental economic analysis of the Mozambican economy
Environmental protection relies on the knowledge of the causes and the consequences of pollution and natural resources use. Avoiding damages necessitates the formulation of strategies and the adoption of technologies. In order to implement such steps, one needs decision-making tools in order to determine if the planned actions are efficient and profitable. Environmental economic analysis addresses such need by valuing the cost of damages and inefficiencies and the cost of remediation as well as keeping track of their evolution.
4.1. Definitions of CDI, CR and B/C ratios
Environmental economic analysis consists in assessing damage and inefficiency costs arising from an industrial sector and their remediation costs.
Cost of Damages (CD). The costs of environmental degradation are defined as a loss of well-being, from an economic point of view, for a country. Such a loss in well-being can result from (the list is not exhaustive): impacts on the health or welfare of a population (mortality and morbidity due to air or water pollution, an unhealthy environment or workplace, disamenities), lower gains (lower soil productivity, less heritage values due to pollution, reduction of other environmental qualities or capacities, etc.), losses of environmental services or externalities (rivers, lakes, beaches, coastal zones or forests losing their recreational, tourist or simply amenity value). These different losses of well-being are evaluated according to what is materially affected as a result of a given type of pollution (lost number of years in case of a premature death or lost days of work in case of morbidity, lost yields in case of lower soil fertility, etc.) or on a given subjective damage (pollution or aesthetic damage to the environment, nuisance or disturbance).
Cost of Inefficiencies (CI). The cost of inefficiencies in the use of resources entails economic losses in the sense of a waste of resources. These losses vary from excessive leakages in water distribution networks to the absence of energy-saving measures and avoidable losses of materials in production processes. Waste, although partially inevitable, belongs to the economic category of inefficiencies.
From an economic viewpoint, damage or inefficiency is relevant only if there is a direct or indirect, instant or future, impact on human well-being. Thus, avoiding damage from an economic viewpoint is efficient or optimal only if the benefit of the action (the avoided damage) is greater or equal to the cost generated by this action (the remediation cost).
Cost of Remediation (CR). The cost of remediation represents the spending (given the current available knowledge and data) necessary to protect the environment by preventing or restoring its degradation. They also comprise the costs of process or management and necessary control for reducing or preventing wastage (inefficiencies). According to this principle, the remediation costs are at "the least cost" given the available technology. This condition is not always taken into consideration due to the lack of relevant applied technical economic studies. With time, such studies should assist in refining remediation costs.
Benefits/Costs ratios (B/C). Ideally, remedial actions would lead to the elimination of damages and inefficiencies at the lowest possible cost. They would result both in benefits
Prepared by sba-Ecosys p. 55 January 2012
(elimination of damages and inefficiencies) and in costs (those relating to remedial actions). Expressing these benefits and costs in terms of a ratio leads to match up CDI with CR as an approximation of the general ratio Benefits/Costs.
An efficient action would then require that the benefits override costs; the ratio B/C should be higher than one. This ratio is also said to be a measure of the profitability of the remediation.
CDI
CRBenefits
Costs1
If the ratio equals 2, it means that for MZN 1 invested in remediation, a damage of MZN 2 could be avoided.
4.2. Categories of analysis
In order to organize the economic-environmental analysis in a structured manner, traditional environmental domains are considered as follows:
Water
Air
Soil, forest and coast
Waste
Energy and Material
Global environment
Soil, forest and coast belong to the same environmental domain since evaluation procedures are based on similar assumptions.
In order to subsequently guide the economic analysis, each environmental domain is organized into one or more of the following three economic categories:
Health/Quality of life (effects on human health and surroundings);
Natural capital (conservation of natural heritage - environmental goods and services);
Inefficiencies in the use of resources (economic losses, including losses in competitiveness).
4.3. Stages of analysis
The economic-environmental analysis is built on the basis of a four-step protocol.
1) Delimitation of the study. First of all, the limits of the analysis have to be set. The environmental inflows and outflows are identified and quantified (physical dimension).
2) Data collection. It involves the consultation of all available statistical sources both at the local and international level. Interviewing local experts and field visits complement this step. The more the collected data is accurate and relevant, the more the environmental economic analysis will be precise.
3) Environmental economic analysis. This step concerns the monetary valuation. It designates the protocol that transforms into monetary unit the environmental flows measured in physical unit. The resulting CDI and CR are related to the GDP of the
Prepared by sba-Ecosys p. 56 January 2012
country. Finally, the ratios B/C are computed to facilitate results understanding and interpretation.
4) Validation. At the end, the results of the analysis are verified. Two strategies allow checking the accuracy of the results. First of all, a sensitivity analysis is undertaken to verify assumptions and alternatives. Then, results and assumptions are reviewed and validated by involved parties.
4.4. Nature and scope of obtained results
The produced estimates of the costs of environmental degradation (the costs of damages and inefficiencies) and the costs of remediation (destined to protect the environment and restore its quality) must be considered as orders of magnitude. The numbers are neither complete (basic data might be insufficient) nor final (the process of evaluation is continuous). Nevertheless, the estimates provided allow for the representation of the level of gravity of environmental degradation (quantitatively) and for the deduction of an economic rationale in order to improve the management of the production in its relationship with the environment (evaluation of the economic and environmental efficiency of an electro-filter, for example) while priority actions can be identified and relevant simulations involving these actions can be carried out.
Regarding the economic valuation of environmental degradation, evaluation techniques have existed in the literature along with complex demonstrations since the 1970s. However, it is only in early 2000 that the analysis of the reality has been carried out in a complete manner at the national level up to the macro-economic evaluations of the environmental degradation in Algeria, Egypt, Tunisia, etc. (see World Bank and OECD studies). The MESO-economic studies (2001-2008) have provided evidence at the level of the industrial sector (cement, power production, tourism) and urban communities (Agadir, Irbid, Aqaba, Annaba). PEI built similar evidence at the national level (Burkina Faso, Mali, and Mauritania) and sector level (cotton and gold in Burkina Faso, livestock and fisheries in Mauritania).
4.5. The costs of environmental degradation and benefits of remediation
a) Cost of Damage and Inefficiencies (CDI)
Aggregated damage and inefficiency costs in Mozambique amount to 17.5 % of GDP. This percentage represents more than MZN 45 billion (table 12). Such statement means that each year the welfare loss due to environmental degradation and the inefficient use of natural resources and energy equals to almost one fifth of the total economic value created in the country.
CDI are assessed by environmental domains (Water, Air and Noise, Soils and Landscape, Waste as well as Energy and Materials) and by economic categories (Health and Quality of life, Natural capital and finally Inefficiencies).
The figures 6 and 7 show CDI by environmental domains and economic categories.
Energy and material (5.1 % of GDP) and water (4.5 %) are the most affected domains. Then come soils, forest and coasts (3.5%), waste (2.4%) and air (1.4%). Annex 1 presents the way damages and inefficiencies costs have been estimated.
In developing countries, relatively high damages in water and soils, forest and coast are quite common. They are due to a lack of infrastructure for securing water services in urban area and an increased pressure on the resources throughout the countries. The lack of quality and availability of water is a significant source of waterborne diseases. Such diseases generate health costs and strongly affect the productivity of the workforce. The decrease of water availability and the lack
Prepared by sba-Ecosys p. 57 January 2012
of infrastructure have also an opportunity cost for household and firms, since good quality water has to be sourced from further away.
Table 12 : Aggregated CDI
Environmental domains Value
% of the GDP USD MZN
Water 4.5% 326,363,970 12,042,830,487
Air 1.4% 105,751,246 3,902,220,985
Soils, forest and coasts 3.5% 253,054,799 9,337,722,092
Wastes 2.4% 178,006,124 6,568,425,959
Energy and Materials 5.1% 373,920,149 13,797,653,480
Health | Quality of life 8.3% 606,493,645 22,379,615,496
Natural capital 3.1 % 225,770,557 8,330,933,563
Inefficiencies 5.5 % 404,832,085 14,938,303,943
Total I 17.5% 1,280,321,831 47,243,875,556
Prepared by sba-Ecosys p. 58 January 2012
Figure 6 : CDI according to environmental domains
Damages concerning soils, forests and coasts are linked to the importance of the primary sector in Mozambique. The most fertile soils are overexploited and suffer from the increasing impact of human activities. In developing countries, the immediate concern for food security and the urgent need of new sources of income explain the overexploitation of soils and sea products. Additionally, forests constitute the main source of energy. Especially wood (fuel and charcoal) is used as a primary source for energy generation for cooking in Mozambique.
Figure 7 : CDI according to economic categories
Note that, due to insufficient and contradictory data on coastal degradation and the impacts on mangroves, no value could be computed. However, this might imply losses of catches for fishermen as well as a loss of biodiversity. Valuable mangrove areas are also likely to be converted to use for private gain, often to the detriment of local populations. Important breeding grounds will be lost, as will buffers that protect against storms and tsunamis. Indeed, the value of the watershed protection provided by intact coastal ecosystems, such as mangroves and other wetlands, has been estimated at USD 845/ha/y in Malaysia and USD 1'022/ha/y in Hawaii. Estimates in Sri Lanka are set at USD 1'088/ha (Gunawardena, 2005) and in Mexico at USD 37'500/ha/y (Univeristy of California - Sand Diego, 2008). Overall, values appear to vary
Prepared by sba-Ecosys p. 59 January 2012
widely from a case to another. Estimates of the annual market value of capture fisheries supported by mangroves ranges from USD 750 to 16'750 per hectare according to Ronnback (1999). Applying such references to Mozambique leads to a damage ranging from 0.21 % of the GDP to more than 10.21 % of the GDP (if 5 % of the mangrove is considered as completely degraded). These damages are not included in this study since the extent of the mangrove degradation (assumed at 5 % for illustrative purpose) cannot yet be assessed in Mozambique.
The case of waste is particular. Waste is not an environmental domain. Damages due to uncollected waste concern in fact water, soils and air. Damages due to collected waste are an opportunity cost for the State due to the budget that has to be spent on waste collection39. The analyst has to decide on how to allocate damages due to waste in each category. In the analysis of Mozambique (as in previous analysis done in Burkina Faso and Mali for PEI), the waste category includes the opportunity cost of collected waste and the damage cost of uncollected waste. Identifying damages due to uncollected waste thus requires to withdraw part of the damages due to the pollution of water and soil (domains Water and Soil) and to add them in the category of "waste".
Air damages tend to be lower. Damages related to air pollution concern principally indoor pollutants. The use of wood for cooking has indeed a negative impact on indoor air quality and seems to constitute a major source of respiratory diseases in the country. Developing countries are indeed less concerned by industrial pollution and heavy traffic. However, in most developing countries, the largest cities encounter increasing motor vehicles and industries are growing steadily.
Examining economic categories (see figure 7 above), the analysis shows that damages concern first the quality of life and health of people. Such category grasps the impact of the lack of safe water and sanitation (including waste), of the indoor air pollution due to wood combustion, of the loss of income corresponding to the management of waste and of the loss of amenities due to the destruction of forest and natural area. Such results confirm the importance of the environment for the livelihood in Mozambique. Each year the impacts of the degradation of the environment and of the lack of the related infrastructure and devices (safe water supply and sewage treatment plant, electricity network) on the health and quality of life of the Mozambican population represent more than 8 % of the GDP, that is around MZN 22 billions per year (i.e. USD 600 millions).
Inefficiencies are also considerable in Mozambique. Inefficiencies are defined as the quantities of inputs that are lost during the production and consumption process. Ignoring inefficiencies jeopardizes and underweights the presence of inappropriate management of natural resources, materials and energies. In most developing economies, inefficiencies in material and resources uses are expected to be high. The UNEP green economy report (2011) states that of a total agricultural production at around 4’600 Kcal/person/day in the world, only 2’000 Kcal/person/day is available for human consumption due to loss during the production, storage and consumption chains. Addressing some of these inefficiencies – especially crop and storage losses – offers opportunities requiring small investments in simple farming and storage technologies in small farms where it makes the most material difference to poor farmers. The FAO reports that although reducing post-harvest losses could be relatively quickly achieved, less than five per cent of worldwide agricultural research and extension funding currently targets this problem. Inefficiencies in water distribution seem also to be high. For example, Phnom Penh Water Supply Authority in Cambodia could increase collection efficiency from 48% to 99.9%. In Mozambique, water loss form the network in the main cities lies between 25% and 87% of the water collected (according to data collected from ADM and FIPAG). Energy inefficiencies are also an important issue. USA’s economy today converts primary energy into useful work –
39 Waste collection might however generate jobs and private activities.
Prepared by sba-Ecosys p. 60 January 2012
mechanical, chemical or electrical – with an aggregated efficiency of 13% (Ayres and Warr 2009, Ayres and Ayres 2010). The previous evidence means that in the most advanced economy of the world, more than 80%, or four-fifths, of the high quality energy extracted from the earth is wasted.
Inefficiencies are due to the lack of proper technology and infrastructure as well as poor public management. Artificially lowering the price of goods through subsidization can indeed encourage inefficiency, waste and overuse, leading to the premature scarcity of valuable finite resources or the degradation of renewable resources and ecosystems. Likewise, lack of proper regulation and compliance or financial resources can also be contributing factors. The lack of regulation and compliance with regards to polluting industries and the lack of financial resources devoted to maintenance might be considered as examples. The case of agriculture, as referred to above, is another one.
However, the case of inefficiencies is usually left aside in analysis due to computational issue. We decide to estimate inefficiencies in Mozambique on the basis of the following assumptions and hypothesis. In Mozambique, inefficiencies are estimated at 5.5% of GDP. Such estimate is based on the amount of MZN (in 5 % of GDP) that could be saved if 5 % of energy resources and 2 % of material goods could be saved keeping identical consumption and production figures. This is an indicative estimate (see annex 1) built on assumptions, it should thus be considered with caution.
One could argue that such inefficiencies should be spontaneously fought by profit maximizing agents. However, their remaining presence can be explained by the following reasons:
Lack of information and understanding on the best practices relative to energy and material management.
Failure to modernise the processes even if they are old and have paid off a long time ago.
Expensive remediation of inefficiencies on a short-term basis as they may require early replacement of equipment. In this regard, low selling prices may explain the presence of inefficiencies (not allowing equipment to be totally amortized).
In many developing countries, companies are still (at least partially) state-owned and face regulations (with respect to quantities and prices) and low competitive pressures that do not favour the systematic search for inefficiency reduction.
Continuous lack of investment in the agricultural sector to cope with crop and post-harvest losses, storage difficulties and other inefficiences, such as poor irrigation infrastructure.
b) Cost of Remediation (CR)
Costs of remediation represent the spending necessary to reduce damages and inefficiencies. For the Mozambican economy, they amount to 9.3 % of the GDP. Actually, it seems that a large increase in public and private expenditures is required to cover the remediation costs. Such results give thus an impetus for increasing the financial resources allocated to environmental protection and management in Mozambique.
The figure 8 represents CR by environmental domains. It is in water and waste that remediation is the most costly.
Prepared by sba-Ecosys p. 61 January 2012
Figure 8 : CR according to environmental domains
Remediation costs represent the spending (given the current available knowledge and data) necessary in order to protect the environment by preventing or restoring its degradation. They also comprise the costs of establishing policies, processes or management practices for reducing or preventing wastage. According to this principle, the remediation costs favour the "the least cost" options. Remediation cost are built on the observation of practices and costs linked to environmental protection in Mozambique and other comparable cases as well as on hypothesis on an elaboration of such practices in Mozambique. Note that for inefficiencies, we postulate that the amount of remediation costs is captured by an increase in prices of 2 % for energy and 1 % for materials.
c) Priorities: B/C ratios
Once CDI and CR are estimated, Benefits/Costs ratios are computed. B/C ratios provide information about the profitability of the remediation or allow for a prioritizing of actions.
The figure 9 and the table 13 show B/C ratios for Mozambique. The overall ratios equal to 1.8, indicating that for MZN 1 in environmental protection, MZN 1.8 are gained in the form of a reduction of the CDI.
Prepared by sba-Ecosys p. 62 January 2012
Figure 9 : CDI/CR ratios
Table 13 : CDI/CR according to environmental domains and economic categories
Environmental domains MZB
Ratios
Water 1.7
Air 1.4
Soils, forest and coasts 2.3
Wastes 1.1
Energy and Materials 3.0
DIC/RC 1.8
Economic categories MZB
Ratios
Health | Quality of life 1.9
Natural capital 1.1
Inefficiencies 2.5
DIC/RC 1.90
The environmental economic analysis gives in this regard the priorities for environmental action in Mozambique and helps to set recommendations for policy makers.
The energy-material B/C ratio amounts to 3. It is evident that the most efficient remediation options lies in this domain. This is due to the fact that the domain "energy-material" captures inefficiencies, which are by definition not very costly to reduce. Such result however rests on the hypothesis made (5 % of inefficiencies for energy, 2 % for materials; 2 % increase in energy prices and 1 % in material prices for evaluating remediation costs).
Soils, forest and coast are also highly beneficial domains (2.3), followed by water (1.7), and air (1.4). Waste (1.1) is the least beneficial domains even if its ratio is still above 1.
Concerning mangrove, a case study taken from The Economics of Ecosystems and Biodiversity (TEEB) shows that the potential damage from storms, coastal and inland flooding and landslides can be considerably reduced by a combination of careful land-use planning and maintenance or restoration of ecosystems to enhance buffering capacity. Planting and protecting nearly 12'000 hectares of mangroves would cost USD 1.1 million but would save annual expenditures on seawall maintenance of USD 7.3 million40. Note that such evidence would indicate a B/C ratio of around 6.5. However, as explained before, mangrove degradation has not yet been assessed in Mozambique.
40 It would also save farmland and housing losses.
Prepared by sba-Ecosys p. 63 January 2012
4.6. Comparisons
The previous estimates of environmental damages and inefficiencies costs have to be compared to the previous analysis of AFD (2008), which also aimed at estimating the cost of environmental degradation in Mozambique41. The AFD study determines the genuine net saving of Mozambique (figure 10), which is defined as the true rate of savings in an economy after taking into account investments in human capital, depletion of natural resources and damage caused by pollution.
The AFD study provides the following results:
The genuine net saving is estimated at 14.2 % for 2005 in Mozambique and 17.8 % as far as CO2 emissions are considered. This means that, in 2005, the Mozambican development path was not sustainable. It used its natural resource base and emitted pollution without investing enough in human and physical capital. This clearly questions, as pointed out by AFD, the sound management and allocation of the natural resources.
The study clearly expands the previous evidences on net genuine savings for Mozambique. Indeed, the World Bank provides estimates for Mozambique that have been lower and not systematically negative (see figure below). World Bank figures ignore damages due to water pollution and soil degradation. The AFD study also assumes that CO2 emissions cause damages equal to 3.5 % of GDP (reference of Nordhaus and Boyer, 2000). The World Bank however attributes a value of USD 20/t. of carbon (around USD 5.4/t. of CO2), which results in a monetized damage equal to 0.2 % of GDP for 2005.
For computing the genuine net savings, the AFD study has thus also considered environmental damages costs. Those latter have been estimated at around 5.7 % of GDP. Taking into account the differences in scope between the AFD study and the present one, the two estimates share strong similarities. The next section develops this argument.
41 The study also examines the importance and composition of natural capital as well as its role in Mozambique.
Prepared by sba-Ecosys p. 64 January 2012
Figure 10 : Genuine net savings for Mozambique
Table 14 presents, step by the step, the estimates of the cost of damages in the AFD and this PEI MICOA study. The major difference lies in the fact that the AFD study does not compute all types of environmental damages. This is clearly due to the objective of the study, which aimed at estimating the net genuine saving.
Table 14 : Costs comparison with AFD study
AFD study PEI actual
study
Soil depletion 0.2% 1.5%
Forest capital depletion 0.4% 0.6%
Unsafe water 2.8% 1.4%
Air indoor pollution 1.1% 1.2%
Air outdoor pollution 0.2% 0.1%
Flood 0.2% -
Drought 0.9% -
Total 1 5.8% 4.8%
CO2 damages 3.5% 0.6%
Total 2 9.3% 5.4%
Time and income loss due to lack of water 2.0 %
Opportunity cost of polluted water 0.7 %
Air pollution - quality of life 0.1 %
Natural area - amenity 1.3 %
Waste 2.4 %
Inefficiencies 5.5 %
Total 3 17.5%
Table 14 indicates the damages that have been estimated by the two studies (soil depletion, forest capital depletion or deforestation, unsafe water, air indoor pollution, air outdoor pollution, flood, drought, CO2 damages) and the damages that have been estimated by the present study only (time and income loss due to lack of water service, opportunity cost of polluted water, impact of air pollution on the quality of life, inefficiencies).
For the damage categories estimated by the two studies, results are very similar. However, the main differences are explained as follows:
For soil depletion, our estimates are eight times higher (1.5% instead of 0.2 %). This difference can be explained through a variation of the total considered area. The agriculture case study (conducted alongside of the macroeconomic study) shows indeed that the area degraded did not only consider the relatively small permanent crop area (of around 235’000 hectares), but around 1.2 million ha, which represents 15% of a larger cropped area (7.5 million ha). 15% is half of the amount indicated in the UN country profile of Mozambique42.
For unsafe water, the difference is explained by the fact that we considered only half of the estimated damages in order to avoid a double counting of the other consequences of polluted water that have previously been estimated (see annex I for more details).
For damages due to CO2 emissions, we used a price of USD 10/t. of carbon (or USD 2.7/t of CO2), see Annex I. AFD uses the 3.5 % estimates of Nordhaus and Boyer (2000) for African countries.
Overall, both studies offer a very similar order of magnitude for the categories of damages that have been estimated. There is also no discrepancy between the results that cannot be explained.
The present study also proposed estimates for other types of damages. For example, damages due to polluted water and lack of access to safe water consider not only the related health cost (by examining the DALYs) but also the time loss (and related income loss) that households face when travelling for collecting water or paying for water tanks delivery. We also estimated the opportunity cost of polluted water as the additional cost that would be associated for sourcing new safe water. It represents the cost of the alternative that has to be used if actual sources are polluted. We also add an estimate of the loss of welfare for the urban population due to air pollution (smell, increase risk of sickness). We consider also the opportunity cost of waste (revenue spent for collecting and discharging waste) as well as the welfare cost associated with uncollected waste. Finally, we also consider the loss of amenities (natural area and beaches).
As explained, the cost of inefficiencies has been estimated at around 5.5 % of the GDP. These costs have however to be considered with caution. If we exclude inefficiencies for avoiding overestimating the CDI, we can assess that the cost for environmental damages lays around 11.4 % of the GDP in Mozambique.
The table 15 proposes an international comparison of the cost of damages (mainly other PEI and World Bank studies). The comparison rests only on damages on health due to unsafe water, polluted air, soil and forest loss and waste since those categories are the only one that are common to all studies. The table shows also that comparing damages cost in proportion of the GDP can be misleading, and therefore additional figures based on the amount of environmental damage costs per capita are necessary. Comparisons thus show that the lowest income countries have higher environmental damages in percentage of the GDP but at the same time reveal to have lower damages per capita.
Table 15 : Cost of damages in various countries
CD* CD/capita - USD GDP/capita - USD
Mozambique (2008) 5.8% 19 334
Malawi (2007) 5.3 % 14 258
Burkina Faso (2008) 6.3 % 35 559
Mali (2007) 6.5 % 33 506
Algeria (2001) 3.6 % 173 4795
Egypt (2000) 4.8 % 151 3146
Tunisia (2001) 2.1 % 109 5169
Morocco (2003) 3.7 % 118 3188
Syria (2003) 3.5 % 95 2702
Jordan (2003) 2.8 % 73 2615
Source : Sarraf et al. (2002,) PEI (2009, 2010, 2011)
Prepared by sba-Ecosys p. 66 January 2012
5. Linking the distributive and cost of damages analyses
Now that we have analyzed the distributive effect of environmental degradation in Mozambique as well as the relative importance of these damages, we can merge the results of the two analyses.
Table 16 and figure 11 both link results by indicating the aggregated indicator of the distributive analysis and the CDI values by environmental domain. Figure 11 illustrates graphically the outcome; the size of the bubbles represents the value of the CDI/CR ratios while the X-axis set the CDI (in % of the GDP) and the Y-axis the distributive indicator. Hence, the further you move up in the Y-axis, the more the domain has a distributive effect on the poorest people.
Table 16 : Linking distributive and allocative analyses
Distributive
indicator CDI
CDI/CR
ratios
WATER 5.6 4.5 % 1.7
AIR 5.1 1.4 % 1.4
SOILS | DEFORESTATION | COAST 4.0 3.5 % 2.3
WASTE 3.5 2.4 % 1.1
ENERGIE and MATERIALS 3.2 5.1 % 3.0
The following conclusions may be drawn:
o Water presents a high damage cost. Furthermore, the negative consequences of water pollution and the lack of access to safe water mostly affect the poor. On such basis, some mitigating or remediation measures constitute a clear priority. However, their cost is relatively high (low CDI/CR ratios).
o Soil degradation and deforestation constitute also a priority. Damages are relatively high; the distributive indicator indicates that the consequences on the poor are higher than average. Finally, the CDI/CR ratios are high, indicating the high profitability of the remediation. Much can be done at a relatively low cost.
o Waste and air appear to be a less urgent issue. Both damages and CDI/CR ratios cost are relatively low. However, indoor air pollution has strong negative impact mostly on women and children in poor communities. Furthermore, the issue of waste did not include the potential of income linked to collection and recycling activities. Investing in waste collection services and recycling activities seems to be more beneficial to poor communities since poor are more inclined to work in the waste sector.
o Results concerning losses in energy and materials (inefficiencies) are purely indicative in this study. However, it seems rather interesting to avoid them. The benefit of avoiding them and the value lost due to inefficiencies are high. Inefficiencies are less concerning the poor. Note also that some inefficiencies (as post harvest losses and bycatch) have not yet been considered. Efforts are required in those areas since their potential incidence on poverty is strong.
Prepared by sba-Ecosys p. 67 January 2012
Computing CDI/CR ratios was not possible for each damage type but only for environmental domains. Annex 2 proposes more detailed results for each of the environmental damages and inefficiencies estimated. However, as far as the definition of damages and inefficiencies might not strictly be the same between the environmental economic and the distributive analyses, such table has to be interpreted with caution.
Figure 11 : Linking distributive and allocative analyses
Prepared by sba-Ecosys p. 68 January 2012
IV. MAIN RESULTS AND RECOMMENDATIONS
1. Environment and poverty in Mozambique
The first part of the study has been devoted to identifying the main consequences of poverty on the environment as well as the consequences of environmental degradation on poverty. Again the issue is complex and vast and empirical analyses are still scarce. PEI is clearly filling an important gap in this respect by proposing a pragmatic approach built on specific cases in order to draw attention and set recommendations for decision-makers.
Overall, there is now clear evidence showing that the environment affects poor people through mainly three channels:
Livelihoods: Poor people are more dependent on their local environment and access to environmental resources. Poor people are thus the most affected when the accessibility and the quality of these resources decrease. They have no income for buying alternative resources or securing their access to the actual one. Furthermore, the concern for immediate subsistence leads people living in situations of extreme poverty to care little about a sustainable use of natural resources, they have no choice or only a small margin to act. In such cases, the literature evokes the vicious circle of poverty:; poor men, women and children have to overuse natural resources to survive; consequently the quality and availability of natural resources decrease leading poorest people to find themselves in an aggravated economic situation. Note also that poor people often do not have secure tenure and ownership rights over the use of natural resources and this tend to contribute to their unsustainable use.
Health: Poor people suffer most from land, water and air pollution. The data analysis of the WHO environmental burden of diseases43 clearly shows that poverty and environmentally related health risk are positively correlated (Blakely, 2004). The health risk poor people face is larger. As far as sickness is also a cause of poverty, a vicious circle between poverty and the environment is again identified.
Vulnerability: Poor people are more exposed to environmental hazards and environmental changes. Their capacity to adapt is again limited. They are not able to escape or buy adapting and mitigating devices. There is now wide evidence showing that natural disasters affect more strongly developing countries and the poorest population. In 2000, 97 % of the deaths due to natural disasters occurred in developing countries (ICRC, 2001).
In Mozambique, available information, though highly incomplete, shows that these three channels are relevant for capturing the links between environment and poverty. However, they constitute broad categories and lack precision in order concreteley measure the relevance of the environment for poverty.
Natural resources constitute a significant source of income for the poorest people in Mozambique. The degradation of natural resources put at stake their source of income and, hence, their living conditions. The scoping studies of the UNEP and IISD (2005) Connecting poverty and ecosystem services in Mozambique but also other research in this area (Duraiappah, 1996, 2004; Joint research paper, 2008) allow the identification of the main parameters between
43 Environmental burden of disease is a measure of the proportion of the human disease burden that may be attributed to environmental causes.
Prepared by sba-Ecosys p. 69 January 2012
environmental resources and poverty in the case of Mozambique and lead to the following conclusions:
Land: As reflected, overexploited land is degraded by erosion and salinization which leads to yield losses. As 95 % of the area under cultivation consists of small-scale subsistence farming, the impact of land degradation seems to be particularly relevant for poverty in Mozambique. The fact that corrective measures are costly (the use of fertilizers) strengthens the effects, which are significant, as agricultural production constitutes a main determinant for food security. However, other sustainable agricultural practices for soils conservation have to be taken into consideration.
Fish resources: Similarly, fish resources might be highly exploited in Mozambique due to the increased migration from the countryside to the coast. Moreover, overfishing by large scale, commercial fishing trawlers represent a high risk to poor fishermen who depend on artisanal fishing for their livelihood. The degradation of mangroves due to the development of human activities along the coast aggravates the consequences. Mangroves constitute a habitat and a reserve of food for many species of fish. Thus, the consequences of their degradation along the Maputo coastline resulted in a drastic reduction of fish stocks in Maputo which is noticeable all over the coastline of Mozambique. The consequences for the rural livelihood could be significant.
Deforestation: The pressure on forests is increasing due to population growth requiring more fuel-wood and the expansion of agricultural area. This has an impact on the availability of the forest ecosystems for wildlife. Deforestation is linked to poverty. The poor suffer more from the increasing scarcity of forest; they have to pay more for wood or travel further away in order to find some. It remains however not clear in which sense forest ecosystems and amenities are more profitable to the poorest part of the population. In Mozambique, indigenous forests constitute a potential source of high value timber and provide other ecosystems services such as CO2 absorption (thus being an important component in the climate regulation). Actually, the exploitation of timber doesn't seem to benefit the local poor communities but renders loggers better off (usually loggers are not part of the local communities). Smuggled timber contributes also to the unsustainable use of the resource. Note also that wood and charcoal constitute the main source of energy for the population.
Water supply and quality: Only 47 % of the population has access to safe water (Environmental burden of disease statistics of the WHO). Unsafe water has direct consequences on health. In Mozambique, the examination of statistics in relation with the burden of diseases shows that each year more than 580’000 years of healthy life are lost due to unsafe water. This means that around 1 person out of 40 is suffering from water related diseases. Water quality and accessibility is thus a concern not only for the low-income classes but also for the middle-income population. The impact of unsafe water is worsened by the lack of access to health services in all parts of the country. In general low-income households experience disproportionate exclusion from basic urban services including water and sanitation. These households usually reside in urban informal settlements scattered around the periphery of the urban space, areas of illegal or temporary housing within the city and formal low-income housing areas which lack access to basic urban services including water supply and sanitation (Danida, 2006).
However, environmental degradation may also have other impacts, somewhat less significant (as far as the existing literature is examined), on poor people. These concern the following:
Prepared by sba-Ecosys p. 70 January 2012
Air quality: A majority of the population rely on firewood and charcoal for domestic uses. The use of wood and charcoal is directly correlated with respiratory diseases. Although there have been attempts to expand electrification and develop alternative sources of energy such as plantations, solar, wind, and energy-efficient stoves, these remain very limited. Wood use is not only a key determinant of deforestation but also of health. In Mozambique, 350’000 years of healthy life are lost each year due to indoor air pollutants (environmental burden of disease statistics of the WHO), women and children are at higher risks due to the traditional division of tasks and roles in the households. Outdoor air pollution remains limited.
Waste: In many countries, waste is less frequently collected in the poorest urban areas. Waste clearly degrades the healthy conditions of the surrounding population leading to health costs and welfare losses. Similarly, rents of dwellings are usually lower in dirty and more polluted areas leading to pollution ghettos in suburban areas. There are positive links between collection and management of waste and the quality of living of the poor. Similarly, recycling and collecting waste activities constitute a source of jobs and income for the poor.
Inefficiencies: The inefficient use of energy flows and natural resources reduce the availability of these resources and increase their prices. These strengthen the exclusions of the poorest households from the services.
2. Main results
The study clearly shows that improved environmental management representant an important opportunity for poverty reduction and economic growth in Mozambique. By
measuring the contribution of the environment to the well-being of the Mozambican, the size of the primary sector would correspond to 45-50% of the GDP. For example, family subsistence farming constitutes a large part of the sector and was estimated at around 12 % of the GDP in 2009. Subsistence fishery corresponds to 0.9-1.45 % of the GDP.
Environment and poverty are thus strongly interdependent concerns in Mozambique. Natural resources are crucial for the quality of life and also for the survival of the poorest. The poor suffer also more from environmental degradation and from extreme climatic events. The survey conducted in Mozambique shows more particularly:
o Health effects as well as economic losses due to natural resource degradation (including access to the resource) have large impacts on the poor.
o Waste is of less distributive concern. However, the examination of the detailed results shows that this is not the case for landfills; poor people are more exposed to their negative consequences.
o Inefficiencies in energy and material are not of a strong distributive concern. The survey confirms that the poorest people have no access yet to modern fuel and electricity so that increasing prices to prevent pervasive inefficiencies do not affect them. They also seem to suffer more from post-harvest loss in food production. No data allowed however a measurement of this phenomena.
o However, this is not the case for water. The inefficient use of water and the subsequent water loss are having a large impact on the poor.
o Finally, the loss of amenities constitutes also a lower distributive concern.
Prepared by sba-Ecosys p. 71 January 2012
The environmental economic (allocative) analysis of the Mozambican economy demonstrates that the welfare (and income) loss due to environmental degradation equals almost to one fifth of the total economic value created in the country. That represents more than MZN 48 billion or 18 % of the GDP.
However, excluding inefficiencies for methodological reasons and performing some sensitivity checks, we can assess that the cost for environmental damages lies at between 6 % and 11 % of the GDP in Mozambique.
Environmental resources constitute one of the most important inputs of economic production in the country as well as one of the essential conditions (availability and quality of water, for example) for the health and quality of life of the poor. This estimate may be considered as coherent with the previous AFD study on this issue.
Energy and material (5.1 % of the GDP) and water (4.5 %) are the most damaged domains. Then come soils, forest and coasts (3.8 %), waste (2.8 %) and air (1.4 %).
B/C analysis shows that the profitability of environmental remediation in Mozambique is on average 1.9, indicating that for MZN 1 in environmental protection, MZN 1.9 are gained in the form of reduction of the CDI. This means that by investing MZN 1 in improved environmental practices Mozambique, avoided damages raises to MZN 1.9. This is a win-win situation in which environmental damages will be reduced and at the same time funds will be raised to be invested in the Mozambican economy and public services.
The energy-material B/C ratio amounts to 2.52. Soils, forest and coast are also highly beneficial domains (2.52). Water (1.65) follows. Air (1.4) and waste (1.2) are less beneficial domains even if the ratios are above 1.
By unifying distributive and allocative analyses, precise priorities may be set:
o Water presents high damage cost. Furthermore, the negative consequences of water pollution and the lack of access to safe water are more affecting the poor. On such basis, some mitigating or remediation measures constitute clear priorities. However, their cost is relatively high (low CDI/CR ratios).
o Soil degradation constitutes also a priority. Damages are relatively high, the distributive indicator indicates that the impact on the poor is higher than average. Finally, the CDI/CR ratios are important indicating the high profitability of the remediation. Much can be done at a relatively low cost.
o Waste and air appear to be a less urgent issue. Either damages or CDI/CR ratios cost are relatively low. However, air pollution (especially indoor air pollution) has strong negative impacts on the poor.
o Inefficiencies seem rather interesting to be fought even if less to the benefit of the poor due to the high CDI/CR ratio.
Mozambique sets an institutional and legal framework for managing natural resources and limiting environmental degradation, which remains incomplete and suffers from a lack of implementation. Land and Forest laws are particular, allowing only community based ownerships of lands (i.e. no private ownership). For poverty alleviation, community lands are promising and require that all people are consulted when decisions to allocate land have to be made. It thus constitutes a tool for poverty reduction. However, studies show that the process of consultation has been weak in providing a room for the disadvantaged and poorest groups to influence decisions. The legal mechanisms adopted by the government under the Land and Forest acts are not clear on how these groups are involved in the process of consultation.
Prepared by sba-Ecosys p. 72 January 2012
Environmental management is not financed specifically. As a consequence, it tends to be listed in the action plans but then faces difficulties in materializing. The national development strategy and the poverty reduction paper partially answer this issue by selecting priorities and proposing a budget for taking actions. However, it should also mention the way financial resources required by environmental management and policies should be increased (ecological taxation, ODA). In other words, a financial strategy is also required.
3. Recommendations
3.1 Increasing budget for environmental protection
Devoting more financial resources to environmental protection and natural resources management constitutes the main priority for Mozambique.
Actually, the lack of financial resources constitutes one of the main reasons for the low implementation of environmental policies. Increasing public budget has to be done by implementing ecological taxation and by prioritizing expenditures from existing funds.
Ecological taxation is considered as a needed step and is required for a well-functioning collaboration between the Ministry of Finance and the Ministry of the Environment. On the one hand, ecological taxation increases the financial resources for the State. On the other, ecological taxation modifies the behavior of economic agents (inventive taxation). Such measures induce private expenses for environmental protection, which complete public ones. According to their setting, ecological taxes might pursue one or both of the previous objectives.
However, the distributive consequences of ecological taxation have to be anticipated. If not, the acceptability of ecological taxation might remain low. For example, increasing water tariff might provide financial solutions (financing water infrastructure and reducing inefficiencies), but could also be socially catastrophic because poor people may not afford water anymore. For this reason, the ecological fiscal reform should constitute a long-term goal. On the short term, small and regular increases in current taxes44 combined with an effective collection rate should be preferred. Other instruments (i.e. lump sum subsidies that complement households’ incomes) have to be implemented instead of lowering the prices of goods and services.
The increase of environmental expenditures should be devoted to:
o The continuation of the development of water-related infrastructures. The study shows that investing in water related infrastructure now, can save MZN 10 billions per year in the future. Moreover, it is the area of environmental damage that is most negatively affecting the poor. The costs of such infrastructure are high but at the same time they are highly profitable (as far as the actual economic cost of the water-related disease is considered) and contribute to poverty reduction. The construction of networks, pipes, and sewage facilities has to be coordinated with the development of the associated competencies and the needed budgets for its maintenance. As Mozambique has already invested in water infrastructures, we recommend increasing the speed of investment. The reduction of water inefficiencies is a priority due to its low remediation cost. Actual water networks in Mozambique account for around 40 % to 80 % of water loss. 40 % of the consumption of the actual irrigation water could also be saved with a better management of the resource and maintenance of pipes.
o Programs that monitor agriculture, forestry and fishery and promote their sustainability in order to ensure the sound exploitation of natural resources (protection of soil, mangroves,
44
The government established Mineral Resources, Fisheries, Agricultural and Environmental funds; levies, royalties and taxes that arise from the access and use of natural resources are implemented.
Prepared by sba-Ecosys p. 73 January 2012
etc.). Investments are not costly but sustainable management practices appear to be difficult to implement since problems and solutions vary widely between regions. Budgets have also to be available for supporting local communities.
3.2 Policies evaluation and reform
Reforming and implementing policies constitute the second main priority for actions in Mozambique. It addresses the need for a better coordination among the various Ministries, Institutes and Organizations whose activities are linked to environmental protection. Stakeholders recognize that many of the recommendations concerning policies reform rest on an appropriate harmonization of the objectives and means of various policies. Coordination is necessary to identify why environmental legislation, which covers adequately the issue in Mozambique according to stakeholders, remains poorly implemented.
Coordination with NGOs and the civil society is also necessary. Local communities need funds in order to support their economic development and their environmental protection programs. A mechanism has been put in place: 20% of the fees paid for natural resources exploitation by economic activities have to go back to the concerned local communities. However, the 20% mechanism seems to lack effectiveness as the reality on ground shows that only part of the funds are being transferred to the communities. Whether it is because the local communities are not sufficiently well organized, or because the state is interested to keep the funds for other policies, the answers to such questions lie beyond the scope of this study. However, the discussions with different stakeholders clearly suggest that a better coordination among the Ministry of Finance, the Ministry of Development and Planning, the Ministry of the Environment and rural associations is necessary for finding viable solutions.
Strengthening the collaboration between the parties is however seen as rather difficult since different organizations might have different objectives and conflicting interests (economic growth, environmental protection, avoiding deficit, etc.). Nevertheless, the parties seem to agree on the results of this study. There is now compelling economic evidence for environmental protection in Mozambique, as environmental protection can no longer be considered as a source of costs, but is instead a benefit for the whole country.
Finally, the financial cost of increasing collaboration is considered as weak. However, reforming the existing organizational framework might be necessary and parties fear that such process might take a lot of time. It remains unclear for the stakeholder how the organization has to be changed. They note that the actual NCC could constitute a platform for discussion.
Policies’ reforms are also necessary. The most needed interventions for reforming policies appear to be the following:
1. The overarching framework of the national development strategy and macro-economic policy has to be strengthened and consolidated. As this framework sets the priorities for budget allocation for the environment, it is an essential element. This strategy should also specify in greater details how existing and new financial resources could be allocated to environmental management practices and policies.
2. Land and Forest laws give an important role to local communities. This constitutes a valuable poverty reduction tool. However, the process of consultation has been weak in providing room for the disadvantaged groups (often the poorest ones also) to influence decisions. The legal mechanisms adopted by the government under the Land and Forest acts have to clarify how these groups will be involved in the process of consultation.
3. Controlling if regulations are enforced is also needed in Mozambique. For example, the actual human and natural finaicial resources do not allow to control if the exploration and use of the
Prepared by sba-Ecosys p. 74 January 2012
country’s natural resources are done legally, which is particularly important when it comes to large-scale extractions of resources. Increasing the resources and power of local inspectors is particularly important in this regard. . Environmental laws should also provide compliance mechanisms in order to punish infringements. In the case of communities infringing regulations, alternative livelihood options, improved technologies and awareness campaigns need to be promoted.
4. Building bridges between agricultural and environmental policies is also needed. In order to reduce poverty, productivity enhancing methods have to be used in agriculture. These may include improved farmer-relevant research, broader dissemination of conservation farming techniques, as well as drought-resistant varieties, encouragement of outgrower arrangements, encouragement of farmer associations, and the exploration of new models for smallholders to access financial markets. However, the environmental impacts of these initiatives have clearly to be assessed beforehand and monitored when implementing. In many places, the quest for productivity has failed to identify the best techniques and behaviours when both economic and environmental consequences are considered.
5. Similarly, the continued worsening of water conditions suggests that efforts to increase the use of irrigation will gradually increase agriculture production costs. Practices such as flooding fields, poor drainage and excessive pumping imply that there are many opportunities for using ground and rainwater in more efficient and sustainable ways. Some sustainable water-use strategies include drip irrigation systems, pressurized water pipe and sprinkler systems as well as the use of manual treadle pumps.
6. Information policies are needed, such as awareness campaigns. Many environmental problems are caused simply due to ignorance and can be prevented by demonstrating the benefits of more sustainable ways of using natural resources. Awareness campaigns should thus not only clarify the legal framework but also explain the risks and damages due to unsustainable practices such as bush fire and overexploitation of soils. Most importantly, these information campaigns should also raise awareness on viable alternatives. When appropriate, these awareness campaigns should be supplemented with follow-up activities (pilot projects) to assist people to change their behaviours and adopt more sustainable alternatives (e.g. small scale loans, expansion of agriculture extension work, better channelling of the funds to communities). Agriculture technology dissemination through public and private officers has to focus on soil conservation to improve productivity and avoid environmental degradation.
7. Finally, policies have to foster the development of financial services in rural and poor communities and provide investment possibilities for rural households.
Prepared by sba-Ecosys p. 75 January 2012
3.3 Increasing competencies and knowledge
The third priority addresses the development of competencies and knowledge relative to the management and preservation of the environment. Techniques of production as well as policy instruments develop rapidly. However, knowledge acquisition and dissemination constitute also a key variable in the relationship between economic growth, environmental needs and the acceptability of environmental policies.
There is thus a need for developing a scientific and technological knowledge acquisition; dissemination and communication system that absorbs the new information and communication technologies and that takes into consideration the development of the economy and the creation of infrastructures. Local specialist are needed in order to select, implement and diffuse new technologies.
3.4 Information gaps
Finally, information on the links between poverty and environment is lacking in Mozambique. However, this is highly problematic as far as such information constitutes a prerequisite to demonstrate the need for actions, to select most appropriate actions and subsequently to manage and monitor them.
Increasing the availability and quality of information constitutes a fourth priority in Mozambique. Much time and discussion are actually spent on identifying correct numbers. Strengthening both economic and environmental information is thus considered as a necessity since actions are sometimes delayed due to data gaps. This report is thus considered as very helpful for bringing new information (or for giving information in a new way) and for identifying where the lack of data seems to be the most problematic for taking decisions.
Such measure is not costly. However, the cost of getting new information (or reducing the margin of error concerning existing one) has also to be considered for prioritizing which information should be completed. Such task necessitates a joined work by MICOA (environmental data, MDP (economic data) and the Ministry of Finances (data relative to the cost of policies and income from taxes). The National Institute of Statistics should also play a leading role.
Information is more particularly needed on the following themes:
o Economy: Surveys are needed on the informal economic activities in the primary sector. Information is also needed on the frequency of illegal practices (wood, hunting and fishery) as well as on the importance of artisanal mineral extraction. This report had thus to estimate the importance of the environment for the Mozambican economy. Such estimates are conservative and may still underestimate the severity of environmental problems as well as the risks associated with environmental degradation.
o Income distribution: The distribution of income is badly monitored in developing countries, both at global and local levels. Identification of beneficiaries and victims of environmental degradation as well as establishing adequate policy measures is difficult and relies on the realization of specific case studies. In this study, we implemented a stakeholders’ survey in order to confront "literature based" expectations on poverty-environment linkages to the Mozambican context.
o Environment: Many environmental concerns remain poorly documented in developing countries. One major issue concerns the loss of soil productivity due to overexploitation of land as well as irrigation practices. However, the damaged area as well as the average yield loss is not known. The capacity to estimate the consequences of mangrove and forest ecosystem losses is also clearly lacking. This study uses the results of case studies on health in
Prepared by sba-Ecosys p. 76 January 2012
Maputo, agriculture in Zambezia and Sofala and fishery in the Sofala bank for estimating the consequences of environmental degradation in Mozambique. However, the risk is that national recommendations and policies are expressed on the basis of non-representative local data or phenomena.
o Inefficiencies: Energy and resources use are highly inefficient involving high losses. Our analysis shows the amount of GDP that is lost if 5 % of energy and 2 % of material could be saved without any consequences on production and consumption patterns in Mozambique. Our analysis shows that even if the cost for reducing such inefficiencies equals to a 1 % increase in price, the net gains remain large (ratio 3.2). As said, such evidence is rough and a survey could bring more precise data on inefficiencies and their causes in Mozambique.
Lack of information prevents analysts and decision-makers of drawing clear and concise conclusions from unclear, partial, non-representative and incomplete facts and opinions. Therefore, a strategy has to be set for building missing data according to the most urgent needs identified just before (informal activities, illegal practices, income distribution, environmental degradation of soils, forests, etc.). In this regard, we recommend to:
Strengthen existing institutions by providing a national laboratory for developing new evidences on income distribution and links between poverty and the environment in Mozambique. Such structure should:
reference all works made on similar subjects in neighboring or comparable countries
conduct regular large scale surveys on the previous theme as well as local and unique surveys on specific topics
work on the request of public authorities
coordinate with official statistical offices
collaborate with local as well as foreign universities
integrate social sciences, environmental sciences and statistics
be supported politically and financially.
Such proposition requires a relatively small investment; valuable work could indeed be done with around 15-20 full-time employees (multidisciplinary team of analysts). However, the realization of a national survey is expensive and requires specific competencies for selecting issues and formulating questions. This could constitute an interesting area for the international cooperation and development aid aiming at developing national capacities.
Further, the creation of a statistical framework in the national accounting system for integrating environmental information in the main economic indicators of Mozambique is also considered as essential. The Millennium Development Goals report grasps such opportunities. However, much more could be developed for systematically integrating the environmental aspect in indicators available to decision-makers. It could thus be very valuable to show that building and maintaining environmentally-related infrastructures are a source of employment and income. Such "green economy" perspectives should appear in the national accounts by monitoring the development of environmentally related activities, as it may constitute a strong impetus for taking actions. These statistical frameworks should include:
a national monitoring framework to develop the currently weak indicators for measuring poverty and environment. For example information on the subsistence use of environment and natural resources.
Prepared by sba-Ecosys p. 77 January 2012
a national system of accounts which captures calculation of GDP and the value of environment and natural resources.
Prepared by sba-Ecosys p. 78 January 2012
V. BIBLIOGRAPHY
Achimo M. (2002), Sediments and Geology of the Recent Sediments in Maputo Bay, Mozambique. Ph.D. Thesis, Stockholm University, Sweden, 79 p
AFD by Timothée O., Dominique R., Bernadac C., Pierre-Noel G. (2009), Recursos Naturais, Meio Ambiente e Crescimento Sustentável em Moçambique, Seminário sobre Recursos Naturais, Meio Ambiente e Crescimento acolhido pelo MICOA – 24 de Fevereiro
AFTWR (2007), Mozambique Country Water Resources Assistance Strategy: Making Water Work for Sustainable Growth and Poverty Reduction August, 2007, Preliminary Publication, Africa Region
Alam K. and Marinova D. (2002), Valuing Benefits of Environmental Improvement: The Case of the Buriganga River in Bangladesh, in S. Karner and B. Wieser (eds) Proceedings of the International Summer Academy on Technology Studies: Technology and the Public, Deutschlandsberg, Austria, pp 169-176
Albano G. (2004), Coastal Forest of Mozambique, Socio-economic aspects, (review)
Anderson D. (2000), Energy and economic prosperity, Chapter 11 in part IV of the World Energy Assessment, UNEP, ISBN 92-1-126126, http://www.undp.org/energy/activities/wea/drafts-frame.html
Ayres R. U and Warr B. (2009), The Economic Growth Engine: How Energy and Work Drive Material Prosperity, Cheltenham, UK & Northampton, Massachusetts: Edward Elgar Publishing, ISBN 978-1-84844-182-8
Ayres R. U and Ayres E. H (2010), Crossing the Energy Divide: Moving from Fossil Fuel Dependence to a Clean-Energy Future, New Jersey: Wharton School Publishing, ISBN 0-13-701544-5
Bandeira S.O. (2007), Concept note on priorities and options, institutional framework and action plan towards the establishement of a transfrontier conservation area between Mozambique and Tanzania - Tanzania point of view, Technical report for the Ministério Para A Coordenação Da Acção Ambiental (MICOA), 89 Bandeira S.O., Queface A.J., da Maia R.C., Scarlett M.P.J., Boane C.P., Achimo M. (in prep). The Current Knowledge of Marine Pollution in Maputo Bay, Mozambique
Bartone, C. (1998), The Value in Wastes, Decade Watch, January issue
Beira Corridor Study (no year), Beira Agricultural Growth Corridor, Delivering the Potential, http://www.beiracorridor.com/documents/IBhigh.pdf
Blakely T., S. Hales and A. Woodward (2004), Environmental Burden of Disease Series, No. 10 Poverty, Assessing the distribution of health risks by socioeconomic position at national and local levels, World Health Organization, Protection of the Human Environment, Geneva 2004
Belhaj M. (2003), Estimating the benefits of clean air contingent valuation and hedonic price methods, International Journal of Global Environmental Issues, Volume 3, Number 1 / 2003
Bölmark, J. (2003), Meretrix meretrix as an Indicator ofHeavy Metal Contamination in Maputo Bay, Committee of Tropical Ecology, Uppsala University, Sweden, 22 p
Cabral L. (2009), Sector Budget Support in practice. Desk study, Agriculture Sector in Mozambique, Overseas Development Institute
Cabral L. and Francisco D. (2008), Environmental institutions, public expenditure and the role for development partners. Mozambique case study, Final Report
CEMT/ECMT (2000-2008), Taxation efficiente des transports – Efficient Transport Taxes and Charges, OCDE/OECD, Paris
Chonguiça E. and Katerere, Y. (2003), Assessing the Need for a Regional Approach to Environmental Studies of Development Investment in Southern Africa, pp 6-24, In: Assessing the Need for a Regional Approach to Environmental Impact Assessment in Southern Africa. Chonguiça, E. & Brett, R. (eds.), IUCN – The World Conservation Union
Chonguiça E. (1995), Environmental Impact Assessment of the Pequenos Libombos Dam Mozambique, (A Case Study) in: Environmental Impact assessment in Water Management International Symposium, Group for Applied Ecology, Belgium
Cosijn C. and Tyson P. D. (1996), Stable discontinuities in the atmosphere over South Africa, S. Afr. J. Sci. 92: 381-386
Cumbane J.J. (2004), Air pollution management in Southern African cities. Air pollution issues in Mozambique. In: Proceedings of the Regional Workshop on “Better Air Quality in the Cities of Africa 2004”. pp. 98-103. Feresu S., Simukanga S., Haq G., Schwela D. (Eds.), Johannesburg, April 2004, Stockholm Environment Institute
Cumbane J.J., Feresu S. (Eds.) (2003), Air Pollution Information Network-Africa APINA
Cumbane J.J. and Ribeiro N. (2002), Impacts of air pollution in Mozambique. In: Sikazuwe O.M., Masialeti, M., Simukanga S. and Hicks W.K. (Eds), Presentation of the country reports on air pollution issues for Botswana, Malawi, Mozambique, South Africa, Zambia and Zimbabwe, Sable Press, Harare, pp 11-12
Del Gatto F. (2003), Support for implementation of the forest and wildlife legislation in Mozambique. Forest law enforcement in Mozambique: an overview, DNFFB and FAO, Mission Report, http://www.fao.org/forestry/12933-2-0.pdf
Dove V., Wetimane A., Loureiro N., Cuco C. and Jombosse A., (2003), Baía de Maputo - Avaliação do Efeito do "Fuel Oil" Derramado pela Petromoc, Instituto de Investigação Pesqueira (IIP), Maputo Moçambique, 5 p (in Portuguese)
Draft report on waste in Mozambique (no year), available on the UN website at: http://www.un.org/esa/dsd/dsd_aofw_ni/ni_pdfs/NationalReports/mozambique/Waste_Management.pdf
Duraiappah A. (1996), Poverty and Environmental Degradation: A Literature, Review and Analysis CREED Working Paper Series No 8, International Institute for Environment and Development, London - Institute for Environmental Studies, Amsterdam
Duraiappah A. (w004), Exploring the Links: Human Well-being, Poverty and Ecosystem Services, UNEP, ISBN 1-895536-86-3
FIDA (2010), Habilitar os pobres rurais a superar a pobreza em Moçambique, www.ifad.org, Global Solidarity Forest Fund, 2008
Faiz A., Gautam S. and Emaad Burki (1995), Air pollution from motor vehicles: issues and options for Latin American countries, Science of The Total Environment, Volume 169, Issues 1-3, 8 July 1995, pp 303-310
FAO (2008a), Mozambique: Forests and the Forestry Sector. http://www.fao.org/forestry/country/en/moz/
FAO (2008b), Mozambique: Import/Export of Forest Products - Trade of Forest Products for 2002, Rome, FAO
FAO (1995), Land degradation and environmental degradation and desertification in Africa, http://www.fao.org/docrep/x5318e/x5318e00.htm
Fujita Y., Fujii A., Furukawa S. and Ogawa T. (2005), Estimation of willingness-to-pay (WTP) for water, sanitation services through contingent valuation (CVM) method, a case study in Iquitos City, the Republic of Peru, Japan Bank for International Cooperation, http://www.jbic.go.jp/english/research/report/review/pdf/ report10_2.pdf
Garcia F. R. M., Bandeira R.R. and Lise F. (2009), Influências ambientais na qualidade de vida em Moçambique, Revista ACOALF Aplp, São Paulo, ano 3 Vol 6 no. 1, pp 69-92, http://www.acoalfaplp.net
Global Mercury Project (2005), Pilot Project for the Reduction of Mercury Contamination Resulting From Artisanal Gold Mining Fields in the Manica District of Mozambique, M.M. Veiga, GEF/UNDP/ UNIDO
Gunawardena and Rowan (2005), Economic Valuation of a Mangrove Ecosystem Threatened by Shrimp Aquaculture in Sri Lanka, Environmental Management,Vol. 36 No. 4, pp 535–550
Hill N. (2005), Livelihoods in an artisanal fishing community and the effect of ecotourism. MSc. Thesis, Department of Envronmental Science and Technology, Imperial College London, University of London, London
ICRC (2001), World Disasters Report 2000. Focus on recovery. International Federation of Red Cross and Red Crescent Societies, Geneva
Imandoust S.B. and Gadam S.N. (2007), Are people willing to pay for river water quality?, Contingent valuation, Int. J. Environ. Sci. Tech. 4 (3), pp 401-408
INE (TIA) (2008), Inquérito Agrícola
Instituto Nacional de Estatística (2007), www.ine.gov.mz
IUCN (1998), Environmetal Strategies for Land Tenure and Community Based Natural Resource Management in Southern Africa. IUCN – The World Conservation Union
Johannessen L.M. and Boyer G. (1999), Observations of Solid Waste Landfills in Developing Countries: Africa, Asia, and Latin America, Urban Development Division, Waste Management Anchor The World Bank
Kaliba A., Norman D. and Chang Y. (2003), Willingness to pay to improve domestic water supply in rural areas of central Tanzania: implications for policy, International Journal of Sustainable Development and World Ecology 10(2), pp 119–132
Krugmann, H. and Juergensen, O. (1997), Niassa Environmental Research & Sustainable Development Programme (NERSDP), Project Proposal, Canada, International Development Research Centre, 27 p
Larsen, B., M. Sarraf and G. Pillet (2002), Cost Assessment of Environmental Degradation in the Mashreq and Maghreb Countries. From Theory to Practice, Cost Assessment of Environmental Degradation in EGYPT”, The World Bank/METAP
Larsen, B., M. Sarraf and G. Pillet (2002), Cost Assessment of Environmental Degradation in the Mashreq
and Maghreb Countries. From Theory to Practice, Evaluation du coût économique de la dégradation de l’environnement en Tunisie”, The World Bank/METAP
Linckia (2001), Levantamento preliminary dos residuos sólidos nas praias do sul de Moçambqiue: cidade de Maputo ,Relatório de Investigação n° 1, 19 p (in Portuguese)
Louro C.M.M. and Pereira M.A.M. (2004), Avaliação Preliminar da Poluiçao Microbiológica na Baía de Maputo, Centro Terra Viva, Estudos e Advocacia Ambiental, 13 p
Maia R.C. (1999), Water quality and environment in Mozambique. Determination of major chemical elements and trace metals in sea water on Maputo bay, Abstracts of the thesis for scientific degree of Philosophy Doctor in chemistry, Moscow, 21 p
Mackenzie C. (2006), Chinese Takeway! Forest gouvernance in Zambezia, Mozambique, Final report for fongza, http://www.illegal-logging.info/uploads/Mozambique_China.pdf
Marzoli A. (2008a), Avaliação integrada de florestas em Moçambique – AIFM: inventario florestal nacional. Directorate of Natural Resources Inventory. National Directorate of Land and Forestry, Maputo, 92 p (draft report)
Marzoli A. (2008b), Inventário Florestal Nacional. Ministério de Agricultura. Direcção Nacional de Terras e Florestas, Maputo, 98 p
Massinga A. and Hatton J. (1997), Status of the coastal zone of Mozambique. In: Lundin, C.G. & Lindén, O. (Eds), Integrated coastal zone management in Mozambique. Ord & Vetande AB, Uppsala, pp 7-68
MICOA - Ministério para a Coordenação da Acção Ambiental (1998), Macrodiagnóstico da Zona Costeira de Moçambique. Versão preliminar, Maputo, Ministério para a Coordenação da Acção Ambiental, 67 p
MICOA - Ministério para a Coordenação da Acção Ambiental (2005), Avaliação da vulnerabilidade as mudanças climáticas e estratégias de adaptação, Maputo, 61 p
MICOA - Ministério para a Coordenação da Acção Ambiental (2007), Programa de Acção Nacional para a Adaptação às Mudanças Climáticas (NAPA), Ministério para Coordenação da Acção Ambiental (MICOA), Direcção Nacional de Gestão Ambiental
MICOA - Ministério para a Coordenação da Acção Ambiental (2007), National Adaptation Programme of Action (NAPA), 68 p
MICOA - Ministério para a Coordenação da Acção Ambiental (2010), Levantamento de dados para a estratégia nacional de redução de emissões de gee por desmatamento e degradação de florestas na província de Nampula, 151 p
MICTUR (2009), Annual Report Summary of 20 per cent payment
MINAG (2009), Annual Report on community 20 per cent payments, National Directorate of Land Affairs
Morgado, M. F. (2003), Mozambique. In: Proceedings of the Second Regional Policy Dialogue on Air Pollution and its Likely Transboundary Effects in Southern Africa. Progress on Air Pollution Issues in Southern Africa, 36 p
Mota H., Pereira M.A.M., Gonçalves M., Ridgway T., Schleyer M.H. (2002), Coral Reef Monitoring in Mozambique II: 2000 Report, Coral Reef Monitoring Programme, MICOA/CORDIO/ORI/WWF, Maputo, 31 pp
Moyo S., O’keefe P. and Sill M. (1993), The Southern African Environment, Profiles of the SADC Countries, London, Earthscan Publications Ltd
MPD and NASA (2010), Poverty and Wellbeing in Mozambique: Third National Poverty Assessment, National Directorate of Studies and Policies Analysis, Ministry of Planning and Development, Mozambique
Nakala M. (1997), Forest Resources Management: Prospects of a Logging Concession, a Case Study from Muanza, Cheringoma and Marromeu Districts, Central Mozambique, MSc Thesis, Agricultural University of Norway (NLH), Centre for International Environment and Development Studies Studies – NORAGRIC
Nielsen Ø. J., Bandeira R., Helles F., Kamelarczyk K., Macucule A., Mlay G., Olsen S., Sitoe A., Taquidir M.A. (2006), Forests and Livelihoods in Mozambique: a literature review and annotated bibliography, Faculdade de Agronomia e Engenharia Florestal, UEM and Danish Centre for
Prepared by sba-Ecosys p. 82 January 2012
Forest, Landscape and Planning, Maputo, Moçambique and Copenhagen, Denmark, Gráfica Académica Lda, 233 p
Norfolk S. (2004), Examining Access to Natural Resources and Linkages to Sustainable Livelihoods: A case Study of Mozambique, LSP Working Paper no. 17, FAO, Rome
Rural Association for Mutual Support, Mozambique (2006), Forestry in Zambezia: Chinese Takeaway, http://www.sarpn.org/documents/d0001929/ORAM_Forestry_Zambia-China.pdf
Poverty, Health, & Environment, Placing Environmental Health on Countries, Development Agendas Poverty-Environment Partnership, Joint Agency Paper, 2008 (joint product of staff from Asian Development Bank, Austrian Development Agency, German Federal Ministry for Economic Cooperation and Development, Ministry of Foreign Affairs of Denmark, Department for International Development, European Commission, Finland Ministry of Foreign Affairs, International Institute for Environment and Development, Irish Aid, London School of Hygiene and Tropical Medicine, Norwegian Agency for Development Cooperation, Swedish International Development Cooperation Agency, Swiss Agency for Development and Cooperation, United Nations Development Programme, United Nations Environment Programme, Water Aid, World Bank, World Health Organization, and World Resources Institute)
PARPA – II (2006 – 2009), Mozambique: Plano Estratégico de Redução da Pobreza: Plano de Acção de Redução da Pobreza Absoluta em Moçambique, see also República de Moçambique. (2006), Plano de Acção para a Redução da Pobreza Absoluta 2006-2009 (PARPA II)
Pillet G. (2001d), L’Efficace, le Juste et l’Ecologique, Helbing & Lichtenhahn, Bâle, Munich, Genève
PEI (2010), Evaluation économique de la gestion environnementale au Mali: coûts et bénéfices - rapport final, Fevrier 2009, Republique du Mali
PEI (2010), Evaluation des coûts de la dégradation ou de la mauvaise utilisation des ressources naturelles en Mauritanie, Octobre 2008 - Note de synthèse
PEI (2010), Evaluation économique des coûts et bénéfices de la gestion de l’environnement en Mauritanie - Application aux ressources Hydriques, Pastorales et Halieutiques
PEI (2010), Evaluation Environnementale Strategique (EES): Secteurs eau et developpement rural, rapport provisoire
PEI (2004), Exploring the Links: Human Well-Being, Poverty and Ecosystem Services, National Institute of Statistics. www.ine.gov.mz
Queface A.J., Piketh S.J., Annegarn H.J. and Holben B.N. (2003), Retrieval of aerosol optical thickness and sie distribution from Cimel Sun photometer over Inhaca Island, Mozambique, J. Geophys. Res. 108 (D13), 8509, doi:10.1029/2002, JD002374
República de Moçambique (2006), Plano de Acção para a Redução da Pobreza Absoluta 2006-2009 (PARPA II)
República de Moçambique (1999), Estruturas e Estratégias de Gestão de Calamidades, Cultivando a Cultura de Prevenção, Instituto Nacional de Gestão de Calamidades, Política Nacional de Gestão de Calamidades. Estatutos do Instituto Nacional de Gestão de Calamidades, Plano Nacional de Acção para Gestão de Calamidades, Maputo
Ronnback P. (1999), The ecological basis for economic value of seafood production supported by mangrove ecosystems, Ecological Economics 29 (1999), pp 235–252
Rosenberger R.S. and Loomis J.B. (2001), Benefit transfer of outdoor recreation use studies: A technical document supporting the Forest Service Strategic Plan (2000 revision), General Technical Report RMRS-GTR-72, Fort Collins, CO: USDA Forest Service, Rocky Mountain Research Station
SANF (2006), Slow Progress on Phase out of Leaded Fuel in SADC, Southern African News Features, 17 January 2006, http://allafrica.com/stories/200601170107.html
Schwela D. (2007), Review of Urban Air Quality in Sub-Saharan Africa, The World Bank Clean Air Initiative in Sub-Saharan Cities, 260 p
Seraj K. (2009), Willingness to Pay for Improved Sanitation Services and its Implication on Demand Responsive Approach of BRAC Water, Sanitation and Hygiene Programme, to be published in The Role of Public Toilets in Urban Sanitation, Icfai University Press, Expected date of publication
Smirnov A., Holben B.N., Kaufman Y.J., Dubovik O., Eck T.F., Slutsker I., Pietras C. and Halthore R.N. (2002), Optical proterties of atmospheric aerosol in maritime environments, Journal of the Atmospheric Sciences, Washington DC, 59 (3), pp 501-523
Sonne-Schmidt C., Arndt C. and Magaua M. (2009), Contribution of Mega-Projects to GPD in Mozambique, Conference of IESE Dinâmicas da Pobreza e Padrões de Acumulação Económica em Moçambique, Maputo, 22 and 23 of April 2009
Stewart B.A. and Robison C.A (1997), Are agroecosystems sustainable in semiarid regions? Adv. Agronomy 60, pp 191-228
Sundström T. (1992), Water Quality studies for Environmental Impact Analysis. A case study from the Pequenos Libombos Reservoir, Mozambique, in Strömquist, L. (ed.) Practical approaches to environmental impact assessments in developing countries, UNGI Rapport 82, Uppsala, pp 95-144
Swap R.J., Annegarn H.J. and Otter L. (2002), Southern African Regional Science Initiative (Safari 2000) summary of science plan, South African Journal of Science 98 (3-4), pp 119-124
Tanner C. and Baleira S. (2006), Mozambique’s legal framework for access to natural resources, The impact of new legal rights and community consultations on local livelihoods, Food And Agriculture Organization Of The United Nations, Livelihood Support Programme (LSP), ftp://ftp.fao.org/docrep/fao/009/ah249e/ah249e00.pdf
Taylor R. P., Govindarajalu C., Levin J., Meyer A. S and Ward W.A. (2008), Financing energy effi ciency : lessons from Brazil, China, India, and beyond, The International Bank for Reconstruction and Development / The World Bank
Tietenberg T. (1996), Environmental and Natural resource Economics, Harper Collins CollegePublishers, New York
Tyson P.D., Garstang M., Swap R., Kâllberg P. and Edwards M. (1996), A air transport climatology for subtropical southern Africa, International Journal of Climatology 16, pp 265-291
UNEP (2011), Towards a green economy: Pathways to sustainable development and poverty reduction, www.unep.org/greeneconomy
UNEP and PNUD (2009), Summary Project Report: Poverty and Environment initiative, Mozambique
UNEP-GEF (2007), Framework for a strategic action programme for addressing land-based sources and activities in the Western Indian Ocean Region, 24 p
UNEP and IISD (2005), Connecting poverty and ecosystem services: a serie of seven country scoping studies: Focus on Mozambique
University of California - San Diego (2008, July 23), High Economic Value Set On Threatened Mexican Mangroves, ScienceDaily
U.S. Congress (1991), Office of Technology Assessment, Energy in Developing Countries, OTA-E-486 Washington, DC, Government Printing Office
World Bank (2010), Economics of Adaptation to Climate Change, 2010, Mozambique Country case study P114750, 120 p
World Bank (2008), Managing the Miombo Woodlands of Southern Africa Policies, incentives and options for the rural poor, Sustainable Development Department, Environment and Natural Resources Management Unit Africa Region. Draft- prior to final publication, 66 p
World Bank (2007), African Development indicators, http://siteresources.worldbank.org/INTSTATINAFR/Resources/adi2007_final.pdf
World Bank (2007), Mozambique Country Water Resources Assistance Strategy: Making Water Work for Sustainable Growth and Poverty Reduction; preliminary publication
World Bank (2008), Mozambique: Country Partnership Strategy 2008–2011, http://siteresources.worldbank.org/MOZAMBIQUEEXTN/Resources/Mozambique_CPS_2008_2011.pdf
World Bank (2005), The Role of Water in the Mozambique Economy – Identifying Vulnerability and Constraints to Growth –
Wilkinson C.R. and Buddemeier R.W. (1994), Global Climate Change and Coral Reefs: Implications for people and reefs, Report of the UNEP-IOC-ASPEI-IUCN Global Task Team on the Implications of Climate Change on Coral Reefs, 122 pp.
Whittington D., Pattanayak S.K., Yang J-C. and Bal Kumar K.C. (2002), Household demand for improved piped water services: evidence from Kathmandu, Nepal, Water Policy 4, pp 531–566
Whittington D., Lauria D.T. and Mu X. (1991), A study of water vending and willingness to pay for water in Onitsha, Nigeria. World Dev 19, pp 179–198
Whittington D., Briscoe J., Mu X. and Barron W. (1990a), Estimating the willingness to pay for water services in developing countries: a case study of the use of contingent valuation surveys in Southern Haiti. Econ Dev Cult Change 38, pp 293–311
Whittington D., Mu X., Roche R. (1990b), Calculating the value of time spent collecting water: some estimates for Ukunda, Kenya. World Dev 18, pp 269–280
Wild H. and Barbosa G. (1967), Vegetation map of the Flora Zambesiaca area, in Wild, H and Fernandes, A. (editores) Flora Zambesiaca, Salisbury
Wolf B. and Lorenzini M. (2007), Land unit-land system mapping of Moçambique. Integrated Assessment of Mozambican Forests (AIFM), Direcção Nacional de Terras e Florestas, Maputo, 53 p
World energy council (2001), Pricing Energy in Developing Countries, http://www.regulationbodyofknowledge.org/documents/163.pdf
Zucula J.N. (2003), Quantificação de Queimadas e Incêndios Florestais em Moçambique usando Imagens de Satélite. Tese de Licenciatura. Maputo, UEM, Faculdade de Ciências, Departamento de Física
Earth Trends Country Profiles (2003)
COP 14 Doc. 37.1 (2007) Convention on International Trade in Endangered Species of Wild Fauna and Flora. Fourteenth Meeting f the Conference of the Parties. The Hague (Netherlands), 3-15 June 2007
Prepared by sba-Ecosys p. 85 January 2012
VI. ANNEXES
ANNEX 1: CDI and CR valuation protocol
Annex 1 explains how the CDI and CR have been computed. In order to fully understand the notions and the background of the calculations, knowledge on environmental economics and more specifically on economic valuation methodologies is required. The reading of environmental economist textbooks45 might thus be useful.
Annex 1 explains the process of data collection and gives details explanations on the logic of the calculations of the CDI and CR (the valuation protocol) so that they might be discussed and modified. Adapting the valuation protocol will indeed be justified in the future as soon as better data are available or new categories of environmental damages are identified.
Finally, note that the available time and budget devoted to this study did also not allow preparing a spread sheet linking data, hypothesis to the final results. According to previous experience, the spread sheet seems appealing, it is however of little concrete use and considerable amount of time is required to make a fair and understandable version of such document.
1. Data
The study was performed using the most recent and available data on Mozambique. The complete data set is available on a spread sheet. All data are secondary data. Data have been collected first from official sources, reports from international organizations and NGOs and academic institutions.
When no data have been found, proxies have been estimated by confronting the judgements of local experts or by transferring data from similar studies. Table A1 shows some data that have been estimated and discussed among the expert groups. Table A2 shows information transferred from existing studies (benefit transfer). They concern mainly Willingness To Pay or prices estimated by academic studies in African countries.
Wastewater - Household water used 130'818'000 m3/y
Number of needed modern ovens 2907067 units
Outdated cars 276'349 4 wheels cars
45 see, for example : Lesser, J. A., D. E. Dodds & R. O. Zerbe, 1997, Environmental Economics and Policy. Addison-Wesley. Pearce, D. W. & K. T. Turner, 1990, Economics of Natural Resources and the Environment. The Johns Hopkins University Press, Baltimore. Tietenberg T., 1996, Environmental and Natural resource Economics. Harper Collins College Publishers, New York.
Prepared by sba-Ecosys p. 86 January 2012
Table A2: Information transferred (example)
WTP - river quality (economic use) and amenity
0.4-0.7 USD/hh/y Imandoust, S.B.; Gadam, S.N., (2007). Are people willing to
pay for river water quality, . Int. J. Environ. Sci. Tech., 4 (3), 401-408.
WTP - river quality (economic use) and amenity
0.5-1 USD/hh/y
Alam, K., Marinova, D. (2002) Valuing Benefits of Environmental Improvement: The Case of the Buriganga River in Bangladesh, in S. Karner and B. Wieser (eds) Proceedings of the International Summer Academy on Technology Studies: Technology and the Public, Deutschlandsberg, Austria, pp. 169-176
WTP sanitation 8.5-12 USD/hh/y
Seraj.K., “Willingness to Pay for Improved Sanitation Services and its Implication on Demand Responsive Approach of BRAC Water, Sanitation and Hygiene Programme”. To be published in “The Role of Public Toilets in Urban Sanitation”, Icfai University Press. Expected date of publication, October, 2009.
WTP sanitation 15-19 USD/hh/y
Fujita Y, Fujii A, Furukawa S, Ogawa T (2005) Estimation of willingness-to-pay (WTP) for water, sanitation services through contingent valuation (CVM) method, a case study in Iquitos City, the Republic of Peru. Japan Bank for International Cooperation.http://www.jbic.go.jp/english/research/report/review/pdf/ report10_2.pdf
WTP potable water 21-25 USD/hh/y
Fujita Y, Fujii A, Furukawa S, Ogawa T (2005) Estimation of willingness-to-pay (WTP) for water, sanitation services through contingent valuation (CVM) method, a case study in Iquitos City, the Republic of Peru. Japan Bank for International Cooperation.http://www.jbic.go.jp/english/research/report/review/pdf/ report10_2.pdf
WTP - air pollution 12 USD/hh/y
Belhaj, M. (1998) Energy, transportation and urban environment in Africa: the case of Rabat-, Salé, Morocco, Dissertation, Department of Economics, Gothenburg university.
WTP - air pollution 1-3 USD/hh/y Belhaj, M. (2003) “Estimating the benefits of clean air; Contingent valuation and hedonic price methods”. International Journal of Global Environmental Issues, 3.
WTP for electricity (electrification)
175 MTZ/hh/month Energy Usage and Socio-economic Conditions in Mozambique Evidence from GTZ Electrifi cation Project Regions,Heft 56
WTP for solide waste management
17 USD/hh(month
Adepoju, A.A and K.K. Salimonu (2010): Household Willingness to pay for Improved Solid Waste management in Osun State, Nigeria. A paper presented at the 4th International Network on Appropriate Technology held from 24th to 27th November, 2010, Accra Ghana
Prepared by sba-Ecosys p. 87 January 2012
2. Water
a) CDI = 4.5 % of GDP
Overall damages in water amount to 4.5 % of the GDP. It is composed of damages to health and quality of life (3.4 % of GDP), natural capital (0.7 %) and inefficiencies (0.4 %).
Health and the quality of life
The consequences of lack of access to safe water and sanitation on health are expressed as “DALYs”(disable adjusted life years). DALYs is a statistic adjusting, in terms of loss of healthy years in a person’s life, the consequences of illnesses and premature death resulting from water related diseases in a country per year. This indicator was developed by the WHO and the World Bank with the collaboration of international experts in order to provide a harmonised measure of the impacts of environmental degradation on human health. For waterborne diseases, DALYs lost in Mozambique are estimated at 588’681 units in 2004 (the most recent available estimate). We considered that the value of one DALYs is equal to the GDP per capita (as done in similar study).
The number of DALYs remains however a rough estimates of the consequences of lack of access to safe water and sanitation since they are based on epidemiological data, which are crude estimates in Mozambique. Furthermore, the figures of prevalence are rather uncertain and we generally expect that there is some double counting since sickness may be due to various reasons and sick people are likely to suffer from various diseases at the same time. In order not to avoid overestimating the impact of water pollution on health, the result has to be weighted. We thus proposed to weight the DALYs by 0.5. The percentage obtained is 1.4 % of the GDP.
Furthermore, as far as water pollution is also due to the to improper waste disposal, part of the damage has to be attributed to the domain "waste". This reallocation is rather artificial but highly needed. Otherwise, damage in the waste categories are clearly underestimated leading to unclear policy conclusions. We thus added 25% of the previous damages (25% * 1.4% of GDP= 0.35% of GDP) to waste. Overall, 62.5% of the total amount of DALYs is thus considered.
The damages due to lack of access to safe water (impact on the quality of life - higher risk of illness and hardness) are estimated by taking the average of the results of two alternative methods:
1. First, a willingness to pay (WTP) for accessing safe water is transferred from a South African study (Kanyoka et al. 2008)46. The source study provides a WTP for tap water in rural area. WHO data is used for estimating the number of households without access to safe water. The WTP are transferred according to difference in GDP-PPP per head and size of household between the location of the source study and Mozambique.
2. Second, the mitigation costs resulting from a lack of access to water are computed for rural and urban areas.
In rural areas, such mitigation cost is estimated according to the value of time spent (16 hours per week per household with no water connection, see Wittington, 1990a, 1990b, 1991, 2002) for collecting water. Rural wages (66 MZN/day) is considered for valuing such time loss. A second estimate uses the value of time calculated in the Wittington studies. The final result is the average of both estimates.
46 KANYOKA, P; FAROLFI, S and MORARDET, S. Households' preferences and willingness to pay for multiple use water services in rural areas of South Africa: an analysis based on choice modelling. Water SA (Online) [online]. 2008, vol.34, n.6 [cited 2010-12-03], pp. 715-723 .
Prepared by sba-Ecosys p. 88 January 2012
In urban area, the mitigation cost is equal to the additional cost to be paid for delivered water (the additional cost of getting water from vendors instead of network water is computed). Such additional cost has been estimated at around 6000 MZN/hh/y. For estimating the quantity of water consumed by the households, we consider the consumption levels for a family of five according to the World Health Organization (WHO): 10 m3/month can be considered as an average consumption. Correcting for household size, this lead to a global water consumption of 260 million of m3 per year by household, around 25-30 litres per day per person. This is rather different that the human development report data (2006) that indicates that the average use in Mozambique is less than 10 litres per day per person in 2002. We kept the first estimates since we could not traced back the second. However, if the second estimate had been considered, the calculated damage would be logically 2.5 times lower.
Averaging both previous estimates (WTP and transaction costs), the damage due to lack of access to safe water (impact on the quality of life - higher risk of illness and hardness) amounts to 1.6 % of GDP.
The damages due lack of access to sanitation are estimated by considering the WTP for access to sanitation. An average of WTP from 3 source studies (Fujita et al., 2005; Seraj et al., 2009, Banerjee et al, 2008 ) is used. The WTP are transferred according to difference in GDP-PPP per head and size of household between the location of the source study and Mozambique. The percentage obtained is 0.4 % of the GDP.
Table A4 presents the results.
Table A4: Water CDI - Health, quality of life
Health / quality of life % GDP
Water related diseases DALYS (0.5*588'681) 1.4%
Population without access to water
(loss of well-being) WTP - transfert 0.4%
Mitigation cost (rural + urban) 2.8%
Average 1.6%
Population with no sanitation WTP (average of 3 sources) 0.4%
Total 3.4%
Natural capital
The pollution of water reduces the quantity of water available for others. Such damage is estimated by considering the amount of discharge water valued at the current price of water in the Mozambican economy.
An average price of 0.38 USD/m3 is used (Banerjee et al, 2008). The consequence of polluted water is thus estimated by referring to the water price since we could consider that polluted water has to be replaced by "new" fresh water. The marginal cost of obtaining water from another well should have been considered as an “alternative”, but no valuable estimates could be computed for Mozambique. So the price of water has been kept.
Finally, in order to avoid double counting with DALYs (polluted water also causes illness), the result is weighted by 0.5.
Prepared by sba-Ecosys p. 89 January 2012
Since no data on quantities of polluted water are available, discharged polluted water has been estimated as 50 % of household water and of industrial water consumption, 10 % of water consumed by livestock and 1 % of water consumed by agriculture and forestry. The opportunity cost of irrigation water has been estimated at 1/10 of the price of water. Such hypothesis captures the fact that irrigation water does not compete with other uses and rest on the "natural" movement of water.
The amounts of water consumption of industries, agriculture and forestry have been taken from the World Bank (2007 and 2005). The way we estimate the amount of water consumed by households has already been explained under "health and quality of life".
Table A5 shows the results. The damages in natural capital amount to 0.73 % of the GDP, rounded up to 0.7% of GDP.
Table A5: Water CDI - Natural capital
Natural capital % GDP
Polluted water Household 0.68%
Industries 0.02%
Agriculture 0.01%
Livestock 0.02%
Forestry 0.00%
Total 0.73%
c) Inefficiencies
Finally, we computed inefficiencies in water used. Distribution losses (beyond the rate of unavoidable losses for which Mozambican statistics are available) in the network as well as water savings in irrigation were considered as inefficiencies.
The quantities of water loss in pipes are estimated by considering the difference between produced and consumed water according to Data from ADM and FIPAG in 2008 (around 50 million of m3 are loss per year). The result gives 0.25% of GDP.
Losses concerning the other uses of water had to be estimated. 40% of total irrigation water (as far as irrigation infrastructure are of poor quality) and 10% of other water consumptions are considered. However, such estimates (0.05% of GDP) remain vague and needs to be confirmed.
The monetary value of the lost m3 of water is estimated according to its price (0.38 USD/m3). The value of irrigation water has been estimated at 1/10 of the previous price of water. Such ratio states implicitly that irrigation water has a lower opportunity cost. However, the price of irrigation water could neither be estimated yet in Mozambique nor found in existing study. Such estimates has to thus to be considered with caution. It is equal to 0.1 % of GDP.
Overall, inefficiencies amount to 0.4 % of the GDP. Table A6 presents the results.
Prepared by sba-Ecosys p. 90 January 2012
Table A6: Water CDI - Inefficiencies
Inefficiencies % GDP
Pipe loss Water loss in urban pipe 0.25%
Irrigation and livestock and forestry 0.05%
Other loss Non pipe consumption 0.1%
Total 0.4%
b) CR = 2.7 % of GDP
Remediation costs for water are estimated to be equal to the yearly needed expenses for increasing water coverage.
First, Mozambique needs over USD one billion (EUR 0.9 billion) in order to meet the millennium target of halving the number of people deprived of clean drinking water and basic sanitation by 2015 (see Agencia de Informacao de Mocambique, 27 Aug 200347). Such estimate dates from 2003. If we increase such investment by 50 % in order not to underestimate it, this corresponds to 1.14 % of the GDP for 12 years (reference period 2003-2015).
A supplementary increase by one third of the previous calculated amount (1.14 % of the GDP) is added to the remediation cost for reducing inefficiencies. Such hypothesis is justified in order to avoid underestimating the remediation. This leads to 0.38% of the GDP.
Finally, polluted water has to be treated; the needed investment is estimated at 4 USD/head/year (according to existing planned investment - see world bank 2005 and 2007). This leads to 1.2 % of the GDP if the whole population is considered.
Overall, the cost of remediation amounts to 2.72% of GDP, rounded up to 2.7% of GDP.
47
or http://www.medilinks.org/updates/water2.asp?NewsID=52
Prepared by sba-Ecosys p. 91 January 2012
3. Air
a) CDI = 1.4 % of GDP
Overall damages of air amount to 1.4 % of the GDP. They concern only the economic category "Health - quality of life".
The main consequences of air pollution are due to indoor pollution (dust due to firewood used, etc.) and outdoor pollution. The statistics on DALYs for air pollution (both indoor and outdoor) has been used. According to WHO (2004), Mozambique counts around 13'000 DALYs for outdoor air pollution and 370'000 for indoor air pollution (see table A7). We consider that 25% of DALYs for air pollution are caused by non environmental factors (mainly smoke from tobacco) and we keep 75% for our estimates (or around 277'000). As in the case of water, the calculated DALYs for the country are then multiplied by the GDP per capita. The calculated damage is equal to 1.3 % of Mozambican GDP (1.25 for indoor air pollution and 0.05 for outdoor air pollution).
Table A7: DALYs - air
Units Source
DALYS - air outdoor 13'082 oms 2004
DAYLS - air indoor 370'651 oms 2004
The damage due to outdoor air pollution in urban area (impact on the quality of life - higher risk of illness and hardship) are estimated by transferring a Moroccan WTP for better air quality in the city of Rabat-Sale (Belhaj, 2003). The source-study deals with the estimation of willingness to pay for a 50 % reduction of air pollution caused by road traffic in Rabat-Sale (Morocco) using contingent valuation and hedonic price methods. The WTP for Rabat-Sale is transferred according to difference in GDP-PPP per head and size of household between the location of the source study and Mozambique. Results give 0.1 % of the GDP.
The impact of air pollution on agricultural productivity (category: natural capital) was not relevant according to local experts.
Table A8 presents the results.
Table A8: Air CDI - Health, quality of life
Health / quality of life % GDP
Health impact - indoor air DALYs 1.25%
Health impact - outdoor air DALYs 0.05%
Quality of life (urban air quality) WTP 0.10%
Total 1.4%
b) CR = 1.0 % of GDP
First, the remediation costs are evaluated by considering the additional investment and related energy costs linked to the use of modern cooking device in urban area and closed ovens in rural areas. Figures are based on local estimates. On average, the needed expenses by household amount to MZN 1100 MZN. We consider that 80% of household have to be equipped, leading
Prepared by sba-Ecosys p. 92 January 2012
to a cost of 1.2 % of the GDP. The previous estimate is then weight by 50% since 50% of this remediation is attributed to deforestation. This leads to 0.6% of GDP.
Second, increased expenses for renewing the vehicle stock have been estimated. This may be associated with a faster renewing of actual cars and trucks or a better maintenance of the existing ones. 100 USD per vehicle has been considered which corresponds to the average maintenance cost per vehicle for reducing emission by 50 % (see Faiz et al., 1994). 20 USD per motocycle has been used. The number of 4 wheels vehicles (including trucks) is 280'000 and 2 wheels vehicules is 50'000 (Institute national of statistics). This leads to 0.4 % of the GDP. Note that no information on the average age (and thus efficiency) of the vehicle stock is available in Mozambique. Such information is highly needed for checking the previous results.
Overall, the cost of remediation for Air amounts to 1% of GDP.
Prepared by sba-Ecosys p. 93 January 2012
4. Soil and deforestation
a) CDI = 3.5% of GDP
CDI in the domain of soil, landscape and deforestation amounts to 3.5 % of the GDP. They are composed of damages concerning "health and the quality of life" (1.3 % of the GDP) and damage to "natural capital" (2.2% of the GDP).
Health and the quality of life
The economic category "health and the quality of life" concerns the amenity loss due to deforestation (non-use value of forest). This is estimated according to a WTP transfer from the mean value estimated in the literature review of Rosenberg et Loomis (2001). The WTP is transferred according to difference in GDP-PPP per head and size of household between the location of the source study and Mozambique, leading to 1550 MZN/household. The value of the damage is obtained by multiplying the WTP by the 50% of the number of households (our hypothesis states that 50% of the whole population is concerned by forest amenity); this amounts to 1.3 % of the GDP.
Natural capital
Agricultural soil degradation is valued according to the value of the estimated production loss resulting from it. Observing crop yield statistics, 20 % to 40 % variation in crop yield could be attributed to various soil types and location. We have considered thus that the degradation of soil is responsible for a loss of 70% of the yield (3500 MZN/ha in Mozambique) on 15% of the cultivated area (15% of 7.6 million ha). Such amount (15%) is around half of the standard amount reported by the UN in the country profile of Mozambique48. This leads to a damage of 1.5% of GDP.
We also consider the cost of fertilizers actually used in the country, since such expense could be considered as one of the opportunity cost of soil degradation. The fertilizers bill (30'000 t at 600 USD/t) is negligible, representing 0.01 % of the GDP (based on trade statistic). However, such estimate does not include the opportunity cost of the working time due to the use of fertilizers, which could not be estimated. Ignoring the value of time, the yield loss due to the degradation of soils is thus a conservative estimate of the damage.
According to the WB (2008), the loss of use value (timber) of one forested hectare before and after deforestation is estimated at USD 180. Multiplying the net area deforested (estimated at 200'000 ha, reforested areas are deduced) by the previous value leads to a damages representing 0.64 % of the GDP. Note that the non-use value of the forest was not ignored, it has been captured under the economic category "health and the quality of life". However, the value of forest as a source of biodiversity could not be estimated.
Table A9 recalls the previous results. The damages in the natural capital domain represent 2.15% of the GDP, rounded up to 2.2% of the GDP.
Table A9: Soils, Deforestation CDI - Natural capital
Natural capital % GDP
Loss of top soil | Overexploitation - erosion
Yield loss 1.5%
Cost of fertilizers / Opportunity cost 0.01%
Deforestation Loss of value woody and non-woody product 0.64%
First, we consider the needed spending for improving the management of protected areas in
Mozambique. According to actual spending, additional needed expenditure could be estimated at 0.1 % of the GDP, such amount corresponds to an increase of management cost around 2 USD /ha on 4'000'000 ha. 2 USD/ha is based on Bruner et al. (2004) indicating that the average current spending for protected areas ranges from 0.05 to 3.00 USD per ha in existing studies, while actual needs range from 0.90 to 9.00 USD per ha. 2 USD/ha cover around one quarter of the average gap (8.95 USD/ha).
Second, we considered the cost of implementing conservative agricultural practices (as intercropping, crop diversification and traditional technique for fighting against soils erosions). Costs have been estimated at around 20 USD/ha (according to FAO estimates) for 10% of the total agricultural area. This leads to an estimate of 0.2% of the GDP.
Finally, we also consider the expenses linked to doubling reforestation efforts made in 2008 (9899 ha). Actual reforestation cost is estimated at 150'000 MZN/ha. Such effort leads to a cost of 0.6 % of the GDP.
In order to reduce actual deforestation rates, 25 % of the remediation associated with the modernization of cooking devices (alternative fuel) has been considered (see "Air"); this amounts to 0.7 % of the GDP.
Table A10 presents the results.
Table A10: Soils, Deforestation CR
Remediation costs % GDP
Protected area Increasing management cost of protected areas 0.1%
Conservative agricultural practices intercropping, crop diversification and traditional technique for fighting against soils erosions
Alternative cooking fuel Cost of modern ovens and energy 0.6%
Total 1.4 %
Prepared by sba-Ecosys p. 95 January 2012
4. Waste a) CDI = 2.4%
CDI in the domain of waste amounts to 2.4% of the GDP. They are composed of damages concerning "health and the quality of life" (2.1 % of the GDP), damage to "natural capital" (0.2% of the GDP) and inefficiencies (0.1% of GDP)
Health and the quality of life
The damages on health and the quality of life concern both collected and uncollected wastes.
Collected waste generates a financial cost for the society. The opportunity cost of collected waste is computed according to collection and treatment cost of waste. Quantities of waste have been computed using a national report on waste management49. Estimated quantities of collected waste range around 2.5 million t of household waste. Collection and treatment cost are set at 27 USD/t. Overall, the opportunity cost amounts to 0.9% of GDP for household waste. Note that no data allow computing damages for industrial waste.
For uncollected waste, and as indicated in the previous explanation for water, we take the option of transferring part of the damage on health due to water pollution (25 %) to the waste category since the disposal of waste is a significant cause of water pollution. Similarly, "re-allocation" has been done in the previous studies (for Mali and Burkina Faso). This amounts to 0.3 % of GDP.
Furthermore, additional (non-health) losses of well-being for uncollected waste are estimated according a WTP for better waste management. We transfer a WTP estimate from a Nigerian case study. The WTP has been adapted to Mozambique according to difference in GDP-PPP per head and size of household between the location of the source study and Mozambique, leading to 17 USD/y/household. The total numbers of household is considered. This amounts to 0.9 % of GDP
This leads to an estimate of 2.1% of the GDP for the impact of waste on the health and the quality of life (see table A11 for the details).
Table A11: Waste CDI - Health, quality of life
Health and the quality of life % GDP
Collected household waste Opportunity cost : value of time to clean the surroundings 0.9%
Uncollected waste : Sickness - water and sanitation
Part of damages computed on "water" 0.3%
Uncollected waste WTP of 17 USD/y/hh 0.9%
Total 2.1 %
Natural capital
Recycling has been considered as a benefit (negative damages). The value of recycling relies on the quantity of recycled waste and the price paid for such recycled materials. This amounts to a negative damage (i.e., a benefit) of 0.32 % of the GDP. Such estimate considered that recycling activities could provide job to 3% of the urban population. Such estimate is based on the World Bank study identifying 1-2 % of the urban population in 1988 (Bartone, 1988). The minimum wage level is considered50. 50% is attributed to inefficiencies, so that -0.16% is kept in natural capital.
49 see http://www.un.org/esa/dsd/dsd_aofw_ni/ni_pdfs/NationalReports/mozambique/Waste_Management.pdf 50
We also consider that waste recycling could be increased in Mozambique, so that an unexploited potential has to be estimated (additional benefit). Based on expert judgements, we estimates that around 5 % of the actual active population could get a complementary income of 1300 MZN/month (half of minimal wage) working directly or indirectly for recycling activities. 50% is attributed to inefficiencies, so that 0.23% is kept in natural capital.
Waste dumps are considered unproductive land in the future. The resulting losses are evaluated according to the estimated average rent in Mozambique (MZN 160/m2/month in urban areas, and MZN 25/m2/month in rural ones). The size of waste dumps is built by considering 0.02 m2 of landfill per habitant (average number found in the Burkina Faso study). This amounts to 0.13 % of the GDP.
This leads to an estimate of 0.2% of the GDP for the impact of waste on the natural capital.
Inefficiencies
Inefficiencies considered 50% of the previous benefit from recycling (the negative damage of 0.16%) as well as 50% of the damages (lost income) of the remaining potential of recycling. This leads to 0.07% of GDP (0.23%- 0.16%), rounded up to 0.1%.
b) CR = 2.3%
Remediation cost for waste considers the overall collection and treatment costs in Mozambique. This amounts to 2.3% of the GDP. Such estimate includes:
The actual cost of waste collection and management: 0.9% of GDP. Such cost is equal to the opportunity cost of waste estimated in the damages.
The expenses corresponding to an increase of 60% of management and collection costs for covering uncollected household waste: 0.6% of GDP.
We also increase actual management and collection costs in order to cover improvement in the quality of household waste management and collection, the amount has been estimated by considering an average of 12 USD per household per year. This equal to 0.6% of the GDP. The 12 USD per household has been set according to the average fee reported in Johannessen and Boyer (1999).
We also estimate an additional spending for upscaling recycling activities. This amounts to 0.2 % of the GDP. Such spending was calculated as an equivalent to MZN 1’250 wage subsidies per potential worker in the recycling activities.
Prepared by sba-Ecosys p. 97 January 2012
Prepared by sba-Ecosys p. 98 January 2012
5. Energy and materials
a) CDI = 5.1%
Energy and material losses are inefficiencies. The estimates of inefficiencies are difficult to set since determining inefficiencies needs to compare a given situation (for example, an amount of energy consumed) to a benchmark. In the case of Mozambique, data are lacking both for identifying the current level of energy and materials consumption of the country as well as for setting the benchmark. Thus, the estimates of inefficiencies for Mozambique are very broad and are to be considered with caution. They mainly illustrate the loss of GDP due to the inefficient use of 5 % of the energy and 2 % of the material goods in the country. The loss amounts to 5.1 % of the GDP.
Table A12: Material and energy inefficiencies
Material Inefficiency rates Total value (MZN/y) % GDP
Household consumption 2% 1.439E+11 1.07%
Services sector 2% 66'809'055'793 0.50%
Public services 2% 9'761'095'380 0.07%
Industries 2% 34'341'084'428 0.25%
Agriculture and livestock 2% 63'977'903'809 0.48%
Fisheries 2% 38'03'736'222 0.03%
Construction 2% 9'279'606'539 0.07%
Extractive industries 5% 3'387'488'000 0.06%
Total 2.5%
Energy Inefficiency rates Total value (MZN/y) % GDP
Fuel wood 7% 470'944'800 0.42%
biomass 7% 4'143'563 0.00%
Charcoal 5% 353'472'879 0.24%
Coal 5% 700'000'000 0.48%
crude oil 5% 17'721'300'000 (0.33%)
Distillate 5% 11'898'335'700 0.22%
Kerozen 5% 812'722'140 0.02%
Jet fuel 5% 1'161'837'486 0.02%
Fuel - car 5% 4'869'918'080 0.09%
LPG (liquid petroleum gaz) 5% 19'615'830 0.01%
Other 5% 15'091'798'628 0.28%
Gaz 10% 163'796 0.00%
Electricity - consumption 5% 821'430'000 0.56%
Electricity - distribution 10% 180'000'000 0.25%
Total 2.6%
Estimates of inefficiencies are set on indirect observation. As indicated in the report, inefficiencies are higher in developing countries and are due to inappropriate management, lack of knowledge, poor maintenance and the use of old technologies. We aim here to focus on inefficiencies that are the cheapest to solve, i.e. the ones that do not require a heavy investment.
We estimated the amount of energy used in the country and considered that 5 % could be spared without compromising on the actual level of living. The 5 % estimates are based on international
Prepared by sba-Ecosys p. 99 January 2012
comparisons of energy consumption (IEA energy statistics). This is also supported by existing evidence on inefficiencies (see UNEP green economy report, 2011; US congress, 1991; Taylor R. P. et al., 2008; World energy council 2001). Quantities have been collected from IEA statistics and the Ministry of Energy.
For wood and charcoal, more precise evidence leads to considering a loss of 10 % due to inefficiencies (World Energy Assessment - chapter 11, 2000).
For consumption goods, estimates have been built on the basis of the proportion of income devoted to subsistence goods (food, medicine, clothes, etc.) and considering that 2 % could be spared. 2 % is a subjective amount based on the comparison of the quantity of waste produced in Mozambique in relation to more developed economies. We also considered that 2 % of intermediary goods used in agriculture, fisheries, construction, industries and public service could be saved.
The evaluation is undertaken at the least cost price of each element. Table A12 presents the results for energy and materials.
b) CR = 1.7%
In order to reduce inefficiencies, price could be increase. The remediation has been calculated according to the following hypothesis: the remediation costs are equal to half of the amount of the damages costs. For inefficiencies concerning the use of fuelwood and charcoal, the remediation costs include also 25% of the remediation costs calculated for indoor air pollution (modern ovens and vehicles). As indicated in the report, results concerning inefficiencies are thus indicative since they are built on assumptions.
The previous remediation cost of 1.7% of GDP is equal to the additional expenditure for household and firms due to a 2-3% increase in price of energy and 1-2% increase of price of goods.
Prepared by sba-Ecosys p. 100 January 2012
6. Global environment
a) CDI = 0.6%
Costs associated with the global environment were considered in terms of CO2 emissions. The quantity of CO2 emissions (around 16 million of CO2 equivalent) is set according to the Ministry
for Co-Ordination of Environmental Affairs51.
The monetary valuation is undertaken at the value of carbon in the market of London (USD 10 per tonne of carbon, see http://www.carbonfund.org/ or http://www.carbonfund.org/2002). This leads to 0.6 % of the GDP.
The use of the carbon price on the European Carbon market would generate higher estimates since the price of Carbon in the European market is between USD 18 and 25 per ton. The carbon market in Europe is linked to binding objectives so that the demand of carbon permits is higher.
Note that biodiversity loss cannot be estimated yet on the basis of the previous protocol. Note also that many studies that evaluated "biodiversity" are actually valuing production and consumption loss that we consider in our study (soil degradation, water pollution).
More particularly and as indicated in eth main report, no value for the impacts on mangroves could be computed due to insufficient and contradictory data on coastal degradation. However, mangroves degradation might imply loss of catches for fishermen as well as loss of biodiversity. The value of the watershed protection provided by intact coastal ecosystems, such as mangroves and other wetlands, has been estimated at USD 845/ha/y in Malaysia and USD 1'022/ha/y in Hawaii. Estimates in Sri Lanka are set at USD 1'088/ha (Gunawardena, 2005) and in Mexico at USD 37'500/ha/y (Aburto-Oropeza). Overall, values appear to vary widely from case to another, estimates of the annual market value of capture fisheries supported by mangroves ranges from USD 750 to 16'750 per hectare according to Ronnback (1999). Applying such references to Mozambique leads to damage going from 0.21 % of GDP to more than 10.21 % of GDP (if 5 % of the mangrove is considered as completely degraded).The previous estimates are not included in this study since the extent of the mangrove degradation (assumed at 5 %) cannot be assessed yet in Mozambique and has a large incidence on the results (high sensitivity).
b) Cost of remediation
No estimate of the remediation cost for CO2 emission could be estimated on the basis of available data. Furthermore, part of this remediation effort might have been already considered in other remediation opportunities.
51
Mozambique Initial National Communication Under UN Framework Convention on Climate Change
Prepared by sba-Ecosys p. 101 January 2012
ANNEX 2: Distributive analysis
Distributive effects
CDI CDI/CR
ratios
WATER 5.7 4.5% 1.7
Health - Quality of life
Illness - unsafe water 6.4 1.4%
Lack of access - water 4.6 2.0%
Water floods and drought 6.0 (0.55%)
Natural capital - 0.7
Inefficiencies 5.5 0.4
AIR 5.1 1.4% 1.4
Health - Quality of life
Illness - outdoor air quality 4.4 0.05%
Illness - indoor air quality 6.2 1.25%
Loss of Amenity / quality of life 4.8 0.1%
SOILS | DEFORESTATION | COAST 4.0 3.5% 2.3
Health - Quality of life
Amenity of forest and rural area 3.4 1.3%
Amenity of beaches 0.7
Natural capital
Soil loss - Agricultural yield loss 5.9 1.5%
Cost of fertilizers - Opportunity cost 2.8 0.01%
Deforestation 6.3 0.64%
Coastal degradation 3.7 n.a
Mangrove loss 5.4 n.a
WASTE 3.5 2.4% 1.1
Health - Quality of life
Collected households waste 1.4 0.9%
Uncollected waste - water pollution + WTP 3.8 1.2%