27
MINISTRY OF ECONOMY │ DEPARTMENT OF BASIC INDUSTRIES MINISTRY OF ECONOMY DEPARTMENT OF BASIC INDUSTRIES MONOGRAPH OF MEXICO’S AVOCADO SECTOR: CURRENT STATUS AND MARKET OPPORTUNITIES

MINISTRY OF ECONOMY │ DEPARTMENT OF BASIC INDUSTRIES
MINISTRY OF ECONOMY
DEPARTMENT OF BASIC INDUSTRIES
MONOGRAPH OF MEXICO’S AVOCADO SECTOR: CURRENT STATUS AND MARKET OPPORTUNITIES

MINISTRY OF ECONOMY │ DEPARTMENT OF BASIC INDUSTRIES
FEBRUARY, 2012
MINISTRY OF ECONOMY │ DEPARTMENT OF BASIC INDUSTRIES
Contents 1. Background ......................................................................................................................................... 7
2. Avocado Market ................................................................................................................................. 7
2.1 Characteristics and Uses ............................................................................................................... 7
2.2 Varieties ......................................................................................................................................... 7
2.3 Industrialization ............................................................................................................................. 8
3. Global production ............................................................................................................................... 8
3.1 Harvested Area .............................................................................................................................. 8
3.2 Production ..................................................................................................................................... 9
3.3 Yields ............................................................................................................................................. 9
3.4 International Marketing ............................................................................................................... 10
4. Domestic Market Status .................................................................................................................... 11
4.1 Apparent Domestic Consumption (ADC) ..................................................................................... 11
4.2 Planted Area, yields and production ........................................................................................... 12
4.3 Production by State ...................................................................................................................... 15
4.4 Marketing .................................................................................................................................... 16
5. Price evolution and Profitability analysis .......................................................................................... 17
5.1 Production region prices ............................................................................................................. 17
5.2 Wholesale prices in supply centers .............................................................................................. 18
5.3 Consumer prices .......................................................................................................................... 19
5.4 Profitability Analysis ................................................................................................................... 19
6. Foreign trade and export opportunities ............................................................................................. 20
7. Institutional Support Structure .......................................................................................................... 23
7.1 Public Agencies ........................................................................................................................... 23
7.2 Regulations .................................................................................................................................. 24

MINISTRY OF ECONOMY │ DEPARTMENT OF BASIC INDUSTRIES

MINISTRY OF ECONOMY │ DEPARTMENT OF BASIC INDUSTRIES
1
MINISTRY OF ECONOMY │ DEPARTMENT OF BASIC INDUSTRIES

MINISTRY OF ECONOMY │ DEPARTMENT OF BASIC INDUSTRIES
MINISTRY OF ECONOMY │ DEPARTMENT OF BASIC INDUSTRIES
1. Background Mexico is the world leader in the avocado market. In 2009 it held a 27% share of the total planted land area. It is the largest exporter with a 40% share and has the highest per-capita consumption at 10 kg per year. Yields per hectare are ranked fourth in the world (10.1 tons/Ha), after the Dominican Republic (19.3 tons/Ha), Colombia (16.5 tons/Ha) and Brazil (12.9 tons/Ha). It is followed by Chile (10 tons/Ha) and the United States and Indonesia (9.8 tons/Ha).
2. Avocado Market
2.1 Characteristics and Uses The avocado tree is leafy and evergreen. It has very generous flowering and fruit is obtained in a very high percentage. The fruit is a seed berry and oval shaped having either a smooth or rough surface. It has a fairly wide weight range, from 120 g to 2.5 kg in commercial varieties. The avocado is greenish and can have a thin or thick skin. When ripe, the pulp has a consistency like hard butter and a flavor slightly reminiscent of a nut. It is very rich in protein and fat, with an oil content of 10 to 20%. Soils most recommended for cultivation are those that are light textured, deep and well-drained with a neutral or slightly acidic pH (5.5 to 7). However, it can be grown in clay or loam as long as there is good drainage. While avocado can be grown from sea level up to 2,500 meters above sea level, cultivation is recommended at altitudes between 800 and 2,500 m to avoid problems with diseases which are mainly root related. It is mainly used for consumption as an addition to all kinds of foods due to its high protein, vitamin and mineral content. Oils can be extracted from its rich fat and, after being processed, they are used in cosmetics and pharmaceuticals.
2.2 Varieties1 There are basically three ecological groups or races of avocado: Mexican, Guatemalan and West Indian. The internationally traded varieties are of Guatemalan or Mexican origin, especially the Hass, Fuerte and Nabal. The Hass variety has replaced Fuerte due to advantages in quality, productivity and resistance to commercial handling practices. In the United States, 95% of production comes from California, of which 85% is Hass. Harvesting takes place all year round, especially between December and August, taking advantage of the climate in various regions throughout the country. Most imports are made
1 FAO, product segmentation and market prospects for the European Community and the United States’ avocado market. 2005, pp.2-‐3

MINISTRY OF ECONOMY │ DEPARTMENT OF BASIC INDUSTRIES
between July and February. During these months demand also seems to decrease, possibly due to the higher prices paid for imported avocados. In the European Union, whose largest suppliers are Israel, South Africa, Spain, France, Mexico, Netherlands and Kenya, the main varieties are Hass and Fuerte. Influence of variety on avocado prices Farm prices vary drastically among the major producing countries. For example, in 2000-2009, producer prices were around $688 dollars per ton in Mexico, while prices in the United States, Australia and Spain were 2 to 2.5 times higher than in Mexico. The avocado markets in both the United States and the European Community (EC) contain large differences among products and feature major market segmentation. It is known that this market segmentation is mainly due to the varieties of products. Hass avocados are very different from other varieties, called "green" varieties. Among the most common are Fuerte, Ettinger and Pinkerton. Hass avocados are generally larger and are subject to strong consumer demand. They dominate international trade. Most green varieties are for domestic consumption within producing countries.
2.3 Industrialization The avocado presents a wide possibility of industrialized product uses, including pulps for spreadable products and oils which are traditionally destined for cosmetic and pharmaceutical use but can also be used as edible extra fine oil. Frozen avocado puree has been widely distributed because it is used as a raw material in various processes, both cosmetic and edible. Dehydrated avocado to be used for consumption is a good industrialization alternative as it has a greater shelf life than fresh avocados. Despite Mexico’s leadership this product, it has made minimal industrial use of it, with only 16% of total production.
3. Global production
3.1 Harvested Area During 1996-2009, worldwide harvested area grew at an average annual rate of 2.7%, reaching 436.3 million hectares in 2009. The leading avocado growing countries are, in order of importance, Mexico, Chile, Indonesia, United States, Colombia, Brazil and the Dominican Republic. Notably, Chile recorded the highest annual average growth rate (AAGR) of harvested area with a rate of 6.3% during this period. Meanwhile, the area harvested in Mexico during 2009 represented 28% of the total, putting Mexico in the number one position in the world.

MINISTRY OF ECONOMY │ DEPARTMENT OF BASIC INDUSTRIES
Avocado harvested surface by country, 1996-2009 (Thousands of hectares)
Source: FACTSTAT
3.2 Production During this same period, global production reported an average annual growth rate of 3.95%, reaching 3.8 million tons in 2009. Chile and the Dominican Republic recorded the most dynamic growth rates with 14% and 4.9%, respectively. Mexico reported an AAGR of 3.0% during this period. It was the largest producer and held a 32% share of global production during 2009.
Main avocado producers, 1996-2009 (Thousands of tons)
Source: FACTSTAT
3.3 Yields The average worldwide yield of avocado production during 1996-2009 was 8.3 (ton/Ha) with an AAGR of 0.62%. Mexico has an average yield of 9.8 ton/Ha, higher than the global average, but lower than the Dominican Republic, Brazil and Colombia. This represents an

MINISTRY OF ECONOMY │ DEPARTMENT OF BASIC INDUSTRIES
area of significant opportunity for development in Mexico, since it is already in first place in planted land area and production and a slight increase in yield would generate a significant impact on production.
Global avocado yield by country, 1996-2009 (Tons per hectare)
Source: FACTSTAT
The average yields per hectare range from 21.3 (ton/Ha) in the Dominican Republic and 12.0 (ton/Ha) in Colombia to 10.6 (ton/Ha) in Indonesia. In this regard, the Dominican Republic’s position is notable, with a 2% share of harvested area, accounting for 4.8% of world production. With these yields, the Dominican Republic would only need to dedicate about 13% of the globally harvested land area in order to reach production levels equivalent to those of Mexico.
3.4 International Marketing In 2010, the major avocado importing countries were the United States (47.1%), France (12.8%), Japan (6.1%) and Canada (4.9%). These countries accounted for 70.8% of total imports. When comparing 2010 with the previous year, it is notable that the U.S. reduced its share by 25%, while during the same period of comparison France increased its share by 13%.
Avocado importer countries*, 2010
* Subitem 080440 of the Harmonized System

MINISTRY OF ECONOMY │ DEPARTMENT OF BASIC INDUSTRIES
Meanwhile, Mexico is among the major avocado exporting countries with a 51.4% share of the market. Mexico is followed by Israel (11.6%), Peru (9.4%) and South Africa (8.0%).
Main avocado exporter countries*, 2010
*Subitem 080440 of the Harmonized System
4. Domestic Market Status
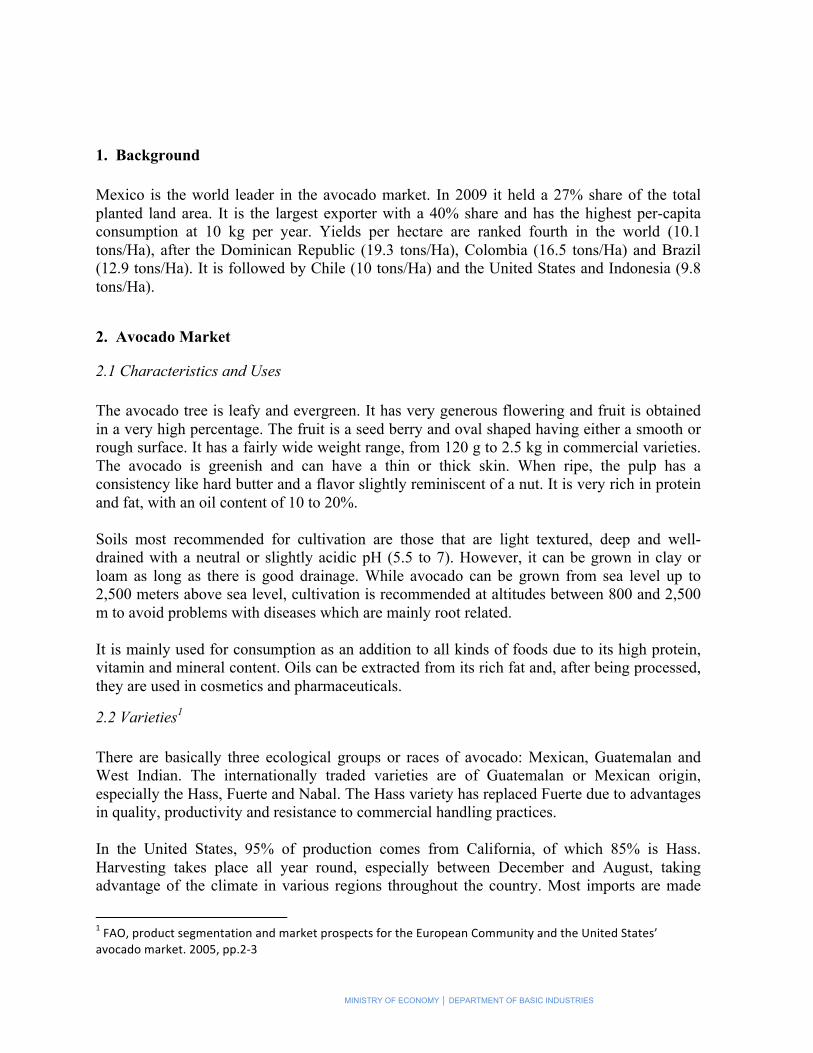
4.1 Apparent Domestic Consumption (ADC) In 2010, apparent domestic consumption of avocados in Mexico amounted to 738 thousand tons. This was an 11% drop from the previous year, but consumption behavior has been relatively stable in recent years. Domestic production shows an average 3% growth during the years 2003-2010. This is sufficient to meet domestic consumption and also provides a significant percentage of surpluses of close to 400 thousand tons for export. Exports show a good trend (16.8% on average during the last 8 years). Also, export production shares have increased during these years.
Avocado production and exports 2003-2010 (tons and percentages)
MINISTRY OF ECONOMY │ DEPARTMENT OF BASIC INDUSTRIES
Source: SIAP-SAGARPA-SIAVI, SE
AVOCADO: APPARENT NATIONAL CONSUMPTION Tons
Average annual growth rate
Source: SIAP-SAGARPA, SIAVI-SE
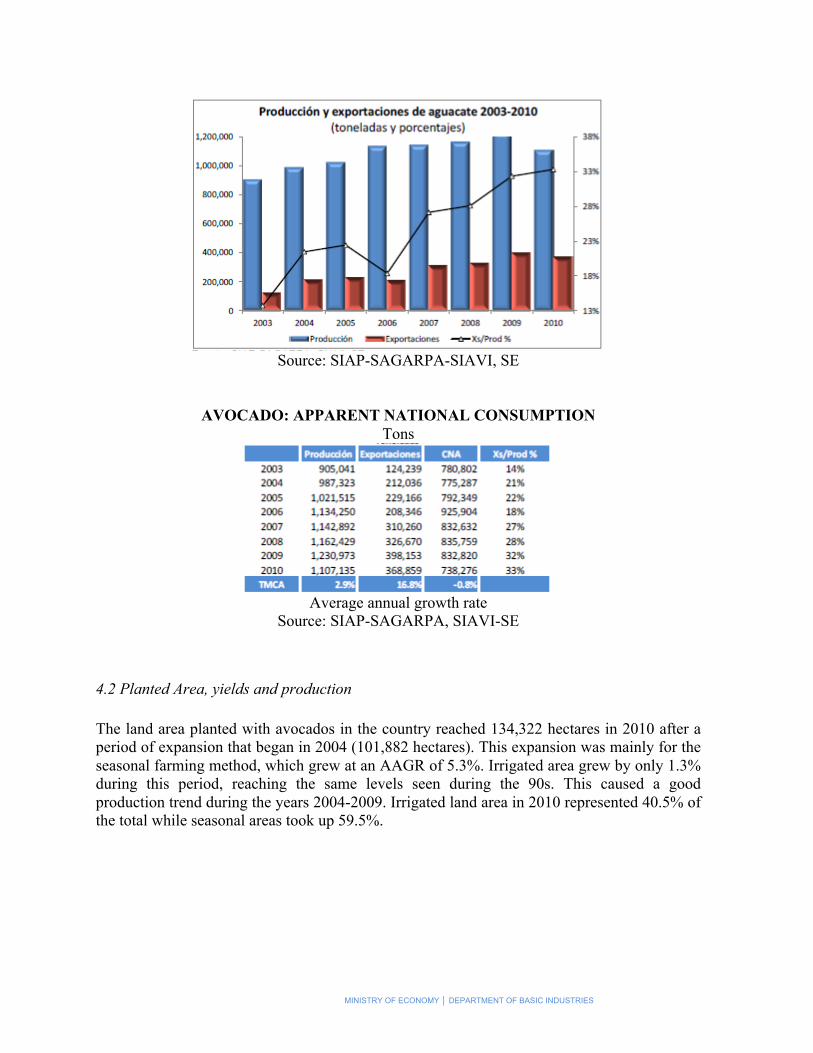
4.2 Planted Area, yields and production The land area planted with avocados in the country reached 134,322 hectares in 2010 after a period of expansion that began in 2004 (101,882 hectares). This expansion was mainly for the seasonal farming method, which grew at an AAGR of 5.3%. Irrigated area grew by only 1.3% during this period, reaching the same levels seen during the 90s. This caused a good production trend during the years 2004-2009. Irrigated land area in 2010 represented 40.5% of the total while seasonal areas took up 59.5%.
MINISTRY OF ECONOMY │ DEPARTMENT OF BASIC INDUSTRIES
Area planted with avocados by category, 1980-2010
Hectares
Source: SIAP-SAGARPA
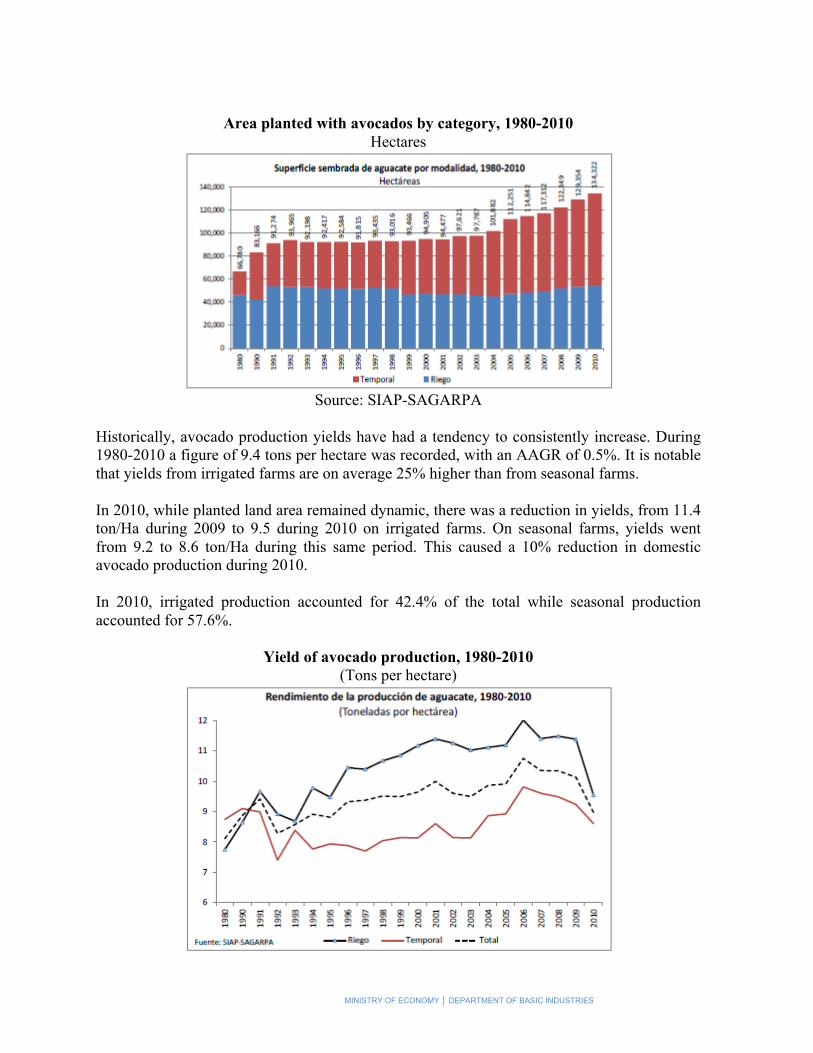
Historically, avocado production yields have had a tendency to consistently increase. During 1980-2010 a figure of 9.4 tons per hectare was recorded, with an AAGR of 0.5%. It is notable that yields from irrigated farms are on average 25% higher than from seasonal farms. In 2010, while planted land area remained dynamic, there was a reduction in yields, from 11.4 ton/Ha during 2009 to 9.5 during 2010 on irrigated farms. On seasonal farms, yields went from 9.2 to 8.6 ton/Ha during this same period. This caused a 10% reduction in domestic avocado production during 2010. In 2010, irrigated production accounted for 42.4% of the total while seasonal production accounted for 57.6%.
Yield of avocado production, 1980-2010 (Tons per hectare)
MINISTRY OF ECONOMY │ DEPARTMENT OF BASIC INDUSTRIES
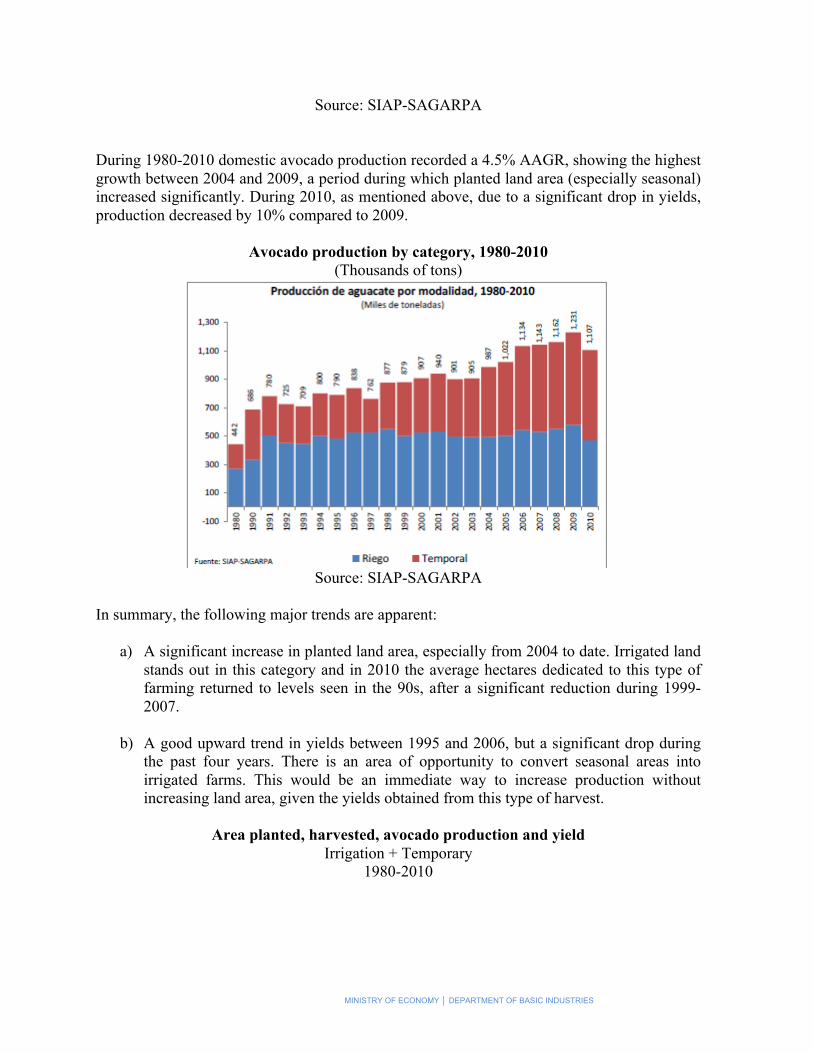
Source: SIAP-SAGARPA During 1980-2010 domestic avocado production recorded a 4.5% AAGR, showing the highest growth between 2004 and 2009, a period during which planted land area (especially seasonal) increased significantly. During 2010, as mentioned above, due to a significant drop in yields, production decreased by 10% compared to 2009.
Avocado production by category, 1980-2010 (Thousands of tons)
Source: SIAP-SAGARPA
In summary, the following major trends are apparent:
a) A significant increase in planted land area, especially from 2004 to date. Irrigated land stands out in this category and in 2010 the average hectares dedicated to this type of farming returned to levels seen in the 90s, after a significant reduction during 1999-2007.
b) A good upward trend in yields between 1995 and 2006, but a significant drop during
the past four years. There is an area of opportunity to convert seasonal areas into irrigated farms. This would be an immediate way to increase production without increasing land area, given the yields obtained from this type of harvest.
Area planted, harvested, avocado production and yield
Irrigation + Temporary 1980-2010
MINISTRY OF ECONOMY │ DEPARTMENT OF BASIC INDUSTRIES
Source: SIAP-SAGARPA
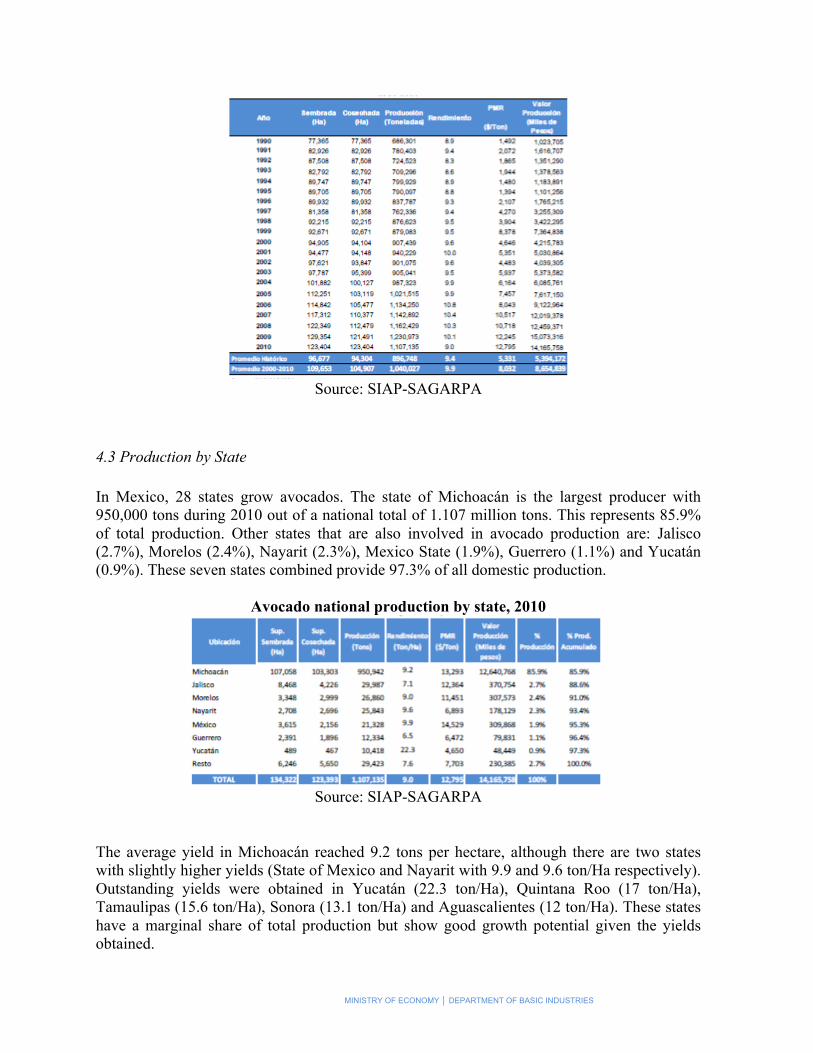
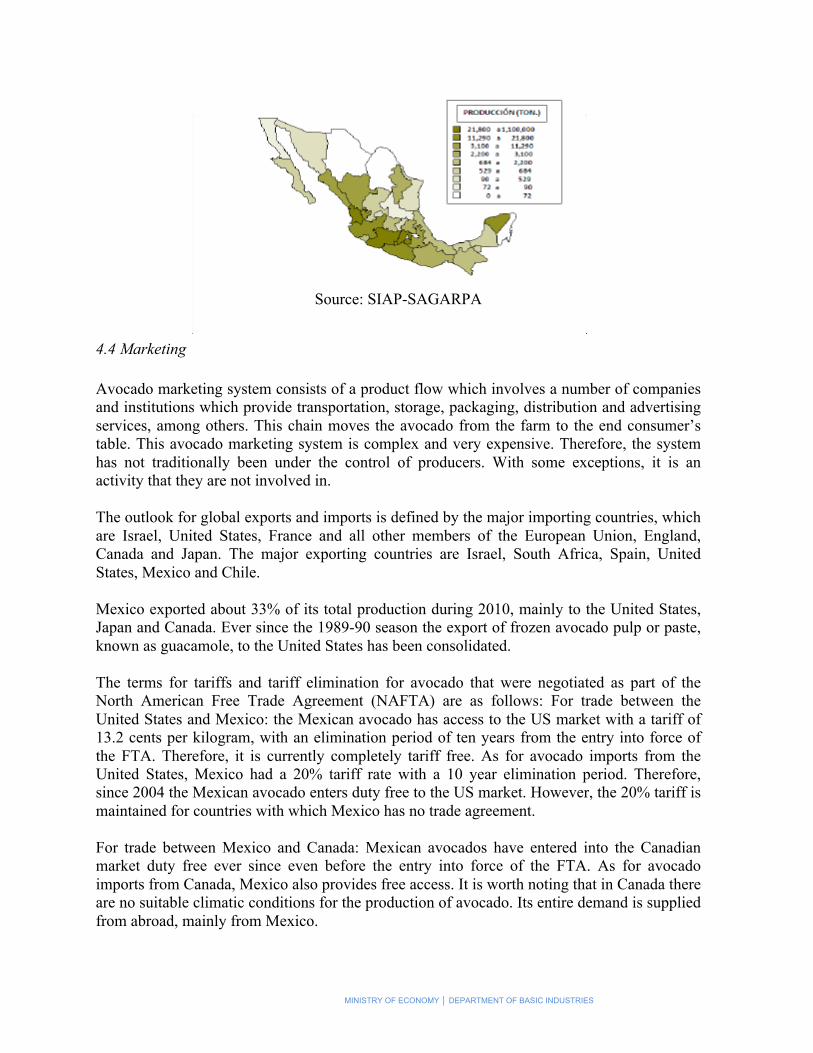
4.3 Production by State In Mexico, 28 states grow avocados. The state of Michoacán is the largest producer with 950,000 tons during 2010 out of a national total of 1.107 million tons. This represents 85.9% of total production. Other states that are also involved in avocado production are: Jalisco (2.7%), Morelos (2.4%), Nayarit (2.3%), Mexico State (1.9%), Guerrero (1.1%) and Yucatán (0.9%). These seven states combined provide 97.3% of all domestic production.
Avocado national production by state, 2010
Source: SIAP-SAGARPA
The average yield in Michoacán reached 9.2 tons per hectare, although there are two states with slightly higher yields (State of Mexico and Nayarit with 9.9 and 9.6 ton/Ha respectively). Outstanding yields were obtained in Yucatán (22.3 ton/Ha), Quintana Roo (17 ton/Ha), Tamaulipas (15.6 ton/Ha), Sonora (13.1 ton/Ha) and Aguascalientes (12 ton/Ha). These states have a marginal share of total production but show good growth potential given the yields obtained.
MINISTRY OF ECONOMY │ DEPARTMENT OF BASIC INDUSTRIES
Source: SIAP-SAGARPA
4.4 Marketing Avocado marketing system consists of a product flow which involves a number of companies and institutions which provide transportation, storage, packaging, distribution and advertising services, among others. This chain moves the avocado from the farm to the end consumer’s table. This avocado marketing system is complex and very expensive. Therefore, the system has not traditionally been under the control of producers. With some exceptions, it is an activity that they are not involved in. The outlook for global exports and imports is defined by the major importing countries, which are Israel, United States, France and all other members of the European Union, England, Canada and Japan. The major exporting countries are Israel, South Africa, Spain, United States, Mexico and Chile. Mexico exported about 33% of its total production during 2010, mainly to the United States, Japan and Canada. Ever since the 1989-90 season the export of frozen avocado pulp or paste, known as guacamole, to the United States has been consolidated. The terms for tariffs and tariff elimination for avocado that were negotiated as part of the North American Free Trade Agreement (NAFTA) are as follows: For trade between the United States and Mexico: the Mexican avocado has access to the US market with a tariff of 13.2 cents per kilogram, with an elimination period of ten years from the entry into force of the FTA. Therefore, it is currently completely tariff free. As for avocado imports from the United States, Mexico had a 20% tariff rate with a 10 year elimination period. Therefore, since 2004 the Mexican avocado enters duty free to the US market. However, the 20% tariff is maintained for countries with which Mexico has no trade agreement. For trade between Mexico and Canada: Mexican avocados have entered into the Canadian market duty free ever since even before the entry into force of the FTA. As for avocado imports from Canada, Mexico also provides free access. It is worth noting that in Canada there are no suitable climatic conditions for the production of avocado. Its entire demand is supplied from abroad, mainly from Mexico.
MINISTRY OF ECONOMY │ DEPARTMENT OF BASIC INDUSTRIES
Regarding domestic markets, the main product distribution centers are located in the cities of Mexico, (supply center of Iztapalapa, Mexico City), Guadalajara, Monterrey, and secondarily, Juarez, Torreon, San Luis Potosi, Leon, Aguascalientes and Nuevo Laredo. Avocado marketing is performed through collection centers and private packers. The greatest number and capacity of storage facilities and packers for both the domestic and international markets are in Uruapan, Peribán and Tacámbaro. In total, these three metropolitan centers market about 75% of the total production of the state of Michoacán. Domestic avocado consumption is widespread. The main consumers are Puebla, Jalisco, Mexico, Distrito Federal, Tamaulipas, San Luis Potosi, Chihuahua, Guanajuato, Baja California and Michoacán. Marketing of avocados produced in the state of Michoacán reaches the market through the following channels: local intermediaries, intermediaries from other cities, local packers, commission sellers and directly to supply centers. Most of Michoacán’s production is consumed domestically, and the remainder is exported as fresh fruit, frozen pulp or refined oil.
5. Price evolution and Profitability analysis
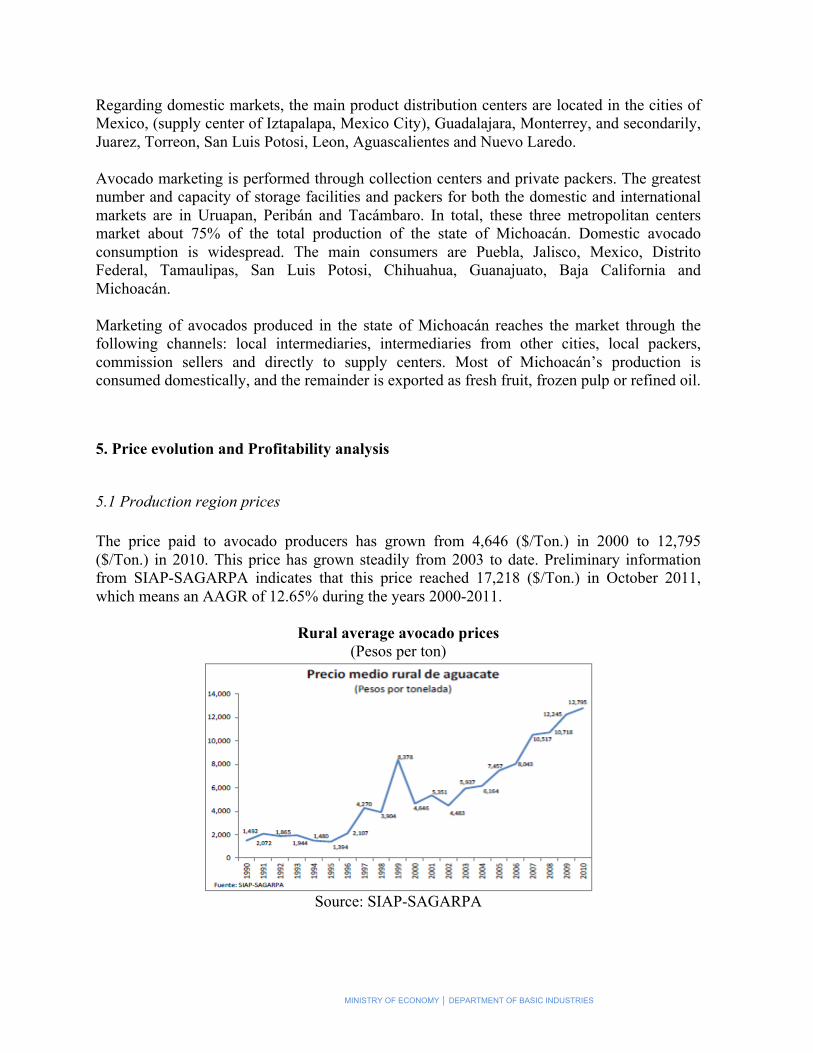
5.1 Production region prices The price paid to avocado producers has grown from 4,646 ($/Ton.) in 2000 to 12,795 ($/Ton.) in 2010. This price has grown steadily from 2003 to date. Preliminary information from SIAP-SAGARPA indicates that this price reached 17,218 ($/Ton.) in October 2011, which means an AAGR of 12.65% during the years 2000-2011.
Rural average avocado prices (Pesos per ton)
Source: SIAP-SAGARPA

MINISTRY OF ECONOMY │ DEPARTMENT OF BASIC INDUSTRIES
5.2 Wholesale prices in supply centers According to data from the Market Information and Integration System (SNIIM as abbreviated in Spanish) in the Iztapalapa Distrito Federal Supply Center, wholesale avocado prices have shown an upward trend since 2006, while during the years 2008-2010 they remained stable. However, from January to October 2011 the annual average reflects a significant increase of 30% compared with the same period the year before. To this effect, the AAGR of the price of avocados at the Iztapalapa Supply Center shows a 17% increase.
Wholesale avocado prices at the Iztapalapa Supply Center, Mexico City Pesos per kilogram
*From January to October of the year specified
Source: SNIIM-SE The market price for supply center avocados has increased by almost the same proportion as the average price paid to the producer. However, the margin of both prices has increased in favor of the wholesale market price. From 2008 to 2011, the share of the average rural price in supply centers’ prices increased from 50.2% to 55.1%. Also, the marketing margin has increased from $10.07 in 2008 to $12.20 in 2009 and $22.30 per kg in 2010. It is anticipated that this margin will increase significantly by the end of 2011.
Average rural price and wholesale price for avocdo in Supply Centers $/Kg, 2006-2011
Source: SNIM and SIAP-SAGARPA
MINISTRY OF ECONOMY │ DEPARTMENT OF BASIC INDUSTRIES
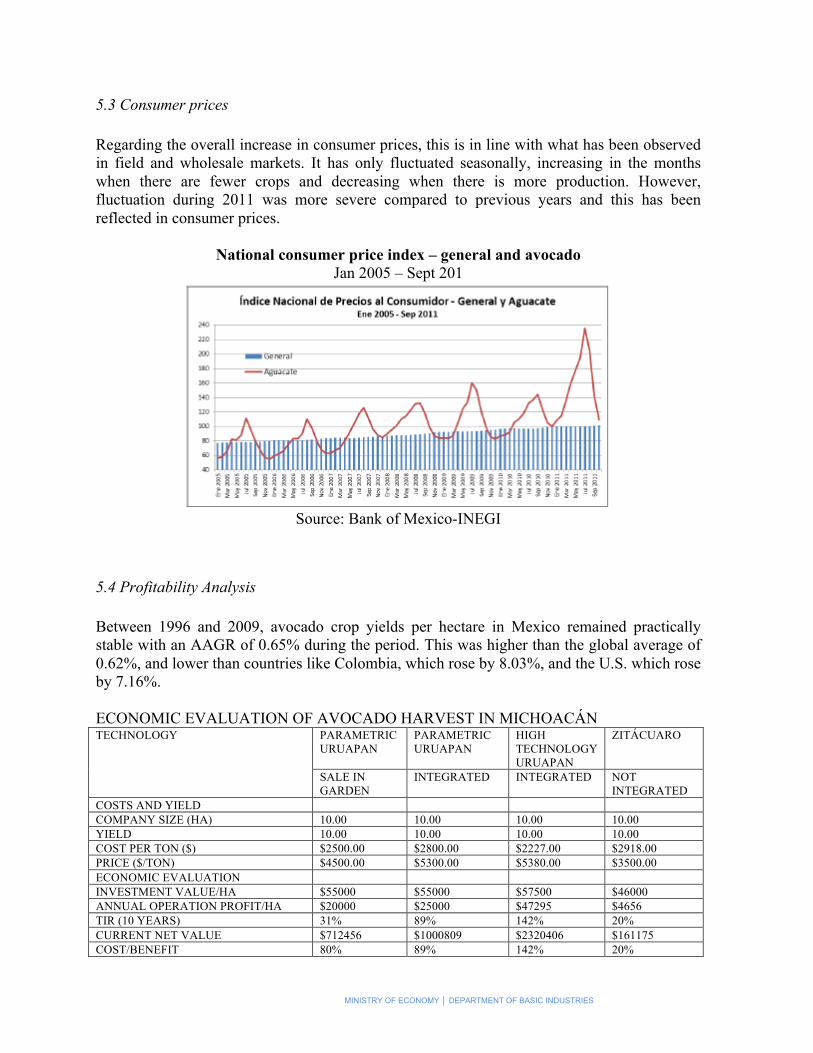
5.3 Consumer prices Regarding the overall increase in consumer prices, this is in line with what has been observed in field and wholesale markets. It has only fluctuated seasonally, increasing in the months when there are fewer crops and decreasing when there is more production. However, fluctuation during 2011 was more severe compared to previous years and this has been reflected in consumer prices.
National consumer price index – general and avocado Jan 2005 – Sept 201
Source: Bank of Mexico-INEGI
5.4 Profitability Analysis Between 1996 and 2009, avocado crop yields per hectare in Mexico remained practically stable with an AAGR of 0.65% during the period. This was higher than the global average of 0.62%, and lower than countries like Colombia, which rose by 8.03%, and the U.S. which rose by 7.16%. ECONOMIC EVALUATION OF AVOCADO HARVEST IN MICHOACÁN TECHNOLOGY PARAMETRIC
URUAPAN PARAMETRIC URUAPAN
HIGH TECHNOLOGY URUAPAN
ZITÁCUARO
SALE IN GARDEN
INTEGRATED INTEGRATED NOT INTEGRATED
COSTS AND YIELD COMPANY SIZE (HA) 10.00 10.00 10.00 10.00 YIELD 10.00 10.00 10.00 10.00 COST PER TON ($) $2500.00 $2800.00 $2227.00 $2918.00 PRICE ($/TON) $4500.00 $5300.00 $5380.00 $3500.00 ECONOMIC EVALUATION INVESTMENT VALUE/HA $55000 $55000 $57500 $46000 ANNUAL OPERATION PROFIT/HA $20000 $25000 $47295 $4656 TIR (10 YEARS) 31% 89% 142% 20% CURRENT NET VALUE $712456 $1000809 $2320406 $161175 COST/BENEFIT 80% 89% 142% 20%

MINISTRY OF ECONOMY │ DEPARTMENT OF BASIC INDUSTRIES
RETURN ON INVESTMENT 36% 45% 82% 10% MINIMUM SIZE OF COMPANY TO COVER FAMILIAR EXPENSES (HA)
1.50 1.50 1.00 11.50
Source: Guiding Plan of the Avocado Product System, SAGARPA The average yield (9.8 tons per hectare) is still higher than the global average of 8.3 ton/Ha. These yields allow Mexican avocado cultivation to produce internal yield rates of up to 80%, according to the Avocado Product System Master Plan. Avocado Product System indicates that with an investment of $57,000 pesos per hectare, producers can receive annualized returns of over 13%. According to this source, the size of the companies studied averaged 10 hectares. The 10-year IRR is significant, and with these numbers it is concluded that this is a profitable business. Regarding U.S. producers, Mexico has significant advantages in regards to harvested land area, yields per hectare, and costs per ton, benefits that we continue to take advantage of.
Mexico and the United States: Productivity indicators
Source: Competitiveness 2005, SAGARPA
The performance and profitability indicators show that the production and sale of avocados can become the backbone to a value chain by promoting the industrialization of fresh avocados, as currently only 16% of all production is industrialized. In review, given the trend in the rural, wholesale and consumer price of avocados and the export success of Mexican producers, avocado cultivation is currently profitable and has prospects of even better return rates in the future. The sector is in the position to improve yields through the intensive use of technology and to create higher aggregate value industrialized products that are derivatives of the avocado crop, for both the domestic market and for export.
6. Foreign trade and export opportunities Avocado exports are a very important activity for producers, packers and exporters, primarily in the state of Michoacán. Producers in this state plant this fruit in approximately 3,300 export certified orchards, covering an area of 29,611 hectares. This comes to 28% of all cultivated land area in the country.
Mexico – Monthly avocado exports 2009-Jun 2011 (Tons)
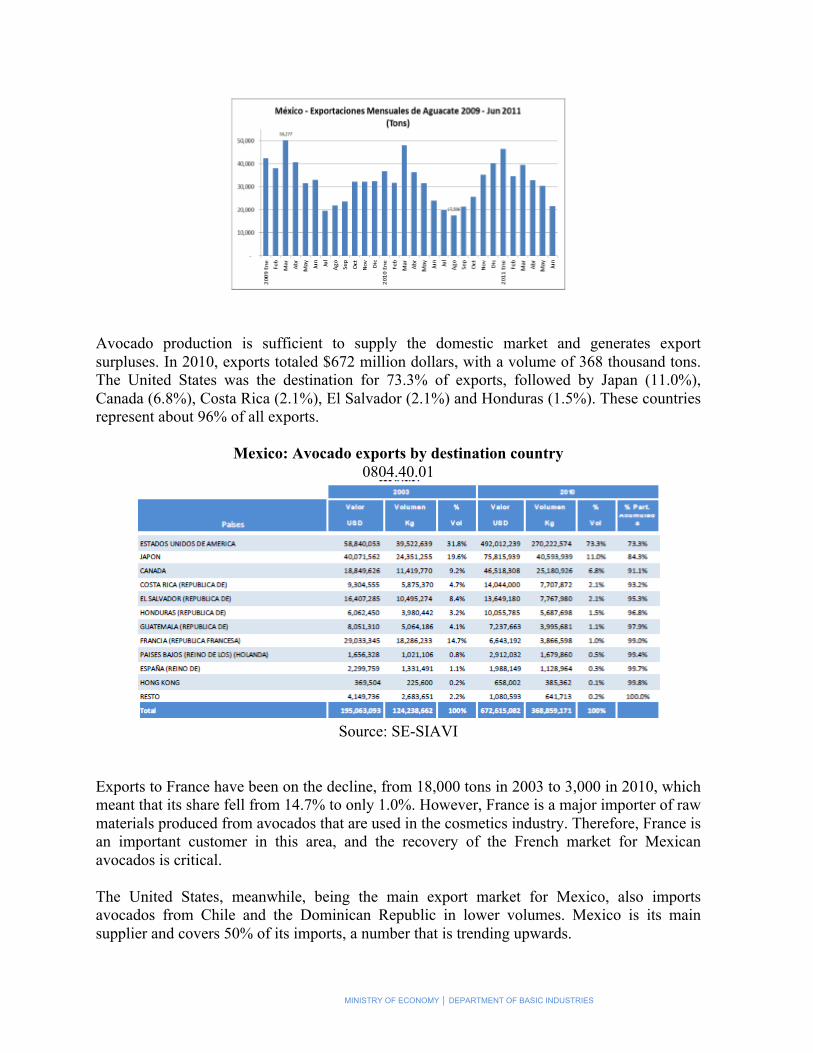
MINISTRY OF ECONOMY │ DEPARTMENT OF BASIC INDUSTRIES
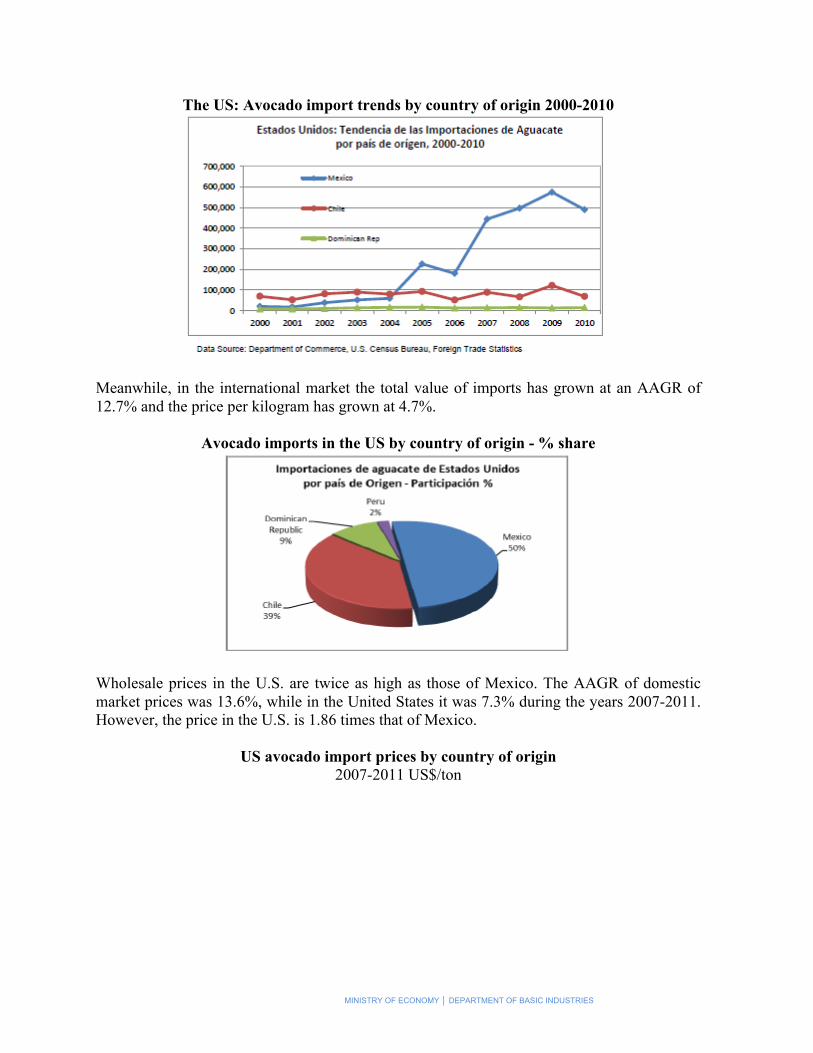
Avocado production is sufficient to supply the domestic market and generates export surpluses. In 2010, exports totaled $672 million dollars, with a volume of 368 thousand tons. The United States was the destination for 73.3% of exports, followed by Japan (11.0%), Canada (6.8%), Costa Rica (2.1%), El Salvador (2.1%) and Honduras (1.5%). These countries represent about 96% of all exports.
Mexico: Avocado exports by destination country 0804.40.01
Source: SE-SIAVI
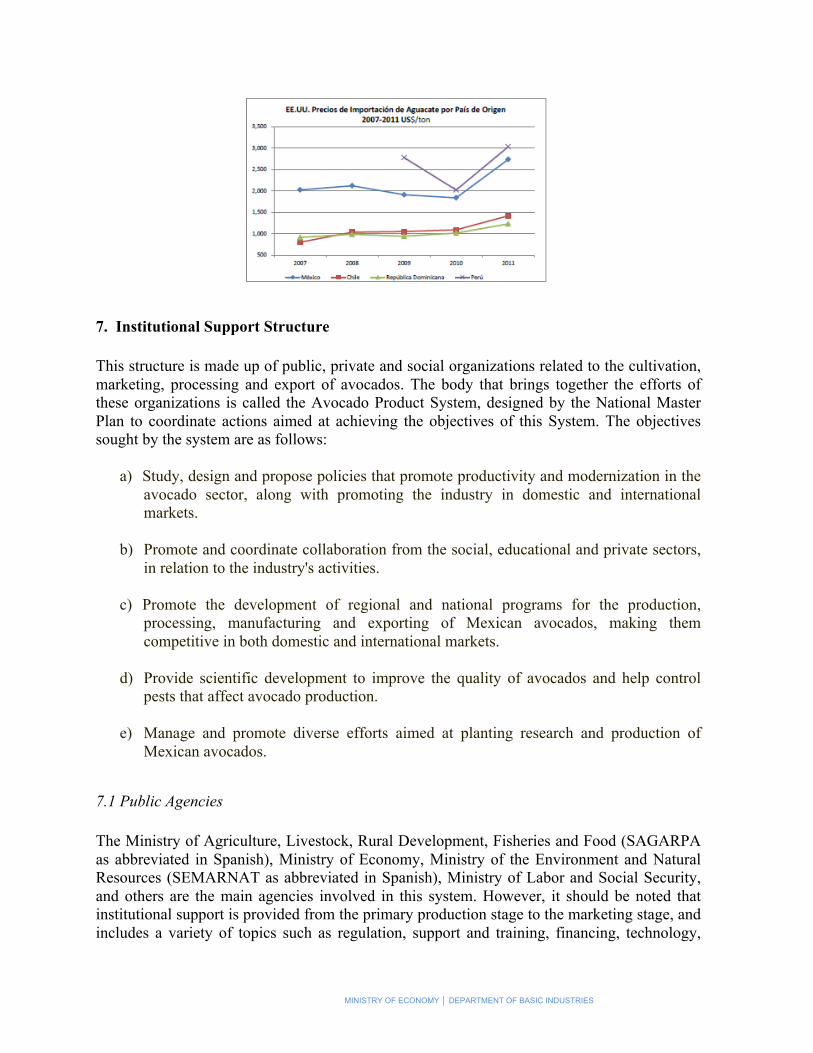
Exports to France have been on the decline, from 18,000 tons in 2003 to 3,000 in 2010, which meant that its share fell from 14.7% to only 1.0%. However, France is a major importer of raw materials produced from avocados that are used in the cosmetics industry. Therefore, France is an important customer in this area, and the recovery of the French market for Mexican avocados is critical. The United States, meanwhile, being the main export market for Mexico, also imports avocados from Chile and the Dominican Republic in lower volumes. Mexico is its main supplier and covers 50% of its imports, a number that is trending upwards.
MINISTRY OF ECONOMY │ DEPARTMENT OF BASIC INDUSTRIES
The US: Avocado import trends by country of origin 2000-2010
Meanwhile, in the international market the total value of imports has grown at an AAGR of 12.7% and the price per kilogram has grown at 4.7%.
Avocado imports in the US by country of origin - % share
Wholesale prices in the U.S. are twice as high as those of Mexico. The AAGR of domestic market prices was 13.6%, while in the United States it was 7.3% during the years 2007-2011. However, the price in the U.S. is 1.86 times that of Mexico.
US avocado import prices by country of origin 2007-2011 US$/ton
MINISTRY OF ECONOMY │ DEPARTMENT OF BASIC INDUSTRIES
7. Institutional Support Structure This structure is made up of public, private and social organizations related to the cultivation, marketing, processing and export of avocados. The body that brings together the efforts of these organizations is called the Avocado Product System, designed by the National Master Plan to coordinate actions aimed at achieving the objectives of this System. The objectives sought by the system are as follows:
a) Study, design and propose policies that promote productivity and modernization in the avocado sector, along with promoting the industry in domestic and international markets.
b) Promote and coordinate collaboration from the social, educational and private sectors,
in relation to the industry's activities.
c) Promote the development of regional and national programs for the production, processing, manufacturing and exporting of Mexican avocados, making them competitive in both domestic and international markets.
d) Provide scientific development to improve the quality of avocados and help control
pests that affect avocado production.
e) Manage and promote diverse efforts aimed at planting research and production of Mexican avocados.
7.1 Public Agencies The Ministry of Agriculture, Livestock, Rural Development, Fisheries and Food (SAGARPA as abbreviated in Spanish), Ministry of Economy, Ministry of the Environment and Natural Resources (SEMARNAT as abbreviated in Spanish), Ministry of Labor and Social Security, and others are the main agencies involved in this system. However, it should be noted that institutional support is provided from the primary production stage to the marketing stage, and includes a variety of topics such as regulation, support and training, financing, technology,

MINISTRY OF ECONOMY │ DEPARTMENT OF BASIC INDUSTRIES
biotechnology and innovation.
Institutional structure to support the avocado sector PRODUCER
ASSOCIATIONS REGULATIONS TECHNICAL
ADVISE AND TRAINING: PUBLIC ORGANIZATIONS
PUBLIC/PRIVATE ORGANIZATIONS
: FINANCING
TECHNOLOGY, BIOTECHNOLOGY AND INNOVATION
PRODUCTION
TRADE INDUSTRIALIZATION
PHYTOSANITARY: NOM-066-FITO-2002 STALK BORER FREE ZONE AGREEMENT QUALITY: NOM-128-SCFI-1998
SYSTEM-PRODUCT
TTECHNOLOGY AND INNOVATION BIOTECHNOLOGY
7.2 Regulations Safety Official Mexican Regulation NOM-066-FITO-200; Specifications for phytosanitary handling and transport of Avocado, published in the Official Journal on May 21, 2002. NMX-AA-150-SCFI-2009, Boxes for packaging fresh avocado-standardized capabilities-specifications. This Regulation is for voluntary application throughout the country for companies or individuals interested in receiving the "Sustainable Avocado Packaging" certificate or the "Standard Avocado Packaging" certificate.

MINISTRY OF ECONOMY │ DEPARTMENT OF BASIC INDUSTRIES
AGREEMENT by which the municipalities of Uruapan, Salvador Escalante, Peribán de Ramos, Tancítaroy Nuevo Parangaricutiro in the state of Michoacán are declared to be free of the Boherman Avocado seed weevil (Heilipuslauri), the Small avocado seed borer (Conotrachelus Aguacatae y C. Persea) and the seed borer moth (Stenoma Catenifer). Published in the Official Federal Journal on Wednesday February 2, 2000 • AGREEMENT by which the municipalities of Rosales and Taretan in the state of Michoacán are declared to be free of the Boherman Avocado seed weevil (Heilipuslauri), the Small avocado seed borer (Conotrachelus Aguacatae y C. Persea) and the seed borer moth (Stenoma Catenifer). Published in the Official Federal Journal on Wednesday February 21, 2001 • Quality Official Mexican Regulation NOM-128-SCFI-1998, Market Information-Labeling of agricultural products-Avocado. Establishes market information to be included on labels on packages containing avocado fruit (Persea americana Mills), for human consumption, of domestic or foreign origin, applies to any packaged product called "avocado" of the Hass and Fuerte varieties and which is marketed within the territory of the United Mexican States. Phytosanitary Control To maintain proper phytosanitary control of pests that affect crops, the National Agro-Food Health, Safety and Quality Service (SENASICA as abbreviated in Spanish) encourages the following activities:
• Field sampling to detect adult seed borers, consisting of the random selection of 10 trees; a branch that shows good leaf development at an average height of 1.65m is chosen from each of them.
• Legal Control over the use of phytosanitary labeling and regulation of the transport of
avocado fruit and its byproducts.
• Crop control through the collection and destruction of affected branches, fallen fruit and fruit on trees that is infested with seed borers. For branch borers, through constant pruning of damaged branches and their destruction by incineration, in side and backyard areas.
• Biological control by spraying the fungi Beauveria bassiana and Metarhizium
anisopliae. This campaign was aimed at controlling branch borers (Copturus aguacatae) and seed borers (Conotrachelus perseae and C. aguacatae). The states that were affected by these plagues and that are in the control phase are Nayarit and ten municipalities in Michoacán.

MINISTRY OF ECONOMY │ DEPARTMENT OF BASIC INDUSTRIES
8. Conclusions to increase competitiveness and productivity in the market chain.
1. Direct government support efforts, especially from SAGARPA, through the modernization of irrigation and health techniques in order to trigger an increase in avocado production yields.
2. Trigger an increase in production yields, through the development and application of
biotechnology to crops in order to increase productivity (which may be by means of innovation and technology transfer from SAGARPA or from state or local governments’ support).
3. Develop agribusiness projects (which may be by means of postproduction
management support from SAGARPA, support from state or local governments or by support from SMEs), in order to develop avocado products that are in high demand in international markets such as avocado powder and avocado oil for the cosmetic industry.
4. Boost growth in exports (trade fairs, exhibitions and promotion using SAGARPA and
Ministry of Economy resources) to the European market, especially focusing on recovering the French market since this is a country with a high demand for this product.
5. Conduct further analysis of these recommendations, with information specific to towns
or municipalities, in order to determine specific areas with optimal conditions for carrying them out and achieving a positive impact on avocado and avocado byproducts production and exports in these regions.

MINISTRY OF ECONOMY │ DEPARTMENT OF BASIC INDUSTRIES
21
MINISTRY OF ECONOMY │ DEPARTMENT OF BASIC INDUSTRIES


