Ministry of Finance Department of Economic Affairs Economic Division 4(3)/Ec. Dn. /2012 MONTHLY ECONOMIC REPORT SEPTEMBER 2013 HIGHLIGHTS The overall growth of GDP at factor cost at constant prices is provisionally estimated at 5.0 per cent in 2012-13 as compared to the growth of 6.2 per cent during 2011-12 (First Revised Estimates). The GDP growth rate is placed at 4.4 per cent in the first quarter of 2013-14. Food grains (rice and wheat) stocks held by FCI and State agencies were 58.93 million tonnes as on September 1, 2013. Overall growth in the Index of Industrial Production (IIP) was 0.6 per cent during August 2013 as compared to 2.0 per cent in August 2012. During April- August 2013-14, IIP growth was 0.1 per cent as compared to 0.2 per cent growth in April- August 2012-13. Eight core infrastructure industries registered 3.7 per cent growth in August 2013 as compared to growth of 6.1 per cent in August 2012. During April- August 2013-14, these sectors grew by 2.3 per cent as compared to 6.3 per cent during April-August 2012-13. The year-on-year growth of Broad Money (M3) as on September 20, 2013 was 12.5 per cent as compared to 13.6 per cent on the corresponding date of the previous year. Exports increased by 11.2 per cent and imports decreased by 18.1 per cent, in US dollar terms during September 2013 over September 2012. Foreign Currency Assets stood at US$ 249.8 billion at end-September 2013 as compared to US$ 260.7 billion at end-September 2012. The Rupee depreciated against US dollar, Pound sterling and Euro and appreciated against Japanese yen in the month of September 2013 over August 2013. The WPI inflation for all commodities for the month of September 2013 has increased to 6.46 per cent from 6.10 per cent in the previous month. Gross tax revenue for the financial year 2013-14 (April-August), at ` 309,056 crore, recorded growth of 8.7 per cent over 2012-13 (April-August). As a proportion of budget estimate, the fiscal deficit and revenue deficit during 2013-14 (April–August) was 74.6 per cent and 87.4 per cent respectively. (RANGEET GHOSH) Assistant Adviser ([email protected])
Transcript
Ministry of Finance Department of Economic Affairs
Economic Division 4(3)/Ec. Dn. /2012
MONTHLY ECONOMIC REPORT
SEPTEMBER 2013 HIGHLIGHTS
The overall growth of GDP at factor cost at constant prices is provisionally estimated at
5.0 per cent in 2012-13 as compared to the growth of 6.2 per cent during 2011-12 (First
Revised Estimates). The GDP growth rate is placed at 4.4 per cent in the first quarter of
2013-14.
Food grains (rice and wheat) stocks held by FCI and State agencies were 58.93 million
tonnes as on September 1, 2013.
Overall growth in the Index of Industrial Production (IIP) was 0.6 per cent during
August 2013 as compared to 2.0 per cent in August 2012. During April- August 2013-14,
IIP growth was 0.1 per cent as compared to 0.2 per cent growth in April- August
2012-13.
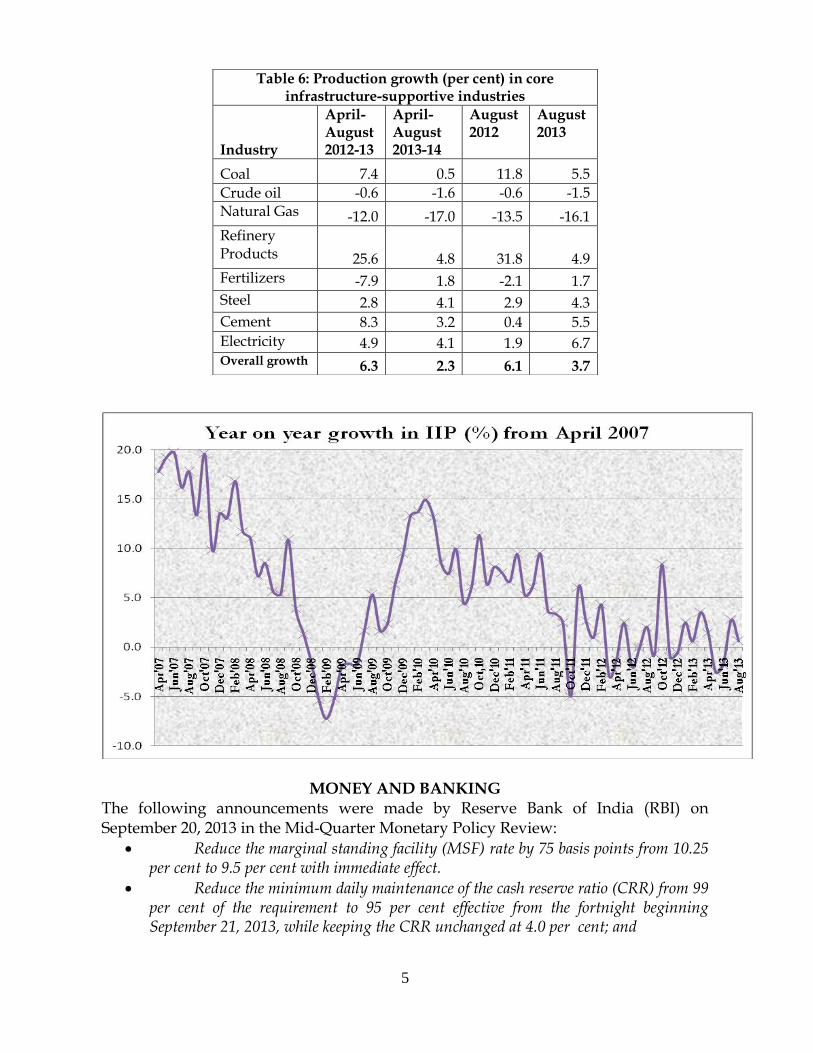
Eight core infrastructure industries registered 3.7 per cent growth in August 2013 as
compared to growth of 6.1 per cent in August 2012. During April- August 2013-14, these
sectors grew by 2.3 per cent as compared to 6.3 per cent during April-August 2012-13.
The year-on-year growth of Broad Money (M3) as on September 20, 2013 was 12.5 per
cent as compared to 13.6 per cent on the corresponding date of the previous year.
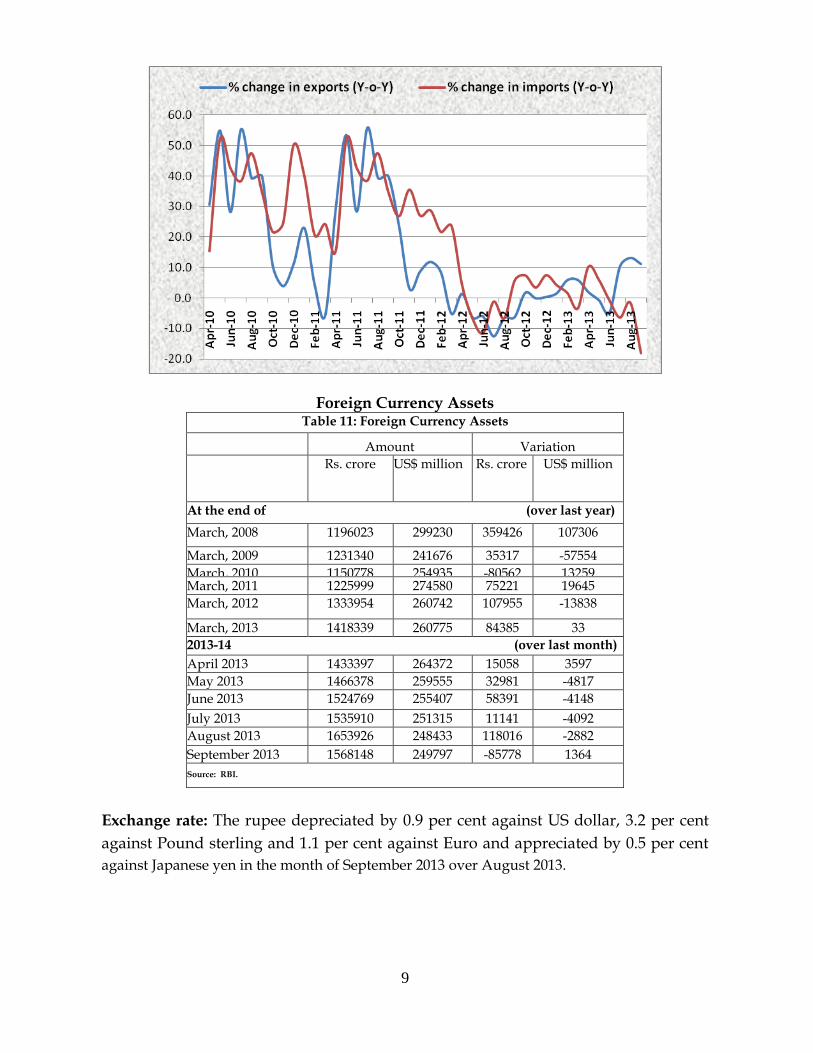
Exports increased by 11.2 per cent and imports decreased by 18.1 per cent, in US dollar
terms during September 2013 over September 2012.
Foreign Currency Assets stood at US$ 249.8 billion at end-September 2013 as
compared to US$ 260.7 billion at end-September 2012.
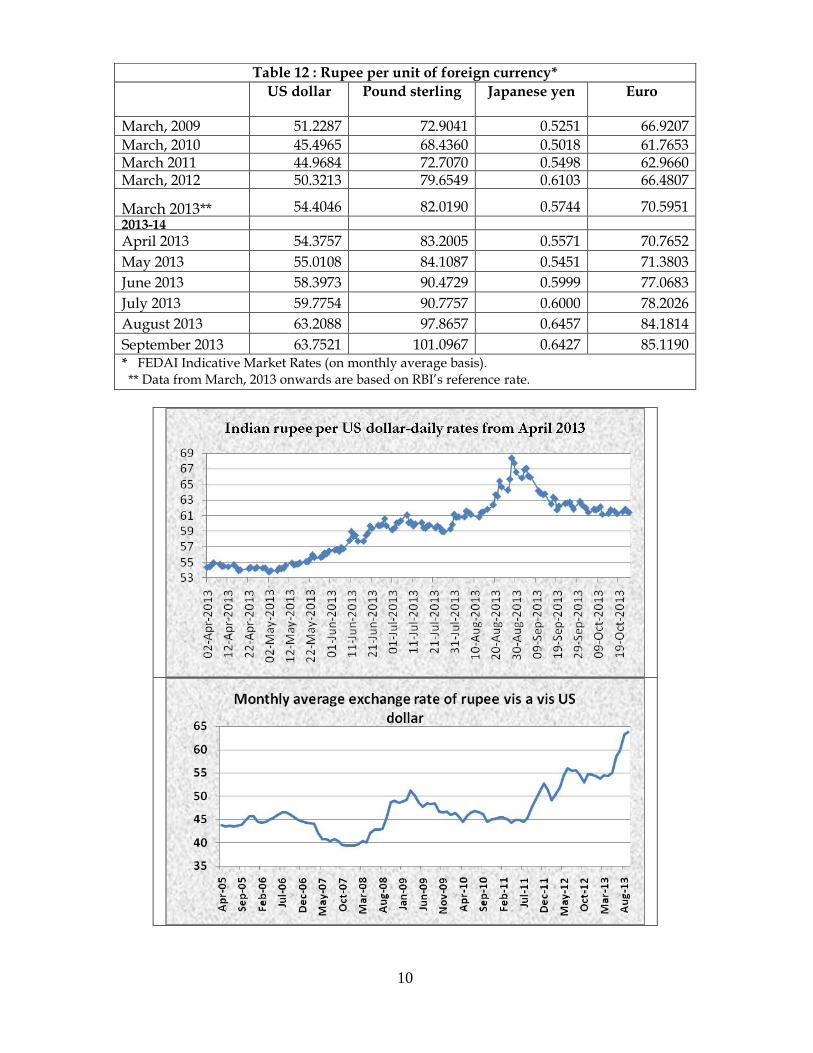
The Rupee depreciated against US dollar, Pound sterling and Euro and appreciated
against Japanese yen in the month of September 2013 over August 2013.
The WPI inflation for all commodities for the month of September 2013 has increased
to 6.46 per cent from 6.10 per cent in the previous month.
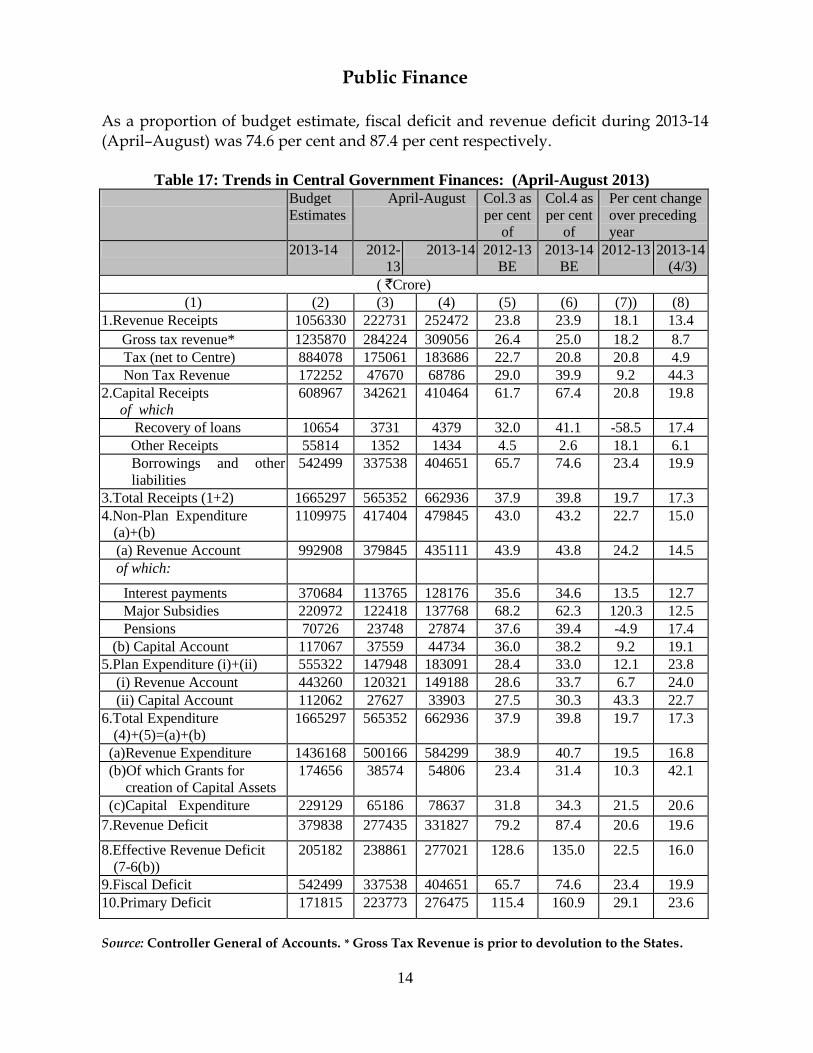
Gross tax revenue for the financial year 2013-14 (April-August), at ` 309,056 crore,
recorded growth of 8.7 per cent over 2012-13 (April-August).
As a proportion of budget estimate, the fiscal deficit and revenue deficit during
2013-14 (April–August) was 74.6 per cent and 87.4 per cent respectively.
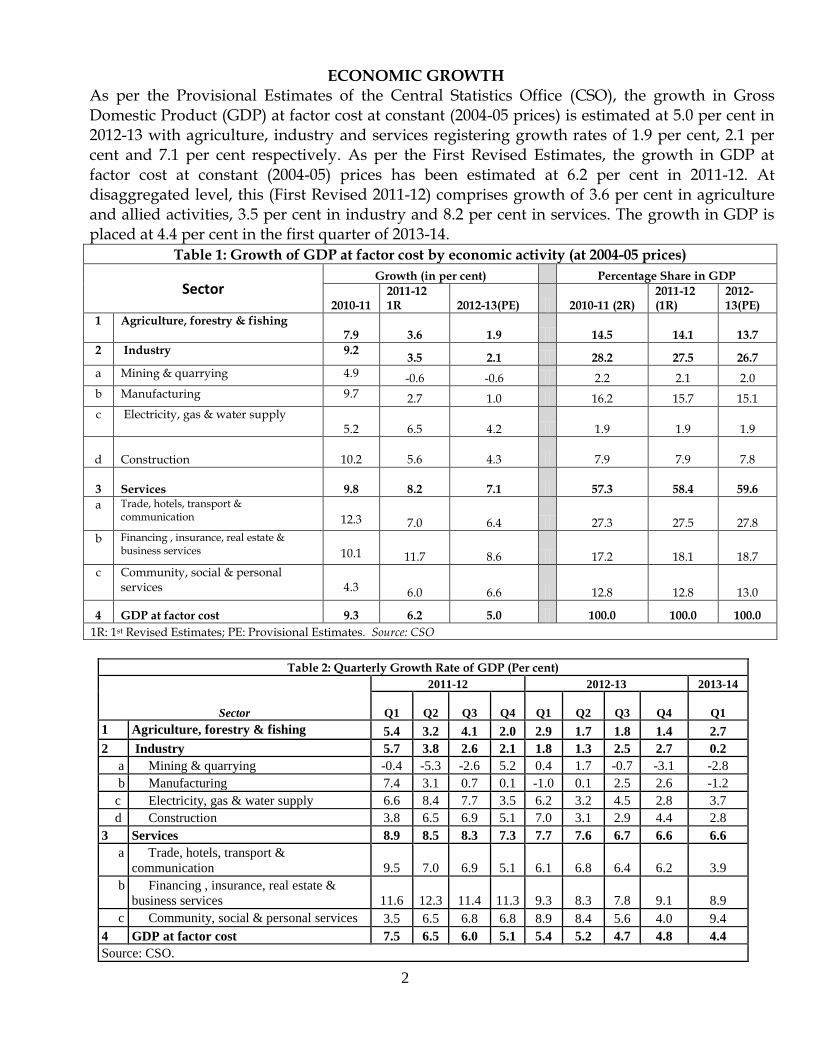
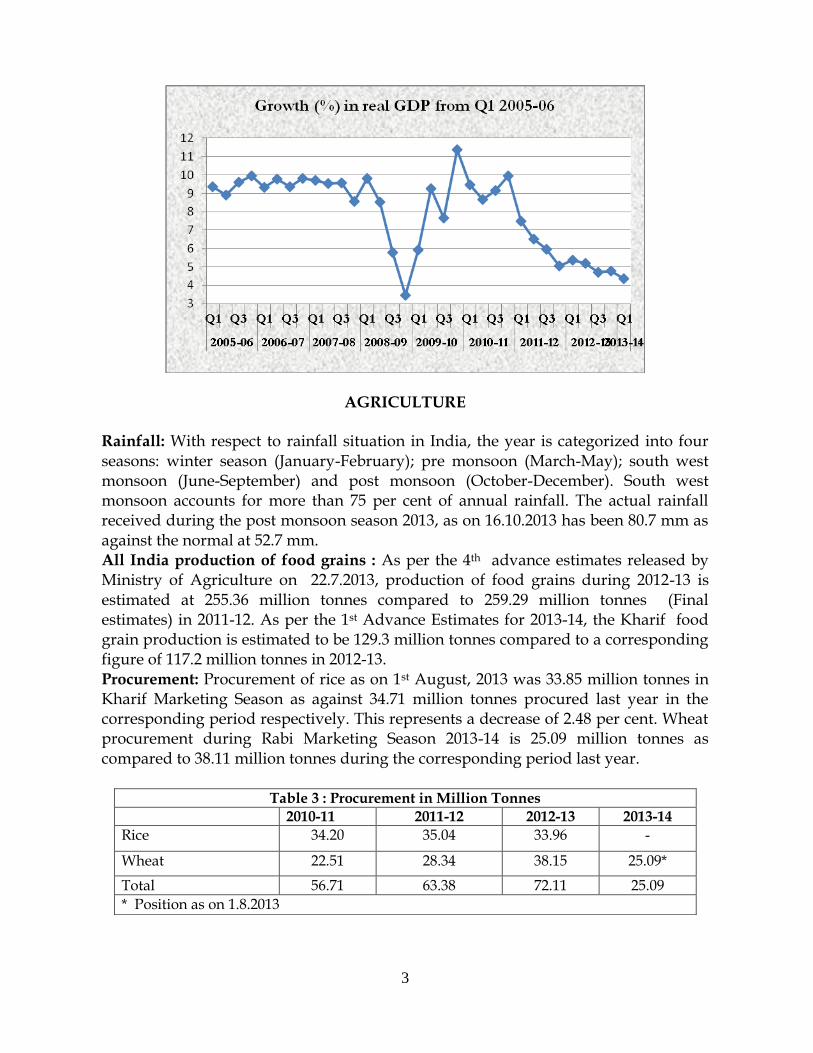
ECONOMIC GROWTH As per the Provisional Estimates of the Central Statistics Office (CSO), the growth in Gross Domestic Product (GDP) at factor cost at constant (2004-05 prices) is estimated at 5.0 per cent in 2012-13 with agriculture, industry and services registering growth rates of 1.9 per cent, 2.1 per cent and 7.1 per cent respectively. As per the First Revised Estimates, the growth in GDP at factor cost at constant (2004-05) prices has been estimated at 6.2 per cent in 2011-12. At disaggregated level, this (First Revised 2011-12) comprises growth of 3.6 per cent in agriculture and allied activities, 3.5 per cent in industry and 8.2 per cent in services. The growth in GDP is placed at 4.4 per cent in the first quarter of 2013-14.
Table 1: Growth of GDP at factor cost by economic activity (at 2004-05 prices)
Rainfall: With respect to rainfall situation in India, the year is categorized into four seasons: winter season (January-February); pre monsoon (March-May); south west monsoon (June-September) and post monsoon (October-December). South west monsoon accounts for more than 75 per cent of annual rainfall. The actual rainfall received during the post monsoon season 2013, as on 16.10.2013 has been 80.7 mm as against the normal at 52.7 mm. All India production of food grains : As per the 4th advance estimates released by Ministry of Agriculture on 22.7.2013, production of food grains during 2012-13 is estimated at 255.36 million tonnes compared to 259.29 million tonnes (Final estimates) in 2011-12. As per the 1st Advance Estimates for 2013-14, the Kharif food grain production is estimated to be 129.3 million tonnes compared to a corresponding figure of 117.2 million tonnes in 2012-13. Procurement: Procurement of rice as on 1st August, 2013 was 33.85 million tonnes in Kharif Marketing Season as against 34.71 million tonnes procured last year in the corresponding period respectively. This represents a decrease of 2.48 per cent. Wheat procurement during Rabi Marketing Season 2013-14 is 25.09 million tonnes as compared to 38.11 million tonnes during the corresponding period last year.
Table 3 : Procurement in Million Tonnes
2010-11 2011-12 2012-13 2013-14
Rice 34.20 35.04 33.96 -
Wheat 22.51 28.34 38.15 25.09*
Total 56.71 63.38 72.11 25.09
* Position as on 1.8.2013
4
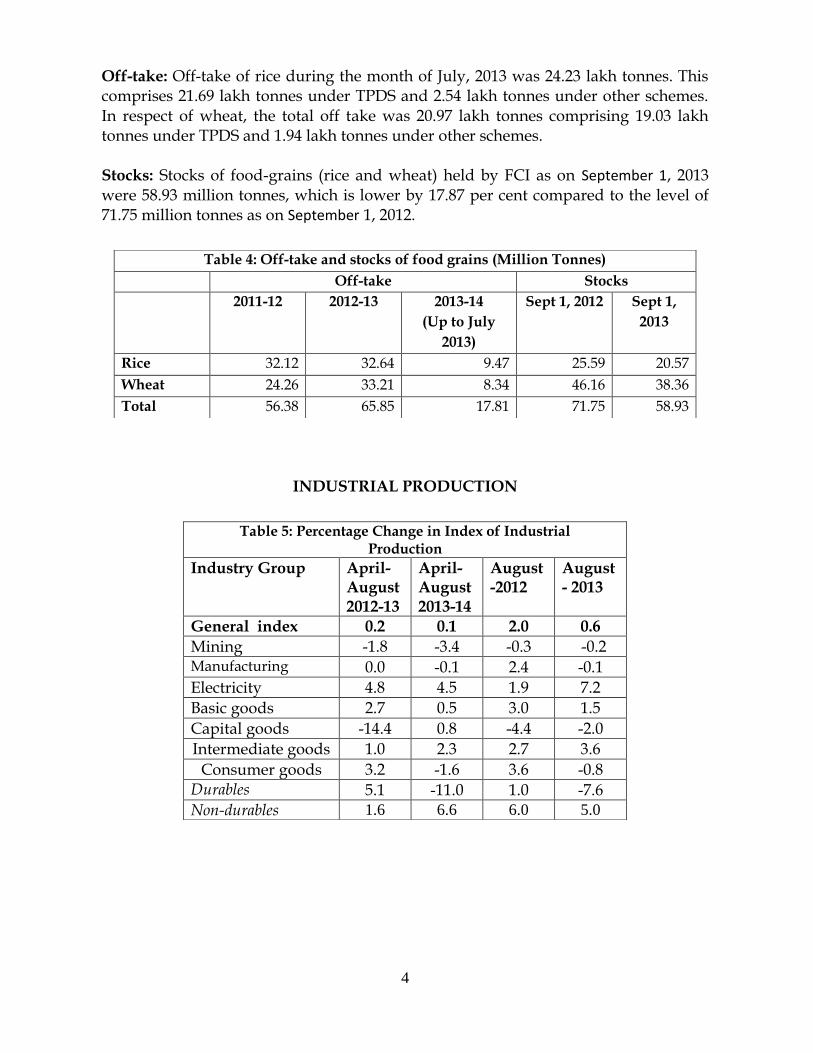
Off-take: Off-take of rice during the month of July, 2013 was 24.23 lakh tonnes. This comprises 21.69 lakh tonnes under TPDS and 2.54 lakh tonnes under other schemes. In respect of wheat, the total off take was 20.97 lakh tonnes comprising 19.03 lakh tonnes under TPDS and 1.94 lakh tonnes under other schemes. Stocks: Stocks of food-grains (rice and wheat) held by FCI as on September 1, 2013 were 58.93 million tonnes, which is lower by 17.87 per cent compared to the level of 71.75 million tonnes as on September 1, 2012.
INDUSTRIAL PRODUCTION
Table 4: Off-take and stocks of food grains (Million Tonnes)
Off-take Stocks
2011-12 2012-13 2013-14
(Up to July
2013)
Sept 1, 2012 Sept 1,
2013
Rice 32.12 32.64 9.47 25.59 20.57
Wheat 24.26 33.21 8.34 46.16 38.36
Total 56.38 65.85 17.81 71.75 58.93
Table 5: Percentage Change in Index of Industrial Production
MONEY AND BANKING The following announcements were made by Reserve Bank of India (RBI) on September 20, 2013 in the Mid-Quarter Monetary Policy Review:
Reduce the marginal standing facility (MSF) rate by 75 basis points from 10.25 per cent to 9.5 per cent with immediate effect.
Reduce the minimum daily maintenance of the cash reserve ratio (CRR) from 99 per cent of the requirement to 95 per cent effective from the fortnight beginning September 21, 2013, while keeping the CRR unchanged at 4.0 per cent; and
Table 6: Production growth (per cent) in core infrastructure-supportive industries
Increase the policy repo rate under the liquidity adjustment facility (LAF) by 25 basis points from 7.25 per cent to 7.5 per cent with immediate effect.
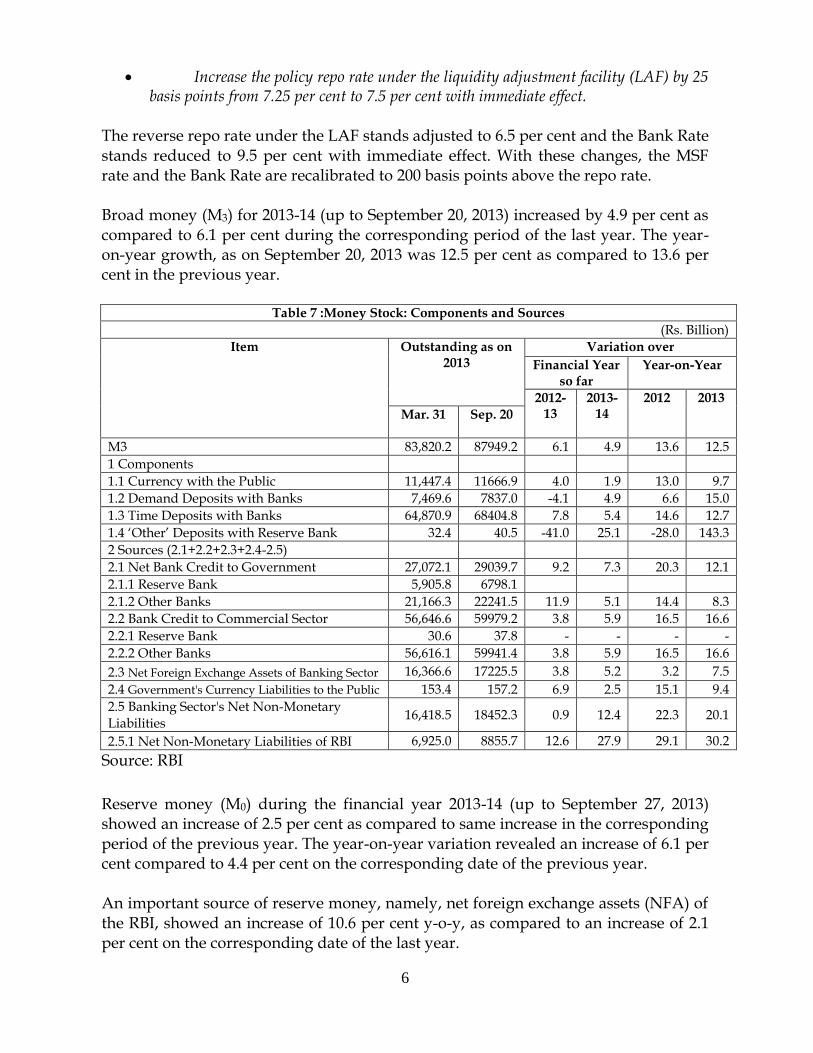
The reverse repo rate under the LAF stands adjusted to 6.5 per cent and the Bank Rate stands reduced to 9.5 per cent with immediate effect. With these changes, the MSF rate and the Bank Rate are recalibrated to 200 basis points above the repo rate. Broad money (M3) for 2013-14 (up to September 20, 2013) increased by 4.9 per cent as compared to 6.1 per cent during the corresponding period of the last year. The year-on-year growth, as on September 20, 2013 was 12.5 per cent as compared to 13.6 per cent in the previous year.
Table 7 :Money Stock: Components and Sources
(Rs. Billion)
Item Outstanding as on 2013
Variation over
Financial Year so far
Year-on-Year
2012-13
2013-14
2012 2013
Mar. 31 Sep. 20
M3 83,820.2 87949.2 6.1 4.9 13.6 12.5
1 Components
1.1 Currency with the Public 11,447.4 11666.9 4.0 1.9 13.0 9.7
1.3 Time Deposits with Banks 64,870.9 68404.8 7.8 5.4 14.6 12.7
1.4 ‘Other’ Deposits with Reserve Bank 32.4 40.5 -41.0 25.1 -28.0 143.3
2 Sources (2.1+2.2+2.3+2.4-2.5)
2.1 Net Bank Credit to Government 27,072.1 29039.7 9.2 7.3 20.3 12.1
2.1.1 Reserve Bank 5,905.8 6798.1
2.1.2 Other Banks 21,166.3 22241.5 11.9 5.1 14.4 8.3
2.2 Bank Credit to Commercial Sector 56,646.6 59979.2 3.8 5.9 16.5 16.6
2.2.1 Reserve Bank 30.6 37.8 - - - -
2.2.2 Other Banks 56,616.1 59941.4 3.8 5.9 16.5 16.6
2.3 Net Foreign Exchange Assets of Banking Sector 16,366.6 17225.5 3.8 5.2 3.2 7.5
2.4 Government's Currency Liabilities to the Public 153.4 157.2 6.9 2.5 15.1 9.4
2.5 Banking Sector's Net Non-Monetary Liabilities
16,418.5 18452.3 0.9 12.4 22.3 20.1
2.5.1 Net Non-Monetary Liabilities of RBI 6,925.0 8855.7 12.6 27.9 29.1 30.2
Source: RBI
Reserve money (M0) during the financial year 2013-14 (up to September 27, 2013) showed an increase of 2.5 per cent as compared to same increase in the corresponding period of the previous year. The year-on-year variation revealed an increase of 6.1 per cent compared to 4.4 per cent on the corresponding date of the previous year. An important source of reserve money, namely, net foreign exchange assets (NFA) of the RBI, showed an increase of 10.6 per cent y-o-y, as compared to an increase of 2.1 per cent on the corresponding date of the last year.
7
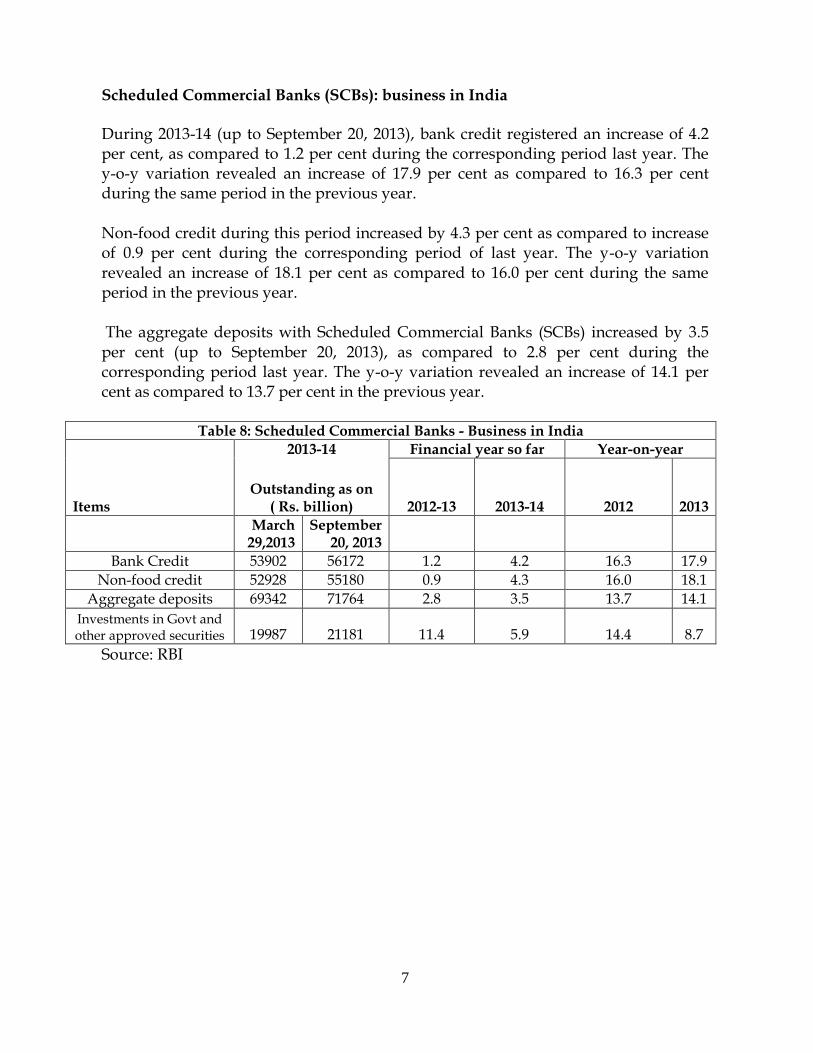
Scheduled Commercial Banks (SCBs): business in India During 2013-14 (up to September 20, 2013), bank credit registered an increase of 4.2 per cent, as compared to 1.2 per cent during the corresponding period last year. The y-o-y variation revealed an increase of 17.9 per cent as compared to 16.3 per cent during the same period in the previous year. Non-food credit during this period increased by 4.3 per cent as compared to increase of 0.9 per cent during the corresponding period of last year. The y-o-y variation revealed an increase of 18.1 per cent as compared to 16.0 per cent during the same period in the previous year. The aggregate deposits with Scheduled Commercial Banks (SCBs) increased by 3.5 per cent (up to September 20, 2013), as compared to 2.8 per cent during the corresponding period last year. The y-o-y variation revealed an increase of 14.1 per cent as compared to 13.7 per cent in the previous year.
Table 8: Scheduled Commercial Banks - Business in India
Items
2013-14 Financial year so far Year-on-year
Outstanding as on ( Rs. billion) 2012-13 2013-14 2012 2013
March 29,2013
September 20, 2013
Bank Credit 53902 56172 1.2 4.2 16.3 17.9
Non-food credit 52928 55180 0.9 4.3 16.0 18.1
Aggregate deposits 69342 71764 2.8 3.5 13.7 14.1
Investments in Govt and other approved securities 19987 21181 11.4 5.9 14.4 8.7
Source: RBI
8
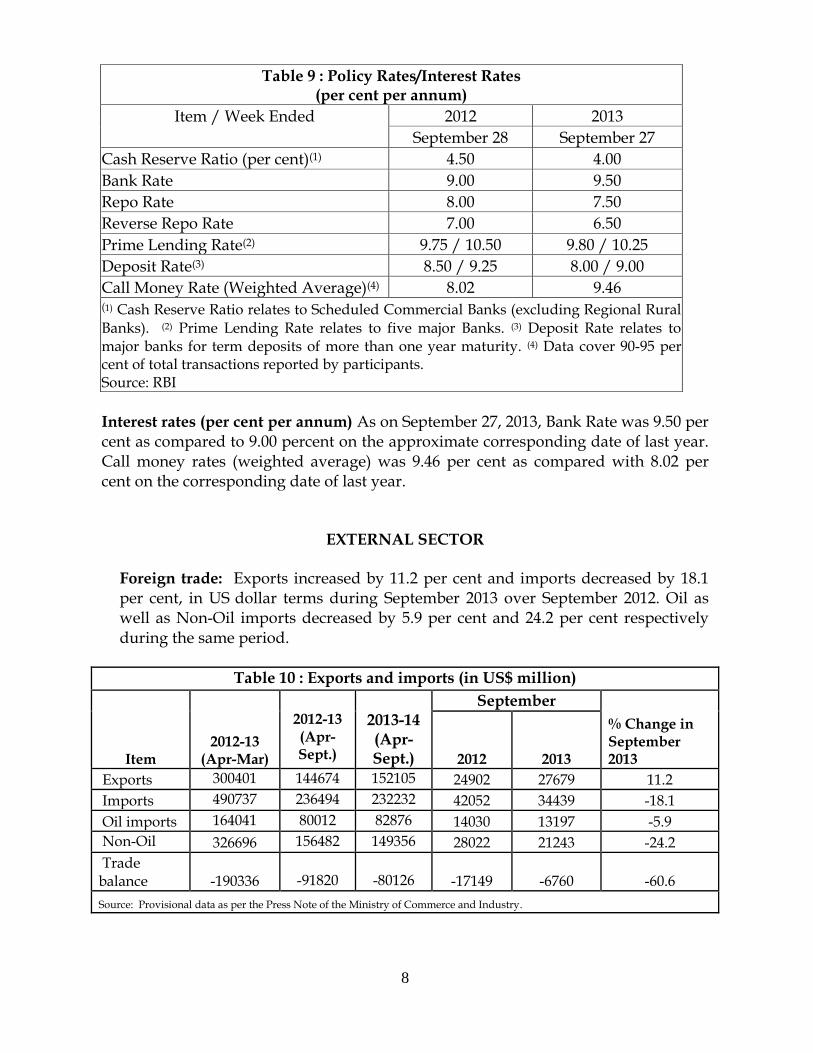
Interest rates (per cent per annum) As on September 27, 2013, Bank Rate was 9.50 per cent as compared to 9.00 percent on the approximate corresponding date of last year. Call money rates (weighted average) was 9.46 per cent as compared with 8.02 per cent on the corresponding date of last year.
EXTERNAL SECTOR
Foreign trade: Exports increased by 11.2 per cent and imports decreased by 18.1 per cent, in US dollar terms during September 2013 over September 2012. Oil as well as Non-Oil imports decreased by 5.9 per cent and 24.2 per cent respectively during the same period.
Table 10 : Exports and imports (in US$ million)
Item 2012-13
(Apr-Mar)
2012-13 (Apr-Sept.)
2013-14 (Apr-Sept.)
September
% Change in September 2013 2012 2013
Exports 300401 144674 152105 24902 27679 11.2
Imports 490737 236494 232232 42052 34439 -18.1
Oil imports 164041 80012 82876 14030 13197 -5.9
Non-Oil imports
326696 156482 149356 28022 21243 -24.2
Trade balance -190336
-91820
-80126 -17149 -6760 -60.6
Source: Provisional data as per the Press Note of the Ministry of Commerce and Industry.
Table 9 : Policy Rates/Interest Rates (per cent per annum)
Item / Week Ended 2012 2013
September 28 September 27
Cash Reserve Ratio (per cent)(1) 4.50 4.00
Bank Rate 9.00 9.50
Repo Rate 8.00 7.50
Reverse Repo Rate 7.00 6.50
Prime Lending Rate(2) 9.75 / 10.50 9.80 / 10.25
Deposit Rate(3) 8.50 / 9.25 8.00 / 9.00
Call Money Rate (Weighted Average)(4) 8.02 9.46 (1) Cash Reserve Ratio relates to Scheduled Commercial Banks (excluding Regional Rural Banks). (2) Prime Lending Rate relates to five major Banks. (3) Deposit Rate relates to major banks for term deposits of more than one year maturity. (4) Data cover 90-95 per cent of total transactions reported by participants. Source: RBI
March 2013** 54.4046 82.0190 0.5744 70.5951 2013-14
April 2013 54.3757 83.2005 0.5571 70.7652
May 2013 55.0108 84.1087 0.5451 71.3803
June 2013 58.3973 90.4729 0.5999 77.0683
July 2013 59.7754 90.7757 0.6000 78.2026
August 2013 63.2088 97.8657 0.6457 84.1814
September 2013 63.7521 101.0967 0.6427 85.1190 * FEDAI Indicative Market Rates (on monthly average basis). ** Data from March, 2013 onwards are based on RBI’s reference rate.
11
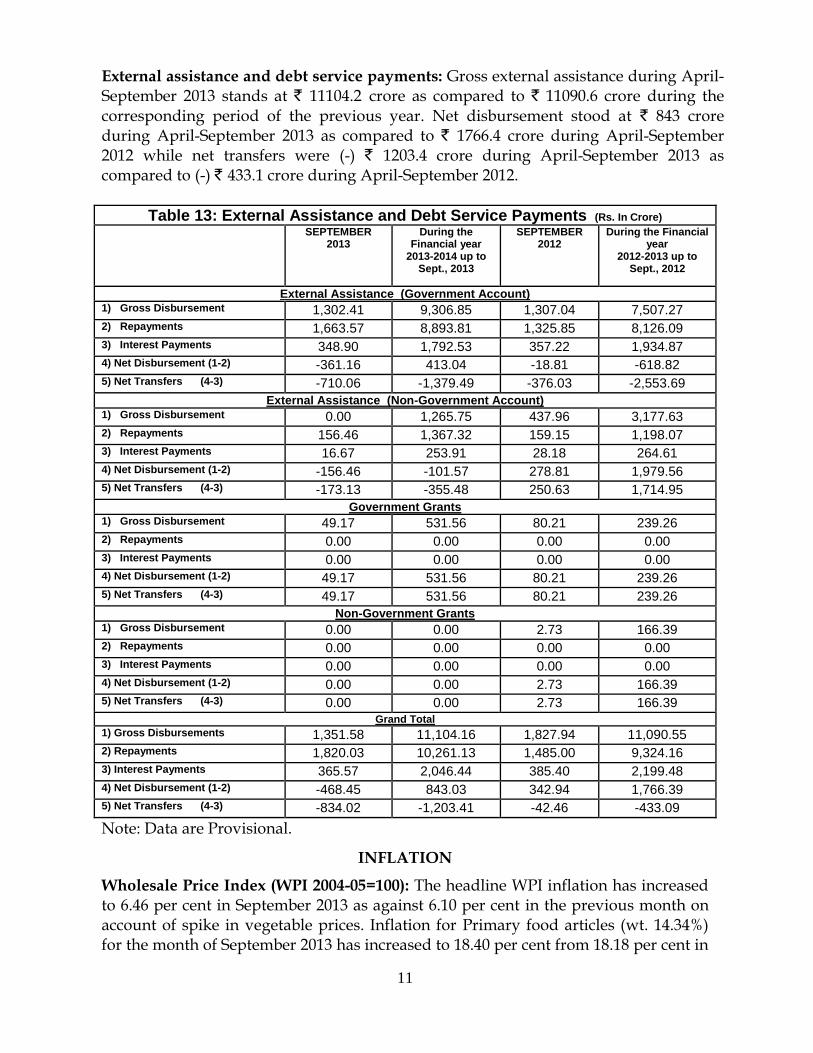
External assistance and debt service payments: Gross external assistance during April-September 2013 stands at ` 11104.2 crore as compared to ` 11090.6 crore during the corresponding period of the previous year. Net disbursement stood at ` 843 crore during April-September 2013 as compared to ` 1766.4 crore during April-September 2012 while net transfers were (-) ` 1203.4 crore during April-September 2013 as compared to (-) ` 433.1 crore during April-September 2012.
Table 13: External Assistance and Debt Service Payments (Rs. In Crore) SEPTEMBER
4) Net Disbursement (1-2) -468.45 843.03 342.94 1,766.39 5) Net Transfers (4-3) -834.02 -1,203.41 -42.46 -433.09
Note: Data are Provisional.
INFLATION
Wholesale Price Index (WPI 2004-05=100): The headline WPI inflation has increased to 6.46 per cent in September 2013 as against 6.10 per cent in the previous month on account of spike in vegetable prices. Inflation for Primary food articles (wt. 14.34%) for the month of September 2013 has increased to 18.40 per cent from 18.18 per cent in
12
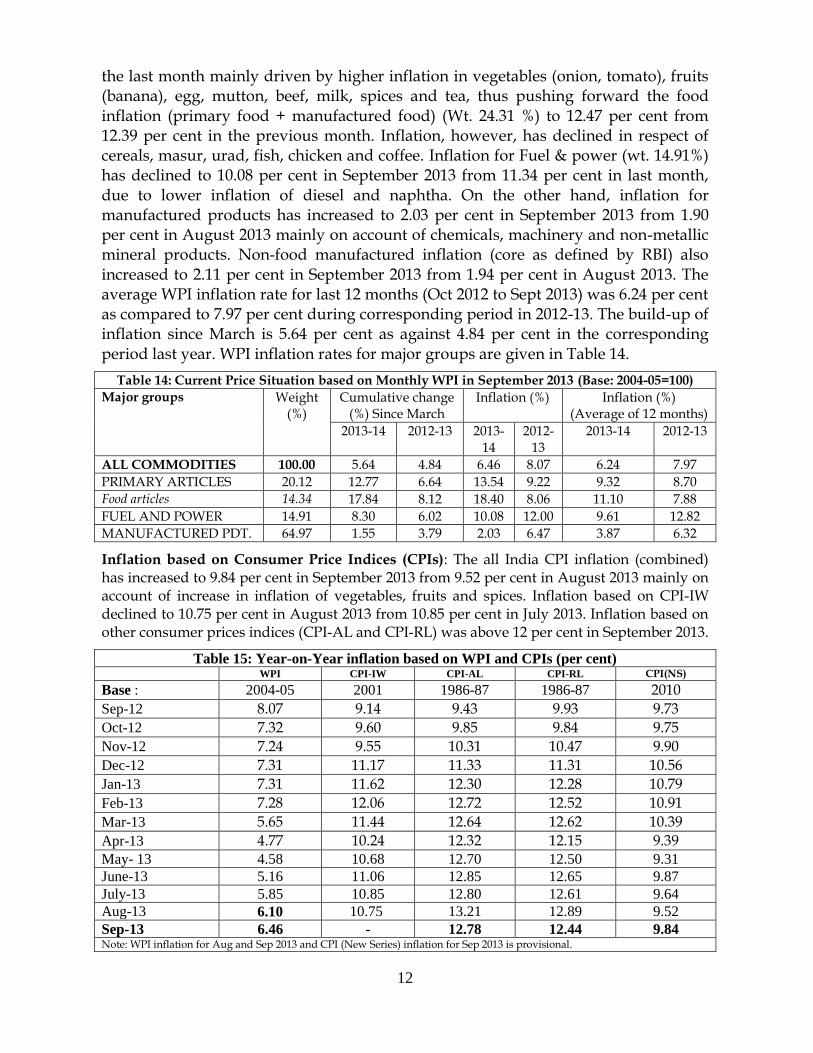
the last month mainly driven by higher inflation in vegetables (onion, tomato), fruits (banana), egg, mutton, beef, milk, spices and tea, thus pushing forward the food inflation (primary food + manufactured food) (Wt. 24.31 %) to 12.47 per cent from 12.39 per cent in the previous month. Inflation, however, has declined in respect of cereals, masur, urad, fish, chicken and coffee. Inflation for Fuel & power (wt. 14.91%) has declined to 10.08 per cent in September 2013 from 11.34 per cent in last month, due to lower inflation of diesel and naphtha. On the other hand, inflation for manufactured products has increased to 2.03 per cent in September 2013 from 1.90 per cent in August 2013 mainly on account of chemicals, machinery and non-metallic mineral products. Non-food manufactured inflation (core as defined by RBI) also increased to 2.11 per cent in September 2013 from 1.94 per cent in August 2013. The average WPI inflation rate for last 12 months (Oct 2012 to Sept 2013) was 6.24 per cent as compared to 7.97 per cent during corresponding period in 2012-13. The build-up of inflation since March is 5.64 per cent as against 4.84 per cent in the corresponding period last year. WPI inflation rates for major groups are given in Table 14.
Table 14: Current Price Situation based on Monthly WPI in September 2013 (Base: 2004-05=100)
Major groups Weight (%)
Cumulative change (%) Since March
Inflation (%) Inflation (%) (Average of 12 months)
2013-14 2012-13 2013-14
2012-13
2013-14 2012-13
ALL COMMODITIES 100.00 5.64 4.84 6.46 8.07 6.24 7.97
Inflation based on Consumer Price Indices (CPIs): The all India CPI inflation (combined) has increased to 9.84 per cent in September 2013 from 9.52 per cent in August 2013 mainly on account of increase in inflation of vegetables, fruits and spices. Inflation based on CPI-IW declined to 10.75 per cent in August 2013 from 10.85 per cent in July 2013. Inflation based on other consumer prices indices (CPI-AL and CPI-RL) was above 12 per cent in September 2013.
Table 15: Year-on-Year inflation based on WPI and CPIs (per cent)