23
Fiscal Policy , Poverty , and Income Inequality in Indonesia Ministry of Finance, Republic of Indonesia Fiscal Policy Agency August, 2014
Fiscal Policy, Poverty, and Income Inequality y y q yin Indonesia
Ministry of Finance, Republic of IndonesiaFiscal Policy Agency
August, 2014
Background
41,01 30%4045
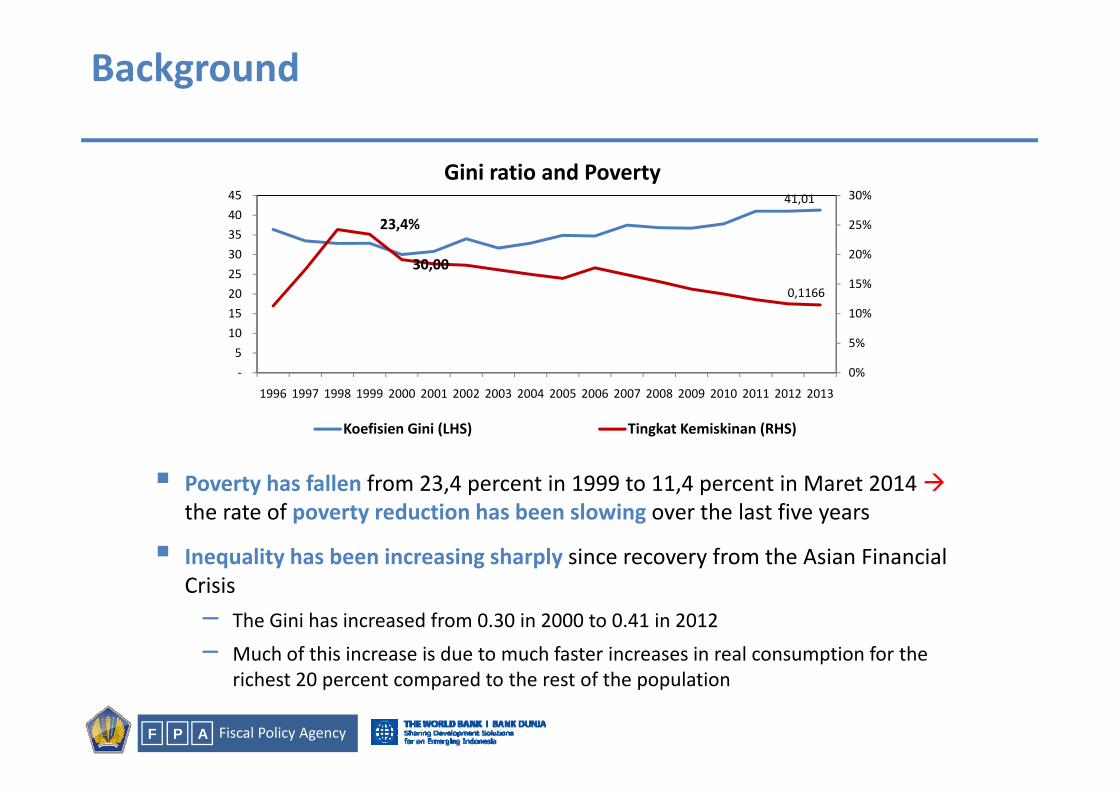
Gini ratio and Poverty
30,00
23,4%
0,116615%
20%
25%
20 25 30 35 40
0%
5%
10%
‐5 10 15
1996 1997 1998 1999 2000 2001 2002 2003 2004 2005 2006 2007 2008 2009 2010 2011 2012 2013
Poverty has fallen from 23 4 percent in 1999 to 11 4 percent in Maret 2014
1996 1997 1998 1999 2000 2001 2002 2003 2004 2005 2006 2007 2008 2009 2010 2011 2012 2013
Koefisien Gini (LHS) Tingkat Kemiskinan (RHS)
Poverty has fallen from 23,4 percent in 1999 to 11,4 percent in Maret 2014 the rate of poverty reduction has been slowing over the last five years
Inequality has been increasing sharply since recovery from the Asian Financial Crisis– The Gini has increased from 0.30 in 2000 to 0.41 in 2012
– Much of this increase is due to much faster increases in real consumption for the
Fiscal Policy AgencyP AF
richest 20 percent compared to the rest of the population
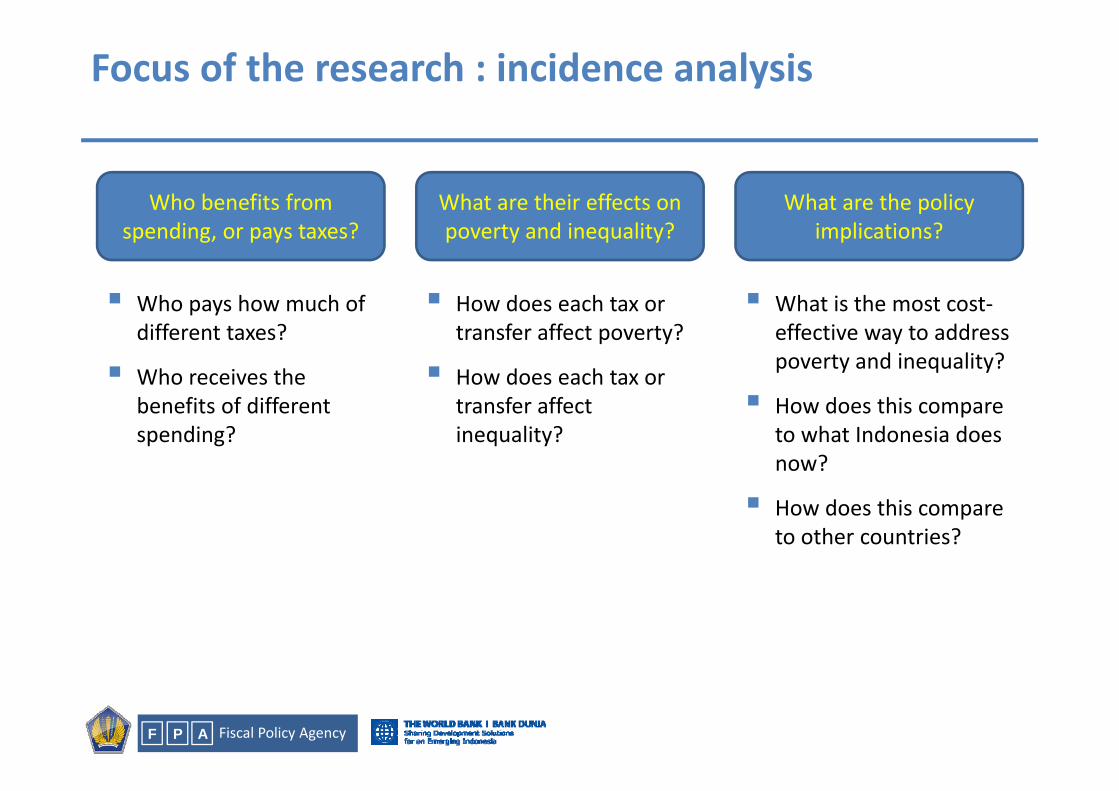
Focus of the research : incidence analysis
Who benefits from What are their effects on What are the policy spending, or pays taxes? poverty and inequality? implications?
Who pays how much of How does each tax or What is the most cost‐Who pays how much of different taxes?
Who receives the
How does each tax or transfer affect poverty?
How does each tax or
What is the most cost‐effective way to address poverty and inequality?
benefits of different spending?
transfer affect inequality?
How does this compare to what Indonesia does now?
How does this compare to other countries?
Fiscal Policy AgencyP AF
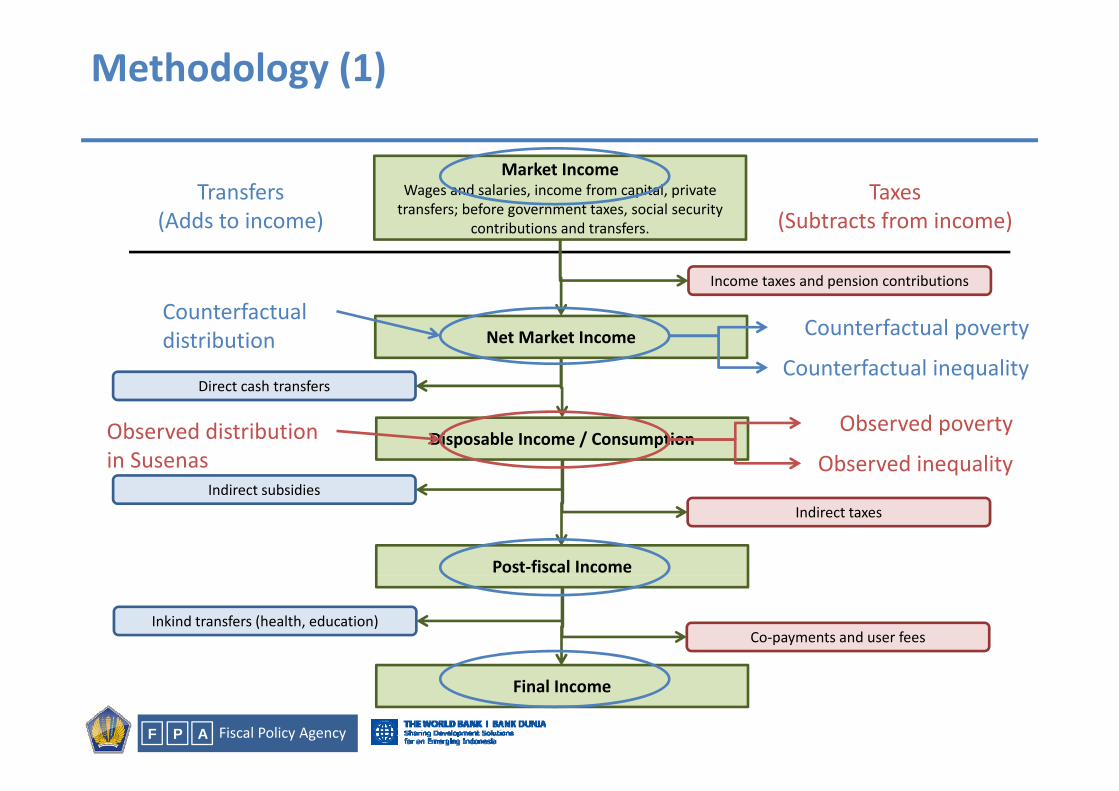
Methodology (1)
Market IncomeWages and salaries, income from capital, private transfers; before government taxes, social security
Transfers(Add t i )
Taxes(S bt t f i )
Income taxes and pension contributions
; g , ycontributions and transfers.(Adds to income) (Subtracts from income)
C t f t lNet Market Income
Direct cash transfers
Counterfactual povertyCounterfactual distribution
Counterfactual inequality
Disposable Income / Consumption
I di b idi
Observed povertyObserved distribution in Susenas Observed inequality
Post‐fiscal Income
Indirect taxesIndirect subsidies
Co‐payments and user feesInkind transfers (health, education)
Fiscal Policy AgencyP AF
Final Income
Methodology (2) : data
We use 2012 fiscal data on different revenues and expenditures– Central and district government
– Broken down by component
We apply standard incidence analysis to these different revenues and expendituresWe apply standard incidence analysis to these different revenues and expenditures– Which households pay how much of each tax?
– Which households receive how much of each transfer or expenditure?
We use 2012 Susenas to allocate these taxes and spending– For each household we know their total consumption (and consumption decile), what
items they consume, and their health and education usagey , g
– For each consumption decile, we determine how much of each tax it is paying
– For each consumption decile, we determine how much of each expenditure it is receivingreceiving
Fiscal Policy AgencyP AF
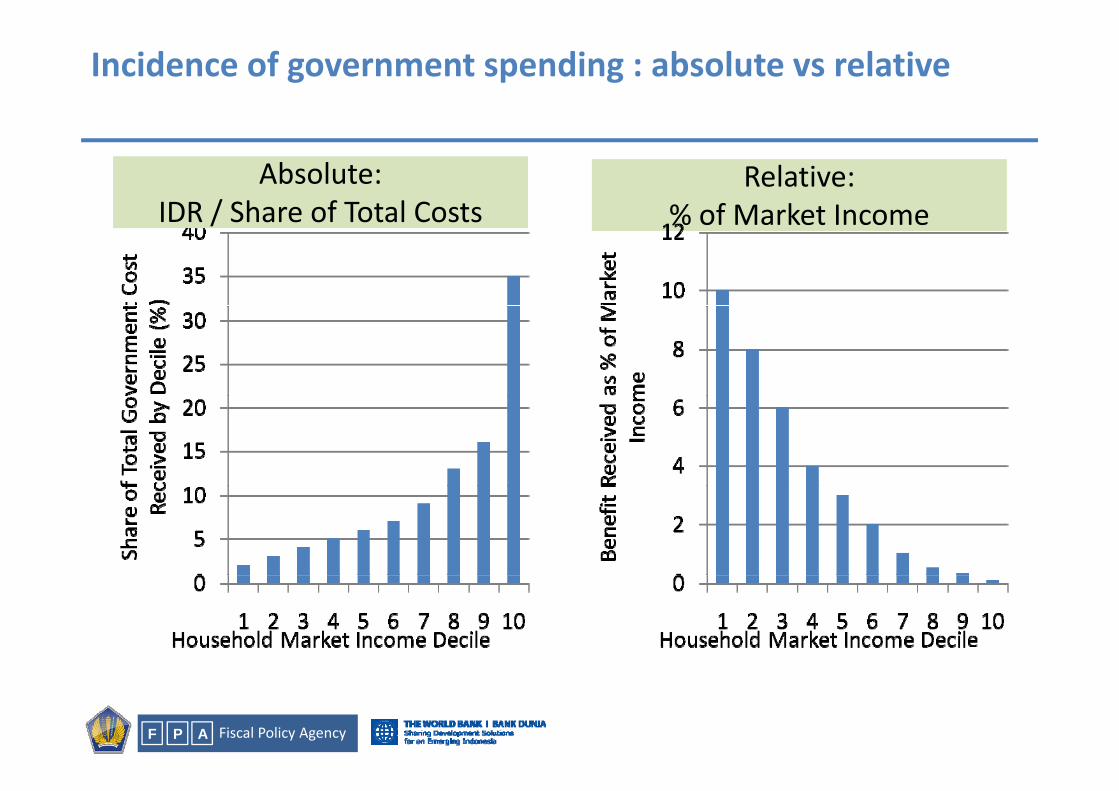
Incidence of government spending : absolute vs relative
Absolute:IDR / Share of Total Costs
Relative:% of Market IncomeIDR / Share of Total Costs % of Market Income
Fiscal Policy AgencyP AF
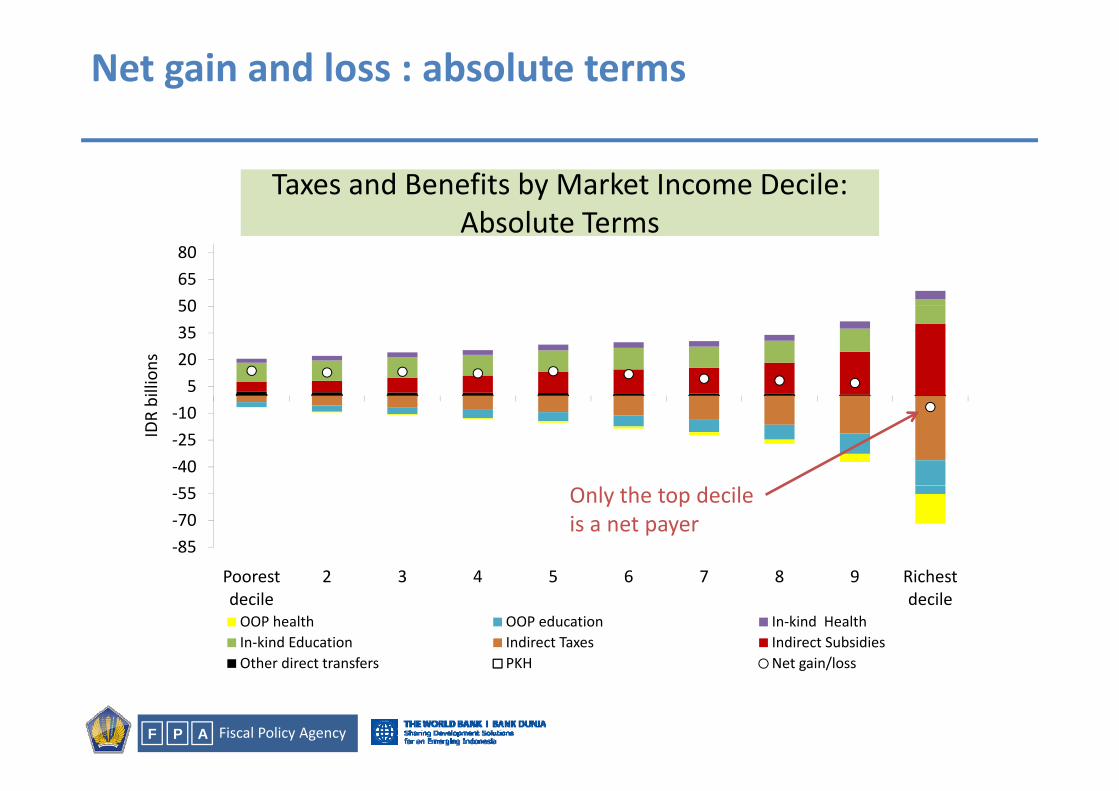
Net gain and loss : absolute terms
Taxes and Benefits by Market Income Decile:Ab l t T
506580
Absolute Terms
5203550
illions
‐40‐25‐10
IDR bi
‐85‐70‐55
Poorest 2 3 4 5 6 7 8 9 Richest
Only the top decile is a net payer
Poorest decile
2 3 4 5 6 7 8 9 Richest decile
OOP health OOP education In‐kind HealthIn‐kind Education Indirect Taxes Indirect SubsidiesOther direct transfers PKH Net gain/loss
Fiscal Policy AgencyP AF
Other direct transfers PKH Net gain/loss
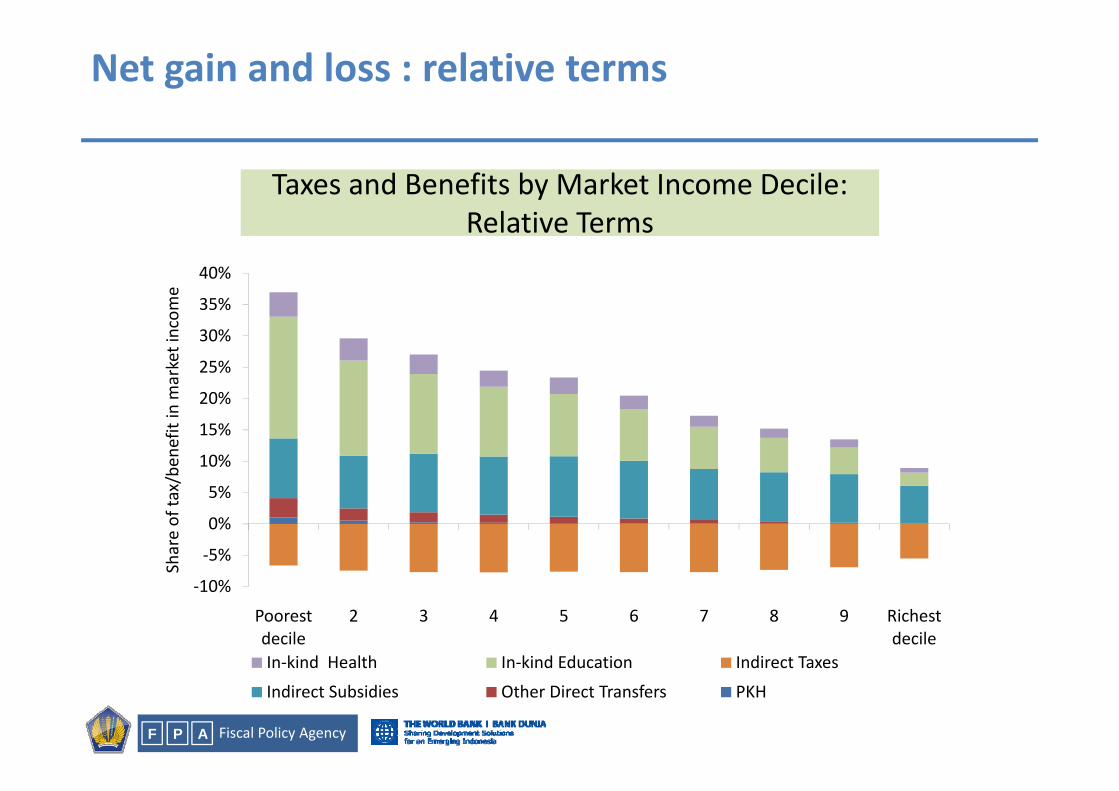
Net gain and loss : relative terms
Taxes and Benefits by Market Income Decile:R l ti T
35%
40%
me
Relative Terms
20%
25%
30%
35%
market incom
10%
15%
20%
x/be
nefit in
m
‐5%
0%
5%
Share of ta
x
‐10%
Poorest decile
2 3 4 5 6 7 8 9 Richest decile
In‐kind Health In‐kind Education Indirect Taxes
Fiscal Policy AgencyP AF
In kind Health In kind Education Indirect Taxes
Indirect Subsidies Other Direct Transfers PKH
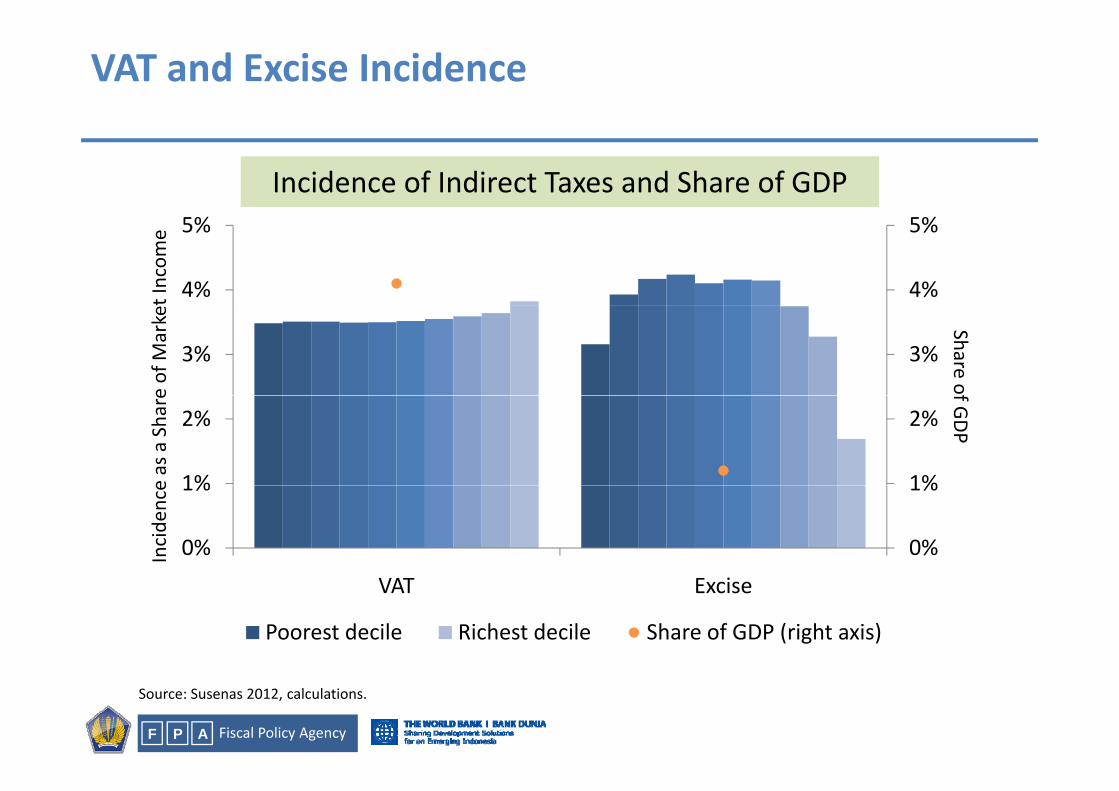
VAT and Excise Incidence
Incidence of Indirect Taxes and Share of GDP
4%
5%
4%
5%
t Incom
e
3%3%
Share ofe of M
arke
1%
2%
1%
2%
f GDP
e as a Share
0%
1%
0%
1%
Incide
nce
VAT Excise
Poorest decile Richest decile Share of GDP (right axis)
Fiscal Policy AgencyP AF
Source: Susenas 2012, calculations.
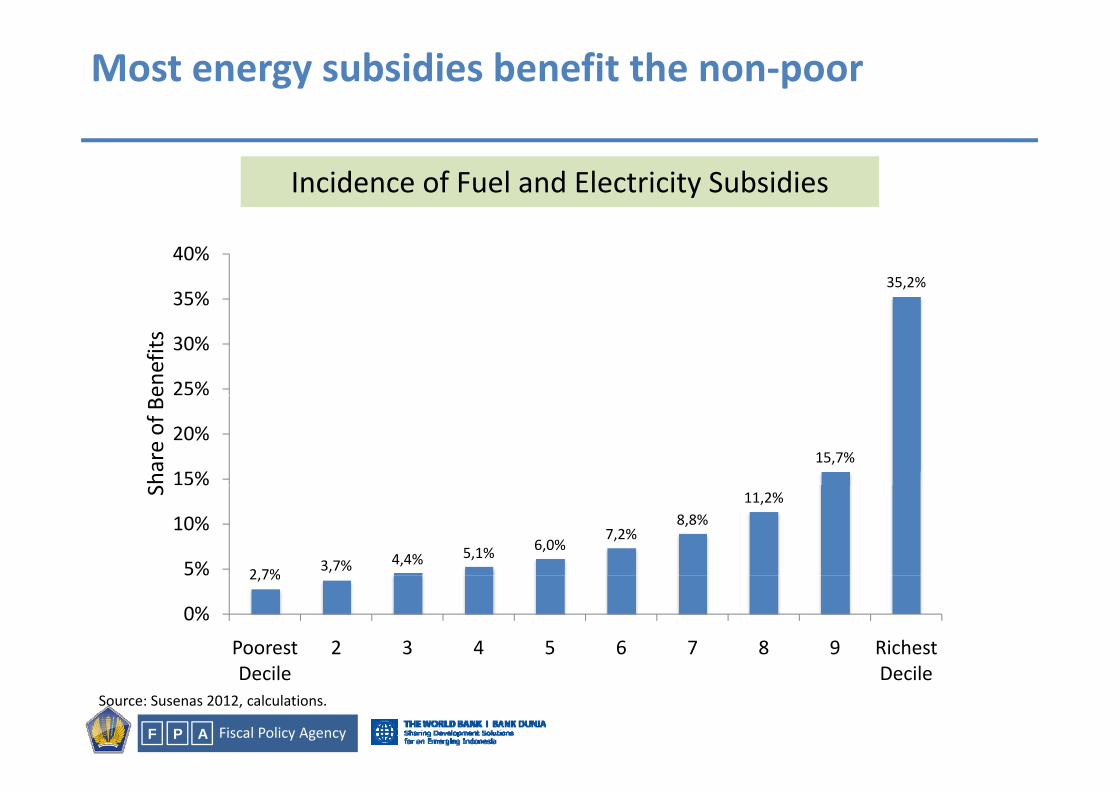
Most energy subsidies benefit the non‐poor
Incidence of Fuel and Electricity Subsidies
35,2%35%
40%
25%
30%
enefits
15,7%15%
20%
hare of B
e
2 7% 3,7% 4,4% 5,1% 6,0%7,2%
8,8%11,2%
5%
10%
%S
2,7%
0%
5%
Poorest 2 3 4 5 6 7 8 9 Richest
Fiscal Policy AgencyP AF
Decile DecileSource: Susenas 2012, calculations.
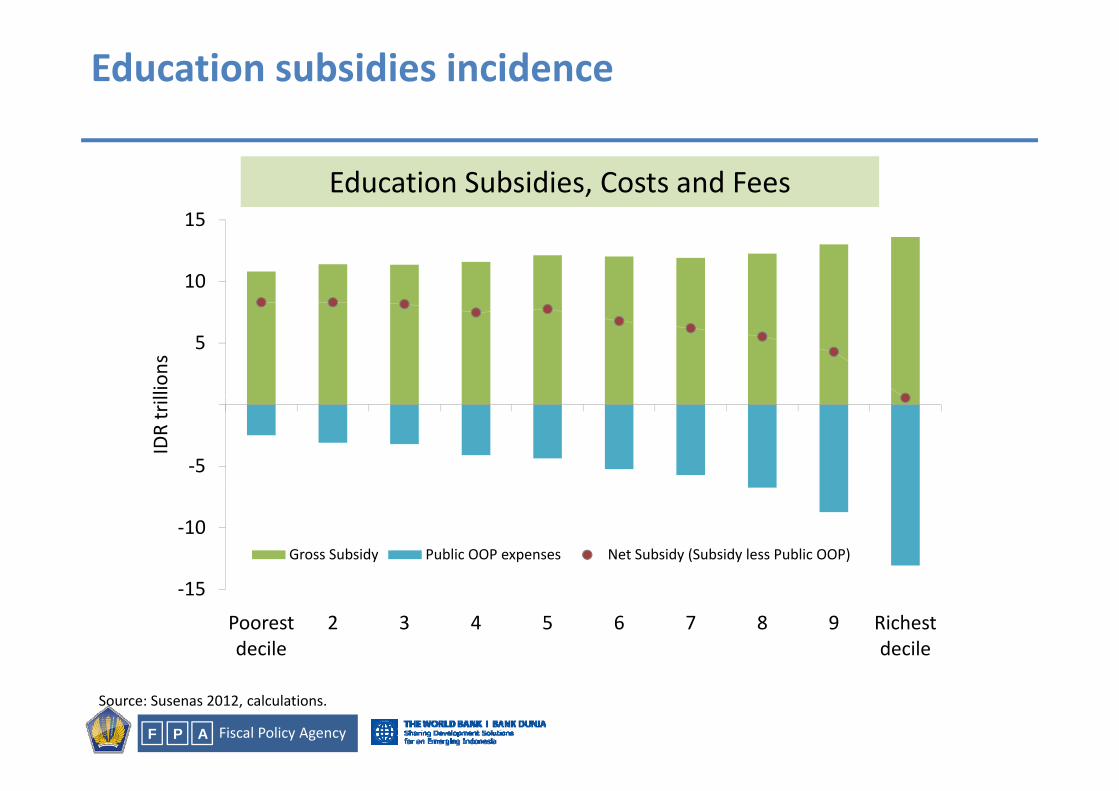
Education subsidies incidence
Education Subsidies, Costs and Fees15
10
15
5
lions
‐5
IDR tril
‐10Gross Subsidy Public OOP expenses Net Subsidy (Subsidy less Public OOP)
‐15
Poorest decile
2 3 4 5 6 7 8 9 Richest decile
Fiscal Policy AgencyP AF
Source: Susenas 2012, calculations.
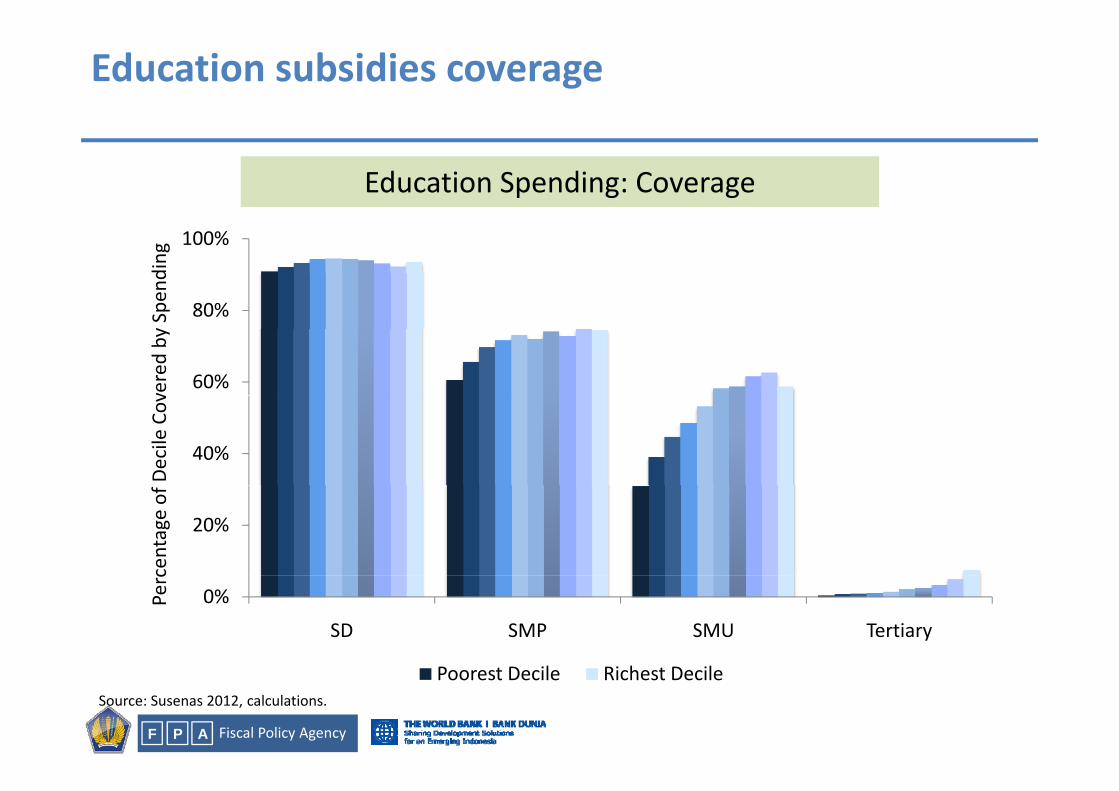
Education subsidies coverage
Education Spending: Coverage
80%
100%
pend
ing
60%
80%
vered by Sp
40%
Decile Cov
20%
centage of
0%
SD SMP SMU Tertiary
Perc
Fiscal Policy AgencyP AF
Poorest Decile Richest DecileSource: Susenas 2012, calculations.
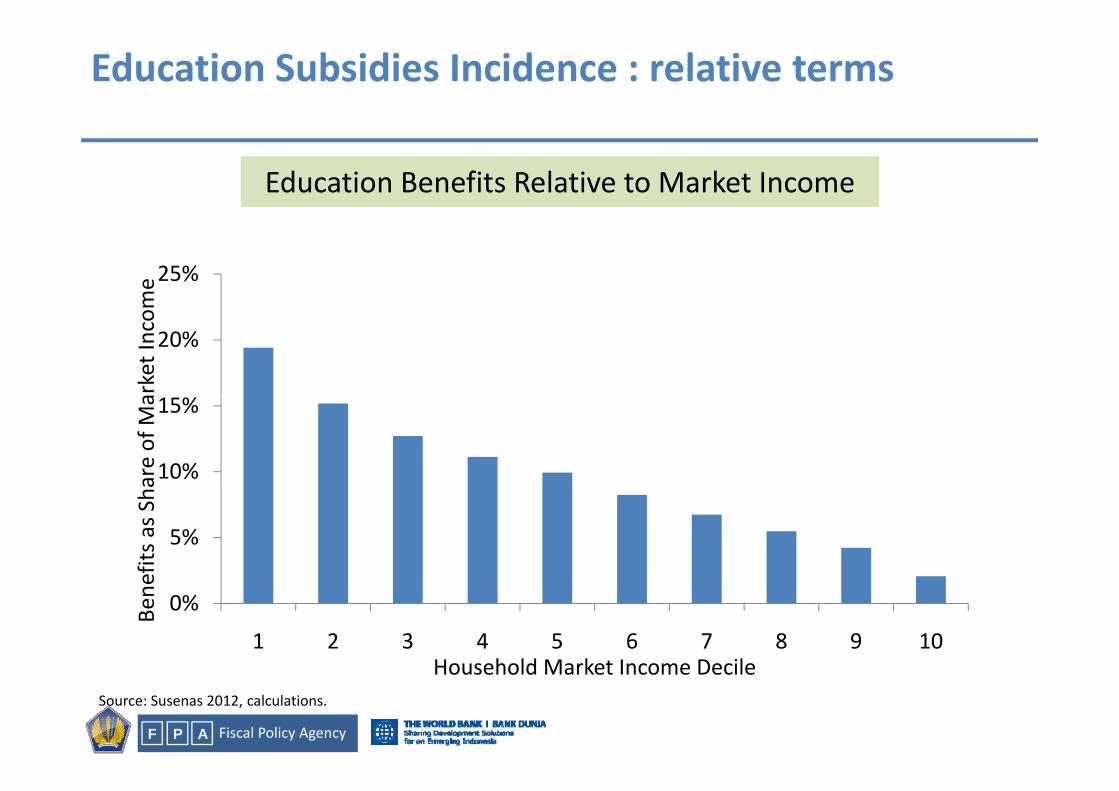
Education Subsidies Incidence : relative terms
Education Benefits Relative to Market Income
25%
me
20%
rket Incom
10%
15%
are of M
a
5%
efits as S
ha
0%
1 2 3 4 5 6 7 8 9 10
Bene
Household Market Income Decile
Fiscal Policy AgencyP AF
Household Market Income DecileSource: Susenas 2012, calculations.
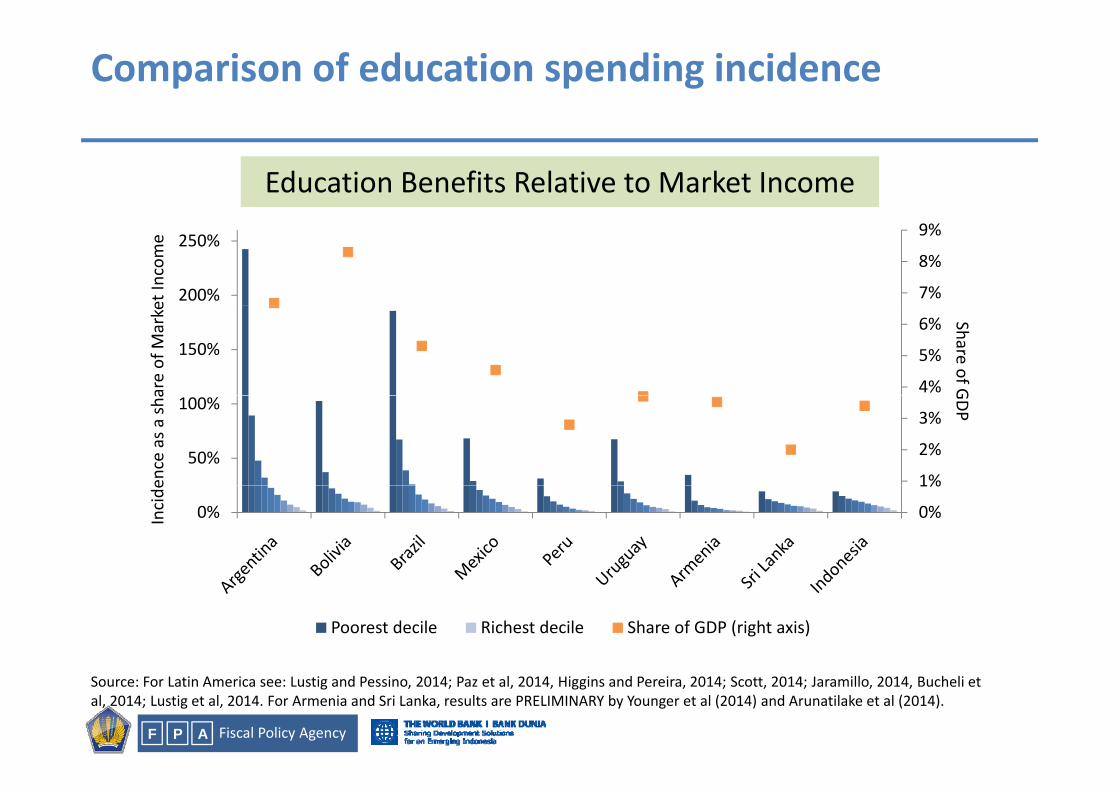
Comparison of education spending incidence
Education Benefits Relative to Market Income
7%
8%
9%
200%
250%
et Income
4%
5%
6%150%
Share of Gare of M
arke
1%
2%
3%
50%
100%
GDP
ence as a
sha
0%
1%
0%Incide
Poorest decile Richest decile Share of GDP (right axis)
Fiscal Policy AgencyP AF
Source: For Latin America see: Lustig and Pessino, 2014; Paz et al, 2014, Higgins and Pereira, 2014; Scott, 2014; Jaramillo, 2014, Bucheli et al, 2014; Lustig et al, 2014. For Armenia and Sri Lanka, results are PRELIMINARY by Younger et al (2014) and Arunatilake et al (2014).
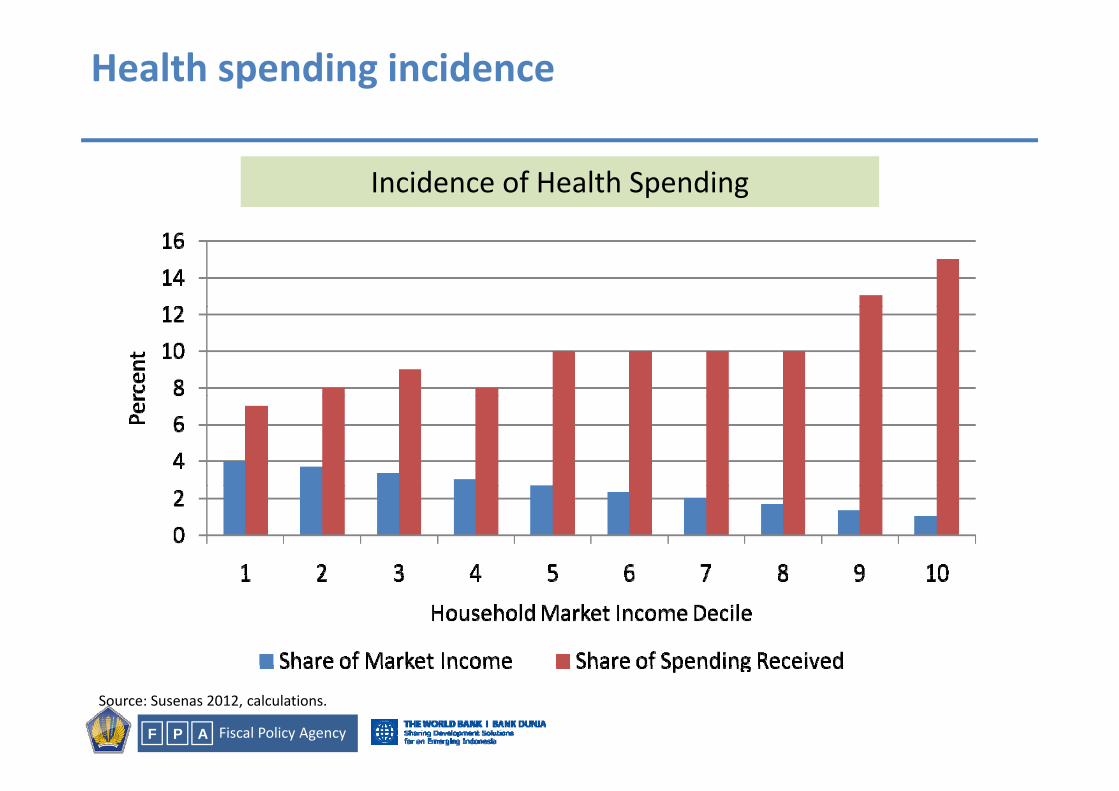
Health spending incidence
Incidence of Health Spending
Fiscal Policy AgencyP AF
Source: Susenas 2012, calculations.
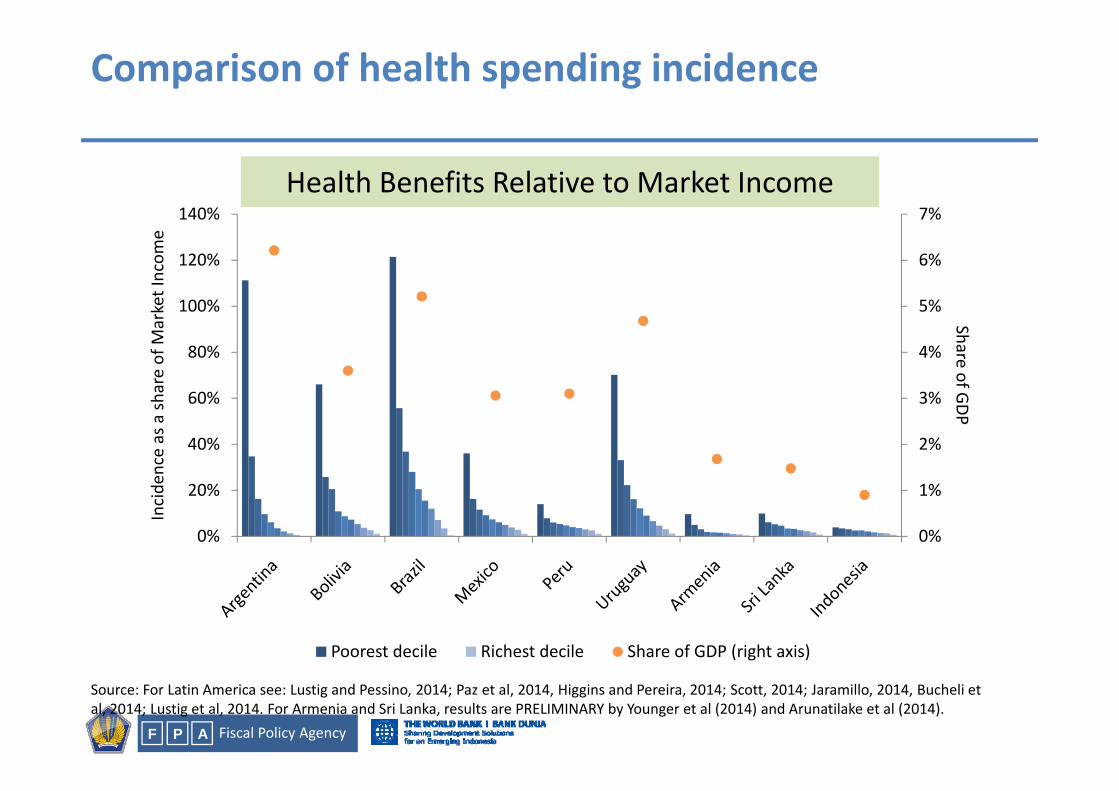
Comparison of health spending incidence
Health Benefits Relative to Market Income7%140%
5%
6%
7%
100%
120%
140%
ket Incom
e
3%
4%
5%
60%
80%
100%
Share of Ghare of M
ark
1%
2%
3%
20%
40%
60% GDP
ence as a
sh
0%
1%
0%
20%
Incid
Poorest decile Richest decile Share of GDP (right axis)
Fiscal Policy AgencyP AF
Source: For Latin America see: Lustig and Pessino, 2014; Paz et al, 2014, Higgins and Pereira, 2014; Scott, 2014; Jaramillo, 2014, Bucheli et al, 2014; Lustig et al, 2014. For Armenia and Sri Lanka, results are PRELIMINARY by Younger et al (2014) and Arunatilake et al (2014).
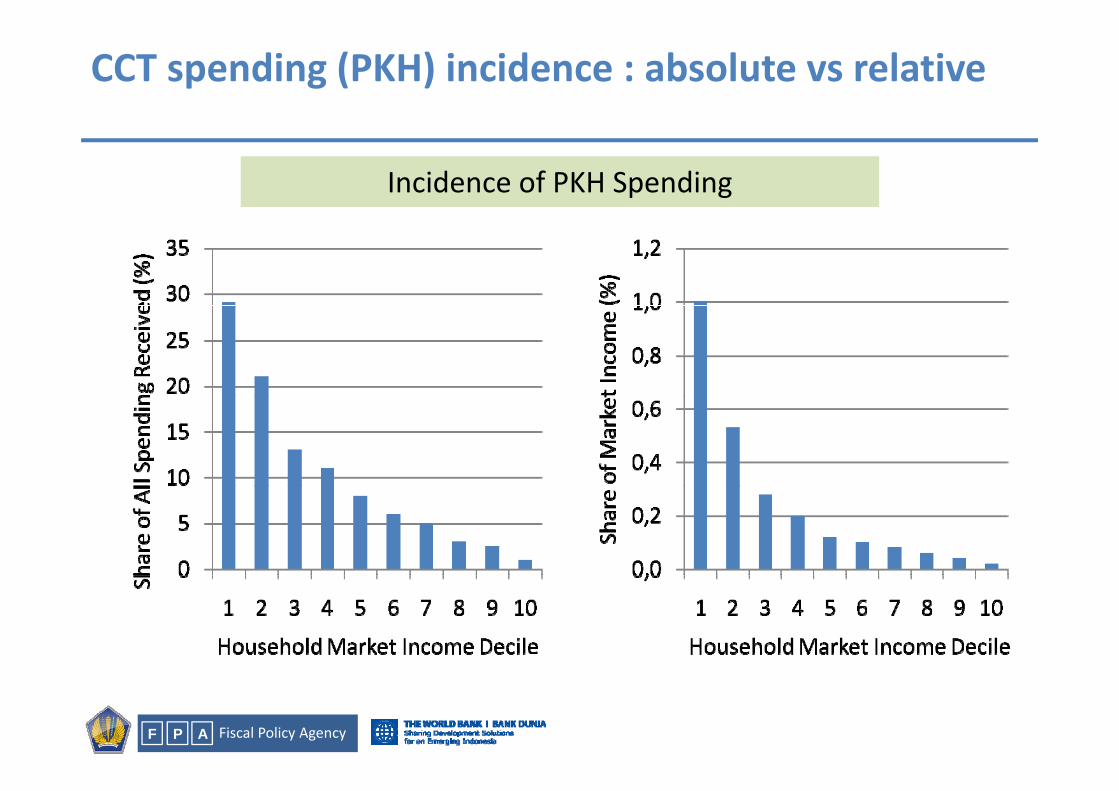
CCT spending (PKH) incidence : absolute vs relative
Incidence of PKH Spending
Fiscal Policy AgencyP AF
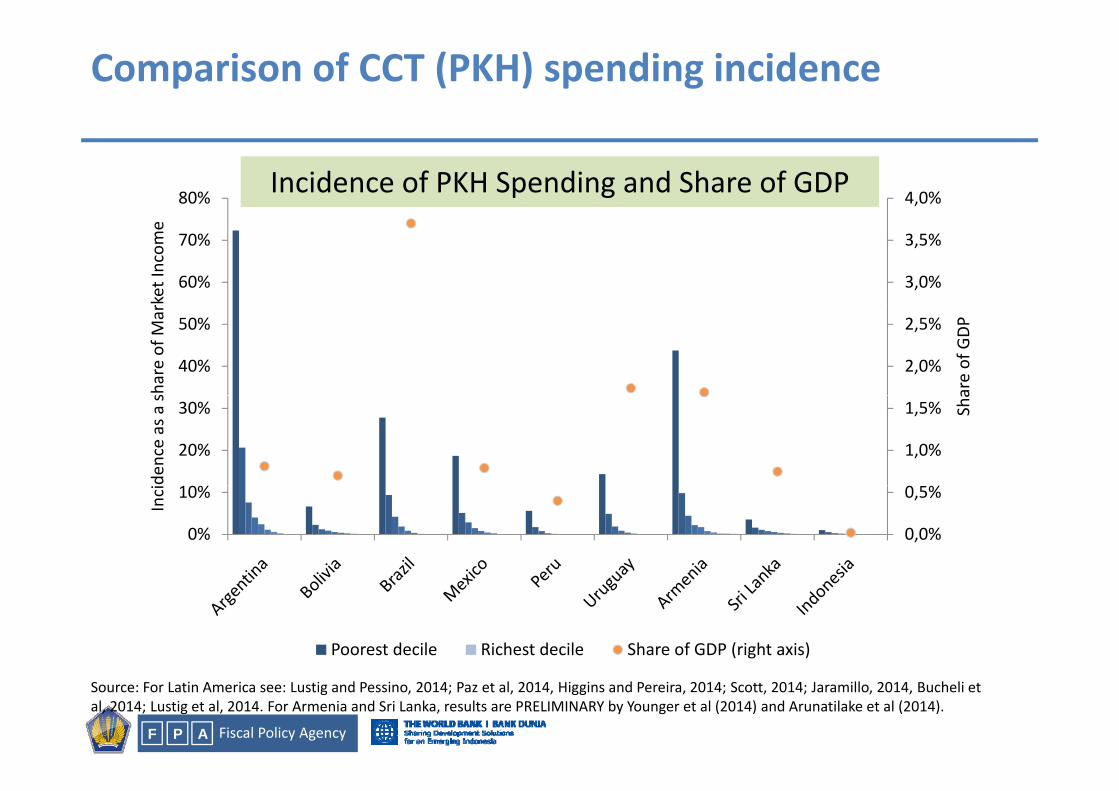
Comparison of CCT (PKH) spending incidence
Incidence of PKH Spending and Share of GDP 4,0%80%
3,0%
3,5%
60%
70%
rket Income
2,0%
2,5%
40%
50%
are of GDP
share of M
ar
1,0%
1,5%
20%
30% Sha
dence as a s
0,0%
0,5%
0%
10%
Inci
Poorest decile Richest decile Share of GDP (right axis)
Fiscal Policy AgencyP AF
Source: For Latin America see: Lustig and Pessino, 2014; Paz et al, 2014, Higgins and Pereira, 2014; Scott, 2014; Jaramillo, 2014, Bucheli et al, 2014; Lustig et al, 2014. For Armenia and Sri Lanka, results are PRELIMINARY by Younger et al (2014) and Arunatilake et al (2014).
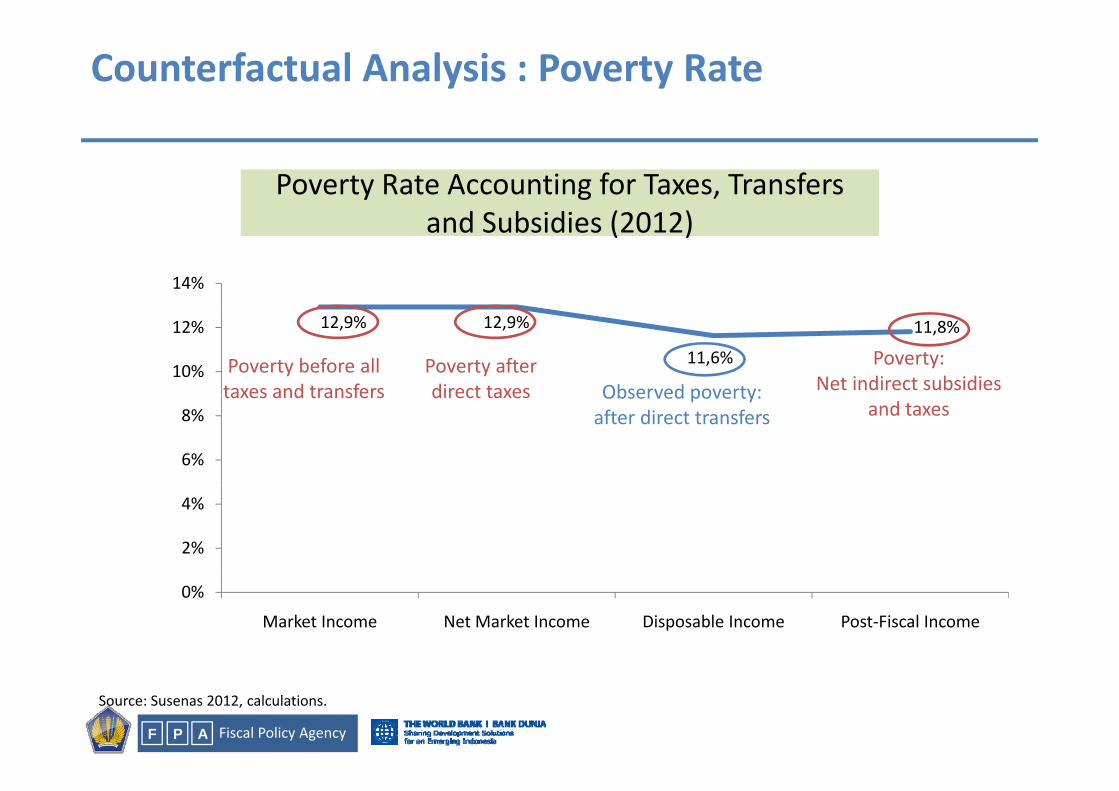
Counterfactual Analysis : Poverty Rate
Poverty Rate Accounting for Taxes, Transfers d S b idi (2012)and Subsidies (2012)
14%
12,9% 12,9%
11,6%
11,8%
10%
12%
Observed poverty:Poverty after direct taxes
Poverty before all taxes and transfers
Poverty:Net indirect subsidies
6%
8%Observed poverty:after direct transfers
direct taxestaxes and transfersand taxes
2%
4%
0%
Market Income Net Market Income Disposable Income Post‐Fiscal Income
Fiscal Policy AgencyP AF
Source: Susenas 2012, calculations.
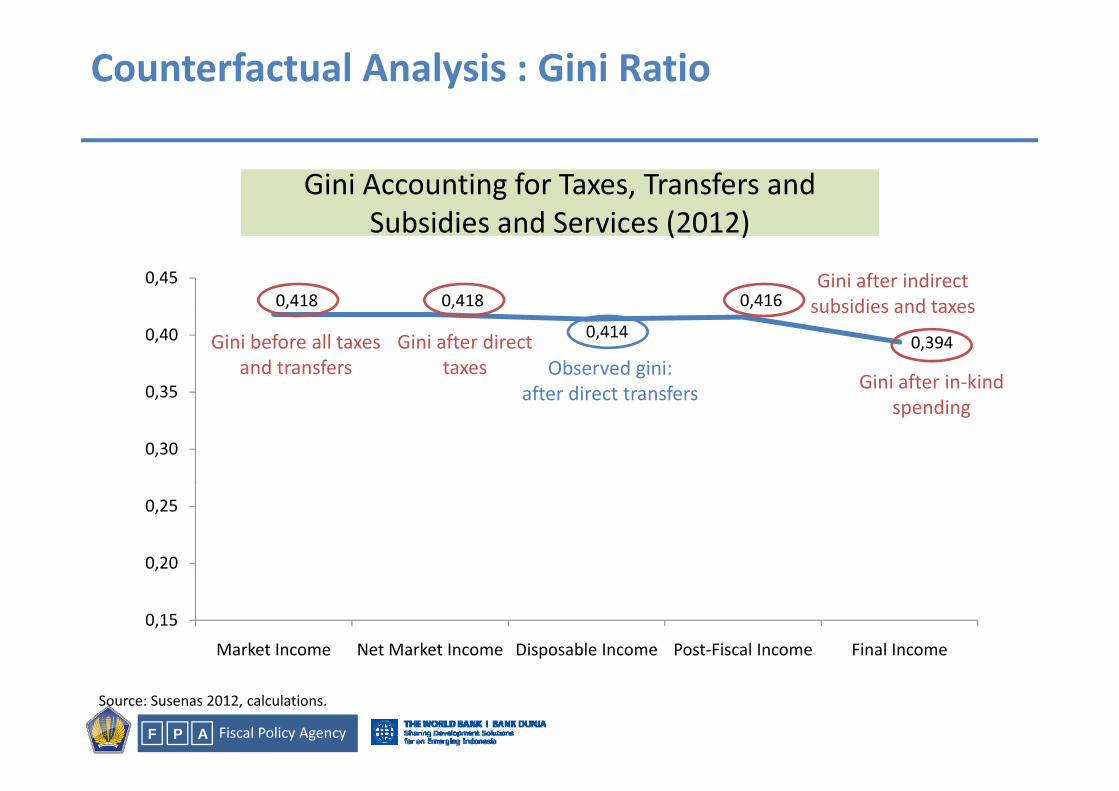
Counterfactual Analysis : Gini Ratio
Gini Accounting for Taxes, Transfers and S b idi d S i (2012)
0,418 0,418 0,4160,45
Subsidies and Services (2012)
Gini after indirect subsidies and taxes0,418 0,418
0,414
0,416
0,394
0,35
0,40
Observed gini:after direct transfers
Gini after direct taxes
Gini before all taxes and transfers
subsidies and taxes
Gini after in‐kind
0,30
0,35 after direct transfersspending
0,20
0,25
0,15
Market Income Net Market Income Disposable Income Post‐Fiscal Income Final Income
Fiscal Policy AgencyP AF
Source: Susenas 2012, calculations.
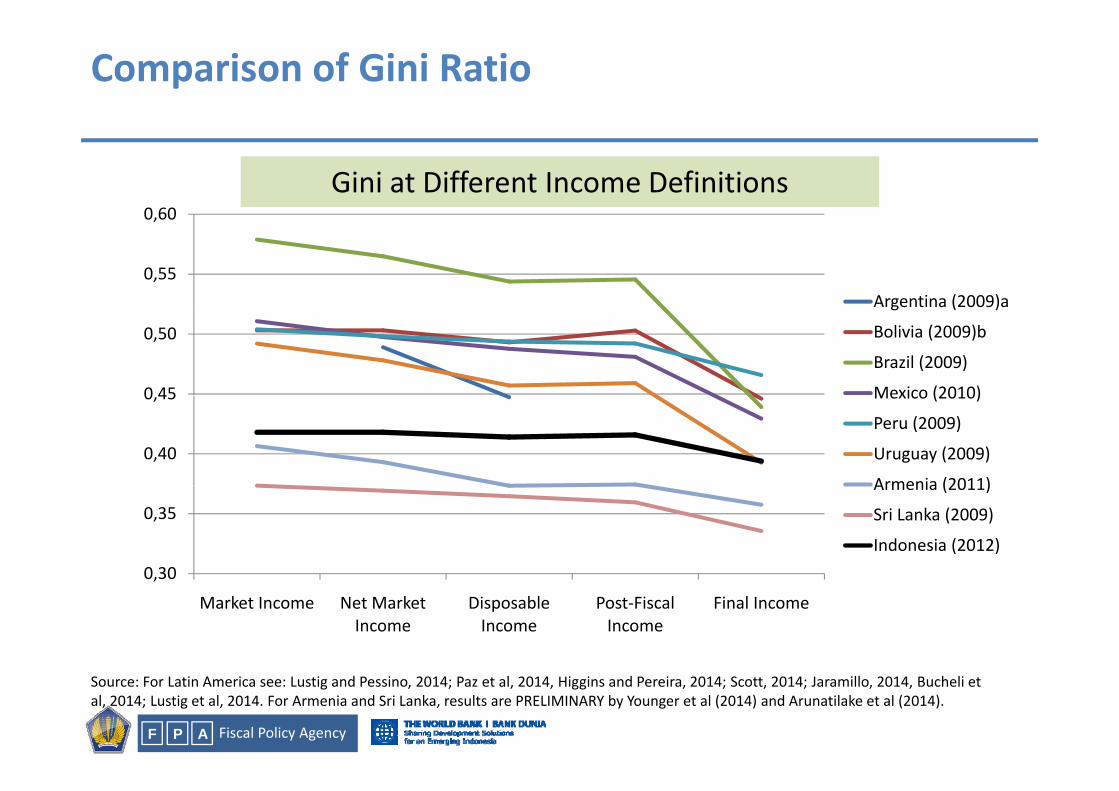
Comparison of Gini Ratio
Gini at Different Income Definitions0 60
0,55
0,60
Argentina (2009)a
0 45
0,50
Argentina (2009)a
Bolivia (2009)b
Brazil (2009)
Mexico (2010)
0,40
0,45 Mexico (2010)
Peru (2009)
Uruguay (2009)
Armenia (2011)
0 30
0,35
Armenia (2011)
Sri Lanka (2009)
Indonesia (2012)0,30
Market Income Net Market Income
Disposable Income
Post‐Fiscal Income
Final Income
Fiscal Policy AgencyP AF
Source: For Latin America see: Lustig and Pessino, 2014; Paz et al, 2014, Higgins and Pereira, 2014; Scott, 2014; Jaramillo, 2014, Bucheli et al, 2014; Lustig et al, 2014. For Armenia and Sri Lanka, results are PRELIMINARY by Younger et al (2014) and Arunatilake et al (2014).
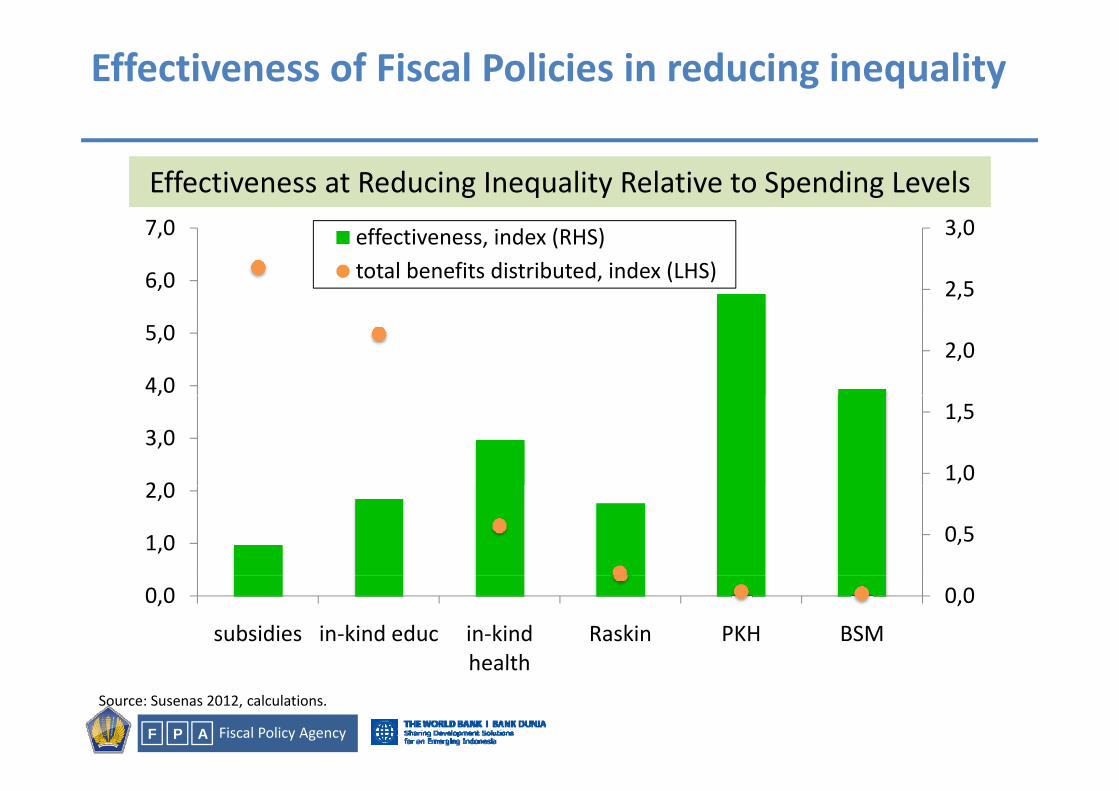
Effectiveness of Fiscal Policies in reducing inequality
Effectiveness at Reducing Inequality Relative to Spending Levels
2,5
3,0
6,0
7,0 effectiveness, index (RHS)total benefits distributed, index (LHS)
2,04,0
5,0
1,0
1,5
2 0
3,0
,
0,51,0
2,0
0,00,0
subsidies in‐kind educ in‐kind health
Raskin PKH BSM
Fiscal Policy AgencyP AF
healthSource: Susenas 2012, calculations.
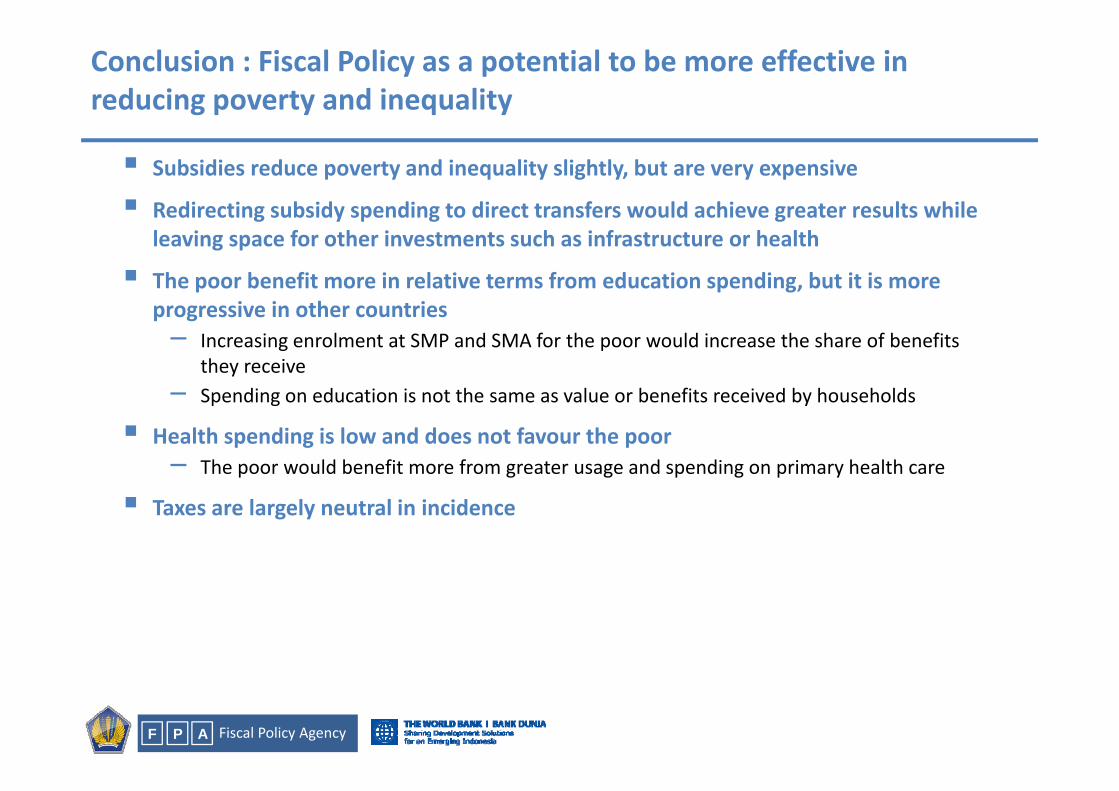
Conclusion : Fiscal Policy as a potential to be more effective in reducing poverty and inequality
Subsidies reduce poverty and inequality slightly, but are very expensive
Redirecting subsidy spending to direct transfers would achieve greater results whileRedirecting subsidy spending to direct transfers would achieve greater results while leaving space for other investments such as infrastructure or health
The poor benefit more in relative terms from education spending, but it is more progressive in other countriesprogressive in other countries– Increasing enrolment at SMP and SMA for the poor would increase the share of benefits
they receive– Spending on education is not the same as value or benefits received by householdsSpending on education is not the same as value or benefits received by households
Health spending is low and does not favour the poor– The poor would benefit more from greater usage and spending on primary health care
Taxes are largely neutral in incidence
Fiscal Policy AgencyP AF


