253
Ministry of Health and Family Welfare
Ministry of Health and Family Welfare

Ministry of Health and Family Welfare
GLOBAL ADULT TOBACCO SURVEY:BANGLADESH REPORT 2009

WHO Library Cataloguing-in-Publication data
World Health Organization, Country Office for Bangladesh.Global adult tobacco survey: Bangladesh report 2009.
1. Tobacco use disorder - prevention and control. 2. Tobacco use cessation.3. Tobacco industry – economics - legislation 4. Smoking - prevention and control.5. Knowledge, Attitudes, Practice. 6. Bangladesh, Ministry of Health and Family Welfare.7. US Centers for Disease Control and Prevention, Office on Smoking and Health.
ISBN: 978-92-9022-372-3 (NLM classification: WM 290)
© World Health Organization 2009
All rights reserved.
Requests for publications, or for permission to reproduce or translate WHO publications
– whether for sale or for noncommercial distribution – can be obtained from World HealthOrganization, Country Office for Bangladesh, House No. 12, Road No. 7, Dhanmondi ResidentialArea, Dhaka 1205, fax: +880 2 8613247; e-mail: [email protected]
The designations employed and the presentation of the material in this publication do not implythe expression of any opinion whatsoever on the part of the World Health Organization concerningthe legal status of any country, territory, city or area or of its authorities, or concerning thedelimitation of its frontiers or boundaries. Dotted lines on maps represent approximate borderlines for which there may not yet be full agreement.
The mention of specific companies or of certain manufacturers’ products does not imply that theyare endorsed or recommended by the World Health Organization in preference to others of asimilar nature that are not mentioned. Errors and omissions excepted, the names of proprietaryproducts are distinguished by initial capital letters.
All reasonable precautions have been taken by the World Health Organization to verify theinformation contained in this publication. However, the published material is being distributedwithout warranty of any kind, either expressed or implied. The responsibility for the interpretationand use of the material lies with the reader. In no event shall the
World Health Organization be liable for damages arising from its use. This publication does notnecessarily represent the decisions or policies of the World Health Organization.
Printed in Bangladesh, December 2009
ii

MinisterMinistry of Health & Family Welfare
Government of the People’s Republic of Bangladesh
It is a great pleasure to have this report of the Global Adult Tobacco Survey (GATS) 2009 in Bangladesh.It is the product of a long, sincere effort of GATS Bangladesh team.
This survey was designed to produce internationally comparable data on tobacco use and tobaccocontrol measures using a standardized questionnaire, sample design, data collection and managementprocedures.
The Ministry of Health and Family Welfare designated the National Institute of Preventive andSocial Medicine (NIPSOM) as the implementing agency for the survey. NIPSOM conducted GATS incollaboration with the Bangladesh Bureau of Statistics and National Institute of Population Researchand Training. I am happy that they have completed the survey within the stipulated time.
In this regard, I am also grateful to the Bloomberg Philanthropies for their financial support, andto the World Health Organization and the Centers for Disease Control and Prevention (CDC), UnitedStates, for their technical assistance.
The present Government is committed to building a “Digital Bangladesh”, and the GATS was thefirst ever survey using electronic means of data collection. This brings Bangladesh one step closertoward its goal.
I trust that this report will contribute to the monitoring of the MPOWER policy package for tobaccocontrol in Bangladesh.
Professor Dr A.F.M. Ruhal Haque
iii
Message

iv

v
Advisor toThe Honorable Prime Minister of the
People’s Republic of Bangladesh(Health & Family Welfare & Social Welfare Ministry)
I feel proud that Bangladesh is one of the 15 countries in the world that has undertaken a Global AdultTobacco Survey (GATS) in 2009. It is the second country to complete the study, after Thailand.
Surveillance and evaluation systems are an integral part of tobacco control programme. Thedevelopment of such a system is an obligation for the parties to the WHO Framework Convention onTobacco Control (FCTC). The GATS 2009 will help us monitor the tobacco consumption and otherrelevant issues necessary for tobacco control policies and programmes in Bangladesh. GATS, usingelectronic means of data collection, also helps us move towards fulfilling the Government’scommitment to build a digital Bangladesh.
I must thank the National Institute of Preventive and Social Medicine for completing thischallenging task in collaboration with Bangladesh Bureau of Statistics and National Institute ofPopulation Research and Training. I am happy that they have set an example by completing the surveyin time despite many obstacles, including a natural disaster.
In this regard, I would also like to thank the World Health Organization and the Centers for DiseaseControl and Prevention (CDC), United States, for their continuous support and technical assistance. Weare grateful to the Bloomberg Philanthropies for their financial support.
I hope the findings will help in monitoring tobacco use in adults aged 15 years and above and intracking the key tobacco control indicators of the WHO FCTC, as well as in monitoring implementationof the MPOWER policy package for tobacco control in Bangladesh.
Professor Dr Syed Modasser Ali
Message

vi

State MinisterMinistry of Health & Family Welfare
Government of the People’s Republic of Bangladesh
I am pleased to know that the report of the Global Adult Tobacco Survey (GATS) Bangladesh 2009 isnow being published after the successful completion of the survey. The survey was conducted by theNational Institute of Preventive and Social Medicine in collaboration with Bangladesh Bureau ofStatistics and the National Institute of Population Research and Training.
It is exciting to see that the survey covered the whole country, including some very hard-to-reachareas. The study was done even in areas affected by Cyclone Aila after the recession of the floodwaters. The GATS is a real example of the increasing digital capacity of Bangladesh. The sampling framethat has been established for this study can be used for future health-related studies in Bangladesh,which will make it possibile to save time and resources.
I would like to thank the World Health Organization and the Centers for Disease Control andPrevention (CDC), United States, for their continuous support and technical guidance, and theBloomberg Philanthropies for their financial support.
I hope the findings of this study will guide the way in monitoring tobacco use in adults and theimplementation of the Tobacco Control Acts in Bangladesh.
Joy BanglaJoy Bangabandhu
Dr Capt. (Retd.) Mozibur Rahman Fakir
vii
Message

viii

ix
Secretary Ministry of Health and Family Welfare
Government of the People's Republic of Bangladesh
I am very much pleased to know the Na�onal Ins�tute of Preven�ve and Social Medicine with thecollabora�on of Na�onal Ins�tute of Popula�on Research and Training and Bangladesh Bureau ofSta�s�cs have completed the Global Adult Tobacco Survey successfully in Bangladesh.
Tobacco use is causing serious harms to the society both in terms of health and economic effects.For effec�ve tobacco control, informa�on related to its use and other indicators are required. Moreoveras a signatory of WHO FCTC, we need to strengthen and monitor our tobacco control programme. I amsure that GATS Bangladesh report will provide us valuable informa�on in this regard. I gratefullyacknowledge the technical support provided by the World Health Organiza�on and the U.S. Centersfor Disease Control for the survey. We are also grateful to the Bloomberg Philanthropies for theirfinancial support.
I believe that substan�al capacity building and technology transfer were done through this surveyfor doing survey through electronic machines. Experience gained through this survey can be u�lizedfor doing surveys using the new technology.
Shaikh Altaf Ali
Message

x

Director General of Health ServicesGovernment of the People’s Republic of Bangladesh
It gives me an immense pleasure to know that Na�onal Ins�tute of Preven�ve and Social Medicine hascompleted the Global Adult Tobacco Survey in Bangladesh maintaining the requisite quality. It is indeeda great achievement of this premier ins�tute of public health of this country. I thank Na�onal Ins�tutefor Popula�on Research and Training and Bangladesh Bureau of Sta�s�cs (BBS) for their coopera�onin this important survey.
Tobacco control is one of the important strategies for preven�on of noncommunicable disease,which is on the rise in Bangladesh. We need to strengthen our tobacco programme to prevent the riseof noncommunicable diseases. I am sure the data from the GATS survey will help us to know thecurrent status of tobacco use and other key tobacco control indicators. GATS data has shown that bothsmoking and smokeless tobacco consump�on are high in Bangladesh and among the smoker a largenumber consume bidi. Based on the findings of this survey, we need to design appropriate interven�onprogramme for specific target groups.
I thank World Health Organiza�on and the U.S. Centers for Disease Control and Preven�on fortheir technical support and collabora�on. We acknowledge the financial support provided byBloomberg Philanthropies for this survey. I am happy to learn that substan�al capacity building fordoing large scale survey by using electronic data collec�on system has been done through this survey.This will take the present government’s commitment for a digital Bangladesh a step ahead. I amgrateful to Ministry of Health and Family welfare for entrus�ng NIPSOM with this job and providingleadership.
Professor Shah Monir Hossain
xi
Message

xii
xiii
Tobacco use is a major cause of preventable deaths and disabilities. The Global Adult Tobacco Survey(GATS) provides information on various key indicators of tobacco control comparable across countries.
I am pleased to see that GATS in Bangladesh was completed successfully even in spite ofchallenging occurrences such as cyclone Aila. I commend the Ministry of Health and Family Welfare fortheir leadership in conducting the survey. The National Institute of Preventive and Social Medicine, themain implementing agency for the survey, did an excellent job in collaboration with the NationalInstitute of Population Research and Training and the Bangladesh Bureau of Statistics. I gratefullyacknowledge the technical support provided by the U.S. Centers for Disease Control and Prevention,Research Triangle Institute International and colleagues from the WHO Regional Office for South-EastAsia and WHO headquarters.
This survey used electronic data capture machines, which has contributed substantially to capacitybuilding of the country to conduct large and standardized surveys using information technology. Thesame machines are now used in the national survey of risk factors for noncommunicable diseases.
The GATS report has gathered important data on various aspects of tobacco use and of the tobaccocontrol programme in Bangladesh. I am confident that this report will be useful in designing andimplementing effective tobacco control policies and interventions in Bangladesh.
Dr Duangvadee SungkhobolWHO Representative to Bangladesh
Message

xiv

On behalf of the U.S. Centers for Disease Control and Prevention (CDC), I congratulateBangladesh in publishing its first Global Adult Tobacco Survey results. This report marks amilestone in Bangladesh’s participation in the first global survey to track adult tobacco use andrelated trends using standardized methods. This report has great potential to improve tobaccouse prevention and control efforts in Bangladesh.
Bangladesh faces a serious tobacco epidemic. Nearly half of the nation’s men are smokers.More than half of all adults are exposed to tobacco smoke in the workplace. Bidis, small hand-rolled cigarettes, pose a grave public health threat. Bidis are linked with several cancers, heartdisease, heart attacks, emphysema, and chronic bronchitis. But there is promising news: thereport shows that most of Bangladesh’s adult population recognize the dangers of tobacco useand support some restrictions on tobacco.
Fighting tobacco in Bangladesh will require a strong commitment to the World HealthOrganization’s MPOWER strategies. These includes continuing to Monitor tobacco use andprevention policies; Protecting people from secondhand smoke; Offering help to those whowant to quit; Warning about the dangers of tobacco; Enforcing bans on tobacco advertising,promotion, and sponsorship; and Raising taxes on tobacco products. To make MPOWER areality in Bangladesh means effectively taxing bidis and raising taxes on cigarettes, enactingand enforcing strong smoke-free laws, and preventing and countering the advertising tacticsof tobacco companies. These are proven strategies that can help avert unnecessary illnessand death.
Bangladesh has taken a crucial step in combating tobacco. I thank the Ministry of Healthand Family Welfare, National Institute of Preventive and Social Medicine, National Institute ofPopulation Research and Training, and the Bangladesh Bureau of Statistics for their leadershipin making the Global Adult Tobacco Survey a success. As one of only 14 countries to participatein the survey so far, Bangladesh has shown a vision for saving lives and improving health. Theglobal tobacco epidemic is predicted to kill 8 million people a year by 2030 and remains oneof the biggest health challenges our world faces.
The U.S. Centers for Disease Control and Prevention looks forward to ongoingcollaboration with you in our mutual mission to prevent the needless toll of tobacco in yourcountry and all countries of the world.
Thomas R. Frieden, M.D., M.P.H. Director, U.S. Centers for Disease Control and Prevention xv
Message

xvi

Preface - - - - - - - - - - - - - - - - - - - - - - - - - - - - - - - - - - - - - - - - - - - - - - - - - - - - - - - - - - - - - - - - - - - - - - - - - - - - - - - - - - - - - - - - - - - xix
Execu�ve summary - - - - - - - - - - - - - - - - - - - - - - - - - - - - - - - - - - - - - - - - - - - - - - - - - - - - - - - - - - - - - - - - - - - - - - - - - - - - - xx
1. Introduc�on - - - - - - - - - - - - - - - - - - - - - - - - - - - - - - - - - - - - - - - - - - - - - - - - - - - - - - - - - - - - - - - - - - - - - - - - - - - - - - - - - 1
1.1 Burden of tobacco in Bangladesh - - - - - - - - - - - - - - - - - - - - - - - - - - - - - - - - - - - - - - - - - - - - - - - - - - - - - - 2
1.2 Current tobacco control policies in Bangladesh - - - - - - - - - - - - - - - - - - - - - - - - - - - - - - - - - - - - - - 3
1.3 Survey Objec�ves - - - - - - - - - - - - - - - - - - - - - - - - - - - - - - - - - - - - - - - - - - - - - - - - - - - - - - - - - - - - - - - - - - - - - - - 4
2. Methodology - - - - - - - - - - - - - - - - - - - - - - - - - - - - - - - - - - - - - - - - - - - - - - - - - - - - - - - - - - - - - - - - - - - - - - - - - - - - - - - - - 5
2.1 Study popula�on - - - - - - - - - - - - - - - - - - - - - - - - - - - - - - - - - - - - - - - - - - - - - - - - - - - - - - - - - - - - - - - - - - - - - - - - 5
2.2 Sampling design - - - - - - - - - - - - - - - - - - - - - - - - - - - - - - - - - - - - - - - - - - - - - - - - - - - - - - - - - - - - - - - - - - - - - - - - - 5
2.3 Survey ques�onnaire - - - - - - - - - - - - - - - - - - - - - - - - - - - - - - - - - - - - - - - - - - - - - - - - - - - - - - - - - - - - - - - - - - - 6
2.4 Ques�onnaire programming and handhelds prepara�on - - - - - - - - - - - - - - - - - - - - - - - - - - - 7
2.5 Recruitment, training and fieldwork - - - - - - - - - - - - - - - - - - - - - - - - - - - - - - - - - - - - - - - - - - - - - - - - - - - 8
2.6 Data processing and aggrega�on - - - - - - - - - - - - - - - - - - - - - - - - - - - - - - - - - - - - - - - - - - - - - - - - - - - - - - 10
2.7 Sta�s�cal analysis - - - - - - - - - - - - - - - - - - - - - - - - - - - - - - - - - - - - - - - - - - - - - - - - - - - - - - - - - - - - - - - - - - - - - - - 10
3. Sample and popula�on characteris�cs - - - - - - - - - - - - - - - - - - - - - - - - - - - - - - - - - - - - - - - - - - - - - - - - - - - - 11
3.1 Coverage of the sample - - - - - - - - - - - - - - - - - - - - - - - - - - - - - - - - - - - - - - - - - - - - - - - - - - - - - - - - - - - - - - - - 11
3.2 Characteris�cs of survey respondents - - - - - - - - - - - - - - - - - - - - - - - - - - - - - - - - - - - - - - - - - - - - - - - - - 13
4. Tobacco use - - - - - - - - - - - - - - - - - - - - - - - - - - - - - - - - - - - - - - - - - - - - - - - - - - - - - - - - - - - - - - - - - - - - - - - - - - - - - - - - - - - 16
4.1 Prevalence of tobacco use - - - - - - - - - - - - - - - - - - - - - - - - - - - - - - - - - - - - - - - - - - - - - - - - - - - - - - - - - - - - - 16
4.2 Number of tobacco users - - - - - - - - - - - - - - - - - - - - - - - - - - - - - - - - - - - - - - - - - - - - - - - - - - - - - - - - - - - - - - - 21
4.3 Current smokers of various smoked tobacco products - - - - - - - - - - - - - - - - - - - - - - - - - - - - - - - 25
4.4 Current users of various smokeless tobacco products - - - - - - - - - - - - - - - - - - - - - - - - - - - - - - - 30
4.5 Tobacco use frequency - - - - - - - - - - - - - - - - - - - - - - - - - - - - - - - - - - - - - - - - - - - - - - - - - - - - - - - - - - - - - - - - - 41
4.6 Smoked and smokeless tobacco use per day - - - - - - - - - - - - - - - - - - - - - - - - - - - - - - - - - - - - - - - - - 53
4.7 Age at smoking ini�a�on - - - - - - - - - - - - - - - - - - - - - - - - - - - - - - - - - - - - - - - - - - - - - - - - - - - - - - - - - - - - - - - 65
4.8 Former daily smoking prevalence and quit ra�o - - - - - - - - - - - - - - - - - - - - - - - - - - - - - - - - - - - - - 66
4.9 Time since qui�ng smoking and smokeless tobacco - - - - - - - - - - - - - - - - - - - - - - - - - - - - - - - - 68
4.10 Type of current tobacco use - - - - - - - - - - - - - - - - - - - - - - - - - - - - - - - - - - - - - - - - - - - - - - - - - - - - - - - - - - 71
4.11 Time to first cigare�e of the day - - - - - - - - - - - - - - - - - - - - - - - - - - - - - - - - - - - - - - - - - - - - - - - - - - - - - 73
5. Cessa�on - - - - - - - - - - - - - - - - - - - - - - - - - - - - - - - - - - - - - - - - - - - - - - - - - - - - - - - - - - - - - - - - - - - - - - - - - - - - - - - - - - - - - - 75
5.1 Smoking cessa�on and health-care seeking behaviours - - - - - - - - - - - - - - - - - - - - - - - - - - - - - 75
5.2 Use of cessa�on method - - - - - - - - - - - - - - - - - - - - - - - - - - - - - - - - - - - - - - - - - - - - - - - - - - - - - - - - - - - - - - - 78
5.3 Interest in qui�ng smoking and smokeless tobacco - - - - - - - - - - - - - - - - - - - - - - - - - - - - - - - - - 80
xvii
GATS Bangladesh Report-2009
Table of Contents

6. Second-hand smoke - - - - - - - - - - - - - - - - - - - - - - - - - - - - - - - - - - - - - - - - - - - - - - - - - - - - - - - - - - - - - - - - - - - - - - - - - 89
6.1 SHS exposure in indoor workplaces - - - - - - - - - - - - - - - - - - - - - - - - - - - - - - - - - - - - - - - - - - - - - - - - - - - 89
6.2 SHS exposure in public places - - - - - - - - - - - - - - - - - - - - - - - - - - - - - - - - - - - - - - - - - - - - - - - - - - - - - - - - - - 92
7. Economics - - - - - - - - - - - - - - - - - - - - - - - - - - - - - - - - - - - - - - - - - - - - - - - - - - - - - - - - - - - - - - - - - - - - - - - - - - - - - - - - - - - - - 97
7.1 Brand of manufactured cigare�es in the last purchase - - - - - - - - - - - - - - - - - - - - - - - - - - - - - - 97
7.2 Brand of bidi in the last purchase - - - - - - - - - - - - - - - - - - - - - - - - - - - - - - - - - - - - - - - - - - - - - - - - - - - - - - 98
7.3 Source of last purchase of cigare�es and bidis - - - - - - - - - - - - - - - - - - - - - - - - - - - - - - - - - - - - - - -103
7.4 Expenditure on cigare�es and bidis - - - - - - - - - - - - - - - - - - - - - - - - - - - - - - - - - - - - - - - - - - - - - - - - - - -106
8. Media - - - - - - - - - - - - - - - - - - - - - - - - - - - - - - - - - - - - - - - - - - - - - - - - - - - - - - - - - - - - - - - - - - - - - - - - - - - - - - - - - - - - - - - - -108
8.1. An�-smoking informa�on in various places - - - - - - - - - - - - - - - - - - - - - - - - - - - - - - - - - - - - - - - - - -108
8.2 No�cing of health warning label on cigare�e packages and thinkingabout qui�ng - - - - - - - - - - - - - - - - - - - - - - - - - - - - - - - - - - - - - - - - - - - - - - - - - - - - - - - - - - - - - - - - - - - - - - - - - - -114
8.3 Tobacco marke�ng in various public places - - - - - - - - - - - - - - - - - - - - - - - - - - - - - - - - - - - - - - - - - - -116
9. Knowledge, a�tudes and percep�ons - - - - - - - - - - - - - - - - - - - - - - - - - - - - - - - - - - - - - - - - - - - - - - - - - - - - -137
9.1 Beliefs about health effects of tobacco use - - - - - - - - - - - - - - - - - - - - - - - - - - - - - - - - - - - - - - - - - - -137
9.2 Health effects of second-hand smoke - - - - - - - - - - - - - - - - - - - - - - - - - - - - - - - - - - - - - - - - - - - - - - - - -146
9.3 Opinion on increasing taxes on tobacco products - - - - - - - - - - - - - - - - - - - - - - - - - - - - - - - - - - - -148
10. Conclusion and policy implica�ons - - - - - - - - - - - - - - - - - - - - - - - - - - - - - - - - - - - - - - - - - - - - - - - - - - - - - - -149
10.1 Conclusion - - - - - - - - - - - - - - - - - - - - - - - - - - - - - - - - - - - - - - - - - - - - - - - - - - - - - - - - - - - - - - - - - - - - - - - - - - - - -149
10.2 Policy implica�ons - - - - - - - - - - - - - - - - - - - - - - - - - - - - - - - - - - - - - - - - - - - - - - - - - - - - - - - - - - - - - - - - - - - - -149
References - - - - - - - - - - - - - - - - - - - - - - - - - - - - - - - - - - - - - - - - - - - - - - - - - - - - - - - - - - - - - - - - - - - - - - - - - - - - - - - - - - - - - - -152
Appendix A: Es�mates of sampling errors - - - - - - - - - - - - - - - - - - - - - - - - - - - - - - - - - - - - - - - - - - - - - - - - - - - -155
Appendix B: Sample design - - - - - - - - - - - - - - - - - - - - - - - - - - - - - - - - - - - - - - - - - - - - - - - - - - - - - - - - - - - - - - - - - - - -169
Appendix C: Glossary of terms - - - - - - - - - - - - - - - - - - - - - - - - - - - - - - - - - - - - - - - - - - - - - - - - - - - - - - - - - - - - - - - - -276
Appendix D: Technical and survey staff - - - - - - - - - - - - - - - - - - - - - - - - - - - - - - - - - - - - - - - - - - - - - - - - - - - - - - -279
Appendix E: Ques�onnaire - - - - - - - - - - - - - - - - - - - - - - - - - - - - - - - - - - - - - - - - - - - - - - - - - - - - - - - - - - - - - - - - - - - - -183
Appendix F: MPOWER summary indicators - - - - - - - - - - - - - - - - - - - - - - - - - - - - - - - - - - - - - - - - - - - - - - - - - -228
xviii
GATS Bangladesh Report-2009

The Global Adult Tobacco Survey (GATS), Bangladesh is a nationally representative household surveyof men and women aged 15 years and above. It is designed to produce internationally comparabledata on tobacco use and tobacco control measures using a standardized questionnaire, sample design,data collection, aggregation and analysis procedures. In Bangladesh, the survey was implemented bythe National Institute of Preventive and Social Medicine (NIPSOM) with the collaboration of NationalInstitute of Population Research and Training (NIPORT) and the Bangladesh Bureau of Statistics (BBS).The Centers for Disease Control and Prevention (CDC), United States, and the World HealthOrganization provided technical assistance.
GATS Bangladesh used handheld machines for data collection and data transmission to gatherinformation from 400 sites from all over Bangladesh, and was Internet-based. This has contributedsubstantially to building the capacity of the country to conduct large-scale surveys using digitaltechnology. NIPSOM now has the capacity to undertake national-level surveys in the future.
I thank the Ministry of Health and Family Welfare for providing leadership in conducting thesurvey. The members of the steering and technical committees formed by the ministry gave valuableinput in all phases of the survey. I also thankfully acknowledge the guidance and cooperation providedby the DGHS during the survey. Experts from CDC, Research Triangle Institute International and WHOprovided excellent logistics and technical advice throughout the process. BBS provided the updatedmaps and lists of the selected 400 sites. NIPORT also contributed substantially to the training, as wellas monitoring of the fieldwork.
I would like to extend my gratitude and appreciation to the members of steering and technicalcommittees and institutions involved in GATS in Bangladesh for their valuable contributions to thesurvey. I also express my heartfelt thanks to the GATS research team of NIPSOM and other faculties fortheir sincere efforts in successful completion of the survey.
Professor Dr Sk. Akhtar Ahmad Director, NIPSOM
Principal Investigator GATS Bangladesh
xix
GATS Bangladesh Report-2009
Preface
The Global Adult Tobacco Survey (GATS) is a nationally representative household survey ofmen and women aged 15 years or above designed to produce internationally comparabledata on tobacco use and tobacco control measures using a standardized questionnaire, sampledesign, data collection and management procedures.
GATS was conducted by the National Institute of Preventive and Social Medicine incollaboration with the Bangladesh Bureau of Statistics and the National Institute of PopulationResearch and Training. Technical assistance was provided by the World Health Organizationand the U.S. Centers for Disease Control and Prevention. Financial support for the survey wasprovided by the Bloomberg Philanthropies.
The 2009 Bangladesh survey used a three-stage stratified cluster sampling and wasdesigned to produce key indicators for the country as a whole stratified by genders and placesof residences classified by urban and rural. Data were collected from 200 urban and 200 ruralprimary sampling units (mauza in rural and mohalla in urban areas). One individual wasrandomly chosen from each selected household to participate in the survey. Among the11,200 selected households, a total of 10,751 households were screened and 9,629 individualswere successfully interviewed for an overall response rate of 93.6%.1 This study providesinformation on tobacco use, cessation, second-hand smoke, economics, media, knowledge,attitudes and perceptions.
Tobacco use: The survey found that 23.0% of adult aged 15 years or above currently smoketobacco in Bangladesh (for males 44.7% and for females 1.5%). The estimated number2 ofcurrent adult tobacco smokers is 21.9 million (21.2 million males and 0.7 million females). Thesmoking rate in rural areas is slightly higher (23.6%) than in urban areas (21.3%). Half of thesmokers use bidis, and the prevalence of bidi smoking in rural areas (13.5%) is higher than inurban areas (4.7%).
In Bangladesh, 27.2% (25.9 million) of the adult population currently use smokelesstobacco. Prevalence is similar in males (26.4%) and females (27.9%). Current smokelesstobacco use is more prevalent in rural areas (28.8%) compared to urban areas (22.5%).
Overall, current tobacco use (smoking or smokeless) among all adults is 43.3%(41.3 million). The proportion is higher in males (58.0%) than females (28.7%). Tobacco use ismore prevalent in rural areas (45.1%) than urban areas (38.1%), and among persons with noformal education (62.9%) and in the lowest quintiles of socioeconomic status (SES) (55.6%).
Among male current tobacco users, 54.6% smoked tobacco only, 23.0% used smokelesstobacco mainly and 22.4% used both smokeless and smoking tobacco. Among female currenttobacco users, 2.7% smoked tobacco only, 94.7% used smokeless tobacco products only and2.6% used both.
xx
GATS Bangladesh Report-2009
Executive summary
1 Calculated as household response rate × individual response rate/100.2 The population estimates are based on the provisional population totals of Bangladesh obtained through the Sample Vital
Registration System of the Bangladesh Bureau of Statistics (SVRS, 2008).

The average number of cigarettes and bidis smoked per day were five and seven sticks,respectively. The average number of times smokeless tobacco was used per day was eight. Theaverage age at initiation of daily smoking was 19 years (for males 18 years, for females 27 years).
Cessation: Nearly 70% of current smokers plan or are thinking about quiting. Almosthalf of smokers (47.3%) made an attempt to quit in the last 12 months. Among those whovisited a health-care facility, 56% were asked about their history of tobacco smoking and 52.9%were advised to quit smoking. Of those who attempted to quit during the past 12 months,14.9% used counseling and 14.5% used other methods, which includes traditional medicines.
Second-hand smoke (SHS): Among all adults, 45% were exposed to SHS in public places.Males (69.4%) were more exposed than females (20.8%). Restaurants (27.6%) and publictransportation (26.3%) were the most common places people were exposed to SHS. Amongall persons engaged in some occupation who work in indoor areas, 63% (11.5 million) wereexposed to SHS in indoor areas of the workplace, and among non-smokers, 75.7% (5.1 million)were exposed to SHS at these workplaces.
Economics: Over nine in 10 smokers purchased cigarettes and bidis from stores. Theaverage cigarette expenditure per month among cigarette smokers was 378 taka/month andamong bidi smokers it was 131 taka. It is estimated that in Bangladesh total expenditure oncigarettes is 1.0% of gross domestic product (GDP) and on bidis is 0.4% of GDP. The price of100 packs of manufactured cigarettes as a percentage of per capita GDP is 5% and the priceof 100 packs of bidis as a percentage of per capita GDP is 1%.
Media: Nearly half of the adult population (49.8%) noticed anti-smoking information,mostly on radio and television (40.5%). People in the highest SES (68.4%) were more exposedto anti-smoking information compared to the lowest SES (30.8%). Cigarette advertising,sponsorship or promotion was noticed by nearly half of the population (48.7%). Amongcurrent smokers, 51.6% noticed health warnings on cigarette packages; 74.4% of them thoughtabout quitting smoking because of those warnings.
Knowledge, attitudes and perceptions: Overall, 97.4% of adults believe that smokingcauses serious illnesses. However, their beliefs differ regarding the causation of variousdiseases. A vast majority (93.4%) believe that exposure to SHS causes serious illness in non-smokers. This is true for smokeless tobacco also (92.7%). Four in five people (81%), includingtobacco consumers, supported an increase in tobacco taxes.
Policy implications: GATS provides essential information on key indicators of tobaccocontrol by socio-demographic characteristics and creates an opportunity for policy-makersand the tobacco control community to adapt or modify targeted interventions. Overall,findings from GATS indicate that there is a positive environment for tobacco control. Based onthe findings, the specific recommendations are:
1. Public health policy and interventions including awareness programmes should coversmoking and smokeless tobacco products with equal emphasis.
xxi
GATS Bangladesh Report-2009

2. There is a need to build capacity to implement programmes among health-care providersand to expand cessation facilities in health-care settings as well as in communities.
3. There is a need to formulate a 100% smoke-free policy for all public places and workplacesand to follow through with effective implementation.
4. Given the nearly equal prevalence of smoking of cigarettes and bidis and smokelesstobacco products, and the large difference in taxes on these types of products, there is aneed to raise taxes on all types of tobacco products in a harmonized manner.
5. There is a need to amend the national tobacco control act to include smokeless tobaccoproducts.
6. Anti-smoking media messages and pictorial health warnings on all tobacco products needto be set for better impact.
7. Given the fact that most smokers (> 90%) purchased cigarettes and bidis from stores andnearly half of them noticed cigarette advertisements in stores, national Tobacco ControlAct needs to be amended to prohibit tobacco advertisements at the point of sale.
xxii
GATS Bangladesh Report-2009

Bangladesh, located in one of the largest deltas in the world, is in the northeastern part ofSouth Asia with a total area of 147,570 square kilometres. It is almost entirely surrounded byIndia, except for a short southeastern frontier with Myanmar and a southern coastline on theBay of Bengal. It lies between latitudes 20° 34’ and 26° 38’ north and longitudes 88° 01’ and92° 41’ east, and it has a tropical climate. Bangladesh is the most densely populated countryin the world, excluding city-states such as Singapore. The country has a population of about144.5 million, with a population density of 979 persons per square kilometre.1 One-third of thepopulation is under 15 years of age, 63% are aged 15-64 years, and 4% are aged 65 or older.
Bangladesh is rich in cultural heritage. Social custom are an integral part of Bangla cultureand tobacco use is one of the accepted social norms in the country. Recently the country hasbeen experiencing health and economic transition, and has a double burden of communicableand noncommunicable diseases. Tobacco is the major risk factor for noncommunicablediseases.
Tobacco use is a major preventable cause of premature death and disease worldwide.Currently, more than 5 million people die globally each year due to tobacco related illness, afigure expected to increase to 8.3 million by 2030.2 Tobacco-attributable deaths are projectedto decline by 9% between 2002 and 2030 in high-income countries, but to double from 3.4million to 6.8 million in low- and middle income countries.3
The World Health Organization (WHO) aims to reduce the global burden of disease anddeath caused by tobacco, thereby protecting present and future generations from thedevastating health, social, environmental and economic consequences of tobaccoconsumption and exposure to tobacco smoke. WHO provides global policy leadership,promoting the WHO Framework Convention on Tobacco Control (FCTC)4 and the MPOWERpolicies packages5 as a key entry point to the FCTC. The FCTC encourages countries to adhereto its principles, and supports them in their efforts to implement tobacco control measuresthrough MPOWER.
Since 1999, WHO and the U.S. Centers for Disease Control and Prevention (CDC), alongwith their partners, have worked together to implement the Global Tobacco SurveillanceSystem (GTSS).6 GTSS enhances the capacity of countries to design, implement and evaluatea country’s national comprehensive tobacco plan while monitoring key articles of the FCTC.The GTSS includes the collection of data through four surveys: the Global Youth TobaccoSurvey (GYTS), the Global School Personnel Survey (GSPS), the Global Health ProfessionsStudents Survey (GHPSS) and Global Adult Tobacco Survey (GATS). Bangladesh has beenimplementing surveys under GTSS since 2004 regularly at periodical intervals.
GATS was implemented initially in 14 countries where more than half of the world’ssmokers live and that bear the highest burden of tobacco use including Bangladesh. The othercountries in this initiative are Brazil, China, Egypt, India, Mexico, Philippines, Poland, RussianFederation, Thailand, Turkey, Ukraine, Uruguay and Vietnam.
GATS is a household survey of people 15 years or above using standard protocol in sampledesign, questionnaire, field implementation, data collection, aggregation and analysis. Thepurpose of GATS was to systematically monitor adult tobacco use (smoking and smokeless)
1
GATS Bangladesh Report-2009
1. Introduction

and track key tobacco control interventions. Results from the GATS assist countries in theformulation, tracking and implementation of effective tobacco control interventions.
1.1 Burden of tobacco in Bangladesh
1.1.1 Prevalence of smoked and smokeless tobacco use
Traditionally, Bangladeshi men smoke cigarettes and bidi, and chew tobacco leaf such as zarda,sada pata, gul, khoinee. However, women usually do not smoke but chew tobacco leaf.
The Bangladesh Health and Demographic Survey 1997 revealed that among therespondents aged 10 years or more 41.1% of males and 4% of females smoked cigarettes orother forms of smoking tobacco such as bidi or hukkah.7 This survey also reported thatrespondents having no education and a lower standard of living had higher smoking rateswhile an inverse relationship was noted between monthly household income and smokinghabits. However this survey did not report the use of smokeless tobacco.
A large-scale nationwide study on the impact of tobacco- related illnesses in Bangladeshconducted by WHO in 2004 found that 41% of male and 1.8% of female adult (15+ years)smoke daily while 14.8% of male and 24.4% of female adults (15+ years) use smokelesstobacco daily.8 Overall, 37% of males and females use tobacco in some form.8
The Global Health Professional Survey done in Bangladesh in 2006 found that 22.2% ofthird-year dental students currently smoke cigarettes (males 46.7%, females 3.3%).9 This surveywas done among specific young professional students in the age group of 23 to 25 years. TheGlobal Youth Tobacco Survey 2007 (GYTS) in Bangladesh has shown that 9.3% of schoolstudents aged 13-15 years were ever smokers of cigarettes (boys 15.8% and girls 4.8%).10
The Bangladesh Urban Health Survey done in 2006 reported the distribution of currentsmoking status among urban male respondents by four categories of tobacco consumption:cigarette smoker, bidi smoker, bidi and cigarette smoker, and nonsmoker. Higher prevalenceof smoking of cigarettes or bidi was found among men in slums (59.6%) followed by districtmunicipalities (50.6%). Lower prevalence was found in non-slums (46%).11 The Demographicand Health survey 2007 reported tobacco smoking rates in those men who were ever marriedaged 15-64 years. About 60% were smokers and 21.4% used other forms of tobacco. Largedifferences were noted in smoking rates among the divisions of the country.12
A multi-site cross-sectional study on chronic noncommunicable diseases risk factors bythe Health and Demographic Surveillance System of the INDEPTH network in 2005 reportedtobacco use in four rural sites of Bangladesh. This study followed WHO STEPS methodology,and both smoking and nonsmoking tobacco use among adults aged 25 to 64 were reported.Tobacco smoking ranged from 42.6% to 62.0% in men while in women the smoking prevalenceranged from 0.3% to 2.7%. Smokeless tobacco use in men ranged from 15.1% to 31.7% andin women 29.6% to 37.7%.13
1.1.2 Economic impact of tobacco use
The cost of tobacco-related illnesses in Bangladesh attributable to tobacco usage wasestimated at 50.9 billion taka, including 5.8 billion taka for illnesses resulting from second-hand smoke exposure in 2004. On the other hand, the total annual product of the tobaccosector was estimated at 24.8 billion taka from tax revenue and wages. The cost of tobacco
2
GATS Bangladesh Report-2009

usage to the country thus exceeded its gain by 26.1 billion taka in 2004 (equivalent to US$442 million). It is estimated that on average a tobacco user spends about 4.5% of the monthlyexpenditure for tobacco consumption.8
1.1.3 Health impact of tobacco use
Bangladesh is overburdened with tobacco-related illnesses; 57,000 people died in 2004 dueto tobacco-related diseases.8 In one survey by WHO, 9% of the participants examined athouseholds had at least one of eight selected tobacco-related diseases (ischemic heartdisease, lung cancer, stroke, oral cancer, cancer of the larynx, chronic obstructive pulmonarydisease, pulmonary tuberculosis or Buerger’s disease). Also, 41% of these were attributableto tobacco. Hospital data indicated that 29% of inpatients aged 30 years or above werehospitalized due to these diseases. It was also estimated that they were responsible for 16%of all deaths in the country and 9% of them were attributable to tobacco. 8
1.2 Current tobacco control policies in Bangladesh
The history of tobacco control in Bangladesh dates back to 1890 when The Railways Act of1890 identified smoking in any compartment of a train without taking permission of the otherpassengers as an offence punishable by a fine. The Juvenile Smoking Act of 1919 bannedselling of any tobacco product to minor (under the age of 16 years). Several metropolitanpolice ordinances of the 1980s and 1990s imposed fines for smoking in public buildings orignoring the no-smoking signs posted by the authority of the buildings.14
The government of Bangladesh has taken several initiatives to reduce tobacco use.Bangladesh is one of the first signatory countries of WHO FCTC. Bangladesh signed on 16 June2003 and ratified on 14 June 2004.15 In 2005, government passed a comprehensive tobaccocontrol law in line with FCTC and in 2006 passed rules to facilitate the enforcement of law.14
The National Strategic Plan of Action for Tobacco Control (2007-2010) is currently beingimplemented.16 The National Tobacco Control Cell (NTCC) has been established with thetechnical assistance of WHO, which has become the hub of national coordination of tobaccocontrol activities and a referral and support centre for all tobacco control stakeholders,including NGOs, in Bangladesh.
The MPOWER package is a series of six proven policies aimed at reversing the globaltobacco epidemic: Monitor tobacco use and prevention policies; Protect people from tobaccosmoke; Offer help to quit tobacco use; Warn about the dangers of tobacco; Enforce bans ontobacco advertising, promotion, and sponsorship; and Raise taxes on tobacco.5 Bangladeshlaunched the package in December 2008 and the tobacco control programme is implementingthe policy.
Monitor tobacco use and prevention policies: Although various surveys have reportedtobacco use in different years, there were differences in target population, method of sampleselection and the questionnaire use. Therefore, it is difficult to have valid estimates of trendsin tobacco use from those surveys. Moreover, only few surveys were done on adult tobaccoconsumption at population level.
Protect people from tobacco smoke: According to the Smoking and Using of TobaccoProducts (Control) Act, 2005, to protect people from the hazard of tobacco smoke thegovernment of Bangladesh declared health-care and educational facilities 100 % smoke-free:
3
GATS Bangladesh Report-2009

however, there is a partial ban on smoking in universities, government facilities, indoor offices,restaurants, pubs and bars.
Offer help to quit tobacco use: Bangladesh has community cessation services in somecommunities and there are a few private tobacco cessation centres. Nicotine ReplacementTherapy (NRT) and other pharmaco-therapeutic medications are not available in the country;however, some health settings have counseling facilities.
Warn about the dangers of tobacco: The current tobacco control act of the country madeit compulsory for industries to provide written health warning on cigarettes packets. Theattributes of the warnings are also clearly stated in the regulation. Health warnings on smokingtobacco products must cover 30% of the front and back surface, and six rotating warnings areto be used in six month rotation. Large tobacco industries producing cigarettes are conformingto the law for packet warning, but generally bidi makers are not. Smokeless tobacco productsis not covered by the law.
Enforce bans on tobacco advertising, promotion, and sponsorship: The BangladeshTobacco Control Act 2005 prohibits tobacco advertising, promotion and sponsorship innational TV and radio, local magazines/newspapers, billboards/outdoor advertising, freedistribution, non-tobacco products with tobacco brand names, or sponsored events.
Raise taxes on tobacco: Bangladesh’s taxation on tobacco is a supplementary duty andvalue-added tax (VAT). In the last budget the tax has been raised on cigarette and bidi.Smokeless tobacco products are also brought under the tax net.
Capacity building of the NGOs and government agencies is being done through theBloomberg Initiatives (BI). NGOs and government agencies are working in different fields oftobacco control with grants from BI. One NGO has obtained a grant from BI for a projectaiming to understand religious leaders’ attitudes to smoking and smoke-free polices and toestablish coalition of religious organizations, providing training and capacity building forleaders. Under a BI grant, a consortium of NGOs running a project to strengthen packagingand labeling laws by instituting pictorials warnings, strengthening existing warnings andaddressing enforcement mechanisms, as well as to mobilize civil society, media, NGOs andother stakeholders in the drive to modify existing tobacco control legislation. Projects alsohas been undertaken to advocate for more effective tobacco tax policies, FCTCimplementation, updating of current law and support for tobacco farmers to switch to foodcrops under a Bloomberg Initiative grant.
1.3 Survey objectives
The general objectives of GATS are:
• To systematically monitor adult tobacco use for both smoking and smokeless productsand track key tobacco control indicators in Bangladesh
• To track implementation of FCTC-recommended policies outlined in the MPOWERpackage
More specifically, the objectives of the survey are to provide up-to-date information onadult tobacco use for both smoked and smokeless tobacco products, and on key tobaccocontrol measures. The survey also provides an opportunity to compare population estimatesat national level, as well as the urban, rural and gender proportions, across countriesimplanting GATS.4
GATS Bangladesh Report-2009

GATS is the global standard for systematically monitoring adult tobacco use (smoking andsmokeless) and for tracking key tobacco control indicators. GATS is a nationally representativesurvey, using a consistent and standard protocol across countries. The data will assist countriesto track WHO FCTC implementation and policy components of the WHO MPOWER package.
2.1 Study population
The target population for this survey includes all men and women in Bangladesh of age 15years and older. This target population includes all people who consider Bangladesh to betheir primary place of residence. This definition includes those individuals residing inBangladesh even though they may not be considered a citizen of the country. The only adultsage 15 years old and older excluded from the study were those individual visiting Bangladesh(e.g. tourists), who indicate their primary place of residence as a military base or groupquarters (e.g. a dormitory) or who were institutionalized—including people residing inhospitals, prisons, nursing homes and other such institutions. In addition, the eligiblerespondents could withdraw from the study at any time. They also had a right to refuse toanswer any question without providing the reason for their decisions. Ethical clearance forconduction of the survey in Bangladesh was obtained form Bangladesh Medical ResearchCouncil (BMRC)
2.2 Sampling design
The sampling frame used for GATS Bangladesh design (see appendix B for details) was thepopulation census of the People’s Republic of Bangladesh conducted by Bangladesh Bureauof Statistic (BBS) in 2001. The survey was based on a three-stage stratified cluster sample ofhouseholds. At the first stage 400 Primary Sampling Units (PSU)s (Mauza in rural and Mohallain urban areas) were selected with probability proportional to size (PPS), followed by a randomselection of one Secondary Sampling Unit (SSU) per selected PSU. At the third stage householdswere selected systematically within the listed households from a selected SSU. SSUs were basedupon Enumeration Areas (EA) from the Bangladesh Agricultural Census conducted in 2008.These selected EAs were updated with mapping and listing. Typically these EAs consisted of 200household units in Mauzas and 300 household units in each Mohalla. The explicit stratificationused at the first stage of selection based upon urban (Mahalla) and rural (Mauza) designationof BBS. Each list of rural and urban geopolitical units was implicitly stratified by division, andwithin division by the percent literacy of women in each Mahalla and Mauza.
Following the standard protocol of GATS 17, the initial target was a representative sample of8000 non-institutionalized households subject to the applicable non-response and eligibilityrates (a target sample of 2000 households each in urban, rural, male and female subgroups).Sample design for Bangladesh consists of 400 PSUs, 200 in urban areas and 200 in rural areas.After accounting for possible nonresponse and eligibility rates, it was determined to have anaverage of 28 households (later randomized to produce equal male and female householdsbased on design specifications) per selected SSU resulting in a total sample size of 11200 non-institutionalized households from all 6 administrative divisions covering 95.5% of the totalpopulation. As per design, one respondent was randomly selected for the interview from each
5
GATS Bangladesh Report-2009
2. Methodology

selected eligible household to participate in the survey. The Bangladesh sample design providescross-sectional estimates for the country as a whole as well as by urban, rural and gender.
2.3 Survey questionnaire
GATS Bangladesh collected information on a variety of indicators that will assist monitoringtobacco use prevalence and aid policy-makers and programme managers to track and formulatetobacco control strategies. GATS in Bangladesh used two types of questionnaire: the householdquestionnaire, and the individual questionnaire for all the adults age 15 and older. Thehousehold and individual questionnaires (see appendix E for details) were based on GATS corequestionnaire and optional questions,18 which was designed for use in countries implementingGATS. In consultation with the NIPSOM, NIPORT, BBS, WHO Bangladesh and the technicalcommittee under Ministry of Health and Family Welfare (MOHFW), these questionnaires wereadapted and modified to reflect the relevant issues applicable for the country situation. Theadaptations took place during a technical mission in consultation with Centers for DiseaseControl and Prevention (CDC), Atlanta and WHO South East Asia Regional Office (WHO- SEARO)in December 2007 in Dhaka, Bangladesh. The adapted questionnaire was approved by an in-country technical committee and questionnaire review committee. The questionnaire wasdeveloped in English and later translated into Bangla. The questionnaire was also backtranslated to check the quality of translations. The questionnaire was finalized in January 2009after incorporating the changes suggested from the pretest experience. Informed consent wasused for both household and individual questionnaires (separately).
Household questionnaire: The household questionnaire collected information on all usualresidents in the sampled household to identify eligible persons from the household (eithermale or female based on sampling strategy) and collect their basic information to select arandom eligible respondent for the individual questionnaire. For all listed household members,basic information on age and sex were collected. The questionnaire also collected informationon current use of smoked and smokeless tobacco. The information on age was used to identifyan eligible random respondent for the individual questionnaire.
Individual questionnaire: Individual questionnaire collected information from eligible selectedmale or female aged 15 years and older. The individual questionnaire consists of the eightsections:
a. Background characteristics: Questions on sex, age, education, occupations, and possessionof household items and material used for roof of the house.
b. Tobacco smoking: Questions cover patterns of use (daily consumption, less than dailyconsumption, not at all), former/past tobacco consumption, age of initiation of daily smoking,consumption of different tobacco products (cigarettes, bidi, hukkah, pipes, cigars and othersmoked tobacco), nicotine dependence and frequency of attempts to quit.
c. Smokeless tobacco: Questions cover patterns of use (daily consumption, less than dailyconsumption, not at all), former/past use of smokeless tobacco, age of initiation of daily useof smokeless tobacco, consumption of different smokeless tobacco products (zarda, sadapata, gul, nosshi, khoinee and other smokeless chewing tobacco products etc.), nicotinedependence, frequency of attempts to quit.
6
GATS Bangladesh Report-2009

d. Cessation: Questions related to advice to quit smoking by health-care providers, methodsused to try stop smoking. Similar information was solicited for cessation on smokeless tobaccoas well.
e. Secondhand smoke: Questions were on smoking allowed in the home, exposure tosecondhand smoke at home, indoor smoking policy at the work place, exposure in the last 30days in the work place, government buildings/offices, health-care facilities, restaurants, andpublic transportation. There were some additional optional items on exposure that includeduniversities, private workplaces, etc. as well as knowledge about serious illness in non-smokersdue to secondhand smoke.
f. Economics: Questions cover type of tobacco product and quantity bought, cost of tobaccoproduct(s), brand, type and source of last tobacco products purchased.
g. Media: Questions on exposure to advertising: television, radio, billboards, posters,newspapers/magazines, cinema, internet, public transportation, public walls, others; exposureto sporting events related to tobacco; exposure to music, theatre, art or fashion eventsconnected with tobacco; exposure to tobacco promotion activities; reaction to health warninglabels on cigarette packages; exposure to anti-tobacco advertising and information. Similarquestions were included for smokeless tobacco as well. The reference period for the questionsin this section was previous 30 days.
h. Knowledge, attitudes and perceptions: Questions regarding knowledge about health effectsof both smoking and smokeless tobacco.
2.4 Questionnaire programming and handhelds preparation
GATS was the first survey ever conducted in Bangladesh that used electronic means of datacollection to collect the information for both household and individual questionnaires in publicsector. For this purpose, the General Survey System (GSS),19 was used; this is a suite of softwaretools developed to facilitate the administration, collection, and management of survey dataon handheld computers, specifically a Microsoft Windows-based platform running WindowsMobile 5.0 or Mobile 6.0, often called Pocket PC systems. The software system is designed tosupport field data collection activities where field interviewers collect data using handheldcomputers. (Refer to the manuals on General Survey System19 and Data Management andImplementation Plan20 for more details). The electronic data collection was useful to facilitatethe complex skip pattern used in the GATS Bangladesh questionnaire, as well as some in-builtvalidity checks on questions during the data collection.
Programming was supported mainly by Research Triangle Institute International (RTI) andWHO. The programming of the questionnaire using GSS was carried out in collaboration within-country IT personnel involved in GATS Bangladesh. A repeated quality control mechanismwas used to test the quality of questionnaire programming. The main steps involved in qualitycontrol checks were: version checking for household and individual questionnaires, checkingdate and time, skipping patterns, bug/error finding particularly in the Bangla version of thequestionnaire and validation checks. The entire process including questionnaire, datacollection using handheld machines and data aggregation to prepare a raw data for analysiswas pretested.
7
GATS Bangladesh Report-2009
Handheld programming was finalized and the final questionnaire for data collection wasuploaded to handhelds by in-country IT Personnel and WHO IT Personnel. The case file, usedfor identifying the selected household addresses, containing the electronic information wasalso uploaded to the handhelds immediately after completion of mapping and listing activities.(Refer to GATS Quality Assurance Manual 21 for more details on the case file and a completelisting of quality control measures adopted in GATS).
2.5 Recruitment, training and fieldwork
2.5.1 Implementing agencies
The Ministry of Health and Family Welfare (MoHFW) is the national coordinating agency forGATS in Bangladesh. MoHFW has designated the National Institute of Preventive and SocialMedicine (NIPSOM) as the main implementing agency responsible for the entire process of theGATS implementation. The Bangladesh Buearu of Statistics (BBS) is responsible for sampling,mapping and listing of households. BBS provided support in training and data collection also.The National Institute for Population Research and Training (NIPORT) was responsible forindependent quality control on data collection.
WHO provided regional and in-country coordination. WHO and CDC (a WHO CollaboratingCenter on Global Tobacco Surveillance) jointly provided technical assistance for theimplementation of the survey. Financial assistance was provided by Bloomberg Philanthropiesunder the Bloomberg Global Initiative to Reduce Tobacco Use through the CDC Foundation.
MoHFW has also established an in-country technical committee. This committee consistsof national experts and senior representatives from MoHFW, NIPSOM, NIPORT, BBS,Bangabandhu Sheikh Mujib Medical University (BSMMU) and Jahangirnagar University tomonitor and provide technical guidance related to implementation of the survey. (SeeAppendix D for details on the technical committee and personnel involved in surveyimplementation.
2.5.2 Pretest
NIPSOM conducted the pretest to test the questionnaire especially in terms of wording andcomprehensibility, inconsistencies in skip patterns, sequencing of questions, completeness ofresponse categories, workload, interview time, availability and call backs and any other issues.Another important objective of the pretest was to test the programmed questionnaire forhandheld data collection and assess problems in the process of data transfer and aggregation.Pretest training took place in July 2008 with the last two days spent to train the supervisorsto perform their tasks. Twelve people were trained during the training programme, of whomthree were selected to perform tasks of a supervisor and nine interviewers conducted theactual field work during the pretest. Training was conducted based on standard GATS manualsand procedures including class presentation, mock interviews, field practices and tests. Pretestfieldwork lasted for four days. Fieldwork was conducted for a purposive sample of 144households equally distributed between sex, urban/rural and smoking status. Goodrepresentation was also ensured of individuals of different age groups.
8
GATS Bangladesh Report-2009

2.5.3 Training
In order to maintain uniform survey procedures and follow standard protocols established inGATS, three manuals were developed. The field interviewer manual22 consists of instructionsfor interviewers regarding interviewing techniques, field procedures, methods of askingquestions and most important, the use of handheld devices for data collection. The fieldsupervisor manual23 contains a detailed description of roles and responsibilities of thesupervisor. It also contains the information on data aggregation and transfer procedures forsupervisors. The question-by-question specifications manual24 provides question-by-questioninstructions to the field interviewers for administering the GATS household and individualquestionnaires using the handheld computer administration. This also contains informationon range checks, response options, and the purpose and instructions on each questionincluded in the survey. All the manuals were first developed in English and translated to Banglafor the training. A total of 72 interviewers and 18 supervisors were trained in two phases. Thefirst phase of training took place over five days in February 2009 and the second phase oftraining took place over another five days in June 2009. A refresher training course was offeredto all the interviewing teams including supervisors in July 2009, just before the start offieldwork. Training included lectures on understanding the contents of the questionnaire, howto complete the questionnaires using handheld devices, mock interviews between participantsand field practice interviews. Special lectures were arranged on tobacco use and the tobaccocontrol situation in Bangladesh. A three-day training programme was also arranged forresearch officers (RO), coordinators and senior research staff from various partnerorganizations on monitoring and quality control of fieldwork.
2.5.4 Mapping and listing
Maps of selected PSUs from the Agricultural Census of 2008 were obtained from thedepartment of cartography of BBS. The BBS personnel worked at field level and inheadquarters (400 enumerators supervised by 23 Regional Statistical Officers at the locallevel and monitored by nine senior officers and one coordinator placed at BBS headquarters)to collect the relevant information and update the maps of the selected SSUs. The listingoperation was conducted in June 2009 and provided the frame for household sample selectionand case file preparation. A GATS manual on mapping and listing25 designed for householdlisting teams containing standard procedures for adopting household listing was thoroughlyfollowed to maintain the highest quality of mapping and listing operations. A two-day trainingfor mapping and listing were arranged by BBS; the training was conducted by the trainedresource persons to ensure the quality of mapping and listing procedures at the divisionallevel by BBS with assistance of NIPSOM and NIPORT in June 2009.
2.5.5 Fieldwork
The GATS data was collected by 18 interviewing teams. Each team consists of one fieldsupervisor, two female and two male interviewers. There were two IT personnel to assist thedata collection. All the interviewers and supervisors were specially hired, taking into accounttheir educational background, experience, computer skills and other relevant qualifications.There were a total of 72 interviewers hired for the data collection. Equal numbers of males (36)and females (36) were recruited to ensure the cultural sensitivity and quality of reporting byensuring female respondents were interviewed by female interviewers and male respondents
9
GATS Bangladesh Report-2009
were interviewed by male interviewers. Field operations took place over a period of sevenweeks from 16 July 2009 to 31 August 2009.
Field interviewers were responsible for collecting information on questionnaires usinghandheld devices. Field supervisors were responsible for the overall operation of the fieldteam. In addition, the field supervisors conducted spot checks to verify information collectedby interviewers and also to ensure the accuracy of household identification in the field. Fieldsupervisors were also responsible for aggregating the interviewer-level data to their laptopsand forwarding the information through Email to the central office through a secured systemto a file transfer protocol (FTP) server for data processing at the national level, IT personnelwere responsible for providing technical support with respect to the concerns raised duringfieldwork and trouble-shooting any issues with the handheld devices.
NIPSOM appointed four research officers (RO) to help with monitoring throughout thetraining and fieldwork in order to ensure that correct and standard survey procedures werefollowed and data quality was maintained. Survey investigators and other senior facultymembers of NIPSOM and staff from partner organizations (NIPORT, BBS and WHO Bangladesh)also visited the field to monitor the data collection in order to ensure that standard qualitycontrol procedures were followed. Field-level data were quickly aggregated every two daysand analysed using microcomputers to identify certain types of data collection errors and skippatterns and to run consistency checks. Field-level feedback forms were analysed andfeedback given to interviewers and supervisors so that their performance could be improved.
2.6 Data processing and aggregation
The aggregated data from the interviewers were sent to the FTP server by all field supervisorson a daily basis using Secured Digital (SD) cards specially designed with specific secure dataprotocols for GATS fieldwork data collection. In-county IT personnel aggregated the data thatthey had received from all supervisors on every alternate day and gave feedback to the fieldstaff if problems observed. Refer to the Data Management Implementation Plan26 for moredetailed information on data aggregation and transfer procedures. Research officers cleanedthe data files on a regular basis. IT personnel, with support from CDC, WHO and RTI mergedand aggregated all the files to a single SDF file. Then, using an aggregation module in GSSsoftware and a statistical software SPSS version 17.0, the aggregated data was transposed toan analysable raw data format that can be read by statistical software for further analysis andreporting.
2.7 Statistical analysis
Complex survey data analysis was performed to obtain population estimates and their 95% ofconfidence intervals. The sample weights were developed for each respondent following thestandard procedures establishes in GATS sample design17 and sample weights27 manuals forGATS data. The details of the sample weighting process are described in Appendix B. The finalweights were used in all analyses to produce estimates of population parameters and theirconfidence intervals. All weighting computations were carried out using Statistical softwareSAS version 9.2 and all computations of estimates and their confidence intervals wereperformed using the SPSS 17 complex samples module.
10
GATS Bangladesh Report-2009

This chapter presents information on sample coverage and characteristics of the population.The population estimates are based on the provisional population totals of Bangladeshobtained through the Sample Vital Registration System (SVRS, 2008)28 by BBS in order topresent a true value of population characteristics at any given time.
3.1 Coverage of the sample
Table 3.1 shows the unweighted number and percentage of households and individualsinterviewed and response rates by place of residence in GATS Bangladesh. Of the 11,200households selected for the survey, 10,751 (96.0%) households and 9,629 (86.0%) selectedeligible individuals successfully completed the interview. The total response rate of the surveywas 93.6%. The response rates were found to be nearly equal in both urban and rural areas(93.4% and 93.9%, respectively). The household response rate was 97.7%. There are nodifferences with respect to urban and rural household response rate. However, 1.7%households were found unoccupied, with a similar proportion in both urban and rural areas.In 0.7% of cases nobody was home and 0.4% of households had no screening respondent atthe time of the interview. Out of 11,200 selected households, 10,050 were found to have aneligible person for the individual interview. The number of eligible persons in urban areas(5,087) was slightly higher than rural areas (4,963). The individual-level response rate wasfound to be 95.9% with 95.5% in urban and 96.2% in rural areas. Overall, 10.3% of respondentswere found to be survey-ineligible. The percentages of ineligibility in urban and rural areaswere 9.2% and 11.4%, respectively. The principal reasons for the individual-level non-responsewere due to not being at home (1.7%), refusal (0.2%) and incapacitation (0.6%). Theproportion of not-at-homes was higher in urban areas (2.1%) compared to rural areas (1.3%)despite repeated visits to the household. Individual-level response rates (not shown in thetable) by gender varies slightly, with 93.8% for males and 97.6% for females.
11
GATS Bangladesh Report-2009
3. Sample and population characteristics

Table 3.1: Number and percent of households and individuals interviewed and response ratesby residence–GATS Bangladesh, 2009
12
GATS Bangladesh Report-2009
ResidenceTotal
Urban Rural
Number Percent Number Percent Number Percent
Selected household
Completed (HC) 5,376 96.0 5,375 96.0 10,751 96.0
Incomplete (HINC) 6 0.1 9 0.2 15 0.1
No screening respondent (HNS) 18 0.3 27 0.5 45 0.4
Nobody home (NHH) 48 0.9 29 0.5 77 0.7
Refused (HR) 15 0.3 1 0.0 16 0.1
Unoccupied (HUO) 95 1.7 93 1.7 188 1.7
Address not a dwelling (HAND) 6 0.1 1 0.0 7 0.1
Other (HO) 36 0.6 65 1.2 101 0.9
Total Households Selected 5,600 100 5,600 100 11,200 100
Household Response Rate (%) 1 97.8% 97.6% 97.7%
Selected individual
Completed (PC) 4,857 86.7 4,772 85.2 9,629 86.0
Incomplete (PINC) 33 0.6 34 0.6 67 0.6
Not eligible (PNE) 513 9.2 637 11.4 1,150 10.3
Not at home (PNAH) 116 2.1 73 1.3 189 1.7
Refused (PR) 16 0.3 2 0.0 18 0.2
Incapacitated (PI) 36 0.6 28 0.5 64 0.6
Other (PO) 29 0.5 54 1.0 83 0.7
Number of Eligible individuals 5,087 100 4,963 100 10,050 100
Individual-level Response Rate (%)2 95.5% 96.2% 95.8%
Total Response Rate (%) 3 93.3% 93.9% 93.6%
Note: 1. Notice that Household questionnaire incomplete [HINC] was not included in the numerator of the householdresponse rate. Therefore, a household screening questionnaire that is incomplete (i.e., the roster could not be finished) wasconsidered a non-respondent to the GATS.
2. Completed individual interview [PC] includes respondents who has completed at least question E1 and who providevalid answers to questions B1/B2/B3 and C1/C2/C3 (when applicable). Therefore, the respondents who did not met thiscriteria were considered as an eligible non-respondent to GATS and thus, incompletes [PINC], were not be included in thenumerator of the individual response rate.

3.2 Characteristics of survey respondents
Table 3.2 presents the unweighted sample size and population estimates by selecteddemographic and socioeconomic characteristics of the household population and surveyrespondents including age, sex, place of residence, and level of education, socioeconomic andoccupational status.
The unweighted sample count (complete responses) was 9,629. The estimated totalBangladesh de facto population aged 15 years and above was 95.4 million in 2008. Inclassifying sample distribution by sex, the survey enumerated a total of 4,468 males and 5,161females. These sample counts yield a de facto population estimate of 47.4 million males(49.7%) and 48.0 million females (50.3%). The number of unweighted samples in urban areaswas higher than in the rural areas (4,857 and 4,772 samples, respectively). However, theweighted population in the rural areas is higher than urban areas, with the ratio being 74:26.
Among the respondents, the overall mean (CI) age was 35.8 (35.4, 36.3) years, and formales and females the mean age were 36.4 (35.7, 37.2) years and 35.3 (34.7, 35.9) years,respectively. The mean (CI) of the age of urban and rural respondents were 34.9 (34.0, 35.7)years and 36.2 (35.6, 36.8) years respectively. A high proportion of adults were 25-44 years ofage (43.1%). The proportion was 29.5% in the 15-24 age group followed by 20.8% in the 45-64 year age group and 6.6% in the age group 65 years and above.
For all eligible respondents aged 15 years and older, data were collected on the highestlevel of education completed. For the purpose of this report, the question on educationallevel was grouped into five categories: no formal schooling, less than primary, primarycomplete, less than secondary and secondary school complete and above. Most of the samplehad no formal schooling (35.6%), followed by less than secondary education (21.6%). All othercategories were more or less equal in proportion.
The 2009 GATS individual questionnaire asked all the respondents on their main workstatus during the past 12 months. Various categories reported in the questionnaire weremerged to form seven exclusive occupation categories: employed (government and nongovernment salaried employee), business, farmer, labourer, student, homemaker andunemployed. This categorization was used throughout the report for depicting differentials invarious indicators. Table 3.2 presents these data on occupation. Overall, 6.4% of all adultswere employed, while 9.4% were engaged in business; 39.2% reported to be homemakers, ofwhom a majority were female. The proportion of adults who reported their occupation aslabourers was 20.2% whereas 11.6% were farmers and 7.9% were students. Only 5.3% of thetotal population was unemployed.
In this report, an index of household economic status was created and used as abackground characteristic with information on household ownership of assets.29 The economicstatus index used here was developed and tested in a large number of countries in relation toinequities in household income.30 It is an indicator of the level of wealth that is consistent withexpenditure and income measures.31
The wealth index was constructed using principal component analysis.32 Asset informationwas collected with the GATS questionnaire and covered information on household ownershipof a number of items, such as electricity, flush toilet, fixed telephone, cell telephone, television,
13
GATS Bangladesh Report-2009

radio, refrigerator, car, moped/scooter/motorcycle, washing machine, bicycle, sewingmachine, almirah/ wardrobe, table, bed or cot, chair or bench, watch or clock, as well as thetype of main material used for the roof of the main house (cement, tin and katcha such asbamboo/thatched/straw).
Each asset was assigned a weight (factor score) generated through principal componentsanalysis, and the resulting asset scores were standardized in relation to a normal distributionwith a mean of zero and standard deviation of one.33 Each household was then assigned ascore for each asset, and the scores were summed for each household; individuals wereranked according to the total score of the household in which they resided. The sample wasthen divided into quintiles from one (lowest) to five (highest). A single asset index wasdeveloped for the whole sample; indices were not prepared for urban and rural populationsseparately.
According to the index, the maximum respondents (23.2%) were from a lowsocioeconomic group, followed by high, middle, lowest and highest—22.6%, 20.4%, 18.8%and 15.0%, respectively.
14
GATS Bangladesh Report-2009
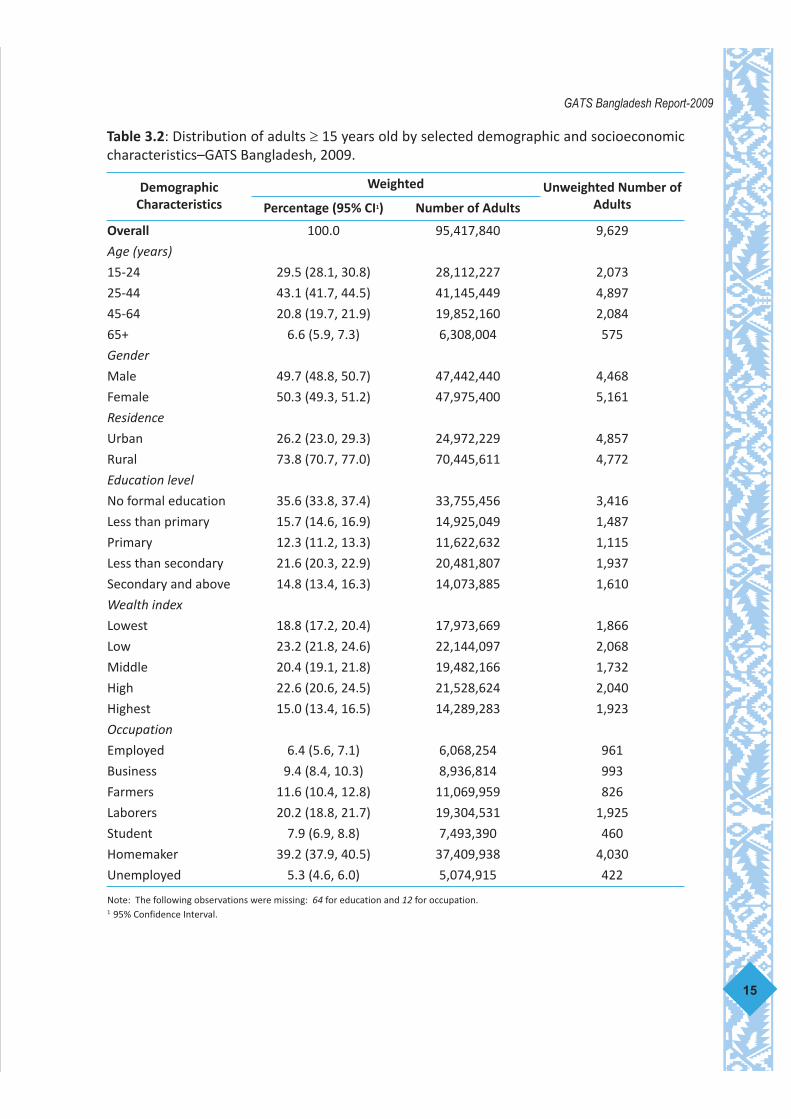
Table 3.2: Distribution of adults ≥ 15 years old by selected demographic and socioeconomiccharacteristics–GATS Bangladesh, 2009.
15
GATS Bangladesh Report-2009
DemographicCharacteristics
Weighted Unweighted Number ofAdultsPercentage (95% CI1) Number of Adults
Overall 100.0 95,417,840 9,629
Age (years)
15-24 29.5 (28.1, 30.8) 28,112,227 2,073
25-44 43.1 (41.7, 44.5) 41,145,449 4,897
45-64 20.8 (19.7, 21.9) 19,852,160 2,084
65+ 6.6 (5.9, 7.3) 6,308,004 575
Gender
Male 49.7 (48.8, 50.7) 47,442,440 4,468
Female 50.3 (49.3, 51.2) 47,975,400 5,161
Residence
Urban 26.2 (23.0, 29.3) 24,972,229 4,857
Rural 73.8 (70.7, 77.0) 70,445,611 4,772
Education level
No formal education 35.6 (33.8, 37.4) 33,755,456 3,416
Less than primary 15.7 (14.6, 16.9) 14,925,049 1,487
Primary 12.3 (11.2, 13.3) 11,622,632 1,115
Less than secondary 21.6 (20.3, 22.9) 20,481,807 1,937
Secondary and above 14.8 (13.4, 16.3) 14,073,885 1,610
Wealth index
Lowest 18.8 (17.2, 20.4) 17,973,669 1,866
Low 23.2 (21.8, 24.6) 22,144,097 2,068
Middle 20.4 (19.1, 21.8) 19,482,166 1,732
High 22.6 (20.6, 24.5) 21,528,624 2,040
Highest 15.0 (13.4, 16.5) 14,289,283 1,923
Occupation
Employed 6.4 (5.6, 7.1) 6,068,254 961
Business 9.4 (8.4, 10.3) 8,936,814 993
Farmers 11.6 (10.4, 12.8) 11,069,959 826
Laborers 20.2 (18.8, 21.7) 19,304,531 1,925
Student 7.9 (6.9, 8.8) 7,493,390 460
Homemaker 39.2 (37.9, 40.5) 37,409,938 4,030
Unemployed 5.3 (4.6, 6.0) 5,074,915 422
Note: The following observations were missing: 64 for education and 12 for occupation.1 95% Confidence Interval.
Tobacco use prevalence is one of the key indicators of tobacco control. Several studies 7-13 inBangladesh has provided information on tobacco use prevalence at national and sub-nationalpopulations but no comprehensive information is available to date on the use of varioustobacco products and its patterns and frequency of usage.
This chapter presents data on tobacco use and includes information on two kinds ofcommonly used tobacco products in Bangladesh i.e. smoking and smokeless tobacco products.Smoking tobacco products in Bangladesh include manufactured cigarettes, bidis, hand-rolledcigarettes, pipes, cigars, water-pipes or hukkah, and other smoked tobacco products.Smokeless tobacco products used include a wide range: betel quid with zarda, zarda only, orzarda with supari; betel quid with sada pata; pan masala with tobacco; sada pata chewing;gul; khoinee and other smokeless tobacco products.
Sections in this chapter covers topics such as smoking status, the number of smokingtobacco products used on daily and non daily basis, age of smoking initiation, time of quittingsmoking, and first desire to smoke of the day. Similar information on smokeless tobacco usealso presented in this chapter.
Key findings:• 23.0% (21.9 million) currently smoke tobacco, nearly half of them(10.1
million) do not have any formal education
• 27.2% (25.9 million) currently use smokeless tobacco products, over half ofthem (14.3 million) have no formal education
• 43.3% uses tobacco in any form
• Smoking and smokeless tobacco use is more in rural population ascompared to urban population
• Among male current tobacco users, 54.6% smoked tobacco only, 23.0%used smokeless tobacco mainly and 22.4% used both smokeless tobaccoand smoking tobacco
• Among female current tobacco users, 2.7% smoked tobacco only, 94.7%used smokeless tobacco products only and 2.6% used both.
4.1 Prevalence of tobacco use
4.1.1 Prevalence of smoking
In Table 4.1 the prevalence of smoking tobacco is presented by “current tobacco smoker” and“non-smoker”. Current tobacco smokers include “daily smokers” and “occasional smokers”while non-smokers include “former daily smokers” and “never daily smokers”. These tobaccouse categories were presented for male, female and total separately in urban, rural and overall
16
GATS Bangladesh Report-2009
4. Tobacco use
2 Overall, the smoked tobacco use among female was less and frequently these estimates by various demographic andsocioeconomic characteristics were based on less than 25 respondents. As per GATS standard reporting, these estimateswere shown in tables only and not reported in the description. However, smokeless tobacco use among Bangladeshifemales was more common and cell sizes for these tables are adequate for reporting.

population of adults aged 15 and older. The overall prevalence of current smokers was 23.0%.Smoking was reported more among males (44.7%) than females (1.5%)2. A similar pattern wasobserved in both urban (42.1% in males and 0.8% in females) and rural areas (45.6% in maleand 1.8% in females). Among current smokers, 20.9% were daily smokers and 2.1% wereoccasional smokers. The daily smoking pattern was almost similar in both urban and ruralareas. However, the daily smoking prevalence among males was higher compared to females(40.7% and 1.3% respectively). The occasional smoking prevalence among males was 4.0%and among females 0.2%. Non-smokers account for 77.0% of the overall adult population.Among them, only 4.7% are former daily smokers and 72.3% were never daily smokers. Forthose who were never daily smokers, the survey found that 71.0% have never smoked in theirlifetime and a small proportion (1.3%) of those never daily smokers was former occasionalsmokers. The proportion of never smokers among female was 97.3% compared to malepopulation with 44.5% of never smokers. The prevalence of male and female estimates isquite similar in urban and rural strata.
Table 4.1: Percentage of adults ≥15 years old, by detailed smoking status, residence andgender–GATS Bangladesh, 2009.
17
GATS Bangladesh Report-2009
Smoking Status Overall
Male Female Total
Percentage (95% CI)
Current tobacco smoker 44.7 (42.5, 47.0) 1.5 ( 1.1, 2.1) 23.0 (21.9, 24.2)
Daily smoker 40.7 (38.5, 42.9) 1.3 ( 0.9, 1.9) 20.9 (19.8, 22.0)
Occasional smoker 4.0 ( 3.3, 5.0) 0.2 ( 0.1, 0.4)* 2.1 ( 1.7, 2.6)
Occasional smoker, formerly daily 1.6 ( 1.2, 2.2) 0.0 ( 0.0, 0.2)* 0.8 ( 0.6, 1.1)
Occasional smoker, never daily 2.4 ( 1.9, 3.2) 0.1 ( 0.1, 0.3)* 1.3 ( 1.0, 1.7)
Non-smoker 55.3 (53.0, 57.5) 98.5 (97.9, 98.9) 77.0 (75.8, 78.1)
Former daily smoker 8.4 ( 7.3, 9.8) 1.0 ( 0.6, 1.5) 4.7 ( 4.1, 5.3)
Never daily smoker 46.8 (44.6, 49.1) 97.5 (96.6, 98.2) 72.3 (71.2, 73.5)
Former occasional smoker 2.4 ( 1.8, 3.2) 0.2 ( 0.1, 0.5)* 1.3 ( 1.0, 1.7)
Never smoker 44.5 (42.2, 46.8) 97.3 (96.4, 98.0) 71.0 (69.8, 72.2)
Note: Current use includes both daily and occasional (less than daily) use.* Estimate based on fewer than 25 unweighted cases.

Tabl
e 4.
1 (c
ont.
): P
erce
ntag
e of
adu
lts ≥
15 y
ears
old
, by
deta
iled
smok
ing
stat
us, r
esid
ence
, and
gen
der–
GAT
S Ba
ngla
desh
, 200
9.
18
GATS Bangladesh Report-2009
Smok
ing
Stat
us
Urb
anRu
ral
Mal
eFe
mal
eTo
tal
Mal
eFe
mal
eTo
tal
Perc
enta
ge (9
5% C
I)
Curr
ent t
obac
co s
mok
er42
.1(3
9.5,
44.
7)0.
8( 0
.5,
1.2)
21.3
(19.
8, 2
2.9)
45.6
(42.
8, 4
8.5)
1.8
( 1.2
, 2.
6)23
.6(2
2.2,
25.
1)
Dai
ly s
mok
er38
.0(3
5.4,
40.
7)0.
7( 0
.4,
1.1)
*19
.2(1
7.7,
20.
8)41
.6(3
8.8,
44.
5)1.
6( 1
.1,
2.3)
21.5
(20.
1, 2
2.9)
Occ
asio
nal s
mok
er4.
1( 3
.0,
5.5)
0.1
( 0.1
, 0.
4)*
2.1
( 1.6
, 2.
8)4.
0( 3
.1,
5.2)
0.2
( 0.1
, 0.
5)*
2.1
( 1.6
, 2.
7)
Occ
asio
nal s
mok
er, f
orm
erly
dai
ly1.
5( 0
.9,
2.4)
0.0
( 0.0
, 0.
3)*
0.8
( 0.5
, 1.
2)1.
6( 1
.1,
2.4)
0.1
( 0.0
, 0.
2)*
0.8
( 0.6
, 1.
2)
Occ
asio
nal s
mok
er, n
ever
dai
ly2.
6( 1
.7,
3.8)
0.1
( 0.0
, 0.
4)*
1.3
( 0.9
, 2.
0)2.
4( 1
.7,
3.4)
0.1
( 0.0
, 0.
5)*
1.3
( 0.9
, 1.
8)
Non
-sm
oker
57.9
(55.
3, 6
0.5)
99.2
(98.
8, 9
9.5)
78.7
(77.
1, 8
0.2)
54.4
(51.
5, 5
7.2)
98.2
(97.
4, 9
8.8)
76.4
(74.
9, 7
7.8)
Form
er d
aily
sm
oker
8.9
( 7.0
, 11.
4)0.
5( 0
.3,
1.0)
*4.
7( 3
.8,
5.8)
8.3
( 6.9
, 9.
9)1.
1( 0
.7,
1.9)
4.7
( 4.0
, 5.
5)
Nev
er d
aily
sm
oker
49.0
(45.
9, 5
2.0)
98.7
(98.
0, 9
9.1)
74.0
(72.
5, 7
5.5)
46.1
(43.
3, 4
8.9)
97.1
(95.
9, 9
8.0)
71.7
(70.
2, 7
3.2)
Form
er o
ccas
iona
l sm
oker
3.0
( 2.1
, 4.
3)0.
1( 0
.0,
0.3)
*1.
5( 1
.1,
2.2)
2.2
( 1.5
, 3.
2)0.
3( 0
.1,
0.7)
*1.
2( 0
.9,
1.7)
Nev
er s
mok
er46
.0(4
2.7,
49.
3)98
.6(9
7.9,
99.
0)72
.5(7
1.0,
74.
0)43
.9(4
1.1,
46.
9)96
.8(9
5.6,
97.
7)70
.5(6
9.0,
72.
0)
Not
e: C
urre
nt u
se in
clud
es b
oth
daily
and
occ
asio
nal (
less
than
dai
ly) u
se.
* Es
timat
e ba
sed
on fe
wer
than
25
unw
eigh
ted
case
s.

4.1.2 Prevalence of smokeless tobacco use
Table 4.1A presents the prevalence of smokeless tobacco use by gender and residence. Currentsmokeless tobacco use was 27.2%. The smokeless tobacco use prevalence in males andfemales was 26.4% and 27.9% respectively. The prevalence was higher in rural populationsthan in urban (28.8% against 22.5%); 23.7% of adults were daily users whereas 3.5% werenon-daily (occasional) users. Females (26.6%) used smokeless tobacco more than males(20.7%) on a daily basis. In the daily users category, rural females (28.5%) reported a higherprevalence as compared to their urban counterparts (21.3%), while rural males (22.5%) usedsmokeless tobacco more than urban males (18.5%). Males in both urban (5.8%) and rural(5.6%) areas reported a high prevalence of occasional smokeless tobacco use as compared totheir female counterparts (2.1% in urban and 1.1% in rural areas respectively). Overall, 72.8%were non-smokeless tobacco users, while male and female prevalence was nearly the same.Among them, only 1.4% were former daily users and 0.9% former occasional users. A highproportion of adults in urban areas (74.7%) had never used any smokeless tobacco in theirlifetime as compared to the adults in rural areas (69.1%).
Table 4.1A: Percentage of adults ≥15 years old, by detailed smokeless tobacco use status,residence, and gender–GATS Bangladesh, 2009.
19
GATS Bangladesh Report-2009
Smokeless tobacco use statusOverall
Male Female Total
Percentage (95% CI)
Current smokeless tobacco user 26.4 (24.2, 28.6) 27.9 (25.9, 30.0) 27.2 (25.5, 28.9)
Daily user 20.7 (18.7, 22.9) 26.6 (24.7, 28.6) 23.7 (22.1, 25.3)
Occasional user 5.6 ( 4.7, 6.7) 1.3 ( 1.0, 1.8) 3.5 ( 3.0, 4.0)
Occasional user, formerly daily 0.8 ( 0.5, 1.2) 0.1 ( 0.0, 0.2)* 0.4 ( 0.3, 0.7)
Occasional user, never daily 4.8 ( 4.0, 5.8) 1.2 ( 0.9, 1.7) 3.0 ( 2.6, 3.5)
Non-smokeless tobacco user 73.6 (71.4, 75.8) 72.1 (70.0, 74.1) 72.8 (71.1, 74.5)
Former daily user 1.8 ( 1.4, 2.5) 1.0 ( 0.7, 1.3) 1.4 ( 1.1, 1.8)
Never daily user 71.8 (69.5, 73.9) 71.1 (69.0, 73.1) 71.4 (69.7, 73.1)
Former occasional user 1.3 ( 0.8, 1.9) 0.5 ( 0.3, 0.8) 0.9 ( 0.6, 1.2)
Never user 70.5 (68.2, 72.7) 70.6 (68.5, 72.7) 70.6 (68.9, 72.2)
Note: Current use includes both daily and occasional (less than daily) use.* Estimate based on fewer than 25 unweighted cases.

20
GATS Bangladesh Report-2009Ta
ble
4.1A
(con
t.):
Perc
enta
ge o
f adu
lts ≥
15 y
ears
old
, by
deta
iled
smok
eles
s to
bacc
o us
e st
atus
, res
iden
ce, a
nd g
ende
r–G
ATS
Bang
lade
sh,
2009
.
Smok
eles
s To
bacc
o U
se S
tatu
s U
rban
Rura
l
Mal
eFe
mal
eTo
tal
Mal
eFe
mal
eTo
tal
Perc
enta
ge (9
5% C
I)
Curr
ent s
mok
eles
s to
bacc
o us
er21
.6(1
9.0,
24.
4)23
.4(2
0.6,
26.
4)22
.5(2
0.3,
24.
8)28
.1(2
5.3,
31.
0)29
.6(2
7.1,
32.
1)28
.8(2
6.8,
30.
9)
Dai
ly u
ser
15.8
(13.
4, 1
8.5)
21.3
(18.
8, 2
4.0)
18.6
(16.
5, 2
0.8)
22.5
(20.
0, 2
5.2)
28.5
(26.
1, 3
1.0)
25.5
(23.
6, 2
7.5)
Occ
asio
nal u
ser
5.8
( 4.4
, 7.
6)2.
1( 1
.4,
3.1)
3.9
( 3.2
, 4.
8)5.
6( 4
.5,
6.9)
1.1
( 0.7
, 1.
6)3.
3( 2
.7,
4.0)
Occ
asio
nal u
ser,
form
erly
dai
ly0.
7( 0
.4,
1.1)
*0.
2( 0
.1,
0.4)
*0.
4( 0
.3,
0.7)
0.8
( 0.5
, 1.
4)*
0.1
( 0.0
, 0.
3)*
0.4
( 0.3
, 0.
7)*
Occ
asio
nal u
ser,
neve
r da
ily5.
1( 3
.7,
7.0)
1.9
( 1.2
, 2.
9)3.
5( 2
.8,
4.4)
4.7
( 3.7
, 6.
0)1.
0( 0
.7,
1.5)
2.9
( 2.4
, 3.
5)
Non
-sm
okel
ess
toba
cco
user
78.4
(75.
6, 8
1.0)
76.6
(73.
6, 7
9.4)
77.5
(75.
2, 7
9.7)
71.9
(69.
0, 7
4.7)
70.4
(67.
9, 7
2.9)
71.2
(69.
1, 7
3.2)
Form
er d
aily
use
r2.
2( 1
.5,
3.1)
0.9
( 0.5
, 1.
5)1.
5( 1
.2,
2.0)
1.7
( 1.2
, 2.
6)1.
0( 0
.7,
1.5)
1.4
( 1.0
, 1.
8)
Nev
er d
aily
use
r76
.2(7
3.3,
78.
9)75
.8(7
2.7,
78.
6)76
.0(7
3.7,
78.
2)70
.2(6
7.3,
73.
0)69
.4(6
6.9,
71.
9)69
.8(6
7.7,
71.
9)
Form
er o
ccas
iona
l use
r2.
3( 1
.3,
4.0)
0.4
( 0.2
, 0.
8)*
1.3
( 0.8
, 2.
1)0.
9( 0
.5,
1.5)
*0.
5( 0
.3,
0.9)
*0.
7( 0
.5,
1.0)
Nev
er u
ser
73.9
(70.
6, 7
7.0)
75.4
(72.
2, 7
8.2)
74.7
(72.
4, 7
6.8)
69.3
(66.
4, 7
2.1)
68.9
(66.
3, 7
1.4)
69.1
(67.
0, 7
1.2)
Not
e: C
urre
nt u
se in
clud
es b
oth
daily
and
occ
asio
nal (
less
than
dai
ly) u
se.
* Es
timat
es b
ased
on
less
than
25
unw
eigh
ted
case
s

4.2 Number of tobacco users
4.2.1 Number of smoked tobacco users
Table 4.2 presents the population totals corresponding to the prevalence estimates onsmoking status in table 4.1 by gender and residence. The estimated number of current adulttobacco smokers was 21.9 million: 19.9 million smoked on a daily basis and 2 million on anon-daily (occasional) basis; 21.2 million were males and only 0.7 million were females; 16.6million smokers belonged to rural areas and 5.3 million to urban areas. The number of dailysmokers was 19.9 million (19.3 million were male and 0.6 million were female). The estimatednumber of non-smokers was 73.5 million among whom 4.4 million were former daily smokersand 69 million were never daily smokers.
21
GATS Bangladesh Report-2009

22
GATS Bangladesh Report-2009Ta
ble
4.2:
Num
ber
of a
dults
≥15
yea
rs o
ld, b
y de
taile
d sm
okin
g st
atus
, res
iden
ce, a
ndge
nder
–GAT
S Ba
ngla
desh
, 200
9.
Smok
ing
Stat
us
Ove
rall
Urb
anRu
ral
Mal
e
Fem
ale
Tota
lM
ale
Fem
ale
Tota
lM
ale
Fem
ale
Tota
l
Num
ber i
n th
ousa
nds
Curr
ent t
obac
co s
mok
er21
,214
.772
4.6
21,9
39.3
5,21
2.9
100.
25,
313.
116
,001
.862
4.4
16,6
26.2
Dai
ly s
mok
er19
,302
.363
7.5
19,9
39.8
4,70
9.0
82*
4,79
1.0
14,5
93.3
555.
515
,148
.9
Occ
asio
nal s
mok
er1,
912.
487
.1*
1,99
9.5
503.
918
.2*
522.
11,
408.
568
.9*
1,47
7.4
Occ
asio
nal s
mok
er, f
orm
erly
dai
ly75
1.1
23.7
*77
4.8
184.
94.
4*18
9.3
566.
1*19
.3*
585.
5*
Occ
asio
nal s
mok
er, n
ever
dai
ly1,
161.
363
.4*
1,22
4.7
319.
013
.8*
332.
884
2.3
49.6
*89
1.9
Non
-sm
oker
26,2
27.7
47,2
50.8
73,4
78.5
7,17
1.0
12,4
88.1
19,6
59.1
19,0
56.8
34,7
62.6
53,8
19.4
Form
er d
aily
sm
oker
4,00
4.7
465.
64,
470.
31,
106.
768
.4*
1,17
5.2
2,89
8.0
397.
23,
295.
2
Nev
er d
aily
sm
oker
22,2
23.0
46,7
85.2
69,0
08.2
6,06
4.2
12,4
19.7
18,4
84.0
16,1
58.8
34,3
65.5
50,5
24.2
Form
er o
ccas
iona
l sm
oker
1,12
6.7
113.
2*1,
239.
937
0.9
12.8
*38
3.6
755.
910
0.4*
856.
3
Nev
er s
mok
er21
,096
.346
,672
.067
,768
.35,
693.
412
,407
.018
,100
.315
,402
.934
,265
.149
,667
.9
Not
e: C
urre
nt u
se in
clud
es b
oth
daily
and
occ
asio
nal (
less
than
dai
ly) u
se.
* Es
timat
es b
ased
on
less
than
25
unw
eigh
ted
case
s

4.2.2 Number of smokeless tobacco use
Table 4.2A presents the population totals corresponding to the prevalence estimatespresented on smoking status in table 4.1A by gender and residence. The estimated numberof current users of smokeless tobacco in Bangladesh was 25.9 million, out of which 13.4 millionfemales and 12.5 million males used smokeless tobacco products.
The number of adult current smokeless tobacco users was more or less equal among maleand female in both urban and rural areas. The number of daily smokeless tobacco users was22.6 million (9.8 million males and 12.8 million females) and 4.6 million in urban and 18.0million in rural areas. The number of occasional smokeless tobacco users was 3.3 million. Outof 69.5 million non-smokeless tobacco users, only 1.3 million adults reported to be formerdaily users, whereas 68.2 million were never daily users. Among these never daily users, 67.3million reported that they had never used any smokeless tobacco in the life time.
23
GATS Bangladesh Report-2009

24
GATS Bangladesh Report-2009Ta
ble
4.2A
: Num
ber
of a
dults
≥15
yea
rs o
ld, b
y de
taile
d sm
okel
ess
toba
cco
use
stat
us, r
esid
ence
,and
gen
der–
GAT
S Ba
ngla
desh
, 200
9
Smok
eles
s To
bacc
o U
se S
tatu
sO
vera
llU
rban
Rura
l
Mal
e
Fem
ale
Tota
lM
ale
Fem
ale
Tota
lM
ale
Fem
ale
Tota
l
Num
ber i
n th
ousa
nds
Curr
ent s
mok
eles
s to
bacc
o us
er12
,511
.313
,402
.625
,914
.02,
671.
92,
939.
65,
611.
59,
839.
410
,463
.120
,302
.5
Dai
ly u
ser
9,84
1.1
12,7
62.1
22,6
03.2
1,95
5.3
2,67
7.9
4,63
3.2
7,88
5.8
10,0
84.2
17,9
70.0
Occ
asio
nal u
ser
2,67
0.2
640.
63,
310.
871
6.6
261.
797
8.2
1,95
3.7
378.
92,
332.
6
Occ
asio
nal u
ser,
form
erly
dai
ly37
4.4
45.7
*42
0.1
82.5
*23
.8*
106.
329
1.9*
21.9
*31
3.8*
Occ
asio
nal u
ser,
neve
r da
ily2,
295.
859
4.9
2,89
0.7
634.
123
7.9
872.
01,
661.
735
7.0
2,01
8.7
Non
-sm
okel
ess
toba
cco
user
34,9
31.1
34,5
72.8
69,5
03.8
9,71
2.0
9,64
8.8
19,3
60.8
25,2
19.1
24,9
24.0
50,1
43.1
Form
er d
aily
use
r87
6.8
458.
61,
335.
327
2.9
110.
038
2.9
603.
834
8.6
952.
4
Nev
er d
aily
use
r34
,054
.334
,114
.268
,168
.59,
439.
09,
538.
818
,977
.824
,615
.324
,575
.349
,190
.7
Form
er o
ccas
iona
l use
r59
4.1
229.
482
3.4
283.
052
.7*
335.
731
1.1*
176.
7*48
7.7
Nev
er u
ser
33,4
60.3
33,8
84.8
67,3
45.1
9,15
6.0
9,48
6.1
18,6
42.1
24,3
04.2
24,3
98.7
48,7
02.9
Not
e: C
urre
nt u
se in
clud
es b
oth
daily
and
occ
asio
nal (
less
than
dai
ly) u
se.
* Es
timat
es b
ased
on
less
than
25
unw
eigh
ted
case
s

4.3 Current smokers of various smoked tobacco products
4.3.1 Prevalence of current smokers by smoked tobacco products
Table 4.3 presents data on smoking tobacco products. In Bangladesh these products includecigarettes, bidis and other smoked tobacco products such as pipes, cigars, water-pipes orhukkah and others. Cigarettes are of two categories: manufactured cigarettes and hand-rolledcigarettes. The overall prevalence rate of current smoking was 23.0%. The prevalence ofcurrent smoking of manufactured cigarettes and bidis were reported as 14.2% and 11.2%,respectively, whereas current smoking for hand-rolled cigarettes and other smoking wasreported to be 0.4% and 1.0% respectively. By age group, the highest tobacco smoking ratewas observed among persons aged 45-64 years of age (32.4%), followed by those 25-44 yearsof age (25.9%). By education and socioeconomic status current smoking shows an inversepattern 31.3% in the “no formal education” group to 14.3% in secondary and above, and29.2% in lowest socio economic status (SES) to 13.6% in highest SES. By occupation, theprevalence of use of any smoked tobacco products, was found to be highest in farmers(52.5%), followed by labourers (44.7%) and businessmen (43.6%). Students and homemakersused the least (3.4% and 1.4%, respectively).
Current cigarette and bidi smoking is reported to be high among males as compared tofemales. Prevalence of current manufactured cigarette use was high in urban (18.4%) areascompared to rural areas (12.6%). In contrast, the prevalence of bidi smoking was greater inrural areas (13.5%) than in urban areas (4.7%). By age group, the highest prevalence of currentmanufactured cigarette smoking was in the age group 25-44 years (16.8%), while highestprevalence of current bidi smoking was in the age group 45-64 years (19.1%). By education andsocioeconomic grades, current manufactured cigarette smoking does not show any specificpattern, whereas current bidi smoking shows an inverse relation with education (19.6% in theno formal education group to 2.7% in the secondary and higher level group) and SES (highestSES 1.5% to 19.0 in lowest SES) levels. By age group, the highest prevalence of currentmanufactured cigarette smoking was noticed in the age group 25-44 years (16.8%) while thehighest prevalence of current bidi smoking was noticed in the age group 45-64 years (19.1%).Prevalence of manufactured cigarettes smoking in the business occupation was the highest(36.1%) followed by employed people (25.0%). Bidis were smoked mostly by farmers (35.0%),followed by labourers (23.6%).
Among men 28.3% smoke manufactured cigarettes and 21.4% reported to smoke bidis.The pattern of smoking various tobacco products among males followed the pattern observedfor adults overall. Overall prevalence estimates were compromised by the significantly lowuse of smoked tobacco products among females and the female smoking prevalence estimateswithin various demographic characteristics became unreasonably low to report. However thehigh prevalence rates of any smoked tobacco product was found among females in the agegroup of 45-64 (2.6%), rural (1.8%), no formal education level (3.5%), farmers (29.1%) andlowest socioeconomic level (4.9%) categories.
25
GATS Bangladesh Report-2009

4.3.2 Number of current smokers by smoked tobacco products
Table 4.4 (based on Table 4.3) presents the estimated number of current smokers who smokedvarious tobacco products. Of those, 13.5 million smoked manufactured cigarettes while 10.6million smoked bidis, and over 1 million smoked other products such as, hand-rolled cigarettes,pipes, cigars, and water-pipes (hukkah).
Among males, 13.4 million smoked manufactured cigarettes while 0.3 million smokedhand-rolled cigarettes; 10.1 million smoked bidis. Among women, 0.5 million smoked bidis.The 25–44 year age group has the highest number of smokers in all categories of smokedtobacco products, i.e. any smoked tobacco product (10.6 million), manufactured cigarettes(6.9 million) and bidis (4.8 million). People living in rural areas (16.6 million) smoked anytobacco product more than in urban areas (5.3 million). The results also show that bothmanufactured cigarette and bidi smoking were more common in rural (8.9 million and 9.5million, respectively) than urban areas (4.6 million and 1.2 million, respectively). Amongcurrent smokers, almost half of the smokers (10.5 million) had no formal education. Thepattern was similar with respect to manufactured cigarettes and bidis; 4.8 million and 6.6million adults reported to smoke these two types, respectively. By socioeconomic status, alarge number adults with high socioeconomic level (3.6 million) smoked manufacturedcigarettes whereas more adults with the lowest socioeconomic level (3.4 million) reported tosmoke bidis. Irrespective of the type of tobacco product, a high number of adults reportedsmoking (4.8 million manufactured cigarettes and 4.6 million bidis smokers).
26
GATS Bangladesh Report-2009

27
GATS Bangladesh Report-2009Ta
ble
4.3:
Per
cent
age
of a
dults
≥15
yea
rs o
ld w
ho a
re c
urre
nt s
mok
ers
of v
ario
us s
mok
ed to
bacc
o pr
oduc
ts, b
y ge
nder
and
sel
ecte
dde
mog
raph
ic c
hara
cter
istic
s–G
ATS
Bang
lade
sh, 2
009.
Dem
ogra
phic
cha
ract
eris
tics
Any
sm
oked
toba
cco
prod
uct
Any
cig
aret
te1
Type
of c
igar
ette
Bidi
sO
ther
sm
oked
toba
cco2
Man
ufac
ture
dH
and-
rolle
d
Perc
enta
ge(9
5% C
I)O
vera
ll23
.0(2
1.9,
24.
2)14
.2(1
3.2,
15.
2)14
.1(1
3.2,
15.
2)0.
4(0
.2, 0
.7)
11.2
(10.
0, 1
2.4)
1.0
(0.6
, 1.7
)A
ge(y
ears
)15
-24
12.0
(10.
2, 1
4.1)
10.2
(8.5
, 12.
2)10
.2(8
.5, 1
2.2)
0.3
(0.1
, 1.0
)*4.
0(2
.8, 5
.5)
0.4
(0.1
, 1.0
)*25
-44
25.9
(24.
1, 2
7.8)
16.8
(15.
3, 1
8.3)
16.8
(15.
3, 1
8.3)
0.4
(0.2
, 0.7
)11
.6(1
0.1,
13.
2)1.
1(0
.5, 2
.4)
45-6
432
.4(2
9.7,
35.
2)15
.9(1
4.0,
18.
1)15
.9(1
4.0,
18.
1)0.
5(0
.2, 0
.9)*
19.1
(16.
7, 2
1.8)
1.0
(0.5
, 1.9
)65
+23
.5(1
9.5,
28.
0)9.
4(7
.0, 1
2.7)
9.0
(6.6
, 12.
2)0.
6(0
.2, 2
.5)*
15.6
(12.
1, 1
9.8)
2.3
(1.1
, 4.8
)*Re
side
nce
Urb
an21
.3(1
9.8,
22.
9)18
.4(1
6.9,
19.
9)18
.4(1
6.9,
19.
9)0.
8(0
.5, 1
.3)
4.7
(3.7
, 5.8
)1.
1(0
.7, 1
.8)
Rura
l23
.6(2
2.2,
25.
1)12
.7(1
1.5,
14.
0)12
.6(1
1.4,
13.
9)0.
3(0
.1, 0
.7)*
13.5
(12.
0, 1
5.0)
0.9
(0.4
, 1.9
)Ed
ucat
ion
leve
lN
o fo
rmal
edu
catio
n31
.1(2
9.1,
33.
3)14
.3(1
2.7,
16.
0)14
.2(1
2.6,
15.
9)0.
5(0
.2, 0
.9)*
19.6
(17.
6, 2
1.8)
1.6
(0.8
, 3.2
)Le
ss th
an p
rim
ary
26.6
(23.
6, 2
9.8)
16.7
(14.
3, 1
9.4)
16.7
(14.
3, 1
9.4)
0.4
(0.2
, 0.8
)*12
.7(1
0.5,
15.
3)0.
9(0
.5, 1
.9)*
Prim
ary
17.5
(14.
7, 2
0.6)
13.0
(10.
5, 1
6.1)
13.0
(10.
5, 1
6.1)
0.1
(0.0
, 0.5
)*6.
0(4
.4, 8
.0)
0.3
(0.1
, 0.7
)*Le
ss th
an s
econ
dary
16.7
(14.
6, 1
9.0)
14.0
(12.
2, 1
6.1)
14.0
(12.
2, 1
6.1)
0.2
(0.1
, 0.5
)*5.
1(3
.8, 6
.8)
0.3
(0.2
, 0.6
)*Se
cond
ary
and
abov
e14
.3(1
1.9,
17.
2)13
.0(1
0.7,
15.
7)13
.0(1
0.7,
15.
7)0.
8(0
.3, 2
.5)*
2.7
(1.7
, 4.3
)1.
1(0
.4, 2
.8)*
Wea
lth in
dex
Low
est
29.2
(26.
4, 3
2.2)
11.9
(9.7
, 14.
5)11
.7(9
.5, 1
4.3)
0.4
(0.2
, 1.0
)*19
.0(1
6.6,
21.
6)2.
6(1
.0, 6
.4)
Low
26.3
(24.
0, 2
8.7)
14.6
(12.
8, 1
6.7)
14.6
(12.
7, 1
6.7)
0.3
(0.1
, 0.7
)*15
.1(1
3.1,
17.
3)0.
6(0
.3, 1
.0)*
Mid
dle
23.2
(20.
6, 2
6.1)
13.6
(11.
7, 1
5.8)
13.6
(11.
7, 1
5.8)
0.4
(0.2
, 0.9
)*12
.3(1
0.0,
15.
0)0.
6(0
.3, 1
.1)*
Hig
h20
.5(1
8.2,
22.
9)16
.9(1
4.9,
19.
1)16
.9(1
4.9,
19.
1)0.
5(0
.2, 1
.3)*
6.0
(4.7
, 7.5
)0.
7(0
.3, 1
.5)*
Hig
hest
13.6
(11.
8, 1
5.7)
13.0
(11.
3, 1
5.0)
13.0
(11.
3, 1
5.0)
0.4
(0.2
, 0.9
)*1.
5(0
.9, 2
.5)
0.6
(0.3
, 1.1
)*O
ccup
atio
nEm
ploy
ed27
.9(2
3.5,
32.
9)25
.0(2
0.8,
29.
8)25
.0(2
0.8,
29.
8)0.
4(0
.2, 1
.0)*
3.6
(2.3
, 5.7
)0.
5(0
.2, 1
.1)*
Busi
ness
43.6
(39.
6, 4
7.7)
36.1
(32.
4, 4
0.0)
36.1
(32.
4, 4
0.0)
0.7
(0.3
, 2.1
)*12
.1(9
.5, 1
5.2)
1.1
(0.5
, 2.5
)*Fa
rmer
s52
.5(4
8.2,
56.
7)24
.8(2
1.2,
28.
7)24
.8(2
1.2,
28.
7)0.
2(0
.0, 1
.2)*
35.0
(30.
6, 3
9.8)
2.2
(0.8
, 6.0
)*La
bour
ers
44.7
(41.
5, 4
8.1)
24.8
(21.
8, 2
8.1)
24.8
(21.
8, 2
8.1)
0.8
(0.4
, 1.4
)23
.6(2
0.6,
26.
9)1.
7(1
.0, 2
.8)
Stud
ent
3.4
(1.5
, 7.5
)*3.
4(1
.5, 7
.5)*
3.4
(1.5
, 7.5
)*0.
9(0
.3, 3
.5)*
0.9
(0.3
, 3.5
)*1.
0(0
.3, 3
.4)*
Hom
emak
er1.
4(1
.0, 2
.0)
0.3
(0.2
, 0.8
)*0.
3(0
.1, 0
.6)*
0.1
(0.0
, 0.4
)*0.
9(0
.6, 1
.4)
0.2
(0.1
, 0.5
)*U
nem
ploy
ed22
.1(1
7.1,
28.
2)16
.8(1
2.2,
22.
8)16
.8(1
2.2,
22.
8)0.
3(0
.0, 1
.7)*
9.9
(6.4
, 15.
1)1.
7(0
.6, 4
.9)*
Not
e: C
urre
nt u
se in
clud
es b
oth
daily
and
occ
asio
nal(l
ess
than
dai
ly) u
se.
1 Incl
udes
man
ufac
ture
d ci
gare
ttes
and
han
d ro
lled
ciga
rett
es. 2 In
clud
es z
arda
, pan
mas
ala
etc.
* Es
timat
e ba
sed
on fe
wer
than
25
unw
eigh
ted
case
s.

28
GATS Bangladesh Report-2009Ta
ble
4.3
(con
t.):
Perc
enta
ge o
f adu
lts ≥
15 y
ears
old
who
are
cur
rent
sm
oker
s of
var
ious
sm
oked
toba
cco
prod
ucts
, by
gend
er a
nd s
elec
ted
dem
ogra
phic
char
acte
rist
ics–
GAT
S Ba
ngla
desh
, 200
9.
Dem
ogra
phic
char
acte
rist
ics
Any
sm
oked
toba
cco
prod
uct
Any
cig
aret
te1
Type
of c
igar
ette
Bidi
sO
ther
sm
oked
toba
cco2
Man
ufac
ture
dH
and-
rolle
d
Perc
enta
ge(9
5% C
I)M
ale
44.7
(42.
5, 4
7.0)
28.3
(26.
3, 3
0.4)
28.3
(26.
3, 3
0.4)
0.7
(0.4
, 1.3
)21
.4(1
9.2,
23.
7)1.
7(1
.0, 2
.8)
Age
(yea
rs)
15-2
424
.0(2
0.4,
28.
0)20
.3(1
6.9,
24.
3)20
.3(1
6.9,
24.
3)0.
6(0
.2, 1
.9)*
7.9
(5.6
, 11.
1)0.
7(0
.3, 1
.9)*
25-4
453
.1(5
0.1,
56.
1)35
.1(3
2.3,
38.
2)35
.1(3
2.3,
38.
2)0.
9(0
.5, 1
.4)
23.6
(20.
8, 2
6.6)
2.0
(1.1
, 3.9
)45
-64
57.9
(53.
6, 6
2.2)
29.3
(25.
9, 3
3.0)
29.3
(25.
9, 3
3.0)
0.8
(0.4
, 1.5
)*33
.4(2
9.2,
37.
9)1.
7(0
.9, 3
.2)
65+
39.1
(32.
7, 4
5.9)
17.3
(12.
9, 2
3.0)
17.3
(12.
9, 2
3.0)
0.4
(0.1
, 1.8
)*26
.0(2
0.5,
32.
3)3.
0(1
.2, 7
.4)*
Resi
denc
eU
rban
42.1
(39.
5, 4
4.7)
37.0
(34.
2, 3
9.8)
37.0
(34.
2, 3
9.8)
1.5
(0.9
, 2.5
)8.
8(7
.0, 1
0.9)
2.2
(1.4
, 3.5
)Ru
ral
45.6
(42.
8, 4
8.5)
25.2
(22.
8, 2
7.8)
25.2
(22.
8, 2
7.8)
0.5
(0.2
, 1.3
)*25
.8(2
3.0,
28.
9)1.
5(0
.7, 3
.1)
Educ
atio
n le
vel
No
form
al e
duca
tion
62.7
(59.
2, 6
6.0)
30.0
(26.
7, 3
3.6)
30.0
(26.
7, 3
3.6)
0.8
(0.4
, 1.5
)*39
.2(3
5.4,
43.
1)2.
6(1
.3, 5
.0)
Less
than
pri
mar
y47
.5(4
2.3,
52.
7)29
.8(2
5.7,
34.
4)29
.8(2
5.7,
34.
4)0.
7(0
.3, 1
.5)*
22.7
(18.
7, 2
7.4)
1.6
(0.8
, 3.4
)*Pr
imar
y40
.3(3
4.8,
46.
1)30
.6(2
5.2,
36.
7)30
.6(2
5.2,
36.
7)0.
3(0
.1, 1
.1)*
13.4
(10.
0, 1
7.8)
0.7
(0.3
, 1.6
)*Le
ss th
an s
econ
dary
34.4
(30.
3, 3
8.7)
28.9
(25.
2, 3
3.0)
28.9
(25.
2, 3
3.0)
0.4
(0.2
, 1.0
)*10
.6(8
.0, 1
4.0)
0.6
(0.3
, 1.2
)*Se
cond
ary
and
abov
e23
.5(1
9.6,
28.
0)21
.4(1
7.7,
25.
6)21
.4(1
7.7,
25.
6)1.
4(0
.4, 4
.1)*
4.4
(2.7
, 7.0
)1.
8(0
.7, 4
.5)*
Wea
lth in
dex
Low
est
59.0
(53.
9, 6
3.9)
25.8
(21.
3, 3
0.8)
25.8
(21.
3, 3
0.8)
0.6
(0.2
, 1.3
)*38
.2(3
2.9,
43.
7)4.
1(1
.5, 1
0.7)
Low
50.7
(46.
3, 5
5.0)
28.6
(25.
0, 3
2.6)
28.6
(25.
0, 3
2.6)
0.5
(0.2
, 1.2
)*29
.0(2
5.0,
33.
3)1.
0(0
.5, 1
.9)*
Mid
dle
44.8
(39.
9, 4
9.8)
26.5
(22.
7, 3
0.6)
26.5
(22.
7, 3
0.6)
0.8
(0.4
, 1.7
)*23
.6(1
9.4,
28.
3)1.
1(0
.6, 2
.1)*
Hig
h39
.2(3
5.2,
43.
4)32
.7(2
9.0,
36.
6)32
.7(2
9.0,
36.
6)1.
0(0
.4, 2
.4)*
11.2
(8.9
, 14.
0)1.
4(0
.6, 2
.8)*
Hig
hest
27.5
(23.
9, 3
1.3)
26.2
(22.
8, 2
9.9)
26.2
(22.
8, 2
9.9)
0.8
(0.3
, 1.9
)*3.
1(1
.9, 4
.9)
1.2
(0.6
, 2.3
)*O
ccup
atio
nEm
ploy
ed37
.0(3
1.3,
43.
1)33
.2(2
7.8,
39.
0)33
.2(2
7.8,
39.
0)0.
6(0
.3, 1
.3)*
4.8
(3.0
, 7.6
)0.
6(0
.3, 1
.4)*
Busi
ness
44.9
(40.
7, 4
9.1)
37.2
(33.
4, 4
1.2)
37.2
(33.
4, 4
1.2)
0.8
(0.3
, 2.1
)*12
.4(9
.8, 1
5.6)
1.2
(0.5
, 2.5
)*Fa
rmer
s52
.8(4
8.5,
57.
2)25
.2(2
1.4,
29.
3)25
.2(2
1.4,
29.
3)0.
2(0
.0, 1
.2)*
35.5
(31.
1, 4
0.1)
1.9
(0.8
, 4.6
)*La
bour
ers
55.0
(51.
2, 5
8.8)
31.1
(27.
4, 3
5.1)
31.1
(27.
4, 3
5.1)
1.0
(0.5
, 1.7
)28
.7(2
5.1,
32.
6)1.
9(1
.1, 3
.0)
Stud
ent
5.6
(2.5
, 12.
1)*
5.6
(2.5
, 12.
1)*
5.6
(2.5
, 12.
1)*
1.5
(0.4
, 5.6
)*1.
5(0
.4, 5
.6)*
1.7
(0.5
, 5.5
)*H
omem
aker
24.4
(8.7
, 52.
2)*
19.0
(5.0
, 51.
2)*
19.0
(5.0
, 51.
2)*
0.0
5.5
(0.7
, 33.
2)*
0.0
Une
mpl
oyed
35.6
(28.
0, 4
4.0)
27.3
(20.
2, 3
5.9)
27.3
(20.
2, 3
5.9)
0.5
(0.1
, 2.7
)*15
.8(1
0.2,
23.
6)2.
8(1
.0, 7
.8)*
Not
e: C
urre
nt u
se in
clud
es b
oth
daily
and
occ
asio
nal(l
ess
than
dai
ly) u
se.
1 Incl
udes
man
ufac
ture
d ci
gare
ttes
and
han
d ro
lled
ciga
rett
es. 2 In
clud
es z
arda
, pan
mas
ala
etc.
* Es
timat
e ba
sed
on fe
wer
than
25
unw
eigh
ted
case
s.

29
GATS Bangladesh Report-2009Ta
ble
4.3
(con
t.):
Perc
enta
ge o
f adu
lts ≥
15 y
ears
old
who
are
cur
rent
sm
oker
s of
var
ious
sm
oked
toba
cco
prod
ucts
, by
gend
er a
nd s
elec
ted
dem
ogra
phic
char
acte
rist
ics–
GAT
S Ba
ngla
desh
, 200
9.D
emog
raph
icch
arac
teri
stic
sA
ny s
mok
ed to
bacc
opr
oduc
tA
ny c
igar
ette
1Ty
pe o
f cig
aret
teBi
dis
Oth
er s
mok
ed to
bacc
o2M
anuf
actu
red
Han
d-ro
lled
Perc
enta
ge(9
5% C
I)Fe
mal
e1.
5(1
.1, 2
.1)
0.2
(0.1
, 0.5
)*0.
2(0
.1, 0
.4)*
0.1
(0.0
, 0.3
)*1.
1(0
.7, 1
.5)
0.3
(0.1
, 0.7
)*A
ge(y
ears
)15
-24
0.4
(0.1
, 1.0
)*0.
3(0
.1, 1
.0)*
0.3
(0.1
, 1.0
)*0.
00.
1(0
.0, 0
.6)*
0.0
(0.0
, 0.2
)*25
-44
1.1
(0.6
, 2.0
)0.
0(0
.0, 0
.1)*
0.0
(0.0
, 0.1
)*0.
00.
6(0
.3, 1
.4)*
0.3
(0.1
, 1.2
)*45
-64
2.6
(1.7
, 4.0
)0.
3(0
.1, 0
.9)*
0.2
(0.1
, 0.8
)*0.
1(0
.0, 0
.6)*
2.5
(1.6
, 3.8
)0.
2(0
.0, 0
.8)*
65+
6.6
(3.5
, 12.
2)*
0.9
(0.1
, 5.9
)*0.
00.
9(0
.1, 5
.9)*
4.4
(2.0
, 9.3
)*1.
5(0
.4, 5
.6)*
Resi
denc
eU
rban
0.8
(0.5
, 1.2
)0.
1(0
.1, 0
.4)*
0.1
(0.1
, 0.4
)*0.
00.
6(0
.4, 1
.0)*
0.0
(0.0
, 0.2
)*Ru
ral
1.8
(1.2
, 2.6
)0.
3(0
.1, 0
.6)*
0.2
(0.1
, 0.5
)*0.
1(0
.0, 0
.5)*
1.2
(0.8
, 1.9
)0.
4(0
.1, 1
.0)*
Educ
atio
n le
vel
No
form
al e
duca
tion
3.5
(2.4
, 4.9
)0.
4(0
.2, 1
.0)*
0.2
(0.1
, 0.6
)*0.
2(0
.0, 0
.9)*
2.5
(1.7
, 3.7
)0.
7(0
.3, 1
.8)*
Less
than
pri
mar
y0.
8(0
.3, 2
.2)*
0.4
(0.0
, 2.5
)*0.
4(0
.0, 2
.5)*
0.0
0.3
(0.1
, 0.9
)*0.
1(0
.0, 0
.4)*
Prim
ary
0.6
(0.2
, 2.0
)*0.
1(0
.0, 0
.7)*
0.1
(0.0
, 0.7
)*0.
00.
5(0
.1, 2
.0)*
0.0
Less
than
sec
onda
ry0.
1(0
.0, 0
.5)*
0.0
0.0
0.0
0.0
0.1
(0.0
, 0.5
)*Se
cond
ary
and
abov
e0.
00.
00.
00.
00.
00.
0W
ealth
inde
xLo
wes
t4.
9(3
.3, 7
.3)
0.6
(0.2
, 1.7
)*0.
3(0
.1, 1
.0)*
0.3
(0.0
, 1.9
)*3.
4(2
.1, 5
.5)
1.3
(0.5
, 3.3
)*Lo
w1.
4(0
.8, 2
.3)*
0.3
(0.1
, 1.3
)*0.
3(0
.1, 1
.3)*
0.1
(0.0
, 0.5
)*0.
9(0
.5, 1
.6)*
0.1
(0.0
, 0.6
)*M
iddl
e0.
3(0
.1, 1
.1)*
0.0
0.0
0.0
0.3
(0.1
, 1.1
)*0.
0H
igh
0.5
(0.1
, 1.5
)*0.
1(0
.0, 0
.5)*
0.1
(0.0
, 0.5
)*0.
00.
4(0
.1, 1
.5)*
0.0
Hig
hest
0.1
(0.0
, 0.6
)*0.
1(0
.0, 0
.6)*
0.1
(0.0
, 0.6
)*0.
00.
00.
0O
ccup
atio
nEm
ploy
ed0.
00.
00.
00.
00.
00.
0Bu
sine
ss0.
00.
00.
00.
00.
00.
0Fa
rmer
s29
.1(1
9.0,
41.
8)*
0.0
0.0
0.0
6.6
(0.8
, 38.
2)*
22.5
(10.
7, 4
1.4)
*
Labo
urer
s4.
8(2
.3, 9
.5)*
0.4
(0.1
, 2.7
)*0.
4(0
.1, 2
.7)*
0.0
3.9
(1.8
, 8.1
)*0.
9(0
.1, 5
.9)*
Stud
ent
0.0
0.0
0.0
0.0
0.0
0.0
Hom
emak
er1.
3(0
.9, 1
.8)
0.2
(0.1
, 0.6
)*0.
2(0
.1, 0
.4)*
0.1
(0.0
, 0.4
)*0.
9(0
.6, 1
.3)
0.2
(0.1
, 0.5
)*U
nem
ploy
ed0.
5(0
.1, 2
.5)*
0.0
0.0
0.0
0.5
(0.1
, 2.5
)*0.
0N
ote:
Cur
rent
use
incl
udes
bot
h da
ily a
nd o
ccas
iona
l(les
s th
an d
aily
) use
. 1 In
clud
es m
anuf
actu
red
ciga
rett
es a
nd h
and
rolle
d ci
gare
ttes
. 2 Incl
udes
zar
da, p
an m
asal
aet
c.*
Estim
ate
base
d on
few
er th
an 2
5 u
nwei
ghte
d ca
ses.
4.4 Current users of various smokeless tobacco products
4.4.1 Prevalence of current users by smokeless tobacco products
Table 4.3.1 presents data on the use prevalence of various smokeless tobacco products. Useof any current smokeless tobacco was 27.2%. The prevalence of use of betel quid with tobaccowas 24.3% followed by gul (5.3%), sada pata (1.8%), khoinee (1.5%) and others (1.4%).
The smokeless tobacco use rate was reported to increase persistently with age, rangingfrom 6.6% in the age group 15-24 years up to 56.4% in the age group 65 and above. Use ofbetel quid with tobacco (51.3%) was more common among adults age 65 and older, whereasa high proportion of gul users (9.8%) come from the age group 45-64 years. Irrespective of theproduct, the prevalence of smokeless tobacco use was found to be higher in rural areascompared to urban areas. For example, 25.7% of rural adults reported to use betel quid withtobacco, whereas 20.5% reported to use the product in urban areas. By education andsocioeconomic level, a clear pattern was observed with respect to smokeless tobacco usewhere the prevalence decreased as education and socioeconomic level increased. Thosecurrent users with no formal education showed a higher rate (42.3%) compared to adultcurrent smokers with less than primary (28.7%) and primary (24.9%) education levels.Similarly, 36.1% of current users of the lowest socioeconomic level reported to use anysmokeless tobacco product, while only 17.3% did so among the highest socioeconomic level.The pattern was similar with respect to any specific smokeless tobacco product, exceptkhoinee. Farmers (33.8%), the unemployed (31.9%) and labourers (30.9%) reported to useany smokeless tobacco at a higher rate.
Unlike the use of smoked tobacco products, the use of smokeless tobacco among malesand females were reported at quite similar levels; in most cases, the use was higher in females.Overall, 26.4% of males and 27.9% of females used any smokeless tobacco product. Similar tooverall estimates, betel quid with tobacco was predominantly used by both males (23.5%)and females (25.2%). The use of gul among males was 5.5% compared to 5.1% among females.Rural males and females (25.0% and 26.4%, respectively) used betel quid with tobacco morethan their urban counterparts (19.3% and 21.7%, respectively). Similar to the pattern observedin overall prevalence, the use of smokeless tobacco products was decreased with an increasein education and socioeconomic level in both male and females. The rate of decrease wassharp among females compared to males. For example, use of betel quid with tobacco amongmales with no formal education was 30.9% compared to those with an educational level ofsecondary and above (12.2%) whereas the prevalence among females was 43.3% and 4.7% inthe respective education categories. The prevalence varied between 30.3% in the lowestsocioeconomic level and 13.0% in the highest socioeconomic level among males, comparedto 32.1% in the lowest and 19.0% in the highest socioeconomic level among females. Gul andkhoinee use were found to be highest among male current users in the occupation of labourers(7.5% and 2.8%, respectively) while among female current users homemaker reported moreuse of these two products (5.7% and 1.4%, respectively).
30
GATS Bangladesh Report-2009

4.4.2 Number of current users by smokeless tobacco products
Table 4.4.1 (based on Table 4.3.1) presents the estimated number of current smokelesstobacco users who used various smokeless tobacco products; 25.9 million used any smokelesstobacco product; 23.2 million used betel quid with tobacco, 5.1 million used gul, 1.7 millionused sada pata, 1.4 million used khoinee and 1.4 million used others products such as zarda,pan masala etc. As for the rural/urban split, 20.3 million rural population and 5.6 urbanpopulation used smokeless tobacco products.
By age, the 25–44 year age group has the highest number of smokeless tobacco users intwo categories of smokeless tobacco products, i.e. betel quid with tobacco (9.8 million), andgul (2.3 million). The sada pata and khoinee use found to be higher among adults in the agegroup 45-64. The results also show that the use of all the specific products was more in ruralareas (18.1 million betel quid with tobacco, 1.3 million sada pata, 3.9 million gul and 1.1million khoinee users) compared to urban areas (5.1 million betel quid with tobacco, 0.4million sada pata, 1.1 million gul and 0.4 million khoinee users). By education, the overallnumber of current smokeless tobacco users who had used any tobacco product was quitehigh among persons with no formal education (14.3 million) compared with those with anyother education level. The pattern was similar with respect to betel quid with tobacco (12.6million) and gul (2.6 million).
By socioeconomic status, large numbers of adults with the lowest and low socioeconomiclevels used betel quid with tobacco (5.6 and 5.9 million, respectively) and gul (1.2 and 1.3million, respectively). By occupation, the number of current users who use these two productswas highest among homemakers (9.8 and 2.1 million, respectively). By gender, the number ofcurrent smokeless tobacco users among females (13.4 million) was more than among males(12.5 million). By products, there was not much difference between males and females. Thepattern of various smokeless tobacco products was very similar to the overall pattern, andthere were no marked differences observed between males and females.
31
GATS Bangladesh Report-2009

32
GATS Bangladesh Report-2009Ta
ble
4.3.
1: P
erce
ntag
e of
adu
lts ≥1
5 ye
ars
old
who
are
cur
rent
use
rs o
f va
riou
s sm
okel
ess
toba
cco
prod
ucts
, by
gend
er a
nd s
elec
ted
dem
ogra
phic
cha
ract
eris
tics–
GAT
S Ba
ngla
desh
, 200
9.D
emog
raph
icch
arac
teri
stic
sA
ny s
mok
eles
s to
bacc
opr
oduc
tTy
pe o
f sm
okel
ess
toba
cco
Bete
l qui
d w
ith
toba
cco
Sada
pat
aG
ulKh
oine
eO
ther
s1
Perc
enta
ge(9
5% C
I)O
vera
ll27
.2(2
5.5,
28.
9)24
.3(2
2.7,
26.
1)1.
8(1
.3, 2
.4)
5.3
(4.5
, 6.3
)1.
5(1
.1, 2
.2)
1.4
(0.9
, 2.2
)A
ge(y
ears
)15
-24
6.6
(5.1
, 8.6
)5.
9(4
.4, 7
.9)
0.3
(0.1
, 0.8
)*1.
2(0
.8, 2
.0)
0.4
(0.2
, 0.9
)*0.
3(0
.1, 0
.7)*
25-4
426
.8(2
4.7,
29.
0)23
.9(2
1.8,
26.
1)1.
2(0
.8, 1
.8)
5.6
(4.6
, 6.8
)1.
3(0
.9, 1
.9)
1.1
(0.7
, 1.7
)45
-64
47.7
(44.
5, 5
1.0)
42.9
(39.
6, 4
6.2)
4.1
(2.6
, 6.2
)9.
8(7
.6, 1
2.6)
3.4
(2.0
, 5.5
)3.
4(1
.9, 5
.9)
65+
56.4
(51.
3, 6
1.4)
51.3
(46.
1, 5
6.5)
4.7
(2.9
, 7.5
)7.
2(4
.7, 1
0.8)
2.2
(1.1
, 4.2
)*2.
8(1
.6, 4
.9)*
Resi
denc
eU
rban
22.5
(20.
3, 2
4.8)
20.5
(18.
5, 2
2.6)
1.5
(1.0
, 2.3
)4.
7(3
.6, 6
.2)
1.5
(1.0
, 2.3
)1.
5(1
.0, 2
.3)
Rura
l28
.8(2
6.8,
30.
9)25
.7(2
3.6,
27.
9)1.
9(1
.3, 2
.7)
5.5
(4.5
, 6.8
)1.
5(1
.0, 2
.4)
1.4
(0.8
, 2.5
)Ed
ucat
ion
leve
lN
o fo
rmal
edu
catio
n42
.3(3
9.8,
44.
9)37
.5(3
5.0,
40.
0)2.
4(1
.7, 3
.2)
7.7
(6.4
, 9.3
)1.
6(1
.1, 2
.4)
1.6
(0.9
, 2.5
)Le
ss th
an p
rim
ary
28.7
(25.
0, 3
2.8)
26.2
(22.
6, 3
0.2)
2.7
(1.6
, 4.6
)6.
2(4
.5, 8
.5)
2.6
(1.5
, 4.4
)2.
4(1
.4, 4
.2)
Prim
ary
24.9
(21.
4, 2
8.7)
22.4
(19.
1, 2
6.3)
0.9
(0.5
, 1.6
)*4.
9(3
.4, 6
.8)
1.0
(0.5
, 1.8
)*1.
1(0
.5, 2
.3)*
Less
than
sec
onda
ry13
.5(1
1.5,
15.
7)12
.5(1
0.7,
14.
7)0.
9(0
.5, 1
.7)*
2.4
(1.7
, 3.4
)1.
0(0
.6, 1
.8)*
0.8
(0.5
, 1.5
)*Se
cond
ary
and
abov
e10
.2(8
.1, 1
2.7)
9.3
(7.2
, 11.
8)1.
4(0
.5, 3
.9)*
2.7
(1.5
, 4.8
)1.
4(0
.5, 3
.9)*
1.3
(0.5
, 3.9
)*W
ealth
inde
xLo
wes
t36
.1(3
2.6,
39.
8)31
.3(2
7.9,
34.
9)1.
6(1
.1, 2
.5)
6.8
(5.4
, 8.6
)1.
5(0
.9, 2
.6)
1.5
(0.8
, 2.6
)Lo
w30
.3(2
7.4,
33.
3)26
.9(2
4.1,
29.
9)2.
4(1
.6, 3
.5)
6.0
(4.7
, 7.6
)1.
4(0
.9, 2
.3)
1.2
(0.7
, 2.1
)M
iddl
e26
.3(2
3.2,
29.
6)24
.1(2
1.2,
27.
2)1.
9(1
.1, 3
.1)
5.8
(4.3
, 7.7
)1.
8(1
.0, 3
.0)
1.9
(1.1
, 3.2
)H
igh
23.8
(21.
4, 2
6.3)
21.6
(19.
3, 2
4.1)
1.8
(0.9
, 3.3
)4.
7(3
.4, 6
.5)
1.9
(1.0
, 3.4
)1.
6(0
.8, 3
.1)
Hig
hest
17.3
(14.
8, 2
0.1)
16.1
(13.
6, 1
8.9)
0.9
(0.4
, 2.1
)*2.
6(1
.8, 3
.8)
0.8
(0.4
, 1.6
)*0.
9(0
.4, 1
.9)*
Occ
upat
ion
Empl
oyed
17.8
(14.
5, 2
1.7)
16.2
(13.
1, 2
0.0)
1.5
(0.7
, 3.2
)*4.
6(3
.0, 7
.0)
1.8
(0.9
, 3.5
)*1.
8(0
.9, 3
.7)*
Busi
ness
27.8
(23.
9, 3
2.0)
25.2
(21.
4, 2
9.4)
1.3
(0.5
, 3.4
)*5.
3(3
.6, 7
.8)
1.6
(0.7
, 3.6
)*1.
3(0
.5, 3
.4)*
Farm
ers
33.8
(30.
0, 3
8.0)
30.3
(26.
6, 3
4.4)
2.2
(1.3
, 3.8
)*5.
8(4
.0, 8
.4)
1.5
(0.8
, 2.9
)*1.
6(0
.8, 3
.1)*
Labo
urer
s30
.9(2
7.5,
34.
5)26
.9(2
3.6,
30.
5)2.
2(1
.1, 4
.4)
6.8
(5.1
, 9.1
)2.
3(1
.2, 4
.5)
2.1
(0.9
, 4.6
)St
uden
t1.
0(0
.4, 2
.6)*
1.0
(0.4
, 2.6
)*0.
3(0
.1, 1
.3)*
0.3
(0.1
, 1.3
)*0.
3(0
.1, 1
.3)*
0.2
(0.0
, 1.4
)*H
omem
aker
29.2
(27.
0, 3
1.6)
26.5
(24.
2, 2
8.9)
1.7
(1.1
, 2.5
)5.
7(4
.6, 6
.9)
1.4
(0.9
, 2.2
)1.
3(0
.8, 2
.0)
Une
mpl
oyed
31.9
(26.
0, 3
8.4)
28.8
(23.
3, 3
5.0)
3.1
(1.4
, 6.5
)*4.
3(2
.4, 7
.5)*
1.0
(0.3
, 2.8
)*1.
6(0
.7, 3
.7)*
Not
e: C
urre
nt u
se in
clud
es b
oth
daily
and
occ
asio
nal(l
ess
than
dai
ly) u
se.
1 Incl
udes
zar
da, p
an m
asal
aet
c.*
Estim
ate
base
d on
few
er th
an 2
5 u
nwei
ghte
d ca
ses.
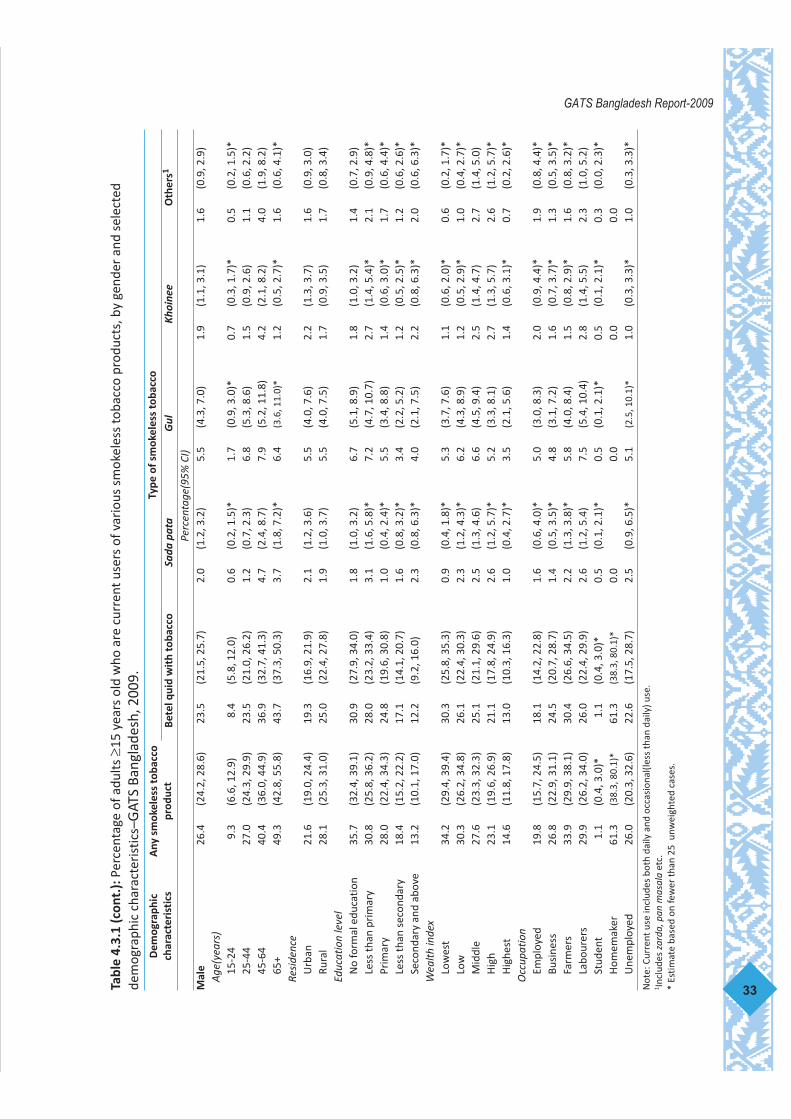
33
GATS Bangladesh Report-2009Ta
ble
4.3.
1 (c
ont.
):Pe
rcen
tage
of a
dults
≥15
yea
rs o
ld w
ho a
re c
urre
nt u
sers
of v
ario
us s
mok
eles
s to
bacc
o pr
oduc
ts, b
y ge
nder
and
sel
ecte
dde
mog
raph
ic c
hara
cter
istic
s–G
ATS
Bang
lade
sh, 2
009.
Dem
ogra
phic
char
acte
rist
ics
Any
sm
okel
ess
toba
cco
prod
uct
Type
of s
mok
eles
s to
bacc
oBe
tel q
uid
wit
h to
bacc
oSa
da p
ata
Gul
Khoi
nee
Oth
ers1
Perc
enta
ge(9
5% C
I)M
ale
26.4
(24.
2, 2
8.6)
23.5
(21.
5, 2
5.7)
2.0
(1.2
, 3.2
)5.
5(4
.3, 7
.0)
1.9
(1.1
, 3.1
)1.
6(0
.9, 2
.9)
Age
(yea
rs)
15-2
49.
3(6
.6, 1
2.9)
8.4
(5.8
, 12.
0)0.
6(0
.2, 1
.5)*
1.7
(0.9
, 3.0
)*0.
7(0
.3, 1
.7)*
0.5
(0.2
, 1.5
)*25
-44
27.0
(24.
3, 2
9.9)
23.5
(21.
0, 2
6.2)
1.2
(0.7
, 2.3
)6.
8(5
.3, 8
.6)
1.5
(0.9
, 2.6
)1.
1(0
.6, 2
.2)
45-6
440
.4(3
6.0,
44.
9)36
.9(3
2.7,
41.
3)4.
7(2
.4, 8
.7)
7.9
(5.2
, 11.
8)4.
2(2
.1, 8
.2)
4.0
(1.9
, 8.2
)65
+49
.3(4
2.8,
55.
8)43
.7(3
7.3,
50.
3)3.
7(1
.8, 7
.2)*
6.4
(3.6
, 11.
0)*
1.2
(0.5
, 2.7
)*1.
6(0
.6, 4
.1)*
Resi
denc
eU
rban
21.6
(19.
0, 2
4.4)
19.3
(16.
9, 2
1.9)
2.1
(1.2
, 3.6
)5.
5(4
.0, 7
.6)
2.2
(1.3
, 3.7
)1.
6(0
.9, 3
.0)
Rura
l28
.1(2
5.3,
31.
0)25
.0(2
2.4,
27.
8)1.
9(1
.0, 3
.7)
5.5
(4.0
, 7.5
)1.
7(0
.9, 3
.5)
1.7
(0.8
, 3.4
)Ed
ucat
ion
leve
lN
o fo
rmal
edu
catio
n35
.7(3
2.4,
39.
1)30
.9(2
7.9,
34.
0)1.
8(1
.0, 3
.2)
6.7
(5.1
, 8.9
)1.
8(1
.0, 3
.2)
1.4
(0.7
, 2.9
)Le
ss th
an p
rim
ary
30.8
(25.
8, 3
6.2)
28.0
(23.
2, 3
3.4)
3.1
(1.6
, 5.8
)*7.
2(4
.7, 1
0.7)
2.7
(1.4
, 5.4
)*2.
1(0
.9, 4
.8)*
Prim
ary
28.0
(22.
4, 3
4.3)
24.8
(19.
6, 3
0.8)
1.0
(0.4
, 2.4
)*5.
5(3
.4, 8
.8)
1.4
(0.6
, 3.0
)*1.
7(0
.6, 4
.4)*
Less
than
sec
onda
ry18
.4(1
5.2,
22.
2)17
.1(1
4.1,
20.
7)1.
6(0
.8, 3
.2)*
3.4
(2.2
, 5.2
)1.
2(0
.5, 2
.5)*
1.2
(0.6
, 2.6
)*Se
cond
ary
and
abov
e13
.2(1
0.1,
17.
0)12
.2(9
.2, 1
6.0)
2.3
(0.8
, 6.3
)*4.
0(2
.1, 7
.5)
2.2
(0.8
, 6.3
)*2.
0(0
.6, 6
.3)*
Wea
lth in
dex
Low
est
34.2
(29.
4, 3
9.4)
30.3
(25.
8, 3
5.3)
0.9
(0.4
, 1.8
)*5.
3(3
.7, 7
.6)
1.1
(0.6
, 2.0
)*0.
6(0
.2, 1
.7)*
Low
30.3
(26.
2, 3
4.8)
26.1
(22.
4, 3
0.3)
2.3
(1.2
, 4.3
)*6.
2(4
.3, 8
.9)
1.2
(0.5
, 2.9
)*1.
0(0
.4, 2
.7)*
Mid
dle
27.6
(23.
3, 3
2.3)
25.1
(21.
1, 2
9.6)
2.5
(1.3
, 4.6
)6.
6(4
.5, 9
.4)
2.5
(1.4
, 4.7
)2.
7(1
.4, 5
.0)
Hig
h23
.1(1
9.6,
26.
9)21
.1(1
7.8,
24.
9)2.
6(1
.2, 5
.7)*
5.2
(3.3
, 8.1
)2.
7(1
.3, 5
.7)
2.6
(1.2
, 5.7
)*H
ighe
st14
.6(1
1.8,
17.
8)13
.0(1
0.3,
16.
3)1.
0(0
.4, 2
.7)*
3.5
(2.1
, 5.6
)1.
4(0
.6, 3
.1)*
0.7
(0.2
, 2.6
)*O
ccup
atio
nEm
ploy
ed19
.8(1
5.7,
24.
5)18
.1(1
4.2,
22.
8)1.
6(0
.6, 4
.0)*
5.0
(3.0
, 8.3
)2.
0(0
.9, 4
.4)*
1.9
(0.8
, 4.4
)*Bu
sine
ss26
.8(2
2.9,
31.
1)24
.5(2
0.7,
28.
7)1.
4(0
.5, 3
.5)*
4.8
(3.1
, 7.2
)1.
6(0
.7, 3
.7)*
1.3
(0.5
, 3.5
)*Fa
rmer
s33
.9(2
9.9,
38.
1)30
.4(2
6.6,
34.
5)2.
2(1
.3, 3
.8)*
5.8
(4.0
, 8.4
)1.
5(0
.8, 2
.9)*
1.6
(0.8
, 3.2
)*La
bour
ers
29.9
(26.
2, 3
4.0)
26.0
(22.
4, 2
9.9)
2.6
(1.2
, 5.4
)7.
5(5
.4, 1
0.4)
2.8
(1.4
, 5.5
)2.
3(1
.0, 5
.2)
Stud
ent
1.1
(0.4
, 3.0
)*1.
1(0
.4, 3
.0)*
0.5
(0.1
, 2.1
)*0.
5(0
.1, 2
.1)*
0.5
(0.1
, 2.1
)*0.
3(0
.0, 2
.3)*
Hom
emak
er61
.3(3
8.3,
80.
1)*
61.3
(38.
3, 8
0.1)
*0.
00.
00.
00.
0U
nem
ploy
ed26
.0(2
0.3,
32.
6)22
.6(1
7.5,
28.
7)2.
5(0
.9, 6
.5)*
5.1
(2.5
, 10.
1)*
1.0
(0.3
, 3.3
)*1.
0(0
.3, 3
.3)*
Not
e: C
urre
nt u
se in
clud
es b
oth
daily
and
occ
asio
nal(l
ess
than
dai
ly) u
se.
1 Incl
udes
zar
da, p
an m
asal
aet
c.*
Estim
ate
base
d on
few
er th
an 2
5 u
nwei
ghte
d ca
ses.

34
GATS Bangladesh Report-2009Ta
ble
4.3.
1 (c
ont.
):Pe
rcen
tage
of a
dults
≥15
yea
rs o
ld w
ho a
re c
urre
nt u
sers
of v
ario
us s
mok
eles
s to
bacc
o pr
oduc
ts, b
y ge
nder
and
sel
ecte
d de
mog
raph
icch
arac
teri
stic
s–G
ATS
Bang
lade
sh, 2
009.
Dem
ogra
phic
char
acte
rist
ics
Any
sm
okel
ess
toba
cco
prod
uct
Type
of s
mok
eles
s to
bacc
o Be
tel q
uid
wit
h to
bacc
oSa
da p
ata
Gul
Khoi
nee
Oth
ers1
Perc
enta
ge(9
5% C
I)Fe
mal
e27
.9(2
5.9,
30.
0)25
.2(2
3.1,
27.
3)1.
6(1
.1, 2
.2)
5.1
(4.2
, 6.3
)1.
2(0
.8, 1
.9)
1.2
(0.8
, 1.9
)A
ge(y
ears
)15
-24
4.0
(2.9
, 5.6
)3.
5(2
.5, 4
.8)
0.1
(0.0
, 0.7
)*0.
8(0
.4, 1
.8)*
0.1
(0.0
, 0.5
)*0.
0(0
.0, 0
.2)*
25-4
426
.6(2
3.9,
29.
5)24
.2(2
1.4,
27.
1)1.
2(0
.8, 1
.9)
4.6
(3.6
, 5.9
)1.
1(0
.7, 1
.9)
1.1
(0.7
, 1.7
)45
-64
56.2
(52.
1, 6
0.3)
49.8
(45.
4, 5
4.3)
3.4
(2.1
, 5.4
)12
.1(9
.3, 1
5.6)
2.4
(1.3
, 4.4
)*2.
6(1
.5, 4
.6)
65+
64.1
(56.
3, 7
1.2)
59.5
(51.
4, 6
7.2)
5.9
(3.0
, 11.
3)*
8.0
(4.7
, 13.
1)*
3.2
(1.3
, 7.7
)*4.
2(2
.1, 8
.2)*
Resi
denc
eU
rban
23.4
(20.
6, 2
6.4)
21.7
(19.
1, 2
4.5)
0.9
(0.5
, 1.5
)3.
9(2
.8, 5
.4)
0.8
(0.4
, 1.5
)1.
4(0
.8, 2
.4)
Rura
l29
.6(2
7.1,
32.
1)26
.4(2
3.9,
29.
1)1.
8(1
.2, 2
.7)
5.6
(4.4
, 7.0
)1.
4(0
.8, 2
.2)
1.2
(0.7
, 2.1
)Ed
ucat
ion
leve
lN
o fo
rmal
edu
catio
n48
.2(4
4.6,
51.
8)43
.3(3
9.6,
47.
0)2.
8(1
.9, 4
.1)
8.6
(6.8
, 10.
9)1.
5(0
.9, 2
.6)
1.6
(1.0
, 2.6
)Le
ss th
an p
rim
ary
26.2
(21.
8, 3
1.1)
24.0
(19.
7, 2
8.8)
2.3
(0.9
, 5.7
)*5.
1(3
.1, 8
.1)
2.4
(1.0
, 5.8
)*2.
8(1
.3, 5
.9)*
Prim
ary
22.6
(18.
6, 2
7.1)
20.7
(16.
7, 2
5.4)
0.8
(0.3
, 1.9
)*4.
4(2
.8, 6
.7)
0.7
(0.3
, 1.8
)*0.
7(0
.3, 1
.8)*
Less
than
sec
onda
ry8.
8(6
.9, 1
1.2)
8.2
(6.3
, 10.
5)0.
3(0
.1, 0
.8)*
1.5
(1.0
, 2.4
)*0.
8(0
.3, 2
.0)*
0.5
(0.2
, 1.1
)*Se
cond
ary
and
abov
e5.
4(3
.5, 8
.4)
4.7
(2.8
, 7.6
)0.
1(0
.0, 0
.8)*
0.6
(0.2
, 1.7
)*0.
2(0
.0, 0
.7)*
0.3
(0.1
, 1.2
)*W
ealth
inde
xLo
wes
t37
.6(3
3.6,
41.
8)32
.1(2
8.2,
36.
4)2.
2(1
.3, 3
.8)*
8.0
(6.0
, 10.
7)1.
9(0
.9, 3
.8)*
2.2
(1.1
, 4.2
)*Lo
w30
.2(2
6.5,
34.
2)27
.6(2
4.0,
31.
7)2.
5(1
.6, 4
.0)
5.8
(4.4
, 7.6
)1.
6(0
.9, 2
.8)*
1.4
(0.7
, 2.5
)*M
iddl
e24
.9(2
1.3,
29.
1)22
.9(1
9.5,
26.
8)1.
2(0
.5, 3
.0)*
5.0
(3.0
, 8.2
)1.
0(0
.3, 3
.0)*
1.0
(0.4
, 2.8
)*H
igh
24.5
(21.
5, 2
7.8)
22.2
(19.
3, 2
5.5)
0.8
(0.4
, 1.6
)*4.
2(3
.0, 5
.9)
1.0
(0.4
, 2.3
)*0.
5(0
.3, 1
.1)*
Hig
hest
20.0
(15.
9, 2
4.9)
19.0
(15.
0, 2
3.9)
0.8
(0.2
, 3.4
)*1.
7(1
.0, 3
.0)*
0.2
(0.1
, 0.5
)*1.
1(0
.5, 2
.6)*
Occ
upat
ion
Empl
oyed
11.8
(8.1
, 16.
7)10
.6(7
.2, 1
5.1)
1.0
(0.3
, 3.1
)*3.
2(1
.6, 6
.3)*
1.1
(0.4
, 3.2
)*1.
6(0
.6, 4
.7)*
Busi
ness
61.6
(42.
6, 7
7.6)
*48
.3(2
9.9,
67.
0)*
0.0
24.3
(12.
1, 4
2.8)
*0.
00.
0Fa
rmer
s32
.2(2
1.4,
45.
5)*
25.0
(14.
2, 4
0.3)
*0.
07.
2(0
.7, 4
7.4)
*0.
00.
0La
bour
ers
34.5
(28.
7, 4
0.8)
30.4
(24.
4, 3
7.3)
0.8
(0.3
, 1.9
)*4.
2(2
.4, 7
.2)*
0.6
(0.3
, 1.4
)*1.
1(0
.4, 3
.0)*
Stud
ent
0.9
(0.1
, 6.1
)*0.
9(0
.1, 6
.1)*
0.0
0.0
0.0
0.0
Hom
emak
er29
.1(2
6.8,
31.
4)26
.3(2
4.0,
28.
7)1.
7(1
.1, 2
.5)
5.7
(4.7
, 7.0
)1.
4(0
.9, 2
.2)
1.3
(0.8
, 2.0
)U
nem
ploy
ed41
.4(3
0.4,
53.
3)38
.7(2
8.1,
50.
6)4.
0(1
.2, 1
2.5)
*2.
9(1
.1, 7
.4)*
1.0
(0.1
, 6.7
)*2.
6(0
.8, 7
.8)*
Not
e: C
urre
nt u
se in
clud
es b
oth
daily
and
occ
asio
nal(l
ess
than
dai
ly) u
se.
1 Incl
udes
zar
da, p
an m
asal
aet
c.*
Estim
ate
base
d on
few
er th
an 2
5 u
nwei
ghte
d ca
ses.
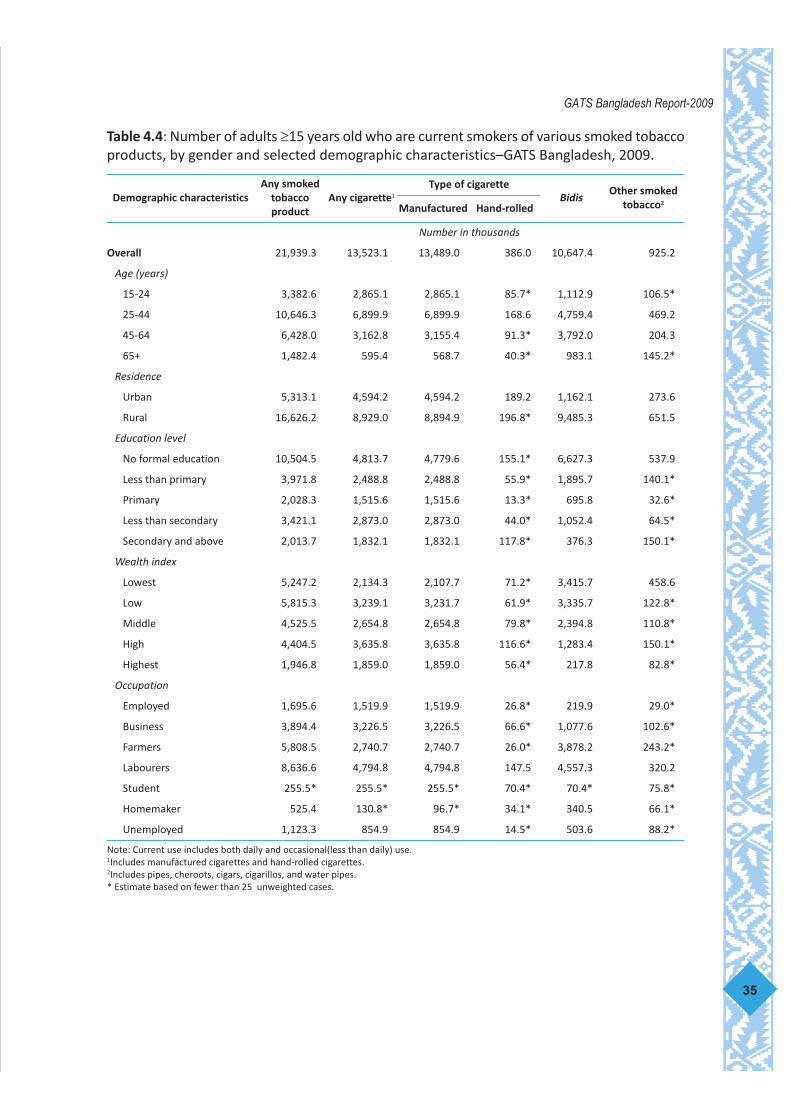
Table 4.4: Number of adults ≥15 years old who are current smokers of various smoked tobaccoproducts, by gender and selected demographic characteristics–GATS Bangladesh, 2009.
35
GATS Bangladesh Report-2009
Demographic characteristicsAny smoked
tobaccoproduct
Any cigarette1
Type of cigaretteBidis
Other smokedtobacco2
Manufactured Hand-rolled
Number in thousands
Overall 21,939.3 13,523.1 13,489.0 386.0 10,647.4 925.2
Age (years)
15-24 3,382.6 2,865.1 2,865.1 85.7* 1,112.9 106.5*
25-44 10,646.3 6,899.9 6,899.9 168.6 4,759.4 469.2
45-64 6,428.0 3,162.8 3,155.4 91.3* 3,792.0 204.3
65+ 1,482.4 595.4 568.7 40.3* 983.1 145.2*
Residence
Urban 5,313.1 4,594.2 4,594.2 189.2 1,162.1 273.6
Rural 16,626.2 8,929.0 8,894.9 196.8* 9,485.3 651.5
Education level
No formal education 10,504.5 4,813.7 4,779.6 155.1* 6,627.3 537.9
Less than primary 3,971.8 2,488.8 2,488.8 55.9* 1,895.7 140.1*
Primary 2,028.3 1,515.6 1,515.6 13.3* 695.8 32.6*
Less than secondary 3,421.1 2,873.0 2,873.0 44.0* 1,052.4 64.5*
Secondary and above 2,013.7 1,832.1 1,832.1 117.8* 376.3 150.1*
Wealth index
Lowest 5,247.2 2,134.3 2,107.7 71.2* 3,415.7 458.6
Low 5,815.3 3,239.1 3,231.7 61.9* 3,335.7 122.8*
Middle 4,525.5 2,654.8 2,654.8 79.8* 2,394.8 110.8*
High 4,404.5 3,635.8 3,635.8 116.6* 1,283.4 150.1*
Highest 1,946.8 1,859.0 1,859.0 56.4* 217.8 82.8*
Occupation
Employed 1,695.6 1,519.9 1,519.9 26.8* 219.9 29.0*
Business 3,894.4 3,226.5 3,226.5 66.6* 1,077.6 102.6*
Farmers 5,808.5 2,740.7 2,740.7 26.0* 3,878.2 243.2*
Labourers 8,636.6 4,794.8 4,794.8 147.5 4,557.3 320.2
Student 255.5* 255.5* 255.5* 70.4* 70.4* 75.8*
Homemaker 525.4 130.8* 96.7* 34.1* 340.5 66.1*
Unemployed 1,123.3 854.9 854.9 14.5* 503.6 88.2*
Note: Current use includes both daily and occasional(less than daily) use.1Includes manufactured cigarettes and hand-rolled cigarettes.2Includes pipes, cheroots, cigars, cigarillos, and water pipes.* Estimate based on fewer than 25 unweighted cases.
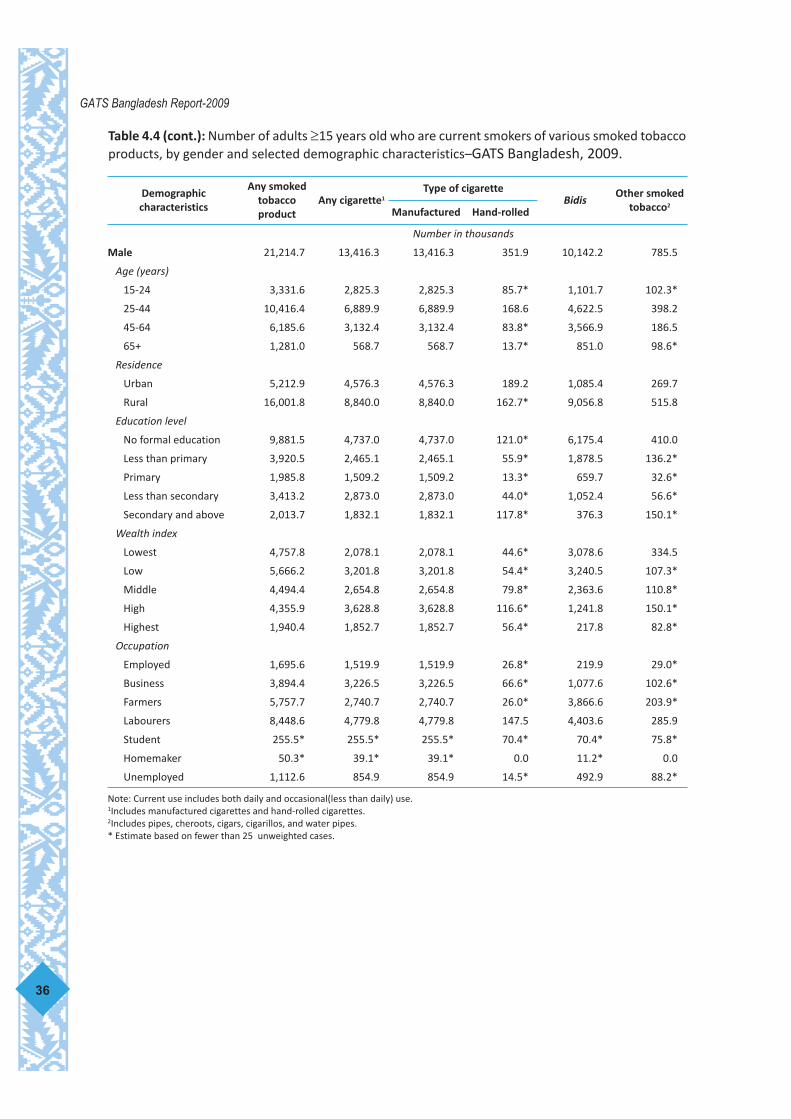
Table 4.4 (cont.): Number of adults ≥15 years old who are current smokers of various smoked tobaccoproducts, by gender and selected demographic characteristics–GATS Bangladesh, 2009.
36
GATS Bangladesh Report-2009
Demographiccharacteristics
Any smokedtobaccoproduct
Any cigarette1Type of cigarette
BidisOther smoked
tobacco2Manufactured Hand-rolled
Number in thousands
Male 21,214.7 13,416.3 13,416.3 351.9 10,142.2 785.5
Age (years)
15-24 3,331.6 2,825.3 2,825.3 85.7* 1,101.7 102.3*
25-44 10,416.4 6,889.9 6,889.9 168.6 4,622.5 398.2
45-64 6,185.6 3,132.4 3,132.4 83.8* 3,566.9 186.5
65+ 1,281.0 568.7 568.7 13.7* 851.0 98.6*
Residence
Urban 5,212.9 4,576.3 4,576.3 189.2 1,085.4 269.7
Rural 16,001.8 8,840.0 8,840.0 162.7* 9,056.8 515.8
Education level
No formal education 9,881.5 4,737.0 4,737.0 121.0* 6,175.4 410.0
Less than primary 3,920.5 2,465.1 2,465.1 55.9* 1,878.5 136.2*
Primary 1,985.8 1,509.2 1,509.2 13.3* 659.7 32.6*
Less than secondary 3,413.2 2,873.0 2,873.0 44.0* 1,052.4 56.6*
Secondary and above 2,013.7 1,832.1 1,832.1 117.8* 376.3 150.1*
Wealth index
Lowest 4,757.8 2,078.1 2,078.1 44.6* 3,078.6 334.5
Low 5,666.2 3,201.8 3,201.8 54.4* 3,240.5 107.3*
Middle 4,494.4 2,654.8 2,654.8 79.8* 2,363.6 110.8*
High 4,355.9 3,628.8 3,628.8 116.6* 1,241.8 150.1*
Highest 1,940.4 1,852.7 1,852.7 56.4* 217.8 82.8*
Occupation
Employed 1,695.6 1,519.9 1,519.9 26.8* 219.9 29.0*
Business 3,894.4 3,226.5 3,226.5 66.6* 1,077.6 102.6*
Farmers 5,757.7 2,740.7 2,740.7 26.0* 3,866.6 203.9*
Labourers 8,448.6 4,779.8 4,779.8 147.5 4,403.6 285.9
Student 255.5* 255.5* 255.5* 70.4* 70.4* 75.8*
Homemaker 50.3* 39.1* 39.1* 0.0 11.2* 0.0
Unemployed 1,112.6 854.9 854.9 14.5* 492.9 88.2*
Note: Current use includes both daily and occasional(less than daily) use.1Includes manufactured cigarettes and hand-rolled cigarettes.2Includes pipes, cheroots, cigars, cigarillos, and water pipes.* Estimate based on fewer than 25 unweighted cases.

Table 4.4 (cont.): Number of adults≥15 years old who are current smokers of various smoked tobaccoproducts, by gender and selected demographic characteristics–GATS Bangladesh, 2009.
37
GATS Bangladesh Report-2009
Demographiccharacteristics
Any smokedtobaccoproduct
Any cigarette1Type of cigarette
BidisOther smoked
tobacco2Manufactured Hand-rolled
Number in thousands
Female 724.6 106.8* 72.8* 34.1* 505.2 139.6*
Age (years)
15-24 51.0* 39.8* 39.8* 0.0 11.2* 4.3*
25-44 229.9 10.0* 10.0* 0.0 136.9* 71.0*
45-64 242.3 30.4* 22.9* 7.5* 225.1 17.8*
65+ 201.4* 26.6* 0.0 26.6* 132.0* 46.6*
Residence
Urban 100.2 17.9* 17.9* 0.0 76.7* 3.9*
Rural 624.4 88.9* 54.9* 34.1* 428.5 135.7*
Education level
No formal education 623.0 76.7* 42.7* 34.1* 451.9 127.8*
Less than primary 51.3* 23.7* 23.7* 0.0 17.2* 3.9*
Primary 42.5* 6.4* 6.4* 0.0 36.1* 0.0
Less than secondary 7.9* 0.0 0.0 0.0 0.0 7.9*
Secondary and above 0.0 0.0 0.0 0.0 0.0 0.0
Wealth index
Lowest 489.4 56.2* 29.6* 26.6* 337.2 124.1*
Low 149.1* 37.3* 29.8* 7.5* 95.2* 15.5*
Middle 31.1* 0.0 0.0 0.0 31.1* 0.0
High 48.6* 7.0* 7.0* 0.0 41.7* 0.0
Highest 6.4* 6.4* 6.4* 0.0 0.0 0.0
Occupation
Employed 0.0 0.0 0.0 0.0 0.0 0.0
Business 0.0 0.0 0.0 0.0 0.0 0.0
Farmers 50.8* 0.0 0.0 0.0 11.5* 39.3*
Labourers 188.0* 15.1* 15.1* 0.0 153.8* 34.3*
Student 0.0 0.0 0.0 0.0 0.0 0.0
Homemaker 475.1 91.8* 57.7* 34.1* 329.2 66.1*
Unemployed 10.7* 0.0 0.0 0.0 10.7* 0.0
Note: Current use includes both daily and occasional(less than daily) use.1Includes manufactured cigarettes and hand-rolled cigarettes.2Includes pipes, cheroots, cigars, cigarillos, and water pipes.* Estimate based on fewer than 25 unweighted cases.

Table 4.4.1: Number of adults ≥15 years old who are current users of various smokelesstobacco products, by gender and selected demographic characteristics–GATS Bangladesh,2009.
38
GATS Bangladesh Report-2009
Demographiccharacteristics
Any smokelesstobacco product
Type of smokeless tobaccoBetel quid with
tobacco Sada pata Gul Khoinee Others1
Number in thousands
Overall 25,914.0 23,227.8 1,695.9 5,068.2 1,458.0 1,374.0
Age (years)
15-24 1,863.8 1,660.9 94.5* 350.8 117.0* 75.6*
25-44 11,022.0 9,819.0 497.0 2,312.5 539.0 451.0
45-64 9,469.5 8,511.5 807.2 1,953.5 665.7 668.2
65+ 3,558.8 3,236.5 297.3 451.3 136.3* 179.2*
Residence
Urban 5,611.5 5,115.4 369.8 1,180.2 374.7 371.7
Rural 20,302.5 18,112.4 1,326.1 3,887.9 1,083.3 1,002.3
Education level
No formal education 14,294.9 12,653.7 794.6 2,611.1 556.1 523.4
Less than primary 4,287.9 3,912.3 409.5 928.2 386.1 360.0
Primary 2,890.4 2,609.2 100.9* 564.9 114.2* 129.3*
Less than secondary 2,761.2 2,566.1 187.8* 500.3 202.5* 174.0*
Secondary and above 1,429.1 1,303.0 203.1* 376.3 199.2* 187.3*
Wealth index
Lowest 6,491.0 5,629.2 291.9 1,226.8 276.9 266.8
Low 6,703.2 5,952.1 527.0 1,329.9 314.9 260.6
Middle 5,127.4 4,689.5 366.0 1,126.4 347.2 367.4
High 5,117.9 4,660.4 379.1 1,016.5 405.6 348.5
Highest 2,474.4 2,296.5 131.9* 368.6 113.4* 130.9*
Occupation
Employed 1,080.0 985.3 89.8* 277.6 106.4* 111.3*
Business 2,482.3 2,250.4 119.3* 475.3 138.8* 116.6*
Farmers 3,746.6 3,358.5 243.0* 644.4 167.4* 172.2*
Labourers 5,960.6 5,194.4 431.5 1,313.0 453.5 399.3
Student 76.2* 76.2* 23.3* 23.3* 23.3* 14.5*
Homemaker 10,939.9 9,895.2 633.1 2,118.2 517.9 480.4
Unemployed 1,618.0 1,461.4 155.9* 216.3* 50.7* 79.6*
Note: Current use includes both daily and occasional(less than daily) use.1Includes zarda, pan masala etc.* Estimate based on fewer than 25 unweighted cases.

Table 4.4.1 (cont.): Number of adults ≥15 years old who are current users of various smokeless tobaccoproducts, by gender and selected demographic characteristics–GATS Bangladesh, 2009.
39
GATS Bangladesh Report-2009
Demographiccharacteristics
Any smokelesstobaccoproduct
Type of smokeless tobacco
Betel quid withtobacco
Sada pata Gul Khoinee Others1
Number in thousands
Male 12,511.3 11,151.0 939.6 2,605.4 879.5 777.9
Age (years)
15-24 1,291.0 1,169.2 80.8* 232.3* 103.0* 72.1*
25-44 5,294.9 4,612.0 241.6 1,323.4 291.9 224.6
45-64 4,308.4 3,936.7 497.4 840.3 445.4 429.4
65+ 1,617.1 1,433.0 119.7* 209.4* 39.3* 51.8*
Residence
Urban 2,671.9 2,385.1 258.5 686.9 274.1 199.3
Rural 9,839.4 8,765.9 681.1 1,918.5 605.4 578.5
Education level
No formal education 5,630.9 4,869.6 285.0 1,059.9 280.3 228.0
Less than primary 2,540.2 2,312.9 253.2* 591.5 226.5* 176.3*
Primary 1,379.1 1,220.7 49.4* 272.1 68.8* 82.5*
Less than secondary 1,831.3 1,702.6 154.6* 340.0 114.7* 119.5*
Secondary and above 1,129.9 1,045.1 197.3* 341.8 189.2* 171.7*
Wealth index
Lowest 2,761.2 2,446.0 70.3* 430.9 88.0* 52.3*
Low 3,391.7 2,921.6 251.8* 694.6 136.7* 112.1*
Middle 2,767.6 2,519.3 252.2 656.7 253.9 270.1
High 2,561.4 2,343.9 293.5* 578.5 300.9 291.2*
Highest 1,029.4 920.2 71.8* 244.6 100.0* 52.2*
Occupation
Employed 905.4 828.7 74.9* 229.6 89.6* 87.0*
Business 2,323.1 2,125.7 119.3* 412.4 138.8* 116.6*
Farmers 3,690.3 3,314.8 243.0* 631.8 167.4* 172.2*
Labourers 4,598.9 3,992.8 401.3 1,148.5 428.8 357.6
Student 50.0* 50.0* 23.3* 23.3* 23.3* 14.5*
Homemaker 126.1* 126.1* 0.0 0.0 0.0 0.0
Unemployed 811.2 706.5 77.8* 159.7* 31.8* 29.9*
Note: Current use includes both daily and occasional(less than daily) use.1Includes zarda, pan masala etc.* Estimate based on fewer than 25 unweighted cases.
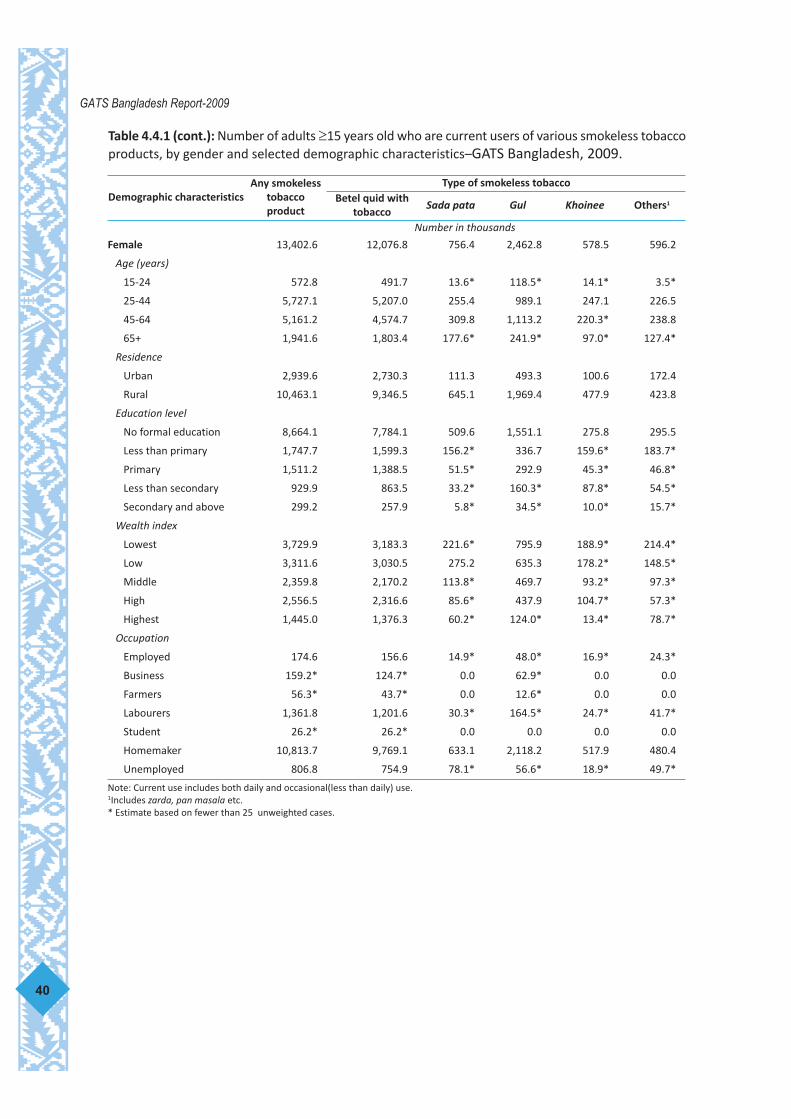
Table 4.4.1 (cont.): Number of adults ≥15 years old who are current users of various smokeless tobaccoproducts, by gender and selected demographic characteristics–GATS Bangladesh, 2009.
40
GATS Bangladesh Report-2009
Demographic characteristicsAny smokeless
tobaccoproduct
Type of smokeless tobaccoBetel quid with
tobaccoSada pata Gul Khoinee Others1
Number in thousands
Female 13,402.6 12,076.8 756.4 2,462.8 578.5 596.2
Age (years)
15-24 572.8 491.7 13.6* 118.5* 14.1* 3.5*
25-44 5,727.1 5,207.0 255.4 989.1 247.1 226.5
45-64 5,161.2 4,574.7 309.8 1,113.2 220.3* 238.8
65+ 1,941.6 1,803.4 177.6* 241.9* 97.0* 127.4*
Residence
Urban 2,939.6 2,730.3 111.3 493.3 100.6 172.4
Rural 10,463.1 9,346.5 645.1 1,969.4 477.9 423.8
Education level
No formal education 8,664.1 7,784.1 509.6 1,551.1 275.8 295.5
Less than primary 1,747.7 1,599.3 156.2* 336.7 159.6* 183.7*
Primary 1,511.2 1,388.5 51.5* 292.9 45.3* 46.8*
Less than secondary 929.9 863.5 33.2* 160.3* 87.8* 54.5*
Secondary and above 299.2 257.9 5.8* 34.5* 10.0* 15.7*
Wealth index
Lowest 3,729.9 3,183.3 221.6* 795.9 188.9* 214.4*
Low 3,311.6 3,030.5 275.2 635.3 178.2* 148.5*
Middle 2,359.8 2,170.2 113.8* 469.7 93.2* 97.3*
High 2,556.5 2,316.6 85.6* 437.9 104.7* 57.3*
Highest 1,445.0 1,376.3 60.2* 124.0* 13.4* 78.7*
Occupation
Employed 174.6 156.6 14.9* 48.0* 16.9* 24.3*
Business 159.2* 124.7* 0.0 62.9* 0.0 0.0
Farmers 56.3* 43.7* 0.0 12.6* 0.0 0.0
Labourers 1,361.8 1,201.6 30.3* 164.5* 24.7* 41.7*
Student 26.2* 26.2* 0.0 0.0 0.0 0.0
Homemaker 10,813.7 9,769.1 633.1 2,118.2 517.9 480.4
Unemployed 806.8 754.9 78.1* 56.6* 18.9* 49.7*
Note: Current use includes both daily and occasional(less than daily) use.1Includes zarda, pan masala etc.* Estimate based on fewer than 25 unweighted cases.

4.5 Tobacco use frequency
4.5.1 Frequency of cigarette smoking
Table 4.5A reports frequency of cigarette smoking as three standard categories, “daily cigarettesmokers”, “occasional cigarette smokers” and “non-smokers of cigarettes” (the third categorymay include persons who smoke bidis.) The percentages of adults aged 15 years and over whoare daily cigarette smokers, occasional cigarette smokers and non-smokers of cigarettes are12.5%, 1.7% and 85.8%, respectively. The percentage of daily smokers among males is 25.0%and for females it is 0.2% (fewer than 25 respondents.) The percentage of male occasionalsmokers is 3.3%; 71.7% of males are non-smokers of cigarettes. Among females, 0% identifiedthemselves as occasional smokers and 99.8% were non-smokers of cigarettes.
Given the low prevalence of cigarette smoking among females (0.2%) as compared tomales (25.0%), data by demographic characteristics is provided below for males. Please note,table 4.5A also provides this data for the overall sample and for females, though cigarettesmoking among females in Bangladesh is very low.
Among males, by age group, the highest percentages of daily cigarette smokers are in the25-44 years and 45-64 years age groups (30.9% and 27.5%). The highest percentages ofoccasional cigarette smokers are in the 25-44 year age group and among those 65 or moreyears of age (4.3% and 3.4%). Among young people 15-24 years of age, 3.1% were occasionalcigarette smokers.
Among males, by residence, the percentage of daily cigarette smokers in urban areas(33.1%) is higher than that found in rural areas (22.1%). However, the distribution of occasionalcigarette smokers is similar by residence (3.8% urban, 3.2% rural). The percentage of ruralmale non-smokers of cigarettes is higher than urban non-cigarette smokers (74.7% and 63.1%,respectively).
Among males, smoking was reported more among those less educated (no formaleducation, less than primary, and less than secondary education, 27.1%, 27.4% and 27.8%,respectively) as compared to secondary and above (17.0%). By wealth index, 27.6% of malesin the high SES category reported daily cigarette smoking; the distribution among other SEScategories was similar (23.8% to 24.9%). Males in the high wealth index category also reportedthe highest occasional cigarette smoking (5.1%). By occupation, males who identified theiroccupation as business have the highest prevalence of daily cigarette smoking (32.7%); farmers(22.3%) and the unemployed (23.8%) report the lowest (note that students and homemakerslacked adequate cell size for inclusion.)
41
GATS Bangladesh Report-2009

Table 4.5A: Percentage distribution of adults ≥15 years old, by cigarette smoking frequency, gender andselected demographic characteristics–GATS Bangladesh, 2009.
42
GATS Bangladesh Report-2009
Demographiccharacteristics
Frequency of cigarette smokingTotal
Daily Occasional1 Non-smoker of cigarettes
Percentage (95% CI)
Overall 12.5 (11.6, 13.5) 1.7 ( 1.3, 2.1) 85.8 (84.8, 86.8) 100
Age (years)
15-24 8.6 ( 7.0, 10.6) 1.6 ( 0.9, 2.6) 89.8 (87.8, 91.5) 100
25-44 14.7 (13.5, 16.1) 2.0 ( 1.5, 2.8) 83.2 (81.7, 84.7) 100
45-64 14.9 (13.0, 17.0) 1.0 ( 0.6, 1.8)* 84.1 (81.9, 86.0) 100
65+ 7.7 ( 5.5, 10.5) 1.8 ( 0.7, 4.2)* 90.6 (87.3, 93.0) 100
Residence
Urban 16.5 (15.1, 18.0) 1.9 ( 1.4, 2.6) 81.6 (80.1, 83.1) 100
Rural 11.1 (10.0, 12.3) 1.6 ( 1.2, 2.1) 87.3 (86.0, 88.5) 100
Education level
No formal education 12.9 (11.4, 14.5) 1.4 ( 0.9, 2.1) 85.7 (84.0, 87.3) 100
Less than primary 15.3 (13.0, 18.0) 1.3 ( 0.8, 2.3)* 83.3 (80.6, 85.7) 100
Primary 11.8 ( 9.4, 14.7) 1.3 ( 0.6, 2.7)* 87.0 (83.9, 89.5) 100
Less than secondary 12.1 (10.4, 14.1) 1.9 ( 1.1, 3.2) 86.0 (83.9, 87.8) 100
Secondary and above 10.3 ( 8.4, 12.6) 2.7 ( 1.6, 4.4) 87.0 (84.3, 89.3) 100
Wealth index
Lowest 11.2 ( 9.0, 13.8) 0.7 ( 0.4, 1.3)* 88.1 (85.5, 90.3) 100
Low 12.7 (10.9, 14.8) 1.9 ( 1.2, 2.9) 85.4 (83.3, 87.2) 100
Middle 12.1 (10.2, 14.2) 1.6 ( 1.0, 2.5)* 86.4 (84.2, 88.3) 100
High 14.3 (12.5, 16.2) 2.6 ( 1.6, 4.2) 83.1 (80.9, 85.1) 100
Highest 11.8 (10.1, 13.7) 1.3 ( 0.9, 1.8) 87.0 (85.0, 88.7) 100
Occupation
Employed 21.4 (17.7, 25.6) 3.7 ( 2.3, 5.8) 75.0 (70.2, 79.2) 100
Business 31.7 (28.3, 35.4) 4.4 ( 2.7, 7.1) 63.9 (60.0, 67.6) 100
Farmers 21.9 (18.4, 25.9) 2.8 ( 1.7, 4.7)* 75.2 (71.3, 78.8) 100
Labourers 22.5 (19.4, 25.8) 2.4 ( 1.6, 3.5) 75.2 (71.9, 78.2) 100
Student 2.6 ( 1.0, 6.7)* 0.8 ( 0.2, 3.5)* 96.6 (92.5, 98.5) 100
Homemaker 0.2 ( 0.1, 0.6)* 0.1 ( 0.0, 0.6)* 99.7 (99.2, 99.8) 100
Unemployed 14.7 (10.1, 20.7) 2.2 ( 1.1, 4.2)* 83.2 (77.2, 87.8) 1001Occasional refers to less than daily use.* Estimate based on fewer than 25 unweighted cases.

Table 4.5A (cont.): Percentage distribution of adults ≥15 years old, by cigarette smoking frequency,gender and selected demographic characteristics–GATS Bangladesh, 2009.
43
GATS Bangladesh Report-2009
Demographiccharacteristics
Frequency of cigarette smokingTotal
Daily Occasional1 Non-smoker of cigarettes
Percentage (95% CI)
Male 25.0 (23.1, 26.9) 3.3 ( 2.6, 4.2) 71.7 (69.6, 73.7) 100
Age (years)
15-24 17.3 (14.0, 21.1) 3.1 ( 1.8, 5.1) 79.7 (75.7, 83.1) 100
25-44 30.9 (28.2, 33.7) 4.3 ( 3.2, 5.7) 64.9 (61.8, 67.7) 100
45-64 27.5 (24.1, 31.1) 1.9 ( 1.0, 3.3)* 70.7 (67.0, 74.1) 100
65+ 13.9 (10.1, 18.9) 3.4 ( 1.4, 8.0)* 82.7 (77.0, 87.1) 100
Residence
Urban 33.1 (30.5, 35.9) 3.8 ( 2.8, 5.2) 63.0 (60.2, 65.8) 100
Rural 22.1 (19.8, 24.5) 3.2 ( 2.3, 4.3) 74.8 (72.2, 77.2) 100
Education level
No formal education 27.1 (23.9, 30.5) 3.0 ( 2.0, 4.4) 70.0 (66.4, 73.3) 100
Less than primary 27.4 (23.3, 32.0) 2.4 ( 1.4, 4.1)* 70.2 (65.6, 74.3) 100
Primary 27.8 (22.6, 33.6) 2.9 ( 1.3, 6.1)* 69.4 (63.3, 74.8) 100
Less than secondary 25.0 (21.6, 28.8) 3.9 ( 2.3, 6.6) 71.1 (67.0, 74.8) 100
Secondary and above 17.0 (13.8, 20.6) 4.5 ( 2.7, 7.2) 78.6 (74.4, 82.3) 100
Wealth index
Lowest 24.3 (19.8, 29.4) 1.4 ( 0.7, 2.8)* 74.2 (69.2, 78.7) 100
Low 24.9 (21.4, 28.8) 3.7 ( 2.4, 5.7) 71.4 (67.4, 75.0) 100
Middle 23.4 (19.7, 27.6) 3.1 ( 1.9, 4.9)* 73.5 (69.4, 77.3) 100
High 27.6 (24.3, 31.1) 5.1 ( 3.2, 8.1) 67.3 (63.4, 71.0) 100
Highest 23.8 (20.5, 27.4) 2.4 ( 1.7, 3.5) 73.8 (70.1, 77.2) 100
Occupation
Employed 28.3 (23.6, 33.6) 4.8 ( 3.1, 7.6) 66.8 (61.0, 72.2) 100
Business 32.7 (29.1, 36.5) 4.5 ( 2.8, 7.3) 62.8 (58.8, 66.6) 100
Farmers 22.3 (18.6, 26.4) 2.9 ( 1.7, 4.8)* 74.8 (70.7, 78.6) 100
Labourers 28.2 (24.5, 32.2) 2.9 ( 1.9, 4.4) 68.9 (64.9, 72.6) 100
Student 4.3 ( 1.6, 10.9)* 1.3 ( 0.3, 5.6)* 94.4 (87.9, 97.5) 100
Homemaker 1.9 ( 0.2, 14.1)* 17.1 ( 3.7, 52.4)* 81.0 (48.8, 95.0)* 100
Unemployed 23.8 (16.8, 32.5) 3.6 ( 1.8, 6.9)* 72.7 (64.1, 79.8) 1001Occasional refers to less than daily use.* Estimate based on fewer than 25 unweighted cases.

Table 4.5A (cont.): Percentage distribution of adults ≥15 years old, by cigarette smoking frequency,gender and selected demographic characteristics–GATS Bangladesh, 2009.
44
GATS Bangladesh Report-2009
Demographiccharacteristics
Frequency of cigarette smokingTotal
Daily Occasional1 Non-smoker of cigarettes
Percentage (95% CI)
Female 0.2 ( 0.1, 0.5)* 0.0 ( 0.0, 0.1)* 99.8 (99.5, 99.9) 100
Age (years)
15-24 0.2 ( 0.0, 1.0)* 0.1 ( 0.0, 0.3)* 99.7 (99.0, 99.9) 100
25-44 0.0 ( 0.0, 0.1)* 0.0 100.0 (99.9, 100) 100
45-64 0.3 ( 0.1, 0.9)* 0.0 99.7 (99.1, 99.9) 100
65+ 0.9 ( 0.1, 5.9)* 0.0 99.1 (94.1, 99.9) 100
Residence
Urban 0.1 ( 0.0, 0.3)* 0.1 ( 0.0, 0.4)* 99.9 (99.6, 99.9) 100
Rural 0.2 ( 0.1, 0.6)* 0.0 ( 0.0, 0.1)* 99.7 (99.4, 99.9) 100
Education level
No formal education 0.4 ( 0.2, 1.0)* 0.0 ( 0.0, 0.2)* 99.6 (99.0, 99.8) 100
Less than primary 0.4 ( 0.0, 2.5)* 0.0 99.6 (97.5, 100) 100
Primary 0.0 0.1 ( 0.0, 0.7)* 99.9 (99.3, 100) 100
Less than secondary 0.0 0.0 100.0 100
Secondary and above 0.0 0.0 100.0 100
Wealth index
Lowest 0.5 ( 0.2, 1.6)* 0.0 ( 0.0, 0.3)* 99.4 (98.3, 99.8) 100
Low 0.3 ( 0.1, 1.3)* 0.0 99.7 (98.7, 99.9) 100
Middle 0.0 0.0 100.0 100
High 0.1 ( 0.0, 0.5)* 0.0 99.9 (99.5, 100) 100
Highest 0.0 0.1 ( 0.0, 0.6)* 99.9 (99.4, 100) 100
Occupation
Employed 0.0 0.0 100.0 100
Business 0.0 0.0 100.0 100
Farmers 0.0 0.0 100.0 * 100
Labourers 0.3 ( 0.0, 1.9)* 0.1 ( 0.0, 0.8)* 99.6 (97.3, 99.9) 100
Student 0.0 0.0 100.0 100
Homemaker 0.2 ( 0.1, 0.6)* 0.0 ( 0.0, 0.1)* 99.8 (99.4, 99.9) 100
Unemployed 0.0 0.0 100.0 1001Occasional refers to less than daily use.* Estimate based on fewer than 25 unweighted cases.
4.5.2 Frequency of bidi smoking
Table 4.5B reports frequency of bidi smoking as three standard categories, “daily smokers”,“occasional smokers” and “non-smokers of bidis” (the third category may include persons whosmoke cigarettes.) The percentages of adults aged 15 years and over who are daily bidismokers, occasional bidi smokers and non-smokers of bidis were 10.6%, 0.6% and 88.8%,respectively. The percentage of male daily bidi smokers was 20.3% and for females it was1.0%. The percentage of male occasional bidi smokers was 1.1%, 78.6% of males were non-smokers of bidis. Among females, 0.1% identified themselves as occasional bidi smokers (cellsize fewer than 25 respondents) and 98.9% were non-smokers of bidis cigarettes.
Among males, by age group, the highest percentage of daily bidi smokers was among thoseaged 45-64 years (32.7%) and the lowest was among the youngest age group 15-24 (7.0%). Allage categories reported fewer than 25 respondents per cell for occasional bidi smoking.
Among males, by residence, the percentage of daily bidi smokers in rural areas (24.6%) ishigher than that found in rural areas (7.9%), and 1.2% of rural males report occasional bidismoking. The percentage of urban male non-smokers of bidi is higher than rural non-bidismokers (91.2% and 74.2%, respectively).
Among males, by educational levels, the percentages of daily bidi smokers was higheramong males with no formal education (37.1%) and those with less than primary education(22.2%). Males who had secondary education and above have the lowest prevalence of dailybidi smoking (3.5%). Males with no formal education also have the highest percentage ofoccasional bidi smoking (2.0%). By wealth index, males in the lowest category reported thehighest prevalence of daily bidi smoking (36.6%). By occupation, males who identified theiroccupation as farmers have the highest prevalence of daily bidi smoking (smoking (34.6%),followed by labourers (27.3%) and the unemployed (14.0%).
45
GATS Bangladesh Report-2009

Table 4.5B: Percentage distribution of adults ≥15 years old, by bidi smoking frequency, gender andselected demographic characteristics–GATS Bangladesh, 2009.
46
GATS Bangladesh Report-2009
Demographiccharacteristics
Frequency of bidi smokingTotal
Daily Occasional1 Non-smoker of bidis
Percentage (95% CI)
Overall 10.6 (9.5, 11.8) 0.6 (0.4, 0.8) 88.8 (87.6, 90.0) 100
Age (years)
15-24 3.5 ( 2.5, 4.9) 0.5 ( 0.2, 1.2)* 96.0 (94.5, 97.2) 100
25-44 11.0 ( 9.6, 12.6) 0.5 ( 0.3, 0.8)* 88.4 (86.8, 89.9) 100
45-64 18.6 (16.3, 21.3) 0.5 ( 0.2, 0.9)* 80.9 (78.2, 83.3) 100
65+ 13.6 (10.3, 17.7) 2.0 ( 0.9, 4.3)* 84.4 (80.2, 87.9) 100
Residence
Urban 4.2 ( 3.2, 5.4) 0.5 ( 0.2, 1.0)* 95.3 (94.2, 96.3) 100
Rural 12.8 (11.5, 14.3) 0.6 ( 0.4, 0.9) 86.5 (85.0, 88.0) 100
Education level
No formal education 18.6 (16.6, 20.7) 1.1 ( 0.7, 1.6) 80.4 (78.2, 82.4) 100
Less than primary 12.4 (10.2, 15.0) 0.3 ( 0.1, 0.9)* 87.3 (84.7, 89.5) 100
Primary 5.9 ( 4.4, 7.9) 0.1 ( 0.0, 0.5)* 94.0 (92.0, 95.6) 100
Less than secondary 4.8 ( 3.6, 6.4) 0.3 ( 0.1, 1.1)* 94.9 (93.2, 96.2) 100
Secondary and above 2.1 ( 1.4, 3.2) 0.6 ( 0.2, 2.0)* 97.3 (95.7, 98.3) 100
Wealth index
Lowest 18.2 (15.8, 20.8) 0.8 ( 0.5, 1.4)* 81.0 (78.4, 83.4) 100
Low 14.1 (12.2, 16.3) 0.9 ( 0.5, 1.7)* 84.9 (82.7, 86.9) 100
Middle 11.8 ( 9.6, 14.4) 0.5 ( 0.2, 1.3)* 87.7 (85.0, 90.0) 100
High 5.6 ( 4.4, 7.0) 0.4 ( 0.1, 1.2)* 94.0 (92.5, 95.3) 100
Highest 1.4 ( 0.8, 2.3)* 0.1 ( 0.0, 0.6)* 98.5 (97.5, 99.1) 100
Occupation
Employed 3.6 ( 2.3, 5.7) 0.0 96.4 (94.3, 97.7) 100
Business 10.8 ( 8.4, 13.8) 1.2 ( 0.5, 3.2)* 87.9 (84.8, 90.5) 100
Farmers 34.2 (29.8, 38.9) 0.8 ( 0.4, 1.8)* 65.0 (60.2, 69.4) 100
Labourers 22.5 (19.6, 25.6) 1.1 ( 0.7, 1.8)* 76.4 (73.1, 79.4) 100
Student 0.2 ( 0.0, 1.4)* 0.7 ( 0.2, 3.6)* 99.1 (96.5, 99.7) 100
Homemaker 0.8 ( 0.6, 1.3) 0.1 ( 0.0, 0.2)* 99.1 (98.6, 99.4) 100
Unemployed 8.8 ( 5.4, 14.0) 1.1 ( 0.5, 2.6)* 90.1 (84.9, 93.6) 1001Occasional refers to less than daily use.* Estimate based on fewer than 25 unweighted cases.

Table 4.5B (cont.): Percentage distribution of adults ≥15 years old, by bidi smoking frequency, genderand selected demographic characteristics–GATS Bangladesh, 2009.
47
GATS Bangladesh Report-2009
Demographiccharacteristics
Frequency of bidi smokingTotal
Daily Occasional1 Non-smoker of bidis
Percentage (95% CI)
Male 20.3 (18.2, 22.6) 1.1 (0.8, 1.6) 78.6 (76.3, 80.8) 100
Age (years)
15-24 7.0 ( 4.9, 9.9) 0.9 ( 0.3, 2.5)* 92.1 (88.9, 94.4) 100
25-44 22.6 (19.9, 25.6) 1.0 ( 0.6, 1.6)* 76.4 (73.4, 79.2) 100
45-64 32.7 (28.5, 37.1) 0.7 ( 0.4, 1.5)* 66.6 (62.1, 70.8) 100
65+ 22.1 (17.0, 28.2) 3.8 ( 1.7, 8.1)* 74.0 (67.7, 79.5) 100
Residence
Urban 7.9 ( 6.0, 10.2) 0.9 ( 0.4, 1.9)* 91.2 (89.1, 93.0) 100
Rural 24.6 (21.9, 27.6) 1.2 ( 0.8, 1.8) 74.2 (71.1, 77.0) 100
Education level
No formal education 37.1 (33.4, 41.0) 2.0 ( 1.3, 3.1) 60.8 (56.9, 64.6) 100
Less than primary 22.2 (18.1, 26.8) 0.6 ( 0.2, 1.7)* 77.3 (72.6, 81.3) 100
Primary 13.2 ( 9.8, 17.6) 0.2 ( 0.0, 1.2)* 86.6 (82.2, 90.0) 100
Less than secondary 9.9 ( 7.4, 13.1) 0.7 ( 0.2, 2.3)* 89.4 (86.0, 92.0) 100
Secondary and above 3.5 ( 2.2, 5.3) 0.9 ( 0.3, 3.2)* 95.6 (93.0, 97.3) 100
Wealth index
Lowest 36.6 (31.4, 42.0) 1.6 ( 0.9, 2.8)* 61.8 (56.3, 67.1) 100
Low 27.1 (23.3, 31.2) 1.9 ( 1.0, 3.4)* 71.0 (66.7, 75.0) 100
Middle 22.7 (18.7, 27.4) 0.9 ( 0.3, 2.5)* 76.4 (71.7, 80.6) 100
High 10.4 ( 8.2, 13.1) 0.8 ( 0.3, 2.3)* 88.8 (86.0, 91.1) 100
Highest 2.8 ( 1.7, 4.7)* 0.2 ( 0.0, 1.1)* 96.9 (95.1, 98.1) 100
Occupation
Employed 4.8 ( 3.0, 7.6) 0.0 95.2 (92.4, 97.0) 100
Business 11.1 ( 8.7, 14.2) 1.3 ( 0.5, 3.3)* 87.6 (84.4, 90.2) 100
Farmers 34.6 (30.3, 39.3) 0.8 ( 0.4, 1.8)* 64.5 (59.9, 68.9) 100
Labourers 27.3 (23.9, 31.0) 1.4 ( 0.9, 2.2)* 71.3 (67.4, 74.9) 100
Student 0.3 ( 0.0, 2.3)* 1.2 ( 0.3, 5.7)* 98.5 (94.4, 99.6) 100
Homemaker 5.5 ( 0.7, 33.2)* 0.0 94.5 (66.8, 99.3)* 100
Unemployed 14.0 ( 8.6, 22.0) 1.8 ( 0.8, 4.2)* 84.2 (76.4, 89.8) 1001Occasional refers to less than daily use.* Estimate based on fewer than 25 unweighted cases.
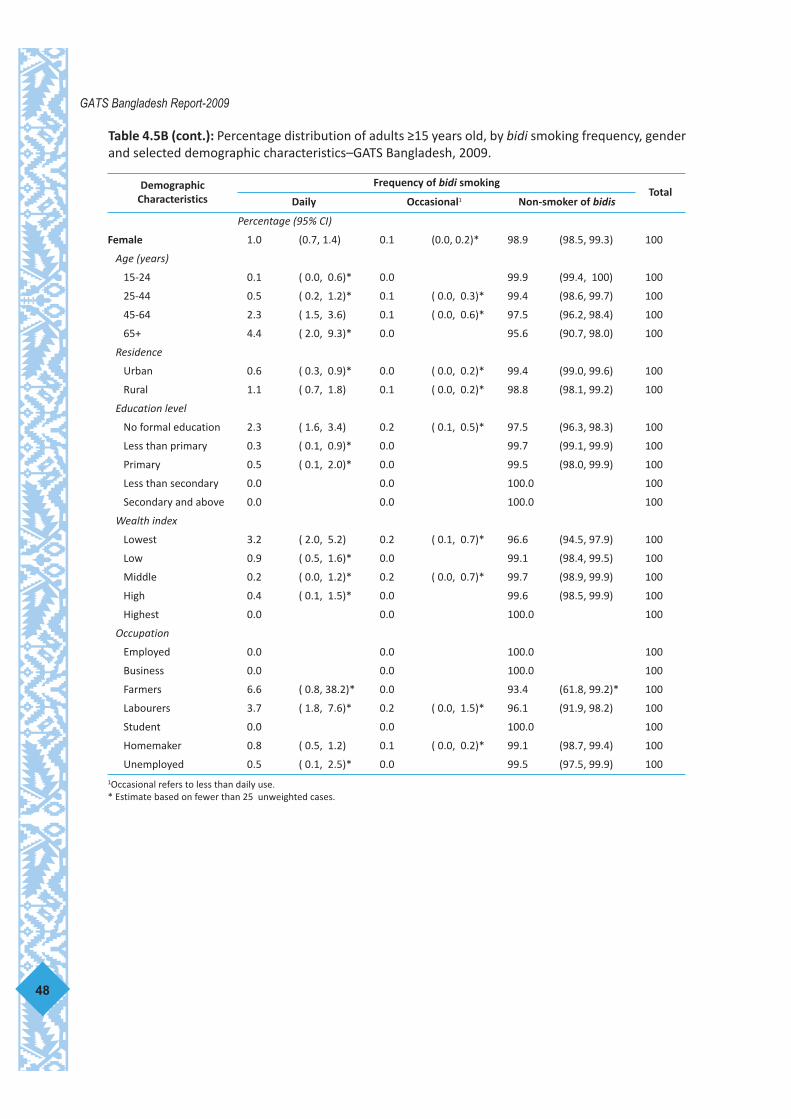
Table 4.5B (cont.): Percentage distribution of adults ≥15 years old, by bidi smoking frequency, genderand selected demographic characteristics–GATS Bangladesh, 2009.
48
GATS Bangladesh Report-2009
DemographicCharacteristics
Frequency of bidi smokingTotal
Daily Occasional1 Non-smoker of bidis
Percentage (95% CI)
Female 1.0 (0.7, 1.4) 0.1 (0.0, 0.2)* 98.9 (98.5, 99.3) 100
Age (years)
15-24 0.1 ( 0.0, 0.6)* 0.0 99.9 (99.4, 100) 100
25-44 0.5 ( 0.2, 1.2)* 0.1 ( 0.0, 0.3)* 99.4 (98.6, 99.7) 100
45-64 2.3 ( 1.5, 3.6) 0.1 ( 0.0, 0.6)* 97.5 (96.2, 98.4) 100
65+ 4.4 ( 2.0, 9.3)* 0.0 95.6 (90.7, 98.0) 100
Residence
Urban 0.6 ( 0.3, 0.9)* 0.0 ( 0.0, 0.2)* 99.4 (99.0, 99.6) 100
Rural 1.1 ( 0.7, 1.8) 0.1 ( 0.0, 0.2)* 98.8 (98.1, 99.2) 100
Education level
No formal education 2.3 ( 1.6, 3.4) 0.2 ( 0.1, 0.5)* 97.5 (96.3, 98.3) 100
Less than primary 0.3 ( 0.1, 0.9)* 0.0 99.7 (99.1, 99.9) 100
Primary 0.5 ( 0.1, 2.0)* 0.0 99.5 (98.0, 99.9) 100
Less than secondary 0.0 0.0 100.0 100
Secondary and above 0.0 0.0 100.0 100
Wealth index
Lowest 3.2 ( 2.0, 5.2) 0.2 ( 0.1, 0.7)* 96.6 (94.5, 97.9) 100
Low 0.9 ( 0.5, 1.6)* 0.0 99.1 (98.4, 99.5) 100
Middle 0.2 ( 0.0, 1.2)* 0.2 ( 0.0, 0.7)* 99.7 (98.9, 99.9) 100
High 0.4 ( 0.1, 1.5)* 0.0 99.6 (98.5, 99.9) 100
Highest 0.0 0.0 100.0 100
Occupation
Employed 0.0 0.0 100.0 100
Business 0.0 0.0 100.0 100
Farmers 6.6 ( 0.8, 38.2)* 0.0 93.4 (61.8, 99.2)* 100
Labourers 3.7 ( 1.8, 7.6)* 0.2 ( 0.0, 1.5)* 96.1 (91.9, 98.2) 100
Student 0.0 0.0 100.0 100
Homemaker 0.8 ( 0.5, 1.2) 0.1 ( 0.0, 0.2)* 99.1 (98.7, 99.4) 100
Unemployed 0.5 ( 0.1, 2.5)* 0.0 99.5 (97.5, 99.9) 1001Occasional refers to less than daily use.* Estimate based on fewer than 25 unweighted cases.

4.5.3 Frequency of smokeless tobacco use
Table 4.5C reports the frequency of smokeless tobacco. Smokeless tobacco use includes thefollowing products in Bangladesh: betel quid with zarda, zarda only, or zarda with supari. Thefrequency of use of these products is divided into three standard categories as is done forsmoked products; daily, occasional and non-users.
Among adults aged 15 years and over, daily smokeless tobacco users were 23.7% andoccasional smokeless tobacco users were 3.5%. Among males daily smokeless tobacco userswere 20.7% and among females 26.6%. The percentage of male occasional smokeless tobaccousers was 5.6%, 1.3% identified themselves as occasional smokeless tobacco users.
Daily smokeless tobacco use prevalence increased with age, persons 65 years of age andolder having the greatest percentage of daily smokeless tobacco use (52.5%), followed by theage groups 45-64 years of age (43.3%), 25-44 years (22.8%) and 15-24 years (4.7%).
Among males, prevalence of smokeless tobacco use increased with age; the highestpercentage was in the 65 years and older age group (43.0%) and the lowest among theyoungest age group 15-24 years (6.2%).
Among females, prevalence of daily smokeless tobacco use increased with age, the highestpercentage was also in the 65 years and older age groups (62.7%) and the lowest among theyoungest age group of 15-24 years (3.1%).
Overall by residence, more persons in rural areas reported daily smokeless tobacco use(25.5%) than those in urban areas (18.6%). The same pattern was reported for males (rural22.5% and urban 15.8%) and females (rural 28.5% and urban 21.3%).
Overall, daily smokeless tobacco use prevalence decreased with increasing level ofeducation. Daily smokeless tobacco use prevalence was 37.8% among persons with no formaleducation; the prevalence decreased as the level of education rose and was reported lowestamong those with less secondary education and above (7.7%). A similar pattern was seenamong males by educational level; those with no formal education have the highestprevalence of daily smokeless tobacco use (28.1%) and those with a secondary education orabove had the lowest (10.2%). This was also the case among females; those with no formaleducation had the highest prevalence of current smokeless tobacco use (46.4%) and thosewith a secondary or higher level of education have the lowest prevalence (4.0%).
Prevalence of daily smokeless tobacco use varied inversely with wealth index. Persons inthe lowest SES had the highest prevalence of daily smokeless tobacco use (32.5%), and personsin the highest SES category had the lowest prevalence (14.5%). A similar pattern was seen bygender. Males in the lowest wealth index had the highest prevalence of smokeless tobacco use(28.2%) and those in the highest wealth index had the lowest prevalence (10.5%). Females inthe lowest wealth index had the highest prevalence (36.1%) and those in the highest index(18.3%) the lowest prevalence.
By occupation, persons who were unemployed had the highest prevalence of dailysmokeless tobacco use (28.8%), followed by homemakers (27.9%); employed persons had thelowest prevalence of daily smokeless tobacco use (14.0%). Labourers had the highestprevalence of occasional smokeless tobacco use (5.7%). Among males, farmers had the highestsmokeless tobacco use (27.6%). Among females, the unemployed category had the highestsmokeless tobacco use (39.6%) and labourers had the next highest (32.7%).
49
GATS Bangladesh Report-2009

Table 4.5C: Percentage distribution of adults ≥15 years old by frequency of smokeless tobacco use,gender and selected demographic characteristics–GATS Bangladesh, 2009.
50
GATS Bangladesh Report-2009
Demographiccharacteristics
Frequency of non-smokeless tobacco useTotal
Daily Occasional1Non-smokeless tobacco
user
Percentage (95% CI)
Overall 23.7 (22.1, 25.3) 3.5 (3.0, 4.0) 72.8 (71.1, 74.5) 100
Age (years)
15-24 4.7 (3.3, 6.5) 2.0 (1.3, 3.0) 93.4 (91.4, 94.9) 100
25-44 22.8 (20.8, 25.0) 4.0 (3.3, 4.8) 73.2 (71.0, 75.3) 100
45-64 43.3 (40.2, 46.5) 4.4 (3.3, 5.8) 52.3 (49.0, 55.5) 100
65+ 52.5 (47.3, 57.6) 3.9 (2.3, 6.7)* 43.6 (38.6, 48.7) 100
Residence
Urban 18.6 (16.5, 20.8) 3.9 (3.2, 4.8) 77.5 (75.2, 79.7) 100
Rural 25.5 (23.6, 27.5) 3.3 (2.7, 4.0) 71.2 (69.1, 73.2) 100
Education level
No formal education 37.8 (35.3, 40.4) 4.5 (3.7, 5.6) 57.7 (55.1, 60.2) 100
Less than primary 24.8 (21.1, 29.0) 3.9 (2.9, 5.2) 71.3 (67.2, 75.0) 100
Primary 22.3 (19.1, 26.0) 2.6 (1.6, 4.0) 75.1 (71.3, 78.6) 100
Less than secondary 10.7 (9.0, 12.7) 2.8 (1.9, 3.9) 86.5 (84.3, 88.5) 100
Secondary and above 7.7 (5.9, 10.1) 2.4 (1.7, 3.5) 89.8 (87.3, 91.9) 100
Wealth index
Lowest 32.5 (29.2, 36.1) 3.6 (2.7, 4.7) 63.9 (60.2, 67.4) 100
Low 26.6 (23.9, 29.6) 3.6 (2.7, 4.9) 69.7 (66.7, 72.6) 100
Middle 22.7 (20.0, 25.7) 3.6 (2.5, 5.1) 73.7 (70.4, 76.8) 100
High 20.3 (18.1, 22.6) 3.5 (2.6, 4.7) 76.2 (73.7, 78.6) 100
Highest 14.5 (12.1, 17.1) 2.9 (2.0, 4.0) 82.7 (79.9, 85.2) 100
Occupation
Employed 14.0 (11.0, 17.8) 3.7 (2.3, 6.0) 82.2 (78.3, 85.5) 100
Business 21.4 (17.8, 25.4) 6.4 (4.6, 8.8) 72.2 (68.0, 76.1) 100
Farmers 27.6 (24.0, 31.5) 6.3 (4.4, 8.8) 66.2 (62.0, 70.0) 100
Labourers 25.2 (21.9, 28.7) 5.7 (4.3, 7.5) 69.1 (65.5, 72.5) 100
Student 0.1 (0.0, 0.8)* 0.9 (0.3, 2.5)* 99.0 (97.4, 99.6) 100
Homemaker 27.9 (25.8, 30.3) 1.3 (0.9, 1.8) 70.8 (68.4, 73.0) 100
Unemployed 28.8 (23.2, 35.2) 3.1 (1.7, 5.4)* 68.1 (61.6, 74.0) 1001Occasional refers to less than daily use.* Estimate based on fewer than 25 unweighted cases.

Table 4.5C (cont.): Percentage distribution of adults ≥15 years old by frequency of smokeless tobaccouse, gender and selected demographic characteristics–GATS Bangladesh, 2009.
51
GATS Bangladesh Report-2009
Demographiccharacteristics
Frequency of non-smokeless tobacco useTotal
Daily Occasional1 Non-smokeless tobaccouser
Percentage (95% CI)
Male 20.7 (18.7, 22.9) 5.6 (4.7, 6.7) 73.6 (71.4, 75.8) 100
Age (years)
15-24 6.2 (3.9, 9.7) 3.1 (1.8, 5.0) 90.7 (87.1, 93.4) 100
25-44 20.4 (17.9, 23.1) 6.6 (5.4, 8.2) 73.0 (70.1, 75.7) 100
45-64 33.4 (29.2, 37.9) 6.9 (5.0, 9.5) 59.6 (55.1, 64.0) 100
65+ 43.0 (36.6, 49.6) 6.3 (3.5, 10.9)* 50.7 (44.2, 57.2) 100
Residence
Urban 15.8 (13.4, 18.5) 5.8 (4.4, 7.6) 78.4 (75.6, 81.0) 100
Rural 22.5 (20.0, 25.2) 5.6 (4.5, 6.9) 71.9 (69.0, 74.7) 100
Education level
No formal education 28.1 (25.1, 31.2) 7.6 (5.9, 9.8) 64.3 (60.9, 67.6) 100
Less than primary 24.4 (19.5, 30.1) 6.4 (4.6, 8.8) 69.2 (63.8, 74.2) 100
Primary 24.3 (19.1, 30.3) 3.7 (2.1, 6.5)* 72.0 (65.7, 77.6) 100
Less than secondary 13.5 (10.8, 16.6) 5.0 (3.4, 7.2) 81.6 (77.8, 84.8) 100
Secondary and above 10.2 (7.3, 13.9) 3.0 (2.0, 4.6) 86.8 (83.0, 89.9) 100
Wealth index
Lowest 28.2 (23.9, 32.9) 6.1 (4.3, 8.4) 65.8 (60.6, 70.6) 100
Low 24.5 (20.6, 28.8) 5.9 (4.1, 8.4) 69.7 (65.2, 73.8) 100
Middle 21.4 (17.6, 25.8) 6.2 (4.1, 9.1) 72.4 (67.7, 76.7) 100
High 17.5 (14.6, 20.8) 5.6 (4.0, 7.8) 76.9 (73.1, 80.4) 100
Highest 10.5 (8.2, 13.5) 4.0 (2.8, 5.9) 85.4 (82.2, 88.2) 100
Occupation
Employed 15.3 (11.6, 20.0) 4.4 (2.6, 7.4) 80.2 (75.5, 84.3) 100
Business 20.2 (16.7, 24.2) 6.6 (4.7, 9.1) 73.2 (68.9, 77.1) 100
Farmers 27.6 (23.9, 31.6) 6.3 (4.5, 8.9) 66.1 (61.9, 70.1) 100
Labourers 23.2 (19.8, 27.1) 6.7 (5.0, 8.9) 70.1 (66.0, 73.8) 100
Student 0.2 (0.0, 1.4)* 0.9 (0.3, 2.9)* 98.9 (97.0, 99.6) 100
Homemaker 58.2 (35.7, 77.8)* 3.1 (0.4, 21.1)* 38.7 (19.9, 61.7)* 100
Unemployed 22.0 (16.7, 28.5) 3.9 (2.1, 7.3)* 74.0 (67.4, 79.7) 1001Occasional refers to less than daily use.* Estimate based on fewer than 25 unweighted cases.
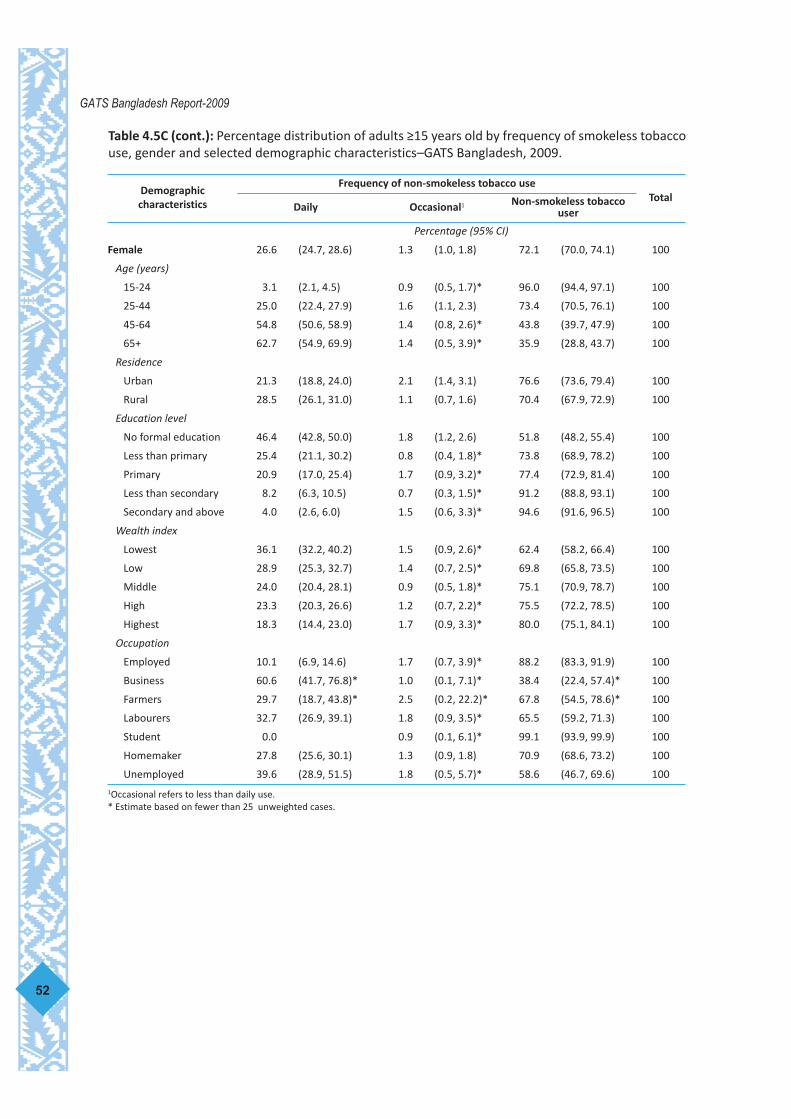
Table 4.5C (cont.): Percentage distribution of adults ≥15 years old by frequency of smokeless tobaccouse, gender and selected demographic characteristics–GATS Bangladesh, 2009.
52
GATS Bangladesh Report-2009
Demographiccharacteristics
Frequency of non-smokeless tobacco useTotal
Daily Occasional1 Non-smokeless tobaccouser
Percentage (95% CI)
Female 26.6 (24.7, 28.6) 1.3 (1.0, 1.8) 72.1 (70.0, 74.1) 100
Age (years)
15-24 3.1 (2.1, 4.5) 0.9 (0.5, 1.7)* 96.0 (94.4, 97.1) 100
25-44 25.0 (22.4, 27.9) 1.6 (1.1, 2.3) 73.4 (70.5, 76.1) 100
45-64 54.8 (50.6, 58.9) 1.4 (0.8, 2.6)* 43.8 (39.7, 47.9) 100
65+ 62.7 (54.9, 69.9) 1.4 (0.5, 3.9)* 35.9 (28.8, 43.7) 100
Residence
Urban 21.3 (18.8, 24.0) 2.1 (1.4, 3.1) 76.6 (73.6, 79.4) 100
Rural 28.5 (26.1, 31.0) 1.1 (0.7, 1.6) 70.4 (67.9, 72.9) 100
Education level
No formal education 46.4 (42.8, 50.0) 1.8 (1.2, 2.6) 51.8 (48.2, 55.4) 100
Less than primary 25.4 (21.1, 30.2) 0.8 (0.4, 1.8)* 73.8 (68.9, 78.2) 100
Primary 20.9 (17.0, 25.4) 1.7 (0.9, 3.2)* 77.4 (72.9, 81.4) 100
Less than secondary 8.2 (6.3, 10.5) 0.7 (0.3, 1.5)* 91.2 (88.8, 93.1) 100
Secondary and above 4.0 (2.6, 6.0) 1.5 (0.6, 3.3)* 94.6 (91.6, 96.5) 100
Wealth index
Lowest 36.1 (32.2, 40.2) 1.5 (0.9, 2.6)* 62.4 (58.2, 66.4) 100
Low 28.9 (25.3, 32.7) 1.4 (0.7, 2.5)* 69.8 (65.8, 73.5) 100
Middle 24.0 (20.4, 28.1) 0.9 (0.5, 1.8)* 75.1 (70.9, 78.7) 100
High 23.3 (20.3, 26.6) 1.2 (0.7, 2.2)* 75.5 (72.2, 78.5) 100
Highest 18.3 (14.4, 23.0) 1.7 (0.9, 3.3)* 80.0 (75.1, 84.1) 100
Occupation
Employed 10.1 (6.9, 14.6) 1.7 (0.7, 3.9)* 88.2 (83.3, 91.9) 100
Business 60.6 (41.7, 76.8)* 1.0 (0.1, 7.1)* 38.4 (22.4, 57.4)* 100
Farmers 29.7 (18.7, 43.8)* 2.5 (0.2, 22.2)* 67.8 (54.5, 78.6)* 100
Labourers 32.7 (26.9, 39.1) 1.8 (0.9, 3.5)* 65.5 (59.2, 71.3) 100
Student 0.0 0.9 (0.1, 6.1)* 99.1 (93.9, 99.9) 100
Homemaker 27.8 (25.6, 30.1) 1.3 (0.9, 1.8) 70.9 (68.6, 73.2) 100
Unemployed 39.6 (28.9, 51.5) 1.8 (0.5, 5.7)* 58.6 (46.7, 69.6) 1001Occasional refers to less than daily use.* Estimate based on fewer than 25 unweighted cases.

4.6 Smoked and smokeless tobacco use per day
The overall mean figures (CI) for the number of cigarettes and bidis smoked per day were 5.1(4.6, 5.6) sticks and 6.9 (6.2, 7.6) sticks; for males those were 5.2 (4.7, 5.7) cigarettes and 7.0(6.3, 7.7) bidis and for female 0.8 (0.2, 1.4) cigarettes and 4.3 (2.4, 6.2) bidis, respectively. Themean figures (CI) of the number of cigarettes and bidis smoked per day in urban respondentswere 8.5 (7.6, 9.5) cigarettes and 2.7 (1.9, 3.4) bidis and in rural respondents were 4.0 (3.5, 4.5)cigarettes and 8.3 (7.4, 9.1) bidis.
The overall mean (CI) of the number of times smokeless tobacco used per day was 8.1(7.7, 8.5), for males was 8.3 (7.6, 8.9) and for females 7.9 (7.4, 8.5) products. The mean (CI)of the number of times smokeless tobacco used per day in urban respondents was 8.1 (7.4,8.8) and in rural respondents was 8.1 (7.6, 8.5).
4.6.1 Number of cigarettes smoked per day
Table 4.6 reports the number of cigarettes smoked on average per day by five standardcategories: <5, 5-9, 10-14, 15-24, ≥25. Overall, 28.1% of persons smoke <5 cigarettes per day,27.5% smoke 5-9 cigarettes per day, 27.7% smoke 10-14 cigarettes per day, 14.9% smoke 15-24 cigarettes per day and 1.8% smoke ≥25 cigarettes per day.
By age category, among 15-24 year olds 40.6% smoked <5 cigarettes per day, 30.3%smoked 5-9 cigarettes per day and 21.2% smoked 10-14 per day. Among 25-44 year olds;29.0% smoked 10-14 cigarettes per day, 27.2% smoked 5-9 cigarettes per day and 23% smoked<5 per day. Among 45-64 year olds, 30.7 smoked 10-14 cigarettes per day, 27.2% smoked <5cigarettes per day and 24.9% smoked 5-9 per day. Among males, 15-24 year olds 39.8%smoked <5 cigarettes per day and 31.0% of 45-64 year olds smoked 10-14 cigarettes per day.Among 25-44 year olds, 29.0% smoke 10-14 cigarettes per day. By residence, among males,the highest prevalence is among rural males who smoke <5 cigarettes per day (31.3%). Amongurban males, the highest prevalence is among those who smoke 5-9 cigarettes per day (28.3%)and the least is among those who smoke ≥25 cigarettes per day (2.9%).
By education level, among males 30.3% of those with no formal schooling smoke 10-14cigarettes per day, and 31.5 % of those with less than primary education smoke 10-14cigarettes per day. Among those with a primary education, 37.4% smoked 5-9 cigarettes perday; among those with less than secondary level of education, 29.0% smoked <5 cigarettes perday. Among those with education of secondary level and above, 34.6% smoked 5-9 per day.By wealth index, among males, those in the low category smoked 10-14 cigarettes per day(32.6%), followed by those in the middle category who smoked 5-9 cigarettes per day (31.9%),while those in the lowest category smoked <5 cigarettes per day (31.2%) and those in the highand highest categories smoked 5-9 cigarettes per day (30.5% and 30.1%, respectively). Byoccupation, among males, 39.2% of farmers report smoking <5 cigarettes per day; amongbusiness persons, 32.7% report smoking 5-9 cigarettes per day; among labourers 33.3% reportsmoking 10-14 cigarettes per day and among the employed 32.8% smoke 5-9 cigarettes perday.
53
GATS Bangladesh Report-2009

4.6.2 Number of bidis smoked per day
Table 4.6A reports the number of bidis smoked on average per day. The same five standardcategories that were used to report the number of cigarettes per day are again used, i.e. <5,5-9, 10-14, 15-24 and ≥25 per day. Overall, 13.6% of persons smoke <5 bidis per day, 21.2%smoke 5-9 bidis per day, 22.5% smoke 10-14 per day, 17.9% smoke 15-24 and 24.8% smoke≥25 per day. Among males, 11.1% smoke <5 bidis per day, 21.3% smoke 5-9 bidis per day,23.2% smoke 10-14 bidis per day, 18.7% smoke 15-24 bidis per day and 25.7% smoke ≥25 bidisper day. Among females, 64.2% smoke <5 bidis per day. The other categories of frequency forfemales have fewer than 25 respondents per cell.
Among males, those in the 25-44 year and 45-64 year age categories have the highestprevalence; in these categories, 28.6% and 28.1% smoked ≥25 bidis per day, respectively. Thepercentage for the same age categories of those who smoke 10-14 bidis per day were, 25.0%and 22.1% and for those who smoke 5-9 bidis per day, 20.1% and 20.3% respectively.
Among males, those in urban areas, who smoked <5 bidis per day represented 23.4%,compared to 9.4% in rural areas. For those who smoke 5-9 bidis per day, the figure was 17.6%for urban residents and 21.7% in rural areas. Among those that smoke 10-14 bidis per day, thefigure were 18.4% for urban residents and 23.7% for rural residents. Distributions amongthose who that smoked 15-24 bidis per day were similar for rural and urban residents, 18.4%and 18.8%, respectively. Among those who smoked ≥25 bidis per day, the figure were 22.2%(urban) and 26.1% (rural).
By education level, 24.6% of males with no formal education smoked ≥25 bidis per day;among those with less than primary education, 31.1% smoked ≥25 bidis per day. By wealthindex, 27.1% of those in the lowest category smoked ≥25 bidis per day and 10.3% smoked <5bidis per day. Among those males in the low income category, 26.7% smoked 10-14 bidis perday and 10.5% smoked <5 bidis per day. Among those in the middle category, 31% smoked ≥25bidis per day and 10.8% smoked <5 per day. Among those in the high category, 26.6% smoked10-14 bidis per day.
By occupation among males, farmers and labourers smoke bidis more on average per daythan other occupational categories. Among males in the business category, 26.3% reportsmoking ≥25 bidis per day, while among farmers and labourers almost 27% report smoking≥25 bidis per day.
4.6.3 Number of times smokeless tobacco used per day
Table 4.6B reports the number of times smokeless tobacco is used on average per day. Thecategories presented are similar to that for smoked forms of tobacco: <5, 5-9, 10-14, 15-24 and≥25 per day. Overall, 30.9% of persons use smokeless tobacco <5 times per day, 37.0% usesmokeless tobacco 5-9 times per day, 18.9% of persons use smokeless tobacco 10-14 times perday, 10.2% of persons use smokeless tobacco 15-24 times per day and 3.0% use smokelesstobacco ≥25 times per day.
Among males, 31.8% use smokeless tobacco <5 times per day, 32.3% use smokelesstobacco 5-9 times per day, and 32.2% use smokeless tobacco 5-9 times per day. Further, 20.9%
54
GATS Bangladesh Report-2009
of males use tobacco 10-14 times per day, 11.2% of males use smokeless tobacco 15-24 timesper day and 3.8% use smokeless tobacco ≥25 times per day. Among females, 30.1% usesmokeless tobacco < 5 times per day, 40.6% use smokeless tobacco 5-9 times per day, 17.4%use smokeless tobacco 10-14 times per day, 9.5% of females use smokeless tobacco 15-24times per day and 2.4% use smokeless tobacco ≥25 times per day.
Among all, male and female the figures for the use of smokeless tobacco at a rate of 5-9times per day was most common in 65 years and above age group, in which the figure were(43.0%, 37.6% and 46.9% for all persons, males, and females respectively).
Overall both persons in urban and rural areas used similar amounts of smokeless tobaccoper day. Among those who lived in urban areas 32.0% used smokeless tobacco <5 times perday and 30.6% of person in rural areas used smokeless tobacco <5 times per day. In urbanareas 35.4% used smokeless tobacco 5-9 times per day while the figure was 37.4% in ruralareas. In urban areas, 18.3% used smokeless tobacco 10-14 times per day, 19.1% used thesame average amount per day in rural areas.
By education level, among those with no formal education 37.1% used smokeless tobacco5-9 times per day. Those with less than primary education also have a similar pattern, with40.4% using smokeless tobacco 5-9 times per day. Among those with primary education 35.4%use smokeless tobacco 5-9 times per day and 38.0% of those with less than secondary usesmokeless tobacco <5 times per day. Those with secondary level and above also use smokelesstobacco 5-9 times per day (38.6%).
By wealth index, across all wealth categories, the highest percentages were in the categoryof persons using smokeless tobacco 5-9 times per day. Among persons in the lowest categorythe figure was 39.5%, in the low category 34.1%, in the middle category, 35.0%, in the highcategory 35.1% and in the highest category 46.2%.
By occupational category, among the employed, most persons used smokeless tobacco<5 or 5-9 times per day (33.0% and 32.7%), respectively. Among business persons, the samepattern was seen: 31.1% used smokeless tobacco <5 times per day and 31.8% used it 5-9 timesper day. Among farmers, 32.9% used smokeless tobacco 5-9 times per day and 28.4% used it<5 times per day. Among labourers, 35.0% used smokeless tobacco <5 times per day and29.4% used it 5-9 times per day. Among homemakers, the figure for smokeless tobacco were41.1% at 5-9 times per day and 30.3% at <5 times per day. Among the unemployed, 50.3%used smokeless tobacco 5-9 times per day and 25.1% used it <5 times per day.
55
GATS Bangladesh Report-2009

56
GATS Bangladesh Report-2009Ta
ble
4.6:
Per
cent
age
dist
ribu
tion
of
ciga
rett
es s
mok
ed p
er d
ay a
mon
g da
ily c
igar
ette
sm
oker
s ≥1
5 ye
ars
old,
by
gend
er a
nd s
elec
ted
dem
ogra
phic
cha
ract
eris
tics–
GAT
S Ba
ngla
desh
, 200
9.D
emog
raph
icch
arac
teri
stic
sN
umbe
r of
cig
aret
tes
smok
ed o
n av
erag
e pe
r da
y1
Tota
l<5
5-9
10-1
415
-24
≥25
Perc
enta
ge(9
5% C
I)O
vera
ll28
.1(2
4.5,
32.
0)27
.5(2
4.3,
31.
0)27
.7(2
3.9,
31.
8)14
.9(1
1.7,
18.
7)1.
8(1
.2, 2
.6)
100
Age
(yea
rs)
15-2
440
.6(3
0.0,
52.
1)30
.3(2
0.8,
41.
9)21
.2(1
3.5,
31.
6)7.
0(3
.2, 1
4.3)
*1.
0(0
.2, 4
.2)*
100
25-4
423
.0(1
9.1,
27.
4)27
.2(2
3.4,
31.
4)29
.0(2
4.2,
34.
3)19
.0(1
4.6,
24.
3)1.
8(1
.1, 3
.0)*
100
45-6
427
.2(2
0.5,
35.
0)24
.9(1
9.4,
31.
5)30
.7(2
4.5,
37.
6)14
.6(1
0.7,
19.
5)2.
6(1
.3, 5
.2)*
100
65+
36.0
(20.
6, 5
5.1)
*32
.8(1
7.9,
52.
2)*
25.8
(13.
8, 4
3.1)
*5.
4(1
.5, 1
7.1)
*0.
010
0Re
side
nce
Urb
an21
.2(1
7.6,
25.
2)28
.4(2
4.5,
32.
6)26
.8(2
2.0,
32.
2)20
.7(1
4.5,
28.
6)3.
0(1
.9, 4
.8)
100
Rura
l31
.9(2
6.8,
37.
4)27
.1(2
2.6,
32.
0)28
.2(2
3.1,
33.
9)11
.8(8
.8, 1
5.5)
1.1
(0.6
, 2.2
)*10
0Ed
ucat
ion
leve
lN
o fo
rmal
edu
catio
n26
.7(2
1.5,
32.
7)23
.3(1
8.4,
29.
0)29
.8(2
4.6,
35.
7)17
.8(1
2.1,
25.
4)2.
4(1
.3, 4
.2)*
100
Less
than
pri
mar
y28
.3(2
1.0,
37.
0)24
.2(1
8.3,
31.
2)31
.2(2
3.0,
40.
6)14
.3(9
.7, 2
0.5)
2.0
(0.9
, 4.4
)*10
0Pr
imar
y27
.2(1
7.8,
39.
3)37
.4(2
6.7,
49.
5)20
.9(1
3.2,
31.
5)12
.4(6
.8, 2
1.8)
*2.
1(0
.6, 6
.9)*
100
Less
than
sec
onda
ry28
.8(2
1.6,
37.
3)28
.2(2
1.0,
36.
8)29
.0(2
2.1,
37.
0)13
.3(8
.8, 1
9.7)
0.7
(0.2
, 2.6
)*10
0Se
cond
ary
and
abov
e31
.7(2
0.8,
45.
1)34
.6(2
4.5,
46.
3)20
.1(1
3.5,
28.
7)12
.3(7
.9, 1
8.8)
1.3
(0.4
, 4.2
)*10
0W
ealth
inde
xLo
wes
t32
.7(2
3.6,
43.
3)19
.0(1
2.7,
27.
4)26
.0(1
8.4,
35.
5)21
.0(1
0.5,
37.
4)1.
3(0
.3, 5
.2)*
100
Low
27.6
(21.
1, 3
5.2)
24.9
(19.
3, 3
1.5)
32.2
(25.
1, 4
0.3)
12.9
(9.0
, 18.
0)2.
4(1
.1, 5
.0)*
100
Mid
dle
28.3
(20.
8, 3
7.3)
31.9
(23.
1, 4
2.2)
26.4
(19.
1, 3
5.3)
11.1
(7.0
, 17.
1)2.
4(1
.1, 5
.1)*
100
Hig
h25
.6(1
8.3,
34.
5)30
.5(2
4.4,
37.
2)27
.0(2
0.8,
34.
4)15
.7(1
1.5,
21.
1)1.
2(0
.5, 3
.0)*
100
Hig
hest
28.3
(20.
9, 3
7.2)
30.1
(22.
7, 3
8.6)
25.0
(18.
2, 3
3.3)
15.1
(10.
3, 2
1.4)
1.5
(0.6
, 3.8
)*10
0O
ccup
atio
nEm
ploy
ed23
.0(1
6.7,
30.
8)32
.8(2
4.1,
42.
9)31
.2(2
3.5,
40.
2)11
.2(7
.0, 1
7.3)
1.8
(0.6
, 5.0
)*10
0Bu
sine
ss19
.3(1
3.8,
26.
2)32
.7(2
6.2,
39.
9)25
.4(2
0.3,
31.
2)20
.6(1
5.4,
26.
9)2.
1(1
.0, 4
.1)*
100
Farm
ers
39.2
(29.
7, 4
9.6)
25.8
(18.
5, 3
4.8)
25.8
(17.
3, 3
6.6)
7.7
(4.6
, 12.
4)*
1.5
(0.5
, 4.8
)*10
0La
bour
ers
25.5
(20.
4, 3
1.4)
22.4
(18.
1, 2
7.3)
33.2
(26.
3, 4
0.9)
16.7
(11.
4, 2
3.8)
2.2
(1.2
, 3.9
)*10
0St
uden
t66
.1(2
5.3,
91.
8)*
7.3
(1.0
, 38.
0)*
26.1
(5.6
, 67.
8)*
0.5
(0.1
, 4.1
)*0.
010
0H
omem
aker
80.4
(48.
1, 9
4.8)
*4.
3(0
.5, 2
7.8)
*2.
6(0
.3, 1
8.5)
*12
.7(2
.5, 4
5.6)
*0.
010
0U
nem
ploy
ed35
.6(2
0.6,
54.
0)*
40.9
(23.
5, 6
0.8)
*8.
0(3
.4, 1
7.9)
*15
.5(7
.5, 2
9.4)
*0.
010
01
Am
ong
daily
cig
aret
te s
mok
ers.
Cig
aret
tes
incl
ude
man
ufac
ture
d an
d ha
nd-r
olle
d.*
Estim
ate
base
d on
few
er th
an 2
5 u
nwei
ghte
d ca
ses.

57
GATS Bangladesh Report-2009Ta
ble
4.6
(con
t.):
Perc
enta
ge d
istr
ibut
ion
of c
igar
ette
s sm
oked
per
day
am
ong
daily
cig
aret
te s
mok
ers ≥
15 y
ears
old
, by
gend
er a
nd s
elec
ted
dem
ogra
phic
char
acte
rist
ics–
GAT
S Ba
ngla
desh
, 200
9.D
emog
raph
icCh
arac
teri
stic
sN
umbe
r of
cig
aret
tes
smok
ed o
n av
erag
e pe
r da
y1
Tota
l<5
5-9
10-1
415
-24
≥25
Perc
enta
ge(9
5% C
I)M
ale
27.7
(24.
1, 3
1.7)
27.6
(24.
4, 3
1.1)
27.9
(24.
1, 3
2.1)
14.9
(11.
8, 1
8.8)
1.8
(1.2
, 2.7
)10
0A
ge(y
ears
)15
-24
39.8
(29.
1, 5
1.6)
30.7
(21.
1, 4
2.4)
21.4
(13.
7, 3
2.0)
7.0
(3.3
, 14.
6)*
1.0
(0.2
, 4.3
)*10
025
-44
23.0
(19.
1, 2
7.4)
27.2
(23.
4, 3
1.4)
29.0
(24.
2, 3
4.3)
19.0
(14.
6, 2
4.4)
1.8
(1.1
, 3.0
)*10
045
-64
26.9
(20.
3, 3
4.8)
25.0
(19.
4, 3
1.6)
31.0
(24.
8, 3
8.0)
14.5
(10.
6, 1
9.4)
2.7
(1.3
, 5.3
)*10
065
+32
.1(1
7.6,
51.
1)*
34.8
(19.
2, 5
4.5)
*27
.4(1
4.7,
45.
2)*
5.7
(1.6
, 18.
0)*
0.0
100
Resi
denc
eU
rban
21.1
(17.
5, 2
5.2)
28.3
(24.
4, 3
2.6)
26.8
(22.
0, 3
2.3)
20.7
(14.
6, 2
8.6)
3.0
(1.9
, 4.8
)10
0Ru
ral
31.3
(26.
2, 3
6.9)
27.3
(22.
8, 3
2.2)
28.5
(23.
4, 3
4.2)
11.8
(8.8
, 15.
6)1.
1(0
.6, 2
.3)*
100
Educ
atio
n le
vel
No
form
al e
duca
tion
25.9
(20.
7, 3
1.9)
23.4
(18.
5, 2
9.2)
30.3
(25.
0, 3
6.2)
17.9
(12.
1, 2
5.6)
2.4
(1.4
, 4.2
)*10
0Le
ss th
an p
rim
ary
27.6
(20.
3, 3
6.3)
24.4
(18.
4, 3
1.6)
31.5
(23.
3, 4
1.0)
14.5
(9.9
, 20.
7)2.
0(0
.9, 4
.4)*
100
Prim
ary
27.2
(17.
8, 3
9.3)
37.4
(26.
7, 4
9.5)
20.9
(13.
2, 3
1.5)
12.4
(6.8
, 21.
8)*
2.1
(0.6
, 6.9
)*10
0Le
ss th
an s
econ
dary
28.8
(21.
6, 3
7.3)
28.2
(21.
0, 3
6.8)
29.0
(22.
1, 3
7.0)
13.3
(8.8
, 19.
7)0.
7(0
.2, 2
.6)*
100
Seco
ndar
y an
d ab
ove
31.7
(20.
8, 4
5.1)
34.6
(24.
5, 4
6.3)
20.1
(13.
5, 2
8.7)
12.3
(7.9
, 18.
8)1.
3(0
.4, 4
.2)*
100
Wea
lth in
dex
Low
est
31.2
(22.
3, 4
1.7)
19.1
(12.
7, 2
7.8)
26.8
(18.
9, 3
6.5)
21.6
(10.
8, 3
8.3)
1.4
(0.3
, 5.4
)*10
0Lo
w27
.1(2
0.5,
34.
9)25
.1(1
9.4,
31.
7)32
.6(2
5.3,
40.
8)12
.8(8
.9, 1
8.0)
2.4
(1.2
, 5.0
)*10
0M
iddl
e28
.3(2
0.8,
37.
3)31
.9(2
3.1,
42.
2)26
.4(1
9.1,
35.
3)11
.1(7
.0, 1
7.1)
2.4
(1.1
, 5.1
)*10
0H
igh
25.4
(18.
1, 3
4.4)
30.5
(24.
5, 3
7.3)
27.1
(20.
8, 3
4.5)
15.7
(11.
5, 2
1.1)
1.2
(0.5
, 3.0
)*10
0H
ighe
st28
.3(2
0.9,
37.
2)30
.1(2
2.7,
38.
6)25
.0(1
8.2,
33.
3)15
.1(1
0.3,
21.
4)1.
5(0
.6, 3
.8)*
100
Occ
upat
ion
Empl
oyed
23.0
(16.
7, 3
0.8)
32.8
(24.
1, 4
2.9)
31.2
(23.
5, 4
0.2)
11.2
(7.0
, 17.
3)1.
8(0
.6, 5
.0)*
100
Busi
ness
19.3
(13.
8, 2
6.2)
32.7
(26.
2, 3
9.9)
25.4
(20.
3, 3
1.2)
20.6
(15.
4, 2
6.9)
2.1
(1.0
, 4.1
)*10
0Fa
rmer
s39
.2(2
9.7,
49.
6)25
.8(1
8.5,
34.
8)25
.8(1
7.3,
36.
6)7.
7(4
.6, 1
2.4)
*1.
5(0
.5, 4
.8)*
100
Labo
urer
s25
.5(2
0.4,
31.
4)22
.3(1
8.0,
27.
3)33
.3(2
6.4,
41.
0)16
.7(1
1.4,
23.
8)2.
2(1
.2, 4
.0)*
100
Stud
ent
66.1
(25.
3, 9
1.8)
*7.
3(1
.0, 3
8.0)
*26
.1(5
.6, 6
7.8)
*0.
5(0
.1, 4
.1)*
0.0
100
Hom
emak
er0.
00.
00.
010
0.0
*0.
010
0U
nem
ploy
ed35
.6(2
0.6,
54.
0)*
40.9
(23.
5, 6
0.8)
*8.
0(3
.4, 1
7.9)
*15
.5(7
.5, 2
9.4)
*0.
010
01
Am
ong
daily
cig
aret
te s
mok
ers.
Cig
aret
tes
incl
ude
man
ufac
ture
d an
d ha
nd-r
olle
d.*
Estim
ate
base
d on
few
er th
an 2
5 u
nwei
ghte
d ca
ses.

58
GATS Bangladesh Report-2009Ta
ble
4.6
(con
t.):
Perc
enta
ge d
istr
ibut
ion
of c
igar
ette
s sm
oked
per
day
am
ong
daily
cig
aret
te s
mok
ers ≥
15 y
ears
old
, by
gend
er a
nd s
elec
ted
dem
ogra
phic
char
acte
rist
ics–
GAT
S Ba
ngla
desh
, 200
9.D
emog
raph
ic
char
acte
rist
ics
Num
ber
of c
igar
ette
s sm
oked
on
aver
age
per
day1
Tota
l<5
5-9
10-1
415
-24
≥25
Perc
enta
ge(9
5% C
I)Fe
mal
e78
.8(4
7.6,
93.
8)*
11.1
(2.4
, 39.
0)*
2.4
(0.3
, 17.
2)*
7.7
(1.0
, 42.
1)*
0.0
100
Age
(yea
rs)
15-2
410
0.0
*0.
00.
00.
00.
010
025
-44
39.2
(5.4
, 88.
0)*
37.9
(5.1
, 87.
5)*
22.9
(2.6
, 76.
8)*
0.0
0.0
100
45-6
452
.9(1
3.4,
89.
1)*
22.6
(2.9
, 74.
1)*
0.0
24.5
(3.2
, 76.
1)*
0.0
100
65+
100.
0*
0.0
0.0
0.0
0.0
100
Resi
denc
eU
rban
47.1
(7.2
, 91.
1)*
33.0
(4.0
, 85.
5)*
19.9
(2.1
, 73.
8)*
0.0
0.0
100
Rura
l83
.1(4
7.6,
96.
4)*
8.1
(1.1
, 42.
1)*
0.0
8.8
(1.0
, 46.
8)*
0.0
100
Educ
atio
n le
vel
No
form
al e
duca
tion
71.8
(36.
5, 9
1.9)
*14
.7(3
.2, 4
7.6)
*3.
2(0
.4, 2
2.2)
*10
.3(1
.3, 5
0.7)
*0.
010
0Le
ss th
an p
rim
ary
100.
0*
0.0
0.0
0.0
0.0
100
Prim
ary
0.0
0.0
0.0
0.0
0.0
0Le
ss th
an s
econ
dary
0.0
0.0
0.0
0.0
0.0
0Se
cond
ary
and
abov
e0.
00.
00.
00.
00.
00
Wea
lth in
dex
Low
est
86.8
(42.
2, 9
8.3)
*13
.2(1
.7, 5
7.8)
*0.
00.
00.
010
0Lo
w63
.7(1
4.4,
94.
8)*
10.2
(1.0
, 56.
9)*
6.2
(0.6
, 42.
5)*
20.0
(1.9
, 75.
9)*
0.0
100
Mid
dle
0.0
0.0
0.0
0.0
0.0
0H
igh
100.
0*
0.0
0.0
0.0
0.0
100
Hig
hest
0.0
0.0
0.0
0.0
0.0
0O
ccup
atio
nEm
ploy
ed0.
00.
00.
00.
00.
00
Busi
ness
0.0
0.0
0.0
0.0
0.0
0Fa
rmer
s0.
00.
00.
00.
00.
00
Labo
urer
s36
.4(3
6.4,
36.
4)*
63.6
(63.
6, 6
3.6)
*0.
00.
00.
010
0St
uden
t0.
00.
00.
00.
00.
00
Hom
emak
er84
.1(5
0.9,
96.
4)*
4.5
(0.5
, 29.
1)*
2.7
(0.3
, 19.
5)*
8.7
(1.1
, 46.
2)*
0.0
100
Une
mpl
oyed
0.0
0.0
0.0
0.0
0.0
01
Am
ong
daily
cig
aret
te s
mok
ers.
Cig
aret
tes
incl
ude
man
ufac
ture
d an
d ha
nd-r
olle
d.*
Estim
ate
base
d on
few
er th
an 2
5 u
nwei
ghte
d ca
ses.

59
GATS Bangladesh Report-2009Ta
ble
4.6A
: Per
cent
age
dist
ribu
tion
of b
idis
smok
ed p
er d
ay a
mon
g da
ily b
idis
mok
ers ≥1
5 ye
ars
old,
by
gend
er a
nd s
elec
ted
dem
ogra
phic
char
acte
rist
ics–
GAT
S Ba
ngla
desh
, 200
9.D
emog
raph
icch
arac
teri
stic
sN
umbe
r of
bid
issm
oked
on
aver
age
per
day1
Tota
l<5
5-9
10-1
415
-24
≥25
Perc
enta
ge(9
5% C
I)O
vera
ll13
.6(1
1.1,
16.
6)21
.2(1
7.7,
25.
2)22
.5(1
9.2,
26.
1)17
.9(1
4.9,
21.
4)24
.8(2
1.6,
28.
3)10
0A
ge(y
ears
)15
-24
14.4
(6.6
, 28.
4)*
25.2
(12.
0, 4
5.5)
*20
.9(1
1.0,
36.
1)*
30.1
(14.
3, 5
2.6)
*9.
4(3
.9, 2
0.8)
*10
025
-44
9.5
(7.0
, 12.
8)20
.6(1
6.1,
26.
0)24
.5(1
9.9,
29.
9)17
.4(1
3.6,
22.
0)27
.9(2
3.3,
33.
0)10
045
-64
14.2
(10.
1, 1
9.7)
19.8
(14.
5, 2
6.5)
21.3
(16.
0, 2
7.6)
17.5
(12.
9, 2
3.3)
27.2
(21.
7, 3
3.6)
100
65+
32.1
(20.
4, 4
6.6)
25.7
(15.
4, 3
9.7)
*18
.4(1
0.7,
30.
0)*
9.6
(4.3
, 20.
0)*
14.1
(7.2
, 25.
8)*
100
Resi
denc
eU
rban
26.1
(17.
7, 3
6.7)
17.6
(12.
2, 2
4.7)
18.5
(12.
0, 2
7.4)
17.1
(11.
9, 2
4.1)
20.7
(15.
1, 2
7.6)
100
Rura
l12
.2(9
.6, 1
5.4)
21.6
(17.
8, 2
6.0)
22.9
(19.
4, 2
6.9)
18.0
(14.
8, 2
1.8)
25.3
(21.
8, 2
9.1)
100
Educ
atio
n le
vel
No
form
al e
duca
tion
13.4
(10.
4, 1
7.2)
22.0
(17.
6, 2
7.2)
22.7
(18.
8, 2
7.2)
18.6
(14.
7, 2
3.2)
23.2
(19.
1, 2
7.9)
100
Less
than
pri
mar
y13
.7(8
.2, 2
1.9)
18.4
(12.
7, 2
6.1)
24.2
(17.
4, 3
2.6)
13.0
(8.4
, 19.
7)*
30.7
(23.
0, 3
9.6)
100
Prim
ary
9.8
(3.8
, 23.
2)*
22.0
(11.
6, 3
7.8)
*17
.2(8
.6, 3
1.2)
*14
.6(7
.6, 2
6.1)
*36
.5(2
3.4,
51.
8)*
100
Less
than
sec
onda
ry15
.2(8
.2, 2
6.5)
*18
.1(9
.4, 3
2.1)
*20
.4(1
2.1,
32.
1)*
25.3
(12.
0, 4
5.7)
*21
.0(1
2.5,
33.
1)*
100
Seco
ndar
y an
d ab
ove
21.4
(9.0
, 42.
9)*
28.0
(11.
6, 5
3.5)
*25
.2(1
1.5,
46.
6)*
19.2
(6.7
, 43.
9)*
6.2
(1.3
, 24.
6)*
100
Wea
lth in
dex
Low
est
16.1
(11.
9, 2
1.5)
20.7
(16.
1, 2
6.2)
20.2
(15.
3, 2
6.3)
18.0
(13.
1, 2
4.2)
24.9
(20.
0, 3
0.6)
100
Low
11.6
(7.6
, 17.
4)21
.6(1
5.6,
29.
1)26
.4(2
0.5,
33.
4)17
.2(1
2.6,
23.
1)23
.1(1
7.5,
29.
9)10
0M
iddl
e10
.8(6
.6, 1
7.2)
20.1
(13.
1, 2
9.6)
18.1
(12.
1, 2
6.2)
19.7
(12.
5, 2
9.4)
31.4
(22.
7, 4
1.5)
100
Hig
h15
.3(8
.9, 2
4.9)
*23
.2(1
5.2,
33.
7)*
26.1
(18.
1, 3
6.0)
16.7
(9.8
, 26.
8)*
18.8
(11.
0, 3
0.3)
*10
0H
ighe
st26
.6(1
1.1,
51.
4)*
23.8
(8.4
, 51.
5)*
24.7
(6.7
, 59.
9)*
15.4
(5.2
, 37.
8)*
9.4
(2.0
, 34.
6)*
100
Occ
upat
ion
Empl
oyed
16.8
(7.2
, 34.
6)*
38.6
(18.
9, 6
3.0)
*17
.8(6
.0, 4
2.3)
*18
.2(7
.7, 3
7.4)
*8.
6(2
.0, 3
0.1)
*10
0Bu
sine
ss14
.5(8
.1, 2
4.5)
*17
.2(1
0.0,
28.
1)*
22.2
(14.
8, 3
2.0)
*19
.7(1
1.7,
31.
2)*
26.3
(17.
9, 3
7.0)
100
Farm
ers
10.4
(6.8
, 15.
5)24
.2(1
8.2,
31.
5)23
.1(1
7.6,
29.
7)15
.2(1
1.0,
20.
6)27
.1(2
1.7,
33.
3)10
0La
bour
ers
11.1
(8.0
, 15.
2)18
.8(1
4.6,
23.
8)24
.3(1
9.6,
29.
7)19
.5(1
4.9,
25.
0)26
.3(2
1.4,
31.
9)10
0St
uden
t10
0.0
*0.
00.
00.
00.
010
0H
omem
aker
66.1
(45.
8, 8
1.8)
*21
.7(9
.4, 4
2.5)
*4.
6(1
.2, 1
6.5)
*2.
4(0
.3, 1
5.5)
*5.
2(0
.7, 2
9.3)
*10
0U
nem
ploy
ed23
.1(9
.8, 4
5.5)
*19
.2(7
.8, 4
0.1)
*14
.3(4
.9, 3
5.0)
*36
.0(1
1.6,
70.
7)*
7.4
(2.2
, 21.
8)*
100
1 A
mon
g da
ily b
idis
mok
ers.
*
Estim
ate
base
d on
few
er th
an 2
5 u
nwei
ghte
d ca
ses.

60
GATS Bangladesh Report-2009Ta
ble
4.6A
(co
nt.)
:Per
cent
age
dist
ribu
tion
of
bidi
ssm
oked
per
day
am
ong
daily
bid
ism
oker
s ≥1
5 ye
ars
old,
by
gend
er a
nd s
elec
ted
dem
ogra
phic
char
acte
rist
ics–
GAT
S Ba
ngla
desh
, 200
9.D
emog
raph
icch
arac
teri
stic
sN
umbe
r of
bid
issm
oked
on
aver
age
per
day1
Tota
l<5
5-9
10-1
415
-24
≥25
Perc
enta
ge(9
5% C
I)M
ale
11.1
(8.8
, 13.
9)21
.3(1
7.7,
25.
5)23
.2(1
9.8,
27.
0)18
.7(1
5.6,
22.
3)25
.7(2
2.3,
29.
3)10
0A
ge(y
ears
)15
-24
13.3
(5.9
, 27.
5)*
25.6
(12.
2, 4
6.0)
*21
.2(1
1.1,
36.
5)*
30.5
(14.
5, 5
3.1)
*9.
5(4
.0, 2
1.1)
*10
025
-44
8.5
(6.1
, 11.
7)20
.1(1
5.5,
25.
7)25
.0(2
0.3,
30.
5)17
.8(1
4.0,
22.
5)28
.5(2
3.7,
33.
7)10
045
-64
11.1
(7.3
, 16.
6)20
.3(1
4.7,
27.
3)22
.1(1
6.5,
28.
8)18
.4(1
3.5,
24.
5)28
.2(2
2.4,
34.
8)10
065
+24
.2(1
3.7,
39.
2)*
28.0
(16.
7, 4
3.1)
*19
.7(1
1.3,
32.
2)*
11.3
(5.1
, 23.
2)*
16.7
(8.4
, 30.
6)*
100
Resi
denc
eU
rban
23.4
(15.
5, 3
3.9)
17.6
(12.
0, 2
5.0)
18.4
(11.
6, 2
8.0)
18.4
(12.
8, 2
5.6)
22.2
(16.
2, 2
9.7)
100
Rura
l9.
7(7
.4, 1
2.7)
21.7
(17.
8, 2
6.3)
23.7
(20.
0, 2
7.8)
18.8
(15.
4, 2
2.7)
26.1
(22.
4, 3
0.0)
100
Educ
atio
n le
vel
No
form
al e
duca
tion
9.4
(6.9
, 12.
8)22
.5(1
7.8,
28.
0)23
.7(1
9.6,
28.
5)19
.8(1
5.7,
24.
7)24
.6(2
0.3,
29.
5)10
0Le
ss th
an p
rim
ary
13.1
(7.7
, 21.
4)18
.3(1
2.6,
26.
0)24
.4(1
7.5,
32.
9)13
.1(8
.4, 1
9.9)
*31
.0(2
3.2,
40.
0)10
0Pr
imar
y10
.4(4
.0, 2
4.4)
*20
.5(1
0.3,
36.
8)*
17.8
(8.8
, 32.
5)*
15.4
(8.0
, 27.
4)*
35.9
(22.
7, 5
1.8)
*10
0Le
ss th
an s
econ
dary
15.2
(8.2
, 26.
5)*
18.1
(9.4
, 32.
1)*
20.4
(12.
1, 3
2.1)
*25
.3(1
2.0,
45.
7)*
21.0
(12.
5, 3
3.1)
*10
0Se
cond
ary
and
abov
e21
.4(9
.0, 4
2.9)
*28
.0(1
1.6,
53.
5)*
25.2
(11.
5, 4
6.6)
*19
.2(6
.7, 4
3.9)
*6.
2(1
.3, 2
4.6)
*10
0W
ealth
inde
xLo
wes
t10
.3(7
.1, 1
4.8)
20.8
(15.
9, 2
6.9)
21.8
(16.
4, 2
8.4)
20.0
(14.
7, 2
6.5)
27.1
(21.
8, 3
3.0)
100
Low
10.5
(6.6
, 16.
5)21
.4(1
5.2,
29.
1)26
.7(2
0.6,
33.
9)17
.5(1
2.7,
23.
5)23
.9(1
8.0,
30.
9)10
0M
iddl
e10
.8(6
.6, 1
7.3)
20.2
(13.
2, 2
9.8)
18.2
(12.
2, 2
6.4)
19.8
(12.
7, 2
9.6)
30.9
(22.
2, 4
1.0)
100
Hig
h12
.6(7
.1, 2
1.4)
*24
.0(1
5.8,
34.
8)*
26.6
(18.
4, 3
6.8)
17.3
(10.
2, 2
7.7)
*19
.5(1
1.5,
31.
3)*
100
Hig
hest
26.6
(11.
1, 5
1.4)
*23
.8(8
.4, 5
1.5)
*24
.7(6
.7, 5
9.9)
*15
.4(5
.2, 3
7.8)
*9.
4(2
.0, 3
4.6)
*10
0O
ccup
atio
nEm
ploy
ed16
.8(7
.2, 3
4.6)
*38
.6(1
8.9,
63.
0)*
17.8
(6.0
, 42.
3)*
18.2
(7.7
, 37.
4)*
8.6
(2.0
, 30.
1)*
100
Busi
ness
14.5
(8.1
, 24.
5)*
17.2
(10.
0, 2
8.1)
*22
.2(1
4.8,
32.
0)*
19.7
(11.
7, 3
1.2)
*26
.3(1
7.9,
37.
0)10
0Fa
rmer
s10
.4(6
.9, 1
5.6)
24.3
(18.
2, 3
1.6)
23.1
(17.
6, 2
9.7)
15.2
(11.
0, 2
0.7)
26.9
(21.
5, 3
3.1)
100
Labo
urer
s9.
5(6
.7, 1
3.2)
18.7
(14.
4, 2
3.9)
24.6
(19.
8, 3
0.2)
20.2
(15.
5, 2
5.8)
27.1
(22.
0, 3
2.8)
100
Stud
ent
100.
0*
0.0
0.0
0.0
0.0
100
Hom
emak
er0.
010
0.0
*0.
00.
00.
010
0U
nem
ploy
ed20
.9(8
.2, 4
3.8)
*19
.8(7
.9, 4
1.3)
*14
.7(5
.0, 3
6.0)
*37
.0(1
2.0,
71.
7)*
7.6
(2.3
, 22.
5)*
100
1 A
mon
g da
ily b
idis
mok
ers.
* Es
timat
e ba
sed
on fe
wer
than
25
unw
eigh
ted
case
s.
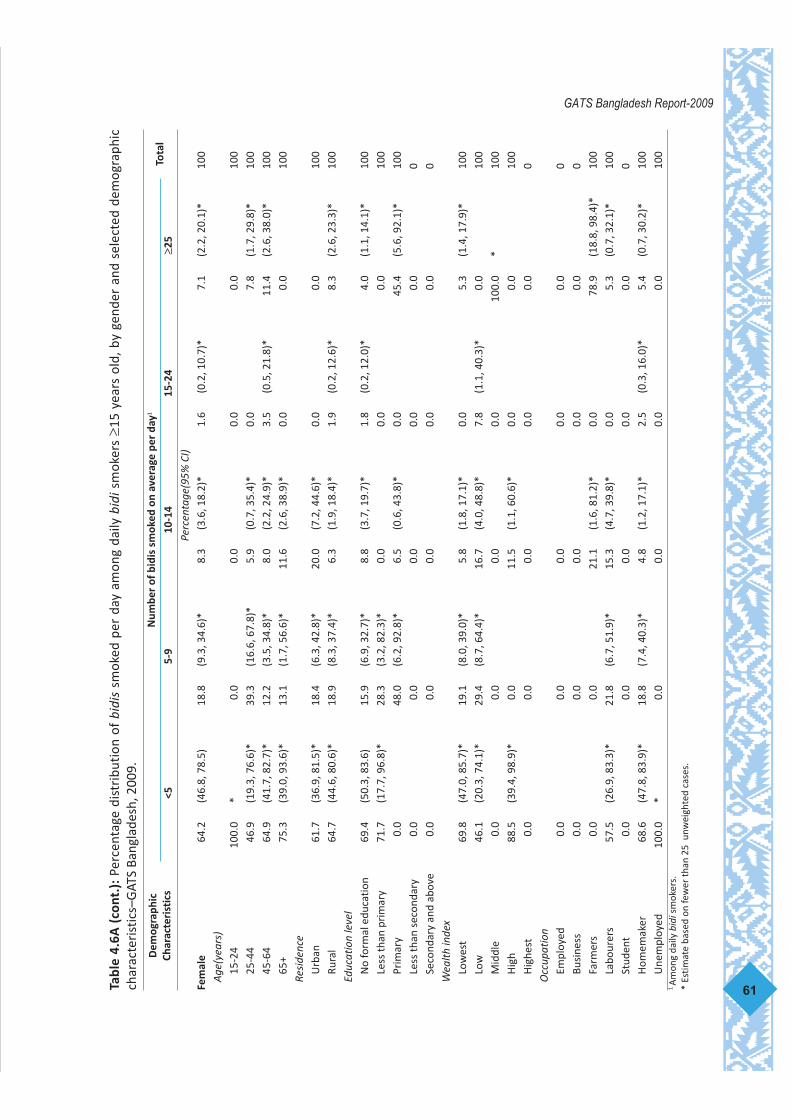
61
GATS Bangladesh Report-2009Ta
ble
4.6A
(co
nt.)
:Per
cent
age
dist
ribu
tion
of
bidi
ssm
oked
per
day
am
ong
daily
bid
ism
oker
s ≥1
5 ye
ars
old,
by
gend
er a
nd s
elec
ted
dem
ogra
phic
char
acte
rist
ics–
GAT
S Ba
ngla
desh
, 200
9.
Dem
ogra
phic
Char
acte
rist
ics
Num
ber
of b
idis
sm
oked
on
aver
age
per
day1
Tota
l<5
5-9
10-1
415
-24
≥25
Perc
enta
ge(9
5% C
I)Fe
mal
e64
.2(4
6.8,
78.
5)18
.8(9
.3, 3
4.6)
*8.
3(3
.6, 1
8.2)
*1.
6(0
.2, 1
0.7)
*7.
1(2
.2, 2
0.1)
*10
0A
ge(y
ears
)15
-24
100.
0*
0.0
0.0
0.0
0.0
100
25-4
446
.9(1
9.3,
76.
6)*
39.3
(16.
6, 6
7.8)
*5.
9(0
.7, 3
5.4)
*0.
07.
8(1
.7, 2
9.8)
*10
045
-64
64.9
(41.
7, 8
2.7)
*12
.2(3
.5, 3
4.8)
*8.
0(2
.2, 2
4.9)
*3.
5(0
.5, 2
1.8)
*11
.4(2
.6, 3
8.0)
*10
065
+75
.3(3
9.0,
93.
6)*
13.1
(1.7
, 56.
6)*
11.6
(2.6
, 38.
9)*
0.0
0.0
100
Resi
denc
eU
rban
61.7
(36.
9, 8
1.5)
*18
.4(6
.3, 4
2.8)
*20
.0(7
.2, 4
4.6)
*0.
00.
010
0Ru
ral
64.7
(44.
6, 8
0.6)
*18
.9(8
.3, 3
7.4)
*6.
3(1
.9, 1
8.4)
*1.
9(0
.2, 1
2.6)
*8.
3(2
.6, 2
3.3)
*10
0Ed
ucat
ion
leve
lN
o fo
rmal
edu
catio
n69
.4(5
0.3,
83.
6)15
.9(6
.9, 3
2.7)
*8.
8(3
.7, 1
9.7)
*1.
8(0
.2, 1
2.0)
*4.
0(1
.1, 1
4.1)
*10
0Le
ss th
an p
rim
ary
71.7
(17.
7, 9
6.8)
*28
.3(3
.2, 8
2.3)
*0.
00.
00.
010
0Pr
imar
y0.
048
.0(6
.2, 9
2.8)
*6.
5(0
.6, 4
3.8)
*0.
045
.4(5
.6, 9
2.1)
*10
0Le
ss th
an s
econ
dary
0.0
0.0
0.0
0.0
0.0
0Se
cond
ary
and
abov
e0.
00.
00.
00.
00.
00
Wea
lth in
dex
Low
est
69.8
(47.
0, 8
5.7)
*19
.1(8
.0, 3
9.0)
*5.
8(1
.8, 1
7.1)
*0.
05.
3(1
.4, 1
7.9)
*10
0Lo
w46
.1(2
0.3,
74.
1)*
29.4
(8.7
, 64.
4)*
16.7
(4.0
, 48.
8)*
7.8
(1.1
, 40.
3)*
0.0
100
Mid
dle
0.0
0.0
0.0
0.0
100.
0*
100
Hig
h88
.5(3
9.4,
98.
9)*
0.0
11.5
(1.1
, 60.
6)*
0.0
0.0
100
Hig
hest
0.0
0.0
0.0
0.0
0.0
0O
ccup
atio
nEm
ploy
ed0.
00.
00.
00.
00.
00
Busi
ness
0.0
0.0
0.0
0.0
0.0
0Fa
rmer
s0.
00.
021
.1(1
.6, 8
1.2)
*0.
078
.9(1
8.8,
98.
4)*
100
Labo
urer
s57
.5(2
6.9,
83.
3)*
21.8
(6.7
, 51.
9)*
15.3
(4.7
, 39.
8)*
0.0
5.3
(0.7
, 32.
1)*
100
Stud
ent
0.0
0.0
0.0
0.0
0.0
0H
omem
aker
68.6
(47.
8, 8
3.9)
*18
.8(7
.4, 4
0.3)
*4.
8(1
.2, 1
7.1)
*2.
5(0
.3, 1
6.0)
*5.
4(0
.7, 3
0.2)
*10
0U
nem
ploy
ed10
0.0
*0.
00.
00.
00.
010
01 A
mon
g da
ily b
idis
mok
ers.
* Es
timat
e ba
sed
on fe
wer
than
25
unw
eigh
ted
case
s.

62
GATS Bangladesh Report-2009Ta
ble
4.6B
: Per
cent
age
dist
ribu
tion
of s
mok
eles
s to
bacc
o us
e pe
r da
y am
ong
daily
sm
okel
ess
toba
cco
user
s ≥1
5 ye
ars
old,
by
gend
er a
nd s
elec
ted
dem
ogra
phic
cha
ract
eris
tics–
GAT
S Ba
ngla
desh
, 200
9.D
emog
raph
ic
char
acte
rist
ics
Num
ber
of ti
mes
sm
okel
ess
toba
cco
used
on
aver
age
per
day1
Tota
l<5
5-9
10-1
415
-24
≥25
Perc
enta
ge(9
5% C
I)O
vera
ll30
.9(2
8.0,
33.
9)37
.0(3
4.2,
39.
8)18
.9(1
6.6,
21.
5)10
.2(8
.4, 1
2.3)
3.0
(2.3
, 4.0
)10
0A
ge(y
ears
)15
-24
42.6
(25.
3, 6
1.8)
23.7
(14.
2, 3
6.9)
20.0
(9.9
, 36.
2)*
12.9
(6.1
, 25.
4)*
0.8
(0.1
, 5.8
)*10
025
-44
33.9
(29.
9, 3
8.2)
35.2
(31.
5, 3
9.1)
19.1
(16.
3, 2
2.3)
9.0
(6.8
, 11.
7)2.
7(1
.7, 4
.3)
100
45-6
427
.7(2
3.7,
32.
0)38
.6(3
3.6,
43.
7)20
.4(1
6.5,
24.
9)9.
7(7
.6, 1
2.4)
3.7
(2.4
, 5.5
)10
065
+25
.9(2
0.0,
32.
9)43
.0(3
6.4,
49.
8)14
.1(1
0.2,
19.
4)13
.8(9
.2, 2
0.3)
3.1
(1.4
, 6.7
)*10
0Re
side
nce
Urb
an32
.0(2
5.4,
39.
4)35
.4(3
0.7,
40.
3)18
.3(1
5.0,
22.
1)11
.5(9
.0, 1
4.5)
2.9
(1.8
, 4.6
)10
0Ru
ral
30.6
(27.
5, 3
3.8)
37.4
(34.
1, 4
0.8)
19.1
(16.
3, 2
2.2)
9.9
(7.8
, 12.
5)3.
1(2
.2, 4
.3)
100
Educ
atio
n le
vel
No
form
al e
duca
tion
30.1
(27.
0, 3
3.4)
37.1
(33.
8, 4
0.5)
19.0
(16.
3, 2
2.1)
10.3
(8.1
, 13.
1)3.
4(2
.5, 4
.8)
100
Less
than
pri
mar
y28
.0(2
1.9,
35.
0)40
.4(3
3.3,
47.
9)19
.2(1
4.1,
25.
5)9.
2(6
.2, 1
3.4)
3.2
(1.5
, 7.1
)*10
0Pr
imar
y33
.1(2
3.7,
44.
2)35
.4(2
6.8,
45.
1)15
.6(1
0.7,
22.
2)12
.5(7
.9, 1
9.4)
3.4
(1.7
, 6.6
)*10
0Le
ss th
an s
econ
dary
38.0
(30.
9, 4
5.7)
29.3
(23.
1, 3
6.5)
21.8
(15.
9, 2
9.1)
9.8
(5.9
, 15.
7)*
1.0
(0.4
, 2.8
)*10
0Se
cond
ary
and
abov
e31
.1(2
0.9,
43.
6)38
.6(2
7.4,
51.
1)20
.3(8
.8, 4
0.3)
*8.
7(3
.4, 2
0.7)
*1.
3(0
.3, 6
.0)*
100
Wea
lth in
dex
Low
est
32.6
(27.
9, 3
7.6)
39.5
(35.
0, 4
4.2)
15.3
(12.
3, 1
9.0)
9.8
(7.0
, 13.
5)2.
8(1
.7, 4
.6)*
100
Low
31.7
(26.
8, 3
7.0)
34.1
(29.
9, 3
8.6)
17.8
(14.
3, 2
2.0)
12.2
(9.4
, 15.
8)4.
1(2
.4, 6
.9)*
100
Mid
dle
27.8
(22.
9, 3
3.4)
35.0
(29.
1, 4
1.3)
25.8
(20.
2, 3
2.2)
9.2
(6.0
, 13.
8)2.
3(1
.2, 4
.4)*
100
Hig
h32
.6(2
5.7,
40.
4)35
.1(2
9.3,
41.
3)18
.6(1
3.6,
25.
0)10
.8(7
.4, 1
5.5)
2.8
(1.4
, 5.7
)*10
0H
ighe
st26
.4(1
9.8,
34.
2)46
.2(3
6.5,
56.
1)18
.2(1
2.3,
26.
2)6.
6(3
.2, 1
3.3)
*2.
6(1
.2, 5
.7)*
100
Occ
upat
ion
Empl
oyed
33.0
(23.
7, 4
3.9)
32.7
(23.
7, 4
3.2)
17.7
(11.
4, 2
6.5)
12.6
(7.0
, 21.
7)*
4.0
(1.5
, 10.
0)*
100
Busi
ness
31.1
(23.
0, 4
0.5)
31.8
(24.
6, 4
0.1)
19.4
(11.
5, 3
0.7)
11.6
(7.0
, 18.
8)*
6.1
(3.0
, 11.
8)*
100
Farm
ers
28.4
(21.
8, 3
6.0)
32.9
(26.
3, 4
0.2)
19.3
(14.
1, 2
5.8)
13.9
(9.3
, 20.
2)5.
6(3
.1, 9
.9)*
100
Labo
urer
s35
.0(2
9.1,
41.
4)29
.4(2
3.8,
35.
7)23
.5(1
8.2,
29.
8)9.
5(6
.8, 1
3.1)
2.6
(1.5
, 4.5
)*10
0St
uden
t0.
00.
010
0.0
*0.
00.
010
0H
omem
aker
30.3
(26.
3, 3
4.6)
41.1
(37.
3, 4
5.0)
17.4
(14.
6, 2
0.7)
9.1
(6.7
, 12.
4)2.
0(1
.2, 3
.4)*
100
Une
mpl
oyed
25.1
(17.
1, 3
5.3)
50.3
(39.
3, 6
1.4)
13.3
(7.8
, 21.
5)*
9.6
(4.4
, 19.
6)*
1.7
(0.5
, 5.4
)*10
01 A
mon
g da
ily s
mok
eles
s to
bacc
o us
ers.
Sm
okel
ess
toba
cco
incl
udes
Bet
el q
uid
with
zar
da, z
arda
only
, or
zard
aw
ith s
upar
i, Be
tel q
uid
with
sad
a pa
ta, P
an M
asal
aw
ith to
bacc
o, S
ada
pata
chew
ing,
Gul
,Kh
oine
e, o
r ot
her.
* Es
timat
e ba
sed
on fe
wer
than
25
unw
eigh
ted
case
s.

63
GATS Bangladesh Report-2009Ta
ble
4.6B
(con
t.):
Perc
enta
ge d
istr
ibut
ion
of s
mok
eles
s to
bacc
o us
e pe
r day
am
ong
daily
sm
okel
ess
toba
cco
user
s ≥1
5 ye
ars
old,
by
gend
er a
nd s
elec
ted
dem
ogra
phic
cha
ract
eris
tics–
GAT
S Ba
ngla
desh
, 200
9.D
emog
raph
icch
arac
teri
stic
sN
umbe
r of
tim
es s
mok
eles
s to
bacc
o us
ed o
n av
erag
e pe
r da
y1
Tota
l<5
5-9
10-1
415
-24
≥25
Perc
enta
ge(9
5% C
I)M
ale
31.8
(27.
4, 3
6.6)
32.3
(28.
7, 3
6.1)
20.9
(16.
6, 2
6.0)
11.2
(8.7
, 14.
2)3.
8(2
.6, 5
.7)
100
Age
(yea
rs)
15-2
449
.6(2
6.2,
73.
2)*
18.0
(8.2
, 35.
3)*
23.9
(9.7
, 47.
8)*
8.4
(2.9
, 22.
1)*
0.0
100
25-4
431
.6(2
6.2,
37.
7)34
.1(2
8.4,
40.
3)20
.2(1
5.6,
25.
8)9.
9(6
.9, 1
4.0)
4.2
(2.5
, 7.0
)*10
045
-64
28.2
(22.
0, 3
5.3)
31.5
(25.
0, 3
8.8)
23.3
(15.
8, 3
3.0)
12.2
(8.5
, 17.
2)4.
8(2
.6, 8
.7)*
100
65+
30.6
(21.
4, 4
1.7)
37.6
(27.
8, 4
8.5)
15.2
(9.1
, 24.
1)*
14.0
(7.3
, 25.
2)*
2.6
(0.6
, 10.
8)*
100
Resi
denc
eU
rban
30.7
(24.
5, 3
7.6)
33.5
(28.
5, 3
8.9)
20.5
(15.
6, 2
6.5)
12.6
(8.8
, 17.
7)2.
7(1
.4, 5
.1)*
100
Rura
l32
.1(2
6.9,
37.
8)31
.9(2
7.7,
36.
5)21
.0(1
5.8,
27.
4)10
.8(8
.0, 1
4.5)
4.1
(2.6
, 6.4
)*10
0Ed
ucat
ion
leve
lN
o fo
rmal
edu
catio
n33
.5(2
8.0,
39.
4)29
.5(2
4.7,
34.
9)20
.9(1
6.2,
26.
5)11
.7(8
.3, 1
6.4)
4.4
(2.6
, 7.1
)*10
0Le
ss th
an p
rim
ary
29.2
(19.
4, 4
1.5)
35.6
(26.
9, 4
5.5)
22.1
(14.
5, 3
2.1)
8.0
(4.7
, 13.
2)*
5.0
(2.0
, 12.
2)*
100
Prim
ary
25.9
(17.
1, 3
7.1)
34.9
(23.
8, 4
8.0)
18.1
(10.
4, 2
9.5)
*16
.3(9
.3, 2
7.0)
*4.
8(2
.0, 1
1.2)
*10
0Le
ss th
an s
econ
dary
38.3
(27.
6, 5
0.2)
31.1
(23.
1, 4
0.4)
19.6
(12.
4, 2
9.7)
10.1
(5.3
, 18.
3)*
0.9
(0.2
, 4.3
)*10
0Se
cond
ary
and
abov
e27
.6(1
6.9,
41.
6)36
.2(2
3.9,
50.
8)24
.1(1
0.2,
47.
0)*
10.5
(3.9
, 25.
1)*
1.6
(0.3
, 7.4
)*10
0W
ealth
inde
xLo
wes
t32
.5(2
5.6,
40.
3)38
.6(3
1.8,
45.
8)14
.6(1
0.3,
20.
3)10
.6(6
.2, 1
7.3)
*3.
8(1
.8, 7
.7)*
100
Low
34.8
(26.
6, 4
4.2)
31.0
(24.
9, 3
7.8)
16.8
(11.
5, 2
3.9)
12.3
(8.3
, 18.
0)5.
1(2
.3, 1
0.5)
*10
0M
iddl
e27
.8(2
0.2,
36.
9)24
.7(1
7.7,
33.
3)31
.2(2
1.7,
42.
5)13
.9(8
.6, 2
1.7)
*2.
5(1
.1, 5
.5)*
100
Hig
h34
.5(2
5.8,
44.
4)29
.1(2
1.8,
37.
8)24
.6(1
5.7,
36.
5)8.
1(4
.9, 1
3.2)
*3.
6(1
.4, 8
.8)*
100
Hig
hest
23.2
(14.
3, 3
5.3)
47.6
(33.
9, 6
1.6)
16.5
(8.7
, 29.
1)*
8.9
(2.7
, 25.
7)*
3.9
(1.2
, 12.
0)*
100
Occ
upat
ion
Empl
oyed
34.1
(23.
2, 4
7.0)
33.1
(22.
8, 4
5.4)
17.1
(10.
1, 2
7.6)
*12
.2(6
.4, 2
2.1)
*3.
4(1
.0, 1
0.9)
*10
0Bu
sine
ss30
.6(2
2.3,
40.
3)32
.6(2
4.6,
41.
7)20
.6(1
2.2,
32.
7)11
.6(6
.7, 1
9.3)
*4.
6(2
.1, 1
0.0)
*10
0Fa
rmer
s28
.9(2
2.2,
36.
6)33
.0(2
6.5,
40.
3)19
.6(1
4.4,
26.
3)12
.8(8
.6, 1
8.6)
5.7
(3.2
, 10.
1)*
100
Labo
urer
s34
.9(2
8.3,
42.
1)30
.7(2
4.5,
37.
6)23
.1(1
6.2,
31.
8)9.
1(6
.1, 1
3.4)
2.2
(1.0
, 4.6
)*10
0St
uden
t0.
00.
010
0.0
*0.
00.
010
0H
omem
aker
0.0
32.6
(7.4
, 74.
5)*
28.7
(4.2
, 78.
9)*
28.8
(4.2
, 78.
9)*
9.9
(1.2
, 50.
1)*
100
Une
mpl
oyed
35.4
(21.
8, 5
1.9)
*35
.6(2
2.4,
51.
3)17
.4(8
.9, 3
1.4)
*9.
9(3
.4, 2
5.5)
*1.
6(0
.2, 1
0.9)
*10
01 A
mon
g da
ily s
mok
eles
s to
bacc
o us
ers.
Sm
okel
ess
toba
cco
incl
udes
Bet
el q
uid
with
zar
da, z
arda
only
, or
zard
aw
ith s
upar
i, Be
tel q
uid
with
sad
a pa
ta, P
an M
asal
aw
ith to
bacc
o, S
ada
pata
chew
ing,
Gul
,Kh
oine
e, o
r ot
her.
* Es
timat
e ba
sed
on fe
wer
than
25
unw
eigh
ted
case
s.

64
GATS Bangladesh Report-2009Ta
ble
4.6B
(con
t.):
Perc
enta
ge d
istr
ibut
ion
of s
mok
eles
s to
bacc
o us
e pe
r day
am
ong
daily
sm
okel
ess
toba
cco
user
s ≥15
yea
rs o
ld, b
y ge
nder
and
sel
ecte
dde
mog
raph
ic c
hara
cter
istic
s–G
ATS
Bang
lade
sh, 2
009.
Dem
ogra
phic
char
acte
rist
ics
Num
ber
of ti
mes
sm
okel
ess
toba
cco
used
on
aver
age
per
day1
Tota
l<5
5-9
10-1
415
-24
≥25
Perc
enta
ge(9
5% C
I)Fe
mal
e30
.1(2
6.6,
33.
9)40
.6(3
7.1,
44.
2)17
.4(1
5.1,
20.
0)9.
5(7
.3, 1
2.2)
2.4
(1.6
, 3.7
)10
0A
ge(y
ears
)15
-24
28.9
(14.
5, 4
9.5)
*34
.7(2
0.0,
52.
9)*
12.5
(5.8
, 24.
9)*
21.5
(8.4
, 45.
2)*
2.4
(0.3
, 15.
3)*
100
25-4
435
.6(3
0.7,
40.
7)36
.1(3
1.4,
41.
0)18
.3(1
5.1,
22.
1)8.
3(5
.7, 1
2.0)
1.7
(0.6
, 4.2
)*10
045
-64
27.3
(22.
6, 3
2.6)
43.5
(37.
9, 4
9.2)
18.3
(14.
5, 2
2.9)
8.0
(5.8
, 11.
1)2.
8(1
.6, 5
.0)*
100
65+
22.5
(15.
6, 3
1.2)
46.9
(37.
9, 5
6.2)
13.4
(8.7
, 20.
2)*
13.7
(7.7
, 23.
3)*
3.5
(1.3
, 8.7
)*10
0Re
side
nce
Urb
an33
.0(2
4.5,
42.
8)36
.7(3
0.6,
43.
3)16
.7(1
2.8,
21.
4)10
.6(7
.5, 1
4.9)
3.0
(1.6
, 5.6
)*10
0Ru
ral
29.4
(25.
7, 3
3.3)
41.6
(37.
5, 4
5.8)
17.6
(14.
9, 2
0.7)
9.2
(6.6
, 12.
6)2.
3(1
.3, 3
.9)*
100
Educ
atio
n le
vel
No
form
al e
duca
tion
28.4
(24.
8, 3
2.2)
41.0
(37.
2, 4
4.9)
18.1
(14.
9, 2
1.7)
9.6
(7.1
, 12.
7)3.
0(1
.8, 4
.8)*
100
Less
than
pri
mar
y26
.5(1
9.5,
34.
9)46
.1(3
6.5,
55.
9)15
.8(1
0.3,
23.
4)10
.5(5
.3, 1
9.8)
*1.
1(0
.4, 3
.4)*
100
Prim
ary
39.2
(24.
9, 5
5.7)
35.8
(24.
7, 4
8.6)
13.5
(8.1
, 21.
7)*
9.4
(4.5
, 18.
6)*
2.1
(0.7
, 6.2
)*10
0Le
ss th
an s
econ
dary
37.7
(28.
0, 4
8.5)
26.6
(17.
9, 3
7.7)
25.2
(15.
9, 3
7.5)
*9.
3(3
.8, 2
0.9)
*1.
3(0
.4, 4
.2)*
100
Seco
ndar
y an
d ab
ove
45.8
(24.
7, 6
8.6)
*48
.3(2
6.9,
70.
3)*
4.6
(1.1
, 17.
9)*
1.3
(0.2
, 9.0
)*0.
010
0W
ealth
inde
xLo
wes
t32
.6(2
6.8,
39.
1)40
.1(3
4.9,
45.
6)15
.8(1
1.8,
21.
0)9.
2(6
.1, 1
3.7)
2.2
(1.0
, 4.5
)*10
0Lo
w29
.0(2
3.0,
35.
9)36
.9(3
1.0,
43.
1)18
.7(1
4.2,
24.
3)12
.1(8
.3, 1
7.5)
3.3
(1.7
, 6.6
)*10
0M
iddl
e27
.9(2
1.5,
35.
2)44
.5(3
6.7,
52.
5)20
.7(1
5.1,
27.
8)4.
9(2
.6, 9
.1)*
2.1
(0.7
, 6.2
)*10
0H
igh
31.2
(22.
6, 4
1.3)
39.8
(31.
9, 4
8.3)
13.9
(9.4
, 20.
2)12
.9(7
.8, 2
0.7)
2.2
(0.7
, 7.0
)*10
0H
ighe
st28
.2(1
9.6,
38.
6)45
.4(3
2.6,
58.
8)19
.2(1
1.7,
29.
9)*
5.3
(2.2
, 12.
4)*
1.9
(0.7
, 5.4
)*10
0O
ccup
atio
nEm
ploy
ed28
.0(1
6.5,
43.
3)*
30.8
(17.
9, 4
7.7)
*20
.3(1
0.4,
35.
8)*
14.4
(5.6
, 31.
9)*
6.5
(1.6
, 23.
3)*
100
Busi
ness
36.6
(17.
4, 6
1.3)
*23
.5(7
.9, 5
2.3)
*5.
3(0
.7, 3
0.4)
*12
.2(3
.7, 3
3.7)
*22
.4(5
.5, 5
8.6)
*10
0Fa
rmer
s0.
024
.3(1
.9, 8
3.9)
*0.
075
.7(1
6.1,
98.
1)*
0.0
100
Labo
urer
s35
.2(2
5.5,
46.
2)25
.9(1
8.1,
35.
5)24
.7(1
7.7,
33.
2)10
.6(6
.0, 1
8.0)
*3.
7(1
.6, 8
.3)*
100
Stud
ent
0.0
0.0
0.0
0.0
0.0
0H
omem
aker
30.6
(26.
6, 3
4.9)
41.2
(37.
4, 4
5.1)
17.3
(14.
5, 2
0.5)
8.9
(6.6
, 11.
9)1.
9(1
.1, 3
.3)*
100
Une
mpl
oyed
15.9
(8.3
, 28.
5)*
63.4
(49.
2, 7
5.7)
9.6
(4.2
, 20.
2)*
9.3
(3.0
, 25.
5)*
1.7
(0.4
, 6.9
)*10
01 A
mon
g da
ily s
mok
eles
s to
bacc
o us
ers.
Sm
okel
ess
toba
cco
incl
udes
Bet
el q
uid
with
zar
da, z
arda
only
, or
zard
aw
ith s
upar
i, Be
tel q
uid
with
sad
a pa
ta, P
an M
asal
aw
ith to
bacc
o, S
ada
pata
chew
ing,
Gul
,Kh
oine
e, o
r ot
her.
* Es
timat
e ba
sed
on fe
wer
than
25
unw
eigh
ted
case
s.

4.7 Age at smoking initiation
The overall mean (CI) of the age at daily smoking initiation was 18.8 (18.4, 19.2) years and formale smokers 18.4 (18.1, 18.8) years, and for female smokers 26.5 (21.6, 31.3) yearsrespectively. The mean (CI) of the age at daily smoking initiation in urban respondents was18.5 (17.9, 19.1) years and in rural respondents 18.9 (18.4, 19.3) years.
Table 4.7 reports the age of smoking initiation among daily smokers ages 20-34 years. Overall,most smokers report initiating smoking at age 20 and over (38.0%); 25% began smokingbetween the ages of 15 and16, and 18.5% began smoking between the ages of 17-19 and <15years of age. By gender, males and females began smoking aged 20 years and older, with61.5% of females reporting smoking initiation at aged 20 and over (the figure was 37.0% formales). Among males, 25.5% began smoking between the ages of 15-16 years and 18.4%began smoking under age 15; 19.1% began between the ages of 17 and 19 years.
By residence, the distribution of initiation of smoking does not vary greatly; 19% of ruralsmokers began smoking under the age of 15 and 16.7% of urban smokers. Among those whobegan smoking between the ages of 15-16 years, 24.4% were rural residents and 26.7% urbanresidents. Among urban smokers, 21.0% initiate smoking between the ages 17-19, comparedto 17.7% of rural smokers. Significant percentages of both urban and rural smokers beginsmoking after age 20 years (35.6% and 38.9%).
By education level, across all levels of education, most persons began smoking after age20–48.3% of those with secondary education and above, and 35.5% of those with no formalschooling. Nine percent of those with secondary and above education who are smokers, begansmoking under the age of 15, compare to 26.6% of persons with no formal schooling. A similarpattern is seen by wealth index. Across all wealth index categories the majority of peoplebegin smoking after age 20. Of those in the highest category 47.8% began smoking after age20, compared to 33.2% of those in the lowest category. Among those in the highest category,11.5% began smoking at less than 15 years of age; the comparable figure in the lowestcategory was more than double (26.6%).
In term of occupational category, most employed persons began smoking after age 20(48.3%), and only 7.6% began before under the age of 15 years. Among business people asimilar pattern is seen; most began after age 20 (45.2%) and only 14.3% began before age 15years. Among farmers, 16.9% began under the age of 15 years and 39.4% began after age 20.Among labourers, the age distribution is less marked, 29.8% having begun smoking after age20, 18.6% between 17-19 years, 29.1% between ages 15 and 16 years and 22.5% before ageof 15. Among homemakers 64.3% began after age 20 and among the unemployed 23.1%began before age of 15.
65
GATS Bangladesh Report-2009

Table 4.7: Percentage distribution of age at smoking initiation among ever daily smokers 20-34 yearsold, by selected demographic characteristics–GATS Bangladesh, 2009.
4.8 Former daily smoking prevalence and quit ratio Quit ratio is the percentage of ever daily tobacco smokers who currently do not smoketobacco. The indicator indicates the success of efforts to encourage cessation amongestablished tobacco smokers. Table 4.8 presents the prevalence rate of former daily smokersamong all adults aged 15 years and over and the quit rate among those who had ever smokeddaily. The prevalence rate of those who are former daily smokers among adults aged 15 yearsand over was 4.7%, and the quit rate was 17.8%. By demographic characteristics, theprevalence rate among male former daily smokers is 8 times that of females (8.4% and 1.0%).However, female former daily smokers have a higher quit rate than male daily smokers (41.3%against 16.6%). By age group, 15–24 years has the lowest rate (though too insignificant toreport due to cell size) and the age group of 65 years and older has the highest proportion offormer daily smokers (0.9% and 21.1%, respectively) among all adults . They (15-24 years and65 years and above) also have the lowest and highest quit rates of 7.7% and 48.4%,respectively among the ever daily smokers.
Though the percentage for former daily smokers among all adults in both rural and urbanareas (4.7%) was same, but among ever daily smokers, urban areas have a slightly higher quit
66
GATS Bangladesh Report-2009
DemographicCharacteristics
Age at Smoking Initiation (years)1
<15 15-16 17-19 20+ TotalPercentage (95% CI)
Overall 18.5 (16.3, 20.9) 25.0 (22.6, 27.6) 18.5 (16.5, 20.7) 38.0 (35.4, 40.7) 100Gender
Male 18.4 (16.3, 20.8) 25.5 (23.1, 28.0) 19.1 (17.0, 21.3) 37.0 (34.4, 39.8) 100Female 19.5 (10.3, 33.9)* 14.2 (6.7, 27.6)* 4.8 (2.0, 11.4)* 61.5 (48.7, 72.8) 100
ResidenceUrban 16.7 (14.1, 19.7) 26.7 (23.5, 30.2) 21.0 (18.5, 23.8) 35.5 (30.1, 41.4) 100Rural 19.0 (16.3, 22.1) 24.4 (21.5, 27.6) 17.7 (15.2, 20.4) 38.9 (36.0, 41.8) 100
Education levelNo formal education 22.8 (19.3, 26.6) 26.4 (22.7, 30.4) 15.3 (12.6, 18.5) 35.5 (32.0, 39.2) 100Less than primary 16.1 (11.5, 22.0) 26.2 (21.7, 31.2) 23.5 (17.8, 30.4) 34.2 (28.8, 40.0) 100Primary 13.1 (8.8, 19.0) 26.4 (18.8, 35.8) 19.9 (13.9, 27.7) 40.6 (32.3, 49.4) 100Less than secondary 16.5 (11.3, 23.7) 21.1 (15.2, 28.4) 19.1 (14.7, 24.4) 43.3 (36.4, 50.5) 100Secondary and above 9.0 (5.1, 15.3) 20.4 (15.0, 27.1) 22.3 (16.9, 29.0) 48.3 (40.6, 56.1) 100
Wealth indexLowest 26.6 (21.6, 32.2) 23.8 (19.1, 29.3) 16.4 (13.0, 20.5) 33.3 (28.9, 38.0) 100Low 20.2 (16.2, 25.0) 28.2 (23.7, 33.2) 17.8 (14.1, 22.4) 33.8 (29.2, 38.6) 100Middle 12.7 (8.9, 17.7) 29.5 (24.3, 35.3) 17.6 (13.5, 22.6) 40.2 (34.4, 46.3) 100High 16.1 (12.2, 20.9) 21.1 (16.9, 26.1) 20.4 (15.4, 26.6) 42.4 (36.0, 49.1) 100Highest 11.5 (7.1, 18.1) 17.2 (13.1, 22.4) 23.5 (17.6, 30.6) 47.8 (40.2, 55.5) 100
OccupationEmployed 7.6 (4.7, 12.1) 20.9 (16.1, 26.6) 23.2 (17.1, 30.8) 48.2 (39.4, 57.2) 100Business 14.3 (10.9, 18.6) 21.6 (17.4, 26.4) 18.9 (14.4, 24.4) 45.2 (38.0, 52.6) 100Farmers 16.9 (13.3, 21.3) 22.8 (18.6, 27.6) 20.9 (16.9, 25.6) 39.4 (34.4, 44.6) 100Labourers 22.5 (18.9, 26.4) 29.1 (25.0, 33.4) 18.6 (15.2, 22.6) 29.9 (26.4, 33.6) 100Student 16.9 (4.2, 48.5)* 30.0 (8.0, 67.9)* 33.4 (13.7, 61.2)* 19.8 (7.1, 44.4)* 100Homemaker 22.2 (10.2, 41.9)* 10.6 (4.5, 23.0)* 2.9 (0.9, 9.1)* 64.3 (47.4, 78.2) 100Unemployed 23.1 (15.1, 33.6) 30.1 (19.9, 42.8) 8.1 (4.8, 13.2)* 38.7 (29.0, 49.5) 100
1Among respondents 20-34 years of age who are ever daily smokers* Estimate based on fewer than 25 unweighted cases.

rate than rural areas (19.1% and 17.3%, respectively). By educational level, the highestpercentages of former daily smokers were found among those with no formal education or lessthan primary education (6.1%). Persons with a secondary school education and above havethe highest quit rate (23.2%).
By socioeconomic status, the highest proportion of former daily smokers was found in thelowest SES (4.8%) category whereas the highest quit rate (24.0%) was found in the highestSES category. By occupation, unemployed adults (14.8%) followed by the business category(10.3%) have the highest rate of former daily smokers, while homemakers (43.9%) followedby unemployed (41.0%) adults have the highest quit rates.
Table 4.8: Percentage of all adults and ever daily smokers ≥15 years old who are former dailysmokers, by selected demographic characteristics–GATS Bangladesh, 2009.
67
GATS Bangladesh Report-2009
Demographiccharacteristics
Former Daily Smokers1
(Among All Adults)Former Daily Smokers1 (Among
Ever Daily Smokers)2
Percentage (95% CI )Overall 4.7 (4.1, 5.3) 17.8 (15.6, 20.1)
GenderMale 8.4 (7.3, 9.8) 16.6 (14.5, 19.1)Female 1.0 (0.6, 1.5) 41.3 (31.1, 52.3)
Age (years)15-24 0.9 (0.4, 2.0)* 7.7 (3.4, 16.6)*25-44 2.3 (1.7, 3.0) 8.6 (6.4, 11.5)45-64 9.8 (8.2, 11.8) 23.5 (19.6, 27.9)65+ 21.1 (17.1, 25.7) 48.4 (40.7, 56.1)
ResidenceUrban 4.7 (3.8, 5.8) 19.1 (15.6, 23.2)Rural 4.7 (4.0, 5.5) 17.3 (14.8, 20.1)
Education levelNo formal education 6.1 (5.2, 7.3) 17.0 (14.4, 19.9)Less than primary 6.1 (4.4, 8.6) 19.4 (14.0, 26.3)Primary 2.6 (1.6, 4.0) 13.5 (8.8, 20.3)Less than secondary 3.2 (2.4, 4.3) 17.4 (13.2, 22.5)Secondary and above 3.7 (2.8, 4.9) 23.2 (17.9, 29.6)
Wealth indexLowest 4.8 (3.8, 6.2) 14.5 (11.5, 18.2)Low 4.7 (3.5, 6.3) 16.2 (12.2, 21.2)Middle 5.2 (4.0, 6.7) 18.8 (14.6, 23.8)High 4.5 (3.3, 6.2) 19.6 (14.3, 26.1)Highest 4.0 (3.1, 5.2) 24.0 (18.9, 29.9)
OccupationEmployed 3.8 (2.8, 5.3) 13.4 (9.5, 18.5)Business 10.3 (6.7, 15.3) 20.1 (13.9, 28.2)Farmers 9.3 (7.4, 11.8) 15.7 (12.5, 19.5)Labourers 5.9 (4.5, 7.6) 12.1 (9.4, 15.5)Student 0.4 (0.1, 2.8)* 12.8 (1.7, 55.9)*Homemaker 1.0 (0.6, 1.6) 43.9 (30.5, 58.3)Unemployed 14.8 (10.9, 19.7) 41.0 (31.2, 51.6)
1 Current non-smokers.2 Also known as the quit ratio for daily smoking.* Estimate based on fewer than 25 unweighted cases.

4.9 Time since quitting smoking and smokeless tobacco
The overall mean (CI) of the time since quitting smoking in years was 12.0 (10.5, 13.6); formales it was 11.8 (10.2, 13.4) years and for females it was 14.1 (9.5, 18.8) years. The mean (CI)of the time since quitting smoking in years in urban respondents was 11.4 (8.0, 14.7) years andin rural respondents was 12.3 (10.6, 13.9) years.
The overall mean (CI) of the time since quitting smokeless tobacco use in years was 13.2 (7.1,19.3) years; for males it was 12.4 (6.3, 18.4) years and for females it was 26.2 (1.3, 51.1) years.The mean (CI) of the time since quitting smokeless tobacco use in years in urban respondentswas 10.7 (6.7, 14.7) years and in rural respondents was 14.6 (5.5, 23.7) years.
Table 4.9 and 4.9a show the time since quitting smoking and smokeless tobacco among formerdaily smokers and smokeless tobacco users aged 15 years and above, respectively. These wereclassified into four categories according to the time since they quit smoking: less than 1 year,1 to less than 5 years, 5 to less than 10 years, and 10 years or more. Among these categoriesthe majority of smokers who quit smoking were in the group who had quit for 10 years ormore (49.6%), followed by 5 to less than 10 years (20.5%), 1 to less than 5 years (16.8%), andless than 1 year (13.1%). The estimates in Table 4.9a were based on fewer than 25 unweightedcases and thus not reported for any demographic characteristics.
When classified by demographic characteristics such as sex, age (except young smokers),residence, educational status, SES and occupation, most of the former daily smokers from allcategories reported quitting smoking for more than 10 years. Female former daily smokershave a higher prevalence of having quit for more than 10 years than males (49.6% and 48.3%,respectively). Former daily smokers who are 65 or more years old have the highest proportionof those having quit smoking for more than 10 years (63.1%). The proportion of those havingquit smoking for more than 10 years among former daily smokers in rural areas was higherthan for urban areas (51.3% and 44.5%, respectively).
The highest and lowest proportions of those having quit smoking for more than 10 yearsare found among former daily smokers who have no formal education, and those with lessthan primary-level education (54.9% and 38.9%, respectively). By SES, proportions of formerdaily smokers who had quit smoking for more than 10 years varied between 38.8% in highSES to 58.7% in middle SES. Among all occupation categories, the majority had quit smokingfor more than 10 years with the highest rate being reported among farmers (70.2%).
68
GATS Bangladesh Report-2009
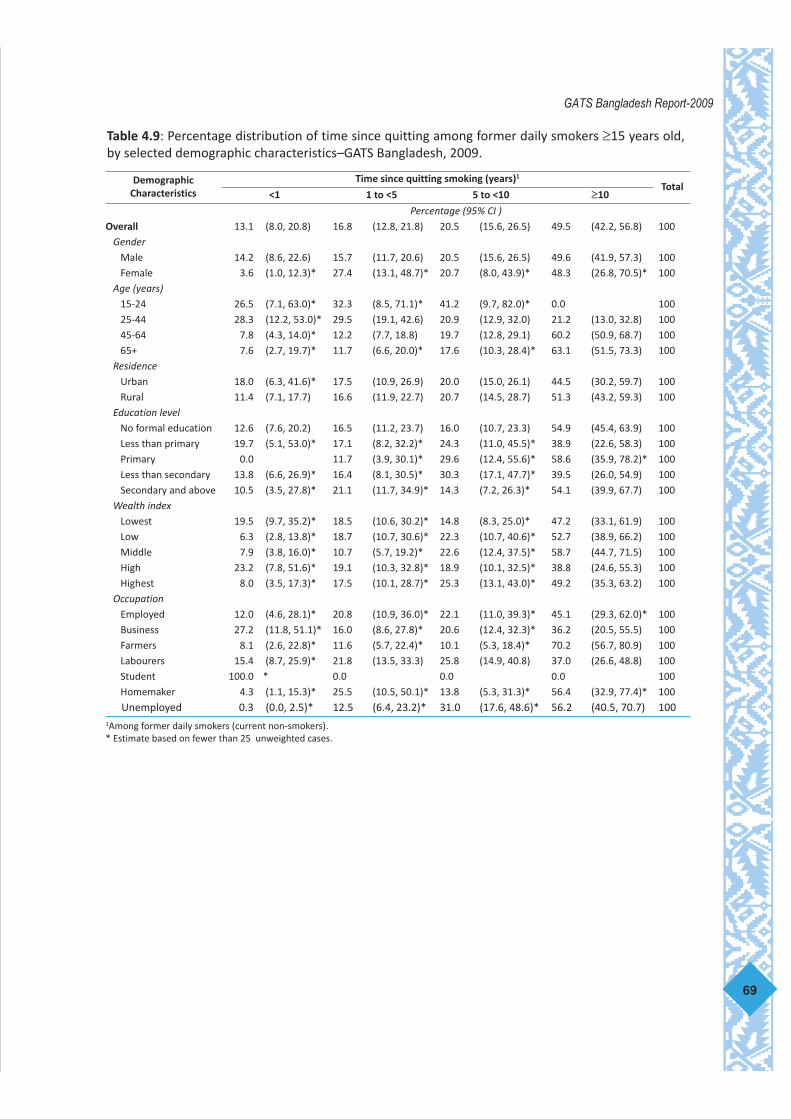
Table 4.9: Percentage distribution of time since quitting among former daily smokers ≥15 years old,by selected demographic characteristics–GATS Bangladesh, 2009.
69
GATS Bangladesh Report-2009
DemographicCharacteristics
Time since quitting smoking (years)1
Total<1 1 to <5 5 to <10 ≥10
Percentage (95% CI )Overall 13.1 (8.0, 20.8) 16.8 (12.8, 21.8) 20.5 (15.6, 26.5) 49.5 (42.2, 56.8) 100
GenderMale 14.2 (8.6, 22.6) 15.7 (11.7, 20.6) 20.5 (15.6, 26.5) 49.6 (41.9, 57.3) 100Female 3.6 (1.0, 12.3)* 27.4 (13.1, 48.7)* 20.7 (8.0, 43.9)* 48.3 (26.8, 70.5)* 100
Age (years)15-24 26.5 (7.1, 63.0)* 32.3 (8.5, 71.1)* 41.2 (9.7, 82.0)* 0.0 10025-44 28.3 (12.2, 53.0)* 29.5 (19.1, 42.6) 20.9 (12.9, 32.0) 21.2 (13.0, 32.8) 10045-64 7.8 (4.3, 14.0)* 12.2 (7.7, 18.8) 19.7 (12.8, 29.1) 60.2 (50.9, 68.7) 10065+ 7.6 (2.7, 19.7)* 11.7 (6.6, 20.0)* 17.6 (10.3, 28.4)* 63.1 (51.5, 73.3) 100
ResidenceUrban 18.0 (6.3, 41.6)* 17.5 (10.9, 26.9) 20.0 (15.0, 26.1) 44.5 (30.2, 59.7) 100Rural 11.4 (7.1, 17.7) 16.6 (11.9, 22.7) 20.7 (14.5, 28.7) 51.3 (43.2, 59.3) 100
Education levelNo formal education 12.6 (7.6, 20.2) 16.5 (11.2, 23.7) 16.0 (10.7, 23.3) 54.9 (45.4, 63.9) 100Less than primary 19.7 (5.1, 53.0)* 17.1 (8.2, 32.2)* 24.3 (11.0, 45.5)* 38.9 (22.6, 58.3) 100Primary 0.0 11.7 (3.9, 30.1)* 29.6 (12.4, 55.6)* 58.6 (35.9, 78.2)* 100Less than secondary 13.8 (6.6, 26.9)* 16.4 (8.1, 30.5)* 30.3 (17.1, 47.7)* 39.5 (26.0, 54.9) 100Secondary and above 10.5 (3.5, 27.8)* 21.1 (11.7, 34.9)* 14.3 (7.2, 26.3)* 54.1 (39.9, 67.7) 100
Wealth indexLowest 19.5 (9.7, 35.2)* 18.5 (10.6, 30.2)* 14.8 (8.3, 25.0)* 47.2 (33.1, 61.9) 100Low 6.3 (2.8, 13.8)* 18.7 (10.7, 30.6)* 22.3 (10.7, 40.6)* 52.7 (38.9, 66.2) 100Middle 7.9 (3.8, 16.0)* 10.7 (5.7, 19.2)* 22.6 (12.4, 37.5)* 58.7 (44.7, 71.5) 100High 23.2 (7.8, 51.6)* 19.1 (10.3, 32.8)* 18.9 (10.1, 32.5)* 38.8 (24.6, 55.3) 100Highest 8.0 (3.5, 17.3)* 17.5 (10.1, 28.7)* 25.3 (13.1, 43.0)* 49.2 (35.3, 63.2) 100
OccupationEmployed 12.0 (4.6, 28.1)* 20.8 (10.9, 36.0)* 22.1 (11.0, 39.3)* 45.1 (29.3, 62.0)* 100Business 27.2 (11.8, 51.1)* 16.0 (8.6, 27.8)* 20.6 (12.4, 32.3)* 36.2 (20.5, 55.5) 100Farmers 8.1 (2.6, 22.8)* 11.6 (5.7, 22.4)* 10.1 (5.3, 18.4)* 70.2 (56.7, 80.9) 100Labourers 15.4 (8.7, 25.9)* 21.8 (13.5, 33.3) 25.8 (14.9, 40.8) 37.0 (26.6, 48.8) 100Student 100.0 * 0.0 0.0 0.0 100Homemaker 4.3 (1.1, 15.3)* 25.5 (10.5, 50.1)* 13.8 (5.3, 31.3)* 56.4 (32.9, 77.4)* 100Unemployed 0.3 (0.0, 2.5)* 12.5 (6.4, 23.2)* 31.0 (17.6, 48.6)* 56.2 (40.5, 70.7) 100
1Among former daily smokers (current non-smokers).* Estimate based on fewer than 25 unweighted cases.

Table 4.9A: Percentage distribution of time since quitting among former daily smokeless tobacco users≥15 years old, by selected demographic characteristics–GATS Bangladesh, 2009
70
GATS Bangladesh Report-2009
Demographiccharacteristics
Time since quitting smokeless tobacco (years)1
Total<1 1 to <5 5 to <10 ≥10
Percentage (95% CI )
Overall 4.2 (1.3, 12.5)* 18.0 (7.6, 36.9)* 37.7 (18.1, 62.4)* 40.1 (23.7, 59.0)* 100
Gender
Male 4.4 (1.4, 13.3)* 19.2 (8.2, 38.8)* 37.6 (17.3, 63.5)* 38.7 (22.2, 58.3)* 100
Female 0.0 0.0 39.4 (3.9, 91.4)* 60.6 (8.6, 96.1)* 100
Age (years)
15-24 0.0 0.0 0.0 0.0 0
25-44 69.2 (21.5, 94.9)* 0.0 9.1 (1.0, 50.2)* 21.7 (2.5, 74.8)* 100
45-64 2.0 (0.4, 8.6)* 24.9 (10.2, 49.1)* 37.4 (13.6, 69.4)* 35.7 (18.0, 58.4)* 100
65+ 0.0 6.1 (1.0, 29.1)* 42.2 (13.4, 77.4)* 51.7 (19.7, 82.4)* 100
Residence
Urban 11.6 (3.3, 33.5)* 8.3 (1.9, 29.1)* 40.3 (10.8, 79.0)* 39.8 (14.5, 72.0)* 100
Rural 0.0 23.5 (9.3, 47.9)* 36.3 (14.5, 65.7)* 40.2 (21.1, 62.9)* 100
Education level
No formal education 8.6 (2.3, 27.1)* 14.8 (2.8, 50.7)* 30.7 (10.4, 62.8)* 45.9 (19.9, 74.3)* 100
Less than primary 0.0 16.3 (3.1, 54.3)* 2.2 (0.3, 17.1)* 81.5 (44.2, 96.1)* 100
Primary 0.0 100.0 * 0.0 0.0 100
Less than secondary 0.0 21.9 (2.8, 73.0)* 66.8 (23.4, 93.0)* 11.2 (2.1, 42.4)* 100
Secondary and above 6.3 (0.8, 36.0)* 19.0 (2.7, 66.6)* 34.9 (9.2, 74.0)* 39.8 (12.2, 75.9)* 100
Wealth index
Lowest 3.5 (0.4, 23.8)* 27.4 (4.2, 76.7)* 13.5 (1.7, 57.9)* 55.6 (18.2, 87.6)* 100
Low 15.2 (1.7, 65.5)* 9.2 (1.0, 51.3)* 26.7 (3.1, 80.3)* 48.9 (8.6, 90.7)* 100
Middle 0.0 4.2 (0.5, 28.1)* 48.2 (12.9, 85.4)* 47.6 (12.8, 84.9)* 100
High 5.2 (0.6, 32.5)* 57.6 (20.9, 87.5)* 12.5 (1.6, 56.1)* 24.7 (6.6, 60.4)* 100
Highest 2.6 (0.3, 19.6)* 1.2 (0.1, 9.7)* 67.8 (28.6, 91.7)* 28.4 (7.0, 67.6)* 100
Occupation
Employed 0.0 33.1 (4.5, 83.7)* 66.9 (16.3, 95.5)* 0.0 100
Business 1.8 (0.2, 14.2)* 22.8 (6.4, 56.1)* 41.6 (8.7, 84.2)* 33.9 (13.1, 63.4)* 100
Farmers 0.0 25.9 (3.9, 75.2)* 30.4 (7.1, 71.3)* 43.8 (13.1, 80.0)* 100
Labourers 33.8 (7.1, 77.2)* 12.7 (1.6, 57.5)* 0.0 53.4 (15.4, 87.9)* 100
Student 0.0 0.0 0.0 0.0 0
Homemaker 0.0 0.0 0.0 0.0 0
Unemployed 2.2 (0.3, 15.7)* 5.1 (0.9, 24.6)* 42.5 (12.3, 79.6)* 50.2 (17.2, 83.1)* 100
1Among former daily smokeless tobacco users (current non-smokeless tobacco users).* Estimate based on fewer than 25 unweighted cases.

4.10 Type of current tobacco use
Current tobacco users include current tobacco smokers who are daily and occasional tobaccosmokers as well as smokeless tobacco users. Table 4.10 presents the prevalence of currenttobacco users aged 15 years and over by selected demographic characteristics. The overallprevalence of tobacco use is 43.3%.
Classified by gender, it is found that the proportion of current tobacco users among maleswas almost twice that of females (58.0% and 28.7%, respectively). By age groups, the 65 yearsand older and 15-24 year age groups have the highest and lowest percentages of currenttobacco users, respectively (16.9% and 70.8%). By residence, rural areas have a higherpercentage of current tobacco users than urban areas (45.1% and 38.1%, respectively). Byeducational status, the highest and lowest percentages of current tobacco users are foundamong those with no formal education (62.9%) and secondary and above-level education(21.7%), respectively. Use of tobacco was found to decrease as SES increases. Bysocioeconomic status, the highest and lowest percentages of current tobacco users are foundin lowest and highest SES categories, with 55.6% and 28.1%, respectively.
Type of tobacco use was classified into three categories: “smoked only”, “both smokedand smokeless”, and “smokeless only”. Current tobacco users mostly fall in the category ofsmokeless tobacco only (46.9%), followed by smoked tobacco only (37.3%); those using bothsmoked and smokeless tobacco represented 15.8%. By gender, most male current tobaccousers use smoked tobacco only (54.6%). In contrast, most female current tobacco users useonly smokeless tobacco (94.7%). Among the lowest age group (15-24 years), the smokedtobacco use rate is the highest (60.8%), while in the oldest age group (65 years or more) thisuse rate was 20.4%. Among the oldest age group, smokeless tobacco use rate was 66.8%,while it was 28.9% among those aged 15 to 24 years.
Classified by residence, the smoked tobacco use rate in urban areas was higher than thatin rural areas (41.1% and 36.1%, respectively); the smokeless tobacco use rate in rural areaswas 47.7%, compared to the rate in urban areas of 44.2%. By educational status, the smokedtobacco use rate was highest among those with a secondary and above education level(53.1%) and the rate among those with no formal education was 32.7%. The smokelesstobacco use rate among those with no formal education was 50.6%. By SES, the rate ofsmokeless tobacco use among current tobacco users varied between 45.4% and 51.4%,whereas the variation was between 35.1% and 38.9% for smoked tobacco use. Smokedtobacco use was found lowest among homemakers and unemployed current tobacco users(2.7% and 35.4%, respectively). Similarly smokeless tobacco use was found highest amonghomemakers followed by unemployed current tobacco users (95.3% and 55.2%, respectively).
71
GATS Bangladesh Report-2009

Table 4.10: Percentage distribution of tobacco use patterns among current tobacco users ≥15 years oldby selected demographic characteristics–GATS Bangladesh, 2009.
72
GATS Bangladesh Report-2009
Demographiccharacteristics
Current Tobacco Users1
Type of Current Tobacco Use
Smoked only Smokeless only Both smoked andsmokeless Total
Percentage (95% CI )
Overall 43.3 (41.7, 45.0) 37.3 (34.9, 39.7) 46.9 (44.5, 49.3) 15.8 (14.3, 17.5) 100
Gender
Male 58.0 (55.9, 60.1) 54.6 (51.4, 57.7) 23.0 (20.3, 25.9) 22.5 (20.2, 24.9) 100
Female 28.7 (26.7, 30.8) 2.7 (1.7, 4.3) 94.7 (92.7, 96.2) 2.5 (1.6, 4.0) 100
Age (years)
15-24 16.9 (14.7, 19.4) 60.8 (52.7, 68.4) 28.9 (21.6, 37.6) 10.2 (6.6, 15.5) 100
25-44 44.8 (42.3, 47.3) 40.2 (37.0, 43.5) 42.2 (39.2, 45.3) 17.5 (15.4, 19.9) 100
45-64 68.8 (65.9, 71.5) 30.7 (27.1, 34.4) 52.9 (49.1, 56.7) 16.4 (14.0, 19.1) 100
65+ 70.8 (66.2, 75.1) 20.4 (16.0, 25.6) 66.8 (61.0, 72.2) 12.8 (9.3, 17.4) 100
Residence
Urban 38.1 (35.6, 40.7) 41.1 (37.5, 44.7) 44.2 (41.1, 47.4) 14.7 (12.5, 17.2) 100
Rural 45.1 (43.2, 47.1) 36.1 (33.2, 39.1) 47.7 (44.8, 50.7) 16.2 (14.3, 18.2) 100
Education level
No formal education 62.9 (60.7, 65.1) 32.7 (29.9, 35.7) 50.6 (47.5, 53.6) 16.7 (14.7, 19.0) 100
Less than primary 47.2 (43.0, 51.4) 39.1 (33.9, 44.7) 43.6 (38.3, 49.1) 17.2 (13.9, 21.2) 100
Primary 37.6 (34.0, 41.3) 33.8 (27.6, 40.7) 53.6 (46.3, 60.7) 12.6 (9.1, 17.2) 100
Less than secondary 26.2 (23.5, 29.0) 48.5 (43.0, 54.0) 36.2 (31.1, 41.6) 15.4 (11.7, 19.9) 100
Secondary and above 21.7 (18.7, 25.0) 53.1 (45.2, 60.9) 33.9 (26.9, 41.8) 12.9 (8.2, 19.8) 100
Wealth index
Lowest 55.6 (52.7, 58.5) 35.1 (30.2, 40.3) 47.5 (42.8, 52.3) 17.4 (14.8, 20.4) 100
Low 48.1 (45.2, 51.0) 37.0 (32.9, 41.3) 45.4 (41.3, 49.5) 17.6 (14.9, 20.7) 100
Middle 43.1 (39.6, 46.6) 38.9 (33.9, 44.2) 46.1 (41.0, 51.2) 15.0 (11.8, 18.8) 100
High 38.4 (35.6, 41.4) 38.2 (33.2, 43.4) 46.8 (42.4, 51.3) 15.1 (11.8, 19.0) 100
Highest 28.1 (25.1, 31.2) 38.3 (32.9, 43.9) 51.4 (45.5, 57.3) 10.3 (7.4, 14.2) 100
Occupation
Employed 38.0 (33.3, 43.0) 53.2 (46.5, 59.8) 26.5 (20.7, 33.3) 20.3 (14.3, 27.9) 100
Business 59.1 (54.6, 63.4) 53.0 (47.3, 58.6) 26.2 (21.6, 31.5) 20.8 (17.0, 25.2) 100
Farmers 69.3 (64.7, 73.5) 51.1 (46.4, 55.8) 24.2 (20.1, 28.9) 24.6 (20.6, 29.1) 100
Labourers 62.0 (58.8, 65.2) 50.2 (45.5, 54.9) 27.9 (23.9, 32.3) 21.9 (18.8, 25.4) 100
Student 4.4 (2.3, 8.3)* 77.0 (48.6, 92.2)* 23.0 (7.8, 51.4)* 0.0 100
Homemaker 30.1 (27.8, 32.4) 2.7 (1.7, 4.4) 95.3 (93.5, 96.7) 1.9 (1.2, 3.2)* 100
Unemployed 49.4 (42.7, 56.0) 35.4 (26.9, 44.9) 55.2 (45.6, 64.3) 9.4 (5.7, 15.2)* 100
1 Includes daily and occasional (less than daily) smokers or smokeless users.* Estimate based on fewer than 25 unweighted cases.
4.11 Time to first cigarette of the day
One measure of evaluating nicotine dependence is the time taken to smoke the first cigaretteof the day after waking. Table 4.11 shows the time to the first smoke or use of smokelesstobacco of the day. The survey found that most daily tobacco users have their first use oftobacco of the day later than 60 minutes after waking (34.3%), followed by those who had itbetween 6 and 30 minutes (31.2%). The average time to the first smoke or use of smokelesstobacco of the day differs by gender only among those reported to make their first use of theday after more than 60 minutes (39.8% in females and 31.5% in males). A high percentage ofdaily tobacco users in the age group of 15-24 years and the oldest age group of 65 years andolder have their use of smoke or smokeless tobacco more than 60 minutes after waking up(45.5% and 36.4%, respectively). On the other hand, many of those in the age group of 15-24years have their first use 31-60 minutes after waking (29.2%), and in the 45-64 years age group34.2% have their first smoke or smokeless tobacco use 6-30 minutes after waking up.
When classified by residence, most daily tobacco users in both rural and urban areas havetheir first smoke or smokeless tobacco use only after 60 minutes after waking up (39.8% and32.7%, respectively). By educational level, most daily tobacco users among all educationallevels have their first use after 60 minutes, except for those with no formal education. Thedifferences among educational levels in terms of first use were found to be higher. The dailytobacco users who first smoke or use smokeless tobacco within 5 minutes after waking up ishigher (14.0%) in no formal education group compared to any other education categories(6.4% in less than primary, 8.1% in primary, 5.5% in less than secondary). Similar patternswere observed with respect to SES categories as well. A high percentage of daily tobacco usersfrom the lowest and low SES categories, have their first use of smoked or smokeless tobaccoproduct 6-30 minutes after waking up. The highest and lowest proportions of tobacco usershaving their first use between 6-30 minutes of waking up are found in the low and highest SEScategories (35.1% and 21.8%, respectively). By occupation, 14.6% of labourers reported tohave their first use of smoked or smokeless tobacco within 5 minutes of waking up.
73
GATS Bangladesh Report-2009

Table 4.11: Percentage distribution of time to first tobacco use upon waking among daily smokersand/or smokeless tobacco users ≥15 years old, by selected demographic characteristics–GATSBangladesh, 2009.
74
GATS Bangladesh Report-2009
Demographiccharacteristics
Time to first smoke or smokeless tobacco useTotal
≤5 minutes 6-30 minutes 31-60 minutes >60 minutes
Percentage (95% CI)
Overall 10.5 (9.1, 12.0) 31.2 (29.0, 33.4) 24.0 (22.0, 26.2) 34.3 (31.8, 36.9) 100
Gender
Male 10.7 (9.0, 12.7) 31.6 (29.2, 34.2) 26.2 (23.6, 29.0) 31.5 (28.4, 34.6) 100
Female 10.0 (7.8, 12.8) 30.3 (26.7, 34.2) 19.9 (16.8, 23.4) 39.8 (35.6, 44.2) 100
Age (years)
15-24 8.3 (4.6, 14.5) 17.0 (12.1, 23.4) 29.2 (21.9, 37.7) 45.5 (36.2, 55.2) 100
25-44 11.7 (9.9, 13.8) 31.4 (28.7, 34.3) 22.2 (19.6, 25.1) 34.7 (31.8, 37.7) 100
45-64 11.0 (8.8, 13.5) 34.2 (31.2, 37.5) 24.9 (21.9, 28.2) 29.9 (26.3, 33.7) 100
65+ 6.0 (3.7, 9.5) 33.9 (27.9, 40.6) 23.7 (18.5, 29.9) 36.4 (30.6, 42.6) 100
Residence
Urban 10.4 (7.9, 13.4) 27.4 (24.4, 30.7) 22.4 (19.0, 26.3) 39.8 (36.5, 43.1) 100
Rural 10.5 (8.9, 12.4) 32.3 (29.7, 35.0) 24.5 (22.0, 27.1) 32.7 (29.8, 35.9) 100
Education level
No formal education 14.0 (11.9, 16.3) 33.4 (30.7, 36.3) 23.2 (20.6, 25.9) 29.5 (26.6, 32.5) 100
Less than primary 6.4 (4.5, 9.0) 33.8 (29.4, 38.6) 25.7 (21.3, 30.7) 34.1 (28.9, 39.6) 100
Primary 8.1 (5.4, 12.1) 26.7 (21.3, 33.0) 22.7 (17.7, 28.6) 42.5 (34.9, 50.4) 100
Less than secondary 5.5 (3.2, 9.2) 29.0 (24.4, 34.0) 23.6 (18.8, 29.3) 41.9 (36.5, 47.5) 100
Secondary and above 7.6 (4.6, 12.3)* 18.7 (13.9, 24.6) 27.3 (19.6, 36.6) 46.4 (37.8, 55.2) 100
Wealth index
Lowest 15.4 (12.0, 19.7) 33.9 (30.1, 37.9) 20.2 (17.0, 23.9) 30.4 (26.6, 34.6) 100
Low 11.0 (8.7, 13.9) 35.1 (31.0, 39.3) 24.1 (20.5, 28.2) 29.8 (25.8, 34.2) 100
Middle 9.9 (7.3, 13.3) 29.5 (25.2, 34.2) 27.0 (22.8, 31.6) 33.7 (29.2, 38.5) 100
High 6.2 (4.4, 8.7) 28.9 (24.9, 33.3) 24.5 (20.4, 29.2) 40.4 (35.5, 45.4) 100
Highest 5.8 (3.4, 9.5) 21.8 (16.9, 27.5) 26.5 (21.0, 32.7) 46.0 (39.4, 52.7) 100
Occupation
Employed 6.0 (3.4, 10.3)* 25.9 (20.5, 32.1) 25.4 (20.2, 31.4) 42.8 (36.1, 49.8) 100
Business 9.2 (6.5, 13.0) 31.0 (26.2, 36.3) 24.2 (19.9, 29.1) 35.6 (30.2, 41.3) 100
Farmers 9.8 (7.3, 13.2) 35.7 (31.2, 40.4) 26.0 (21.5, 31.1) 28.4 (24.0, 33.4) 100
Labourers 14.6 (11.6, 18.2) 31.2 (27.4, 35.2) 26.2 (22.3, 30.5) 28.1 (24.1, 32.4) 100
Student 0.0 6.0 (0.7, 36.6)* 23.4 (5.2, 62.9)* 70.6 (31.6, 92.6)* 100
Homemaker 9.6 (7.3, 12.6) 29.2 (25.4, 33.4) 20.3 (16.9, 24.2) 40.8 (35.9, 45.9) 100
Unemployed 3.6 (1.7, 7.5)* 33.9 (25.0, 44.1) 23.3 (15.4, 33.7) 39.3 (29.5, 49.9) 100
* Estimate based on fewer than 25 unweighted cases.

Tobacco cessation in Bangladesh mainly includes two approaches: 1) advice and counseling by anyhealth-care provider or through a quit line, and 2) other cessation methods such as the use oftraditional medicines (Ayurvedic, Unani), switching to smokeless tobacco and other methods.Pharmacotherapy is another proven approach for cessation. However, this is not available inBangladesh.14 This chapter presents findings on these tobacco cessation practices and health-care-seeking behaviour, cessation methods used and the degree of interest in quitting.
Key findings:
• Nearly 5 in 10 current smokers made attempts to quit.
• Nearly 6 in 10 current smokers were asked if they smoked tobacco by a doctoror health-care provider in the last 12 months.
• 5 in 10 current smokers received advice to quit smoking by a doctor or health-care provider in the last 12 months.
• Counseling was the most common cessation method reported by currentsmokers who had made an attempt to quit in the past 12 months.
5.1 Smoking cessation and health-care seeking behaviours
A quit attempt is defined as when current tobacco smokers and former tobacco smokers whohave been abstinent for less than 12 months. Table 5.1 reports the proportion of adult smokerswho made a quit attempt, visited a health-care provider (HCP), and were asked about smoking andreceived advice by an HCP on quitting smoking.
5.1.1 Quit attempts among current tobacco smokers
Among current tobacco smokers and former tobacco smokers, approximately half of (47.3%) had madean attempt to quit in the previous 12 months. Males (47.8%) attempted more than females (31.5%).Smokers who live in urban areas (53.4%) have a slightly higher rate of quit attempts than those in ruralareas (45.3%). Classified by age group, quit attempt rates ranged from 44.3% (15-24 years) to 48.2%(65 years and older). Classified by education levels, smokers with secondary education and above havethe highest percentage of quit attempts (54.2%) and the rate is lowest among smokers with educationlevels less than primary (43.7%). By socioeconomic status, quit attempts varied from 54.9% (high SES)to 41.8% (lowest SES).
5.1.2 Visits to health-care provider
The percentage of smokers (including current tobacco smokers and recent quitters, <12 months) whovisited a health-care provider during the past 12 months is 38.3%. Male smokers have a higherproportion of HCP visits than female smokers (38.8% against 24.2%). Smokers aged 65 years and overhave the highest rate of HCP visits (53.3%). The percentages are similar in both urban and rural areas(41.2% and 37.4%, respectively). By education level, smokers with less than secondary education havethe highest rate of HCP visits (43.7%). Smokers in the highest SES (44.4%) visited HCP more thansmokers in the low or lowest SES (34.7%).
75
GATS Bangladesh Report-2009
5. Cessation
5.1.3 Health-care provider asking tobacco smoking history
Among the smokers who have visited an HCP during the previous 12 months 56.0% were asked abouttheir history of tobacco smoking. The proportion asked about tobacco smoking by the HCP amongfemale smokers (64.6%) is higher than for male smokers (55.9%). The proportions are similar in urbanand rural areas (52.3% and 57.4%). Classified by educational level, the proportion ranged from 45.7%(less than primary) to 61.9% (secondary and above education). Classified by socioeconomic status, itranged from 47.8% (high) to 62.0% (highest). By occupation, it ranged from 46.2% (unemployed) to63.8% (farmers). Classified by age group, the proportion who had an HCP ask about their smokinghistory ranged from 69.2% (age group 45-64) to 31.3% (15-24 years). Over half of smokers in bothrural (57.4%) and urban areas (52.3%) were asked about their history of smoking.
5.1.4 Advice to quit tobacco smoking
Approximately half of all smokers (52.9%) ever received advice to quit smoking by the HCP. The rateof getting advice from the HCP is slightly higher among female smokers (61.6%) than among male(52.7%). The proportion receiving advice on quitting smoking is highest among smokers aged 45-64years and over (67.3%). The lowest proportion is found among younger smokers aged 15-24 years(24.9%).
Quitting advice was received more by smokers in urban areas (54.3%) than in rural areas (49.0%).By education, it varied from 42.1% (less than primary level) to 58.3% (no formal education). Bysocioeconomic status it varies from 58.2% (lowest SES) to 44.0% (high SES). By occupational category,more than half of smokers in employed, farmers, labourer, category were advised by physicians toquit; however only 42.2% in unemployed category were advised to quit with least frequency.
76
GATS Bangladesh Report-2009
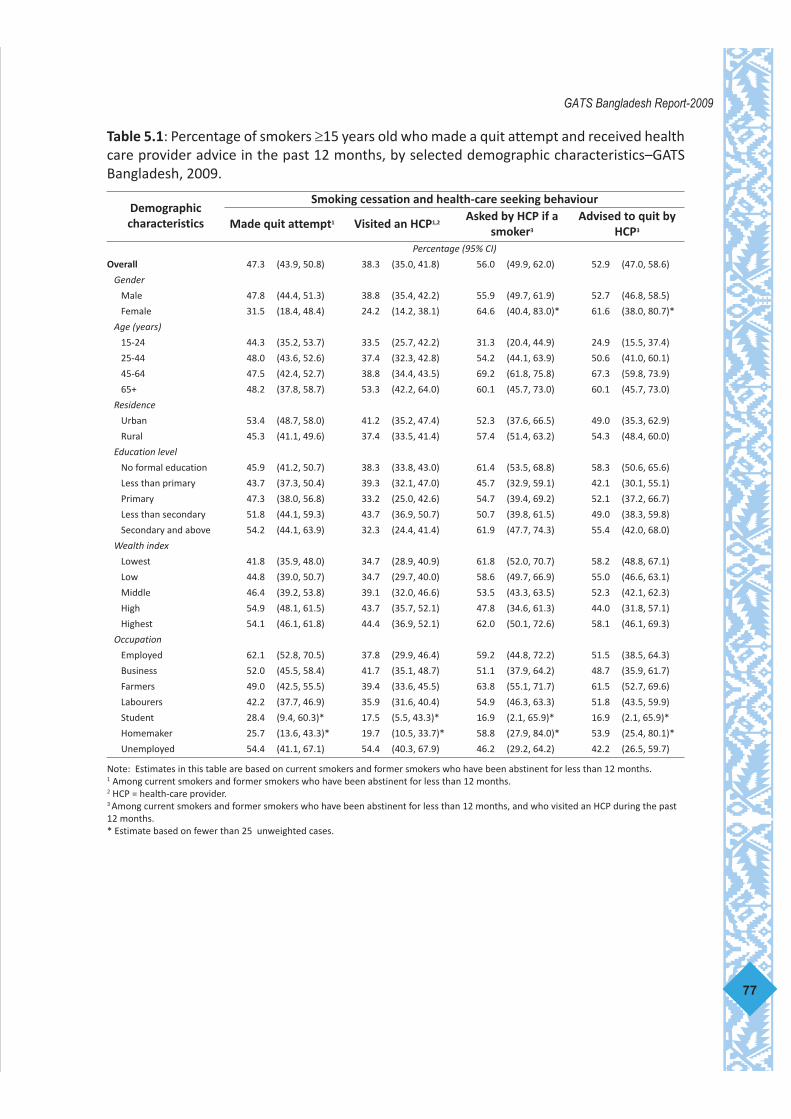
Table 5.1: Percentage of smokers ≥15 years old who made a quit attempt and received healthcare provider advice in the past 12 months, by selected demographic characteristics–GATSBangladesh, 2009.
77
GATS Bangladesh Report-2009
Demographiccharacteristics
Smoking cessation and health-care seeking behaviour
Made quit attempt1 Visited an HCP1,2Asked by HCP if a
smoker3
Advised to quit byHCP3
Percentage (95% CI)
Overall 47.3 (43.9, 50.8) 38.3 (35.0, 41.8) 56.0 (49.9, 62.0) 52.9 (47.0, 58.6)
Gender
Male 47.8 (44.4, 51.3) 38.8 (35.4, 42.2) 55.9 (49.7, 61.9) 52.7 (46.8, 58.5)
Female 31.5 (18.4, 48.4) 24.2 (14.2, 38.1) 64.6 (40.4, 83.0)* 61.6 (38.0, 80.7)*
Age (years)
15-24 44.3 (35.2, 53.7) 33.5 (25.7, 42.2) 31.3 (20.4, 44.9) 24.9 (15.5, 37.4)
25-44 48.0 (43.6, 52.6) 37.4 (32.3, 42.8) 54.2 (44.1, 63.9) 50.6 (41.0, 60.1)
45-64 47.5 (42.4, 52.7) 38.8 (34.4, 43.5) 69.2 (61.8, 75.8) 67.3 (59.8, 73.9)
65+ 48.2 (37.8, 58.7) 53.3 (42.2, 64.0) 60.1 (45.7, 73.0) 60.1 (45.7, 73.0)
Residence
Urban 53.4 (48.7, 58.0) 41.2 (35.2, 47.4) 52.3 (37.6, 66.5) 49.0 (35.3, 62.9)
Rural 45.3 (41.1, 49.6) 37.4 (33.5, 41.4) 57.4 (51.4, 63.2) 54.3 (48.4, 60.0)
Education level
No formal education 45.9 (41.2, 50.7) 38.3 (33.8, 43.0) 61.4 (53.5, 68.8) 58.3 (50.6, 65.6)
Less than primary 43.7 (37.3, 50.4) 39.3 (32.1, 47.0) 45.7 (32.9, 59.1) 42.1 (30.1, 55.1)
Primary 47.3 (38.0, 56.8) 33.2 (25.0, 42.6) 54.7 (39.4, 69.2) 52.1 (37.2, 66.7)
Less than secondary 51.8 (44.1, 59.3) 43.7 (36.9, 50.7) 50.7 (39.8, 61.5) 49.0 (38.3, 59.8)
Secondary and above 54.2 (44.1, 63.9) 32.3 (24.4, 41.4) 61.9 (47.7, 74.3) 55.4 (42.0, 68.0)
Wealth index
Lowest 41.8 (35.9, 48.0) 34.7 (28.9, 40.9) 61.8 (52.0, 70.7) 58.2 (48.8, 67.1)
Low 44.8 (39.0, 50.7) 34.7 (29.7, 40.0) 58.6 (49.7, 66.9) 55.0 (46.6, 63.1)
Middle 46.4 (39.2, 53.8) 39.1 (32.0, 46.6) 53.5 (43.3, 63.5) 52.3 (42.1, 62.3)
High 54.9 (48.1, 61.5) 43.7 (35.7, 52.1) 47.8 (34.6, 61.3) 44.0 (31.8, 57.1)
Highest 54.1 (46.1, 61.8) 44.4 (36.9, 52.1) 62.0 (50.1, 72.6) 58.1 (46.1, 69.3)
Occupation
Employed 62.1 (52.8, 70.5) 37.8 (29.9, 46.4) 59.2 (44.8, 72.2) 51.5 (38.5, 64.3)
Business 52.0 (45.5, 58.4) 41.7 (35.1, 48.7) 51.1 (37.9, 64.2) 48.7 (35.9, 61.7)
Farmers 49.0 (42.5, 55.5) 39.4 (33.6, 45.5) 63.8 (55.1, 71.7) 61.5 (52.7, 69.6)
Labourers 42.2 (37.7, 46.9) 35.9 (31.6, 40.4) 54.9 (46.3, 63.3) 51.8 (43.5, 59.9)
Student 28.4 (9.4, 60.3)* 17.5 (5.5, 43.3)* 16.9 (2.1, 65.9)* 16.9 (2.1, 65.9)*
Homemaker 25.7 (13.6, 43.3)* 19.7 (10.5, 33.7)* 58.8 (27.9, 84.0)* 53.9 (25.4, 80.1)*
Unemployed 54.4 (41.1, 67.1) 54.4 (40.3, 67.9) 46.2 (29.2, 64.2) 42.2 (26.5, 59.7)
Note: Estimates in this table are based on current smokers and former smokers who have been abstinent for less than 12 months. 1 Among current smokers and former smokers who have been abstinent for less than 12 months.2 HCP = health-care provider. 3 Among current smokers and former smokers who have been abstinent for less than 12 months, and who visited an HCP during the past12 months. * Estimate based on fewer than 25 unweighted cases.

5.2 Use of cessation method
The cessation methods for smokers (current tobacco smokers and recent quitters of <12months) covered in GATS Bangladesh are: (1) counseling and advice, including counseling ata cessation clinic or a telephone quit line/helpline; and (2) other methods including traditionalmethods (Ayurvedic, Unani) and switching to smokeless tobacco.
The data show that counseling (14.9%) and other methods (14.5%) were almost equallyreported as being the most often tried cessation methods to quit smoking within the last 12months.
Though the female estimates are based on less than 25 unweighted cases, females (25.9%)used counseling more than their male counterparts (14.7%) in quitting smoking. Categorizedby age group, the proportion who reported for counseling as the cessation method variedfrom 12.5% (25-44 years) to 20.2% (45-64 years). In rural areas (16.1%) the counselingapproach was tried more than in urban areas (11.8%). By occupation, the counseling methodvaries from 10.9% (labourers) to 20.6% (farmers). Smokers in urban areas (17.8%) used othermethods more than smokers in rural areas (13.3%). By socioeconomic category, proportionusing other method of counseling varies from 11.4% in (low SES) to 19.6% (lowest SES). Byoccupational category, it varies from 12.7% (business) to 18.4% (labourers).
78
GATS Bangladesh Report-2009
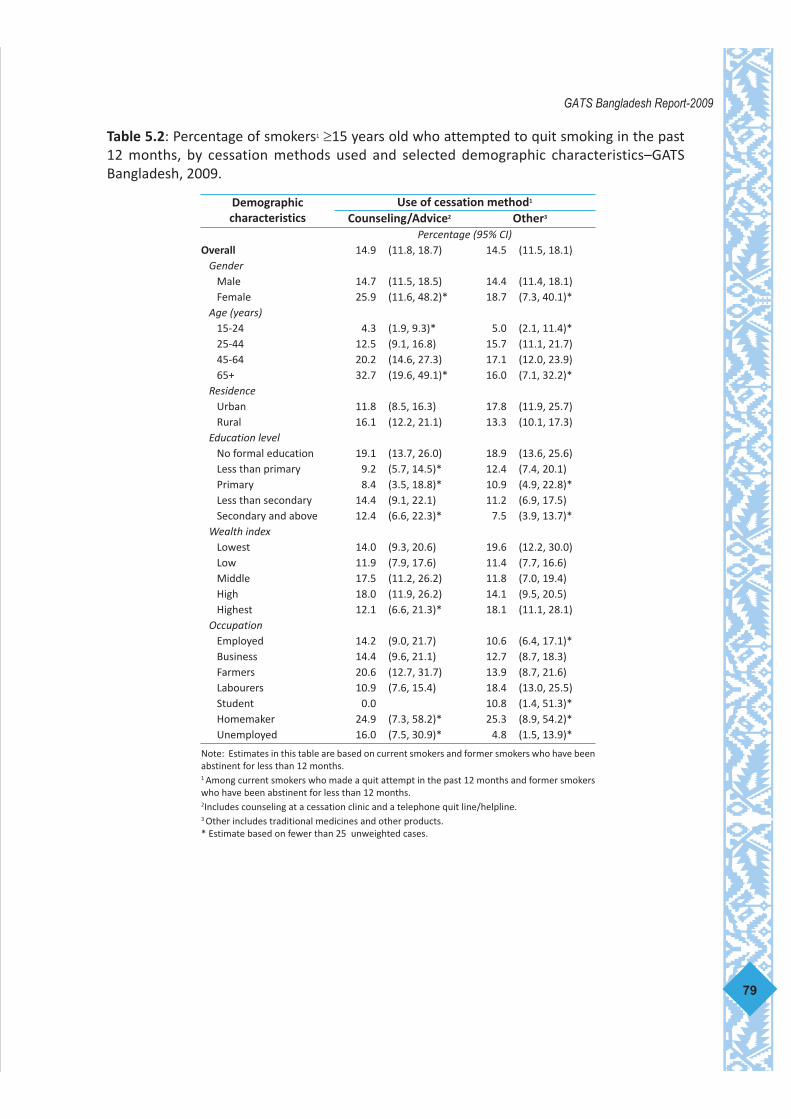
Table 5.2: Percentage of smokers1 ≥15 years old who attempted to quit smoking in the past12 months, by cessation methods used and selected demographic characteristics–GATSBangladesh, 2009.
79
GATS Bangladesh Report-2009
Demographiccharacteristics
Use of cessation method1
Counseling/Advice2 Other3
Percentage (95% CI)Overall 14.9 (11.8, 18.7) 14.5 (11.5, 18.1)
GenderMale 14.7 (11.5, 18.5) 14.4 (11.4, 18.1)Female 25.9 (11.6, 48.2)* 18.7 (7.3, 40.1)*
Age (years)15-24 4.3 (1.9, 9.3)* 5.0 (2.1, 11.4)*25-44 12.5 (9.1, 16.8) 15.7 (11.1, 21.7)45-64 20.2 (14.6, 27.3) 17.1 (12.0, 23.9)65+ 32.7 (19.6, 49.1)* 16.0 (7.1, 32.2)*
ResidenceUrban 11.8 (8.5, 16.3) 17.8 (11.9, 25.7)Rural 16.1 (12.2, 21.1) 13.3 (10.1, 17.3)
Education levelNo formal education 19.1 (13.7, 26.0) 18.9 (13.6, 25.6)Less than primary 9.2 (5.7, 14.5)* 12.4 (7.4, 20.1)Primary 8.4 (3.5, 18.8)* 10.9 (4.9, 22.8)*Less than secondary 14.4 (9.1, 22.1) 11.2 (6.9, 17.5)Secondary and above 12.4 (6.6, 22.3)* 7.5 (3.9, 13.7)*
Wealth indexLowest 14.0 (9.3, 20.6) 19.6 (12.2, 30.0)Low 11.9 (7.9, 17.6) 11.4 (7.7, 16.6)Middle 17.5 (11.2, 26.2) 11.8 (7.0, 19.4)High 18.0 (11.9, 26.2) 14.1 (9.5, 20.5)Highest 12.1 (6.6, 21.3)* 18.1 (11.1, 28.1)
OccupationEmployed 14.2 (9.0, 21.7) 10.6 (6.4, 17.1)*Business 14.4 (9.6, 21.1) 12.7 (8.7, 18.3)Farmers 20.6 (12.7, 31.7) 13.9 (8.7, 21.6)Labourers 10.9 (7.6, 15.4) 18.4 (13.0, 25.5)Student 0.0 10.8 (1.4, 51.3)*Homemaker 24.9 (7.3, 58.2)* 25.3 (8.9, 54.2)*Unemployed 16.0 (7.5, 30.9)* 4.8 (1.5, 13.9)*
Note: Estimates in this table are based on current smokers and former smokers who have beenabstinent for less than 12 months. 1 Among current smokers who made a quit attempt in the past 12 months and former smokerswho have been abstinent for less than 12 months.2Includes counseling at a cessation clinic and a telephone quit line/helpline.3 Other includes traditional medicines and other products.* Estimate based on fewer than 25 unweighted cases.

5.3 Interest in quitting smoking and smokeless tobacco
In GATS, interest in quitting smoking was defined as current tobacco smokers who are planningto quit or thinking about quitting smoking. In GATS Bangladesh the information was collectedin five major categories of interest; planning to quit within the next month, thinking aboutquitting within the next 12 months, will quit some day but not in the next 12 months, notinterested in quitting, or don’t know. Table 5.3 presents data on these five categories ofinterest in quitting smoking.
Among all smokers, nearly one fifth of current smokers reported planning to quit nextmonth (19.3%) and planning to quit within next 12 months (19.8%), while nearly one third(28.9%) of smokers reported intending to quit but not within the next 12 months. Nearly onefifth (21.2%) of smokers said that they are not interested in quitting and one in ten were in thecategory “don’t know”. Within the category of planning to quit next month and planning toquit within the next 12 months there is not much difference among different socio-demographic characteristics (Table 5.3).
Among cigarette smokers, nearly one fifth of current cigarette smokers reported planningto quit within the next month (21.4%) and planning to quit within 12 months (22.5%);however, nearly one third (28.6%) of current cigarette smokers reported thinking of quittingbut not in the next 12 months. Nearly one third are either not interested in quitting (18.2%)or responded “don’t know “(9.3%) (Table 5.3A).
Among bidi smokers, nearly one fifth of current bidi smokers reported planning to quitwithin the next month (21.5%) or thinking about quitting within next 12 months (17.3%);however, nearly one third of current bidi smokers (27.7%) responded that they will quitsomeday but not in the next 12 months. Nearly one third either responded “not interested”in quitting (22.1%) or “don’t know” (11.4%) (Table 5.3B).
Among smokeless tobacco users, nearly one fourth reported planning to quit within thenext month (13.7%) and within the next 12 months (14.0%); however nearly one fifth (21.0%)responded that they will quit someday but not in the next 12 months. Nearly half of smokelesstobacco users either responded “not interested” in quitting (43.3%) or “don’t know” (8.0%)(Table 5.3C). Among male smokeless tobacco users, three in five responded that they wereplanning to quit either within the next month (16.9%) or within the next 12 months (20.2%)or sometimes but not within 12 months (23.9%). However, two in five responded either “notinterested” in quitting (28.2%) or “don’t know” (10.8%). Among female smokeless tobaccousers two in five responded that they intended to quit either within the next month (10.7%)or within the next 12 months (8.4%) or sometime but not within 12 months (18.3%); however,nearly three in five responded either “not interested” in quitting (57.0%) or “don’t know”(5.6%).
80
GATS Bangladesh Report-2009

81
GATS Bangladesh Report-2009Ta
ble
5.3:
Per
cent
age
dist
ribu
tion
of
curr
ent
smok
ers ≥1
5 ye
ars
old,
by
inte
rest
in
quitt
ing
smok
ing
and
sele
cted
dem
ogra
phic
char
acte
rist
ics–
GAT
S Ba
ngla
desh
, 200
9.
Dem
ogra
phic
cha
ract
eris
tics
Inte
rest
in q
uitt
ing
smok
ing1
Plan
ning
to q
uit
wit
hin
next
mon
thTh
inki
ng a
bout
qui
ttin
gw
ithi
n ne
xt 1
2 m
onth
sW
ill q
uit
som
eday
, but
not
in t
he n
ext
12 m
onth
sN
ot in
tere
sted
in q
uitt
ing
Don
’t k
now
Tota
l
Perc
enta
ge (9
5% C
I )
Ove
rall
19.3
(16.
6, 2
2.3)
19.8
(17.
1, 2
2.7)
28.9
(25.
8, 3
2.2)
21.2
(18.
0, 2
4.7)
10.8
(8.8
, 13.
3)10
0
Gen
der
Mal
e19
.4(1
6.7,
22.
5)20
.3(1
7.5,
23.
3)29
.4(2
6.2,
32.
7)20
.1(1
7.0,
23.
6)10
.8(8
.8, 1
3.4)
100
Fem
ale
16.1
(6.9
, 33.
3)*
5.8
(2.2
, 14.
3)*
15.0
(6.5
, 31.
0)*
53.0
(36.
0, 6
9.3)
10.1
(3.7
, 24.
7)*
100
Age
(yea
rs)
15-2
422
.7(1
5.6,
31.
8)22
.0(1
5.7,
29.
9)31
.0(2
3.5,
39.
6)15
.3(1
0.0,
22.
8)9.
0(4
.9, 1
5.8)
*10
0
25-4
417
.3(1
4.3,
20.
9)18
.6(1
5.5,
22.
2)31
.2(2
7.3,
35.
3)21
.9(1
8.4,
25.
9)11
.0(8
.5, 1
4.2)
100
45-6
420
.0(1
5.6,
25.
2)19
.8(1
5.1,
25.
4)26
.0(2
1.7,
30.
7)23
.5(1
8.7,
29.
0)10
.9(7
.7, 1
5.0)
100
65+
23.1
(14.
9, 3
4.1)
23.2
(15.
4, 3
3.5)
21.0
(13.
8, 3
0.6)
19.2
(12.
2, 2
9.0)
*13
.5(8
.3, 2
1.1)
*10
0
Resi
denc
e
Urb
an18
.7(1
4.8,
23.
4)21
.8(1
8.2,
26.
0)28
.9(2
3.7,
34.
7)22
.6(1
7.8,
28.
3)8.
0(5
.8, 1
0.8)
100
Rura
l19
.5(1
6.2,
23.
3)19
.1(1
5.9,
22.
8)28
.9(2
5.2,
32.
9)20
.7(1
6.9,
25.
0)11
.8(9
.2, 1
4.9)
100
Educ
atio
n Le
vel
No
form
al e
duca
tion
19.3
(15.
5, 2
3.7)
18.6
(15.
3, 2
2.4)
28.0
(24.
0, 3
2.4)
21.7
(17.
7, 2
6.3)
12.4
(9.6
, 16.
0)10
0
Less
than
pri
mar
y15
.5(1
1.5,
20.
5)18
.4(1
3.7,
24.
4)30
.5(2
4.5,
37.
2)27
.0(2
0.5,
34.
6)8.
6(5
.8, 1
2.5)
100
Prim
ary
20.3
(13.
5, 2
9.4)
24.2
(17.
0, 3
3.2)
27.2
(19.
1, 3
7.1)
20.5
(14.
0, 2
9.1)
7.8
(4.2
, 14.
1)*
100
Less
than
sec
onda
ry21
.4(1
4.9,
29.
6)20
.3(1
5.2,
26.
5)32
.7(2
6.2,
39.
9)18
.0(1
3.1,
24.
4)7.
6(4
.8, 1
2.1)
100
Seco
ndar
y an
d ab
ove
22.6
(15.
4, 3
1.8)
23.5
(15.
6, 3
3.7)
25.8
(19.
0, 3
4.0)
12.8
(7.1
, 21.
9)15
.4(9
.4, 2
4.2)
100
Wea
lth in
dex
Low
est
16.8
(12.
1, 2
2.8)
16.4
(12.
5, 2
1.2)
30.1
(24.
8, 3
6.1)
26.2
(21.
4, 3
1.6)
10.5
(7.3
, 15.
0)10
0
Low
17.3
(13.
4, 2
2.0)
20.6
(16.
0, 2
6.1)
32.0
(27.
0, 3
7.3)
20.0
(15.
3, 2
5.7)
10.1
(7.1
, 14.
2)10
0
Mid
dle
23.2
(17.
7, 2
9.8)
19.7
(15.
2, 2
5.0)
25.7
(20.
0, 3
2.4)
21.7
(16.
0, 2
8.7)
9.7
(6.7
, 14.
0)10
0
Hig
h20
.2(1
5.4,
26.
0)21
.1(1
5.5,
28.
1)29
.0(2
3.0,
35.
8)16
.9(1
2.1,
22.
9)12
.8(9
.1, 1
8.0)
100
Hig
hest
21.3
(15.
7, 2
8.3)
23.5
(17.
5, 3
0.8)
23.9
(18.
6, 3
0.1)
19.8
(13.
6, 2
8.0)
11.5
(6.9
, 18.
5)10
01 A
mon
g cu
rren
t dai
ly o
r le
ss th
an d
aily
sm
oker
s.*
Estim
ate
base
d on
few
er th
an 2
5 u
nwei
ghte
d ca
ses.
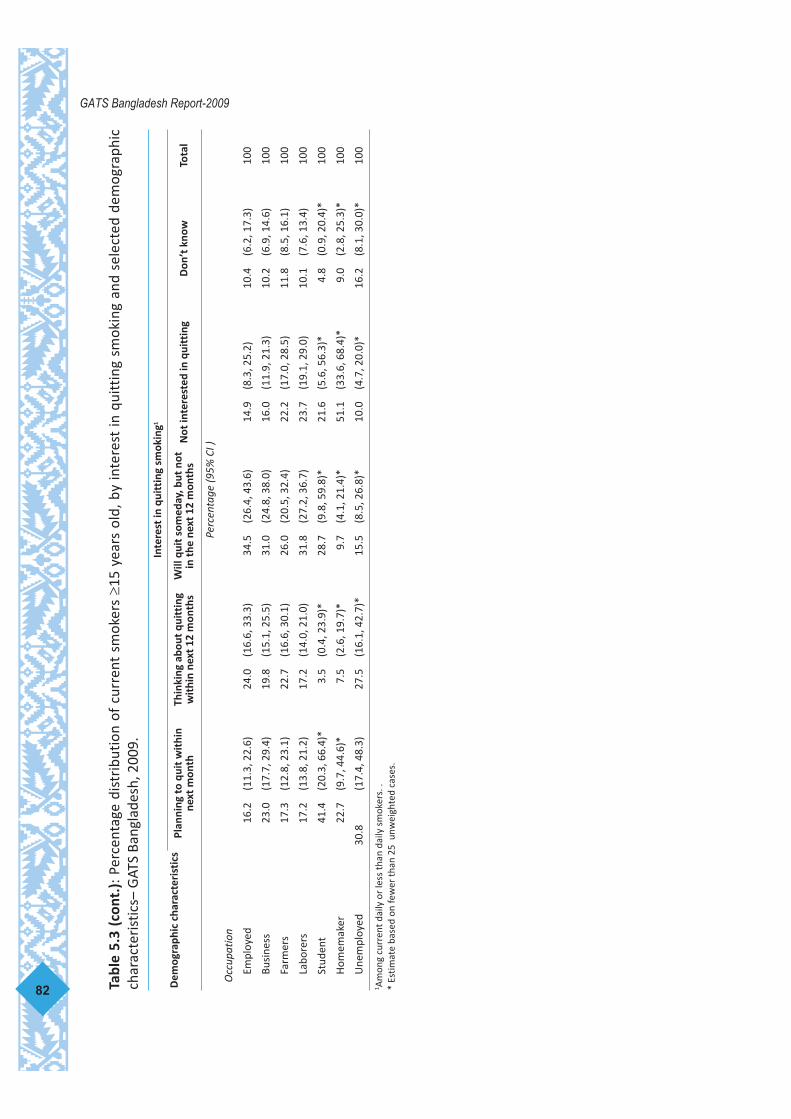
Tabl
e 5.
3 (c
ont.
): P
erce
ntag
e di
stri
buti
on o
f cu
rren
t sm
oker
s ≥1
5 ye
ars
old,
by
inte
rest
in q
uitt
ing
smok
ing
and
sele
cted
dem
ogra
phic
char
acte
rist
ics–
GAT
S Ba
ngla
desh
, 200
9.
82
GATS Bangladesh Report-2009
Dem
ogra
phic
cha
ract
eris
tics
Inte
rest
in q
uitt
ing
smok
ing1
Plan
ning
to q
uit
wit
hin
next
mon
thTh
inki
ng a
bout
qui
ttin
gw
ithi
n ne
xt 1
2 m
onth
sW
ill q
uit
som
eday
, but
not
in t
he n
ext
12 m
onth
sN
ot in
tere
sted
in q
uitt
ing
Don
’t k
now
Tota
l
Perc
enta
ge (9
5% C
I )
Occ
upat
ion
Empl
oyed
16.2
(11.
3, 2
2.6)
24.0
(16.
6, 3
3.3)
34.5
(26.
4, 4
3.6)
14.9
(8.3
, 25.
2)10
.4(6
.2, 1
7.3)
100
Busi
ness
23.0
(17.
7, 2
9.4)
19.8
(15.
1, 2
5.5)
31.0
(24.
8, 3
8.0)
16.0
(11.
9, 2
1.3)
10.2
(6.9
, 14.
6)10
0
Farm
ers
17.3
(12.
8, 2
3.1)
22.7
(16.
6, 3
0.1)
26.0
(20.
5, 3
2.4)
22.2
(17.
0, 2
8.5)
11.8
(8.5
, 16.
1)10
0
Labo
rers
17.2
(13.
8, 2
1.2)
17.2
(14.
0, 2
1.0)
31.8
(27.
2, 3
6.7)
23.7
(19.
1, 2
9.0)
10.1
(7.6
, 13.
4)10
0
Stud
ent
41.4
(20.
3, 6
6.4)
*3.
5(0
.4, 2
3.9)
*28
.7(9
.8, 5
9.8)
*21
.6(5
.6, 5
6.3)
*4.
8(0
.9, 2
0.4)
*10
0
Hom
emak
er22
.7(9
.7, 4
4.6)
*7.
5(2
.6, 1
9.7)
*9.
7(4
.1, 2
1.4)
*51
.1(3
3.6,
68.
4)*
9.0
(2.8
, 25.
3)*
100
Une
mpl
oyed
30.8
(17.
4, 4
8.3)
27.5
(16.
1, 4
2.7)
*15
.5(8
.5, 2
6.8)
*10
.0(4
.7, 2
0.0)
*16
.2(8
.1, 3
0.0)
*10
01 A
mon
g cu
rren
t dai
ly o
r le
ss th
an d
aily
sm
oker
s. .
*
Estim
ate
base
d on
few
er th
an 2
5 u
nwei
ghte
d ca
ses.
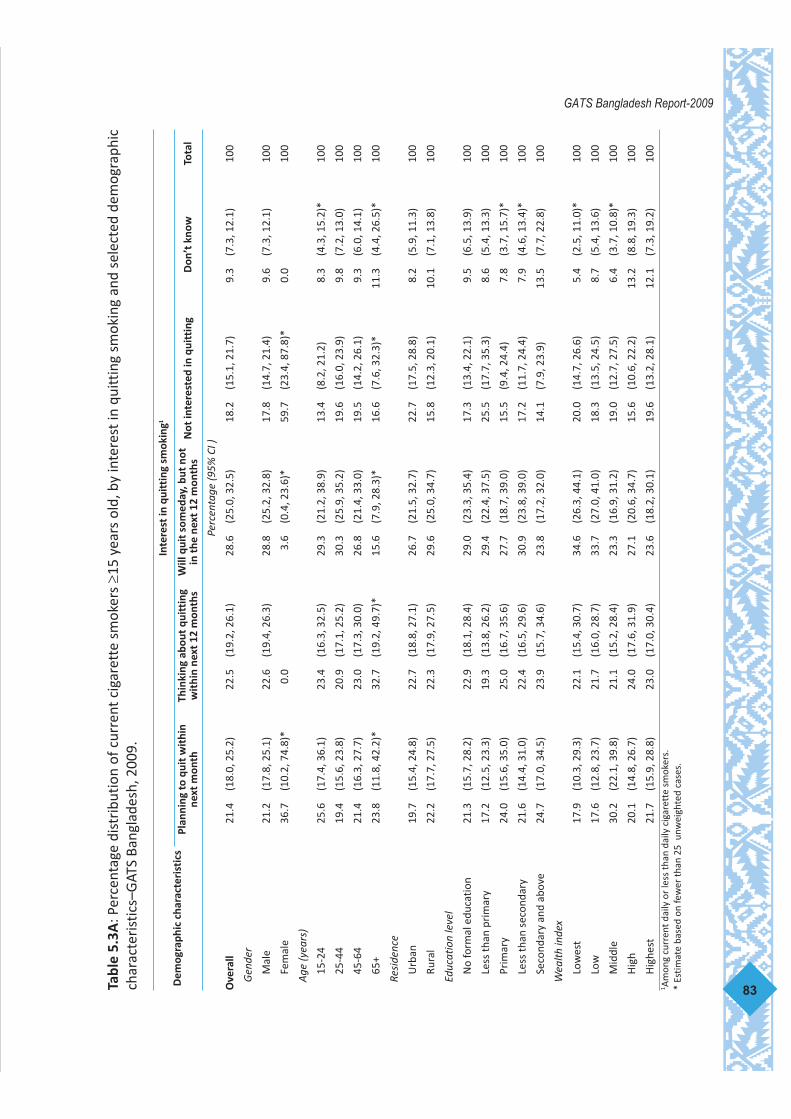
83
GATS Bangladesh Report-2009Ta
ble
5.3A
: Per
cent
age
dist
ribu
tion
of c
urre
nt c
igar
ette
sm
oker
s ≥1
5 ye
ars
old,
by
inte
rest
in q
uitt
ing
smok
ing
and
sele
cted
dem
ogra
phic
char
acte
rist
ics–
GAT
S Ba
ngla
desh
, 200
9.
Dem
ogra
phic
cha
ract
eris
tics
Inte
rest
in q
uitt
ing
smok
ing1
Plan
ning
to q
uit
wit
hin
next
mon
thTh
inki
ng a
bout
qui
ttin
gw
ithi
n ne
xt 1
2 m
onth
sW
ill q
uit
som
eday
, but
not
in t
he n
ext
12 m
onth
sN
ot in
tere
sted
in q
uitt
ing
Don
’t k
now
Tota
l
Perc
enta
ge (9
5% C
I )
Ove
rall
21.4
(18.
0, 2
5.2)
22.5
(19.
2, 2
6.1)
28.6
(25.
0, 3
2.5)
18.2
(15.
1, 2
1.7)
9.3
(7.3
, 12.
1)10
0
Gen
der
Mal
e21
.2(1
7.8,
25.
1)22
.6(1
9.4,
26.
3)28
.8(2
5.2,
32.
8)17
.8(1
4.7,
21.
4)9.
6(7
.3, 1
2.1)
100
Fem
ale
36.7
(10.
2, 7
4.8)
*0.
03.
6(0
.4, 2
3.6)
*59
.7(2
3.4,
87.
8)*
0.0
100
Age
(yea
rs)
15-2
425
.6(1
7.4,
36.
1)23
.4(1
6.3,
32.
5)29
.3(2
1.2,
38.
9)13
.4(8
.2, 2
1.2)
8.3
(4.3
, 15.
2)*
100
25-4
419
.4(1
5.6,
23.
8)20
.9(1
7.1,
25.
2)30
.3(2
5.9,
35.
2)19
.6(1
6.0,
23.
9)9.
8(7
.2, 1
3.0)
100
45-6
421
.4(1
6.3,
27.
7)23
.0(1
7.3,
30.
0)26
.8(2
1.4,
33.
0)19
.5(1
4.2,
26.
1)9.
3(6
.0, 1
4.1)
100
65+
23.8
(11.
8, 4
2.2)
*32
.7(1
9.2,
49.
7)*
15.6
(7.9
, 28.
3)*
16.6
(7.6
, 32.
3)*
11.3
(4.4
, 26.
5)*
100
Resi
denc
e
Urb
an19
.7(1
5.4,
24.
8)22
.7(1
8.8,
27.
1)26
.7(2
1.5,
32.
7)22
.7(1
7.5,
28.
8)8.
2(5
.9, 1
1.3)
100
Rura
l22
.2(1
7.7,
27.
5)22
.3(1
7.9,
27.
5)29
.6(2
5.0,
34.
7)15
.8(1
2.3,
20.
1)10
.1(7
.1, 1
3.8)
100
Educ
atio
n le
vel
No
form
al e
duca
tion
21.3
(15.
7, 2
8.2)
22.9
(18.
1, 2
8.4)
29.0
(23.
3, 3
5.4)
17.3
(13.
4, 2
2.1)
9.5
(6.5
, 13.
9)10
0
Less
than
pri
mar
y17
.2(1
2.5,
23.
3)19
.3(1
3.8,
26.
2)29
.4(2
2.4,
37.
5)25
.5(1
7.7,
35.
3)8.
6(5
.4, 1
3.3)
100
Prim
ary
24.0
(15.
6, 3
5.0)
25.0
(16.
7, 3
5.6)
27.7
(18.
7, 3
9.0)
15.5
(9.4
, 24.
4)7.
8(3
.7, 1
5.7)
*10
0
Less
than
sec
onda
ry21
.6(1
4.4,
31.
0)22
.4(1
6.5,
29.
6)30
.9(2
3.8,
39.
0)17
.2(1
1.7,
24.
4)7.
9(4
.6, 1
3.4)
*10
0
Seco
ndar
y an
d ab
ove
24.7
(17.
0, 3
4.5)
23.9
(15.
7, 3
4.6)
23.8
(17.
2, 3
2.0)
14.1
(7.9
, 23.
9)13
.5(7
.7, 2
2.8)
100
Wea
lth in
dex
Low
est
17.9
(10.
3, 2
9.3)
22.1
(15.
4, 3
0.7)
34.6
(26.
3, 4
4.1)
20.0
(14.
7, 2
6.6)
5.4
(2.5
, 11.
0)*
100
Low
17.6
(12.
8, 2
3.7)
21.7
(16.
0, 2
8.7)
33.7
(27.
0, 4
1.0)
18.3
(13.
5, 2
4.5)
8.7
(5.4
, 13.
6)10
0
Mid
dle
30.2
(22.
1, 3
9.8)
21.1
(15.
2, 2
8.4)
23.3
(16.
9, 3
1.2)
19.0
(12.
7, 2
7.5)
6.4
(3.7
, 10.
8)*
100
Hig
h20
.1(1
4.8,
26.
7)24
.0(1
7.6,
31.
9)27
.1(2
0.6,
34.
7)15
.6(1
0.6,
22.
2)13
.2(8
.8, 1
9.3)
100
Hig
hest
21.7
(15.
9, 2
8.8)
23.0
(17.
0, 3
0.4)
23.6
(18.
2, 3
0.1)
19.6
(13.
2, 2
8.1)
12.1
(7.3
, 19.
2)10
01 A
mon
g cu
rren
t dai
ly o
r le
ss th
an d
aily
cig
aret
te s
mok
ers.
* Es
timat
e ba
sed
on fe
wer
than
25
unw
eigh
ted
case
s.

Tabl
e 5.
3A (
cont
.):
Perc
enta
ge d
istr
ibut
ion
of c
urre
nt c
igar
ette
sm
oker
s ≥1
5 ye
ars
old,
by
inte
rest
in q
uitt
ing
smok
ing
and
sele
cted
dem
ogra
phic
cha
ract
eris
tics–
GAT
S Ba
ngla
desh
, 200
9.
84
GATS Bangladesh Report-2009
Dem
ogra
phic
cha
ract
eris
tics
Inte
rest
in q
uitt
ing
smok
ing1
Plan
ning
to q
uit
wit
hin
next
mon
thTh
inki
ng a
bout
qui
ttin
gw
ithi
n ne
xt 1
2 m
onth
sW
ill q
uit
som
eday
, but
not
in t
he n
ext
12 m
onth
sN
ot in
tere
sted
in q
uitt
ing
Don
’t k
now
Tota
l
Perc
enta
ge (9
5% C
I )
Occ
upat
ion
Empl
oyed
18.1
(12.
6, 2
5.2)
24.7
(17.
3, 3
4.0)
31.6
(24.
0, 4
0.3)
14.1
(7.3
, 25.
6)11
.5(6
.7, 1
9.0)
100
Busi
ness
24.8
(19.
1, 3
1.4)
21.5
(16.
3, 2
7.8)
30.1
(23.
7, 3
7.4)
13.9
(10.
0, 1
8.8)
9.7
(6.2
, 14.
9)10
0
Farm
ers
19.8
(13.
6, 2
7.9)
27.5
(19.
0, 3
8.2)
24.8
(18.
1, 3
2.8)
19.4
(13.
0, 2
7.8)
8.5
(5.1
, 13.
9)*
100
Labo
rers
16.9
(12.
5, 2
2.3)
20.3
(15.
5, 2
6.1)
32.2
(26.
0, 3
9.2)
22.7
(16.
9, 2
9.7)
7.9
(5.5
, 11.
5)10
0
Stud
ent
41.4
(20.
2, 6
6.4)
*3.
5(0
.4, 2
3.9)
*28
.7(9
.8, 5
9.8)
*21
.6(5
.6, 5
6.3)
*4.
8(0
.9, 2
0.4)
*10
0
Hom
emak
er56
.8(2
1.7,
86.
2)*
0.0
2.9
(0.4
, 20.
1)*
37.3
(10.
9, 7
4.4)
*3.
0(0
.4, 2
0.6)
*10
0
Une
mpl
oyed
32.6
(16.
5, 5
4.2)
*27
.4(1
4.5,
45.
8)*
14.2
(6.6
, 28.
1)*
8.4
(3.1
, 20.
7)*
17.4
(7.5
, 34.
9)*
100
1 Am
ong
curr
ent d
aily
or
less
than
dai
ly c
igar
ette
sm
oker
s.
* Es
timat
e ba
sed
on fe
wer
than
25
unw
eigh
ted
case
s.

85
GATS Bangladesh Report-2009Ta
ble
5.3B
: Per
cent
age
dist
ribu
tion
of
curr
ent
bidi
sm
oker
s ≥1
5 ye
ars
old,
by
inte
rest
in q
uitt
ing
smok
ing
and
sele
cted
dem
ogra
phic
char
acte
rist
ics–
GAT
S Ba
ngla
desh
, 200
9
Dem
ogra
phic
cha
ract
eris
tics
Inte
rest
in q
uitt
ing
smok
ing1
Plan
ning
to q
uit
wit
hin
next
mon
thTh
inki
ng a
bout
qui
ttin
gw
ithi
n ne
xt 1
2 m
onth
sW
ill q
uit
som
eday
, but
not
in t
he n
ext
12 m
onth
sN
ot in
tere
sted
in q
uitt
ing
Don
’t k
now
Tota
l
Perc
enta
ge (9
5% C
I )
Ove
rall
21.5
(17.
5, 2
6.2)
17.3
(13.
8, 2
1.4)
27.7
(23.
4, 3
2.5)
22.1
(17.
7, 2
7.2)
11.4
(8.6
, 15.
0)10
0
Gen
der
Mal
e21
.7(1
7.6,
26.
5)17
.7(1
4.1,
22.
0)28
.5(2
4.0,
33.
5)20
.8(1
6.4,
25.
9)11
.3(8
.3, 1
5.0)
100
Fem
ale
17.2
(6.3
, 39.
0)*
8.5
(3.2
, 20.
4)*
11.2
(4.8
, 24.
0)*
48.5
(29.
5, 6
7.9)
*14
.6(5
.5, 3
3.5)
*10
0
Age
(yea
rs)
15-2
434
.1(1
9.6,
52.
4)*
15.0
(7.0
, 29.
3)*
24.6
(13.
6, 4
0.3)
*19
.8(1
0.2,
34.
9)*
6.5
(1.5
, 24.
2)*
100
25-4
418
.0(1
3.7,
23.
4)15
.8(1
2.0,
20.
3)31
.3(2
5.8,
37.
3)23
.3(1
8.2,
29.
5)11
.6(8
.1, 1
6.3)
100
45-6
420
.2(1
4.2,
27.
9)20
.3(1
3.8,
28.
9)25
.3(1
9.6,
32.
0)23
.2(1
7.2,
30.
5)11
.0(7
.1, 1
6.6)
100
65+
29.3
(18.
3, 4
3.5)
*15
.4(8
.6, 2
6.1)
*23
.4(1
4.0,
36.
3)*
14.4
(7.1
, 27.
1)*
17.5
(10.
4, 2
7.8)
*10
0
Resi
denc
e
Urb
an27
.3(1
8.5,
38.
3)15
.6(1
0.5,
22.
5)33
.1(2
5.5,
41.
6)18
.2(1
1.5,
27.
6)5.
8(3
.2, 1
0.5)
*10
0
Rura
l20
.8(1
6.5,
25.
9)17
.5(1
3.7,
22.
1)27
.1(2
2.4,
32.
3)22
.6(1
7.7,
28.
2)12
.0(9
.0, 1
6.1)
100
Educ
atio
n le
vel
No
form
al e
duca
tion
22.1
(17.
4, 2
7.7)
15.7
(11.
8, 2
0.7)
26.0
(21.
2, 3
1.4)
22.5
(17.
6, 2
8.5)
13.7
(9.9
, 18.
4)10
0
Less
than
pri
mar
y14
.5(9
.1, 2
2.3)
21.1
(14.
0, 3
0.4)
31.2
(22.
6, 4
1.3)
24.2
(16.
4, 3
4.2)
9.0
(4.9
, 16.
0)*
100
Prim
ary
14.8
(7.0
, 28.
6)*
25.2
(14.
3, 4
0.6)
*23
.9(1
2.6,
40.
7)*
30.2
(17.
3, 4
7.3)
*5.
9(1
.8, 1
7.2)
*10
0
Less
than
sec
onda
ry31
.2(1
7.4,
49.
5)*
13.4
(6.6
, 25.
1)*
34.6
(23.
5, 4
7.7)
16.1
(9.3
, 26.
3)*
4.8
(1.8
, 11.
9)*
100
Seco
ndar
y an
d ab
ove
30.9
(11.
5, 6
0.7)
*21
.8(8
.5, 4
5.5)
*27
.1(1
3.0,
48.
0)*
6.3
(1.5
, 22.
9)*
13.9
(4.0
, 38.
5)*
100
Wea
lth in
dex
Low
est
18.1
(13.
3, 2
4.1)
14.2
(10.
5, 1
9.1)
26.3
(20.
2, 3
3.5)
28.1
(21.
8, 3
5.3)
13.3
(9.0
, 19.
3)10
0
Low
21.5
(15.
8, 2
8.6)
20.0
(14.
2, 2
7.4)
28.9
(23.
1, 3
5.5)
18.2
(12.
6, 2
5.4)
11.4
(7.3
, 17.
4)10
0
Mid
dle
22.2
(14.
3, 3
2.6)
17.7
(11.
5, 2
6.1)
26.9
(18.
5, 3
7.5)
21.9
(14.
2, 3
2.2)
11.3
(6.9
, 18.
2)*
100
Hig
h27
.4(1
8.6,
38.
3)15
.9(8
.5, 2
7.7)
*29
.0(2
0.4,
39.
6)19
.1(1
2.4,
28.
4)8.
6(4
.3, 1
6.5)
*10
0
Hig
hest
31.7
(14.
5, 5
5.9)
*26
.6(1
0.8,
52.
2)*
31.4
(12.
1, 6
0.4)
*10
.3(3
.0, 2
9.8)
*0.
010
01 A
mon
g cu
rren
t dai
ly o
r le
ss th
an d
aily
bid
ism
oker
s.
* Es
timat
e ba
sed
on fe
wer
than
25
unw
eigh
ted
case
s.

Tabl
e 5.
3B (c
ont.
): P
erce
ntag
e di
stri
butio
n of
cur
rent
bid
i sm
oker
s ≥1
5 ye
ars
old,
by
inte
rest
in q
uitt
ing
smok
ing
and
sele
cted
dem
ogra
phic
char
acte
rist
ics–
GAT
S Ba
ngla
desh
, 200
9
86
GATS Bangladesh Report-2009
Dem
ogra
phic
cha
ract
eris
tics
Inte
rest
in q
uitt
ing
smok
ing1
Plan
ning
to q
uit
wit
hin
next
mon
thTh
inki
ng a
bout
qui
ttin
gw
ithi
n ne
xt 1
2 m
onth
sW
ill q
uit
som
eday
, but
not
in t
he n
ext
12 m
onth
sN
ot in
tere
sted
in q
uitt
ing
Don
’t k
now
Tota
l
Perc
enta
ge (9
5% C
I )
Occ
upat
ion
Empl
oyed
16.5
(7.1
, 33.
9)*
15.0
(3.6
, 45.
8)*
38.4
(17.
8, 6
4.2)
*28
.1(1
2.2,
52.
4)*
2.0
(0.3
, 13.
0)*
100
Busi
ness
24.9
(13.
8, 4
0.6)
*14
.5(8
.5, 2
3.6)
*30
.3(2
0.2,
42.
7)21
.0(1
2.7,
32.
7)9.
3(5
.0, 1
7.0)
*10
0
Farm
ers
18.1
(12.
5, 2
5.6)
21.1
(13.
8, 3
0.9)
26.2
(19.
6, 3
4.1)
21.6
(15.
6, 2
9.1)
13.0
(8.9
, 18.
4)10
0
Labo
rers
21.1
(16.
4, 2
6.6)
14.8
(11.
2, 1
9.2)
30.4
(24.
7, 3
6.8)
22.5
(17.
2, 2
8.8)
11.2
(7.6
, 16.
2)10
0
Stud
ent
100.
0*
0.0
0.0
0.0
0.0
100
Hom
emak
er15
.4(4
.4, 4
1.7)
*11
.8(4
.1, 2
9.7)
*11
.7(4
.0, 2
9.4)
*48
.2(2
7.8,
69.
2)*
12.9
(3.7
, 36.
6)*
100
Une
mpl
oyed
39.1
(17.
4, 6
6.3)
*23
.0(1
0.3,
43.
8)*
19.4
(7.9
, 40.
5)*
8.0
(2.9
, 20.
2)*
10.5
(3.7
, 25.
9)*
100
1 Am
ong
curr
ent d
aily
or
less
than
dai
ly b
idi s
mok
ers.
*
Estim
ate
base
d on
few
er th
an 2
5 u
nwei
ghte
d ca
ses.
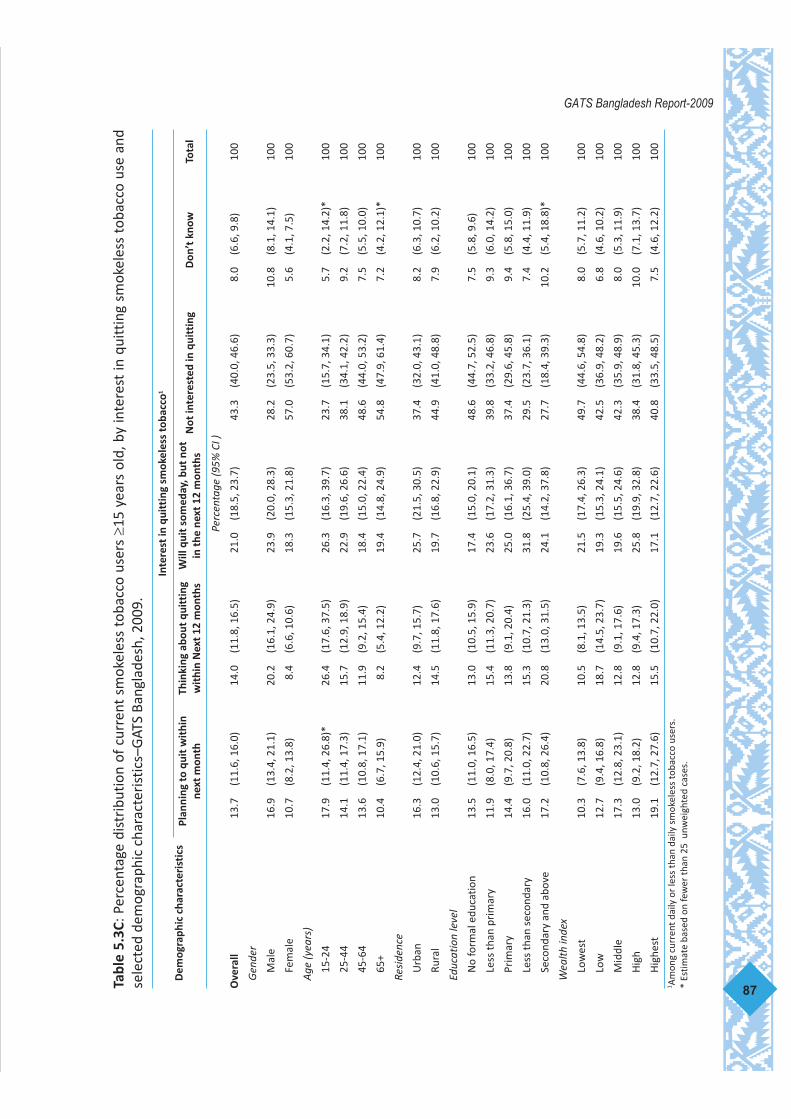
87
GATS Bangladesh Report-2009Ta
ble
5.3C
: Per
cent
age
dist
ribu
tion
of c
urre
nt s
mok
eles
s to
bacc
o us
ers ≥1
5 ye
ars
old,
by
inte
rest
in q
uitt
ing
smok
eles
s to
bacc
o us
e an
dse
lect
ed d
emog
raph
ic c
hara
cter
istic
s–G
ATS
Bang
lade
sh, 2
009.
Dem
ogra
phic
cha
ract
eris
tics
Inte
rest
in q
uitt
ing
smok
eles
s to
bacc
o1
Plan
ning
to q
uit
wit
hin
next
mon
thTh
inki
ng a
bout
qui
ttin
gw
ithi
n N
ext
12 m
onth
sW
ill q
uit
som
eday
, but
not
in t
he n
ext
12 m
onth
sN
ot in
tere
sted
in q
uitt
ing
Don
’t k
now
Tota
l
Perc
enta
ge (9
5% C
I )
Ove
rall
13.7
(11.
6, 1
6.0)
14.0
(11.
8, 1
6.5)
21.0
(18.
5, 2
3.7)
43.3
(40.
0, 4
6.6)
8.0
(6.6
, 9.8
)10
0
Gen
der
Mal
e16
.9(1
3.4,
21.
1)20
.2(1
6.1,
24.
9)23
.9(2
0.0,
28.
3)28
.2(2
3.5,
33.
3)10
.8(8
.1, 1
4.1)
100
Fem
ale
10.7
(8.2
, 13.
8)8.
4(6
.6, 1
0.6)
18.3
(15.
3, 2
1.8)
57.0
(53.
2, 6
0.7)
5.6
(4.1
, 7.5
)10
0
Age
(yea
rs)
15-2
417
.9(1
1.4,
26.
8)*
26.4
(17.
6, 3
7.5)
26.3
(16.
3, 3
9.7)
23.7
(15.
7, 3
4.1)
5.7
(2.2
, 14.
2)*
100
25-4
414
.1(1
1.4,
17.
3)15
.7(1
2.9,
18.
9)22
.9(1
9.6,
26.
6)38
.1(3
4.1,
42.
2)9.
2(7
.2, 1
1.8)
100
45-6
413
.6(1
0.8,
17.
1)11
.9(9
.2, 1
5.4)
18.4
(15.
0, 2
2.4)
48.6
(44.
0, 5
3.2)
7.5
(5.5
, 10.
0)10
0
65+
10.4
(6.7
, 15.
9)8.
2(5
.4, 1
2.2)
19.4
(14.
8, 2
4.9)
54.8
(47.
9, 6
1.4)
7.2
(4.2
, 12.
1)*
100
Resi
denc
e
Urb
an16
.3(1
2.4,
21.
0)12
.4(9
.7, 1
5.7)
25.7
(21.
5, 3
0.5)
37.4
(32.
0, 4
3.1)
8.2
(6.3
, 10.
7)10
0
Rura
l13
.0(1
0.6,
15.
7)14
.5(1
1.8,
17.
6)19
.7(1
6.8,
22.
9)44
.9(4
1.0,
48.
8)7.
9(6
.2, 1
0.2)
100
Educ
atio
n le
vel
No
form
al e
duca
tion
13.5
(11.
0, 1
6.5)
13.0
(10.
5, 1
5.9)
17.4
(15.
0, 2
0.1)
48.6
(44.
7, 5
2.5)
7.5
(5.8
, 9.6
)10
0
Less
than
pri
mar
y11
.9(8
.0, 1
7.4)
15.4
(11.
3, 2
0.7)
23.6
(17.
2, 3
1.3)
39.8
(33.
2, 4
6.8)
9.3
(6.0
, 14.
2)10
0
Prim
ary
14.4
(9.7
, 20.
8)13
.8(9
.1, 2
0.4)
25.0
(16.
1, 3
6.7)
37.4
(29.
6, 4
5.8)
9.4
(5.8
, 15.
0)10
0
Less
than
sec
onda
ry16
.0(1
1.0,
22.
7)15
.3(1
0.7,
21.
3)31
.8(2
5.4,
39.
0)29
.5(2
3.7,
36.
1)7.
4(4
.4, 1
1.9)
100
Seco
ndar
y an
d ab
ove
17.2
(10.
8, 2
6.4)
20.8
(13.
0, 3
1.5)
24.1
(14.
2, 3
7.8)
27.7
(18.
4, 3
9.3)
10.2
(5.4
, 18.
8)*
100
Wea
lth in
dex
Low
est
10.3
(7.6
, 13.
8)10
.5(8
.1, 1
3.5)
21.5
(17.
4, 2
6.3)
49.7
(44.
6, 5
4.8)
8.0
(5.7
, 11.
2)10
0
Low
12.7
(9.4
, 16.
8)18
.7(1
4.5,
23.
7)19
.3(1
5.3,
24.
1)42
.5(3
6.9,
48.
2)6.
8(4
.6, 1
0.2)
100
Mid
dle
17.3
(12.
8, 2
3.1)
12.8
(9.1
, 17.
6)19
.6(1
5.5,
24.
6)42
.3(3
5.9,
48.
9)8.
0(5
.3, 1
1.9)
100
Hig
h13
.0(9
.2, 1
8.2)
12.8
(9.4
, 17.
3)25
.8(1
9.9,
32.
8)38
.4(3
1.8,
45.
3)10
.0(7
.1, 1
3.7)
100
Hig
hest
19.1
(12.
7, 2
7.6)
15.5
(10.
7, 2
2.0)
17.1
(12.
7, 2
2.6)
40.8
(33.
5, 4
8.5)
7.5
(4.6
, 12.
2)10
01 A
mon
g cu
rren
t dai
ly o
r le
ss th
an d
aily
sm
okel
ess
toba
cco
user
s.*
Estim
ate
base
d on
few
er th
an 2
5 u
nwei
ghte
d ca
ses.

Tabl
e 5.
3C (c
ont.
): P
erce
ntag
e di
stri
butio
n of
cur
rent
sm
okel
ess
toba
cco
user
s ≥1
5 ye
ars
old,
by
inte
rest
in q
uitt
ing
smok
eles
s to
bacc
o us
ean
d se
lect
ed d
emog
raph
ic c
hara
cter
istic
s–G
ATS
Bang
lade
sh, 2
009.
88
GATS Bangladesh Report-2009
Dem
ogra
phic
cha
ract
eris
tics
Inte
rest
in q
uitt
ing
smok
eles
s to
bacc
o1
Plan
ning
to q
uit
wit
hin
next
mon
thTh
inki
ng a
bout
qui
ttin
gw
ithi
n N
ext
12 m
onth
sW
ill q
uit
som
eday
, but
not
in t
he n
ext
12 m
onth
sN
ot in
tere
sted
in q
uitt
ing
Don
’t k
now
Tota
l
Perc
enta
ge (9
5% C
I )
Occ
upat
ion
Empl
oyed
15.7
(9.2
, 25.
4)*
20.2
(12.
6, 3
0.8)
23.1
(16.
4, 3
1.5)
31.0
(20.
8, 4
3.5)
10.0
(6.0
, 16.
1)*
100
Busi
ness
25.5
(17.
7, 3
5.3)
19.2
(13.
6, 2
6.5)
23.1
(17.
0, 3
0.6)
22.6
(16.
3, 3
0.5)
9.6
(5.7
, 15.
4)10
0
Farm
ers
10.5
(7.0
, 15.
5)24
.4(1
8.0,
32.
1)18
.7(1
3.9,
24.
6)35
.8(2
8.5,
43.
9)10
.6(7
.2, 1
5.6)
100
Labo
rers
14.1
(10.
6, 1
8.5)
17.9
(13.
4, 2
3.5)
26.9
(21.
6, 3
3.0)
30.3
(25.
4, 3
5.8)
10.8
(7.4
, 15.
3)10
0
Stud
ent
29.1
(4.0
, 80.
3)*
37.1
(5.8
, 85.
1)*
17.5
(2.1
, 67.
5)*
7.3
(0.8
, 42.
5)*
9.1
(1.0
, 48.
8)*
100
Hom
emak
er11
.1(8
.2, 1
4.9)
7.8
(6.0
, 9.9
)18
.9(1
5.4,
23.
0)56
.6(5
2.2,
60.
9)5.
6(4
.0, 7
.5)
100
Une
mpl
oyed
16.1
(9.4
, 26.
3)*
6.3
(3.2
, 11.
9)*
15.0
(9.3
, 23.
4)56
.3(4
6.4,
65.
8)6.
3(3
.1, 1
2.1)
*10
01 A
mon
g cu
rren
t dai
ly o
r le
ss th
an d
aily
sm
okel
ess
toba
cco
user
s.*
Estim
ate
base
d on
few
er th
an 2
5 u
nwei
ghte
d ca
ses.

In Bangladesh smoking in public places is prohibited by law. Health-care facilities andeducational facilities are 100% smoke-free by law; however, there is a partial ban in otherpublic places. The Global Youth Tobacco Survey10 shows that more than 40% of students aged13-15 years were exposed to second-hand smoke (SHS) in public places and the Global HealthProfessions Students Survey9 results show that more than 70% of third-year medical and dentalstudents were exposed to second-hand smoke (SHS) in public places. However, there was nodata on SHS exposure among the general adult population in public places, includingworkplaces before GATS in Bangladesh.
This chapter measures exposure to second-hand smoke in public places like indoorworkplaces, government buildings, health-care facilities, restaurants and public transport.
Key findings:
• Among those who work indoors, 6 in 10 were exposed to SHS at indoorworkplaces in the 30 days preceding the survey.
• More than 4 in 10 respondents reported exposure to SHS in publicplaces.
• Almost more than one fourth of all adults were exposed to SHS inrestaurants and public transports.
6.1 SHS exposure in indoor workplaces
Prevalence and estimated numbers of people exposed to SHS in indoor workplaces over thepreceding 30 days are shown in Table 6.1.
6.1.1 Prevalence of SHS exposure in indoor workplaces
Exposure to SHS in indoor workplaces was inquired about from those who work outside thehome and usually work indoors. Overall, 63% of workers are exposed to SHS at indoorworkplaces. Male workers (67.8%) have higher exposure to SHS than female workers (30.4%).Nearly 6 in 10 (57.7%) of young (15-24 years of age) workers were exposed to SHS atworkplaces. Workers living in rural (66.0%) areas have more exposure to SHS at indoorworkplaces than those living in urban areas (58.7%). Workers with low education (no formaleducation, 70.9%; and less than primary education, 70.6%) were more exposed to SHS inindoor workplaces than those with secondary and above education (49.4%). By socioeconomicstatus, workers with lowest (65.9%), low (67.5%) and middle (62.1%) SES were more exposedto SHS in indoor workplaces than those belonging to the highest SES levels (59.0%). Byoccupational category, exposure varied from 44.4% (unemployed) to 80.6% (business).
Among non-smoking workers, 75.7% were exposed to SHS in indoor workplaces. Non-smoking female workers (91.0%) were exposed more to SHS compared to their male (75.6%)counterparts. Nearly 7 in 10 (70.5%) of the young (15-24 years of age) non-smokers wereexposed to SHS in indoor workplaces. Non-smoking workers living in urban areas (75.6%) and
89
GATS Bangladesh Report-2009
6. Second-hand smoke

rural areas (75.8%) were equally exposed to SHS at indoor workplaces. Non-smoking workerswith lower educational levels (no formal education, 82.4%) were more exposed to SHS atindoor workplaces than smokers with in higher education levels (secondary and above, 69.2%).Classified by socioeconomic status, the lowest SES (81.9%) was more exposed to SHS in indoorworkplaces than the highest SES (73.2%).
6.1.2 Number of workers exposed to SHS in indoor workplaces:
Overall 11.5 million workers are exposed to SHS in the indoor areas of their workplaces; 10.8million male workers and 0.7 million female workers are exposed to SHS in indoor workplaces.Classified by age group, adult workers in the age group 25-44 were most prominently (5.7million) exposed to SHS in indoor workplaces.
The estimated number of workers living in rural areas who were exposed to SHS in indoorworkplaces is 7.1 million whereas those living in urban areas is 4.4 million. Nearly the samenumber of adults are exposed to SHS in the workplace in each of the educational categories(no formal education, 2.6 million; less then primary, 2.2 million; less then secondary, 2.8million, and secondary and above, 2.4 million) except primary education level (1.3 million).Similarly, classified by SES group, equal numbers from low SES (lowest 1.2 million, low 2.2million, and middle 2.2 million) and high SES (high 3.2 million, highest 2.6 million) wereexposed to SHS at the worksite. Lastly, 3.6 million labourers and 4.2 million in the businesscategory and 2.1 million employed persons were exposed to SHS at workplaces.
Five million non-smoking workers (predominantly male) are exposed to SHS at indoorworkplaces. Non-smoking workers in the age category 25-44 years have the highest numberof persons who are exposed to SHS in indoor workplaces (2.7 million); 3.1 million non-smokersin rural areas and 1.9 million in urban areas are exposed to SHS. Nearly 2 million non-smokersin low SES (lowest, low, SES together) , over 1 million in middle SES and nearly 2 million inhigh SES (high and highest SES together)are exposed to SHS.
90
GATS Bangladesh Report-2009

Table 6.1: Percentage and number of adults ≥15 years old, who work indoors and are exposedto tobacco smoke at work, by smoking status and selected demographic characteristics–GATSBangladesh, 2009.
91
GATS Bangladesh Report-2009
Demographiccharacteristics
Adults exposed to tobacco smoke at work1
Percentage (95% CI ) Number in thousands
Overall 63.0 (59.2, 66.7) 11,546.3
Gender
Male 67.8 (63.7, 71.6) 10,830.4
Female 30.4 (24.1, 37.6) 715.9
Age (years)
15-24 57.7 (50.7, 64.4) 3,060.9
25-44 64.7 (60.2, 69.0) 5,720.1
45-64 66.5 (59.9, 72.5) 2,411.4
65+ 63.8 (46.5, 78.1) 353.9
Residence
Urban 58.7 (53.5, 63.8) 4,429.1
Rural 66.0 (60.4, 71.2) 7,117.2
Education level
No formal education 70.9 (64.7, 76.4) 2,683.9
Less than primary 70.6 (62.5, 77.6) 2,203.3
Primary 66.6 (57.4, 74.6) 1,375.9
Less than secondary 64.1 (57.3, 70.4) 2,810.3
Secondary and above 49.4 (43.1, 55.7) 2,442.4
Wealth index
Lowest 65.9 (56.7, 74.1) 1,205.4
Low 67.5 (59.6, 74.6) 2,207.2
Middle 62.1 (54.2, 69.4) 2,221.0
High 63.1 (55.6, 70.0) 3,296.9
Highest 59.0 (52.9, 64.8) 2,615.8
Occupation
Employed 44.4 (39.0, 50.0) 2,101.4
Business 80.6 (75.1, 85.2) 4,205.5
Farmers 68.1 (57.1, 77.4) 1,198.9
Labourers 69.5 (63.7, 74.7) 3,675.9
Student 20.6 (10.7, 36.0)* 207.0*
Homemaker 50.4 (30.5, 70.2)* 94.6*
Unemployed 47.6 (14.8, 82.7)* 56.6*1 In the past 30 days. Among those respondents who work outside of the home who usuallywork indoors or both indoors and outdoors. * Estimate based on fewer than 25 unweighted cases.

Table 6.1 (cont.): Percentage and number of adults ≥15 years old, who work indoors and areexposed to tobacco smoke at work, by smoking status and selected demographiccharacteristics–GATS Bangladesh, 2009.
6.2 SHS exposure in public places
Common sites of exposure to SHS in public places are government buildings, health-carefacilities, restaurants, public transport or other places. Table 6.2 presents the prevalence rateof SHS exposure in these public places for the preceding 30 days for all adults and for non-smokers aged 15 years and over, respectively.
92
GATS Bangladesh Report-2009
Demographiccharacteristics Adults exposed to tobacco smoke at work1
Percentage (95% CI ) Number in thousands
Non-smokers 75.7 (70.1, 80.6) 5,094.1Gender
Male 75.6 (70.0, 80.5) 5,055.5Female 91.0 (52.4, 98.9)* 38.6*
Age (years)15-24 70.5 (55.9, 81.8) 861.425-44 77.8 (70.6, 83.7) 2,728.345-64 75.8 (67.2, 82.7) 1,379.465+ 69.4 (38.1, 89.3)* 125.1*
ResidenceUrban 75.6 (69.7, 80.7) 1,933.6Rural 75.8 (67.2, 82.7) 3,160.5
Education LevelNo formal education 82.4 (74.5, 88.3) 1,709.1Less than primary 76.0 (65.2, 84.3) 912.4Primary 79.5 (66.7, 88.2) 605.3Less than secondary 69.6 (60.7, 77.2) 1,039.3Secondary and above 69.2 (55.6, 80.1) 828.0
Wealth indexLowest 81.9 (70.1, 89.7) 637.3Low 78.3 (68.4, 85.8) 1,249.2Middle 76.6 (65.7, 84.9) 1,129.5High 71.5 (60.1, 80.7) 1,233.1Highest 73.2 (64.0, 80.7) 845.0
OccupationEmployed 52.9 (41.4, 64.1) 668.4Business 83.7 (74.9, 89.9) 1,837.3Farmers 76.1 (60.5, 86.8) 574.1Labourers 82.7 (75.5, 88.2) 1,967.3Student 18.1 (1.9, 71.7)* 13.8*Homemaker 40.2 (7.6, 84.5)* 5.2*Unemployed 60.8 (13.8, 93.7)* 28.0*
1 In the past 30 days. Among those respondents who work outside of the home who usuallywork indoors or both indoors and outdoors. * Estimate based on fewer than 25 unweighted cases.

6.2.1 Prevalence of adults exposed to SHS in all public places
Among all adults, 45% were exposed to second-hand smoke in any of the public places. It wasfound that 69.4% of the male and 20.8 % of the female adult population are exposed to SHSin public places. Urban and rural figures are almost similar (urban 46.6%, rural 44.4%). Byoccupational category, it varies from 20.6% (homemakers) to 78.3% (business). By SEScategory, it varies from 37.9% (lowest) to 49.1% (highest) and by education category from39.2% (no formal education) to 58.3% (secondary and above education).
Among non-smokers, 7 in 10 (70.1%) non-smokers are exposed to SHS in public places(predominantly males 72.1%). Classified by age, it varies from 80.1% (15-24 years) to 47.1%(65 years and older). Exposure in public places is similar among non-smokers in rural areas(70.4%) and urban areas (70.2%) areas; classified by educational level, it varies from 64.0% (noformal education) to 84.1% (secondary and above education); by wealth index, it varies from64.4% (lowest SES) to 79.1% (highest SES); by occupational category, it varies from 61.4%(unemployed) to 81.3% (business).
Among the four main categories of public places people are exposed more in restaurants(27.6%) and public transportation (26.3%) than health-care facilities (5.8%) and governmentbuildings (5.4%).
6.2.2 Prevalence of exposure to SHS in public transportation
Among all adults, over one fourth of adults population (26.3%) traveling in public transportwere exposed to SHS in the past 30 days. Males (35.9%) were exposed more compared to thefemales (16.9%): By age, exposure ranged from 13.9% (65 years and older) to 28.1% (15-24years); categorized by education the variation was from 24.6% (no formal education) to 34.5%(secondary and above); and by SES group, from 22.5% (lowest SES) to 29.4% (highest SES).
Among non-smokers, of 35.9% non-smokers were exposed to SHS in public transportation(predominantly males, 36.6%); by age, the figure varied from 20.1% (65 years and older) to40.9% (25-44 years). By occupational category, the variation was from 28.0% (unemployed) to41.8% (business).
6.2.3 Prevalence of exposure to SHS in restaurants
Among all adults, nearly one fourth (27.6%) of visitors to restaurants were exposed to SHS during thelast 30 day. Males (53.4%) were exposed to SHS more than females (2.2%) in restaurants during last30 days. By age category, it varies from 14.2% (65 years and above) to 29.6% (15-24 years); byeducational category, exposure varied from 22.7% (no formal education) to 36.8% (secondary andabove); by SES, it varies from 23.0% (lowest) to 30.2% (high SES); and by occupational category it variesfrom 1.8% (homemaker) to 62.5% (business).
More than half (55.4%) of non-smokers were exposed to SHS during a visit to a restaurant in thelast 30 days. Males (57.2%) were exposed more compared to females (2.6%). By age, SHS exposurevaried from 65.4% (15-24 years) to 32.1% (65 years and above); by educational category it rangedfrom 48.4% (no formal education) to 66.6% (secondary and above education); by SES categories, itvaries from 47.8% (lowest SES) to 64.2% (highest SES); and by occupational category it varies from47.7% (unemployed) to 68.9% (business).
93
GATS Bangladesh Report-2009

94
GATS Bangladesh Report-2009Ta
ble
6.2:
Per
cent
age
of a
dults
≥15
yea
rs o
ld, w
ho w
ere
expo
sed
to to
bacc
o sm
oke
in p
ublic
pla
ces
in th
e pa
st 3
0 da
ys, b
y sm
okin
g st
atus
and
sele
cted
dem
ogra
phic
cha
ract
eris
tics–
GAT
S Ba
ngla
desh
, 200
9.
Dem
ogra
phic
cha
ract
eris
tics
Adu
lts
expo
sed
to to
bacc
o sm
oke1
in ..
.
Gov
ernm
ent
build
ings
Hea
lth-
care
faci
litie
sRe
stau
rant
sPu
blic
tran
spor
tati
onA
ny o
f the
se p
lace
s2
Perc
enta
ge (9
5% C
I )
Ove
rall
5.4
(4.8
, 6.0
)5.
8(5
.0, 6
.6)
27.6
(26.
1, 2
9.2)
26.3
(24.
8, 2
7.9)
45.0
(43.
4, 4
6.5)
Gen
der
Mal
e9.
2(8
.1, 1
0.5)
7.1
(5.7
, 8.8
)53
.4(5
0.4,
56.
3)35
.9(3
3.5,
38.
3)69
.4(6
7.0,
71.
6)
Fem
ale
1.5
(1.2
, 2.0
)4.
4(3
.7, 5
.4)
2.2
(1.6
, 2.8
)16
.9(1
5.2,
18.
7)20
.8(1
9.1,
22.
7)
Age
(yea
rs)
15-2
43.
9(2
.9, 5
.3)
6.7
(5.3
, 8.4
)29
.6(2
6.6,
32.
7)28
.1(2
5.4,
30.
9)48
.0(4
4.7,
51.
2)
25-4
45.
5(4
.7, 6
.3)
5.9
(4.9
, 7.2
)29
.5(2
7.5,
31.
5)27
.2(2
5.3,
29.
1)46
.2(4
4.2,
48.
1)
45-6
47.
6(6
.1, 9
.4)
4.7
(3.6
, 6.3
)25
.2(2
2.5,
28.
1)26
.2(2
3.6,
28.
9)44
.0(4
1.1,
46.
9)
65+
4.3
(2.8
, 6.4
)3.
6(2
.2, 5
.8)
14.2
(11.
2, 1
7.8)
13.9
(10.
7, 1
7.8)
26.7
(22.
8, 3
1.0)
Resi
denc
e
Urb
an7.
8(6
.5, 9
.2)
6.8
(5.2
, 8.9
)29
.9(2
8.2,
31.
7)26
.4(2
4.5,
28.
3)46
.6(4
4.5,
48.
6)
Rura
l4.
5(3
.8, 5
.3)
5.4
(4.6
, 6.3
)26
.8(2
4.8,
28.
9)26
.3(2
4.4,
28.
3)44
.4(4
2.4,
46.
4)
Educ
atio
n le
vel
No
form
al e
duca
tion
3.5
(2.7
, 4.4
)4.
3(3
.4, 5
.5)
22.7
(20.
6, 2
5.1)
24.6
(22.
1, 2
7.2)
39.2
(36.
8, 4
1.7)
Less
than
pri
mar
y3.
5(2
.5, 4
.9)
5.7
(4.0
, 8.1
)31
.9(2
8.5,
35.
6)25
.8(2
2.8,
29.
1)47
.3(4
3.9,
50.
7)
Prim
ary
2.6
(1.8
, 3.9
)4.
9(3
.4, 7
.1)
24.4
(20.
8, 2
8.5)
23.5
(20.
0, 2
7.4)
40.8
(36.
1, 4
5.7)
Less
than
sec
onda
ry6.
6(5
.2, 8
.3)
6.8
(5.3
, 8.7
)28
.8(2
6.1,
31.
6)26
.2(2
3.5,
29.
2)46
.9(4
3.7,
50.
1)
Seco
ndar
y an
d ab
ove
12.7
(10.
4, 1
5.3)
8.3
(6.3
, 10.
9)36
.8(3
2.9,
40.
9)34
.5(3
0.9,
38.
3)58
.3(5
4.5,
62.
0)
Wea
lth in
dex
Low
est
2.2
(1.3
, 3.6
)4.
1(2
.9, 5
.8)
23.0
(20.
4, 2
6.0)
22.5
(19.
7, 2
5.6)
37.9
(34.
8, 4
1.1)
Low
3.1
(2.3
, 4.2
)3.
9(2
.9, 5
.1)
26.8
(23.
9, 2
9.9)
24.8
(22.
0, 2
7.8)
42.7
(39.
6, 4
5.9)
Mid
dle
5.2
(3.9
, 6.9
)5.
7(4
.3, 7
.6)
29.3
(25.
9, 3
2.9)
28.4
(25.
2, 3
1.8)
47.1
(43.
2, 5
1.0)
Hig
h7.
5(5
.8, 9
.6)
8.4
(6.4
, 11.
0)30
.2(2
7.3,
33.
4)27
.2(2
4.3,
30.
3)48
.4(4
5.3,
51.
6)
Hig
hest
10.0
(8.3
, 12.
0)6.
8(5
.2, 8
.7)
28.4
(25.
5, 3
1.6)
29.4
(26.
1, 3
2.9)
49.1
(45.
4, 5
2.7)
1 In
the
past
30
days
.2
Resp
onde
nts
repo
rtin
g sm
okin
g oc
curr
ed in
gov
ernm
ent b
uild
ings
, hea
lth-c
are
faci
litie
s, re
stau
rant
s, o
r pu
blic
tran
spor
tatio
n.
* Es
timat
e ba
sed
on fe
wer
than
25
unw
eigh
ted
case
s.

Tabl
e 6.
2 (c
ont.
): P
erce
ntag
e of
adu
lts ≥
15 y
ears
old
, who
wer
e ex
pose
d to
toba
cco
smok
e in
pub
lic p
lace
s in
the
past
30
days
, by
smok
ing
stat
us a
nd s
elec
ted
dem
ogra
phic
cha
ract
eris
tics–
GAT
S Ba
ngla
desh
, 200
9.
95
GATS Bangladesh Report-2009
Dem
ogra
phic
cha
ract
eris
tics
Adu
lts
expo
sed
to to
bacc
o sm
oke1
in ..
.
Gov
ernm
ent
build
ings
Hea
lth-
care
faci
litie
sRe
stau
rant
sPu
blic
tran
spor
tati
onA
ny o
f the
se p
lace
s2
Perc
enta
ge (9
5% C
I )
Occ
upat
ion
Empl
oyed
15.3
(12.
2, 1
9.0)
7.5
(5.3
, 10.
3)45
.0(4
0.5,
49.
5)30
.8(2
6.9,
35.
0)63
.1(5
8.7,
67.
2)
Busi
ness
10.2
(7.9
, 13.
2)8.
9(5
.5, 1
3.9)
62.5
(57.
7, 6
7.1)
43.8
(39.
3, 4
8.4)
78.3
(74.
4, 8
1.8)
Farm
ers
9.6
(7.5
, 12.
3)5.
9(4
.2, 8
.4)
47.6
(42.
5, 5
2.7)
34.8
(30.
5, 3
9.4)
66.5
(62.
2, 7
0.6)
Labo
urer
s5.
0(3
.6, 7
.1)
4.7
(3.4
, 6.3
)42
.5(3
8.4,
46.
6)29
.4(2
6.0,
33.
0)57
.2(5
3.4,
61.
0)
Stud
ent
6.7
(4.3
, 10.
2)10
.0(6
.4, 1
5.4)
36.8
(31.
1, 4
3.0)
36.2
(30.
1, 4
2.7)
57.3
(51.
2, 6
3.2)
Hom
emak
er1.
4(1
.0, 1
.9)
4.6
(3.7
, 5.7
)1.
8(1
.3, 2
.4)
16.6
(14.
8, 1
8.6)
20.6
(18.
6, 2
2.6)
Une
mpl
oyed
4.3
(2.4
, 7.6
)4.
3(2
.6, 6
.9)
22.5
(17.
2, 2
8.8)
17.2
(12.
9, 2
2.5)
32.3
(26.
5, 3
8.7)
Non
-sm
oker
s9.
2(7
.7, 1
0.9)
5.8
(4.4
, 7.6
)55
.4(5
2.1,
58.
7)35
.9(3
2.6,
39.
3)70
.3(6
7.6,
72.
9)
Gen
der
Mal
e9.
4(7
.9, 1
1.1)
5.8
(4.4
, 7.6
)57
.2(5
3.8,
60.
6)36
.6(3
3.3,
40.
1)72
.1(6
9.4,
74.
7)
Fem
ale
3.0
(0.9
, 8.9
)*5.
0(1
.7, 1
4.2)
*2.
6(0
.8, 8
.4)*
14.9
(6.7
, 30.
0)*
18.7
(9.8
, 32.
8)*
Age
(yea
rs)
15-2
48.
0(4
.3, 1
4.2)
*8.
7(4
.6, 1
5.9)
*65
.4(5
5.9,
73.
7)39
.8(3
1.1,
49.
1)80
.1(7
1.9,
86.
4)
25-4
49.
6(7
.4, 1
2.2)
7.0
(4.9
, 9.8
)61
.4(5
7.3,
65.
3)40
.9(3
6.9,
45.
1)75
.1(7
1.8,
78.
1)
45-6
410
.3(7
.7, 1
3.6)
3.6
(2.2
, 5.7
)45
.7(4
0.4,
51.
0)29
.2(2
4.6,
34.
3)62
.7(5
7.8,
67.
3)
65+
4.5
(1.7
, 11.
1)*
0.1
(0.0
, 1.0
)*32
.1(2
3.6,
41.
9)20
.1(1
2.6,
30.
6)47
.1(3
7.1,
57.
3)
Resi
denc
e
Urb
an14
.2(1
1.0,
18.
1)6.
6(4
.1, 1
0.5)
55.9
(50.
2, 6
1.4)
32.3
(28.
5, 3
6.3)
70.2
(65.
3, 7
4.6)
Rura
l7.
6(6
.1, 9
.4)
5.5
(3.9
, 7.6
)55
.3(5
1.2,
59.
2)37
.1(3
2.9,
41.
4)70
.4(6
7.1,
73.
5)
Educ
atio
n le
vel
No
form
al e
duca
tion
6.7
(4.7
, 9.5
)5.
1(3
.3, 8
.0)
48.4
(43.
9, 5
2.8)
36.2
(31.
8, 4
0.9)
64.0
(60.
2, 6
7.6)
Less
than
pri
mar
y4.
8(2
.9, 7
.9)
2.5
(1.3
, 4.8
)*57
.3(5
0.6,
63.
8)32
.5(2
6.8,
38.
9)66
.8(5
9.7,
73.
2)
Prim
ary
4.1
(1.7
, 9.5
)*3.
1(1
.5, 6
.3)*
60.2
(51.
3, 6
8.5)
39.7
(30.
9, 4
9.2)
78.5
(70.
8, 8
4.6)
Less
than
sec
onda
ry13
.7(9
.6, 1
9.3)
7.0
(4.2
, 11.
5)*
65.5
(57.
8, 7
2.4)
37.4
(30.
5, 4
4.7)
81.1
(75.
6, 8
5.5)
Seco
ndar
y an
d ab
ove
27.9
(21.
1, 3
5.9)
16.0
(9.5
, 25.
7)66
.6(5
7.2,
74.
8)34
.9(2
5.8,
45.
1)84
.1(7
7.2,
89.
2)1 In
the
past
30
days
.2
Resp
onde
nts
repo
rtin
g sm
okin
g oc
curr
ed in
gov
ernm
ent b
uild
ings
, hea
lth-c
are
faci
litie
s, re
stau
rant
s, o
r pu
blic
tran
spor
tatio
n.
* Es
timat
e ba
sed
on fe
wer
than
25
unw
eigh
ted
case
s.
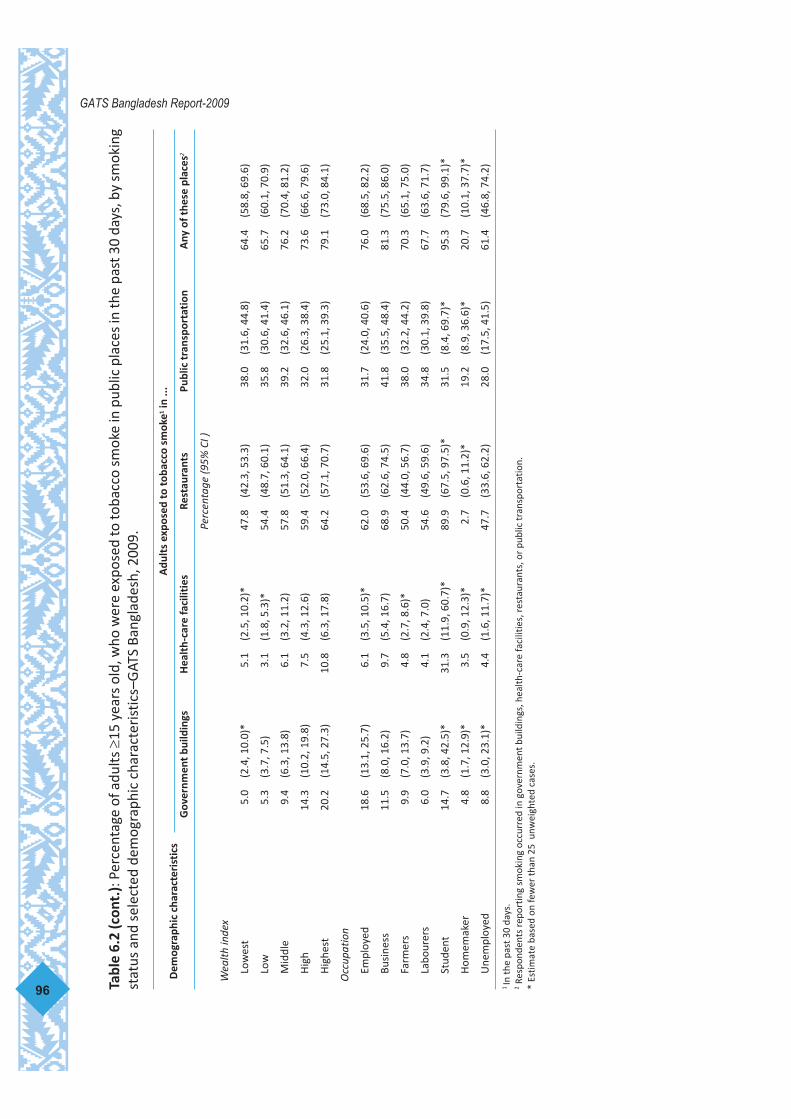
96
GATS Bangladesh Report-2009
Dem
ogra
phic
cha
ract
eris
tics
Adu
lts
expo
sed
to to
bacc
o sm
oke1
in ..
.
Gov
ernm
ent
build
ings
Hea
lth-
care
faci
litie
sRe
stau
rant
sPu
blic
tran
spor
tati
onA
ny o
f the
se p
lace
s2
Perc
enta
ge (9
5% C
I )
Wea
lth in
dex
Low
est
5.0
(2.4
, 10.
0)*
5.1
(2.5
, 10.
2)*
47.8
(42.
3, 5
3.3)
38.0
(31.
6, 4
4.8)
64.4
(58.
8, 6
9.6)
Low
5.3
(3.7
, 7.5
)3.
1(1
.8, 5
.3)*
54.4
(48.
7, 6
0.1)
35.8
(30.
6, 4
1.4)
65.7
(60.
1, 7
0.9)
Mid
dle
9.4
(6.3
, 13.
8)6.
1(3
.2, 1
1.2)
57.8
(51.
3, 6
4.1)
39.2
(32.
6, 4
6.1)
76.2
(70.
4, 8
1.2)
Hig
h14
.3(1
0.2,
19.
8)7.
5(4
.3, 1
2.6)
59.4
(52.
0, 6
6.4)
32.0
(26.
3, 3
8.4)
73.6
(66.
6, 7
9.6)
Hig
hest
20.2
(14.
5, 2
7.3)
10.8
(6.3
, 17.
8)64
.2(5
7.1,
70.
7)31
.8(2
5.1,
39.
3)79
.1(7
3.0,
84.
1)
Occ
upat
ion
Empl
oyed
18.6
(13.
1, 2
5.7)
6.1
(3.5
, 10.
5)*
62.0
(53.
6, 6
9.6)
31.7
(24.
0, 4
0.6)
76.0
(68.
5, 8
2.2)
Busi
ness
11.5
(8.0
, 16.
2)9.
7(5
.4, 1
6.7)
68.9
(62.
6, 7
4.5)
41.8
(35.
5, 4
8.4)
81.3
(75.
5, 8
6.0)
Farm
ers
9.9
(7.0
, 13.
7)4.
8(2
.7, 8
.6)*
50.4
(44.
0, 5
6.7)
38.0
(32.
2, 4
4.2)
70.3
(65.
1, 7
5.0)
Labo
urer
s6.
0(3
.9, 9
.2)
4.1
(2.4
, 7.0
)54
.6(4
9.6,
59.
6)34
.8(3
0.1,
39.
8)67
.7(6
3.6,
71.
7)
Stud
ent
14.7
(3.8
, 42.
5)*
31.3
(11.
9, 6
0.7)
*89
.9(6
7.5,
97.
5)*
31.5
(8.4
, 69.
7)*
95.3
(79.
6, 9
9.1)
*
Hom
emak
er4.
8(1
.7, 1
2.9)
*3.
5(0
.9, 1
2.3)
*2.
7(0
.6, 1
1.2)
*19
.2(8
.9, 3
6.6)
*20
.7(1
0.1,
37.
7)*
Une
mpl
oyed
8.8
(3.0
, 23.
1)*
4.4
(1.6
, 11.
7)*
47.7
(33.
6, 6
2.2)
28.0
(17.
5, 4
1.5)
61.4
(46.
8, 7
4.2)
1 In
the
past
30
days
.2
Resp
onde
nts
repo
rtin
g sm
okin
g oc
curr
ed in
gov
ernm
ent b
uild
ings
, hea
lth-c
are
faci
litie
s, re
stau
rant
s, o
r pu
blic
tran
spor
tatio
n.
* Es
timat
e ba
sed
on fe
wer
than
25
unw
eigh
ted
case
s.
Tabl
e 6.
2 (c
ont.
): P
erce
ntag
e of
adu
lts ≥
15 y
ears
old
, who
wer
e ex
pose
d to
toba
cco
smok
e in
pub
lic p
lace
s in
the
past
30
days
, by
smok
ing
stat
us a
nd s
elec
ted
dem
ogra
phic
cha
ract
eris
tics–
GAT
S Ba
ngla
desh
, 200
9.

Bangladesh is a tobacco-producing country; in 2007, the total number of cigarettesmanufactured was 22,524 millions and the annual per capita cigarette consumption was 172sticks. The price of internationally recognized brands was $1.16 (Taka 80) and a local brand was$0.58 (Taka 40).34
One study has shown that cheaper brands of cigarettes are most popular in both urbanand rural areas.35 While, there is no study available on bidi brand preference and the patternof bidi consumption.
Bangladesh’s taxation on tobacco is a supplementary duty and value-added tax (VAT). According tothe tariff value of a pack of 10 sticks, cigarettes products are divided into four slabs and progressivelyhigher supplementary duties ranging from 32% to 57% are imposed for higher-priced cigarette brands.On top of that, 15% VAT is added. In the case of bidi, for a pack of 25 sticks, the tariff value is taka 3.47and supplementary duty and VAT are 20% and 15% respectively.36 For smokeless tobacco 15% VAT isadded to the tariff value.
This chapter focuses on different brands purchased by current smokers in the lastpurchase, source of last purchase, expenditure on cigarettes or bidi.
Key Findings:
• The most used cigarette brand was Star
• The most used bidi brand was Akij
• All most all of current smokers buy manufactured cigarettes and bidifrom stores
• On average a current cigarette smoker spends 377.8 taka/month onmanufactured cigarettes and a current bidi smoker spends 130.5taka/month
• Average price of a pack of manufactured cigarettes is 32.1 taka
7.1 Brand of manufactured cigarettes in the last purchase
Current smokers of manufactured cigarettes were asked to report on the brand names of thelast cigarettes they purchased. The GATS demonstrated that in Bangladesh more than 35brands were currently being used by adults. Out of these, the top five reported brands mostpurchased were shown in Table 7.1. Among the top five reported brands, three brands (Sheikh,Navy, and Marise) were produced by local companies and two brands (Star and Gold Leaf)were produced by multinational companies.
Among the five most-purchased brands, a high proportion of those purchased by currentmanufactured cigarette smokers were Star (25.6%), Sheikh (18.3%) and Navy (13.7%). Bydemographic characteristics, all groups of current manufactured cigarette smokers mostlybought the Star brand at their last purchase. The largest proportions buying this brand ofcigarettes are: males (25.6%), persons aged 15-24 years (26.8%), those living in rural areas(29.2%), with primary education (33.7%), in the middle quintal (29.6%) of the wealth index andfarmers (34.9%).
97
GATS Bangladesh Report-2009
7. Economics

7.2 Brand of bidi in the last purchase
Current bidi smokers were asked to report on the brand names of the last bidi purchased. Thesurvey demonstrated that in Bangladesh more than 60 brands were currently being used byadults. Out of these, the top four reported brands most purchased are shown in table 7.1A.Among the five most purchased brands, Akij (29.1 %) was most popular followed by Aziz(10.8%). By demographic characteristics, taken together all groups of bidi smokers mostlybought the Akij brand at their last purchase. The largest proportions buying this brand of bidiare: males (29.2%), aged 65 years or more (34.4%), those living in urban areas (35.4%) andthose from high SES (39.6%).
98
GATS Bangladesh Report-2009

99
GATS Bangladesh Report-2009Ta
ble
7.1:
Per
cent
age
of c
urre
nt m
anuf
actu
red
ciga
rett
e sm
oker
s ≥15
yea
rs o
ld, b
y la
st b
rand
pur
chas
ed a
nd s
elec
ted
dem
ogra
phic
cha
ract
eris
tics–
GAT
SBa
ngla
desh
, 200
9.
Dem
ogra
phic
char
acte
rist
ics
Last
cig
aret
te b
rand
pur
chas
edSt
arSh
eikh
Nav
yG
old
Leaf
Mar
ise
Perc
enta
ge (9
5% C
I )O
vera
ll25
.6(2
1.6,
30.
1)18
.3(1
5.8,
21.
2)13
.7(1
0.8,
17.
2)10
.3(8
.2, 1
2.8)
8.9
(6.5
, 12.
1)G
ende
rM
ale
25.6
(21.
6, 3
0.1)
18.3
(15.
8, 2
1.2)
13.7
(10.
8, 1
7.3)
10.3
(8.2
, 12.
8)8.
9(6
.5, 1
2.1)
Fem
ale
6.8
(0.8
, 41.
5)*
11.3
(1.3
, 55.
7)*
0.0
0.0
20.7
(2.5
, 72.
8)*
Age
(yea
rs)
15-2
426
.8(1
8.3,
37.
5)15
.5(9
.5, 2
4.3)
20.2
(12.
9, 3
0.1)
15.0
(9.5
, 22.
9)3.
3(1
.3, 8
.3)*
25-4
426
.0(2
1.7,
30.
8)17
.0(1
3.8,
20.
7)12
.0(9
.1, 1
5.7)
10.5
(8.0
, 13.
7)10
.3(7
.4, 1
4.1)
45-6
423
.2(1
7.1,
30.
7)23
.3(1
7.9,
29.
8)11
.4(7
.6, 1
6.7)
6.6
(4.3
, 9.9
)10
.4(5
.8, 1
7.8)
65+
28.6
(15.
1, 4
7.5)
*21
.8(1
0.4,
40.
2)*
14.0
(5.6
, 31.
0)*
2.8
(0.6
, 11.
9)*
13.7
(5.2
, 31.
8)*
Resi
denc
eU
rban
18.7
(14.
3, 2
4.0)
19.1
(16.
3, 2
2.1)
15.2
(11.
2, 2
0.3)
17.8
(14.
0, 2
2.3)
5.2
(3.3
, 8.0
)Ru
ral
29.2
(23.
6, 3
5.6)
17.9
(14.
4, 2
2.1)
12.9
(9.2
, 17.
8)6.
4(4
.0, 1
0.0)
10.9
(7.4
, 15.
7)Ed
ucat
ion
Leve
lN
o fo
rmal
edu
catio
n25
.4(1
9.6,
32.
1)26
.7(2
1.2,
33.
1)8.
9(6
.2, 1
2.6)
2.3
(1.2
, 4.4
)*15
.6(1
0.8,
21.
9)Le
ss th
an p
rim
ary
30.7
(23.
2, 3
9.3)
14.7
(10.
6, 2
0.0)
13.9
(9.4
, 20.
1)4.
3(2
.4, 7
.6)*
9.9
(5.5
, 17.
3)*
Prim
ary
33.7
(24.
4, 4
4.4)
14.5
(9.0
, 22.
3)15
.6(8
.3, 2
7.5)
*9.
8(5
.6, 1
6.7)
*8.
0(3
.8, 1
6.0)
*Le
ss th
an s
econ
dary
26.8
(19.
6, 3
5.5)
17.7
(11.
8, 2
5.7)
16.9
(11.
9, 2
3.5)
14.3
(10.
3, 1
9.4)
3.0
(1.4
, 6.0
)*Se
cond
ary
and
abov
e10
.7(6
.1, 1
8.0)
*6.
2(3
.5, 1
0.8)
*18
.7(1
1.2,
29.
6)*
32.8
(24.
4, 4
2.5)
0.9
(0.3
, 2.9
)*W
ealth
inde
xLo
wes
t21
.5(1
4.0,
31.
6)28
.3(2
0.9,
37.
1)7.
1(3
.7, 1
3.0)
*0.
7(0
.2, 2
.4)*
14.3
(7.8
, 24.
8)Lo
w27
.9(2
1.3,
35.
7)20
.6(1
5.7,
26.
6)13
.5(9
.0, 1
9.8)
1.4
(0.6
, 3.7
)*15
.0(1
0.4,
21.
2)M
iddl
e29
.6(2
1.5,
39.
2)21
.8(1
5.7,
29.
3)17
.6(1
2.1,
25.
1)6.
0(3
.7, 9
.6)
6.9
(3.4
, 13.
4)*
Hig
h27
.3(2
0.7,
35.
2)13
.2(9
.5, 1
7.9)
17.4
(12.
4, 2
3.8)
15.0
(9.9
, 22.
2)6.
4(3
.6, 1
1.1)
Hig
hest
17.1
(11.
4, 2
4.9)
8.7
(4.5
, 16.
1)*
8.4
(5.1
, 13.
4)*
32.6
(25.
4, 4
0.6)
0.5
(0.1
, 1.9
)*N
ote:
Cur
rent
man
ufac
ture
d ci
gare
tte
smok
ers
incl
udes
dai
ly a
nd o
ccas
iona
l (le
ss th
an d
aily
) use
. Th
e to
p fiv
e re
port
ed b
rand
s la
st p
urch
ased
am
ong
all m
anuf
actu
red
ciga
rett
e sm
oker
s ar
e sh
own
here
.*
Estim
ate
base
d on
few
er th
an 2
5 u
nwei
ghte
d ca
ses.
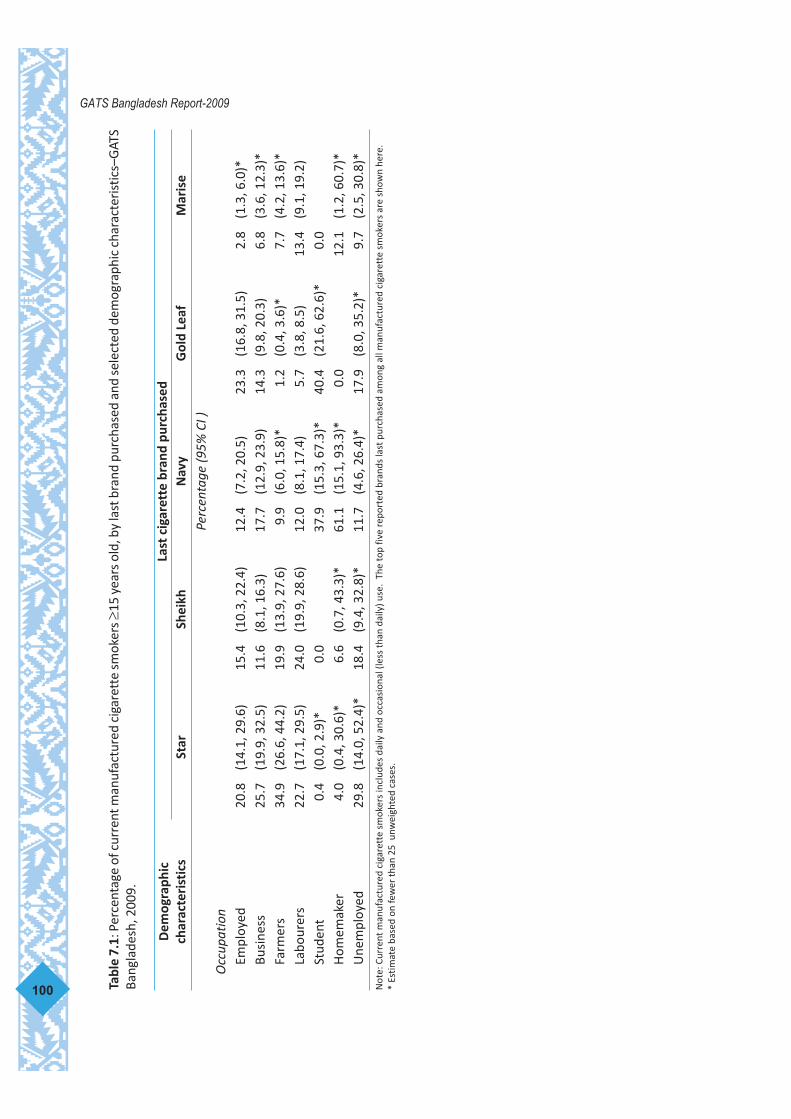
100
GATS Bangladesh Report-2009
Dem
ogra
phic
char
acte
rist
ics
Last
cig
aret
te b
rand
pur
chas
edSt
arSh
eikh
Nav
yG
old
Leaf
Mar
ise
Perc
enta
ge (9
5% C
I )O
ccup
atio
nEm
ploy
ed20
.8(1
4.1,
29.
6)15
.4(1
0.3,
22.
4)12
.4(7
.2, 2
0.5)
23.3
(16.
8, 3
1.5)
2.8
(1.3
, 6.0
)*Bu
sine
ss25
.7(1
9.9,
32.
5)11
.6(8
.1, 1
6.3)
17.7
(12.
9, 2
3.9)
14.3
(9.8
, 20.
3)6.
8(3
.6, 1
2.3)
*Fa
rmer
s34
.9(2
6.6,
44.
2)19
.9(1
3.9,
27.
6)9.
9(6
.0, 1
5.8)
*1.
2(0
.4, 3
.6)*
7.7
(4.2
, 13.
6)*
Labo
urer
s22
.7(1
7.1,
29.
5)24
.0(1
9.9,
28.
6)12
.0(8
.1, 1
7.4)
5.7
(3.8
, 8.5
)13
.4(9
.1, 1
9.2)
Stud
ent
0.4
(0.0
, 2.9
)*0.
037
.9(1
5.3,
67.
3)*
40.4
(21.
6, 6
2.6)
*0.
0H
omem
aker
4.0
(0.4
, 30.
6)*
6.6
(0.7
, 43.
3)*
61.1
(15.
1, 9
3.3)
*0.
012
.1(1
.2, 6
0.7)
*U
nem
ploy
ed29
.8(1
4.0,
52.
4)*
18.4
(9.4
, 32.
8)*
11.7
(4.6
, 26.
4)*
17.9
(8.0
, 35.
2)*
9.7
(2.5
, 30.
8)*
Not
e: C
urre
nt m
anuf
actu
red
ciga
rett
e sm
oker
s in
clud
es d
aily
and
occ
asio
nal (
less
than
dai
ly) u
se.
The
top
five
repo
rted
bra
nds
last
pur
chas
ed a
mon
g al
l man
ufac
ture
d ci
gare
tte
smok
ers
are
show
n he
re.
* Es
timat
e ba
sed
on fe
wer
than
25
unw
eigh
ted
case
s.
Tabl
e 7.
1: P
erce
ntag
e of
cur
rent
man
ufac
ture
d ci
gare
tte
smok
ers ≥
15 y
ears
old
, by
last
bra
nd p
urch
ased
and
sel
ecte
d de
mog
raph
ic c
hara
cter
istic
s–G
ATS
Bang
lade
sh, 2
009.

101
GATS Bangladesh Report-2009Ta
ble
7.1A
: Per
cent
age
of c
urre
nt b
idis
mok
ers ≥1
5 ye
ars
old,
by
last
bra
nd p
urch
ased
and
sel
ecte
d de
mog
raph
ic c
hara
cter
istic
s–G
ATS
Bang
lade
sh, 2
009.
Dem
ogra
phic
char
acte
rist
ics
Last
bid
ibra
nd p
urch
ased
Aki
j Bid
iA
ziz
Bidi
Loca
l Bid
i1A
nsar
Bid
iN
asir
Bid
i
Perc
enta
ge (9
5% C
I )
Ove
rall
29.1
(23.
6, 3
5.4)
10.8
(7.1
, 16.
0)10
.4(7
.4, 1
4.6)
4.8
(2.6
, 8.7
)4.
7(2
.5, 8
.4)
Gen
der
Mal
e29
.2(2
3.6,
35.
5)11
.2(7
.4, 1
6.6)
10.6
(7.4
, 14.
9)4.
7(2
.5, 8
.7)
4.6
(2.5
, 8.1
)
Fem
ale
27.9
(15.
3, 4
5.4)
*0.
06.
5(2
.3, 1
7.3)
*7.
3(1
.4, 2
9.9)
*7.
0(1
.3, 3
1.2)
*
Age
(yea
rs)
15-2
418
.7(8
.9, 3
5.1)
*6.
2(2
.3, 1
5.7)
*22
.3(8
.7, 4
6.2)
*2.
6(0
.6, 1
0.1)
*0.
7(0
.2, 3
.1)*
25-4
430
.3(2
4.0,
37.
5)9.
7(6
.2, 1
4.9)
9.2
(5.9
, 14.
2)4.
7(2
.3, 9
.4)*
6.4
(3.3
, 11.
8)
45-6
429
.1(2
2.3,
36.
9)13
.1(7
.8, 2
1.1)
10.0
(6.4
, 15.
3)5.
7(2
.7, 1
1.7)
*4.
2(1
.8, 9
.6)*
65+
34.4
(22.
4, 4
8.8)
12.0
(5.6
, 23.
8)*
6.0
(2.2
, 15.
6)*
4.2
(1.0
, 15.
2)*
1.9
(0.4
, 7.9
)*
Resi
denc
e
Urb
an35
.4(2
4.7,
47.
7)12
.7(4
.3, 3
2.2)
*7.
4(3
.7, 1
4.0)
*3.
5(1
.1, 1
0.6)
*3.
5(1
.1, 1
0.6)
*
Rura
l28
.4(2
2.5,
35.
3)10
.6(6
.7, 1
6.2)
10.8
(7.4
, 15.
4)4.
9(2
.6, 9
.3)
4.8
(2.5
, 9.0
)
Educ
atio
n le
vel
No
form
al e
duca
tion
28.0
(22.
1, 3
4.8)
10.3
(6.5
, 16.
0)8.
8(5
.9, 1
3.0)
4.1
(2.0
, 8.2
)*5.
3(2
.7, 1
0.2)
Less
than
pri
mar
y32
.0(2
3.5,
41.
8)8.
3(4
.3, 1
5.5)
*11
.4(6
.4, 1
9.5)
*8.
7(4
.1, 1
7.5)
*4.
5(1
.7, 1
1.5)
*
Prim
ary
39.9
(25.
6, 5
6.2)
*5.
4(1
.3, 1
9.6)
*4.
6(1
.8, 1
1.7)
*4.
4(1
.4, 1
3.2)
*2.
2(0
.5, 9
.4)*
Less
than
sec
onda
ry18
.6(1
0.6,
30.
5)*
18.6
(9.2
, 33.
9)*
22.7
(9.5
, 45.
1)*
3.4
(1.0
, 10.
6)*
2.3
(0.6
, 8.1
)*
Seco
ndar
y an
d ab
ove
45.0
(24.
2, 6
7.8)
*24
.1(9
.3, 4
9.7)
*14
.2(4
.8, 3
5.5)
*0.
04.
1(0
.6, 2
4.5)
*
Not
e: C
urre
nt b
idi s
mok
ers
incl
udes
dai
ly a
nd o
ccas
iona
l(les
s th
an d
aily
) use
. Th
e to
p fo
ur re
port
ed b
rand
s la
st p
urch
ased
am
ong
all b
idis
mok
ers
are
show
n he
re.
1Lo
cal b
idip
rodu
cts
incl
ude
prod
ucts
suc
h as
Gop
al, S
onal
i, H
alim
, May
a, K
arig
arh,
Ras
hid,
Man
moh
an e
tc.
* Es
timat
es b
ased
on
less
than
25
unw
eigh
ted
case
s .

102
GATS Bangladesh Report-2009Ta
ble
7.1A
(con
t.):
Per
cent
age
of c
urre
nt b
idis
mok
ers ≥1
5 ye
ars
old,
by
last
bra
nd p
urch
ased
and
sel
ecte
d de
mog
raph
ic c
hara
cter
istic
s–G
ATS
Bang
lade
sh, 2
009.
Dem
ogra
phic
char
acte
rist
ics
Last
bid
ibra
nd p
urch
ased
Aki
j Bid
iA
ziz
Bidi
Loca
l Bid
i1A
nsar
Bid
iN
asir
Bid
i
Perc
enta
ge (9
5% C
I )
Wea
lth in
dex
Low
est
28.3
(21.
5, 3
6.3)
9.1
(5.2
, 15.
5)7.
6(4
.9, 1
1.5)
5.6
(2.8
, 10.
8)*
4.0
(1.7
, 9.3
)*
Low
29.0
(21.
7, 3
7.5)
9.9
(5.9
, 16.
0)14
.4(8
.8, 2
2.6)
4.9
(2.3
, 10.
3)*
5.6
(2.7
, 11.
5)*
Mid
dle
26.1
(17.
7, 3
6.7)
11.4
(6.2
, 19.
9)*
9.9
(4.3
, 21.
5)*
6.2
(2.7
, 13.
6)*
4.7
(1.9
, 11.
2)*
Hig
h39
.6(2
8.6,
51.
7)15
.2(8
.2, 2
6.4)
*8.
0(3
.5, 1
7.0)
*0.
04.
2(1
.3, 1
2.7)
*
Hig
hest
20.5
(7.3
, 45.
8)*
21.9
(5.1
, 59.
4)*
11.5
(2.2
, 42.
7)*
0.0
0.0
Occ
upat
ion
Empl
oyed
21.3
(8.2
, 45.
0)*
21.4
(5.3
, 56.
8)*
10.6
(2.9
, 31.
6)*
10.1
(2.5
, 33.
4)*
0.0
Busi
ness
29.7
(19.
3, 4
2.8)
9.2
(4.2
, 18.
9)*
11.7
(5.8
, 22.
1)*
5.5
(2.0
, 14.
2)*
1.0
(0.1
, 6.8
)*
Farm
ers
29.0
(21.
1, 3
8.4)
10.5
(6.4
, 16.
6)10
.6(6
.5, 1
6.7)
4.3
(1.7
, 10.
6)*
4.2
(1.9
, 8.8
)*
Labo
urer
s28
.7(2
2.3,
36.
2)11
.7(7
.2, 1
8.2)
8.9
(5.3
, 14.
3)5.
0(2
.6, 9
.4)*
5.9
(2.8
, 11.
8)*
Stud
ent
0.0
0.0
0.0
0.0
0.0
Hom
emak
er25
.3(1
2.8,
44.
0)*
0.0
3.1
(0.4
, 19.
7)*
4.7
(0.6
, 27.
3)*
11.8
(2.2
, 44.
7)*
Une
mpl
oyed
37.7
(19.
4, 6
0.4)
*9.
1(2
.2, 3
1.4)
*25
.1(5
.9, 6
4.2)
*2.
9(0
.4, 1
8.9)
*3.
9(0
.8, 1
6.0)
*
Not
e: C
urre
nt b
idi s
mok
ers
incl
udes
dai
ly a
nd o
ccas
iona
l(les
s th
an d
aily
) use
. Th
e to
p fo
ur re
port
ed b
rand
s la
st p
urch
ased
am
ong
all b
idis
mok
ers
are
show
n he
re.
1Lo
cal b
idip
rodu
cts
incl
ude
prod
ucts
suc
h as
Gop
al, S
onal
i, H
alim
, May
a, K
arig
arh,
Ras
hid,
Man
moh
an e
tc.
* Es
timat
es b
ased
on
less
than
25
unw
eigh
ted
case
s .

7.3 Source of last purchase of cigarettes and bidis
Table 7.2 presents the most common source of last purchased of cigarettes among currentsmokers of manufactured cigarettes. The most common source from which the majority ofmanufactured cigarette smokers last bought their cigarettes was stores (98.7%), and this wassimilar across all the demographic characteristics such as gender, age group, residence, andwealth index. The other sources (1.3%) include wholesale shops/department stores, streetvendors, hawkers, flea markets, duty-free shops, outside the country, Internet, military stores,from another person and others.
Table 7.2A presents the most common source of last purchased bidis among currentbidi smokers. The most common source was stores (92.4%). About 22.5% women and 12.6%urban residents mentioned “other” as the source of last purchase. The other sources (7.6%)include wholesale shops/department stores, street vendors, hawkers, flea markets, duty-freeshops, outside the country, Internet, military stores, from another person and others.
103
GATS Bangladesh Report-2009
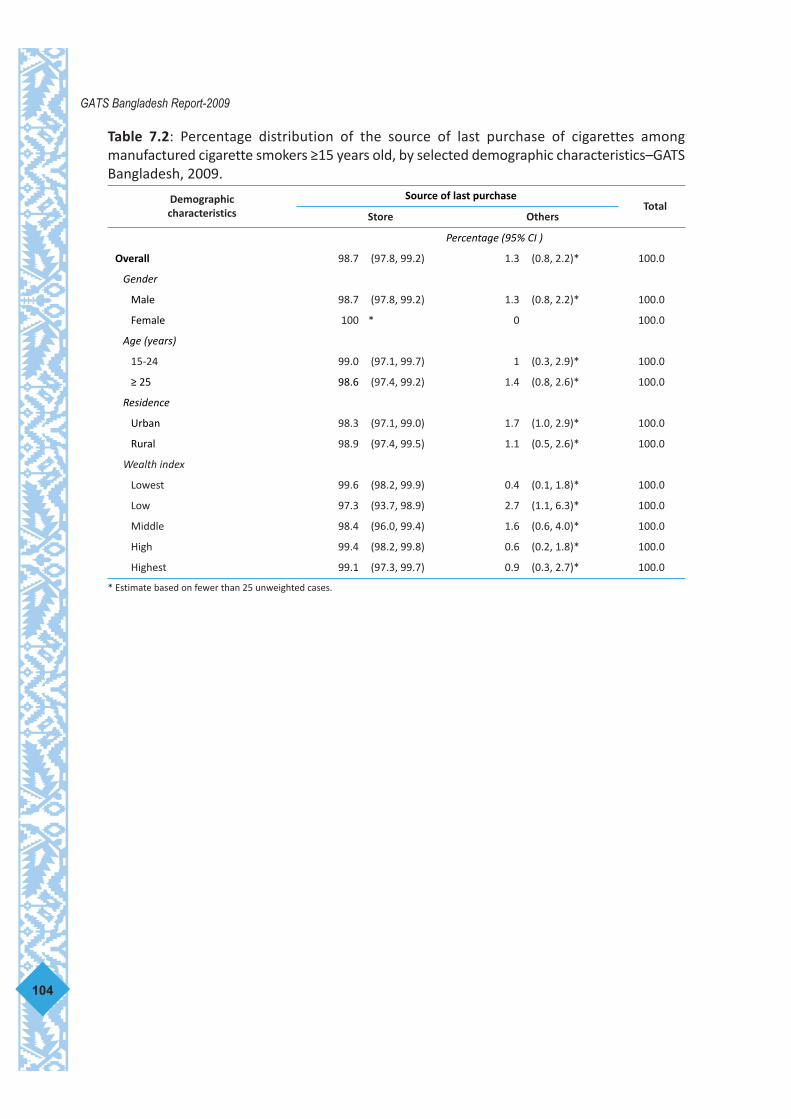
104
GATS Bangladesh Report-2009
Table 7.2: Percentage distribution of the source of last purchase of cigarettes amongmanufactured cigarette smokers ≥15 years old, by selected demographic characteristics–GATSBangladesh, 2009.
Demographiccharacteristics
Source of last purchaseTotal
Store Others
Percentage (95% CI )
Overall 98.7 (97.8, 99.2) 1.3 (0.8, 2.2)* 100.0
Gender
Male 98.7 (97.8, 99.2) 1.3 (0.8, 2.2)* 100.0
Female 100 * 0 100.0
Age (years)
15-24 99.0 (97.1, 99.7) 1 (0.3, 2.9)* 100.0
≥ 25 98.6 (97.4, 99.2) 1.4 (0.8, 2.6)* 100.0
Residence
Urban 98.3 (97.1, 99.0) 1.7 (1.0, 2.9)* 100.0
Rural 98.9 (97.4, 99.5) 1.1 (0.5, 2.6)* 100.0
Wealth index
Lowest 99.6 (98.2, 99.9) 0.4 (0.1, 1.8)* 100.0
Low 97.3 (93.7, 98.9) 2.7 (1.1, 6.3)* 100.0
Middle 98.4 (96.0, 99.4) 1.6 (0.6, 4.0)* 100.0
High 99.4 (98.2, 99.8) 0.6 (0.2, 1.8)* 100.0
Highest 99.1 (97.3, 99.7) 0.9 (0.3, 2.7)* 100.0
* Estimate based on fewer than 25 unweighted cases.
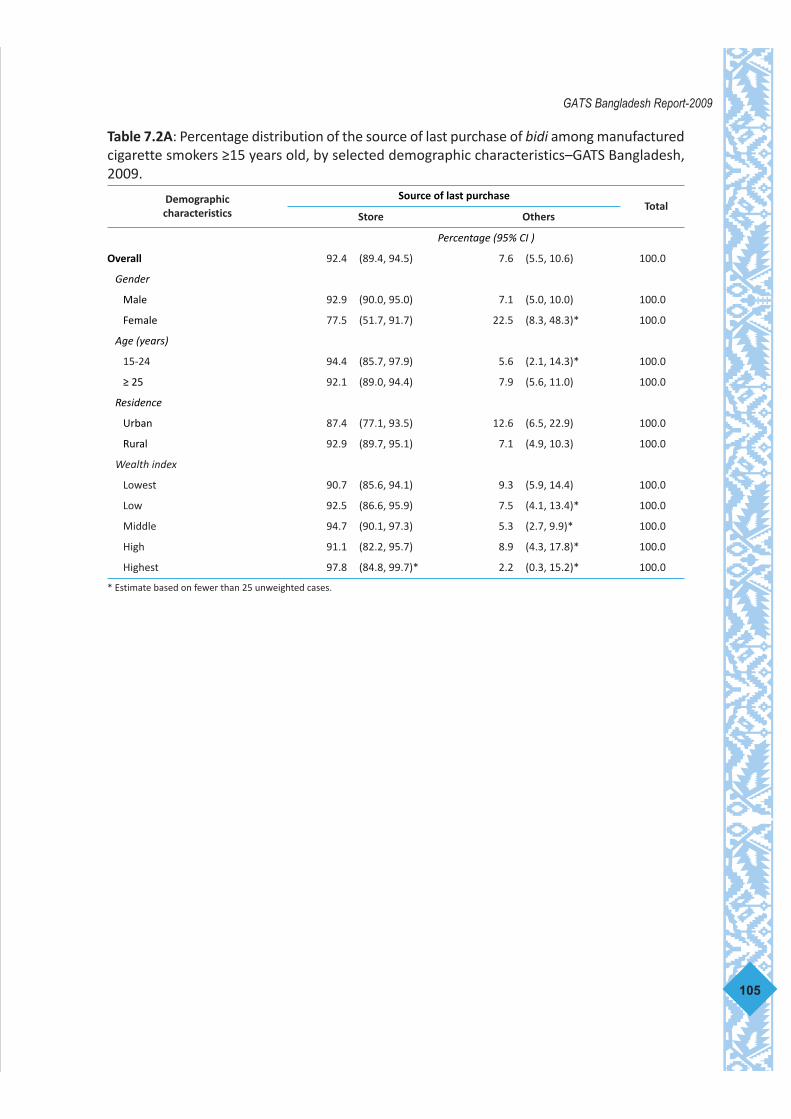
105
GATS Bangladesh Report-2009
Table 7.2A: Percentage distribution of the source of last purchase of bidi among manufacturedcigarette smokers ≥15 years old, by selected demographic characteristics–GATS Bangladesh,2009.
Demographiccharacteristics
Source of last purchaseTotal
Store Others
Percentage (95% CI )
Overall 92.4 (89.4, 94.5) 7.6 (5.5, 10.6) 100.0
Gender
Male 92.9 (90.0, 95.0) 7.1 (5.0, 10.0) 100.0
Female 77.5 (51.7, 91.7) 22.5 (8.3, 48.3)* 100.0
Age (years)
15-24 94.4 (85.7, 97.9) 5.6 (2.1, 14.3)* 100.0
≥ 25 92.1 (89.0, 94.4) 7.9 (5.6, 11.0) 100.0
Residence
Urban 87.4 (77.1, 93.5) 12.6 (6.5, 22.9) 100.0
Rural 92.9 (89.7, 95.1) 7.1 (4.9, 10.3) 100.0
Wealth index
Lowest 90.7 (85.6, 94.1) 9.3 (5.9, 14.4) 100.0
Low 92.5 (86.6, 95.9) 7.5 (4.1, 13.4)* 100.0
Middle 94.7 (90.1, 97.3) 5.3 (2.7, 9.9)* 100.0
High 91.1 (82.2, 95.7) 8.9 (4.3, 17.8)* 100.0
Highest 97.8 (84.8, 99.7)* 2.2 (0.3, 15.2)* 100.0
* Estimate based on fewer than 25 unweighted cases.

7.4 Expenditure on cigarettes and bidis
The information was collected from all current manufactured cigarette and bidi smokers onmoney spent for their last purchase. An average expenditure for both cigarettes and bidiamong manufactured cigarettes and bidi smokers in Bangladesh was calculated and ispresented individually in Table 7.3.
On average a current cigarette smoker spends 377.8 taka/month on manufacturedcigarettes whereas a current bidi smoker spends 130.5 taka/month. The highest-spending agegroup for manufactured cigarettes was smokers aged 25-44 years at 398.5 taka/month, whilefor bidi, the highest-spending age group was 15-24 years, at 227.6 taka/month. Urban cigarettesmokers spend 516.1 taka/month, which is 210 taka higher than the average amount spent byrural cigarette smokers. For bidi, urban smokers spend about 87.5 taka/month while ruralsmokers spend 135.2 taka/month.
Cigarettes smokers with a secondary education level or above spend the highest amount(465.3 taka/month) for purchasing cigarettes while bidi smokers with less than primaryeducation spend the highest amount (177.7 taka/month) for purchasing bidi. Cigarettesmokers in the highest wealth index category spend 610.6 taka/month while bidi smoker in themiddle category spend 205.4 taka/month. Among the occupational categories, smokers fromthe business category spend the highest amount (484.8 taka/month) on cigarettes, while bidismokers from the farmer category spend the highest amount (160.0 taka/month) on bidis.
Survey results also show that the average price per pack of manufactured cigarettes (of 20sticks) was 32.1 taka and the average price per pack of bidis (of 25 sticks) was 6.23 taka.
It is estimated that in Bangladesh total expenditure on cigarettes is 1.0% of gross domesticproduct (GDP) and on bidi is 0.4% of GDP. Calculating the average price of 100 packs ofmanufactured cigarettes (3210 taka) and factoring in the gross domestic product (GDP) as ofSeptember 2009 (6149.43 billion taka GDP equivalent to 64731 taka per capita based oncurrent population)37, it is estimated that price of 100 packs of manufactured cigarettes as apercentage of per capita GDP is 5%. For bidis, price of 100 packs as a percentage of per capitaGDP is 1%.
106
GATS Bangladesh Report-2009

Table 7.3: Average cigarette and bidi expenditures per month among manufactured cigarettesmokers and bidi smokers ≥15 years old, by selected demographic characteristics–GATSBangladesh, 2009.
107
GATS Bangladesh Report-2009
Demographiccharacteristics
Cigarette expenditureper month1 (Taka)
Bidi expenditure permonth2 (Taka)
Average (95% CI )
Overall 377.8 (348.2, 407.4) 130.5 (91.9, 169.0)Gender
Male 378.4 (348.8, 408.1) 131.1 (91.1, 171.0)Female 128.2 (55.2, 201.1)* 114.2 (25.1, 203.2)
Age (years)15-24 340.8 (264.1, 417.6) 227.6 (-60.5, 515.7)25-44 398.5 (361.4, 435.5) 124.4 (79.7, 169.2)45-64 385.8 (329.8, 441.8) 129.9 (71.6, 188.1)65+ 241.2 (175.6, 306.7) 61.7 (47.1, 76.4)
ResidenceUrban 516.1 (470.9, 561.2) 87.5 (72.7, 102.3)Rural 306.4 (270.9, 341.9) 135.2 (92.4, 178.0)
Education levelNo formal education 337.1 (284.6, 389.7) 124.9 (78.9, 170.9)Less than primary 357.6 (280.4, 434.8) 177.7 (29.2, 326.1)Primary 355.9 (299.8, 412.0) 122.3 (60.7, 183.9)Less than secondary 416.6 (358.6, 474.6) 96.3 (77.4, 115.1)Secondary and above 465.3 (380.2, 550.5) 76.3 (44.1, 108.6)*
Wealth indexLowest 330.1 (229.0, 431.1) 92.1 (81.5, 102.7)Low 292.9 (254.6, 331.2) 124.6 (62.5, 186.7)Middle 334.6 (292.5, 376.8) 205.4 (58.4, 352.4)High 390.7 (326.6, 454.9) 110.4 (69.9, 150.9)Highest 610.6 (526.0, 695.2) 93 (40.7, 145.3)*
OccupationEmployed 416.9 (353.3, 480.6) 70.4 (55.3, 85.5)*Business 484.8 (426.2, 543.4) 96.7 (79.8, 113.7)Farmers 278.1 (229.5, 326.7) 160.0 (73.8, 246.3)Labourers 363.1 (308.0, 418.2) 121.9 (73.7, 170.0)Student 417.4 (87.4, 747.4)* 0Homemaker 114.0 (-1.0, 229.0)* 93.2 (-7.6, 194.0)Unemployed 306.2 (227.2, 385.2) 84.9 (52.1, 117.7)
1 Among current manufactured cigarette smokers.2 Among current bidi smokers.* Estimate based on fewer than 25 unweighted cases.

A comprehensive ban on marketing and promotion is a powerful weapon against the tobaccoepidemic. To be effective, bans must be complete and apply to all marketing and promotionalcategories.5 It reduces the social desirability of smoking, in particular among young people. TheTobacco Control Act of Bangladesh has banned all forms of advertisement of tobacco products.However, advertisement at point of sale is allowed in a restricted form. Tobacco industriesare using various ways for direct and indirect advertisement. GYTS Bangladesh has shown that12.8% of students of age 13-15 years had seen an object with a cigarette or tobacco logo onit, while 10% of the students were offered free cigarettes by a tobacco companyrepresentative.38 Therefore, monitoring of implementaton of the ban is important. Variousnongovernmental organizations have been campaigning for tobacco control for the last twodecades by raising awareness both among the general public and policy-makers forenforcement of the ban. The Government has taken steps to remove visible signboards andbillboards with tobacco advertsements and formed local-level committees to facilitateenforcement of the Tobacco Control Act. The Act made it compulsory for the industry toprovide specific textual health warnings on packets of all smoking tobacco products; however,it applies to cigarette packets only. Six rotating warnings are to be used in six-monthlyrotations. Smokeless tobacco products are not covered by the Act.
Key findings:
• Half of adults noticed anti-smoking information in the media and publicplaces
• Half of current smokers noticed a health warning on cigarette packagesand 7 in 10 current cigarette smokers thought about quitting because ofthe health warning
• Half of adults noticed tobacco marketing activities
GATS in Bangladesh provides an opportunity to track tobacco control interventions,focusing on media awareness in both smokers and non-smokers. The data presented in thischapter relay information on perceptions by adults of anti-smoking information in variousmass media and public places, health warnings on different tobacco products and all forms ofcigarette advertising.
8.1. Anti-smoking information in various places
The percentages of adults ≥15 years who noticed anti-smoking information during the last 30days in various places are presented in Table 8.1. Overall, about 49.8% have noticed anti-smoking information in newspapers, magazines, television, radio, billboards, posters or otherlocations. The largest percentage noticed that information while watching television orlistening to radio programmes (40.5%). Other common sites were billboards (16.6%), posters(14.6%) and newspapers (9.1%). The lowest percentage was for people who noticed theinformation in magazines (2.3%). A larger percentage of men noticed anti-smoking information
108
GATS Bangladesh Report-2009
8. Media

than women (56.5% and 43.2%, respectively). In terms of age, people 15-24 years old noticedthat information more than 25 years or more age group (58.7% and 46.1%). For any location,urban people noticed anti-smoking information more than rural people (57.0% and 47.3%),and also for specific locations. However, rural people had more exposure to radio (12.2%)than urban people (8.7%). The higher the wealth index category the higher was the exposureto anti-smoking information.
Among current tobacco smokers, 51.1% have noticed anti-smoking information in somelocation. The largest percentage noticed information while watching television or listening toradio programmes (40.5%). Other common sites were billboards (17.8%), posters (17.0%),and newspapers (9.4%). A higher percentage of men (53.1%) noticed anti-smoking informationthan women (19.4%). Between the age groups, current smokers of 15-24 years noticed thatinformation more than other groups (59.1% versus 50.9%). Urban and rural current tobaccosmokers has almost similar exposure to anti-smoking information (56.8% and 50.6%,respectively). However, 15% of rural current smokers received information from radio, while8.8% of urban smokers received information that way. By wealth index category, exposure toanti-smoking information for current tobacco smokers was similar to that for all adult peopleaged 15 years and older.
Among non-smokers, 49.9% have noticed anti-smoking information in any of the locations.Similar to the figures for smokers, the largest percentage of non-smokers noticed informationwhile watching television or listening to radio programmes (39.9%). Other common sites werebillboards (16.2%), posters (14.0%) and newspapers (9.0%). The percentage of non-smokingmen and women exposed to anti-smoking information were 59.2% and 43.5%, respectively.Non-smokers 15-24 years old noticed that information more than the older age group (58.6% and 44.3%, respectively), while urban non-smokers noticed anti-smoking information morethan rural people (57.1% versus 46.2%). Non-smokers of higher wealth index noticed anti-smoking information more than the lower categories.
109
GATS Bangladesh Report-2009

110
GATS Bangladesh Report-2009Ta
ble
8.1:
Perc
enta
ge o
f adu
lts ≥
15 y
ears
old
, who
not
iced
ant
i-sm
okin
g in
form
atio
n1du
ring
the
last
30
days
in v
ario
us p
lace
s, b
ysm
okin
g st
atus
and
sel
ecte
d de
mog
raph
ic c
hara
cter
istic
s–G
ATS,
Ban
glad
esh
2009
.
Plac
esO
vera
llG
ende
rA
ge (y
ears
)Re
side
nce
Mal
eFe
mal
e15
-24
≥25
Urb
anRu
ral
Perc
enta
ge (9
5% C
I)
Ove
rall
In n
ewsp
aper
s9.
1(8
.2, 1
0.2)
13.9
(12.
3, 1
5.8)
4.4
(3.7
, 5.2
)11
.3(9
.4, 1
3.5)
8.2
(7.3
, 9.3
)13
.5(1
1.7,
15.
6)7.
6(6
.5, 8
.8)
In m
agaz
ines
2.3
(1.8
, 2.9
)3.
4(2
.6, 4
.5)
1.2
(0.7
, 1.8
)3.
2(2
.3, 4
.4)
1.9
(1.4
, 2.5
)3.
6(2
.7, 4
.7)
1.8
(1.3
, 2.6
)
On
tele
visi
on o
r ra
dio
40.5
(38.
5, 4
2.6)
45.1
(42.
3, 4
7.9)
36.0
(33.
7, 3
8.3)
48.3
(44.
7, 5
1.8)
37.3
(35.
3, 3
9.3)
45.4
(42.
8, 4
8.0)
38.8
(36.
2, 4
1.4)
On
tele
visi
on36
.6(3
4.5,
38.
8)41
.6(3
8.8,
44.
4)31
.7(2
9.3,
34.
1)44
.1(4
0.5,
47.
8)33
.5(3
1.4,
35.
6)43
.4(4
0.7,
46.
2)34
.2(3
1.5,
37.
0)
On
the
radi
o11
.0(9
.8, 1
2.2)
14.0
(12.
1, 1
6.2)
8.0
(6.7
, 9.4
)13
.0(1
0.9,
15.
4)10
.2(9
.0, 1
1.4)
7.6
(6.4
, 8.9
)12
.2(1
0.7,
13.
9)
On
billb
oard
s16
.6(1
5.0,
18.
2)20
.8(1
8.6,
23.
2)12
.3(1
0.7,
14.
2)20
.2(1
7.4,
23.
3)15
.0(1
3.6,
16.
6)20
.8(1
7.4,
24.
6)15
.1(1
3.3,
17.
0)
On
post
ers
14.6
(13.
2, 1
6.2)
20.7
(18.
4, 2
3.2)
8.7
(7.5
, 10.
1)18
.7(1
5.8,
22.
0)12
.9(1
1.7,
14.
3)17
.7(1
5.5,
20.
1)13
.6(1
1.8,
15.
6)
Som
ewhe
re e
lse
4.2
(3.5
, 5.1
)5.
1(4
.0, 6
.4)
3.4
(2.6
, 4.4
)5.
8(4
.3, 7
.7)
3.6
(2.9
, 4.4
)5.
3(4
.0, 6
.9)
3.9
(3.0
, 5.0
)
Any
loca
tion
49.8
(47.
6, 5
2.0)
56.5
(53.
6, 5
9.3)
43.2
(40.
7, 4
5.7)
58.7
(55.
0, 6
2.3)
46.1
(43.
9, 4
8.3)
57.0
(53.
7, 6
0.3)
47.3
(44.
5, 5
0.1)
Curr
ent
toba
cco
smok
ers2
In n
ewsp
aper
s9.
4(7
.8, 1
1.3)
9.7
(8.0
, 11.
6)1.
9(0
.4, 8
.1)*
10.0
(5.8
, 16.
6)9.
3(7
.7, 1
1.3)
13.8
(10.
8, 1
7.6)
8.0
(6.2
, 10.
3)
In m
agaz
ines
1.7
(1.1
, 2.5
)1.
7(1
.2, 2
.6)
0.0
2.4
(0.9
, 6.0
)*1.
5(1
.0, 2
.3)
2.7
(1.8
, 3.9
)1.
3(0
.7, 2
.5)*
On
tele
visi
on o
r ra
dio
42.7
(39.
2, 4
6.2)
43.6
(40.
1, 4
7.2)
14.9
(7.1
, 28.
6)*
51.3
(42.
6, 5
9.9)
41.1
(37.
6, 4
4.7)
43.8
(37.
4, 5
0.4)
42.3
(38.
2, 4
6.5)
On
tele
visi
on40
.1(3
6.6,
43.
7)41
.1(3
7.6,
44.
8)8.
6(3
.4, 2
0.1)
*48
.8(4
0.2,
57.
5)38
.5(3
5.0,
42.
1)42
.5(3
6.1,
49.
0)39
.3(3
5.2,
43.
6)
On
radi
o13
.6(1
1.2,
16.
4)13
.8(1
1.4,
16.
7)6.
4(1
.9, 1
9.6)
*19
.9(1
3.0,
29.
2)12
.4(1
0.3,
14.
9)8.
8(6
.5, 1
1.9)
15.1
(12.
1, 1
8.7)
On
billb
oard
s17
.8(1
5.4,
20.
4)18
.3(1
5.8,
21.
0)1.
6(0
.4, 6
.5)*
22.2
(15.
3, 3
1.2)
16.9
(14.
5, 1
9.6)
23.2
(18.
9, 2
8.1)
16.0
(13.
2, 1
9.3)
On
post
ers
17.0
(14.
8, 1
9.4)
17.5
(15.
3, 2
0.0)
0.7
(0.1
, 5.1
)*22
.6(1
5.7,
31.
4)15
.9(1
3.8,
18.
3)22
.6(1
8.9,
26.
7)15
.2(1
2.6,
18.
1)
Som
ewhe
re e
lse
3.9
(2.9
, 5.3
)4.
0(3
.0, 5
.4)
0.0
3.4
(1.6
, 7.4
)*4.
0(2
.9, 5
.5)
3.5
(2.2
, 5.7
)4.
0(2
.8, 5
.8)
Any
loca
tion
52.1
(48.
5, 5
5.7)
53.1
(49.
5, 5
6.7)
19.4
(10.
1, 3
4.0)
*59
.1(5
0.3,
67.
3)50
.9(4
7.2,
54.
5)56
.8(5
0.1,
63.
3)50
.6(4
6.3,
54.
9)1
Not
icin
g an
ti-sm
okin
g in
form
atio
n in
clud
es n
otic
ing
anti-
ciga
rett
e or
ant
i-bid
iinf
orm
atio
n.2
Incl
udes
dai
ly a
nd o
ccas
iona
l (le
ss th
an d
aily
) sm
oker
s.3
Incl
udes
form
er a
nd n
ever
sm
oker
s.*
Estim
ate
base
d on
few
er th
an 2
5 un
wei
ghte
d ca
ses.

111
GATS Bangladesh Report-2009Ta
ble
8.1
(con
t.):
Perc
enta
ge o
f adu
lts ≥
15 y
ears
old
, who
not
iced
ant
i-sm
okin
g in
form
atio
n1du
ring
the
last
30
days
in v
ario
us p
lace
s, b
ysm
okin
g st
atus
and
sel
ecte
d de
mog
raph
ic c
hara
cter
istic
s–G
ATS,
Ban
glad
esh
2009
.
Plac
esO
vera
llG
ende
rA
ge (y
ears
)Re
side
nce
Mal
eFe
mal
e15
-24
≥25
Urb
anRu
ral
Perc
enta
ge (9
5% C
I)
Non
-sm
oker
s3
In n
ewsp
aper
s9.
0(8
.0, 1
0.2)
17.4
(15.
0, 2
0.0)
4.4
(3.7
, 5.3
)11
.5(9
.6, 1
3.7)
7.8
(6.8
, 9.0
)13
.4(1
1.6,
15.
6)7.
4(6
.3, 8
.8)
In m
agaz
ines
2.5
(1.9
, 3.2
)4.
8(3
.6, 6
.5)
1.2
(0.7
, 1.9
)3.
3(2
.4, 4
.7)
2.0
(1.5
, 2.8
)3.
8(2
.9, 5
.1)
2.0
(1.3
, 3.0
)
On
tele
visi
on o
r ra
dio
39.9
(37.
7, 4
2.1)
46.3
(42.
8, 4
9.8)
36.3
(34.
0, 3
8.6)
47.8
(44.
2, 5
1.5)
35.8
(33.
7, 3
8.0)
45.8
(42.
8, 4
8.8)
37.7
(35.
0, 4
0.4)
On
tele
visi
on35
.6(3
3.4,
37.
8)42
.0(3
8.4,
45.
6)32
.0(2
9.7,
34.
5)43
.5(3
9.7,
47.
4)31
.5(2
9.4,
33.
8)43
.7(4
0.9,
46.
6)32
.6(2
9.8,
35.
5)
On
the
radi
o10
.2(9
.0, 1
1.5)
14.2
(12.
0, 1
6.7)
8.0
(6.7
, 9.4
)12
.0(1
0.0,
14.
4)9.
3(8
.1, 1
0.7)
7.2
(5.8
, 8.9
)11
.3(9
.8, 1
3.0)
On
billb
oard
s16
.2(1
4.6,
18.
0)22
.9(2
0.1,
26.
0)12
.5(1
0.9,
14.
3)19
.9(1
7.1,
23.
1)14
.3(1
2.8,
15.
9)20
.1(1
6.6,
24.
2)14
.8(1
2.9,
16.
8)
On
post
ers
14.0
(12.
4, 1
5.7)
23.2
(20.
0, 2
6.8)
8.8
(7.6
, 10.
2)18
.2(1
5.1,
21.
8)11
.8(1
0.5,
13.
3)16
.4(1
4.1,
19.
0)13
.1(1
1.1,
15.
3)
Som
ewhe
re e
lse
4.3
(3.5
, 5.3
)5.
9(4
.4, 7
.8)
3.5
(2.7
, 4.5
)6.
1(4
.5, 8
.3)
3.4
(2.7
, 4.4
)5.
7(4
.3, 7
.6)
3.8
(2.9
, 5.0
)
Any
loca
tion
49.1
(46.
8, 5
1.4)
59.2
(55.
5, 6
2.7)
43.5
(41.
0, 4
6.0)
58.6
(54.
7, 6
2.4)
44.3
(42.
0, 4
6.6)
57.1
(53.
9, 6
0.2)
46.2
(43.
3, 4
9.2)
1N
otic
ing
anti-
smok
ing
info
rmat
ion
incl
udes
not
icin
g an
ti-ci
gare
tte
or a
nti-b
idii
nfor
mat
ion.
2In
clud
es d
aily
and
occ
asio
nal (
less
than
dai
ly) s
mok
ers.
3In
clud
es fo
rmer
and
nev
er s
mok
ers.
* Es
timat
e ba
sed
on fe
wer
than
25
unw
eigh
ted
case
s.

112
GATS Bangladesh Report-2009Ta
ble
8.1
(Con
t.):
Per
cent
age
of a
dults
≥15
yea
rs o
ld, w
ho n
otic
ed a
nti-s
mok
ing
info
rmat
ion1
duri
ng th
e la
st 3
0 da
ys in
var
ious
pla
ces,
by
smok
ing
stat
us a
nd s
elec
ted
dem
ogra
phic
cha
ract
eris
tics–
GAT
S Ba
ngla
desh
, 200
9.
Plac
esW
ealt
h in
dex
Low
est
Low
Mid
dle
Hig
hH
ighe
st
Perc
enta
ge (9
5% C
I)
Ove
rall
In n
ewsp
aper
s2.
4(1
.5, 3
.7)
4.8
(3.7
, 6.3
)7.
5(5
.9, 9
.6)
12.2
(10.
1, 1
4.7)
21.9
(19.
0, 2
5.0)
In m
agaz
ines
0.3
(0.1
, 1.2
)*0.
8(0
.4, 1
.6)*
1.8
(1.1
, 2.9
)3.
0(2
.0, 4
.5)
6.6
(4.8
, 9.1
)
On
tele
visi
on o
r ra
dio
23.7
(20.
8, 2
7.0)
31.3
(28.
2, 3
4.5)
42.5
(39.
2, 4
5.9)
52.9
(49.
5, 5
6.2)
54.5
(50.
5, 5
8.4)
On
tele
visi
on19
.8(1
7.2,
22.
8)27
.1(2
4.2,
30.
2)36
.0(3
2.7,
39.
5)50
.2(4
6.5,
53.
8)52
.8(4
8.9,
56.
7)
On
the
radi
o8.
7(7
.0, 1
0.8)
10.5
(8.7
, 12.
5)15
.1(1
2.5,
18.
1)11
.7(9
.7, 1
4.1)
7.9
(6.1
, 10.
2)
On
billb
oard
s7.
2(5
.4, 9
.6)
11.3
(9.5
, 13.
4)16
.5(1
3.8,
19.
7)21
.2(1
8.2,
24.
7)29
.4(2
5.9,
33.
1)
On
post
ers
8.1
(6.2
, 10.
6)12
.2(9
.7, 1
5.1)
14.3
(11.
9, 1
6.9)
18.7
(16.
3, 2
1.3)
21.2
(18.
4, 2
4.3)
Som
ewhe
re e
lse
2.9
(2.0
, 4.2
)3.
8(2
.6, 5
.5)
4.3
(3.0
, 6.1
)4.
2(3
.0, 5
.8)
6.7
(4.6
, 9.6
)
Any
loca
tion
30.8
(27.
1, 3
4.7)
39.9
(36.
2, 4
3.7)
52.5
(48.
9, 5
6.1)
60.8
(57.
6, 6
3.9)
68.4
(65.
0, 7
1.6)
Curr
ent
toba
cco
smok
ers2
In n
ewsp
aper
s3.
3(1
.7, 6
.2)*
4.0
(2.7
, 5.9
)8.
4(5
.7, 1
2.2)
19.6
(14.
5, 2
6.1)
21.6
(16.
3, 2
8.1)
In m
agaz
ines
0.4
(0.1
, 1.3
)*0.
6(0
.2, 1
.4)*
1.0
(0.4
, 2.6
)*2.
4(1
.1, 5
.3)*
8.3
(4.9
, 13.
6)
On
tele
visi
on o
r ra
dio
27.8
(22.
5, 3
3.7)
41.7
(36.
4, 4
7.2)
43.3
(37.
0, 4
9.8)
56.6
(49.
9, 6
3.0)
52.9
(45.
1, 6
0.5)
On
tele
visi
on24
.4(1
9.4,
30.
1)39
.2(3
3.9,
44.
8)40
.7(3
4.4,
47.
3)54
.8(4
8.1,
61.
4)50
.1(4
2.4,
57.
7)
On
the
radi
o11
.5(8
.4, 1
5.4)
12.6
(9.3
, 16.
9)14
.9(1
0.3,
21.
1)17
.3(1
2.1,
24.
1)10
.8(6
.6, 1
7.2)
On
billb
oard
s7.
7(5
.1, 1
1.6)
13.0
(9.9
, 16.
9)19
.9(1
4.8,
26.
2)26
.3(2
0.6,
33.
0)34
.3(2
7.2,
42.
2)
On
post
ers
11.2
(8.0
, 15.
6)15
.1(1
1.5,
19.
7)16
.9(1
2.7,
22.
1)22
.9(1
7.6,
29.
2)24
.7(1
8.9,
31.
5)
Som
ewhe
re e
lse
3.2
(1.8
, 5.6
)*2.
9(1
.6, 5
.2)*
3.4
(1.9
, 6.0
)*5.
4(2
.8, 9
.9)*
6.5
(3.7
, 11.
2)*
Any
loca
tion
36.2
(29.
9, 4
3.0)
48.9
(43.
5, 5
4.4)
55.5
(48.
7, 6
2.0)
64.7
(58.
3, 7
0.5)
67.6
(60.
2, 7
4.2)
1N
otic
ing
anti-
smok
ing
info
rmat
ion
incl
udes
not
icin
g an
ti-ci
gare
tte
or a
nti-b
idii
nfor
mat
ion.
2In
clud
es d
aily
and
occ
asio
nal (
less
than
dai
ly) s
mok
ers.
3In
clud
es fo
rmer
and
nev
er s
mok
ers.
* Es
timat
e ba
sed
on fe
wer
than
25
unw
eigh
ted
case
s.

113
GATS Bangladesh Report-2009Ta
ble
8.1
(Con
t.):
Per
cent
age
of a
dults
≥15
yea
rs o
ld, w
ho n
otic
ed a
nti-s
mok
ing
info
rmat
ion1
duri
ng th
e la
st 3
0 da
ys in
var
ious
pla
ces,
by
smok
ing
stat
us a
nd s
elec
ted
dem
ogra
phic
cha
ract
eris
tics–
GAT
S Ba
ngla
desh
, 200
9.
Plac
esW
ealt
h in
dex
Low
est
Low
Mid
dle
Hig
hH
ighe
st
Perc
enta
ge (9
5% C
I)
Non
-sm
oker
s3
In n
ewsp
aper
s2.
0(1
.1, 3
.6)*
5.1
(3.7
, 7.0
)7.
3(5
.4, 9
.8)
10.3
(8.2
, 12.
8)21
.9(1
8.7,
25.
5)
In m
agaz
ines
0.3
(0.1
, 1.9
)*0.
9(0
.4, 2
.0)*
2.0
(1.2
, 3.4
)3.
2(2
.0, 5
.0)
6.4
(4.4
, 9.1
)
On
tele
visi
on o
r ra
dio
22.1
(18.
9, 2
5.6)
27.5
(24.
1, 3
1.2)
42.3
(38.
5, 4
6.2)
51.9
(48.
3, 5
5.5)
54.8
(50.
5, 5
8.9)
On
tele
visi
on18
.0(1
5.1,
21.
2)22
.7(1
9.6,
26.
2)34
.6(3
0.7,
38.
7)49
.0(4
5.1,
52.
9)53
.3(4
9.1,
57.
4)
On
the
radi
o7.
6(5
.7, 1
0.0)
9.7
(7.6
, 12.
3)15
.2(1
2.5,
18.
4)10
.3(8
.3, 1
2.7)
7.4
(5.6
, 9.9
)
On
billb
oard
s7.
0(5
.1, 9
.6)
10.7
(8.6
, 13.
3)15
.5(1
2.5,
19.
1)19
.9(1
6.8,
23.
4)28
.6(2
4.9,
32.
6)
On
post
ers
6.8
(4.8
, 9.5
)11
.1(8
.2, 1
4.8)
13.5
(11.
0, 1
6.5)
17.6
(15.
0, 2
0.5)
20.7
(17.
7, 2
4.0)
Som
ewhe
re e
lse
2.7
(1.7
, 4.3
)4.
1(2
.7, 6
.1)
4.5
(3.0
, 6.8
)3.
9(2
.6, 5
.7)
6.7
(4.5
, 10.
0)
Any
loca
tion
28.6
(24.
7, 3
2.8)
36.6
(32.
4, 4
1.1)
51.6
(47.
5, 5
5.7)
59.8
(56.
5, 6
3.1)
68.5
(64.
8, 7
2.0)
1N
otic
ing
anti-
smok
ing
info
rmat
ion
incl
udes
not
icin
g an
ti-ci
gare
tte
or a
nti-b
idii
nfor
mat
ion.
2In
clud
es d
aily
and
occ
asio
nal (
less
than
dai
ly) s
mok
ers.
3In
clud
es fo
rmer
and
nev
er s
mok
ers.
* Es
timat
e ba
sed
on fe
wer
than
25
unw
eigh
ted
case
s.

8.2 Noticing of health warning label on cigarette packages and thinking about quitting
Table 8.2 shows the percentage of current tobacco users ≥15 years old who noticed healthwarnings on cigarette packages and considered quitting because of the warning labels duringthe last 30 days by selected demographic characteristics. Among current tobacco smokers,51.6% noticed health warnings on cigarette packages and 74.4% of them thought aboutquitting smoking because of those health warnings. A higher percentage of males noticedhealth warnings on cigarette packages compared to females (75.3% and 28.1%); 63.6% ofsmokers in the 15-24 year age group and 50.4% in the 25-44 year age group noticed thosehealth warnings. Higher percentages of current tobacco smokers in younger age groups havenoticed health warnings on cigarette packages, but a higher percentage of older people hadthought of quitting because of the warning labels. With respect to residence, almost equalproportion of current tobacco smokers in urban and rural areas have noticed warnings oncigarette packages (54.6% and 50.6%, respectively) and thought about quitting smoking forthose warnings (74.1% and 74.5%). More than 50% of current tobacco users who had anylevel of education had noticed warnings on cigarette packages. However, only 32.8% of peoplewho had no formal education had noticed warnings on cigarette packages. A lower proportionof people from the lower wealth index category noticed health warnings on cigarettepackages. By occupation, the homemaker group had the lowest proportion for noticing ofhealth warning on cigarette packages.
114
GATS Bangladesh Report-2009

Table 8.2: Percentage of current tobacco users ≥15 years old who noticed health warnings oncigarette packages and considered quitting because of the warning labels during the last 30days, by selected demographic characteristics–GATS Bangladesh, 2009.
115
GATS Bangladesh Report-2009
Demographiccharacteristics
Current tobacco smokers1 who ...
Noticed health warnings on cigarettepackages2
Thought about quitting because ofwarning labels2
Percentage (95% CI) Percentage (95% CI)
Overall 51.6 (49.9, 53.3) 74.4 (70.8, 77.7)
Gender
Male 75.3 (73.1, 77.4) 74.5 (71.0, 77.8)
Female 28.1 (26.2, 30.0) 51.1 (13.6, 87.3)*
Age (years)
15-24 63.6 (60.4, 66.6) 68.5 (58.5, 77.1)
25-44 50.4 (48.1, 52.7) 74.7 (70.2, 78.8)
45-64 44.3 (41.3, 47.2) 77.4 (71.9, 82.1)
65+ 28.8 (24.3, 33.6) 76.5 (64.5, 85.4)
Residence
Urban 54.6 (52.2, 56.9) 74.1 (69.1, 78.5)
Rural 50.6 (48.4, 52.7) 74.5 (69.8, 78.7)
Education level
No formal education 32.8 (30.5, 35.3) 76.1 (70.9, 80.6)
Less than primary 51.9 (48.1, 55.7) 73.9 (67.1, 79.7)
Primary 54.8 (50.7, 58.9) 73.1 (62.9, 81.4)
Less than secondary 69.2 (66.2, 72.0) 74 (66.0, 80.7)
Secondary and above 69.1 (65.3, 72.7) 71.5 (61.5, 79.8)
Wealth index
Lowest 37.4 (34.0, 41.0) 71.5 (64.2, 77.9)
Low 48.8 (45.7, 52.0) 71.4 (64.7, 77.3)
Middle 55.4 (52.2, 58.7) 77.1 (69.0, 83.7)
High 58.1 (55.2, 61.0) 79.9 (73.6, 84.9)
Highest 58.5 (54.7, 62.1) 69.3 (61.3, 76.3)
Occupation
Employed 71.2 (67.2, 75.0) 79.1 (68.1, 87.1)
Business 85.5 (82.4, 88.2) 79.6 (73.5, 84.5)
Farmers 68.3 (63.6, 72.7) 80.8 (74.3, 85.9)
Labourers 62.8 (59.6, 65.9) 68.2 (62.1, 73.7)
Student 74.1 (68.4, 79.1) 56.3 (33.3, 76.9)*
Homemaker 25.6 (23.5, 27.8) 85.8 (58.5, 96.3)*
Unemployed 47.6 (40.6, 54.7) 63.4 (44.1, 79.2)
1 Includes daily and occasional (less than daily) smokers.2 During the last 30 days.* Estimate based on fewer than 25 unweighted cases.

8.3 Tobacco marketing in various public places
8.3.1. Noticing of cigarette marketing in various public places
Table 8.3 shows the distribution of adults aged 15 years and above who noticed cigarette marketingin public places and media, such as in stores where cigarettes are sold, on television, radio, billboards,posters, newspapers or magazines, Internet and cinemas, as well as cigarette promotion by methodssuch as free samples, sale price , coupons and free gifts, in last 30 days. The percentage of peopleaged 15 years or above who noticed some cigarette advertisement, sponsorship and promotion was48.7%. The most common site for noticing cigarette advertisements was in a store (33.2%). Other siteswere posters (14.1%), public transportation (8.4%), public walls (6.5%), billboards (6.1%), television(5.4%), cinemas (3.1), newspapers (1.8%) and radio (1.2%). The most common type of promotionnoticed was free gifts/discounts on other products (10.4%). Other promotion activities noticed werefree sample (6.9%), coupons (5.7%) and clothing items with a brand name or logo (4.8%). A higherpercentage of males (68.0%) noticed some advertisement or promotion compared with females(29.3%). A higher percentage of younger people (55.4%) noticed some advertisement or promotionthan the older age group (45.9%). No urban-rural difference or differences among the wealth indexcategories were observed.
The distribution of current tobacco smokers who noticed cigarette marketing in public places andmedia in the last 30 days is presented in Table 8.3A. The percentage of current tobacco smokers whonoticed some cigarette advertisement, sponsorship or promotion was 66.6%; the most common sitewas in stores (49.3%). Other sites were posters (23.2%), public transportation (12.1%), billboards(9.0%), public walls (8.7%), television (5.7%), cinemas (4.1), newspapers (1.9%) and radio (1.0%). Themost common type of promotion noticed was free gifts/discounts on other products (10.4%). Otherpromotion activities noticed were free samples (13.5%), coupons (7.9%) and clothing items with abrand name or logo (6.8%). Higher percentages of males (67.6%) noticed some advertisement orpromotion than females (36.7%). No gender, urban-rural wealth index category differences wereobserved.
The distribution of current non-smokers aged 15 years or above who noticed cigarette marketingin public places and media in last 30 days by demographic characteristics are presented in Table 8.3B.The percentage of current non-smokers who noticed some cigarette advertisement, sponsorship andpromotion was 43.3%. The most common site for noticing cigarette advertisements was in stores(28.4%). Other sites were posters (11.4%), public transportation (7.3%), public walls (5.9%), billboards(5.2%), television (5.3%), cinemas (2.8), newspapers (1.7%) and radio (1.2%). The most common typeof promotion noticed was free gifts/discounts on other product (8.8%). Other promotional activitiesnoticed were coupons (5.1%), free sample (4.9%) and clothing items with brand name or logo (4.2%).Higher percentages of males (68.0%) noticed some advertisement or promotion than females (29.1%).A higher percentage of the younger population noticed advertisements or promotions than olderpopulations (53.5% and 38.0%, respectively). No urban-rural difference or differences among thewealth index categories were observed.
116
GATS Bangladesh Report-2009
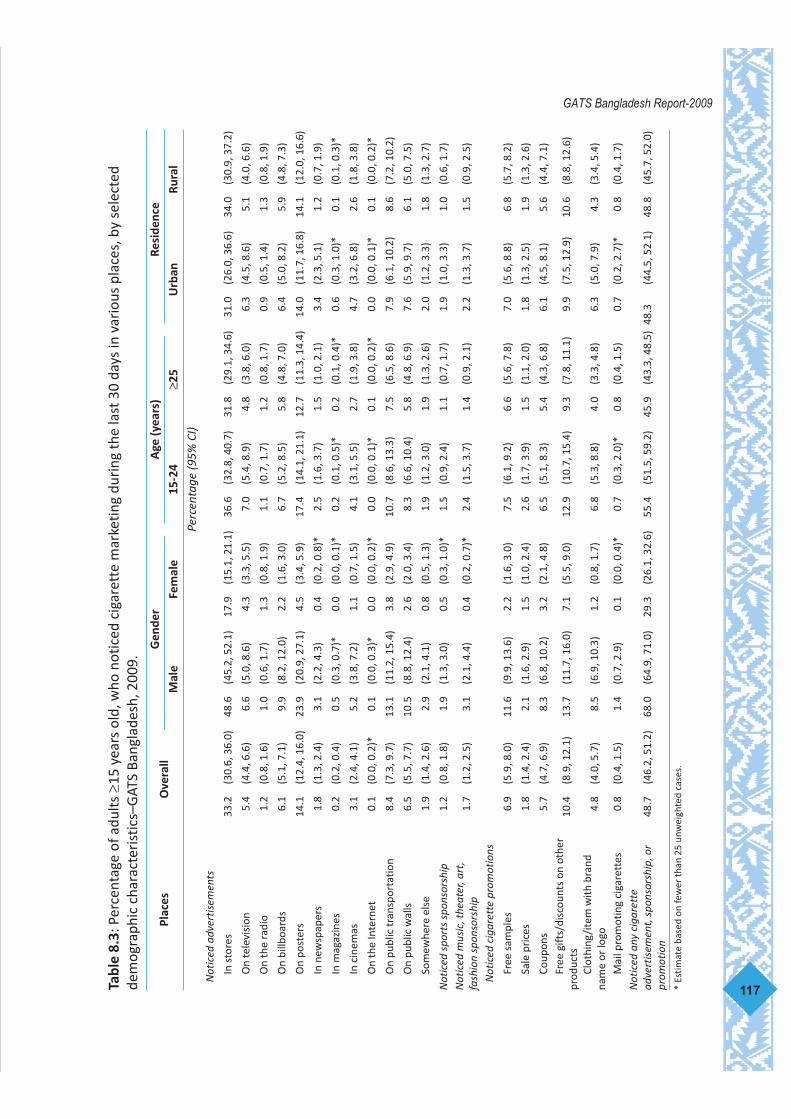
117
GATS Bangladesh Report-2009Ta
ble
8.3:
Per
cent
age
of a
dults
≥15
yea
rs o
ld, w
ho n
otic
ed c
igar
ette
mar
ketin
g du
ring
the
last
30
days
in v
ario
us p
lace
s, b
y se
lect
edde
mog
raph
ic c
hara
cter
istic
s–G
ATS
Bang
lade
sh, 2
009.
Plac
esO
vera
llG
ende
rA
ge (y
ears
)Re
side
nce
Mal
eFe
mal
e15
-24
≥25
Urb
anRu
ral
Perc
enta
ge (9
5% C
I)N
otic
ed a
dver
tisem
ents
In s
tore
s33
.2(3
0.6,
36.
0)48
.6(4
5.2,
52.
1)17
.9(1
5.1,
21.
1)36
.6(3
2.8,
40.
7)31
.8(2
9.1,
34.
6)31
.0(2
6.0,
36.
6)34
.0(3
0.9,
37.
2)
On
tele
visi
on5.
4(4
.4, 6
.6)
6.6
(5.0
, 8.6
)4.
3(3
.3, 5
.5)
7.0
(5.4
, 8.9
)4.
8(3
.8, 6
.0)
6.3
(4.5
, 8.6
)5.
1(4
.0, 6
.6)
On
the
radi
o1.
2(0
.8, 1
.6)
1.0
(0.6
, 1.7
)1.
3(0
.8, 1
.9)
1.1
(0.7
, 1.7
)1.
2(0
.8, 1
.7)
0.9
(0.5
, 1.4
)1.
3(0
.8, 1
.9)
On
billb
oard
s6.
1(5
.1, 7
.1)
9.9
(8.2
, 12.
0)2.
2(1
.6, 3
.0)
6.7
(5.2
, 8.5
)5.
8(4
.8, 7
.0)
6.4
(5.0
, 8.2
)5.
9(4
.8, 7
.3)
On
post
ers
14.1
(12.
4, 1
6.0)
23.9
(20.
9, 2
7.1)
4.5
(3.4
, 5.9
)17
.4(1
4.1,
21.
1)12
.7(1
1.3,
14.
4)14
.0(1
1.7,
16.
8)14
.1(1
2.0,
16.
6)
In n
ewsp
aper
s1.
8(1
.3, 2
.4)
3.1
(2.2
, 4.3
)0.
4(0
.2, 0
.8)*
2.5
(1.6
, 3.7
)1.
5(1
.0, 2
.1)
3.4
(2.3
, 5.1
)1.
2(0
.7, 1
.9)
In m
agaz
ines
0.2
(0.2
, 0.4
)0.
5(0
.3, 0
.7)*
0.0
(0.0
, 0.1
)*0.
2(0
.1, 0
.5)*
0.2
(0.1
, 0.4
)*0.
6(0
.3, 1
.0)*
0.1
(0.1
, 0.3
)*
In c
inem
as3.
1(2
.4, 4
.1)
5.2
(3.8
, 7.2
)1.
1(0
.7, 1
.5)
4.1
(3.1
, 5.5
)2.
7(1
.9, 3
.8)
4.7
(3.2
, 6.8
)2.
6(1
.8, 3
.8)
On
the
Inte
rnet
0.1
(0.0
, 0.2
)*0.
1(0
.0, 0
.3)*
0.0
(0.0
, 0.2
)*0.
0(0
.0, 0
.1)*
0.1
(0.0
, 0.2
)*0.
0(0
.0, 0
.1)*
0.1
(0.0
, 0.2
)*
On
publ
ic tr
ansp
orta
tion
8.4
(7.3
, 9.7
)13
.1(1
1.2,
15.
4)3.
8(2
.9, 4
.9)
10.7
(8.6
, 13.
3)7.
5(6
.5, 8
.6)
7.9
(6.1
, 10.
2)8.
6(7
.2, 1
0.2)
On
publ
ic w
alls
6.5
(5.5
, 7.7
)10
.5(8
.8, 1
2.4)
2.6
(2.0
, 3.4
)8.
3(6
.6, 1
0.4)
5.8
(4.8
, 6.9
)7.
6(5
.9, 9
.7)
6.1
(5.0
, 7.5
)
Som
ewhe
re e
lse
1.9
(1.4
, 2.6
)2.
9(2
.1, 4
.1)
0.8
(0.5
, 1.3
)1.
9(1
.2, 3
.0)
1.9
(1.3
, 2.6
)2.
0(1
.2, 3
.3)
1.8
(1.3
, 2.7
)
Not
iced
spo
rts
spon
sors
hip
1.2
(0.8
, 1.8
)1.
9(1
.3, 3
.0)
0.5
(0.3
, 1.0
)*1.
5(0
.9, 2
.4)
1.1
(0.7
, 1.7
)1.
9(1
.0, 3
.3)
1.0
(0.6
, 1.7
)N
otic
ed m
usic
, the
ater
, art
,fa
shio
n sp
onso
rshi
p1.
7(1
.2, 2
.5)
3.1
(2.1
, 4.4
)0.
4(0
.2, 0
.7)*
2.4
(1.5
, 3.7
)1.
4(0
.9, 2
.1)
2.2
(1.3
, 3.7
)1.
5(0
.9, 2
.5)
Not
iced
cig
aret
te p
rom
otio
ns
Free
sam
ples
6.9
(5.9
, 8.0
)11
.6(9
.9, 1
3.6)
2.2
(1.6
, 3.0
)7.
5(6
.1, 9
.2)
6.6
(5.6
, 7.8
)7.
0(5
.6, 8
.8)
6.8
(5.7
, 8.2
)
Sale
pri
ces
1.8
(1.4
, 2.4
)2.
1(1
.6, 2
.9)
1.5
(1.0
, 2.4
)2.
6(1
.7, 3
.9)
1.5
(1.1
, 2.0
)1.
8(1
.3, 2
.5)
1.9
(1.3
, 2.6
)
Coup
ons
5.7
(4.7
, 6.9
)8.
3(6
.8, 1
0.2)
3.2
(2.1
, 4.8
)6.
5(5
.1, 8
.3)
5.4
(4.3
, 6.8
)6.
1(4
.5, 8
.1)
5.6
(4.4
, 7.1
)Fr
ee g
ifts/
disc
ount
s on
oth
erpr
oduc
ts10
.4(8
.9, 1
2.1)
13.7
(11.
7, 1
6.0)
7.1
(5.5
, 9.0
)12
.9(1
0.7,
15.
4)9.
3(7
.8, 1
1.1)
9.9
(7.5
, 12.
9)10
.6(8
.8, 1
2.6)
Clot
hing
/ite
m w
ith b
rand
nam
e or
logo
4.8
(4.0
, 5.7
)8.
5(6
.9, 1
0.3)
1.2
(0.8
, 1.7
)6.
8(5
.3, 8
.8)
4.0
(3.3
, 4.8
)6.
3(5
.0, 7
.9)
4.3
(3.4
, 5.4
)
Mai
l pro
mot
ing
ciga
rett
es0.
8(0
.4, 1
.5)
1.4
(0.7
, 2.9
)0.
1(0
.0, 0
.4)*
0.7
(0.3
, 2.0
)*0.
8(0
.4, 1
.5)
0.7
(0.2
, 2.7
)*0.
8(0
.4, 1
.7)
Not
iced
any
cig
aret
tead
vert
isem
ent,
spo
nsor
ship
, or
prom
otio
n48
.7(4
6.2,
51.
2)68
.0(6
4.9,
71.
0)29
.3(2
6.1,
32.
6)55
.4(5
1.5,
59.
2)45
.9(4
3.3,
48.
5)48
.3(4
4.5,
52.
1)48
.8(4
5.7,
52.
0)
* Es
timat
e ba
sed
on fe
wer
than
25
unw
eigh
ted
case
s.

118
GATS Bangladesh Report-2009Ta
ble
8.3
(Con
t.):
Perc
enta
ge o
f adu
lts ≥
15 y
ears
old
, who
not
iced
cig
aret
te m
arke
ting
durin
g th
e la
st 3
0 da
ys in
var
ious
pla
ces,
by
sele
cted
dem
ogra
phic
char
acte
rist
ics–
GAT
S Ba
ngla
desh
, 200
9.Pl
aces
Wea
lth
inde
xLo
wes
tLo
wM
iddl
eH
igh
Hig
hest
Perc
enta
ge (9
5% C
I)N
otic
ed a
dver
tisem
ents
In s
tore
s30
.4(2
6.3,
35.
0)35
.0(3
1.5,
38.
6)36
.3(3
2.4,
40.
3)33
.7(2
9.2,
38.
4)29
.1(2
5.2,
33.
5)
On
tele
visi
on3.
7(2
.5, 5
.7)
5.8
(4.2
, 8.0
)4.
4(3
.2, 6
.0)
6.2
(4.5
, 8.4
)7.
3(5
.3, 9
.9)
On
the
radi
o1.
0(0
.5, 2
.0)*
1.2
(0.6
, 2.2
)*1.
2(0
.7, 2
.1)*
1.5
(0.9
, 2.6
)*0.
6(0
.3, 1
.3)*
On
billb
oard
s4.
4(2
.8, 6
.7)
5.0
(3.7
, 6.6
)5.
8(4
.4, 7
.7)
7.7
(5.9
, 9.9
)7.
9(6
.0, 1
0.2)
On
post
ers
11.6
(9.1
, 14.
6)14
.6(1
1.9,
17.
9)15
.2(1
2.5,
18.
4)15
.0(1
2.4,
18.
1)13
.6(1
0.9,
16.
7)
In n
ewsp
aper
s0.
6(0
.2, 1
.5)*
1.6
(0.8
, 3.1
)1.
3(0
.7, 2
.3)*
1.7
(1.0
, 2.7
)4.
4(2
.7, 7
.0)
In m
agaz
ines
0.0
(0.0
, 0.1
)*0.
4(0
.1, 0
.9)*
0.1
(0.0
, 0.6
)*0.
2(0
.1, 0
.5)*
0.6
(0.3
, 1.2
)*
In c
inem
as2.
8(1
.7, 4
.7)
4.5
(3.0
, 6.6
)2.
3(1
.5, 3
.4)
2.7
(1.8
, 4.0
)3.
2(1
.9, 5
.5)
On
the
Inte
rnet
0.0
0.1
(0.0
, 0.6
)*0.
1(0
.0, 0
.7)*
0.1
(0.0
, 0.4
)*0.
1(0
.0, 0
.2)*
On
publ
ic tr
ansp
orta
tion
4.8
(3.6
, 6.4
)9.
0(7
.1, 1
1.3)
9.1
(7.1
, 11.
6)9.
3(7
.4, 1
1.7)
9.9
(7.7
, 12.
7)
On
publ
ic w
alls
3.3
(2.3
, 4.8
)5.
2(4
.0, 6
.8)
7.1
(5.3
, 9.4
)8.
0(6
.2, 1
0.3)
9.5
(7.3
, 12.
2)
Som
ewhe
re e
lse
2.1
(1.2
, 3.5
)2.
4(1
.5, 3
.7)
1.5
(0.9
, 2.6
)*1.
2(0
.7, 2
.0)*
2.5
(1.4
, 4.5
)
Not
iced
spo
rts
spon
sors
hip
0.5
(0.2
, 1.3
)*1.
6(0
.8, 3
.0)*
1.0
(0.4
, 2.4
)*0.
8(0
.4, 1
.4)*
2.6
(1.3
, 5.0
)N
otic
ed m
usic
, the
ater
, art
, fas
hion
spon
sors
hip
1.4
(0.7
, 2.7
)*2.
2(1
.3, 4
.0)
1.3
(0.6
, 2.6
)*0.
9(0
.5, 1
.8)*
2.9
(1.6
, 5.1
)
Not
iced
cig
aret
te p
rom
otio
ns
Free
sam
ples
6.6
(5.0
, 8.6
)5.
4(4
.2, 7
.1)
8.1
(6.2
, 10.
5)8.
4(6
.6, 1
0.6)
5.5
(4.0
, 7.4
)
Sale
pri
ces
1.5
(0.9
, 2.5
)1.
3(0
.8, 2
.1)
2.2
(1.4
, 3.6
)2.
2(1
.4, 3
.4)
2.0
(1.2
, 3.2
)
Coup
ons
3.9
(2.7
, 5.6
)6.
1(4
.5, 8
.2)
6.2
(4.7
, 8.2
)6.
9(5
.0, 9
.5)
5.0
(3.4
, 7.2
)Fr
ee g
ifts/
disc
ount
s on
oth
erpr
oduc
ts9.
9(7
.5, 1
3.0)
9.0
(7.2
, 11.
2)11
.3(8
.9, 1
4.2)
12.9
(10.
0, 1
6.5)
8.2
(6.3
, 10.
5)
Clot
hing
/ite
m w
ith b
rand
nam
eor
logo
2.9
(2.0
, 4.3
)3.
4(2
.3, 4
.9)
5.5
(4.1
, 7.3
)7.
2(5
.1, 1
0.0)
5.0
(3.6
, 6.8
)
Mai
l pro
mot
ing
ciga
rett
es0.
1(0
.0, 0
.4)*
0.4
(0.1
, 1.3
)*1.
2(0
.5, 2
.6)*
1.3
(0.5
, 3.6
)*0.
8(0
.2, 3
.0)*
Not
iced
any
cig
aret
te a
dver
tisem
ent,
spon
sors
hip,
or p
rom
otio
n42
.6(3
8.3,
47.
0)49
.0(4
5.5,
52.
5)50
.5(4
6.7,
54.
2)51
.6(4
7.7,
55.
5)49
.0(4
4.4,
53.
5)
* Es
timat
e ba
sed
on fe
wer
than
25
unw
eigh
ted
case
s.

119
GATS Bangladesh Report-2009Ta
ble
8.3A
: Per
cent
age
of c
urre
nt to
bacc
o sm
oker
s ≥1
5 ye
ars
old,
who
not
iced
cig
aret
te m
arke
ting
duri
ng th
e la
st 3
0 da
ys in
var
ious
pla
ces,
by
sele
cted
dem
ogra
phic
cha
ract
eris
tics–
GAT
S Ba
ngla
desh
, 200
9.
Plac
esO
vera
llG
ende
rA
ge (y
ears
)Re
side
nce
Mal
eFe
mal
e15
-24
≥25
Urb
anRu
ral
Perc
enta
ge (9
5% C
I)N
otic
ed a
dver
tisem
ents
In s
tore
s49
.3(4
5.5,
53.
2)50
.0(4
6.1,
54.
0)28
.9(1
5.9,
46.
6)*
51.2
(42.
0, 6
0.4)
49.0
(45.
2, 5
2.9)
47.8
(41.
3, 5
4.3)
49.9
(45.
2, 5
4.5)
On
tele
visi
on5.
7(4
.1, 7
.8)
5.8
(4.2
, 8.0
)0.
9(0
.2, 4
.3)*
5.6
(2.5
, 12.
0)*
5.7
(4.0
, 8.0
)7.
2(4
.7, 1
0.9)
5.2
(3.4
, 7.9
)
On
the
radi
o1.
0(0
.5, 2
.1)*
1.0
(0.5
, 2.0
)*3.
1(0
.4, 1
9.2)
*1.
3(0
.4, 4
.0)*
1.0
(0.4
, 2.2
)*0.
7(0
.3, 1
.6)*
1.1
(0.5
, 2.6
)*
On
billb
oard
s9.
0(7
.1, 1
1.4)
9.2
(7.3
, 11.
4)5.
5(0
.8, 3
0.2)
*8.
9(5
.5, 1
4.1)
*9.
1(7
.1, 1
1.5)
9.9
(7.2
, 13.
4)8.
8(6
.5, 1
1.7)
On
post
ers
23.2
(20.
1, 2
6.5)
23.6
(20.
5, 2
7.0)
10.6
(3.3
, 29.
1)*
28.7
(21.
4, 3
7.4)
22.2
(19.
1, 2
5.5)
23.6
(19.
7, 2
7.9)
23.1
(19.
3, 2
7.3)
In n
ewsp
aper
s1.
9(1
.2, 3
.1)
2.0
(1.2
, 3.2
)0.
01.
8(0
.8, 4
.0)*
1.9
(1.1
, 3.3
)4.
1(2
.2, 7
.5)
1.2
(0.6
, 2.5
)*
In m
agaz
ines
0.3
(0.2
, 0.7
)*0.
3(0
.2, 0
.7)*
0.0
0.1
(0.0
, 0.6
)*0.
4(0
.2, 0
.8)*
0.9
(0.4
, 2.1
)*0.
1(0
.0, 0
.6)*
In c
inem
as4.
1(2
.8, 6
.1)
4.2
(2.9
, 6.3
)0.
03.
9(2
.0, 7
.4)*
4.1
(2.7
, 6.4
)6.
3(3
.9, 9
.9)
3.4
(1.9
, 6.0
)
On
the
Inte
rnet
0.0
(0.0
, 0.1
)*0.
0(0
.0, 0
.1)*
0.0
0.1
(0.0
, 0.6
)*0.
00.
0(0
.0, 0
.4)*
0.0
On
publ
ic tr
ansp
orta
tion
12.1
(10.
1, 1
4.5)
12.5
(10.
4, 1
4.9)
1.4
(0.2
, 9.0
)*13
.2(8
.6, 1
9.8)
11.9
(9.9
, 14.
4)11
.3(8
.3, 1
5.1)
12.4
(10.
0, 1
5.3)
On
publ
ic w
alls
8.7
(7.1
, 10.
6)8.
9(7
.3, 1
0.9)
1.9
(0.5
, 7.4
)*11
.2(7
.3, 1
6.6)
8.2
(6.6
, 10.
1)13
.1(9
.8, 1
7.3)
7.2
(5.5
, 9.5
)
Som
ewhe
re e
lse
2.2
(1.5
, 3.3
)2.
3(1
.5, 3
.4)
0.0
1.2
(0.4
, 3.7
)*2.
4(1
.6, 3
.7)
2.4
(1.4
, 4.3
)*2.
1(1
.3, 3
.6)
Not
iced
spo
rts
spon
sors
hip
1.5
(0.9
, 2.5
)1.
5(0
.9, 2
.6)
1.3
(0.2
, 8.2
)*1.
4(0
.4, 5
.0)*
1.5
(0.9
, 2.6
)2.
9(1
.5, 5
.3)*
1.1
(0.5
, 2.4
)*N
otic
ed m
usic
, the
ater
, art
,fa
shio
n sp
onso
rshi
p2.
0(1
.2, 3
.1)
2.0
(1.3
, 3.2
)0.
02.
5(0
.9, 6
.7)*
1.9
(1.2
, 2.9
)3.
0(1
.5, 6
.0)*
1.6
(0.9
, 2.9
)*
Not
iced
cig
aret
te p
rom
otio
ns
Free
sam
ples
13.5
(11.
1, 1
6.2)
13.8
(11.
4, 1
6.6)
3.3
(1.1
, 9.5
)*15
.8(1
0.3,
23.
6)13
.0(1
0.6,
15.
9)14
.2(1
1.0,
18.
1)13
.2(1
0.4,
16.
7)
Sale
pri
ces
2.6
(1.7
, 4.0
)2.
7(1
.8, 4
.1)
1.3
(0.2
, 7.9
)*3.
4(1
.4, 8
.0)*
2.5
(1.6
, 4.0
)2.
7(1
.6, 4
.7)
2.6
(1.5
, 4.4
)
Coup
ons
7.9
(6.3
, 9.8
)8.
1(6
.5, 1
0.0)
1.2
(0.2
, 8.1
)*9.
0(5
.4, 1
4.7)
*7.
6(6
.0, 9
.8)
7.8
(5.7
, 10.
6)7.
9(6
.0, 1
0.3)
Free
gift
s/di
scou
nts
onot
her
prod
ucts
15.8
(13.
1, 1
9.1)
16.1
(13.
4, 1
9.3)
7.7
(1.9
, 26.
7)*
19.4
(13.
3, 2
7.4)
15.2
(12.
3, 1
8.7)
18.3
(13.
3, 2
4.5)
15.1
(11.
9, 1
8.9)
Clot
hing
/ite
m w
ith b
rand
nam
e or
logo
6.8
(5.3
, 8.7
)7.
0(5
.5, 8
.9)
1.3
(0.2
, 8.1
)*12
.0(7
.1, 1
9.5)
5.9
(4.6
, 7.5
)9.
1(6
.8, 1
2.0)
6.1
(4.3
, 8.5
)
Mai
l pro
mot
ing
ciga
rett
es0.
8(0
.3, 2
.0)*
0.7
(0.3
, 2.1
)*1.
9(0
.3, 9
.3)*
2.1
(0.6
, 7.5
)*0.
5(0
.2, 1
.2)*
0.3
(0.1
, 0.6
)*0.
9(0
.3, 2
.6)*
Not
iced
any
cig
aret
tead
vert
isem
ent,
spo
nsor
ship
,or
pro
mot
ion
66.6
(62.
8, 7
0.2)
67.6
(63.
8, 7
1.2)
36.7
(23.
0, 5
2.9)
68.9
(59.
4, 7
7.0)
66.2
(62.
4, 6
9.8)
68.0
(63.
3, 7
2.3)
66.2
(61.
4, 7
0.7)
Not
e: C
urre
nt to
bacc
o sm
oker
s in
clud
e m
anuf
actu
red,
han
d-ro
lled
ciga
rett
e sm
oker
s an
d bi
dism
oker
s.*
Estim
ate
base
d on
few
er th
an 2
5 un
wei
ghte
d ca
ses.

120
GATS Bangladesh Report-2009Ta
ble
8.3A
(Con
t.):
Perc
enta
ge o
f cur
rent
toba
cco
smok
ers ≥1
5 ye
ars
old,
who
not
iced
cig
aret
te m
arke
ting
duri
ng th
e la
st 3
0 da
ys in
var
ious
pla
ces,
by
sele
cted
dem
ogra
phic
cha
ract
eris
tics–
GAT
S Ba
ngla
desh
, 200
9.
Plac
esW
ealt
h in
dex
Low
est
Low
Mid
dle
Hig
hH
ighe
st
Perc
enta
ge (9
5% C
I)N
otic
ed a
dver
tisem
ents
In s
tore
s42
.6(3
5.8,
49.
6)53
.1(4
7.4,
58.
8)49
.9(4
2.3,
57.
5)51
.5(4
4.1,
58.
8)50
.2(4
1.9,
58.
4)
On
tele
visi
on4.
5(2
.5, 7
.7)*
8.2
(5.1
, 12.
8)3.
4(1
.4, 7
.9)*
5.6
(2.8
, 11.
0)*
7.1
(3.9
, 12.
4)*
On
the
radi
o1.
0(0
.3, 2
.9)*
1.1
(0.4
, 2.9
)*0.
4(0
.1, 1
.3)*
1.8
(0.6
, 5.7
)*0.
8(0
.2, 2
.6)*
On
billb
oard
s8.
9(5
.1, 1
5.1)
6.4
(4.3
, 9.4
)7.
4(4
.9, 1
1.1)
13.4
(9.4
, 18.
9)11
.2(7
.5, 1
6.4)
On
post
ers
19.5
(14.
1, 2
6.3)
23.7
(19.
0, 2
9.3)
24.8
(19.
1, 3
1.5)
24.5
(19.
1, 3
0.9)
24.7
(18.
6, 3
1.9)
In n
ewsp
aper
s1.
3(0
.4, 4
.8)*
1.2
(0.5
, 2.8
)*1.
4(0
.6, 3
.3)*
2.7
(1.1
, 6.5
)*4.
9(2
.4, 9
.6)*
In m
agaz
ines
0.1
(0.0
, 0.4
)*0.
3(0
.1, 1
.0)*
0.3
(0.0
, 2.3
)*0.
1(0
.0, 0
.6)*
1.9
(0.7
, 5.1
)*
In c
inem
as3.
5(1
.8, 6
.7)*
7.0
(4.1
, 11.
6)2.
7(1
.3, 5
.2)*
2.6
(1.1
, 5.8
)*4.
1(1
.8, 8
.9)*
On
the
Inte
rnet
0.0
0.0
0.0
0.0
0.1
(0.0
, 1.0
)*
On
publ
ic tr
ansp
orta
tion
7.3
(4.9
, 10.
7)13
.4(1
0.1,
17.
4)12
.3(8
.8, 1
6.8)
15.5
(11.
3, 2
1.0)
13.5
(9.4
, 18.
9)
On
publ
ic w
alls
5.4
(3.3
, 8.7
)8.
4(6
.0, 1
1.6)
8.0
(5.5
, 11.
4)10
.5(7
.4, 1
4.6)
15.8
(11.
3, 2
1.6)
Som
ewhe
re e
lse
1.5
(0.7
, 3.1
)*3.
4(2
.0, 5
.8)*
1.9
(0.8
, 4.4
)*1.
3(0
.5, 3
.4)*
3.4
(1.5
, 7.8
)*
Not
iced
spo
rts
spon
sors
hip
0.7
(0.3
, 1.9
)*2.
2(0
.9, 5
.1)*
0.9
(0.3
, 3.2
)*1.
0(0
.4, 2
.5)*
4.2
(1.8
, 9.5
)*N
otic
ed m
usic
, the
ater
, art
, fas
hion
spon
sors
hip
1.4
(0.6
, 3.6
)*3.
1(1
.6, 6
.0)*
1.1
(0.3
, 3.5
)*0.
8(0
.3, 2
.3)*
4.5
(1.8
, 10.
5)*
Not
iced
cig
aret
te p
rom
otio
ns
Free
sam
ples
12.1
(8.7
, 16.
7)9.
8(7
.0, 1
3.6)
16.8
(11.
8, 2
3.3)
17.0
(12.
3, 2
3.0)
12.0
(8.1
, 17.
3)
Sale
pri
ces
1.9
(0.9
, 3.6
)*2.
7(1
.5, 4
.6)*
5.0
(2.3
, 10.
3)*
1.5
(0.6
, 3.3
)*1.
8(0
.8, 4
.0)*
Coup
ons
5.5
(3.4
, 9.0
)10
.1(6
.9, 1
4.7)
9.8
(6.6
, 14.
5)5.
7(3
.6, 8
.8)
7.6
(4.5
, 12.
4)
Free
gift
s/di
scou
nts
on o
ther
pro
duct
s16
.3(1
0.9,
23.
7)11
.3(8
.2, 1
5.4)
20.6
(15.
2, 2
7.2)
18.7
(13.
2, 2
5.8)
10.7
(6.9
, 16.
1)
Clot
hing
/ite
m w
ith b
rand
nam
e or
logo
3.9
(2.3
, 6.6
)*6.
1(4
.1, 9
.1)
6.5
(4.0
, 10.
6)10
.5(7
.1, 1
5.2)
9.0
(5.9
, 13.
5)
Mai
l pro
mot
ing
ciga
rett
es0.
0(0
.0, 0
.2)*
0.6
(0.2
, 1.8
)*1.
3(0
.5, 3
.5)*
1.3
(0.3
, 6.0
)*1.
2(0
.3, 4
.9)*
Not
iced
any
cig
aret
te a
dver
tisem
ent,
spon
sors
hip,
or p
rom
otio
n60
.2(5
4.2,
65.
9)70
.7(6
5.4,
75.
5)65
.0(5
6.8,
72.
4)70
.5(6
3.6,
76.
6)66
.5(5
8.4,
73.
8)
Not
e: C
urre
nt to
bacc
o sm
oker
s in
clud
e m
anuf
actu
red,
han
d-ro
lled
ciga
rett
e sm
oker
s an
d bi
dism
oker
s.*
Estim
ate
base
d on
few
er th
an 2
5 un
wei
ghte
d ca
ses.

121
GATS Bangladesh Report-2009Ta
ble
8.3B
: Per
cent
age
of c
urre
nt n
on-s
mok
ers ≥1
5 ye
ars
old,
who
not
iced
cig
aret
te m
arke
ting
duri
ng th
e la
st 3
0 da
ys in
var
ious
pla
ces,
by s
elec
ted
dem
ogra
phic
cha
ract
eris
tics–
GAT
S Ba
ngla
desh
, 200
9.
Plac
esO
vera
llG
ende
rA
ge (y
ears
)Re
side
nce
Mal
eFe
mal
e15
-24
≥25
Urb
anRu
ral
Perc
enta
ge (9
5% C
I)
Not
iced
adv
ertis
emen
ts
In s
tore
s28
.4(2
5.6,
31.
3)47
.5(4
3.6,
51.
4)17
.7(1
4.9,
20.
9)34
.6(3
0.7,
38.
8)25
.2(2
2.5,
28.
2)26
.5(2
1.5,
32.
1)29
.1(2
5.9,
32.
5)
On
tele
visi
on5.
3(4
.3, 6
.6)
7.2
(5.2
, 9.9
)4.
3(3
.4, 5
.5)
7.1
(5.5
, 9.3
)4.
4(3
.5, 5
.6)
6.0
(4.3
, 8.4
)5.
1(3
.9, 6
.7)
On
the
radi
o1.
2(0
.8, 1
.7)
1.1
(0.6
, 1.9
)*1.
2(0
.8, 1
.9)
1.1
(0.7
, 1.7
)1.
2(0
.8, 1
.9)
0.9
(0.5
, 1.5
)1.
3(0
.8, 2
.0)
On
billb
oard
s5.
2(4
.3, 6
.2)
10.6
(8.5
, 13.
1)2.
1(1
.5, 3
.0)
6.4
(4.9
, 8.2
)4.
6(3
.7, 5
.6)
5.5
(4.1
, 7.2
)5.
1(4
.0, 6
.3)
On
post
ers
11.4
(9.7
, 13.
4)24
.1(2
0.4,
28.
1)4.
4(3
.3, 5
.7)
15.8
(12.
5, 1
9.8)
9.2
(7.8
, 10.
7)11
.5(9
.2, 1
4.3)
11.4
(9.3
, 13.
9)
In n
ewsp
aper
s1.
7(1
.2, 2
.4)
4.0
(2.8
, 5.7
)0.
4(0
.2, 0
.8)*
2.6
(1.7
, 3.9
)1.
3(0
.9, 1
.9)
3.3
(2.1
, 5.0
)1.
2(0
.7, 1
.9)
In m
agaz
ines
0.2
(0.1
, 0.4
)*0.
5(0
.3, 1
.0)*
0.0
(0.0
, 0.1
)*0.
3(0
.1, 0
.6)*
0.2
(0.1
, 0.5
)*0.
5(0
.2, 0
.9)*
0.1
(0.0
, 0.4
)*
In c
inem
as2.
8(2
.2, 3
.7)
6.0
(4.3
, 8.4
)1.
1(0
.7, 1
.6)
4.2
(3.0
, 5.7
)2.
2(1
.5, 3
.1)
4.3
(2.9
, 6.2
)2.
3(1
.6, 3
.4)
On
the
Inte
rnet
0.1
(0.0
, 0.2
)*0.
2(0
.0, 0
.5)*
0.0
(0.0
, 0.2
)*0.
0(0
.0, 0
.1)*
0.1
(0.0
, 0.3
)*0.
0(0
.0, 0
.1)*
0.1
(0.0
, 0.3
)*
On
publ
ic tr
ansp
orta
tion
7.3
(6.2
, 8.7
)13
.7(1
1.3,
16.
5)3.
8(2
.9, 4
.9)
10.4
(8.1
, 13.
2)5.
8(4
.8, 6
.9)
7.0
(5.2
, 9.3
)7.
4(6
.1, 9
.1)
On
publ
ic w
alls
5.9
(4.9
, 7.0
)11
.7(9
.6, 1
4.3)
2.6
(2.0
, 3.5
)7.
9(6
.1, 1
0.2)
4.8
(3.9
, 5.9
)6.
1(4
.7, 8
.0)
5.8
(4.6
, 7.3
)
Som
ewhe
re e
lse
1.8
(1.3
, 2.5
)3.
5(2
.4, 5
.1)
0.9
(0.5
, 1.4
)2.
0(1
.3, 3
.2)
1.7
(1.1
, 2.5
)1.
9(1
.1, 3
.2)
1.8
(1.2
, 2.6
)
Not
iced
spo
rts
spon
sors
hip
1.1
(0.7
, 1.8
)2.
3(1
.4, 3
.8)
0.5
(0.3
, 1.0
)*1.
5(0
.9, 2
.5)
1.0
(0.6
, 1.6
)1.
6(0
.8, 3
.2)
1.0
(0.5
, 1.7
)*N
otic
ed m
usic
, the
ater
, art
, fas
hion
spon
sors
hip
1.6
(1.1
, 2.4
)3.
9(2
.6, 5
.8)
0.4
(0.2
, 0.7
)*2.
4(1
.5, 3
.8)
1.2
(0.8
, 1.9
)1.
9(1
.1, 3
.5)
1.5
(0.9
, 2.5
)
Not
iced
cig
aret
te p
rom
otio
ns
Free
sam
ples
4.9
(4.1
, 5.9
)9.
8(8
.0, 1
2.0)
2.2
(1.6
, 3.0
)6.
3(5
.0, 8
.1)
4.2
(3.4
, 5.2
)5.
1(3
.9, 6
.7)
4.8
(3.8
, 6.1
)
Sale
pri
ces
1.6
(1.2
, 2.2
)1.
7(1
.1, 2
.6)
1.5
(1.0
, 2.4
)2.
5(1
.6, 3
.9)
1.1
(0.8
, 1.6
)1.
5(1
.0, 2
.3)
1.6
(1.1
, 2.5
)
Coup
ons
5.1
(4.0
, 6.5
)8.
5(6
.2, 1
1.5)
3.2
(2.1
, 4.9
)6.
2(4
.7, 8
.1)
4.5
(3.3
, 6.2
)5.
6(3
.7, 8
.4)
4.9
(3.6
, 6.6
)
Free
gift
s/di
scou
nts o
n ot
her p
rodu
cts
8.8
(7.3
, 10.
4)11
.8(9
.6, 1
4.4)
7.1
(5.5
, 9.0
)12
.0(9
.8, 1
4.5)
7.1
(5.8
, 8.7
)7.
6(5
.8, 1
0.1)
9.2
(7.4
, 11.
3)
Clot
hing
/item
with
bra
nd n
ame
or lo
go4.
2(3
.4, 5
.2)
9.7
(7.5
, 12.
4)1.
2(0
.8, 1
.7)
6.1
(4.7
, 8.0
)3.
3(2
.6, 4
.2)
5.5
(3.9
, 7.7
)3.
8(2
.9, 4
.8)
Mai
l pro
mot
ing
ciga
rett
es0.
8(0
.4, 1
.5)
2.0
(1.0
, 4.1
)0.
1(0
.0, 0
.3)*
0.5
(0.2
, 1.5
)*0.
9(0
.4, 1
.8)
0.9
(0.2
, 3.5
)*0.
7(0
.3, 1
.6)*
Not
iced
any
cig
aret
te a
dver
tisem
ent,
spon
sors
hip,
or p
rom
otio
n43
.3(4
0.6,
46.
0)68
.3(6
4.8,
71.
6)29
.1(2
6.0,
32.
5)53
.5(4
9.6,
57.
4)38
.0(3
5.3,
40.
8)42
.9(3
8.8,
47.
1)43
.4(4
0.2,
46.
7)
* Es
timat
e ba
sed
on fe
wer
than
25
unw
eigh
ted
case
s.

122
GATS Bangladesh Report-2009Ta
ble
8.3B
(Co
nt.)
:Per
cent
age
of c
urre
nt n
on-s
mok
ers ≥1
5 ye
ars
old,
who
not
iced
cig
aret
te m
arke
ting
duri
ng t
he la
st 3
0 da
ys in
var
ious
pla
ces,
by
sele
cted
dem
ogra
phic
cha
ract
eris
tics–
GAT
S Ba
ngla
desh
, 200
9.
Plac
esW
ealt
h in
dex
Low
est
Low
Mid
dle
Hig
hH
ighe
st
Perc
enta
ge (9
5% C
I)
Not
iced
adv
ertis
emen
ts
In s
tore
s25
.4(2
1.0,
30.
4)28
.5(2
4.8,
32.
5)32
.2(2
8.0,
36.
7)29
.1(2
4.7,
33.
8)25
.8(2
1.8,
30.
3)
On
tele
visi
on3.
5(2
.1, 5
.5)
4.9
(3.4
, 7.1
)4.
7(3
.3, 6
.6)
6.3
(4.5
, 8.7
)7.
3(5
.2, 1
0.2)
On
the
radi
o1.
0(0
.4, 2
.5)*
1.2
(0.6
, 2.6
)*1.
5(0
.8, 2
.6)*
1.5
(0.8
, 2.5
)*0.
6(0
.2, 1
.4)*
On
billb
oard
s2.
5(1
.5, 4
.1)
4.5
(3.1
, 6.3
)5.
3(3
.7, 7
.5)
6.2
(4.5
, 8.4
)7.
4(5
.5, 9
.8)
On
post
ers
8.3
(6.1
, 11.
3)11
.4(8
.6, 1
5.0)
12.4
(9.5
, 16.
0)12
.6(1
0.0,
15.
7)11
.8(9
.2, 1
5.0)
In n
ewsp
aper
s0.
3(0
.1, 0
.9)*
1.7
(0.8
, 3.4
)*1.
2(0
.6, 2
.5)*
1.4
(0.8
, 2.4
)4.
3(2
.5, 7
.1)
In m
agaz
ines
0.0
0.4
(0.1
, 1.2
)*0.
00.
3(0
.1, 0
.7)*
0.4
(0.2
, 1.0
)*
In c
inem
as2.
6(1
.5, 4
.4)
3.6
(2.3
, 5.6
)2.
2(1
.4, 3
.5)
2.7
(1.8
, 4.2
)3.
1(1
.7, 5
.6)
On
the
Inte
rnet
0.0
0.1
(0.0
, 0.8
)*0.
1(0
.0, 0
.9)*
0.1
(0.0
, 0.5
)*0.
0(0
.0, 0
.2)*
On
publ
ic tr
ansp
orta
tion
3.8
(2.6
, 5.4
)7.
4(5
.5, 9
.9)
8.2
(5.9
, 11.
2)7.
7(5
.8, 1
0.1)
9.3
(7.1
, 12.
2)
On
publ
ic w
alls
2.5
(1.5
, 4.1
)4.
1(2
.8, 5
.9)
6.8
(4.7
, 9.8
)7.
4(5
.6, 9
.7)
8.5
(6.2
, 11.
5)
Som
ewhe
re e
lse
2.3
(1.2
, 4.2
)*2.
0(1
.1, 3
.4)*
1.4
(0.7
, 2.8
)*1.
2(0
.6, 2
.1)*
2.4
(1.3
, 4.5
)
Not
iced
spo
rts
spon
sors
hip
0.5
(0.1
, 1.8
)*1.
3(0
.6, 3
.1)*
1.0
(0.4
, 2.5
)*0.
7(0
.4, 1
.5)*
2.3
(1.0
, 5.0
)
Not
iced
mus
ic, t
heat
er, a
rt, f
ashi
on s
pons
orsh
ip1.
4(0
.6, 2
.9)*
1.9
(1.0
, 3.9
)*1.
4(0
.7, 2
.6)*
1.0
(0.5
, 1.9
)*2.
6(1
.4, 5
.0)
Not
iced
cig
aret
te p
rom
otio
ns
Free
sam
ples
4.3
(3.0
, 6.1
)3.
9(2
.7, 5
.5)
5.5
(3.9
, 7.7
)6.
2(4
.6, 8
.4)
4.4
(3.0
, 6.5
)
Sale
pri
ces
1.4
(0.7
, 2.6
)*0.
8(0
.4, 1
.8)*
1.4
(0.8
, 2.5
)*2.
4(1
.5, 3
.8)
2.0
(1.2
, 3.4
)
Coup
ons
3.3
(2.2
, 4.9
)4.
7(3
.2, 6
.8)
5.1
(3.5
, 7.5
)7.
2(4
.9, 1
0.4)
4.5
(2.9
, 7.1
)
Free
gift
s/di
scou
nts
on o
ther
pro
duct
s7.
2(5
.4, 9
.5)
8.2
(6.1
, 10.
9)8.
4(6
.0, 1
1.8)
11.4
(8.6
, 15.
1)7.
8(5
.8, 1
0.4)
Clot
hing
/ite
m w
ith b
rand
nam
e or
logo
2.6
(1.5
, 4.3
)2.
4(1
.3, 4
.3)
5.2
(3.6
, 7.3
)6.
3(4
.0, 9
.7)
4.3
(3.0
, 6.3
)
Mai
l pro
mot
ing
ciga
rett
es0.
1(0
.0, 0
.6)*
0.3
(0.1
, 1.1
)*1.
2(0
.5, 2
.8)*
1.3
(0.4
, 4.1
)*0.
7(0
.2, 2
.8)*
Not
iced
any
cig
aret
te a
dver
tisem
ent,
spon
sors
hip,
or p
rom
otio
n35
.3(3
0.6,
40.
4)41
.2(3
7.3,
45.
1)46
.0(4
1.7,
50.
4)46
.7(4
2.4,
51.
0)46
.1(4
1.3,
51.
0)
* Es
timat
e ba
sed
on fe
wer
than
25
unw
eigh
ted
case
s.

8.3.2. Noticing of bidi marketing in various public places
The distribution of adults aged 15 years or above who noticed bidi marketing in public placesand media in the last 30 days by demographic characteristics is presented in Table 8.3C. Thepercentage of people who noticed some bidi advertisement, sponsorship or promotion was84.0%. The most common site for noticing such advertisements was in stores (23.1%). Othercommon sites were posters (11.6%), cinemas (6.0%), public transportation (5.9%), billboards(5.9%), television (5.8%), public walls (5.2%), newspapers (3.4%) and radio (2.4%). The mostcommon type of promotion noticed was free gifts/discounts on other products (10.4%). Otherpromotional activities noticed were clothing items with a brand name or logo (4.0%), freesamples (2.9%), free gifts/discounts on other products (2.7%) and coupons (2.2%). Almostsimilar percentages of males and females noticed some advertisement or promotion of bidi(85.9% and 80.1%). A higher percentage of rural people (86.7%) noticed some advertisementor promotion than urban people (75.5%). A highest percentage of attention to bidi marketingactivity was noted in the lowest wealth index category (92.7%) while the lowest was in thehighest wealth index category (68.8%)
The distribution of current tobacco smokers aged 15 years or above who noticed bidimarketing in public places and media in the last 30 days are presented in Table 8.3D. Thepercentage of tobacco users who noticed some bidi advertisements, sponsorship or promotionwas 87.3%. The most common site for noticing bidi advertisements was in stores (27.2%).Other sites were posters (16.3%), cinemas (8.1%), public transportation (8.0%), billboards(7.6%), public walls (6.6%), television (6.1%), newspapers (3.2%) and radio (2.0%). The mostcommon type of promotion noticed was a clothing item with a brand name or logo (5.9%).Other promotional activities noticed were free samples (5.1%) and free gifts/discounts onother products (3.7%). A higher percentage of rural people (90.5%) had noticed someadvertisement or promotion than urban people (77.1%). The highest percentage of bidimarketing activity noticed was in the lowest wealth index category (94.2%) while the lowestwas in the highest wealth index category (67.0%)
The distribution of current non-smokers who noticed bidi marketing in public places andmedia in last 30 days is presented in Table 8.3E. The percentage of non-smokers who noticedsome bidi advertisement, sponsorship or promotion was 82.7%. The most common site fornoticing bidi advertising was in stores (21.6%). Other sites were posters (9.9%), television(5.8%), cinemas (5.3), public transportation (5.2%), billboards (5.2%), public walls (4.7%),newspapers (3.4%) and radio (2.5%). The most common type of promotion noticed wasclothing items with a brand name or logo (3.4%). Other promotional activities noticed werefree gifts/discounts on other products (2.4%) and free samples (2.2%). A higher percentage ofrural people (85.2%) had noticed some advertisement or promotion than urban people(74.8%). For non-smokers as well, the highest percentage of bidi marketing activity noticed wasin the lowest wealth index category (91.8%) while the lowest was in the highest wealth indexcategory (69.2%).
123
GATS Bangladesh Report-2009
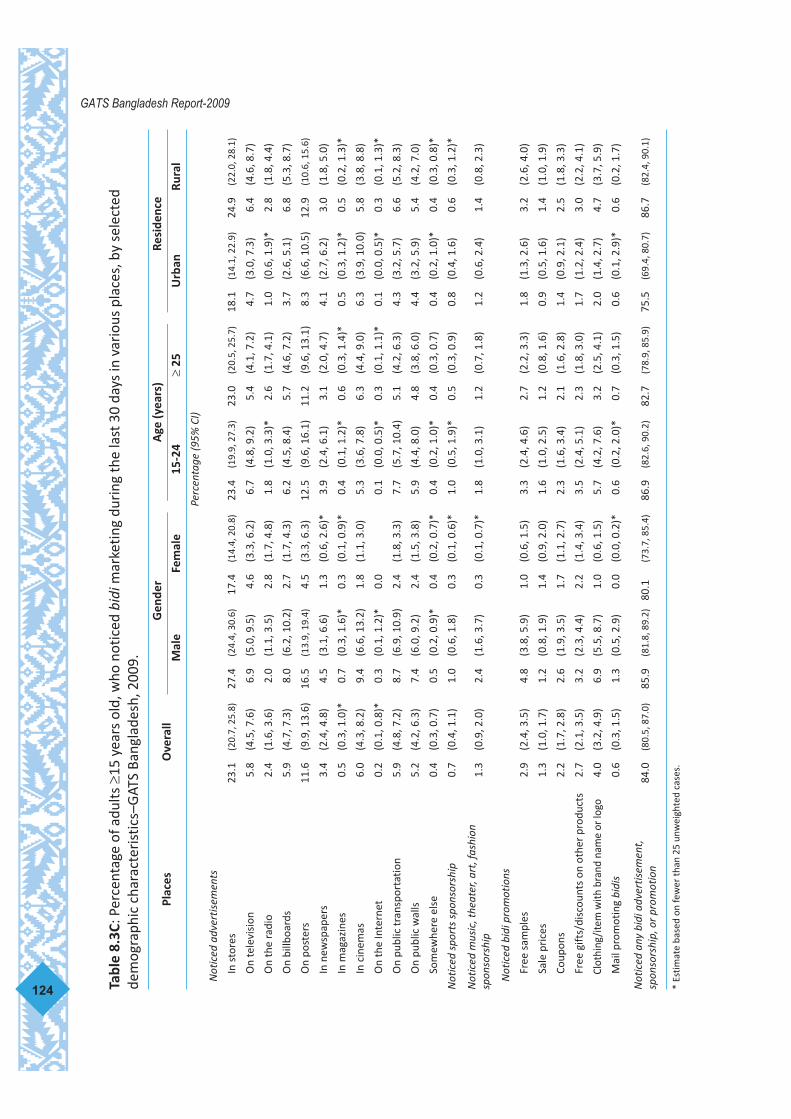
124
GATS Bangladesh Report-2009Ta
ble
8.3C
: Per
cent
age
of a
dults
≥15
yea
rs o
ld, w
ho n
otic
ed b
idim
arke
ting
duri
ng th
e la
st 3
0 da
ys in
var
ious
pla
ces,
by
sele
cted
dem
ogra
phic
cha
ract
eris
tics–
GAT
S Ba
ngla
desh
, 200
9.
Plac
esO
vera
llG
ende
rA
ge (y
ears
)Re
side
nce
Mal
eFe
mal
e15
-24
≥25
Urb
anRu
ral
Perc
enta
ge (9
5% C
I)
Not
iced
adv
ertis
emen
ts
In s
tore
s23
.1(2
0.7,
25.
8)27
.4(2
4.4,
30.
6)17
.4(1
4.4,
20.
8)23
.4(1
9.9,
27.
3)23
.0(2
0.5,
25.
7)18
.1(1
4.1,
22.
9)24
.9(2
2.0,
28.
1)
On
tele
visi
on5.
8(4
.5, 7
.6)
6.9
(5.0
, 9.5
)4.
6(3
.3, 6
.2)
6.7
(4.8
, 9.2
)5.
4(4
.1, 7
.2)
4.7
(3.0
, 7.3
)6.
4(4
.6, 8
.7)
On
the
radi
o2.
4(1
.6, 3
.6)
2.0
(1.1
, 3.5
)2.
8(1
.7, 4
.8)
1.8
(1.0
, 3.3
)*2.
6(1
.7, 4
.1)
1.0
(0.6
, 1.9
)*2.
8(1
.8, 4
.4)
On
billb
oard
s5.
9(4
.7, 7
.3)
8.0
(6.2
, 10.
2)2.
7(1
.7, 4
.3)
6.2
(4.5
, 8.4
)5.
7(4
.6, 7
.2)
3.7
(2.6
, 5.1
)6.
8(5
.3, 8
.7)
On
post
ers
11.6
(9.9
, 13.
6)16
.5(1
3.9,
19.
4)4.
5(3
.3, 6
.3)
12.5
(9.6
, 16.
1)11
.2(9
.6, 1
3.1)
8.3
(6.6
, 10.
5)12
.9(1
0.6,
15.
6)
In n
ewsp
aper
s3.
4(2
.4, 4
.8)
4.5
(3.1
, 6.6
)1.
3(0
.6, 2
.6)*
3.9
(2.4
, 6.1
)3.
1(2
.0, 4
.7)
4.1
(2.7
, 6.2
)3.
0(1
.8, 5
.0)
In m
agaz
ines
0.5
(0.3
, 1.0
)*0.
7(0
.3, 1
.6)*
0.3
(0.1
, 0.9
)*0.
4(0
.1, 1
.2)*
0.6
(0.3
, 1.4
)*0.
5(0
.3, 1
.2)*
0.5
(0.2
, 1.3
)*
In c
inem
as6.
0(4
.3, 8
.2)
9.4
(6.6
, 13.
2)1.
8(1
.1, 3
.0)
5.3
(3.6
, 7.8
)6.
3(4
.4, 9
.0)
6.3
(3.9
, 10.
0)5.
8(3
.8, 8
.8)
On
the
Inte
rnet
0.2
(0.1
, 0.8
)*0.
3(0
.1, 1
.2)*
0.0
0.1
(0.0
, 0.5
)*0.
3(0
.1, 1
.1)*
0.1
(0.0
, 0.5
)*0.
3(0
.1, 1
.3)*
On
publ
ic tr
ansp
orta
tion
5.9
(4.8
, 7.2
)8.
7(6
.9, 1
0.9)
2.4
(1.8
, 3.3
)7.
7(5
.7, 1
0.4)
5.1
(4.2
, 6.3
)4.
3(3
.2, 5
.7)
6.6
(5.2
, 8.3
)
On
publ
ic w
alls
5.2
(4.2
, 6.3
)7.
4(6
.0, 9
.2)
2.4
(1.5
, 3.8
)5.
9(4
.4, 8
.0)
4.8
(3.8
, 6.0
)4.
4(3
.2, 5
.9)
5.4
(4.2
, 7.0
)
Som
ewhe
re e
lse
0.4
(0.3
, 0.7
)0.
5(0
.2, 0
.9)*
0.4
(0.2
, 0.7
)*0.
4(0
.2, 1
.0)*
0.4
(0.3
, 0.7
)0.
4(0
.2, 1
.0)*
0.4
(0.3
, 0.8
)*
Not
iced
spo
rts
spon
sors
hip
0.7
(0.4
, 1.1
)1.
0(0
.6, 1
.8)
0.3
(0.1
, 0.6
)*1.
0(0
.5, 1
.9)*
0.5
(0.3
, 0.9
)0.
8(0
.4, 1
.6)
0.6
(0.3
, 1.2
)*
Not
iced
mus
ic, t
heat
er, a
rt, f
ashi
onsp
onso
rshi
p1.
3(0
.9, 2
.0)
2.4
(1.6
, 3.7
)0.
3(0
.1, 0
.7)*
1.8
(1.0
, 3.1
)1.
2(0
.7, 1
.8)
1.2
(0.6
, 2.4
)1.
4(0
.8, 2
.3)
Not
iced
bid
i pro
mot
ions
Free
sam
ples
2.9
(2.4
, 3.5
)4.
8(3
.8, 5
.9)
1.0
(0.6
, 1.5
)3.
3(2
.4, 4
.6)
2.7
(2.2
, 3.3
)1.
8(1
.3, 2
.6)
3.2
(2.6
, 4.0
)
Sale
pri
ces
1.3
(1.0
, 1.7
)1.
2(0
.8, 1
.9)
1.4
(0.9
, 2.0
)1.
6(1
.0, 2
.5)
1.2
(0.8
, 1.6
)0.
9(0
.5, 1
.6)
1.4
(1.0
, 1.9
)
Coup
ons
2.2
(1.7
, 2.8
)2.
6(1
.9, 3
.5)
1.7
(1.1
, 2.7
)2.
3(1
.6, 3
.4)
2.1
(1.6
, 2.8
)1.
4(0
.9, 2
.1)
2.5
(1.8
, 3.3
)
Free
gift
s/di
scou
nts
on o
ther
pro
duct
s2.
7(2
.1, 3
.5)
3.2
(2.3
, 4.4
)2.
2(1
.4, 3
.4)
3.5
(2.4
, 5.1
)2.
3(1
.8, 3
.0)
1.7
(1.2
, 2.4
)3.
0(2
.2, 4
.1)
Clot
hing
/ite
m w
ith b
rand
nam
e or
logo
4.0
(3.2
, 4.9
)6.
9(5
.5, 8
.7)
1.0
(0.6
, 1.5
)5.
7(4
.2, 7
.6)
3.2
(2.5
, 4.1
)2.
0(1
.4, 2
.7)
4.7
(3.7
, 5.9
)
Mai
l pro
mot
ing
bidi
s0.
6(0
.3, 1
.5)
1.3
(0.5
, 2.9
)0.
0(0
.0, 0
.2)*
0.6
(0.2
, 2.0
)*0.
7(0
.3, 1
.5)
0.6
(0.1
, 2.9
)*0.
6(0
.2, 1
.7)
Not
iced
any
bid
i adv
ertis
emen
t,sp
onso
rshi
p, o
r pro
mot
ion
84.0
(80.
5, 8
7.0)
85.9
(81.
8, 8
9.2)
80.1
(73.
7, 8
5.4)
86.9
(82.
6, 9
0.2)
82.7
(78.
9, 8
5.9)
75.5
(69.
4, 8
0.7)
86.7
(82.
4, 9
0.1)
* Es
timat
e ba
sed
on fe
wer
than
25
unw
eigh
ted
case
s.

125
GATS Bangladesh Report-2009Ta
ble
8.3C
(Co
nt.)
:Per
cent
age
of a
dults
≥15
yea
rs o
ld w
ho n
otic
ed b
idim
arke
ting
duri
ng t
he la
st 3
0 da
ys in
var
ious
pla
ces,
by
sele
cted
dem
ogra
phic
cha
ract
eris
tics–
GAT
S Ba
ngla
desh
, 200
9.
Plac
esW
ealt
h in
dex
Low
est
Low
Mid
dle
Hig
hH
ighe
st
Perc
enta
ge (9
5% C
I)
Not
iced
adv
ertis
emen
ts
In s
tore
s24
.8(2
0.7,
29.
5)24
.8(2
1.4,
28.
6)24
.7(2
0.9,
28.
9)23
.7(2
0.3,
27.
4)15
.5(1
2.0,
19.
7)
On
tele
visi
on6.
4(4
.0, 1
0.1)
8.6
(5.9
, 12.
3)4.
3(2
.8, 6
.5)
5.4
(3.7
, 7.9
)4.
9(3
.2, 7
.3)
On
the
radi
o3.
1(1
.5, 6
.4)*
2.8
(1.5
, 5.5
)*2.
5(1
.3, 5
.0)*
2.6
(1.3
, 5.0
)*0.
4(0
.1, 2
.0)*
On
billb
oard
s6.
2(4
.0, 9
.6)
5.5
(3.8
, 8.0
)5.
9(4
.1, 8
.5)
6.9
(4.9
, 9.6
)4.
6(2
.9, 7
.2)
On
post
ers
13.2
(9.7
, 17.
8)12
.9(1
0.3,
16.
1)12
.1(9
.2, 1
5.8)
11.1
(8.8
, 13.
9)8.
4(6
.1, 1
1.6)
In n
ewsp
aper
s2.
4(0
.7, 8
.2)*
5.1
(2.6
, 9.9
)*2.
8(1
.4, 5
.5)*
2.8
(1.7
, 4.6
)3.
5(2
.0, 6
.2)
In m
agaz
ines
0.2
(0.0
, 1.2
)*1.
0(0
.2, 3
.9)*
0.9
(0.3
, 2.8
)*0.
2(0
.0, 0
.8)*
0.4
(0.2
, 1.2
)*
In c
inem
as8.
4(4
.9, 1
4.0)
10.8
(7.2
, 15.
9)3.
9(2
.4, 6
.5)
4.0
(2.6
, 6.1
)3.
9(2
.0, 7
.3)
On
the
Inte
rnet
0.0
0.0
0.0
1.0
(0.2
, 3.8
)*0.
1(0
.0, 0
.6)*
On
publ
ic tr
ansp
orta
tion
3.5
(2.4
, 5.0
)6.
9(4
.9, 9
.5)
6.9
(5.0
, 9.4
)6.
6(4
.8, 9
.1)
4.8
(3.3
, 7.0
)
On
publ
ic w
alls
3.2
(2.2
, 4.7
)4.
8(3
.4, 6
.6)
7.1
(5.2
, 9.6
)5.
5(4
.0, 7
.6)
4.8
(3.4
, 6.9
)
Som
ewhe
re e
lse
0.8
(0.4
, 1.5
)*0.
4(0
.2, 1
.0)*
0.5
(0.2
, 1.5
)*0.
2(0
.1, 0
.4)*
0.2
(0.1
, 0.8
)*
Not
iced
spo
rts
spon
sors
hip
0.2
(0.0
, 1.0
)*0.
9(0
.4, 2
.1)*
0.8
(0.2
, 2.4
)*0.
4(0
.2, 0
.9)*
1.1
(0.5
, 2.3
)*
Not
iced
mus
ic, t
heat
er, a
rt, f
ashi
onsp
onso
rshi
p1.
1(0
.6, 2
.3)*
2.1
(1.1
, 3.7
)1.
2(0
.6, 2
.6)*
0.8
(0.4
, 1.5
)*1.
5(0
.8, 3
.0)*
Not
iced
bid
i pro
mot
ions
Free
sam
ples
2.7
(1.8
, 4.2
)2.
8(2
.0, 3
.8)
4.0
(2.8
, 5.9
)3.
1(2
.3, 4
.2)
1.2
(0.6
, 2.4
)*
Sale
pri
ces
1.3
(0.8
, 2.4
)*1.
0(0
.5, 1
.8)*
1.5
(0.9
, 2.5
)*1.
3(0
.8, 2
.1)*
1.5
(0.8
, 2.8
)*
Coup
ons
2.4
(1.5
, 3.9
)2.
1(1
.4, 3
.2)
3.1
(2.1
, 4.5
)1.
8(1
.1, 2
.9)
1.2
(0.6
, 2.2
)*
Free
gift
s/di
scou
nts
on o
ther
pro
duct
s2.
3(1
.6, 3
.4)
2.3
(1.5
, 3.6
)3.
6(2
.3, 5
.5)
3.1
(2.0
, 4.9
)1.
9(1
.1, 3
.2)
Clot
hing
/ite
m w
ith b
rand
nam
e or
logo
2.7
(1.8
, 4.2
)4.
0(2
.8, 5
.8)
5.5
(4.0
, 7.5
)4.
6(3
.2, 6
.4)
2.4
(1.5
, 3.7
)
Mai
l pro
mot
ing
bidi
s0.
1(0
.0, 0
.4)*
0.1
(0.0
, 0.4
)*0.
9(0
.4, 2
.2)*
1.4
(0.5
, 3.9
)*0.
7(0
.1, 3
.2)*
Not
iced
any
bid
iadv
ertis
emen
t, s
pons
orsh
ip, o
rpr
omot
ion
92.7
(88.
4, 9
5.5)
84.1
(78.
8, 8
8.3)
86.8
(81.
7, 9
0.7)
85.4
(80.
6, 8
9.1)
68.8
(61.
1, 7
5.5)
* Es
timat
e ba
sed
on fe
wer
than
25
unw
eigh
ted
case
s.

126
GATS Bangladesh Report-2009Ta
ble
8.3D
: Per
cent
age
of c
urre
nt to
bacc
o sm
oker
s ≥1
5 ye
ars
old,
who
not
iced
bid
imar
ketin
g du
ring
the
last
30
days
in v
ario
us p
lace
s,by
sel
ecte
d de
mog
raph
ic c
hara
cter
istic
s–G
ATS
Bang
lade
sh, 2
009.
Plac
esO
vera
llG
ende
rA
ge (y
ears
)Re
side
nce
Mal
eFe
mal
e15
-24
≥25
Urb
anRu
ral
Perc
enta
ge (9
5% C
I)
Not
iced
adv
ertis
emen
ts
In s
tore
s27
.2(2
4.0,
30.
7)27
.0(2
3.8,
30.
5)35
.7(1
9.8,
55.
5)*
25.2
(18.
1, 3
3.8)
27.6
(24.
3, 3
1.2)
22.3
(17.
7, 2
7.8)
28.8
(24.
9, 3
3.1)
On
tele
visi
on6.
1(4
.1, 8
.9)
6.1
(4.1
, 9.0
)3.
0(0
.4, 1
9.5)
*6.
4(2
.5, 1
5.8)
*6.
0(3
.9, 9
.0)
5.0
(2.7
, 9.0
)6.
4(4
.0, 1
0.3)
On
the
radi
o2.
0(1
.0, 4
.2)*
1.8
(0.8
, 3.9
)*18
.4(2
.7, 6
5.0)
*0.
4(0
.1, 2
.8)*
2.4
(1.1
, 5.0
)*0.
5(0
.1, 2
.1)*
2.5
(1.1
, 5.3
)*
On
billb
oard
s7.
6(5
.8, 1
0.0)
7.5
(5.6
, 9.8
)22
.2(3
.5, 6
9.2)
*8.
9(5
.1, 1
5.2)
*7.
4(5
.6, 9
.7)
5.2
(3.3
, 8.1
)8.
5(6
.1, 1
1.6)
On
post
ers
16.3
(13.
5, 1
9.5)
16.1
(13.
4, 1
9.2)
30.3
(9.7
, 63.
6)*
19.9
(13.
1, 2
8.9)
15.6
(12.
8, 1
8.9)
13.0
(9.7
, 17.
3)17
.4(1
3.9,
21.
5)
In n
ewsp
aper
s3.
2(1
.8, 5
.5)
3.2
(1.8
, 5.6
)0.
01.
3(0
.3, 5
.2)*
3.6
(2.0
, 6.4
)5.
1(2
.2, 1
1.5)
*2.
4(1
.1, 5
.0)*
In m
agaz
ines
0.7
(0.2
, 1.9
)*0.
7(0
.2, 1
.9)*
0.0
0.3
(0.0
, 2.3
)*0.
7(0
.2, 2
.3)*
0.7
(0.2
, 2.2
)*0.
7(0
.2, 2
.8)*
In c
inem
as8.
1(5
.3, 1
2.1)
8.1
(5.3
, 12.
3)0.
04.
5(1
.9, 1
0.3)
*9.
0(5
.7, 1
3.8)
9.8
(5.8
, 16.
1)7.
5(4
.2, 1
2.9)
On
the
Inte
rnet
0.1
(0.0
, 0.8
)*0.
1(0
.0, 0
.8)*
0.0
0.9
(0.1
, 6.2
)*0.
00.
3(0
.0, 2
.0)*
0.0
On
publ
ic tr
ansp
orta
tion
8.0
(6.3
, 10.
2)8.
1(6
.3, 1
0.3)
3.7
(0.5
, 22.
7)*
10.2
(5.7
, 17.
5)*
7.6
(6.0
, 9.7
)5.
2(3
.6, 7
.3)
9.0
(6.8
, 11.
8)
On
publ
ic w
alls
6.6
(5.1
, 8.4
)6.
7(5
.2, 8
.5)
0.0
6.6
(3.6
, 11.
8)*
6.6
(5.1
, 8.5
)6.
5(4
.5, 9
.1)
6.6
(4.8
, 9.0
)
Som
ewhe
re e
lse
0.4
(0.1
, 0.9
)*0.
4(0
.2, 0
.9)*
0.0
0.8
(0.2
, 3.2
)*0.
3(0
.1, 0
.8)*
0.0
0.5
(0.2
, 1.2
)*
Not
iced
spo
rts
spon
sors
hip
0.6
(0.3
, 1.3
)*0.
6(0
.2, 1
.3)*
1.3
(0.2
, 8.2
)*0.
8(0
.1, 5
.5)*
0.5
(0.2
, 1.2
)*1.
4(0
.5, 4
.0)*
0.3
(0.1
, 1.1
)*
Not
iced
mus
ic, t
heat
er, a
rt, f
ashi
onsp
onso
rshi
p1.
5(0
.9, 2
.5)
1.6
(1.0
, 2.6
)0.
01.
2(0
.3, 5
.0)*
1.6
(1.0
, 2.6
)2.
5(1
.1, 5
.4)*
1.2
(0.7
, 2.3
)*
Not
iced
bid
i pro
mot
ions
Free
sam
ples
5.1
(3.9
, 6.6
)5.
3(4
.1, 6
.8)
0.2
(0.0
, 1.3
)*4.
6(2
.3, 9
.1)*
5.2
(4.0
, 6.8
)3.
9(2
.4, 6
.4)
5.5
(4.1
, 7.3
)
Sale
pri
ces
1.8
(1.1
, 2.8
)1.
7(1
.0, 2
.8)
3.7
(1.0
, 13.
4)*
2.5
(0.8
, 7.5
)*1.
6(1
.0, 2
.8)
0.6
(0.2
, 1.3
)*2.
2(1
.3, 3
.6)
Coup
ons
2.7
(1.8
, 4.0
)2.
7(1
.8, 4
.0)
1.2
(0.2
, 8.1
)*3.
2(1
.1, 9
.1)*
2.6
(1.7
, 4.0
)1.
3(0
.6, 2
.9)*
3.1
(2.0
, 4.8
)
Free
gift
s/di
scou
nts
on o
ther
pro
duct
s3.
7(2
.5, 5
.3)
3.8
(2.6
, 5.5
)0.
03.
3(1
.3, 8
.5)*
3.8
(2.6
, 5.3
)2.
7(1
.7, 4
.3)
4.0
(2.6
, 6.2
)
Clot
hing
/ite
m w
ith b
rand
nam
e or
logo
5.9
(4.3
, 8.1
)6.
1(4
.5, 8
.3)
1.3
(0.2
, 8.1
)*7.
2(3
.4, 1
4.7)
*5.
7(4
.1, 7
.9)
2.6
(1.5
, 4.4
)7.
0(5
.0, 9
.8)
Mai
l pro
mot
ing
bidi
s0.
5(0
.1, 2
.0)*
0.5
(0.1
, 2.1
)*0.
3(0
.0, 2
.4)*
1.7
(0.3
, 7.7
)*0.
3(0
.1, 1
.0)*
0.2
(0.1
, 0.5
)*0.
7(0
.2, 2
.7)*
Not
iced
any
bid
i adv
ertis
emen
t,sp
onso
rshi
p, o
r pro
mot
ion
87.3
(83.
0, 9
0.7)
87.0
(82.
6, 9
0.5)
0.0
91.1
(84.
5, 9
5.1)
86.6
(81.
8, 9
0.3)
77.1
(70.
4, 8
2.7)
90.5
(84.
8, 9
4.2)
Not
e: C
urre
nt to
bacc
o sm
oker
s in
clud
e m
anuf
actu
red,
han
d-ro
lled
ciga
rett
e sm
oker
s an
d bi
dism
oker
s.*
Estim
ate
base
d on
few
er th
an 2
5 un
wei
ghte
d ca
ses.

127
GATS Bangladesh Report-2009Ta
ble
8.3D
(Con
t.):
Perc
enta
ge o
f cur
rent
toba
cco
smok
ers ≥
15 y
ears
old
, who
not
iced
bid
imar
ketin
g du
ring
the
last
30
days
in v
ario
us p
lace
s, b
y se
lect
edde
mog
raph
ic c
hara
cter
istic
s–G
ATS
Bang
lade
sh, 2
009.
Plac
esW
ealt
h in
dex
Low
est
Low
Mid
dle
Hig
hH
ighe
stPe
rcen
tage
(95%
CI)
Not
iced
adv
ertis
emen
ts
In s
tore
s25
.0(1
9.0,
32.
1)32
.4(2
7.1,
38.
2)25
.7(2
0.1,
32.
1)26
.6(2
1.5,
32.
5)22
.6(1
6.5,
30.
1)
On
tele
visi
on5.
1(2
.5, 1
0.4)
*11
.3(6
.9, 1
8.0)
2.3
(1.0
, 5.1
)*5.
3(2
.4, 1
1.3)
*4.
2(1
.9, 9
.2)*
On
the
radi
o2.
5(0
.8, 7
.9)*
1.5
(0.6
, 4.0
)*0.
7(0
.1, 2
.9)*
4.1
(1.3
, 12.
0)*
0.7
(0.1
, 4.9
)*
On
billb
oard
s7.
9(4
.5, 1
3.5)
*5.
0(3
.0, 8
.2)*
7.4
(4.5
, 11.
8)11
.5(7
.6, 1
7.0)
5.9
(3.3
, 10.
5)*
On
post
ers
18.1
(11.
9, 2
6.7)
17.9
(13.
4, 2
3.5)
14.7
(10.
4, 2
0.4)
15.3
(11.
0, 2
0.9)
13.0
(8.2
, 20.
0)
In n
ewsp
aper
s4.
9(1
.1, 1
9.3)
*2.
8(1
.1, 6
.9)*
1.9
(0.6
, 5.7
)*3.
0(1
.0, 8
.8)*
4.5
(1.9
, 10.
1)*
In m
agaz
ines
0.5
(0.1
, 3.4
)*1.
1(0
.2, 4
.6)*
1.3
(0.2
, 9.1
)*0.
00.
3(0
.0, 2
.3)*
In c
inem
as8.
8(4
.4, 1
7.0)
*14
.9(8
.9, 2
3.8)
4.0
(1.8
, 8.8
)*4.
6(1
.8, 1
1.5)
*6.
2(2
.7, 1
3.8)
*
On
the
Inte
rnet
0.0
0.0
0.0
0.0
0.5
(0.1
, 3.6
)*
On
publ
ic tr
ansp
orta
tion
4.6
(2.8
, 7.6
)*8.
8(5
.8, 1
3.1)
8.1
(5.4
, 12.
0)11
.4(7
.4, 1
7.0)
6.1
(3.8
, 9.8
)*
On
publ
ic w
alls
4.8
(2.9
, 7.9
)*6.
6(4
.5, 9
.6)
7.2
(4.7
, 11.
0)6.
6(4
.0, 1
0.8)
9.3
(5.8
, 14.
7)*
Som
ewhe
re e
lse
0.8
(0.2
, 2.4
)*0.
5(0
.1, 2
.0)*
0.0
0.2
(0.0
, 1.6
)*0.
0
Not
iced
spo
rts
spon
sors
hip
0.2
(0.0
, 1.2
)*0.
2(0
.1, 1
.1)*
0.8
(0.2
, 3.3
)*0.
2(0
.0, 1
.2)*
3.1
(1.1
, 8.6
)*
Not
iced
mus
ic, t
heat
er, a
rt, f
ashi
on s
pons
orsh
ip1.
0(0
.4, 2
.7)*
2.4
(1.2
, 4.6
)*1.
1(0
.3, 3
.5)*
0.7
(0.3
, 2.1
)*3.
3(1
.1, 9
.4)*
Not
iced
bid
i pro
mot
ions
Free
sam
ples
5.1
(3.3
, 7.7
)4.
0(2
.5, 6
.4)
7.0
(4.3
, 11.
3)*
6.4
(4.3
, 9.3
)1.
0(0
.3, 3
.3)*
Sale
pri
ces
1.9
(0.8
, 4.5
)*1.
0(0
.4, 2
.4)*
3.6
(1.7
, 7.5
)*1.
2(0
.5, 3
.1)*
0.8
(0.2
, 2.6
)*
Coup
ons
3.3
(1.6
, 6.7
)*2.
3(1
.2, 4
.2)*
4.5
(2.3
, 8.6
)*1.
4(0
.5, 3
.8)*
1.0
(0.3
, 3.1
)*
Free
gift
s/di
scou
nts
on o
ther
pro
duct
s2.
1(1
.0, 4
.2)*
2.7
(1.5
, 4.8
)*6.
6(3
.9, 1
0.9)
*4.
6(2
.6, 8
.0)*
2.1
(0.9
, 4.7
)*
Clot
hing
/ite
m w
ith b
rand
nam
e or
logo
3.8
(2.1
, 6.7
)*6.
6(4
.3, 1
0.1)
6.9
(4.0
, 11.
7)*
7.9
(5.0
, 12.
2)2.
9(1
.4, 6
.1)*
Mai
l pro
mot
ing
bidi
s0.
0(0
.0, 0
.2)*
0.1
(0.0
, 0.2
)*1.
1(0
.3, 3
.3)*
1.0
(0.1
, 6.7
)*1.
1(0
.2, 5
.1)*
Not
iced
any
bid
i adv
ertis
emen
t, s
pons
orsh
ip, o
rpr
omot
ion
94.2
(89.
0, 9
7.0)
91.0
(86.
4, 9
4.2)
86.4
(77.
8, 9
2.0)
86.2
(77.
8, 9
1.7)
67.0
(55.
1, 7
7.1)
Not
e: C
urre
nt to
bacc
o sm
oker
s in
clud
e m
anuf
actu
red,
han
d-ro
lled
ciga
rett
e sm
oker
s an
d bi
dism
oker
s.*
Estim
ate
base
d on
few
er th
an 2
5 un
wei
ghte
d ca
ses.
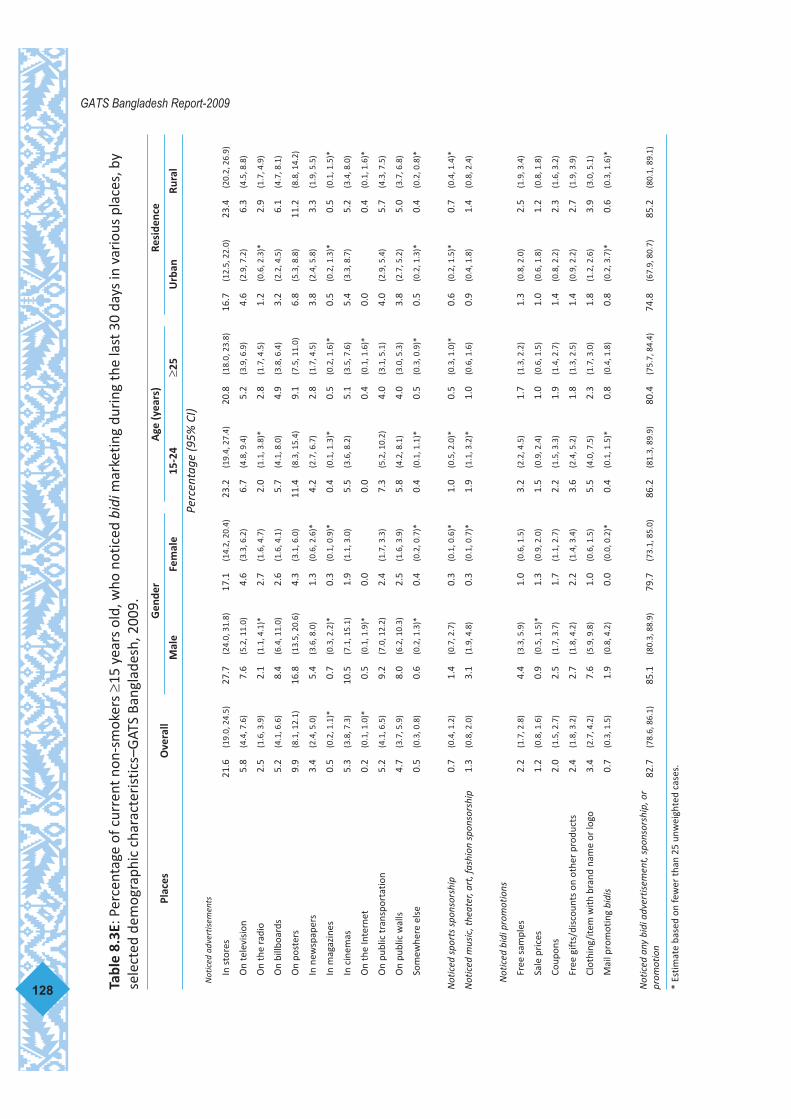
128
GATS Bangladesh Report-2009Ta
ble
8.3E
: Per
cent
age
of c
urre
nt n
on-s
mok
ers ≥1
5 ye
ars
old,
who
not
iced
bid
imar
ketin
g du
ring
the
last
30
days
in v
ario
us p
lace
s, b
yse
lect
ed d
emog
raph
ic c
hara
cter
istic
s–G
ATS
Bang
lade
sh, 2
009.
Plac
esO
vera
llG
ende
rA
ge (y
ears
)Re
side
nce
Mal
eFe
mal
e15
-24
≥25
Urb
anRu
ral
Perc
enta
ge (9
5% C
I)N
otic
ed a
dver
tisem
ents
In s
tore
s21
.6(1
9.0,
24.
5)27
.7(2
4.0,
31.
8)17
.1(1
4.2,
20.
4)23
.2(1
9.4,
27.
4)20
.8(1
8.0,
23.
8)16
.7(1
2.5,
22.
0)23
.4(2
0.2,
26.
9)
On
tele
visi
on5.
8(4
.4, 7
.6)
7.6
(5.2
, 11.
0)4.
6(3
.3, 6
.2)
6.7
(4.8
, 9.4
)5.
2(3
.9, 6
.9)
4.6
(2.9
, 7.2
)6.
3(4
.5, 8
.8)
On
the
radi
o2.
5(1
.6, 3
.9)
2.1
(1.1
, 4.1
)*2.
7(1
.6, 4
.7)
2.0
(1.1
, 3.8
)*2.
8(1
.7, 4
.5)
1.2
(0.6
, 2.3
)*2.
9(1
.7, 4
.9)
On
billb
oard
s5.
2(4
.1, 6
.6)
8.4
(6.4
, 11.
0)2.
6(1
.6, 4
.1)
5.7
(4.1
, 8.0
)4.
9(3
.8, 6
.4)
3.2
(2.2
, 4.5
)6.
1(4
.7, 8
.1)
On
post
ers
9.9
(8.1
, 12.
1)16
.8(1
3.5,
20.
6)4.
3(3
.1, 6
.0)
11.4
(8.3
, 15.
4)9.
1(7
.5, 1
1.0)
6.8
(5.3
, 8.8
)11
.2(8
.8, 1
4.2)
In n
ewsp
aper
s3.
4(2
.4, 5
.0)
5.4
(3.6
, 8.0
)1.
3(0
.6, 2
.6)*
4.2
(2.7
, 6.7
)2.
8(1
.7, 4
.5)
3.8
(2.4
, 5.8
)3.
3(1
.9, 5
.5)
In m
agaz
ines
0.5
(0.2
, 1.1
)*0.
7(0
.3, 2
.2)*
0.3
(0.1
, 0.9
)*0.
4(0
.1, 1
.3)*
0.5
(0.2
, 1.6
)*0.
5(0
.2, 1
.3)*
0.5
(0.1
, 1.5
)*
In c
inem
as5.
3(3
.8, 7
.3)
10.5
(7.1
, 15.
1)1.
9(1
.1, 3
.0)
5.5
(3.6
, 8.2
)5.
1(3
.5, 7
.6)
5.4
(3.3
, 8.7
)5.
2(3
.4, 8
.0)
On
the
Inte
rnet
0.2
(0.1
, 1.0
)*0.
5(0
.1, 1
.9)*
0.0
0.0
0.4
(0.1
, 1.6
)*0.
00.
4(0
.1, 1
.6)*
On
publ
ic tr
ansp
orta
tion
5.2
(4.1
, 6.5
)9.
2(7
.0, 1
2.2)
2.4
(1.7
, 3.3
)7.
3(5
.2, 1
0.2)
4.0
(3.1
, 5.1
)4.
0(2
.9, 5
.4)
5.7
(4.3
, 7.5
)
On
publ
ic w
alls
4.7
(3.7
, 5.9
)8.
0(6
.2, 1
0.3)
2.5
(1.6
, 3.9
)5.
8(4
.2, 8
.1)
4.0
(3.0
, 5.3
)3.
8(2
.7, 5
.2)
5.0
(3.7
, 6.8
)
Som
ewhe
re e
lse
0.5
(0.3
, 0.8
)0.
6(0
.2, 1
.3)*
0.4
(0.2
, 0.7
)*0.
4(0
.1, 1
.1)*
0.5
(0.3
, 0.9
)*0.
5(0
.2, 1
.3)*
0.4
(0.2
, 0.8
)*
Not
iced
spo
rts
spon
sors
hip
0.7
(0.4
, 1.2
)1.
4(0
.7, 2
.7)
0.3
(0.1
, 0.6
)*1.
0(0
.5, 2
.0)*
0.5
(0.3
, 1.0
)*0.
6(0
.2, 1
.5)*
0.7
(0.4
, 1.4
)*
Not
iced
mus
ic, t
heat
er, a
rt, f
ashi
on s
pons
orsh
ip1.
3(0
.8, 2
.0)
3.1
(1.9
, 4.8
)0.
3(0
.1, 0
.7)*
1.9
(1.1
, 3.2
)*1.
0(0
.6, 1
.6)
0.9
(0.4
, 1.8
)1.
4(0
.8, 2
.4)
Not
iced
bid
i pro
mot
ions
Free
sam
ples
2.2
(1.7
, 2.8
)4.
4(3
.3, 5
.9)
1.0
(0.6
, 1.5
)3.
2(2
.2, 4
.5)
1.7
(1.3
, 2.2
)1.
3(0
.8, 2
.0)
2.5
(1.9
, 3.4
)
Sale
pri
ces
1.2
(0.8
, 1.6
)0.
9(0
.5, 1
.5)*
1.3
(0.9
, 2.0
)1.
5(0
.9, 2
.4)
1.0
(0.6
, 1.5
)1.
0(0
.6, 1
.8)
1.2
(0.8
, 1.8
)
Coup
ons
2.0
(1.5
, 2.7
)2.
5(1
.7, 3
.7)
1.7
(1.1
, 2.7
)2.
2(1
.5, 3
.3)
1.9
(1.4
, 2.7
)1.
4(0
.8, 2
.2)
2.3
(1.6
, 3.2
)
Free
gift
s/di
scou
nts
on o
ther
pro
duct
s2.
4(1
.8, 3
.2)
2.7
(1.8
, 4.2
)2.
2(1
.4, 3
.4)
3.6
(2.4
, 5.2
)1.
8(1
.3, 2
.5)
1.4
(0.9
, 2.2
)2.
7(1
.9, 3
.9)
Clot
hing
/ite
m w
ith b
rand
nam
e or
logo
3.4
(2.7
, 4.2
)7.
6(5
.9, 9
.8)
1.0
(0.6
, 1.5
)5.
5(4
.0, 7
.5)
2.3
(1.7
, 3.0
)1.
8(1
.2, 2
.6)
3.9
(3.0
, 5.1
)
Mai
l pro
mot
ing
bidi
s0.
7(0
.3, 1
.5)
1.9
(0.8
, 4.2
)0.
0(0
.0, 0
.2)*
0.4
(0.1
, 1.5
)*0.
8(0
.4, 1
.8)
0.8
(0.2
, 3.7
)*0.
6(0
.3, 1
.6)*
Not
iced
any
bid
i adv
ertis
emen
t, s
pons
orsh
ip, o
rpr
omot
ion
82.7
(78.
6, 8
6.1)
85.1
(80.
3, 8
8.9)
79.7
(73.
1, 8
5.0)
86.2
(81.
3, 8
9.9)
80.4
(75.
7, 8
4.4)
74.8
(67.
9, 8
0.7)
85.2
(80.
1, 8
9.1)
* Es
timat
e ba
sed
on fe
wer
than
25
unw
eigh
ted
case
s.
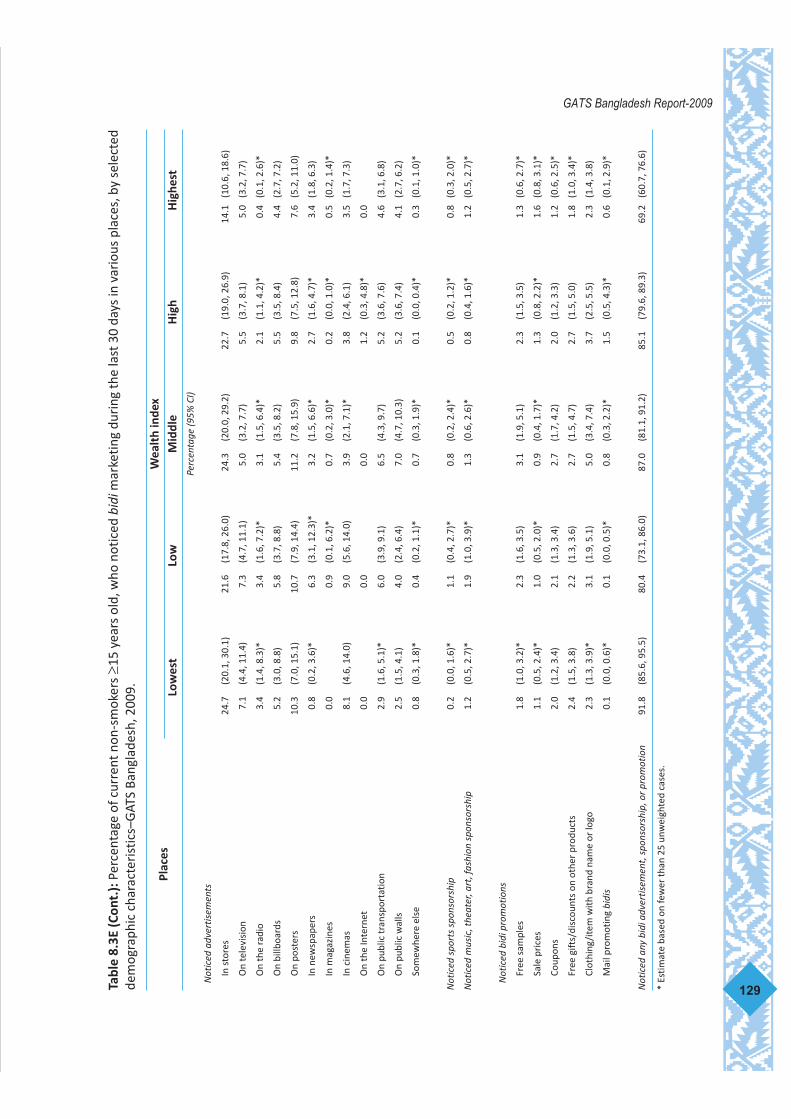
129
GATS Bangladesh Report-2009Ta
ble
8.3E
(Con
t.):
Perc
enta
ge o
f cur
rent
non
-sm
oker
s ≥1
5 ye
ars
old,
who
not
iced
bid
imar
ketin
g du
ring
the
last
30
days
in v
ario
us p
lace
s, b
y se
lect
edde
mog
raph
ic c
hara
cter
istic
s–G
ATS
Bang
lade
sh, 2
009.
Plac
esW
ealt
h in
dex
Low
est
Low
Mid
dle
Hig
hH
ighe
stPe
rcen
tage
(95%
CI)
Not
iced
adv
ertis
emen
ts
In s
tore
s24
.7(2
0.1,
30.
1)21
.6(1
7.8,
26.
0)24
.3(2
0.0,
29.
2)22
.7(1
9.0,
26.
9)14
.1(1
0.6,
18.
6)
On
tele
visi
on7.
1(4
.4, 1
1.4)
7.3
(4.7
, 11.
1)5.
0(3
.2, 7
.7)
5.5
(3.7
, 8.1
)5.
0(3
.2, 7
.7)
On
the
radi
o3.
4(1
.4, 8
.3)*
3.4
(1.6
, 7.2
)*3.
1(1
.5, 6
.4)*
2.1
(1.1
, 4.2
)*0.
4(0
.1, 2
.6)*
On
billb
oard
s5.
2(3
.0, 8
.8)
5.8
(3.7
, 8.8
)5.
4(3
.5, 8
.2)
5.5
(3.5
, 8.4
)4.
4(2
.7, 7
.2)
On
post
ers
10.3
(7.0
, 15.
1)10
.7(7
.9, 1
4.4)
11.2
(7.8
, 15.
9)9.
8(7
.5, 1
2.8)
7.6
(5.2
, 11.
0)
In n
ewsp
aper
s0.
8(0
.2, 3
.6)*
6.3
(3.1
, 12.
3)*
3.2
(1.5
, 6.6
)*2.
7(1
.6, 4
.7)*
3.4
(1.8
, 6.3
)
In m
agaz
ines
0.0
0.9
(0.1
, 6.2
)*0.
7(0
.2, 3
.0)*
0.2
(0.0
, 1.0
)*0.
5(0
.2, 1
.4)*
In c
inem
as8.
1(4
.6, 1
4.0)
9.0
(5.6
, 14.
0)3.
9(2
.1, 7
.1)*
3.8
(2.4
, 6.1
)3.
5(1
.7, 7
.3)
On
the
Inte
rnet
0.0
0.0
0.0
1.2
(0.3
, 4.8
)*0.
0
On
publ
ic tr
ansp
orta
tion
2.9
(1.6
, 5.1
)*6.
0(3
.9, 9
.1)
6.5
(4.3
, 9.7
)5.
2(3
.6, 7
.6)
4.6
(3.1
, 6.8
)
On
publ
ic w
alls
2.5
(1.5
, 4.1
)4.
0(2
.4, 6
.4)
7.0
(4.7
, 10.
3)5.
2(3
.6, 7
.4)
4.1
(2.7
, 6.2
)
Som
ewhe
re e
lse
0.8
(0.3
, 1.8
)*0.
4(0
.2, 1
.1)*
0.7
(0.3
, 1.9
)*0.
1(0
.0, 0
.4)*
0.3
(0.1
, 1.0
)*
Not
iced
spo
rts
spon
sors
hip
0.2
(0.0
, 1.6
)*1.
1(0
.4, 2
.7)*
0.8
(0.2
, 2.4
)*0.
5(0
.2, 1
.2)*
0.8
(0.3
, 2.0
)*
Not
iced
mus
ic, t
heat
er, a
rt, f
ashi
on s
pons
orsh
ip1.
2(0
.5, 2
.7)*
1.9
(1.0
, 3.9
)*1.
3(0
.6, 2
.6)*
0.8
(0.4
, 1.6
)*1.
2(0
.5, 2
.7)*
Not
iced
bid
i pro
mot
ions
Free
sam
ples
1.8
(1.0
, 3.2
)*2.
3(1
.6, 3
.5)
3.1
(1.9
, 5.1
)2.
3(1
.5, 3
.5)
1.3
(0.6
, 2.7
)*
Sale
pri
ces
1.1
(0.5
, 2.4
)*1.
0(0
.5, 2
.0)*
0.9
(0.4
, 1.7
)*1.
3(0
.8, 2
.2)*
1.6
(0.8
, 3.1
)*
Coup
ons
2.0
(1.2
, 3.4
)2.
1(1
.3, 3
.4)
2.7
(1.7
, 4.2
)2.
0(1
.2, 3
.3)
1.2
(0.6
, 2.5
)*
Free
gift
s/di
scou
nts
on o
ther
pro
duct
s2.
4(1
.5, 3
.8)
2.2
(1.3
, 3.6
)2.
7(1
.5, 4
.7)
2.7
(1.5
, 5.0
)1.
8(1
.0, 3
.4)*
Clot
hing
/ite
m w
ith b
rand
nam
e or
logo
2.3
(1.3
, 3.9
)*3.
1(1
.9, 5
.1)
5.0
(3.4
, 7.4
)3.
7(2
.5, 5
.5)
2.3
(1.4
, 3.8
)
Mai
l pro
mot
ing
bidi
s0.
1(0
.0, 0
.6)*
0.1
(0.0
, 0.5
)*0.
8(0
.3, 2
.2)*
1.5
(0.5
, 4.3
)*0.
6(0
.1, 2
.9)*
Not
iced
any
bid
i adv
ertis
emen
t, s
pons
orsh
ip, o
r pro
mot
ion
91.8
(85.
6, 9
5.5)
80.4
(73.
1, 8
6.0)
87.0
(81.
1, 9
1.2)
85.1
(79.
6, 8
9.3)
69.2
(60.
7, 7
6.6)
* Es
timat
e ba
sed
on fe
wer
than
25
unw
eigh
ted
case
s.
8.3.3. Noticing of smokeless tobacco marketing in various public places
The distribution of adults aged 15 years or above who noticed marketing of smokeless tobaccoproducts in public places and media in the last 30 days by demographic characteristics ispresented in Table 8.3F. The percentage of people who noticed some smokeless tobaccoproduct advertisement, sponsorship or promotion was 70.5%; the most common site was ina store (13.1%). Other common sites were posters (3.1%), public transportation (3.4%),television (3.4%), cinemas (3.1%), billboards (2.6%) and public walls (1.8%). The most commontype of promotion noticed was clothing items with a brand name or logo (4.0%). Figures forother promotional activities were very low. Almost similar percentages of males and femalesnoticed some advertisement or promotion of bidi (70.8.9% and 69.9%). Higher percentagesof rural people (74.1%) had noticed some advertisement or promotion than urban people(61.1%). The highest percentage of smokeless tobacco marketing activity noticed was in thelowest wealth index category (84.1%), while the lowest was in the highest wealth indexcategory (51.7%).
The distribution of smokeless tobacco users who noticed smokeless tobacco productsmarketing in public places and media in the last 30 days is presented in Table 8.3G. Thepercentage of current smokeless tobacco users who noticed some smokeless tobacco productadvertisement, sponsorship or promotion was 72.9%. The most common site for noticingsmokeless tobacco advertisement was in stores (14.2%). Other common sites were cinemas(3.1%), public transportation (4.7%), posters (4.5%), television (4.3%), billboards (2.6%) andpublic walls (1.2%). The percentage of smokeless tobacco users noticing promotional activitiesof smokeless tobacco use was very low and the most common type of promotion noticed wasclothing items with a brand name or logo (1.0%) Almost similar percentages of males andfemales noticed some advertisement or promotion of smokeless tobacco use (73.6% and71.8%). Higher percentages of rural people (74.0%) had noticed some advertisement orpromotion than urban people (69.6%). The highest percentages of smokeless tobaccomarketing activity noticed was in the lowest wealth index category (85.1%), while the lowestwas in the highest wealth index category (63.7%).
The distribution of current non-smokeless tobacco users who noticed smokeless tobaccoproducts marketing in public places and media in the last 30 days is presented in Table 8.3H.The percentage of current non-smokeless tobacco users who noticed some smokeless tobaccoproduct advertisement, sponsorship or promotion was 69.5%; the most common site was ina store (12.7%). Other common sites were public posters (3.7%), transportation (3.0%),television (3.1%), billboards (2.7%), cinemas (2.3%) and public walls (2.1%). The percentageof smokeless tobacco users noticing promotional activities of smokeless tobacco was very lowand the most common type of promotion noticed was clothing items with a brand name orlogo (1.0%). A higher percentage of rural people (74.1%) noticed some advertisement orpromotion than urban people (50.6%). The highest percentage of smokeless tobacco productmarketing activity noticed was in the lowest wealth index category (83.1%), while the lowestwas in the highest wealth index category (49.4%).
There are differences between current tobacco smokers and non-smokers in noticing somecigarette advertisement, sponsorship or promotional activity. Current tobacco smokers reporteda higher percentage (66.6%) compared to non-smokers (43.3%) for noticing tobacco marketing;53.5% of non-smoking people in the younger age group people were exposed to marketingactivity, while 68.9% of tobacco-smoking young people were so exposed. On the other hand,only 38% of non-smoking older people were exposed to tobacco marketing activities. However,for bidi smokers and smokeless tobacco users, no such differences were noted.
130
GATS Bangladesh Report-2009

131
GATS Bangladesh Report-2009Ta
ble
8.3F
: Per
cent
age
of a
dults
≥15
yea
rs o
ld, w
ho n
otic
ed s
mok
eles
s to
bacc
o m
arke
ting
duri
ng t
he la
st 3
0 da
ys in
var
ious
pla
ces,
by
sele
cted
dem
ogra
phic
cha
ract
eris
tics–
GAT
S Ba
ngla
desh
, 200
9.
Plac
esO
vera
llG
ende
rA
ge (y
ears
)Re
side
nce
Mal
eFe
mal
e15
-24
≥25
Urb
anRu
ral
Perc
enta
ge (9
5% C
I)
Not
iced
adv
ertis
emen
ts
In s
tore
s13
.1(1
1.3,
15.
1)12
.9(1
0.8,
15.
5)13
.3(1
0.5,
16.
6)12
.7(1
0.3,
15.
6)13
.2(1
1.4,
15.
4)11
.0(8
.4, 1
4.3)
13.8
(11.
7, 1
6.3)
On
tele
visi
on3.
4(2
.5, 4
.6)
3.2
(2.2
, 4.8
)3.
5(2
.5, 5
.1)
3.9
(2.7
, 5.6
)3.
1(2
.3, 4
.3)
3.0
(1.9
, 4.7
)3.
5(2
.4, 5
.2)
On
the
radi
o1.
2(0
.7, 2
.0)
0.3
(0.1
, 0.7
)*2.
3(1
.3, 4
.2)
0.4
(0.1
, 1.2
)*1.
6(1
.0, 2
.6)
0.7
(0.3
, 1.5
)*1.
4(0
.8, 2
.5)
On
billb
oard
s2.
6(1
.8, 3
.8)
3.6
(2.4
, 5.5
)1.
2(0
.6, 2
.2)
2.4
(1.4
, 4.2
)2.
7(2
.0, 3
.8)
1.6
(1.1
, 2.4
)3.
1(2
.0, 4
.7)
On
post
ers
3.9
(3.1
, 4.9
)5.
4(4
.1, 7
.1)
1.7
(1.1
, 2.7
)3.
2(2
.1, 4
.7)
4.3
(3.4
, 5.3
)3.
1(2
.3, 4
.2)
4.2
(3.2
, 5.6
)
In n
ewsp
aper
s1.
3(0
.8, 2
.0)
1.6
(0.9
, 2.7
)0.
7(0
.3, 1
.4)*
1.5
(0.7
, 3.1
)*1.
1(0
.7, 1
.9)
1.6
(0.9
, 2.8
)1.
1(0
.6, 2
.1)*
In m
agaz
ines
0.5
(0.2
, 1.1
)*0.
8(0
.4, 1
.8)*
0.1
(0.0
, 0.5
)*0.
2(0
.0, 0
.8)*
0.7
(0.3
, 1.6
)*0.
5(0
.2, 1
.5)*
0.5
(0.2
, 1.4
)*
In c
inem
as3.
1(2
.1, 4
.6)
5.0
(3.2
, 7.5
)0.
9(0
.5, 1
.7)
2.9
(1.8
, 4.6
)3.
2(2
.1, 5
.0)
4.2
(2.4
, 7.3
)2.
7(1
.6, 4
.4)
On
the
Inte
rnet
0.2
(0.0
, 0.8
)*0.
3(0
.1, 1
.2)*
0.0
0.0
0.3
(0.1
, 1.1
)*0.
00.
3(0
.1, 1
.3)*
On
publ
ic tr
ansp
orta
tion
3.4
(2.6
, 4.5
)4.
8(3
.5, 6
.6)
1.6
(1.1
, 2.4
)4.
1(2
.8, 5
.9)
3.1
(2.4
, 4.1
)2.
2(1
.5, 3
.0)
3.9
(2.9
, 5.3
)
On
publ
ic w
alls
1.8
(1.3
, 2.5
)2.
9(2
.0, 4
.2)
0.5
(0.3
, 0.9
)1.
6(0
.9, 2
.5)
1.9
(1.4
, 2.8
)1.
6(1
.1, 2
.6)
1.9
(1.3
, 2.8
)
Som
ewhe
re e
lse
0.2
(0.1
, 0.4
)*0.
1(0
.0, 0
.7)*
0.2
(0.1
, 0.5
)*0.
3(0
.1, 0
.9)*
0.1
(0.1
, 0.3
)*0.
1(0
.0, 0
.4)*
0.2
(0.1
, 0.5
)*
Not
iced
spo
rts
spon
sors
hip
0.4
(0.2
, 0.8
)0.
6(0
.3, 1
.3)*
0.3
(0.1
, 0.6
)*0.
5(0
.3, 1
.1)*
0.4
(0.2
, 0.7
)*0.
3(0
.1, 0
.8)*
0.5
(0.2
, 0.9
)*
Not
iced
mus
ic, t
heat
er, a
rt, f
ashi
on s
pons
orsh
ip0.
4(0
.3, 0
.7)
0.5
(0.3
, 1.0
)*0.
3(0
.2, 0
.7)*
0.5
(0.2
, 1.1
)*0.
4(0
.2, 0
.7)*
0.5
(0.2
, 1.2
)*0.
4(0
.2, 0
.8)*
Not
iced
sm
okel
ess
toba
cco
prom
otio
ns
Free
sam
ples
0.8
(0.5
, 1.1
)1.
1(0
.7, 1
.8)
0.4
(0.3
, 0.7
)0.
9(0
.5, 1
.7)*
0.7
(0.4
, 1.1
)0.
5(0
.3, 0
.8)
0.8
(0.5
, 1.3
)
Sale
pri
ces
0.6
(0.4
, 0.9
)0.
3(0
.2, 0
.5)*
0.9
(0.6
, 1.5
)0.
7(0
.4, 1
.3)*
0.6
(0.4
, 0.9
)0.
7(0
.4, 1
.3)
0.6
(0.4
, 0.9
)
Coup
ons
0.6
(0.4
, 0.9
)0.
7(0
.4, 1
.3)*
0.5
(0.3
, 1.0
)*0.
9(0
.5, 1
.6)*
0.5
(0.3
, 0.9
)0.
4(0
.2, 0
.7)*
0.7
(0.4
, 1.1
)
Free
gift
s/di
scou
nts
on o
ther
pro
duct
s0.
6(0
.4, 0
.9)
0.4
(0.2
, 0.8
)0.
8(0
.5, 1
.4)
0.9
(0.6
, 1.6
)*0.
5(0
.3, 0
.8)
0.6
(0.3
, 0.9
)0.
7(0
.4, 1
.1)
Clot
hing
/ite
m w
ith b
rand
nam
e or
logo
1.4
(1.0
, 2.0
)2.
3(1
.5, 3
.6)
0.5
(0.3
, 0.9
)*1.
5(0
.9, 2
.4)
1.4
(0.9
, 2.1
)1.
2(0
.7, 1
.9)
1.5
(1.0
, 2.4
)
Mai
l pro
mot
ing
smok
eles
s to
bacc
o0.
7(0
.3, 1
.5)
1.3
(0.5
, 2.9
)0.
0(0
.0, 0
.2)*
0.6
(0.2
, 2.0
)*0.
7(0
.3, 1
.5)
0.6
(0.1
, 2.9
)*0.
7(0
.3, 1
.7)
Not
iced
any
sm
okel
ess
toba
cco
adve
rtis
emen
t,sp
onso
rshi
p, o
r pro
mot
ion
70.5
(65.
1, 7
5.3)
70.8
(64.
1, 7
6.7)
69.9
(61.
4, 7
7.2)
72.2
(65.
1, 7
8.3)
69.7
(64.
1, 7
4.8)
61.1
(53.
0, 6
8.6)
74.1
(67.
2, 8
0.0)
* Es
timat
e ba
sed
on fe
wer
than
25
unw
eigh
ted
case
s.
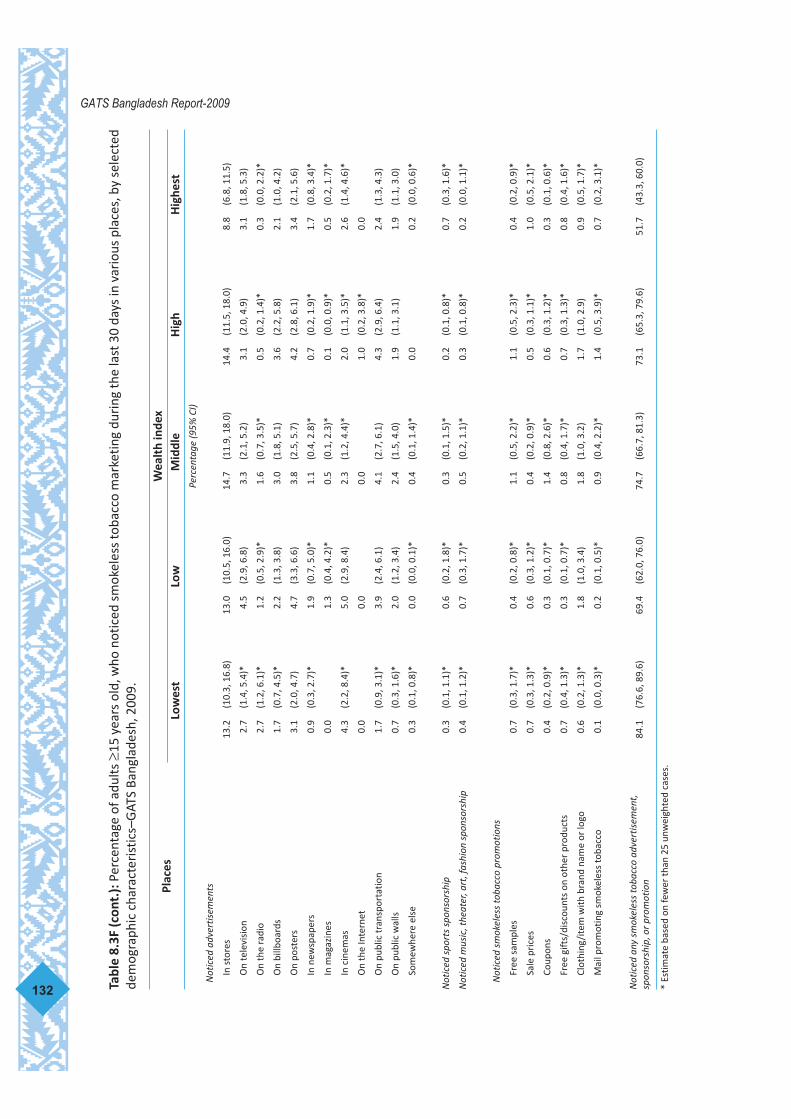
132
GATS Bangladesh Report-2009Ta
ble
8.3F
(con
t.):
Perc
enta
ge o
f adu
lts ≥
15 y
ears
old
, who
not
iced
sm
okel
ess
toba
cco
mar
ketin
g du
ring
the
last
30
days
in v
ario
us p
lace
s, b
y se
lect
edde
mog
raph
ic c
hara
cter
istic
s–G
ATS
Bang
lade
sh, 2
009.
Plac
esW
ealt
h in
dex
Low
est
Low
Mid
dle
Hig
hH
ighe
stPe
rcen
tage
(95%
CI)
Not
iced
adv
ertis
emen
ts
In s
tore
s13
.2(1
0.3,
16.
8)13
.0(1
0.5,
16.
0)14
.7(1
1.9,
18.
0)14
.4(1
1.5,
18.
0)8.
8(6
.8, 1
1.5)
On
tele
visi
on2.
7(1
.4, 5
.4)*
4.5
(2.9
, 6.8
)3.
3(2
.1, 5
.2)
3.1
(2.0
, 4.9
)3.
1(1
.8, 5
.3)
On
the
radi
o2.
7(1
.2, 6
.1)*
1.2
(0.5
, 2.9
)*1.
6(0
.7, 3
.5)*
0.5
(0.2
, 1.4
)*0.
3(0
.0, 2
.2)*
On
billb
oard
s1.
7(0
.7, 4
.5)*
2.2
(1.3
, 3.8
)3.
0(1
.8, 5
.1)
3.6
(2.2
, 5.8
)2.
1(1
.0, 4
.2)
On
post
ers
3.1
(2.0
, 4.7
)4.
7(3
.3, 6
.6)
3.8
(2.5
, 5.7
)4.
2(2
.8, 6
.1)
3.4
(2.1
, 5.6
)
In n
ewsp
aper
s0.
9(0
.3, 2
.7)*
1.9
(0.7
, 5.0
)*1.
1(0
.4, 2
.8)*
0.7
(0.2
, 1.9
)*1.
7(0
.8, 3
.4)*
In m
agaz
ines
0.0
1.3
(0.4
, 4.2
)*0.
5(0
.1, 2
.3)*
0.1
(0.0
, 0.9
)*0.
5(0
.2, 1
.7)*
In c
inem
as4.
3(2
.2, 8
.4)*
5.0
(2.9
, 8.4
)2.
3(1
.2, 4
.4)*
2.0
(1.1
, 3.5
)*2.
6(1
.4, 4
.6)*
On
the
Inte
rnet
0.0
0.0
0.0
1.0
(0.2
, 3.8
)*0.
0
On
publ
ic tr
ansp
orta
tion
1.7
(0.9
, 3.1
)*3.
9(2
.4, 6
.1)
4.1
(2.7
, 6.1
)4.
3(2
.9, 6
.4)
2.4
(1.3
, 4.3
)
On
publ
ic w
alls
0.7
(0.3
, 1.6
)*2.
0(1
.2, 3
.4)
2.4
(1.5
, 4.0
)1.
9(1
.1, 3
.1)
1.9
(1.1
, 3.0
)
Som
ewhe
re e
lse
0.3
(0.1
, 0.8
)*0.
0(0
.0, 0
.1)*
0.4
(0.1
, 1.4
)*0.
00.
2(0
.0, 0
.6)*
Not
iced
spo
rts
spon
sors
hip
0.3
(0.1
, 1.1
)*0.
6(0
.2, 1
.8)*
0.3
(0.1
, 1.5
)*0.
2(0
.1, 0
.8)*
0.7
(0.3
, 1.6
)*
Not
iced
mus
ic, t
heat
er, a
rt, f
ashi
on s
pons
orsh
ip0.
4(0
.1, 1
.2)*
0.7
(0.3
, 1.7
)*0.
5(0
.2, 1
.1)*
0.3
(0.1
, 0.8
)*0.
2(0
.0, 1
.1)*
Not
iced
sm
okel
ess
toba
cco
prom
otio
ns
Free
sam
ples
0.7
(0.3
, 1.7
)*0.
4(0
.2, 0
.8)*
1.1
(0.5
, 2.2
)*1.
1(0
.5, 2
.3)*
0.4
(0.2
, 0.9
)*
Sale
pri
ces
0.7
(0.3
, 1.3
)*0.
6(0
.3, 1
.2)*
0.4
(0.2
, 0.9
)*0.
5(0
.3, 1
.1)*
1.0
(0.5
, 2.1
)*
Coup
ons
0.4
(0.2
, 0.9
)*0.
3(0
.1, 0
.7)*
1.4
(0.8
, 2.6
)*0.
6(0
.3, 1
.2)*
0.3
(0.1
, 0.6
)*
Free
gift
s/di
scou
nts
on o
ther
pro
duct
s0.
7(0
.4, 1
.3)*
0.3
(0.1
, 0.7
)*0.
8(0
.4, 1
.7)*
0.7
(0.3
, 1.3
)*0.
8(0
.4, 1
.6)*
Clot
hing
/ite
m w
ith b
rand
nam
e or
logo
0.6
(0.2
, 1.3
)*1.
8(1
.0, 3
.4)
1.8
(1.0
, 3.2
)1.
7(1
.0, 2
.9)
0.9
(0.5
, 1.7
)*
Mai
l pro
mot
ing
smok
eles
s to
bacc
o0.
1(0
.0, 0
.3)*
0.2
(0.1
, 0.5
)*0.
9(0
.4, 2
.2)*
1.4
(0.5
, 3.9
)*0.
7(0
.2, 3
.1)*
Not
iced
any
sm
okel
ess
toba
cco
adve
rtis
emen
t,sp
onso
rshi
p, o
r pro
mot
ion
84.1
(76.
6, 8
9.6)
69.4
(62.
0, 7
6.0)
74.7
(66.
7, 8
1.3)
73.1
(65.
3, 7
9.6)
51.7
(43.
3, 6
0.0)
* Es
timat
e ba
sed
on fe
wer
than
25
unw
eigh
ted
case
s.

133
GATS Bangladesh Report-2009Ta
ble
8.3G
: Per
cent
age
of c
urre
nt s
mok
eles
s to
bacc
o us
ers ≥1
5 ye
ars
old,
who
not
iced
sm
okel
ess
toba
cco
mar
ketin
g du
ring
the
last
30
days
in v
ario
us p
lace
s, b
y se
lect
ed d
emog
raph
ic c
hara
cter
istic
s–G
ATS
Bang
lade
sh, 2
009.
Plac
esO
vera
llG
ende
rA
ge (y
ears
)Re
side
nce
Mal
eFe
mal
e15
-24
≥25
Urb
anRu
ral
Perc
enta
ge (9
5% C
I)N
otic
ed a
dver
tisem
ents
In s
tore
s14
.2(1
1.7,
17.
3)14
.3(1
1.1,
18.
1)14
.1(1
0.3,
19.
1)10
.4(5
.3, 1
9.3)
*14
.6(1
1.9,
17.
7)14
.3(1
0.1,
19.
9)14
.2(1
1.2,
17.
8)
On
tele
visi
on4.
3(2
.9, 6
.5)
5.7
(3.5
, 9.0
)2.
7(1
.5, 4
.9)*
4.8
(1.6
, 13.
2)*
4.3
(2.8
, 6.4
)5.
1(2
.5, 1
0.0)
4.1
(2.4
, 6.7
)
On
the
radi
o1.
8(0
.9, 3
.4)*
0.4
(0.1
, 1.3
)*3.
6(1
.7, 7
.4)*
0.2
(0.0
, 1.4
)*2.
0(1
.0, 3
.8)*
2.2
(0.9
, 5.3
)*1.
7(0
.7, 3
.9)*
On
billb
oard
s2.
6(1
.4, 4
.6)
3.8
(2.0
, 7.3
)0.
7(0
.3, 1
.7)*
1.2
(0.2
, 7.8
)*2.
7(1
.5, 4
.8)
2.1
(1.3
, 3.6
)*2.
7(1
.3, 5
.5)*
On
post
ers
4.5
(3.1
, 6.6
)6.
5(4
.2, 9
.8)
1.7
(0.8
, 3.4
)*5.
2(2
.1, 1
2.3)
*4.
5(3
.0, 6
.5)
4.2
(2.8
, 6.2
)4.
6(2
.9, 7
.3)
In n
ewsp
aper
s1.
4(0
.8, 2
.6)*
1.7
(0.9
, 3.3
)*0.
7(0
.1, 3
.5)*
1.5
(0.2
, 9.9
)*1.
4(0
.7, 2
.5)*
3.1
(1.4
, 6.4
)*0.
8(0
.3, 2
.1)*
In m
agaz
ines
0.0
0.0
0.0
0.0
0.0
0.0
0.0
In c
inem
as5.
7(3
.4, 9
.4)
9.4
(5.5
, 15.
5)0.
8(0
.3, 2
.2)*
11.1
(4.5
, 24.
8)*
5.1
(2.9
, 8.6
)6.
9(3
.4, 1
3.6)
5.2
(2.6
, 10.
2)*
On
the
Inte
rnet
0.4
(0.1
, 2.8
)*0.
6(0
.1, 4
.1)*
0.0
0.0
0.4
(0.1
, 3.2
)*0.
00.
5(0
.1, 3
.8)*
On
publ
ic tr
ansp
orta
tion
4.7
(3.2
, 7.0
)7.
2(4
.6, 1
1.2)
1.8
(1.0
, 3.3
)*13
.0(5
.9, 2
6.2)
*4.
1(2
.7, 6
.2)
2.5
(1.4
, 4.4
)5.
4(3
.5, 8
.4)
On
publ
ic w
alls
1.2
(0.7
, 2.0
)1.
7(0
.9, 3
.2)*
0.6
(0.3
, 1.2
)*0.
8(0
.1, 4
.0)*
1.2
(0.7
, 2.1
)2.
0(1
.0, 3
.6)*
0.9
(0.4
, 2.0
)*
Som
ewhe
re e
lse
0.2
(0.1
, 0.7
)*0.
0(0
.0, 0
.2)*
0.4
(0.1
, 1.3
)*0.
00.
3(0
.1, 0
.7)*
0.2
(0.1
, 0.6
)*0.
2(0
.1, 0
.8)*
Not
iced
spo
rts
spon
sors
hip
0.4
(0.1
, 1.2
)*0.
8(0
.2, 2
.5)*
0.1
(0.0
, 0.4
)*1.
5(0
.2, 1
0.2)
*0.
3(0
.1, 1
.2)*
0.0
(0.0
, 0.2
)*0.
5(0
.2, 1
.6)*
Not
iced
mus
ic, t
heat
er, a
rt, f
ashi
on s
pons
orsh
ip0.
4(0
.2, 1
.0)*
0.6
(0.2
, 1.7
)*0.
3(0
.1, 1
.2)*
2.2
(0.5
, 9.4
)*0.
3(0
.1, 0
.8)*
0.9
(0.3
, 2.8
)*0.
3(0
.1, 1
.0)*
Not
iced
sm
okel
ess
toba
cco
prom
otio
ns
Free
sam
ples
0.8
(0.4
, 1.8
)*1.
2(0
.4, 3
.6)*
0.4
(0.2
, 1.0
)*0.
00.
9(0
.4, 2
.0)*
0.5
(0.2
, 1.4
)*0.
9(0
.3, 2
.3)*
Sale
pri
ces
0.8
(0.5
, 1.3
)*0.
6(0
.3, 1
.1)*
1.0
(0.5
, 1.9
)*0.
1(0
.0, 0
.8)*
0.8
(0.5
, 1.4
)*0.
9(0
.4, 2
.4)*
0.7
(0.4
, 1.3
)*
Coup
ons
0.6
(0.3
, 1.4
)*0.
8(0
.2, 2
.5)*
0.4
(0.2
, 1.1
)*3.
1(1
.0, 9
.4)*
0.4
(0.1
, 1.2
)*0.
4(0
.1, 1
.4)*
0.7
(0.3
, 1.7
)*
Free
gift
s/di
scou
nts
on o
ther
pro
duct
s0.
3(0
.2, 0
.6)*
0.2
(0.1
, 0.6
)*0.
4(0
.2, 0
.9)*
0.8
(0.2
, 3.4
)*0.
2(0
.1, 0
.5)*
0.3
(0.1
, 1.0
)*0.
3(0
.1, 0
.6)*
Clot
hing
/ite
m w
ith b
rand
nam
e or
logo
1.1
(0.6
, 2.0
)1.
8(0
.9, 3
.8)
0.4
(0.2
, 1.0
)*1.
6(0
.2, 1
0.3)
*1.
1(0
.6, 1
.9)
1.4
(0.5
, 4.0
)*1.
0(0
.5, 2
.1)*
Mai
l pro
mot
ing
smok
eles
s to
bacc
o1.
1(0
.4, 2
.6)
2.2
(0.9
, 5.4
)0.
0(0
.0, 0
.1)*
1.5
(0.4
, 5.8
)*1.
0(0
.4, 2
.6)*
0.3
(0.1
, 0.8
)*1.
3(0
.5, 3
.3)*
Not
iced
any
sm
okel
ess
toba
cco
adve
rtis
emen
t,sp
onso
rshi
p, o
r pro
mot
ion
72.9
(65.
6, 7
9.2)
73.6
(64.
3, 8
1.2)
71.8
(59.
6, 8
1.5)
75.5
(56.
2, 8
8.1)
72.6
(65.
1, 7
9.1)
69.6
(57.
6, 7
9.4)
74.0
(64.
9, 8
1.3)
* Es
timat
e ba
sed
on fe
wer
than
25
unw
eigh
ted
case
s.

134
GATS Bangladesh Report-2009Ta
ble
8.3G
(Con
t.):
Perc
enta
ge o
f cur
rent
sm
okel
ess
toba
cco
user
s ≥1
5 ye
ars
old,
who
not
iced
sm
okel
ess
toba
cco
mar
ketin
g du
ring
the
last
30
days
inva
riou
s pl
aces
, by
sele
cted
dem
ogra
phic
cha
ract
eris
tics–
GAT
S Ba
ngla
desh
, 200
9.
Plac
esW
ealt
h in
dex
Low
est
Low
Mid
dle
Hig
hH
ighe
st
Perc
enta
ge (9
5% C
I)
Not
iced
adv
ertis
emen
ts
In s
tore
s15
.1(1
1.0,
20.
4)13
.0(9
.6, 1
7.5)
18.9
(13.
3, 2
6.1)
11.8
(8.0
, 17.
0)10
.6(6
.2, 1
7.4)
On
tele
visi
on4.
1(1
.8, 9
.2)*
6.6
(3.6
, 11.
9)*
2.2
(0.9
, 5.2
)*1.
9(0
.8, 4
.4)*
9.0
(4.8
, 16.
5)*
On
the
radi
o3.
1(1
.1, 8
.8)*
1.7
(0.7
, 4.2
)*2.
0(0
.4, 1
0.0)
*0.
8(0
.2, 3
.1)*
1.7
(0.2
, 10.
9)*
On
billb
oard
s1.
7(0
.5, 5
.6)*
1.0
(0.5
, 2.3
)*5.
0(2
.6, 9
.5)*
2.8
(1.0
, 8.0
)*2.
3(0
.5, 1
0.1)
*
On
post
ers
3.8
(2.1
, 6.7
)*3.
6(2
.0, 6
.2)*
6.9
(3.9
, 11.
8)3.
8(1
.8, 8
.1)*
5.1
(2.2
, 11.
4)*
In n
ewsp
aper
s1.
0(0
.1, 6
.9)*
2.0
(0.6
, 6.5
)*0.
5(0
.1, 3
.3)*
0.8
(0.2
, 3.8
)*2.
8(1
.1, 7
.3)*
In m
agaz
ines
0.0
0.0
0.0
0.0
0.0
In c
inem
as7.
3(3
.3, 1
5.5)
*8.
7(4
.3, 1
6.6)
*2.
9(1
.2, 7
.2)*
3.7
(1.6
, 8.1
)*5.
9(1
.9, 1
7.0)
*
On
the
Inte
rnet
0.0
0.0
0.0
1.8
(0.2
, 12.
1)*
0.0
On
publ
ic tr
ansp
orta
tion
1.7
(0.8
, 3.6
)*5.
3(2
.7, 1
0.2)
*7.
6(4
.3, 1
3.3)
4.5
(2.1
, 9.3
)*4.
5(1
.8, 1
0.6)
*
On
publ
ic w
alls
0.3
(0.1
, 1.2
)*0.
7(0
.3, 2
.1)*
2.8
(1.1
, 6.8
)*0.
9(0
.3, 2
.5)*
1.6
(0.6
, 4.0
)*
Som
ewhe
re e
lse
0.4
(0.1
, 1.8
)*0.
0(0
.0, 0
.3)*
0.5
(0.1
, 3.3
)*0.
00.
3(0
.1, 1
.3)*
Not
iced
spo
rts
spon
sors
hip
0.3
(0.0
, 2.3
)*0.
5(0
.1, 2
.6)*
0.9
(0.1
, 6.1
)*0.
0(0
.0, 0
.2)*
0.0
Not
iced
mus
ic, t
heat
er, a
rt, f
ashi
on s
pons
orsh
ip0.
5(0
.1, 2
.4)*
0.7
(0.2
, 2.8
)*0.
7(0
.2, 2
.8)*
0.0
(0.0
, 0.2
)*0.
0
Not
iced
sm
okel
ess
toba
cco
prom
otio
ns
Free
sam
ples
0.4
(0.1
, 1.4
)*0.
3(0
.1, 1
.3)*
0.3
(0.1
, 1.5
)*2.
4(0
.6, 8
.7)*
0.9
(0.2
, 3.3
)*
Sale
pri
ces
0.6
(0.2
, 1.8
)*1.
1(0
.5, 2
.3)*
0.3
(0.1
, 1.7
)*0.
5(0
.2, 1
.6)*
1.7
(0.5
, 5.4
)*
Coup
ons
0.5
(0.1
, 1.9
)*0.
1(0
.0, 0
.7)*
1.9
(0.6
, 5.9
)*0.
3(0
.1, 1
.3)*
0.4
(0.0
, 2.5
)*
Free
gift
s/di
scou
nts
on o
ther
pro
duct
s0.
3(0
.1, 1
.2)*
0.5
(0.2
, 1.4
)*0.
2(0
.0, 1
.3)*
0.0
(0.0
, 0.2
)*0.
5(0
.1, 2
.2)*
Clot
hing
/ite
m w
ith b
rand
nam
e or
logo
0.2
(0.1
, 0.9
)*0.
9(0
.4, 2
.0)*
2.8
(1.1
, 7.1
)*1.
2(0
.5, 3
.4)*
0.1
(0.0
, 0.6
)*
Mai
l pro
mot
ing
smok
eles
s to
bacc
o0.
2(0
.0, 1
.0)*
0.5
(0.2
, 1.5
)*2.
5(1
.0, 6
.2)*
1.2
(0.2
, 5.9
)*1.
6(0
.3, 7
.9)*
Not
iced
any
sm
okel
ess
toba
cco
adve
rtis
emen
t,sp
onso
rshi
p, o
r pro
mot
ion
85.5
(73.
6, 9
2.6)
67.4
(56.
8, 7
6.4)
80.1
(69.
1, 8
7.8)
64.3
(49.
6, 7
6.7)
63.7
(46.
2, 7
8.2)
* Es
timat
e ba
sed
on fe
wer
than
25
unw
eigh
ted
case
s.

135
GATS Bangladesh Report-2009Ta
ble
8.3H
: Per
cent
age
of c
urre
nt n
on-s
mok
eles
s to
bacc
o us
ers ≥1
5 ye
ars
old,
who
not
iced
sm
okel
ess
toba
cco
mar
ketin
g du
ring
the
last
30 d
ays
in v
ario
us p
lace
s, b
y se
lect
ed d
emog
raph
ic c
hara
cter
istic
s–G
ATS
Bang
lade
sh, 2
009.
Plac
esO
vera
llG
ende
rA
ge (y
ears
)Re
side
nce
Mal
eFe
mal
e15
-24
≥25
Urb
anRu
ral
Perc
enta
ge (9
5% C
I)
Not
iced
adv
ertis
emen
ts
In s
tore
s12
.7(1
0.9,
14.
7)12
.5(1
0.2,
15.
1)12
.9(1
0.1,
16.
4)12
.9(1
0.5,
15.
8)12
.5(1
0.6,
14.
8)10
.0(7
.7, 1
2.9)
13.7
(11.
4, 1
6.3)
On
tele
visi
on3.
1(2
.2, 4
.2)
2.4
(1.5
, 3.8
)3.
8(2
.5, 5
.7)
3.8
(2.6
, 5.5
)2.
5(1
.8, 3
.6)
2.5
(1.6
, 3.8
)3.
4(2
.2, 5
.0)
On
the
radi
o1.
0(0
.5, 1
.8)*
0.3
(0.1
, 0.9
)*1.
8(0
.9, 3
.8)*
0.4
(0.1
, 1.3
)*1.
4(0
.8, 2
.5)*
0.2
(0.1
, 0.6
)*1.
3(0
.6, 2
.4)*
On
billb
oard
s2.
7(1
.9, 3
.8)
3.6
(2.4
, 5.4
)1.
3(0
.6, 2
.7)
2.5
(1.4
, 4.4
)2.
8(1
.9, 4
.1)
1.5
(1.0
, 2.3
)3.
2(2
.1, 4
.8)
On
post
ers
3.7
(2.9
, 4.7
)5.
1(3
.9, 6
.6)
1.7
(1.0
, 3.0
)3.
0(2
.0, 4
.6)
4.2
(3.2
, 5.3
)2.
8(2
.0, 4
.1)
4.1
(3.1
, 5.4
)
In n
ewsp
aper
s1.
2(0
.7, 2
.0)
1.5
(0.8
, 2.8
)*0.
6(0
.3, 1
.5)*
1.5
(0.7
, 3.2
)*1.
0(0
.5, 2
.0)*
1.2
(0.6
, 2.4
)*1.
2(0
.6, 2
.4)*
In m
agaz
ines
0.7
(0.3
, 1.4
)*1.
1(0
.5, 2
.4)*
0.1
(0.0
, 0.6
)*0.
2(0
.1, 0
.9)*
1.0
(0.4
, 2.3
)*0.
6(0
.2, 1
.8)*
0.7
(0.3
, 1.8
)*
In c
inem
as2.
3(1
.6, 3
.3)
3.4
(2.2
, 5.2
)0.
9(0
.5, 1
.8)*
2.3
(1.4
, 3.7
)2.
3(1
.4, 3
.6)
3.5
(2.0
, 5.8
)1.
7(1
.1, 2
.8)*
On
the
Inte
rnet
0.1
(0.0
, 0.8
)*0.
2(0
.0, 1
.4)*
0.0
0.0
0.2
(0.0
, 1.4
)*0.
00.
2(0
.0, 1
.4)*
On
publ
ic tr
ansp
orta
tion
3.0
(2.2
, 3.9
)4.
0(2
.9, 5
.6)
1.6
(1.0
, 2.6
)3.
5(2
.3, 5
.3)
2.6
(1.9
, 3.6
)2.
1(1
.4, 3
.0)
3.3
(2.4
, 4.7
)
On
publ
ic w
alls
2.1
(1.5
, 2.9
)3.
3(2
.3, 4
.8)
0.5
(0.2
, 0.9
)*1.
6(1
.0, 2
.7)*
2.3
(1.6
, 3.4
)1.
6(0
.9, 2
.6)
2.3
(1.5
, 3.4
)
Som
ewhe
re e
lse
0.2
(0.1
, 0.5
)*0.
2(0
.0, 1
.0)*
0.1
(0.0
, 0.4
)*0.
3(0
.1, 1
.0)*
0.1
(0.0
, 0.3
)*0.
1(0
.0, 0
.5)*
0.2
(0.1
, 0.6
)*
Not
iced
spo
rts
spon
sors
hip
0.4
(0.2
, 0.8
)0.
5(0
.2, 1
.2)*
0.4
(0.2
, 0.8
)*0.
5(0
.2, 1
.0)*
0.4
(0.2
, 0.8
)*0.
4(0
.2, 1
.1)*
0.4
(0.2
, 1.0
)*
Not
iced
mus
ic, t
heat
er, a
rt, f
ashi
onsp
onso
rshi
p0.
4(0
.2, 0
.8)*
0.5
(0.2
, 1.2
)*0.
3(0
.1, 0
.8)*
0.4
(0.1
, 0.9
)*0.
5(0
.2, 0
.9)*
0.4
(0.1
, 1.2
)*0.
4(0
.2, 0
.9)*
Not
iced
sm
okel
ess
toba
cco
prom
otio
ns
Free
sam
ples
0.7
(0.5
, 1.1
)1.
1(0
.6, 1
.8)
0.4
(0.2
, 0.7
)*1.
0(0
.6, 1
.8)*
0.6
(0.4
, 0.9
)0.
5(0
.3, 0
.9)*
0.8
(0.5
, 1.4
)
Sale
pri
ces
0.6
(0.3
, 0.9
)0.
2(0
.1, 0
.5)*
0.9
(0.5
, 1.6
)*0.
7(0
.4, 1
.4)*
0.4
(0.2
, 0.8
)*0.
6(0
.3, 1
.3)*
0.5
(0.3
, 1.0
)*
Coup
ons
0.6
(0.4
, 1.0
)0.
7(0
.4, 1
.2)*
0.5
(0.2
, 1.2
)*0.
7(0
.4, 1
.4)*
0.6
(0.3
, 0.9
)*0.
4(0
.2, 0
.7)*
0.7
(0.4
, 1.2
)*
Free
gift
s/di
scou
nts
on o
ther
pro
duct
s0.
8(0
.5, 1
.1)
0.5
(0.3
, 1.0
)*1.
0(0
.6, 1
.7)
1.0
(0.5
, 1.7
)*0.
6(0
.4, 1
.0)
0.6
(0.4
, 1.0
)*0.
8(0
.5, 1
.3)
Clot
hing
/ite
m w
ith b
rand
nam
e or
logo
1.5
(1.0
, 2.3
)2.
5(1
.6, 4
.0)
0.5
(0.3
, 1.0
)*1.
5(0
.9, 2
.4)
1.6
(1.0
, 2.5
)1.
1(0
.7, 1
.7)
1.7
(1.1
, 2.8
)
Mai
l pro
mot
ing
smok
eles
s to
bacc
o0.
5(0
.2, 1
.3)*
0.9
(0.3
, 2.5
)*0.
1(0
.0, 0
.2)*
0.6
(0.2
, 2.0
)*0.
5(0
.1, 1
.7)*
0.8
(0.1
, 3.9
)*0.
4(0
.1, 1
.1)*
Not
iced
any
sm
okel
ess
toba
cco
adve
rtis
emen
t, s
pons
orsh
ip, o
r pro
mot
ion
69.5
(63.
9, 7
4.6)
69.7
(62.
3, 7
6.2)
69.2
(60.
7, 7
6.6)
71.8
(64.
3, 7
8.2)
68.0
(61.
9, 7
3.5)
58.3
(50.
5, 6
5.7)
74.1
(66.
6, 8
0.4)
* Es
timat
e ba
sed
on fe
wer
than
25
unw
eigh
ted
case
s.

136
GATS Bangladesh Report-2009Ta
ble
8.3H
(Con
t.):
Perc
enta
ge o
f cur
rent
non
-sm
okel
ess
toba
cco
user
s ≥1
5 ye
ars
old,
who
not
iced
sm
okel
ess
toba
cco
mar
ketin
g du
ring
the
last
30
days
in v
ario
us p
lace
s, b
y se
lect
ed d
emog
raph
ic c
hara
cter
istic
s–G
ATS
Bang
lade
sh, 2
009.
Plac
esW
ealt
h in
dex
Low
est
Low
Mid
dle
Hig
hH
ighe
st
Perc
enta
ge (9
5% C
I)
Not
iced
adv
ertis
emen
ts
In s
tore
s12
.1(9
.0, 1
6.0)
13.0
(10.
2, 1
6.5)
13.2
(10.
3, 1
6.8)
15.2
(12.
0, 1
9.1)
8.5
(6.5
, 11.
0)
On
tele
visi
on2.
0(1
.0, 4
.2)*
3.7
(2.1
, 6.3
)3.
7(2
.2, 6
.1)
3.5
(2.2
, 5.5
)1.
9(1
.0, 3
.5)
On
the
radi
o2.
5(1
.0, 6
.3)*
1.0
(0.3
, 3.1
)*1.
4(0
.6, 3
.4)*
0.4
(0.1
, 1.6
)*0.
0
On
billb
oard
s1.
8(0
.7, 4
.5)*
2.7
(1.5
, 4.9
)2.
4(1
.2, 4
.6)*
3.8
(2.3
, 6.1
)2.
0(1
.1, 3
.7)
On
post
ers
2.7
(1.5
, 4.8
)*5.
1(3
.4, 7
.7)
2.7
(1.7
, 4.4
)4.
2(2
.9, 6
.2)
3.1
(1.9
, 5.0
)
In n
ewsp
aper
s0.
8(0
.2, 3
.3)*
1.9
(0.6
, 6.2
)*1.
3(0
.4, 3
.6)*
0.6
(0.2
, 2.3
)*1.
5(0
.6, 3
.5)*
In m
agaz
ines
0.0
1.8
(0.5
, 6.1
)*0.
7(0
.2, 2
.9)*
0.1
(0.0
, 1.1
)*0.
6(0
.2, 2
.0)*
In c
inem
as2.
7(1
.4, 5
.2)*
3.6
(1.7
, 7.2
)*2.
1(1
.0, 4
.5)*
1.5
(0.7
, 3.3
)*1.
9(1
.0, 3
.5)*
On
the
Inte
rnet
0.0
0.0
0.0
0.6
(0.1
, 4.3
)*0.
0
On
publ
ic tr
ansp
orta
tion
1.7
(0.7
, 3.9
)*3.
3(1
.8, 5
.8)
2.9
(1.8
, 4.7
)4.
2(2
.8, 6
.4)
2.0
(1.1
, 3.5
)
On
publ
ic w
alls
0.9
(0.4
, 2.3
)*2.
6(1
.4, 4
.6)
2.3
(1.3
, 4.0
)*2.
2(1
.2, 3
.8)
1.9
(1.1
, 3.3
)
Som
ewhe
re e
lse
0.3
(0.1
, 1.0
)*0.
00.
4(0
.1, 1
.9)*
0.0
0.1
(0.0
, 0.8
)*
Not
iced
spo
rts
spon
sors
hip
0.3
(0.1
, 1.6
)*0.
6(0
.1, 2
.5)*
0.1
(0.0
, 0.9
)*0.
3(0
.1, 1
.0)*
0.9
(0.4
, 1.9
)*
Not
iced
mus
ic, t
heat
er, a
rt, f
ashi
on s
pons
orsh
ip0.
3(0
.1, 1
.6)*
0.7
(0.2
, 2.1
)*0.
4(0
.1, 1
.3)*
0.4
(0.1
, 1.1
)*0.
3(0
.1, 1
.4)*
Not
iced
sm
okel
ess
toba
cco
prom
otio
ns
Free
sam
ples
0.9
(0.3
, 2.5
)*0.
4(0
.2, 1
.0)*
1.3
(0.6
, 2.9
)*0.
7(0
.4, 1
.3)*
0.3
(0.1
, 0.8
)*
Sale
pri
ces
0.7
(0.3
, 1.7
)*0.
4(0
.1, 1
.2)*
0.4
(0.1
, 1.2
)*0.
5(0
.2, 1
.2)*
0.9
(0.3
, 2.2
)*
Coup
ons
0.4
(0.2
, 0.9
)*0.
4(0
.2, 1
.0)*
1.2
(0.6
, 2.6
)*0.
7(0
.3, 1
.5)*
0.3
(0.1
, 0.7
)*
Free
gift
s/di
scou
nts
on o
ther
pro
duct
s1.
0(0
.5, 1
.7)*
0.2
(0.1
, 0.6
)*1.
0(0
.5, 2
.2)*
0.9
(0.4
, 1.7
)*0.
8(0
.4, 1
.9)*
Clot
hing
/ite
m w
ith b
rand
nam
e or
logo
0.7
(0.3
, 2.0
)*2.
3(1
.1, 4
.5)
1.4
(0.8
, 2.8
)*1.
8(1
.0, 3
.4)
1.1
(0.6
, 2.0
)*
Mai
l pro
mot
ing
smok
eles
s to
bacc
o0.
00.
0(0
.0, 0
.0)*
0.3
(0.1
, 1.2
)*1.
4(0
.5, 4
.5)*
0.6
(0.1
, 2.1
)*
Not
iced
any
sm
okel
ess
toba
cco
adve
rtis
emen
t,sp
onso
rshi
p, o
r pro
mot
ion
83.1
(74.
4, 8
9.3)
70.5
(61.
7, 7
8.1)
72.6
(63.
0, 8
0.5)
75.8
(67.
8, 8
2.3)
49.4
(40.
8, 5
8.1)
* Es
timat
e ba
sed
on fe
wer
than
25
unw
eigh
ted
case
s.

Despite conclusive evidence on the dangers of tobacco relatively few tobacco user understand the fullextent of the health risks. People may know generally that tobacco use is harmful but they may notname specific diseases caused by smoking other than lung cancer.5 It has been shown that knowledgeof specific harms of tobacco helps increase in people’s motivation for quitting.
This chapter presents the beliefs among the population aged 15 years and older about the healtheffects of tobacco use in various forms, such as smoked and smokeless tobacco, as well as of theadverse health effects caused by exposure to other people’s smoke.
Key findings:
• 97.4% of adults believe that smoking causes serious illness.
• 93.4% of adults believe that exposure to other people’s smoke causes seriousillness in non-smokers.
• 92.7% of adults believe smokeless tobacco use causes serious illness.
• 81% of adults including the smokers favored raising tax on tobacco products.
9.1 Beliefs about health effects of tobacco use
9.1.1 Health effects of tobacco smoking
The survey collects information on general beliefs about the health effects of tobacco smoking amongthe population aged 15 years and older, as well as on its role in causing various diseases. Table 9.1shows the percentages of adults who believe that smoking causes serious illness, stroke, heart attack,lung cancer and long-term respiratory distress by current smoking status and selected demographiccharacteristics. Overall, most of the adult population in Bangladesh believes that smoking causesserious illnesses (97.4%) and this knowledge did not differ according to various demographiccharacteristics. However, knowledge about specific diseases caused by smoking varied among adults.A vast majority of adults reported that smoking causes stroke (81.6%), lung cancer (91.5%), long-termrespiratory distress (90.3%), and heart attack (85.9%). More males compared to females believe thatsmoking causes stroke (87.2% and 76.0%, respectively), heart attack (90.2% and 81.6%), lung cancer(94.2% and 88.9%) and long-term respiratory distress (91.8% and 88.8%). Knowledge about varioushealth effects was found more among young adults aged 15-24 years (stroke, 83.8%; heart attack,88.3%; lung cancer, 93.8% and long-term respiratory distress, 91.4%), urban population (stroke, 86.3%;heart attack, 90.3%; lung cancer, 94.6%; and long-term respiratory distress, 92.0%), those withsecondary school education and above (stroke, 92.3%; heart attack, 96.4%; lung cancer, 97.9%; andlong-term respiratory distress, 96.8%) and in the highest SES level (stroke, 86.9%; heart attack, 91.8%;lung cancer, 94.9%; and long-term respiratory distress, 93.0%). When looking at the differences bysmoking status, in general, non-smokers reported to have more knowledge on any specific diseasecaused by smoking compared to current smokers.
Among the current tobacco smokers, most of them (96.8%) believe that smoking tobacco causesserious illness and other diseases such as stroke (84.2%), heart attack (87.0%), lung cancer (92.0%)and long-term respiratory distress (89.9%). By gender, the female population (86.1%) knew less thanthe male population (97.1%) about the effect on overall serious illness, and also for stroke (38.0% and85%), heart attack (51.7% and 88%), lung cancer (60.7% and 93%) and long-term respiratory diseases(68.1% and 90.2%). The population aged 65 years and above knew less about health hazards thanother groups. Current smokers living in urban areas with higher education levels and higher SES had
137
GATS Bangladesh Report-2009
9. Knowledge, attitudes and perceptions
more knowledge about different diseases caused by smoking. The highest knowledge was foundamong the businessman current smoker (98.7%) followed by employed, farmers and laborers (96.0%,97.1% and 96.9%), whereas homemakers and students had the least knowledge (84.3% and 89.5%).
Among non-smokers, 97.6% believed that smoking causes serious illness and diseases such asstroke (80.8.2%), heart attack (85.5.0%), lung cancer (91.4%) and long-term respiratory distress(90.4%). Similar percentages of non-smoking males and females believe that smoking cause seriousillness (98.0% and 97.3%); however, higher percentage of men believe that smoking causes diseasesuch as stroke (88.3%), heart attack (91.7%), lung cancer (95.2%), and long-term respiratory distress(92.6%). The population aged 65 years and above know less about health hazards than other groups(91.9%). Non-smokers living in urban areas, those with higher education levels and higher SES hadmore knowledge about different diseases caused by smoking.
138
GATS Bangladesh Report-2009

139
GATS Bangladesh Report-2009Ta
ble
9.1:
Per
cent
age
of a
dults
≥15
yea
rs o
ld, w
ho b
elie
ve t
hat
smok
ing
caus
es s
erio
us il
lnes
s, s
trok
e, h
eart
att
ack,
lung
can
cer,
or lo
ng-
term
resp
irato
ry d
istr
ess,
by
smok
ing
stat
us a
nd s
elec
ted
dem
ogra
phic
cha
ract
eris
tics–
GAT
S Ba
ngla
desh
, 200
9.
Dem
ogra
phic
char
acte
rist
ics
Adu
lts
who
bel
ieve
that
sm
okin
g ca
uses
:
Seri
ous
illne
ssSt
roke
Hea
rt a
ttac
kLu
ng c
ance
rLo
ng-t
erm
resp
irat
ory
dist
ress
Perc
enta
ge (9
5% C
I)
Ove
rall
97.4
(96.
8, 9
7.8)
81.6
(79.
8, 8
3.2)
85.9
(84.
5, 8
7.2)
91.5
(90.
5, 9
2.5)
90.3
(89.
2, 9
1.3)
Gen
der
Mal
e97
.6(9
6.8,
98.
2)87
.2(8
5.0,
89.
1)90
.2(8
8.6,
91.
6)94
.2(9
3.0,
95.
2)91
.8(9
0.3,
93.
0)
Fem
ale
97.2
(96.
4, 9
7.8)
76.0
(73.
5, 7
8.4)
81.6
(79.
5, 8
3.6)
88.9
(87.
2, 9
0.3)
88.8
(87.
3, 9
0.2)
Age
(yea
rs)
15-2
498
.0(9
6.9,
98.
7)83
.8(8
1.5,
86.
0)88
.3(8
6.2,
90.
1)93
.8(9
2.2,
95.
1)91
.4(8
9.5,
92.
9)
25-4
498
.2(9
7.7,
98.
6)82
.7(8
0.5,
84.
7)86
.8(8
5.1,
88.
4)92
.5(9
1.3,
93.
6)91
.0(8
9.6,
92.
3)
45-6
496
.3(9
5.0,
97.
4)79
.8(7
7.1,
82.
3)84
.6(8
2.0,
86.
9)89
.9(8
7.8,
91.
7)90
.2(8
8.4,
91.
7)
65+
92.7
(89.
0, 9
5.3)
69.6
(64.
4, 7
4.3)
72.7
(67.
6, 7
7.3)
79.4
(74.
6, 8
3.5)
80.9
(76.
3, 8
4.7)
Resi
denc
e
Urb
an97
.5(9
6.7,
98.
1)86
.3(8
3.9,
88.
5)90
.3(8
8.3,
92.
1)94
.6(9
3.2,
95.
6)92
.0(9
0.3,
93.
5)
Rura
l97
.3(9
6.7,
97.
9)79
.9(7
7.8,
81.
8)84
.3(8
2.6,
85.
8)90
.4(8
9.1,
91.
6)89
.7(8
8.3,
90.
9)
Educ
atio
n le
vel
No
form
al e
duca
tion
95.5
(94.
3, 9
6.4)
73.9
(71.
2, 7
6.4)
78.3
(76.
1, 8
0.3)
85.8
(83.
9, 8
7.5)
84.5
(82.
6, 8
6.2)
Less
than
pri
mar
y97
.9(9
6.8,
98.
6)79
.6(7
6.2,
82.
5)83
.7(8
0.8,
86.
3)91
.2(8
8.7,
93.
2)90
.1(8
7.8,
92.
0)
Prim
ary
98.9
(97.
7, 9
9.4)
82.3
(78.
7, 8
5.3)
86.2
(82.
7, 8
9.1)
92.3
(89.
9, 9
4.2)
91.8
(89.
3, 9
3.8)
Less
than
sec
onda
ry98
.9(9
8.2,
99.
3)88
.2(8
6.0,
90.
1)93
.1(9
1.4,
94.
5)96
.7(9
5.5,
97.
6)94
.6(9
2.7,
96.
1)
Seco
ndar
y an
d ab
ove
98.4
(97.
2, 9
9.1)
92.3
(90.
2, 9
4.0)
96.4
(95.
0, 9
7.3)
97.9
(96.
6, 9
8.7)
96.8
(95.
2, 9
7.9)
1 In
clud
es d
aily
and
occ
asio
nal (
less
than
dai
ly) s
mok
ers.
2In
clud
es fo
rmer
and
nev
er s
mok
ers.
* Es
timat
e ba
sed
on fe
wer
than
25
unw
eigh
ted
case
s.
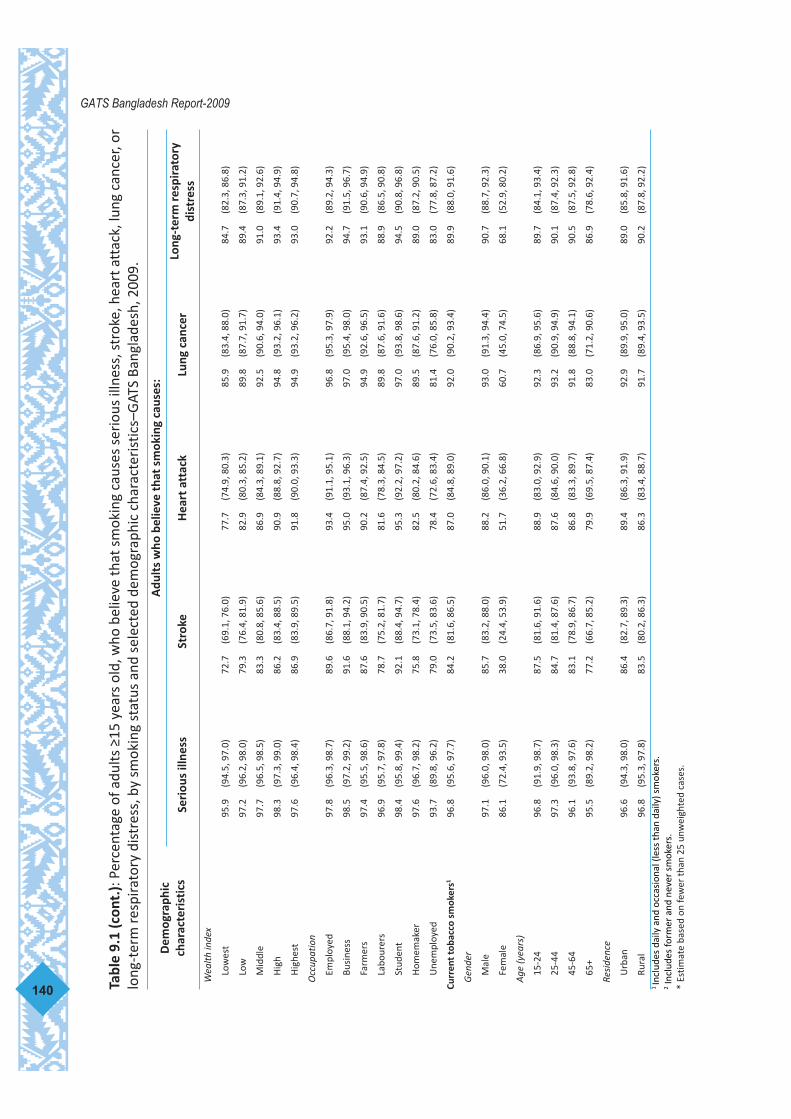
140
GATS Bangladesh Report-2009Ta
ble
9.1
(con
t.):
Per
cent
age
of a
dults
≥15
yea
rs o
ld, w
ho b
elie
ve th
at s
mok
ing
caus
es s
erio
us il
lnes
s, s
trok
e, h
eart
att
ack,
lung
can
cer,
orlo
ng-t
erm
resp
irato
ry d
istr
ess,
by
smok
ing
stat
us a
nd s
elec
ted
dem
ogra
phic
cha
ract
eris
tics–
GAT
S Ba
ngla
desh
, 200
9.
Dem
ogra
phic
char
acte
rist
ics
Adu
lts
who
bel
ieve
that
sm
okin
g ca
uses
:
Seri
ous
illne
ssSt
roke
Hea
rt a
ttac
kLu
ng c
ance
rLo
ng-t
erm
resp
irat
ory
dist
ress
Wea
lth in
dex
Low
est
95.9
(94.
5, 9
7.0)
72.7
(69.
1, 7
6.0)
77.7
(74.
9, 8
0.3)
85.9
(83.
4, 8
8.0)
84.7
(82.
3, 8
6.8)
Low
97.2
(96.
2, 9
8.0)
79.3
(76.
4, 8
1.9)
82.9
(80.
3, 8
5.2)
89.8
(87.
7, 9
1.7)
89.4
(87.
3, 9
1.2)
Mid
dle
97.7
(96.
5, 9
8.5)
83.3
(80.
8, 8
5.6)
86.9
(84.
3, 8
9.1)
92.5
(90.
6, 9
4.0)
91.0
(89.
1, 9
2.6)
Hig
h98
.3(9
7.3,
99.
0)86
.2(8
3.4,
88.
5)90
.9(8
8.8,
92.
7)94
.8(9
3.2,
96.
1)93
.4(9
1.4,
94.
9)
Hig
hest
97.6
(96.
4, 9
8.4)
86.9
(83.
9, 8
9.5)
91.8
(90.
0, 9
3.3)
94.9
(93.
2, 9
6.2)
93.0
(90.
7, 9
4.8)
Occ
upat
ion
Empl
oyed
97.8
(96.
3, 9
8.7)
89.6
(86.
7, 9
1.8)
93.4
(91.
1, 9
5.1)
96.8
(95.
3, 9
7.9)
92.2
(89.
2, 9
4.3)
Busi
ness
98.5
(97.
2, 9
9.2)
91.6
(88.
1, 9
4.2)
95.0
(93.
1, 9
6.3)
97.0
(95.
4, 9
8.0)
94.7
(91.
5, 9
6.7)
Farm
ers
97.4
(95.
5, 9
8.6)
87.6
(83.
9, 9
0.5)
90.2
(87.
4, 9
2.5)
94.9
(92.
6, 9
6.5)
93.1
(90.
6, 9
4.9)
Labo
urer
s96
.9(9
5.7,
97.
8)78
.7(7
5.2,
81.
7)81
.6(7
8.3,
84.
5)89
.8(8
7.6,
91.
6)88
.9(8
6.5,
90.
8)
Stud
ent
98.4
(95.
8, 9
9.4)
92.1
(88.
4, 9
4.7)
95.3
(92.
2, 9
7.2)
97.0
(93.
8, 9
8.6)
94.5
(90.
8, 9
6.8)
Hom
emak
er97
.6(9
6.7,
98.
2)75
.8(7
3.1,
78.
4)82
.5(8
0.2,
84.
6)89
.5(8
7.6,
91.
2)89
.0(8
7.2,
90.
5)
Une
mpl
oyed
93.7
(89.
8, 9
6.2)
79.0
(73.
5, 8
3.6)
78.4
(72.
6, 8
3.4)
81.4
(76.
0, 8
5.8)
83.0
(77.
8, 8
7.2)
Curr
ent t
obac
co s
mok
ers1
96.8
(95.
6, 9
7.7)
84.2
(81.
6, 8
6.5)
87.0
(84.
8, 8
9.0)
92.0
(90.
2, 9
3.4)
89.9
(88.
0, 9
1.6)
Gen
der
Mal
e97
.1(9
6.0,
98.
0)85
.7(8
3.2,
88.
0)88
.2(8
6.0,
90.
1)93
.0(9
1.3,
94.
4)90
.7(8
8.7,
92.
3)
Fem
ale
86.1
(72.
4, 9
3.5)
38.0
(24.
4, 5
3.9)
51.7
(36.
2, 6
6.8)
60.7
(45.
0, 7
4.5)
68.1
(52.
9, 8
0.2)
Age
(yea
rs)
15-2
496
.8(9
1.9,
98.
7)87
.5(8
1.6,
91.
6)88
.9(8
3.0,
92.
9)92
.3(8
6.9,
95.
6)89
.7(8
4.1,
93.
4)
25-4
497
.3(9
6.0,
98.
3)84
.7(8
1.4,
87.
6)87
.6(8
4.6,
90.
0)93
.2(9
0.9,
94.
9)90
.1(8
7.4,
92.
3)
45-6
496
.1(9
3.8,
97.
6)83
.1(7
8.9,
86.
7)86
.8(8
3.3,
89.
7)91
.8(8
8.8,
94.
1)90
.5(8
7.5,
92.
8)
65+
95.5
(89.
2, 9
8.2)
77.2
(66.
7, 8
5.2)
79.9
(69.
5, 8
7.4)
83.0
(71.
2, 9
0.6)
86.9
(78.
6, 9
2.4)
Resi
denc
e
Urb
an96
.6(9
4.3,
98.
0)86
.4(8
2.7,
89.
3)89
.4(8
6.3,
91.
9)92
.9(8
9.9,
95.
0)89
.0(8
5.8,
91.
6)
Rura
l96
.8(9
5.3,
97.
8)83
.5(8
0.2,
86.
3)86
.3(8
3.4,
88.
7)91
.7(8
9.4,
93.
5)90
.2(8
7.8,
92.
2)1 In
clud
es d
aily
and
occ
asio
nal (
less
than
dai
ly) s
mok
ers.
2In
clud
es fo
rmer
and
nev
er s
mok
ers.
* Es
timat
e ba
sed
on fe
wer
than
25
unw
eigh
ted
case
s.

141
GATS Bangladesh Report-2009Ta
ble
9.1
(con
t.):
Per
cent
age
of a
dults
≥15
yea
rs o
ld, w
ho b
elie
ve th
at s
mok
ing
caus
es s
erio
us il
lnes
s, s
trok
e, h
eart
att
ack,
lung
can
cer,
orlo
ng-t
erm
resp
irato
ry d
istr
ess,
by
smok
ing
stat
us a
nd s
elec
ted
dem
ogra
phic
cha
ract
eris
tics–
GAT
S Ba
ngla
desh
, 200
9.D
emog
raph
ic c
hara
cter
isti
csA
dult
s w
ho b
elie
ve th
at s
mok
ing
caus
es:
Seri
ous
illne
ssSt
roke
Hea
rt a
ttac
kLu
ng c
ance
rLo
ng-t
erm
resp
irat
ory
dist
ress
Educ
atio
n le
vel
No
form
al e
duca
tion
96.2
(94.
2, 9
7.5)
79.8
(75.
9, 8
3.2)
82.3
(78.
9, 8
5.3)
89.1
(86.
0, 9
1.5)
86.7
(83.
6, 8
9.2)
Less
than
pri
mar
y96
.1(9
3.1,
97.
8)83
.1(7
7.3,
87.
7)86
.5(8
1.2,
90.
5)92
.5(8
8.4,
95.
2)90
.8(8
6.4,
93.
9)
Prim
ary
99.1
(97.
0, 9
9.7)
83.7
(75.
5, 8
9.6)
89.5
(82.
6, 9
3.9)
96.0
(91.
7, 9
8.1)
91.9
(86.
0, 9
5.5)
Less
than
sec
onda
ry97
.9(9
4.5,
99.
2)93
.1(8
7.8,
96.
2)95
.9(9
2.0,
98.
0)96
.4(9
2.8,
98.
2)94
.2(9
0.5,
96.
6)
Seco
ndar
y an
d ab
ove
96.8
(91.
8, 9
8.8)
94.6
(89.
8, 9
7.2)
94.9
(89.
7, 9
7.6)
94.4
(88.
0, 9
7.5)
95.9
(91.
1, 9
8.1)
Wea
lth in
dex
Low
est
96.5
(94.
0, 9
8.0)
77.5
(71.
8, 8
2.3)
79.8
(74.
6, 8
4.2)
89.0
(85.
0, 9
2.1)
86.6
(82.
6, 8
9.7)
Low
97.4
(94.
9, 9
8.6)
81.3
(76.
3, 8
5.4)
85.8
(81.
6, 8
9.1)
91.2
(87.
3, 9
4.0)
89.8
(85.
8, 9
2.7)
Mid
dle
96.4
(93.
1, 9
8.1)
87.3
(81.
9, 9
1.3)
89.1
(84.
1, 9
2.7)
92.7
(88.
9, 9
5.3)
89.1
(84.
9, 9
2.2)
Hig
h97
.1(9
4.2,
98.
6)91
.6(8
7.8,
94.
3)93
.2(8
9.5,
95.
6)95
.1(9
1.7,
97.
2)93
.7(9
0.5,
95.
9)
Hig
hest
95.8
(90.
9, 9
8.2)
86.8
(79.
1, 9
2.0)
91.4
(84.
4, 9
5.4)
93.1
(86.
8, 9
6.5)
92.8
(87.
7, 9
5.8)
Occ
upat
ion
Empl
oyed
96.0
(91.
9, 9
8.0)
89.9
(84.
8, 9
3.4)
93.1
(88.
7, 9
5.8)
95.0
(90.
9, 9
7.3)
89.3
(82.
7, 9
3.6)
Busi
ness
98.7
(97.
1, 9
9.4)
91.9
(88.
0, 9
4.6)
94.0
(91.
0, 9
6.0)
96.9
(94.
8, 9
8.2)
94.6
(92.
1, 9
6.3)
Farm
ers
97.1
(94.
5, 9
8.5)
87.7
(83.
5, 9
1.0)
88.6
(84.
5, 9
1.8)
93.5
(89.
8, 9
6.0)
91.7
(88.
2, 9
4.3)
Labo
urer
s96
.9(9
5.0,
98.
1)79
.3(7
4.7,
83.
2)83
.5(7
9.3,
86.
9)90
.6(8
7.7,
93.
0)88
.5(8
5.2,
91.
1)
Stud
ent
89.5
(49.
5, 9
8.7)
*89
.5(4
9.5,
98.
7)*
89.5
(49.
5, 9
8.7)
*75
.6(4
9.0,
90.
9)*
89.5
(49.
5, 9
8.7)
*
Hom
emak
er84
.3(6
6.3,
93.
6)35
.0(2
0.7,
52.
7)*
50.7
(33.
6, 6
7.6)
60.0
(42.
8, 7
5.1)
60.0
(42.
8, 7
5.1)
Une
mpl
oyed
96.0
(86.
7, 9
8.9)
90.2
(80.
4, 9
5.4)
89.6
(79.
4, 9
5.0)
90.7
(80.
3, 9
5.9)
90.7
(80.
3, 9
5.9)
Non
-sm
oker
s297
.6(9
7.0,
98.
1)80
.8(7
8.9,
82.
5)85
.5(8
4.0,
86.
9)91
.4(9
0.2,
92.
4)90
.4(8
9.1,
91.
5)
Mal
e98
.0(9
6.8,
98.
7)88
.3(8
5.9,
90.
4)91
.7(8
9.9,
93.
3)95
.2(9
3.6,
96.
3)92
.6(9
0.6,
94.
2)
Fem
ale
97.3
(96.
6, 9
7.9)
76.6
(74.
1, 7
8.9)
82.1
(79.
9, 8
4.0)
89.3
(87.
7, 9
0.7)
89.2
(87.
6, 9
0.5)
1 In
clud
es d
aily
and
occ
asio
nal (
less
than
dai
ly) s
mok
ers.
2In
clud
es fo
rmer
and
nev
er s
mok
ers.
* Es
timat
e ba
sed
on fe
wer
than
25
unw
eigh
ted
case
s.

142
GATS Bangladesh Report-2009Ta
ble
9.1
(con
t.):
Per
cent
age
of a
dults
≥15
yea
rs o
ld, w
ho b
elie
ve th
at s
mok
ing
caus
es s
erio
us il
lnes
s, s
trok
e, h
eart
att
ack,
lung
can
cer,
orlo
ng-t
erm
resp
irato
ry d
istr
ess,
by
smok
ing
stat
us a
nd s
elec
ted
dem
ogra
phic
cha
ract
eris
tics–
GAT
S Ba
ngla
desh
, 200
9.
Dem
ogra
phic
char
acte
rist
ics
Adu
lts
who
bel
ieve
that
sm
okin
g ca
uses
:
Seri
ous
illne
ssSt
roke
Hea
rt a
ttac
kLu
ng c
ance
rLo
ng-t
erm
resp
irat
ory
dist
ress
Age
(yea
rs)
15-2
498
.1(9
7.0,
98.
8)83
.3(8
0.8,
85.
6)88
.2(8
6.0,
90.
1)94
.1(9
2.4,
95.
4)91
.6(8
9.6,
93.
3)25
-44
98.5
(97.
9, 9
8.9)
82.0
(79.
4, 8
4.3)
86.6
(84.
6, 8
8.4)
92.3
(90.
8, 9
3.6)
91.4
(89.
7, 9
2.8)
45-6
496
.5(9
4.7,
97.
7)78
.2(7
4.7,
81.
3)83
.5(8
0.2,
86.
4)89
.0(8
6.1,
91.
4)90
.0(8
7.8,
91.
9)65
+91
.9(8
7.0,
95.
1)67
.3(6
1.0,
72.
9)70
.5(6
4.3,
76.
1)78
.4(7
2.7,
83.
1)79
.0(7
3.3,
83.
7)Re
side
nce
Urb
an97
.7(9
6.8,
98.
4)86
.3(8
3.7,
88.
6)90
.6(8
8.4,
92.
4)95
.0(9
3.6,
96.
1)92
.9(9
1.0,
94.
3)Ru
ral
97.5
(96.
7, 9
8.1)
78.7
(76.
5, 8
0.9)
83.7
(81.
9, 8
5.3)
90.1
(88.
6, 9
1.3)
89.5
(88.
0, 9
0.9)
Educ
atio
n le
vel
No
form
al e
duca
tion
95.1
(93.
6, 9
6.3)
71.3
(68.
1, 7
4.2)
76.5
(73.
7, 7
9.0)
84.3
(82.
0, 8
6.4)
83.5
(81.
1, 8
5.6)
Less
than
pri
mar
y98
.5(9
7.6,
99.
1)78
.3(7
4.2,
81.
8)82
.7(7
9.1,
85.
8)90
.7(8
7.8,
93.
0)89
.9(8
7.2,
92.
0)Pr
imar
y98
.8(9
7.3,
99.
5)81
.9(7
7.9,
85.
4)85
.5(8
1.5,
88.
7)91
.6(8
8.8,
93.
7)91
.8(8
9.0,
94.
0)Le
ss th
an s
econ
dary
99.1
(98.
5, 9
9.4)
87.2
(84.
7, 8
9.5)
92.5
(90.
5, 9
4.2)
96.8
(95.
4, 9
7.7)
94.7
(92.
5, 9
6.3)
Seco
ndar
y an
d ab
ove
98.7
(97.
3, 9
9.3)
92.0
(89.
5, 9
3.9)
96.6
(95.
1, 9
7.6)
98.4
(97.
3, 9
9.1)
97.0
(95.
1, 9
8.1)
Wea
lth in
dex
Low
est
95.7
(93.
8, 9
7.0)
70.7
(66.
7, 7
4.4)
76.8
(73.
6, 7
9.7)
84.6
(81.
6, 8
7.1)
83.9
(81.
1, 8
6.4)
Low
97.2
(96.
0, 9
8.0)
78.6
(75.
4, 8
1.5)
81.9
(78.
9, 8
4.5)
89.4
(86.
9, 9
1.4)
89.3
(86.
8, 9
1.3)
Mid
dle
98.1
(96.
8, 9
8.9)
82.1
(79.
2, 8
4.6)
86.2
(83.
4, 8
8.6)
92.4
(90.
2, 9
4.1)
91.6
(89.
5, 9
3.3)
Hig
h98
.6(9
7.5,
99.
3)84
.8(8
1.4,
87.
7)90
.3(8
7.8,
92.
4)94
.8(9
2.9,
96.
2)93
.3(9
1.0,
95.
0)H
ighe
st97
.9(9
6.5,
98.
7)87
.0(8
3.8,
89.
5)91
.8(8
9.8,
93.
5)95
.2(9
3.3,
96.
6)93
.1(9
0.3,
95.
1)O
ccup
atio
nEm
ploy
ed98
.5(9
6.7,
99.
3)89
.4(8
5.9,
92.
2)93
.5(9
0.7,
95.
5)97
.5(9
5.8,
98.
5)93
.3(8
9.8,
95.
6)Bu
sine
ss98
.4(9
6.1,
99.
3)91
.5(8
5.5,
95.
1)95
.7(9
3.3,
97.
3)97
.1(9
4.8,
98.
4)94
.8(8
8.7,
97.
7)Fa
rmer
s97
.9(9
4.2,
99.
2)87
.4(8
1.4,
91.
7)92
.0(8
7.6,
94.
9)96
.4(9
3.1,
98.
2)94
.5(9
1.1,
96.
7)La
bour
ers
96.9
(95.
3, 9
7.9)
78.1
(74.
2, 8
1.6)
80.1
(76.
3, 8
3.5)
89.0
(86.
0, 9
1.5)
89.2
(86.
0, 9
1.7)
Stud
ent
98.8
(96.
0, 9
9.6)
92.2
(88.
4, 9
4.9)
95.5
(92.
4, 9
7.4)
97.8
(94.
6, 9
9.1)
94.7
(90.
9, 9
6.9)
Hom
emak
er97
.8(9
6.9,
98.
4)76
.4(7
3.7,
79.
0)82
.9(8
0.7,
85.
0)89
.9(8
8.1,
91.
5)89
.4(8
7.7,
90.
9)U
nem
ploy
ed93
.0(8
8.4,
95.
9)75
.8(6
9.3,
81.
3)75
.3(6
8.4,
81.
1)78
.8(7
2.4,
84.
0)80
.8(7
4.6,
85.
7)1 In
clud
es d
aily
and
occ
asio
nal (
less
than
dai
ly) s
mok
ers.
2In
clud
es fo
rmer
and
nev
er s
mok
ers.
* Es
timat
e ba
sed
on fe
wer
than
25
unw
eigh
ted
case
s.

9.1.2 Health effects of smokeless tobacco use
This survey provides information about beliefs regarding health effects caused by smokelesstobacco among the adult population aged 15 years and above (Table 9.1A). The percentageof adults who believe smokeless tobacco can cause serious illness is 92.7% while for specificillnesses, adults reported 83% for mouth cancer, 75.7% for heart attack and 73.5% for stroke.There is little difference in the overall belief among the male and female populations. However,the percentage of the male population that believe that specific diseases are caused bysmokeless tobacco was higher than for females e.g. for stroke (81.6% and 65.4%, respectively),heart attack (82.7% and 68.9%) and mouth cancer (86.7% and 79.4%). Knowledge aboutvarious health effects is found more among the 25-44 year age group (93.6%) in comparisonwith those aged 65 years and above (87.1%). Urban populations (94.9%), adults withsecondary school education and above (97.2%) and those with the highest SES level (95.3%)have more knowledge that smokeless tobacco causes serious illness compared to ruralpopulations (92.0%), the non-formally educated (89.5%), and those in the lowest SES (88.7%).Moreover, the employed population (97.3%), businessmen (94.5%) and students (94.0%) knowmore about serious illness caused by smokeless tobacco use than the unemployed population(88.5%), labourers (90.4%), homemakers (93.6%) and farmers (91.2%). The differences inknowledge between these groups on all specific diseases was greater.
Among current smokeless tobacco users, most of them (91.5%) believe that smokelesstobacco causes serious illness and other diseases such as stroke (71.7%), heart attack (73.6%)and mouth cancer (79.7%). The percentages related to knowledge about serious illness amongthe male and female population are 91.3% and 91.8%, respectively. However, male populationknew more about specific diseases that can be caused by smokeless tobacco than femalepopulation, e.g. for stroke (80.8% and 63.2%, respectively), heart attack (81.2% against 66.5%)and mouth cancer (85.5% against 74.3%). The population aged 65 years and above knew lessabout health hazards than the other groups. Current smokeless tobacco users living in urbanareas (93.5%) with secondary school education and above (98.7%) and highest SES (95.0%)were found to be more knowledgeable about different diseases caused by smokeless tobaccouse. The highest level of knowledge was found among the employed current smokelesstobacco users (97.0%) followed by homemakers, businessmen and farmers (92.8%, 91.9% and91.4%, respectively), whereas the unemployed and labourers have the least knowledge (82.9%and 90.3%, respectively).
Among non-smokeless tobacco users, 93.2% believe that smokeless tobacco causes seriousillness; respectively, 74.1%, 76.5% and 84.3% believe that stroke, heart attack and mouthcancer can be caused by the effects of smokeless tobacco use. Knowledge and perceptionpatterns about health effects are almost the same as among current smokeless tobacco userswith respect to gender, residence, educational level and wealth index category, but notoccupation.
143
GATS Bangladesh Report-2009

Table 9.1A: Percentage of adults ≥15 years old, who believe that using smokeless tobacco causesserious illness, stroke, heart attack or cancer of the mouth, by smokeless tobacco use status andselected demographic characteristics–GATS Bangladesh, 2009.
144
GATS Bangladesh Report-2009
Demographiccharacteristics
Adults who believe that smokeless tobacco use causes:Serious illness Stroke Heart attack Mouth cancer
Percentage (95% CI)
Overall 92.7 (91.6, 93.7) 73.5 (71.6, 75.2) 75.7 (74.0, 77.4) 83.0 (81.6, 84.4)Gender
Male 92.6 (91.2, 93.8) 81.6 (79.4, 83.6) 82.7 (80.6, 84.5) 86.7 (84.9, 88.2)Female 92.9 (91.4, 94.1) 65.4 (62.6, 68.1) 68.9 (66.4, 71.3) 79.4 (77.4, 81.3)
Age (years)15-24 92.9 (91.1, 94.3) 73.5 (70.8, 76.0) 74.9 (72.4, 77.3) 83.0 (80.7, 85.0)25-44 93.6 (92.4, 94.7) 74.5 (72.0, 76.9) 77.4 (75.3, 79.4) 84.5 (82.7, 86.1)45-64 92.5 (90.6, 94.0) 73.5 (70.7, 76.2) 76.5 (73.6, 79.2) 82.5 (80.0, 84.8)65+ 87.1 (82.7, 90.4) 66.3 (60.7, 71.5) 65.9 (60.4, 71.0) 75.6 (70.5, 80.0)
ResidenceUrban 94.9 (93.3, 96.1) 77.7 (74.4, 80.6) 78.7 (75.5, 81.5) 87.3 (85.2, 89.1)Rural 92.0 (90.5, 93.2) 72.0 (69.8, 74.0) 74.7 (72.7, 76.6) 81.5 (79.8, 83.1)
Education levelNo formal education 89.5 (87.6, 91.1) 67.5 (64.6, 70.2) 69.8 (67.1, 72.4) 78.1 (75.9, 80.1)Less than primary 93.0 (90.8, 94.6) 71.4 (67.4, 75.1) 73.3 (69.3, 76.9) 83.0 (80.0, 85.7)Primary 93.1 (90.8, 94.9) 75.1 (71.1, 78.6) 78.1 (74.2, 81.6) 82.5 (79.0, 85.5)Less than secondary 94.8 (92.8, 96.2) 77.0 (74.2, 79.5) 79.1 (76.3, 81.6) 86.1 (83.8, 88.1)Secondary and above 97.2 (95.4, 98.4) 84.6 (81.3, 87.4) 86.9 (83.9, 89.4) 91.9 (89.7, 93.7)
Wealth indexLowest 88.7 (86.2, 90.8) 65.3 (61.6, 68.8) 69.9 (66.4, 73.1) 75.7 (72.6, 78.5)Low 91.3 (89.2, 93.0) 70.9 (67.8, 73.8) 71.8 (68.5, 74.9) 81.4 (79.0, 83.7)Middle 93.6 (91.8, 95.0) 73.9 (70.9, 76.7) 75.6 (72.5, 78.5) 84.2 (81.9, 86.3)High 95.2 (93.5, 96.4) 79.5 (76.1, 82.5) 81.9 (79.1, 84.4) 86.4 (83.8, 88.7)Highest 95.3 (92.7, 97.0) 78.0 (74.8, 80.9) 80.1 (77.0, 82.9) 88.1 (85.3, 90.4)
OccupationEmployed 97.3 (96.0, 98.2) 84.0 (80.3, 87.0) 86.6 (83.4, 89.2) 91.4 (88.5, 93.6)Business 94.5 (91.3, 96.6) 86.2 (82.3, 89.3) 87.2 (83.3, 90.4) 89.5 (85.9, 92.3)Farmers 91.2 (88.4, 93.4) 81.3 (77.5, 84.5) 82.7 (79.2, 85.7) 85.9 (82.8, 88.5)Labourers 90.4 (87.9, 92.3) 72.3 (68.8, 75.6) 72.9 (69.3, 76.2) 81.4 (78.3, 84.2)Student 94.0 (89.9, 96.5) 78.8 (73.5, 83.2) 79.6 (74.1, 84.1) 85.3 (80.5, 89.0)Homemaker 93.6 (92.2, 94.7) 66.0 (62.8, 69.0) 70.4 (67.6, 73.1) 80.4 (78.1, 82.5)Unemployed 88.5 (83.8, 92.0) 73.4 (67.6, 78.5) 72.3 (66.3, 77.6) 77.5 (71.7, 82.4)
Current smokeless users1 91.5 (89.7, 93.0) 71.7 (68.9, 74.3) 73.6 (70.8, 76.2) 79.7 (77.5, 81.7)Gender
Male 91.3 (88.7, 93.3) 80.8 (77.3, 83.9) 81.2 (77.5, 84.3) 85.5 (82.4, 88.1)Female 91.8 (89.3, 93.7) 63.2 (59.0, 67.2) 66.5 (62.6, 70.2) 74.3 (71.0, 77.3)
Age (years)15-24 89.5 (77.7, 95.4) 70.0 (59.9, 78.4) 71.5 (62.1, 79.4) 76.1 (66.3, 83.8)25-44 93.1 (90.8, 94.8) 73.2 (69.7, 76.5) 74.9 (71.1, 78.4) 82.5 (79.6, 85.0)45-64 92.3 (89.9, 94.1) 73.0 (69.2, 76.5) 76.0 (72.2, 79.4) 80.0 (76.6, 82.9)65+ 85.9 (79.9, 90.3) 64.3 (56.6, 71.3) 64.2 (56.8, 71.0) 72.3 (65.3, 78.4)
ResidenceUrban 93.5 (90.8, 95.4) 76.5 (72.9, 79.8) 78.5 (74.4, 82.1) 83.7 (80.0, 86.9)Rural 91.0 (88.8, 92.8) 70.4 (67.0, 73.6) 72.3 (68.9, 75.4) 78.6 (75.9, 81.0)
Education levelNo formal education 90.1 (87.5, 92.2) 67.8 (63.9, 71.4) 69.7 (66.1, 73.1) 76.5 (73.3, 79.5)Less than primary 92.0 (86.7, 95.3) 69.0 (62.9, 74.5) 72.0 (65.1, 78.0) 82.7 (76.2, 87.6)Primary 93.9 (89.5, 96.6) 78.1 (71.7, 83.3) 81.1 (73.9, 86.6) 83.2 (76.7, 88.1)Less than secondary 92.8 (88.3, 95.7) 81.2 (74.5, 86.4) 81.5 (75.4, 86.4) 85.9 (80.4, 90.0)Secondary and above 98.7 (96.4, 99.5) 93.3 (86.5, 96.8) 94.0 (88.3, 97.0) 90.9 (83.7, 95.1)
1 Includes daily and occasional (less than daily) smokeless tobacco users.2 Includes former and never smokeless tobacco users.* Estimate based on fewer than 25 unweighted cases.

145
GATS Bangladesh Report-2009
Demographiccharacteristics
Adults who believe that smokeless tobacco use causes:Serious illness Stroke Heart attack Mouth cancer
Percentage (95% CI)
Wealth index
Lowest 89.1 (85.3, 92.0) 65.4 (60.3, 70.2) 70.9 (66.3, 75.0) 75.6 (71.3, 79.4)
Low 89.1 (85.1, 92.1) 72.3 (67.9, 76.4) 71.3 (66.7, 75.6) 78.4 (73.9, 82.2)
Middle 94.0 (90.9, 96.1) 69.4 (63.4, 74.8) 72.4 (66.8, 77.4) 81.6 (76.8, 85.6)
High 93.7 (90.0, 96.1) 75.4 (69.5, 80.4) 76.8 (70.9, 81.9) 82.3 (76.8, 86.7)
Highest 95.0 (89.4, 97.7) 83.6 (77.2, 88.5) 82.7 (76.2, 87.7) 84.8 (78.1, 89.7)
Occupation
Employed 97.0 (93.8, 98.6) 85.3 (78.5, 90.3) 87.0 (80.8, 91.4) 91.6 (86.1, 95.1)
Business 91.9 (86.8, 95.2) 84.9 (78.7, 89.6) 83.3 (76.6, 88.4) 87.0 (81.5, 91.1)
Farmers 91.4 (86.9, 94.5) 78.9 (72.5, 84.2) 81.1 (75.1, 86.0) 83.5 (77.9, 87.9)
Labourers 90.3 (85.9, 93.4) 74.7 (69.4, 79.4) 73.9 (68.4, 78.7) 83.2 (78.4, 87.1)
Student 100.0 * 65.6 (17.3, 94.6)* 65.6 (17.3, 94.6)* 65.6 (17.3, 94.6)*
Homemaker 92.8 (90.5, 94.6) 64.4 (59.9, 68.7) 68.8 (64.7, 72.6) 75.2 (71.7, 78.5)
Unemployed 82.9 (73.1, 89.6) 63.6 (53.4, 72.7) 63.9 (52.9, 73.7) 69.4 (58.1, 78.8)
Non-smokeless users2 93.2 (92.0, 94.2) 74.1 (72.0, 76.1) 76.5 (74.7, 78.3) 84.3 (82.7, 85.7)
Gender
Male 93.1 (91.5, 94.4) 81.9 (79.3, 84.2) 83.2 (80.8, 85.3) 87.1 (85.1, 88.9)
Female 93.3 (91.8, 94.5) 66.2 (63.2, 69.2) 69.8 (67.1, 72.4) 81.4 (79.3, 83.4)
Age (years)
15-24 93.1 (91.4, 94.6) 73.7 (70.9, 76.4) 75.2 (72.5, 77.7) 83.5 (81.0, 85.7)
25-44 93.9 (92.5, 95.0) 74.9 (72.2, 77.5) 78.3 (76.2, 80.4) 85.2 (83.2, 86.9)
45-64 92.6 (90.1, 94.6) 74.0 (69.9, 77.8) 77.0 (72.9, 80.7) 84.9 (81.7, 87.5)
65+ 88.6 (82.6, 92.7) 69.0 (61.3, 75.7) 68.1 (60.4, 74.9) 79.8 (73.1, 85.2)
Residence
Urban 95.3 (93.7, 96.5) 78.0 (74.3, 81.3) 78.7 (75.3, 81.8) 88.3 (86.3, 90.1)
Rural 92.4 (90.8, 93.7) 72.6 (70.2, 74.9) 75.7 (73.5, 77.8) 82.7 (80.8, 84.5)
Education level
No formal education 89.0 (86.6, 91.0) 67.3 (63.6, 70.7) 69.9 (66.4, 73.2) 79.2 (76.5, 81.7)
Less than primary 93.3 (91.0, 95.1) 72.4 (67.5, 76.7) 73.8 (69.2, 77.9) 83.2 (79.5, 86.3)
Primary 92.8 (90.0, 94.9) 74.1 (69.6, 78.1) 77.1 (73.0, 80.7) 82.3 (78.3, 85.7)
Less than secondary 95.1 (92.9, 96.6) 76.3 (73.3, 79.1) 78.7 (75.7, 81.4) 86.1 (83.6, 88.3)
Secondary and above 97.1 (95.1, 98.3) 83.6 (80.0, 86.6) 86.1 (82.8, 88.8) 92.1 (89.6, 94.0)
Wealth index
Lowest 88.5 (85.5, 90.9) 65.2 (60.9, 69.3) 69.3 (65.1, 73.2) 75.7 (71.9, 79.2)
Low 92.2 (90.2, 93.9) 70.3 (66.4, 73.8) 72.0 (68.1, 75.6) 82.7 (80.0, 85.2)
Middle 93.4 (91.5, 94.9) 75.5 (71.9, 78.8) 76.8 (73.0, 80.1) 85.2 (82.3, 87.6)
High 95.6 (93.8, 96.9) 80.7 (77.0, 84.0) 83.4 (80.5, 86.0) 87.7 (84.8, 90.2)
Highest 95.4 (92.5, 97.2) 76.8 (73.4, 80.0) 79.6 (76.1, 82.7) 88.7 (85.5, 91.3)
Occupation
Employed 97.3 (95.8, 98.3) 83.7 (79.5, 87.1) 86.5 (82.8, 89.5) 91.4 (88.0, 93.9)
Business 95.5 (91.0, 97.8) 86.7 (81.8, 90.4) 88.7 (84.0, 92.2) 90.5 (85.8, 93.7)
Farmers 91.0 (87.5, 93.7) 82.5 (78.1, 86.1) 83.4 (79.0, 87.1) 87.1 (83.4, 90.1)
Labourers 90.4 (87.5, 92.7) 71.3 (66.9, 75.2) 72.4 (68.2, 76.4) 80.7 (76.8, 84.0)
Student 93.9 (89.8, 96.5) 78.9 (73.7, 83.3) 79.7 (74.3, 84.2) 85.5 (80.6, 89.2)
Homemaker 93.9 (92.4, 95.1) 66.6 (63.1, 70.0) 71.1 (67.9, 74.0) 82.5 (80.1, 84.7)
Unemployed 91.1 (85.3, 94.8) 78.0 (70.5, 84.0) 76.2 (68.6, 82.5) 81.4 (74.2, 86.9)
1 Includes daily and occasional (less than daily) smokeless tobacco users.2 Includes former and never smokeless tobacco users.* Estimate based on fewer than 25 unweighted cases.
Table 9.1A (cont.): Percentage of adults ≥15 years old, who believe that using smokeless tobaccocauses serious illness, stroke, heart attack or cancer of the mouth, by smokeless tobacco use statusand selected demographic characteristics–GATS Bangladesh, 2009.

9.2 Health effects of second-hand smoke
Table 9.2 presents information on the percentage of adults who believe breathing otherpeople’s smoke causes serious illness in non-smokers, and includes information by theirsmoking status. Overall, 93.4% of adults 15 years and older believe that breathing otherpeople’s smoke can cause serious illness in non-smokers; 95.2% of current smokers and 92.9%of non-smokers believe this (Table 9.2). By gender, irrespective of the smoking status, thepercentage of males who believe in the adverse effects of other people’s smoke on health ishigher than among females (97.6% compared with 89.9%). By gender the percentages were96.3% and 62.1% in current smokers and 97.6% and 90.3% in non-smokers. Here it should benoticed that non-smoking females had at a higher rate than current female smokers. Overallyoung adults aged 15-24 years have reported in higher proportion that other people’s smokecauses serious illness (95.2%) when compared to adults aged 65 years and over (81.5%). Thisproportion is also higher in non-smoking young adults (95.2%) than any other age group.Among current smokers, the 25-44 year age group had a higher rate (97.1%), followed by the15-24 year age group (95.9%). There is little difference in belief among the urban and ruralpopulations about serious illness caused by other people’s smoke; however, overall, urbanpeople (96.7%) had a higher rate of belief than rural (92.3%). The figures were also higher forurbanites than rural populations in the categories of current smokers (97.6% against 94.4%)and non-smokers (96.4% against 91.6%).
By education, belief that other people’s smoke causes serious illness in non-smokersincreased with educational level. The pattern is persistent with wealth index as well. Forexample, 99.0% of adults in the higher educational category believe that breathing otherspeople’s smoke causes serious illness in non-smokers whereas this proportion is only 88.7%among those with no formal education. Similarly, 97.7% of adults from the highest SES levelbelieve that breathing others people’s smoke causes serious illness in non-smokers, comparedto 85.9% among the adults in the lowest SES level. These proportions were observed to followsimilar patterns in both current smokers and non-smoking adults. However, current smokersreported a higher belief in all the categories compared to non-smokers. The percentage ofbelieve is highest among businessmen (99.2%) followed by the employed (98.4%) and students(98.1%). Though the percentage of belief among all occupation groups is almost the same, itwas found that homemaker current smokers believed the least (61.6%) in comparison withothers.
146
GATS Bangladesh Report-2009

Table 9.2: Percentage of adults ≥ 15 years old who believe that breathing other people’s smokecauses serious illness in non-smokers, by smoking status and selected demographiccharacteristics-GATS Bangladesh, 2009.
147
GATS Bangladesh Report-2009
Demographic characteristicsBelieve that breathing other people’s smoke causes serious illness in non-smokers
Overall Current smokers1 Non-smokers2
Percentage (95% CI )
Overall 93.4 (92.6, 94.2) 95.2 (93.7, 96.3) 92.9 (91.9, 93.8)
Gender
Male 97.0 (96.2, 97.6) 96.3 (94.9, 97.3) 97.6 (96.6, 98.3)
Female 89.9 (88.3, 91.2) 62.1 (45.5, 76.3) 90.3 (88.8, 91.6)
Age (years)
15-24 95.2 (94.0, 96.2) 95.9 (91.4, 98.1) 95.2 (93.8, 96.2)
25-44 94.9 (93.8, 95.7) 97.1 (95.8, 98.0) 94.1 (92.7, 95.2)
45-64 91.6 (89.8, 93.1) 93.8 (91.0, 95.8) 90.6 (88.3, 92.4)
65+ 81.5 (77.2, 85.1) 85.3 (73.9, 92.2) 80.3 (75.5, 84.4)
Residence
Urban 96.7 (95.8, 97.3) 97.6 (96.3, 98.5) 96.4 (95.4, 97.2)
Rural 92.3 (91.2, 93.2) 94.4 (92.4, 95.8) 91.6 (90.4, 92.7)
Education level
No formal education 88.7 (87.1, 90.1) 93.0 (90.6, 94.8) 86.7 (84.7, 88.5)
Less than primary 93.4 (91.6, 94.9) 96.2 (92.8, 98.0) 92.4 (90.0, 94.3)
Primary 94.4 (92.0, 96.0) 95.9 (91.0, 98.2) 94.0 (91.3, 95.9)
Less than secondary 97.2 (96.1, 98.0) 97.6 (93.0, 99.2) 97.2 (95.9, 98.0)
Secondary and above 99.0 (97.9, 99.5) 99.6 (98.3, 99.9) 98.9 (97.6, 99.5)
Wealth index
Lowest 85.9 (83.6, 88.0) 89.9 (85.7, 92.9) 84.3 (81.6, 86.7)
Low 92.3 (90.8, 93.6) 94.6 (91.2, 96.7) 91.5 (89.6, 93.1)
Middle 94.7 (93.3, 95.9) 97.1 (94.5, 98.5) 94.0 (92.3, 95.4)
High 96.7 (95.5, 97.6) 98.6 (96.4, 99.5) 96.3 (94.8, 97.3)
Highest 97.7 (96.5, 98.5) 98.9 (96.9, 99.6) 97.5 (96.1, 98.4)
Occupation
Employed 98.4 (97.2, 99.0) 98.8 (96.6, 99.6) 98.2 (96.6, 99.0)
Business 99.2 (98.3, 99.6) 98.8 (97.1, 99.5) 99.4 (98.6, 99.8)
Farmers 95.9 (93.9, 97.3) 94.5 (91.2, 96.6) 97.5 (95.0, 98.8)
Labourers 93.9 (92.1, 95.4) 95.2 (92.6, 97.0) 92.9 (90.3, 94.8)
Student 98.1 (95.8, 99.1) 97.9 (84.4, 99.7)* 98.1 (95.7, 99.2)
Homemaker 89.9 (88.2, 91.3) 61.6 (43.9, 76.7) 90.3 (88.6, 91.7)
Unemployed 89.2 (85.2, 92.2) 94.8 (86.2, 98.2) 87.6 (82.6, 91.3)
1 Includes daily and occasional (less than daily) smokers.2 Includes former and never smokers.* Estimate based on fewer than 25 unweighted cases
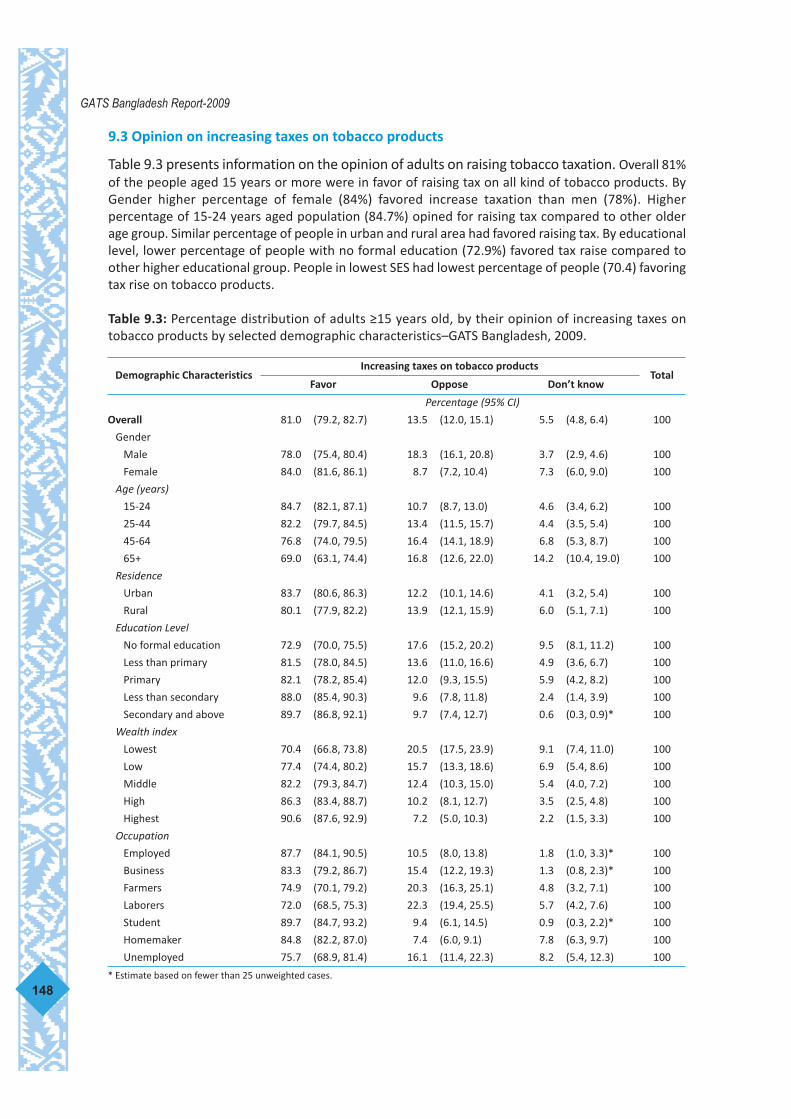
9.3 Opinion on increasing taxes on tobacco products
Table 9.3 presents information on the opinion of adults on raising tobacco taxation. Overall 81%of the people aged 15 years or more were in favor of raising tax on all kind of tobacco products. ByGender higher percentage of female (84%) favored increase taxation than men (78%). Higherpercentage of 15-24 years aged population (84.7%) opined for raising tax compared to other olderage group. Similar percentage of people in urban and rural area had favored raising tax. By educationallevel, lower percentage of people with no formal education (72.9%) favored tax raise compared toother higher educational group. People in lowest SES had lowest percentage of people (70.4) favoringtax rise on tobacco products.
Table 9.3: Percentage distribution of adults ≥15 years old, by their opinion of increasing taxes ontobacco products by selected demographic characteristics–GATS Bangladesh, 2009.
148
GATS Bangladesh Report-2009
Demographic CharacteristicsIncreasing taxes on tobacco products
TotalFavor Oppose Don’t know
Percentage (95% CI)
Overall 81.0 (79.2, 82.7) 13.5 (12.0, 15.1) 5.5 (4.8, 6.4) 100
Gender
Male 78.0 (75.4, 80.4) 18.3 (16.1, 20.8) 3.7 (2.9, 4.6) 100
Female 84.0 (81.6, 86.1) 8.7 (7.2, 10.4) 7.3 (6.0, 9.0) 100
Age (years)
15-24 84.7 (82.1, 87.1) 10.7 (8.7, 13.0) 4.6 (3.4, 6.2) 100
25-44 82.2 (79.7, 84.5) 13.4 (11.5, 15.7) 4.4 (3.5, 5.4) 100
45-64 76.8 (74.0, 79.5) 16.4 (14.1, 18.9) 6.8 (5.3, 8.7) 100
65+ 69.0 (63.1, 74.4) 16.8 (12.6, 22.0) 14.2 (10.4, 19.0) 100
Residence
Urban 83.7 (80.6, 86.3) 12.2 (10.1, 14.6) 4.1 (3.2, 5.4) 100
Rural 80.1 (77.9, 82.2) 13.9 (12.1, 15.9) 6.0 (5.1, 7.1) 100
Education Level
No formal education 72.9 (70.0, 75.5) 17.6 (15.2, 20.2) 9.5 (8.1, 11.2) 100
Less than primary 81.5 (78.0, 84.5) 13.6 (11.0, 16.6) 4.9 (3.6, 6.7) 100
Primary 82.1 (78.2, 85.4) 12.0 (9.3, 15.5) 5.9 (4.2, 8.2) 100
Less than secondary 88.0 (85.4, 90.3) 9.6 (7.8, 11.8) 2.4 (1.4, 3.9) 100
Secondary and above 89.7 (86.8, 92.1) 9.7 (7.4, 12.7) 0.6 (0.3, 0.9)* 100
Wealth index
Lowest 70.4 (66.8, 73.8) 20.5 (17.5, 23.9) 9.1 (7.4, 11.0) 100
Low 77.4 (74.4, 80.2) 15.7 (13.3, 18.6) 6.9 (5.4, 8.6) 100
Middle 82.2 (79.3, 84.7) 12.4 (10.3, 15.0) 5.4 (4.0, 7.2) 100
High 86.3 (83.4, 88.7) 10.2 (8.1, 12.7) 3.5 (2.5, 4.8) 100
Highest 90.6 (87.6, 92.9) 7.2 (5.0, 10.3) 2.2 (1.5, 3.3) 100
Occupation
Employed 87.7 (84.1, 90.5) 10.5 (8.0, 13.8) 1.8 (1.0, 3.3)* 100
Business 83.3 (79.2, 86.7) 15.4 (12.2, 19.3) 1.3 (0.8, 2.3)* 100
Farmers 74.9 (70.1, 79.2) 20.3 (16.3, 25.1) 4.8 (3.2, 7.1) 100
Laborers 72.0 (68.5, 75.3) 22.3 (19.4, 25.5) 5.7 (4.2, 7.6) 100
Student 89.7 (84.7, 93.2) 9.4 (6.1, 14.5) 0.9 (0.3, 2.2)* 100
Homemaker 84.8 (82.2, 87.0) 7.4 (6.0, 9.1) 7.8 (6.3, 9.7) 100
Unemployed 75.7 (68.9, 81.4) 16.1 (11.4, 22.3) 8.2 (5.4, 12.3) 100
* Estimate based on fewer than 25 unweighted cases.

10.1 Conclusion
The GATS is a global standard tool for systematically monitoring adult tobacco use and fortracking key tobacco control indicators, which can be utilized by policy-makers forstrengthening tobacco control. In addition, it allows international comparability and anopportunity to learn lessons from tobacco control from different other countries.
GATS Bangladesh has provided national estimate for both smoking and smokeless tobaccousages by urban-rural and by gender. In addition, indicators for various dimensions of tobaccocontrol such as exposure to second-hand smoke, exposure through media to anti-tobaccoinformation, exposure to tobacco advertisements and expenditures related to tobacco arealso generated. This is the first nationwide survey to provide extensive information on all kindsof tobacco products, including smokeless tobacco, and other key indicators of tobacco control.
This is the first survey in Bangladesh that used electronic data collection devices forcollecting data from all the selected 11,200 households widely scattered throughoutBangladesh. Capacity building of national staff and technology transfer through collaborationwith international partners has led to the successful completion of the survey. Implementingagencies are now capable of doing other surveys through electronic data collection and manystaff were trained, including both IT and survey experts in different phases by the internationalpartners such as CDC, RTI and WHO.
This survey shows that overall, 43.3% of adults aged 15 years or above use some form oftobacco in Bangladesh. Tobacco use prevalence as reported in GATS Bangladesh is comparablewith findings of other surveys done in Bangladesh.7,8 As there are methodological differencesbetween these surveys11,12, a direct comparison of rates needs to be interpreted cautiously.
The previous national survey on tobacco done in 2004 had reported that 37% of the sameage group people used tobacco in some form. The impact of the tobacco control programmemay take decades to become visible. The apparent rise in tobacco use over the last five yearsmay be due to the methodological differences of the surveys. However, the increase is not verylarge and coordinated efforts by government and nongovernmental organizations may haveimpacted the rise. Further multisectoral action is required to reverse the rise of tobacco use.
In this study a very high percentage of subjects had knowledge about harmful effects oftobacco in general. Surprisingly, more than 80% of respondent had knowledge about specificdiseases (e.g. ischaemic heart diseases , strokes , lung cancer, long-term respiratory distress).This had happened because of the fact that response options were read out. There were highprobability of guess answers in many instances. Therefore this finding should be cautiouslyinterpreted.
10.2 Policy implications
The results from GATS provided recent information on the use of tobacco, both smoking andsmokeless, and added new information on key indicators related to different provisions of theWHO Framework Convention on Tobacco Control and MPOWER policy package, which willhelp evaluating tobacco control policies and implementing the WHO FCTC provisions. Some
149
GATS Bangladesh Report-2009
10. Conclusion and policy implications
policy recommendations are mentioned aimed to develop, track and implement moreeffective tobacco control interventions, specifically under WHO’s MPOWER guidelines.
M: Monitor
GATS Bangladesh has provided national representative data on both smoking and smokelesstobacco use among the adult population for the year 2009. However, for effective monitoringof tobacco use and its control programme, regular surveillance on key indicators is necessary.Key strategies should be implemented for effective monitoring of tobacco use, such as:
a) Periodic implementation of surveys under the Global Tobacco Surveillance System(GTSS);
b) increase collaboration among tobacco control experts from various institutes and alsotobacco control stakeholders for strengthening the tobacco surveillance system;
c) establish communication with national and international agencies for technical andfinancial support to administer surveys regularly under GTSS; and
d) develop a monitoring plan responding to indicators and FCTC guidelines.
P: Protect
GATS Bangladesh has shown that a high percentage of people are exposed to second-handsmoke in the workplace and also in public places. Steps to protect people protected fromtobacco smoke are:
a) To advocate for the amendment of the current law to include 100% smoke–freeenvironments to cover more public places and protect the public from exposure totobacco smoke pollution.
b) to enforce smoke–free provisions of the current law actively and effectively;
c) mount a public awareness campaign through different media to increase knowledgeof the harms from tobacco and exposure to tobacco smoke.
O: Offer help
GATS Bangladesh has shown that almost 70% of current smokers have an interest in quittingsmoking. However, only 30% of smokers received some forms of counseling for quitting. Onlyhalf of the adults received advice to quit tobacco use when visiting health-care providers.Users of either smoked or smokeless tobacco products should be offered help to quit by:
a) Establishing tobacco cessation centre as a clinic or in the community;
b) training nurses and health workers in counseling skills;
c) making available nicotine replacement therapy (NRT) and other pharmaco-therapeuticagents used in cessation;
d) leaders at workplaces and in the community, as well as volunteers and school teachersshould be trained on cessation skills;
e) establish health promotion activities including tobacco cessation in private and publichealth-care facilities;
f) provide formal training to health professional students;150
GATS Bangladesh Report-2009
g) integrate tobacco cessation services in primary health care settings; and
h) establish a national tobacco quit line.
W: Warn
GATS Bangladesh has shown that only 50% of the adult population has been exposed to anti-tobacco information. Only 50% of cigarette smokers have noticed health warnings on cigarettepackets. Warning messages have reached to a limited number of smokers population becausethey are in textual form. Nonreaders and people with lower educational levels cannot read andunderstand textual health warnings on cigarette packets. Better impact through publiceducation may be achieved by:
• Formulating and enacting effective pictorial health warnings on all types of smokingand smokeless tobacco products;
• disseminating information on the health and economic impact caused by smokingand exposure to second-hand smoke through media campaigns.
E: Enforce
By law, tobacco advertisements for all smoking products is banned in Bangladesh. But GATSBangladesh has shown that almost 50% of adults are exposed to some form of tobaccomarketing activities. Bans on tobacco advertising, promotion and sponsorship should beenhanced through:
• Modification of the national Tobacco Control Act to include a ban on advertisement ofall kinds of tobacco products, including smokeless tobacco;
• raising social awareness regarding tobacco’s harm and exposing the selfishness of thetobacco industry’s through promotion of tobacco;
• coordinating with government and nongovernmental organizations for tobacco controlat every level and especially in remote areas for systematic monitoring of tobaccoindustry advertising;
• rigorously enforcing laws and regulations to eliminate tobacco industry advertising;and
• increasing capacity of the task force to enforce tobacco legislation.
R: Raise taxes on tobacco
Increasing the excise tax on tobacco products has been referred to as a one of the mosteffective ways to discourage youth from starting to smoke, reduce tobacco use and save lives.In this study 81% people supported increase in tobacco taxes.
Further steps include:
a) Advocacy for raising taxes on all types of tobacco products;
b) enhancing political commitment to regularly revise and increase taxes on tobaccoproducts including bidi, smokeless tobacco and imported cigarettes;
c) strengthening community-monitoring of local grocery stores where cigarettes aresold to ensure that youth under 18 years old cannot access them.
151
GATS Bangladesh Report-2009

1. Bangladesh Bureau of Statistics. Statistical pocketbook Bangladesh, 2008. Ministry ofFinance and Planning, Planning Division, Government of Bangladesh, Dhaka 2008.
2. Mathers CD, Loncar D. Projection of global mortality and burden of disease from 2002 to2030. Plos medicine, 2006, 3(11):e442.
3. Majid E, Lopez AD, Rodgers A, Vander Hoorn S, Murray CJL and the Comparative RiskAssessment Collaborating Group. Selected major risk factors and global and regionalburden of disease. Lancet 2002;360:1347–60.
4. World Health Organization. WHO framework convention on tobacco control. Geneva:WHO, 2003. (http://www.who.int/fctc/text_download/en/index.html– accessed on 15November 2009 <http://www.who.int/fctc/text_download/en/index.html%20accessed%207%20May%202009> ).
5. World Health Organization. WHO report on the global tobacco epidemic, 2008: theMPOWER package. Geneva: World Health Organization, 2008. (http://www.who.int/tobacco/mpower/mpower_report_full_2008.pdf - accessed on 15 November 2009).
6. The GTSS Collaborative Group. The Global Tobacco Surveillance System. Tobacco Control2006;15 (Suppl II):ii1–ii3.
7. Bangladesh Health and Demographic and Survey. Report of survey on prevalence ofmorbidity, treatment status, treatment expenditures, fertility, immunization and smoking,July 1997. Bangladesh Bureau of Statistics, Dhaka, 1999.
8. Zaman MM, Nargis N, Perucic AM, Rahman K (Editors). Impact of Tobacco Related Illnessin Bangladesh. World Health Organization, Regional Office for South East Asia, New Delhi,2007. (http://intranet/LinkFiles/Tobacco_Free_Initiative_Health_Cost_bangladesh.pdf )
9. World Health Organization, Regional Office for South-East Asia Region. Fact Sheet.Bangladesh–Dental Students Global Health Professionals Survey (GHPS). (http://www.searo.who.int/LinkFiles/GHPS_Factsheet_Ban.pdf. Accessed on 3 December 2009)
10. WHO, Report on Global Youth Tobacco Survey (GYTS) and Global School Personnel Survey(GSPS) in Bangladesh, World Health Organization, Office for South-East Asia Region, NewDelhi, 2007 (http://www.searo.who.int/LinkFiles/GYTS_BAN2007.pdf Accessed on 3December 2009)
11. National Institute of Population Research and Training (NIPORT), MEASURE evaluation,International Centre for Diarrhoeal Disease Research, Bangladesh (ICDDR,B), andAssociates for Community and Population Research (ACRP). 2006 Bangladesh UrbanHealth Survey. Dhaka, Bangladesh and Chapel Hill, NC, USA: NIPORT, MEASURE Evaluation,ICDDR,B, and ACPR; 2008.
152
GATS Bangladesh Report-2009
References
12. Bangladesh Demographic and Health Survey 2007. National Institute of PopulationResearch and Training (NIPORT), Mitra and Associates, and ORC Macro (2007). Dhaka,Bangladesh and Calverton, Maryland. (http://www.measuredhs.com/pubs/pdf/FR207/FR207[April-10-2009].pdf)
13. Ashraf A, Quaiyum MA, Nawi Ng et al Self-reported use of tobacco products in nine ruralINDEPTH Health and Demographic Surveillance Systems in Asia. Global Health ActionSupplement 1, 2009.19DOI: 10.3402/gha.v2i0.1997.
14. Government of People’s Republic of Bangladesh, Ministry of Health and Family Welfare,Smoking and tobacco products usage (control) act, 2005. In: National strategic plan ofaction for tobacco control, 2007-2010. Dhaka: MOHFW, 2009. pp 24-28.(http://www.whoban.org/pdf/Tobacco_full_book.pdf – accessed on 15 November 2009).
15. WHO, Parties to the WHO Framework Convention on Tobacco Control. List of Conventionto the party World Health Organization, Geneva 2009 (http://www.who.int/fctc/signatories_parties/en/index.html; accessed on 15 November 2009).
16. National Strategic Plan of Action for Tobacco Control, 2007-2010. Ministry of Health andFamily Welfare, Govt. of Bangladesh, Dhaka, 2007. (http://www.whoban.org/pdf/Tobacco_full_book.pdf).
17. Global Tobacco Surveillance System (GTSS), Global Adult Tobacco Survey (GATS): SampleDesign Manual. 2009.
18. Global Tobacco Surveillance System (GTSS), Global Adult Tobacco Survey (GATS): CoreQuestionnaire with Optional Questions. 2009.
19. Global Tobacco Surveillance System (GTSS), Global Adult Tobacco Survey (GATS):Programmer’s Guide to General Survey System. 2009.
20. Global Tobacco Surveillance System (GTSS), Global Adult Tobacco Survey (GATS): DataManagement Implementation Plan. 2009.
21. Global Tobacco Surveillance System (GTSS), Global Adult Tobacco Survey (GATS): QualityAssurance: Guidelines and Documentation. 2009.
22. Global Tobacco Surveillance System (GTSS), Global Adult Tobacco Survey (GATS): FieldInterviewer Manual. 2009.
23. Global Tobacco Surveillance System (GTSS), Global Adult Tobacco Survey (GATS): FieldSupervisor Manual. 2009.
24. Global Tobacco Surveillance System (GTSS), Global Adult Tobacco Survey (GATS): Questionby Question Specifications. 2009.
25. Global Tobacco Surveillance System (GTSS), Global Adult Tobacco Survey (GATS): Mappingand Listing Manual. 2009.
26. Global Tobacco Surveillance System (GTSS), Global Adult Tobacco Survey (GATS): Datamanagement implementation plan 2009.
27. Global Tobacco Surveillance System (GTSS), Global Adult Tobacco Survey (GATS): SampleWeights Manual. 2009.
153
GATS Bangladesh Report-2009
28. Report on Sample Vital Registration System 2008 (2009). Bangladesh Bureau of Statistics,Ministry of Finance and Planning, Planning Division, Government of Bangladesh (in press).
29. Ahmed, M.S. 2003. Intimate partner violence against women: Experience from a woman-focused development programme in Matlab, Bangladesh. Journal of Health, Populationand Nutrition 23(1): 95-101.
30. Gwatkin, D.R., S. Rutstein, K. Johnson, R.P. Pande, and A. Wagstaff. 2000. Socio-economicdifferences in health, nutrition and poverty. HNP/Poverty Thematic Group of The WorldBank. Washington, D.C.: The World Bank.
31. Rutstein, S. 1999. Wealth versus expenditure: Comparison between the DHS wealth indexand household expenditures in four departments of Guatemala. Calverton, Maryland:ORC Macro.
32. Rutstein and Johnson, 2004. Principal Component Analysis.
33. Rutstein, S., K. Johnson, and D. Gwatkin. 2000. Poverty, health inequality, and its healthand demographic effects. Paper presented at the 2000 Annual Meeting of the PopulationAssociation of America, Los Angeles, California.
34. Omar Shafey, Michael Erikson, Hana Ross, Judith Mackay (2009), The Tobacco Atlas. 3rdEdition 2009. American Cancer Society. Atlanta.
35. Howlader SR et al. (2003) Prevalence of and Economic Impact of Tobacco consumption inBangladesh: A Household survey in Selected Rural and Urban Areas. Institute of HealthEconomics, University of Dhaka. Dhaka.
36. Bangladesh gazettes (additional). 11 June 2009. National Board of Revenue. Governmentof Bangladesh.
37. Monthly economic trends. September 2009. Statistics Department, Bangladesh Bank.Dhaka.
38. CDC, Fact sheet, Bangladesh, Global Youth Tobacco Survey 2004, Center for DiseaseControl and Prevention, Atlanta. (http://www.cdc.gov/TOBACCO/global/gyts/ factsheets/sear/2004/BangladeshDhaka_factsheet.htm accessed on 15 November 2009).
154
GATS Bangladesh Report-2009
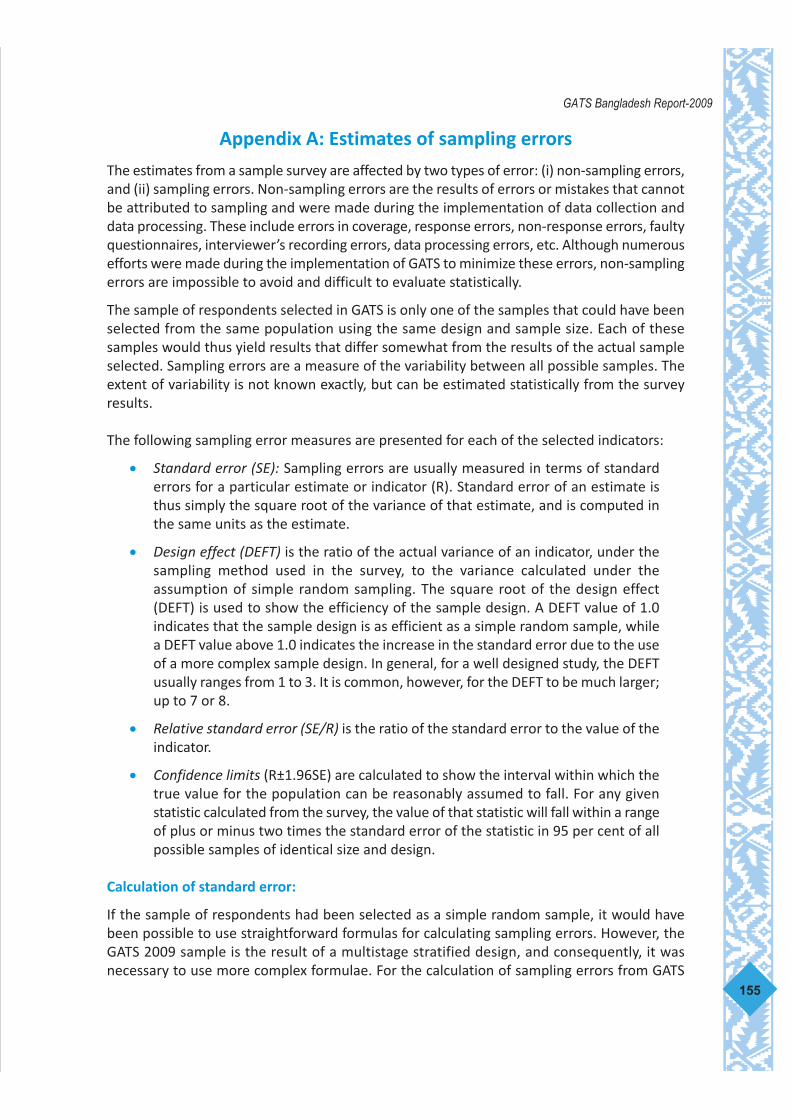
Appendix A: Estimates of sampling errors
The estimates from a sample survey are affected by two types of error: (i) non-sampling errors,and (ii) sampling errors. Non-sampling errors are the results of errors or mistakes that cannotbe attributed to sampling and were made during the implementation of data collection anddata processing. These include errors in coverage, response errors, non-response errors, faultyquestionnaires, interviewer’s recording errors, data processing errors, etc. Although numerousefforts were made during the implementation of GATS to minimize these errors, non-samplingerrors are impossible to avoid and difficult to evaluate statistically.
The sample of respondents selected in GATS is only one of the samples that could have beenselected from the same population using the same design and sample size. Each of thesesamples would thus yield results that differ somewhat from the results of the actual sampleselected. Sampling errors are a measure of the variability between all possible samples. Theextent of variability is not known exactly, but can be estimated statistically from the surveyresults.
The following sampling error measures are presented for each of the selected indicators:
• Standard error (SE): Sampling errors are usually measured in terms of standarderrors for a particular estimate or indicator (R). Standard error of an estimate isthus simply the square root of the variance of that estimate, and is computed inthe same units as the estimate.
• Design effect (DEFT) is the ratio of the actual variance of an indicator, under thesampling method used in the survey, to the variance calculated under theassumption of simple random sampling. The square root of the design effect(DEFT) is used to show the efficiency of the sample design. A DEFT value of 1.0indicates that the sample design is as efficient as a simple random sample, whilea DEFT value above 1.0 indicates the increase in the standard error due to the useof a more complex sample design. In general, for a well designed study, the DEFTusually ranges from 1 to 3. It is common, however, for the DEFT to be much larger;up to 7 or 8.
• Relative standard error (SE/R) is the ratio of the standard error to the value of theindicator.
• Confidence limits (R±1.96SE) are calculated to show the interval within which thetrue value for the population can be reasonably assumed to fall. For any givenstatistic calculated from the survey, the value of that statistic will fall within a rangeof plus or minus two times the standard error of the statistic in 95 per cent of allpossible samples of identical size and design.
Calculation of standard error:
If the sample of respondents had been selected as a simple random sample, it would havebeen possible to use straightforward formulas for calculating sampling errors. However, theGATS 2009 sample is the result of a multistage stratified design, and consequently, it wasnecessary to use more complex formulae. For the calculation of sampling errors from GATS
155
GATS Bangladesh Report-2009

data, SPSS Version 17 with a complex samples module was used. The Taylor linearizationmethod of variance estimation for survey estimates that are means or proportions was used.
The Taylor linearization method treats any percentage or average as a ratio estimate, r = y/x,where y represents the total sample value for variable y, and x represents the total numberof cases in the group or subgroup under consideration. The variance of r is computed usingthe formula given below:
where h (=1 or 2) represents the stratum which is urban or rural;
mh is the total number of PSUs selected in the hth stratum;
yhi is the sum of the weighted values of variable y in the ith PSU in the hth stratum;
xhi is the sum of the weighted number of cases in the ith PSU in the hth stratum; and,
f is the overall sampling fraction which is so small that it is ignored.
The results are presented in this appendix for the country as a whole, for urban and ruralareas, and classified by gender. For each variable or indicator, the type of statistic (mean,proportion or rate) and the base population are given in Table A.1. In addition to the samplingerror (SE) described above, the tables (Tables A.2 to A.6) include the value of the estimate(R), the number of unweighted and weighted counts, the design effect (DEFT), the relativestandard error (SE/R), and the 95 percent confidence limits (R±1.96SE) for each variable orindicator.
156
GATS Bangladesh Report-2009
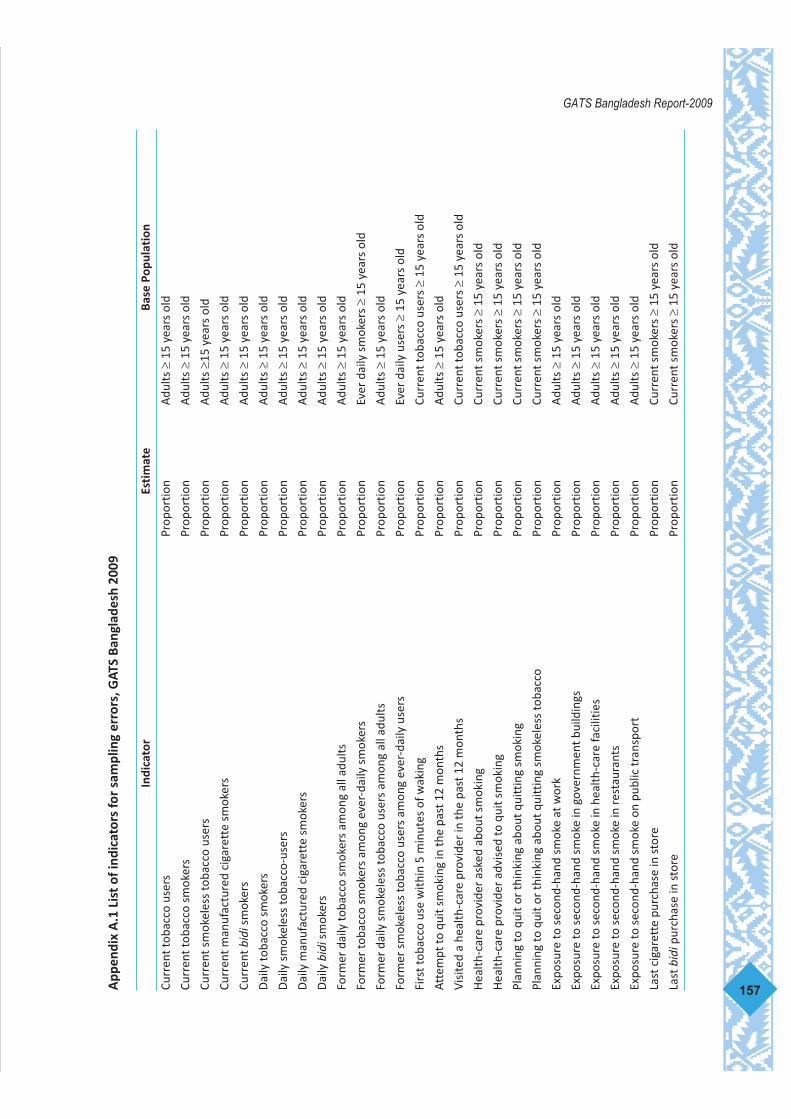
157
GATS Bangladesh Report-2009A
ppen
dix
A.1
Lis
t of
indi
cato
rs fo
r sa
mpl
ing
erro
rs, G
ATS
Bang
lade
sh 2
009
Indi
cato
rEs
tim
ate
Base
Pop
ulat
ion
Curr
ent t
obac
co u
sers
Prop
ortio
nA
dults
≥15
yea
rs o
ld
Curr
ent t
obac
co s
mok
ers
Prop
ortio
nA
dults
≥15
yea
rs o
ld
Curr
ent s
mok
eles
s to
bacc
o us
ers
Prop
ortio
nA
dults
≥15
yea
rs o
ld
Curr
ent m
anuf
actu
red
ciga
rett
e sm
oker
s
Prop
ortio
nA
dults
≥15
yea
rs o
ld
Curr
ent b
idis
mok
ers
Prop
ortio
nA
dults
≥15
yea
rs o
ld
Dai
ly to
bacc
o sm
oker
s
Pr
opor
tion
Adu
lts ≥
15 y
ears
old
Dai
ly s
mok
eles
s to
bacc
o-us
ers
Pr
opor
tion
Adu
lts ≥
15 y
ears
old
Dai
ly m
anuf
actu
red
ciga
rett
e sm
oker
s
Prop
ortio
nA
dults
≥15
yea
rs o
ld
Dai
ly b
idis
mok
ers
Pr
opor
tion
Adu
lts ≥
15 y
ears
old
Form
er d
aily
toba
cco
smok
ers
amon
g al
l adu
lts
Pr
opor
tion
Adu
lts ≥
15 y
ears
old
Form
er to
bacc
o sm
oker
s am
ong
ever
-dai
ly s
mok
ers
Prop
ortio
nEv
er d
aily
sm
oker
s ≥
15 y
ears
old
Form
er d
aily
sm
okel
ess
toba
cco
user
s am
ong
all a
dults
Pr
opor
tion
Adu
lts ≥
15 y
ears
old
Form
er s
mok
eles
s to
bacc
o us
ers
amon
g ev
er-d
aily
use
rs
Prop
ortio
nEv
er d
aily
use
rs ≥
15 y
ears
old
Firs
t tob
acco
use
with
in 5
min
utes
of w
akin
g
Prop
ortio
nCu
rren
t tob
acco
use
rs ≥
15 y
ears
old
Atte
mpt
to q
uit s
mok
ing
in th
e pa
st 1
2 m
onth
s
Pr
opor
tion
Adu
lts ≥
15 y
ears
old
Visi
ted
a he
alth
-car
e pr
ovid
er in
the
past
12
mon
ths
Pr
opor
tion
Curr
ent t
obac
co u
sers
≥15
yea
rs o
ld
Hea
lth-c
are
prov
ider
ask
ed a
bout
sm
okin
g
Prop
ortio
nCu
rren
t sm
oker
s ≥
15 y
ears
old
Hea
lth-c
are
prov
ider
adv
ised
to q
uit s
mok
ing
Prop
ortio
nCu
rren
t sm
oker
s ≥
15 y
ears
old
Plan
ning
to q
uit o
r th
inki
ng a
bout
qui
ttin
g sm
okin
g
Prop
ortio
nCu
rren
t sm
oker
s ≥
15 y
ears
old
Plan
ning
to q
uit o
r th
inki
ng a
bout
qui
ttin
g sm
okel
ess
toba
cco
Pr
opor
tion
Curr
ent s
mok
ers ≥
15 y
ears
old
Expo
sure
to s
econ
d-ha
nd s
mok
e at
wor
k
Prop
ortio
nA
dults
≥15
yea
rs o
ld
Expo
sure
to s
econ
d-ha
nd s
mok
e in
gov
ernm
ent b
uild
ings
Prop
ortio
nA
dults
≥15
yea
rs o
ld
Expo
sure
to s
econ
d-ha
nd s
mok
e in
hea
lth-c
are
faci
litie
s
Prop
ortio
nA
dults
≥15
yea
rs o
ld
Expo
sure
to s
econ
d-ha
nd s
mok
e in
rest
aura
nts
Prop
ortio
nA
dults
≥15
yea
rs o
ld
Expo
sure
to s
econ
d-ha
nd s
mok
e on
pub
lic tr
ansp
ort
Prop
ortio
nA
dults
≥15
yea
rs o
ld
Last
cig
aret
te p
urch
ase
in s
tore
Pr
opor
tion
Curr
ent s
mok
ers ≥
15 y
ears
old
Last
bid
ipur
chas
e in
sto
re
Prop
ortio
nCu
rren
t sm
oker
s ≥
15 y
ears
old

158
GATS Bangladesh Report-2009
Indi
cato
rEs
tim
ate
Base
Pop
ulat
ion
Not
iced
ant
i-cig
aret
te o
r bid
iinf
orm
atio
n at
any
loca
tion
Prop
ortio
nA
dults
≥15
yea
rs o
ld
Not
iced
hea
lth w
arni
ng la
bels
on
ciga
rett
es
Prop
ortio
nA
dults
≥15
yea
rs o
ld
Thin
king
of q
uitt
ing
beca
use
of h
ealth
war
ning
labe
ls o
n ci
gare
ttes
Pr
opor
tion
Curr
ent c
igar
ette
sm
oker
s ≥
15 y
ears
old
Not
iced
hea
lth w
arni
ng la
bels
on
bidi
sPr
opor
tion
Adu
lts ≥
15 y
ears
old
Thin
king
of q
uitt
ing
beca
use
of h
ealth
war
ning
labe
ls o
n bi
dis
Prop
ortio
nCu
rren
t bid
ism
oker
s ≥
15 y
ears
old
Not
iced
hea
lth w
arni
ng la
bels
on
smok
eles
s
Pr
opor
tion
Adu
lts ≥
15 y
ears
old
Thin
king
of q
uitt
ing
beca
use
of h
ealth
war
ning
labe
ls o
n sm
okel
ess
toba
cco
Prop
ortio
nCu
rren
t sm
okel
ess
toba
cco
user
s ≥
15 y
ears
old
Not
iced
any
cig
aret
te a
dver
tisem
ent,
spo
nsor
ship
or
prom
otio
n
Prop
ortio
nA
dults
≥15
yea
rs o
ld
Not
iced
any
bid
iadv
ertis
emen
t, s
pons
orsh
ip o
r pr
omot
ion
Prop
ortio
nA
dults
≥15
yea
rs o
ld
Not
iced
any
sm
okel
ess
toba
cco
adve
rtis
emen
t, s
pons
orsh
ip o
r pr
omot
ion
Prop
ortio
nA
dults
≥15
yea
rs o
ld
Belie
ves
that
sm
okin
g ca
uses
ser
ious
illn
ess
Prop
ortio
nA
dults
≥15
yea
rs o
ld
Belie
ves
that
sm
okel
ess
toba
cco
caus
es s
erio
us il
lnes
s
Pr
opor
tion
Adu
lts ≥
15 y
ears
old
Belie
ves
that
sec
ond-
hand
sm
oke
caus
es s
erio
us il
lnes
s in
non
-sm
oker
sPr
opor
tion
Adu
lts ≥
15 y
ears
old
Num
ber
of c
igar
ette
s sm
oked
per
day
(by
daily
sm
oker
s)
Mea
nCu
rren
t cig
aret
te s
mok
ers ≥
15 y
ears
old
Num
ber
of b
idis
smok
ed p
er d
ay (b
y da
ily s
mok
ers)
M
ean
Curr
ent b
idis
mok
ers ≥
15 y
ears
old
Num
ber
of s
mok
eles
s to
bacc
o us
e in
stan
ces
per
day
(by
daily
use
rs)
M
ean
Curr
ent s
mok
eles
s to
bacc
o us
ers ≥
15 y
ears
old
Age
at d
aily
sm
okin
g in
itiat
ion
M
ean
Ever
dai
ly s
mok
ers ≥
15 y
ears
old
Tim
e si
nce
quitt
ing
smok
ing
(in y
ears
)
M
ean
Form
er s
mok
ers ≥
15 y
ears
old
Tim
e si
nce
quitt
ing
smok
eles
s to
bacc
o us
e (in
yea
rs)
M
ean
Form
er s
mok
eles
s us
ers ≥
15 y
ears
old
Tota
l mon
thly
exp
endi
ture
on
man
ufac
ture
d ci
gare
ttes
M
ean
Curr
ent c
igar
ette
sm
oker
s ≥
15 y
ears
old
Tota
l mon
thly
exp
endi
ture
s on
bid
isM
ean
Curr
ent b
idis
mok
ers ≥
15 y
ears
old
App
endi
x A
.1 (c
ont.
): L
ist
of in
dica
tors
for
sam
plin
g er
rors
, GAT
S Ba
ngla
desh
200
9

159
GATS Bangladesh Report-2009A
ppen
dix
A.2
Sam
plin
g er
rors
for
Nat
iona
l Sam
ple,
GAT
S Ba
ngla
desh
200
9
Indi
cato
rEs
tim
ate
(R)
Stan
dard
erro
r (S
E)
Num
ber
of re
spon
dent
sD
esig
n ef
fect
(DEF
T)Re
lati
ve e
rror
(SE/
R)
Conf
iden
ce li
mit
sun
wei
ghte
d(N
)W
eigh
ted
(000
s) (W
N)
Low
er li
mit
(R-1
.96S
E)U
pper
lim
it(R
+1.9
6SE)
Curr
ent t
obac
co u
sers
0.43
30.
008
9629
9541
82.
784
0.02
00.
417
0.45
0Cu
rren
t tob
acco
sm
oker
s
0.23
00.
006
9629
9541
81.
862
0.02
50.
219
0.24
1Cu
rren
t sm
okel
ess
toba
cco
user
s
0.
272
0.00
996
2995
418
3.54
40.
031
0.25
50.
288
Curr
ent m
anuf
actu
red
ciga
rett
e Sm
oker
s
0.
141
0.00
596
2995
418
2.06
60.
036
0.13
10.
151
Curr
ent b
idis
mok
ers
0.11
20.
006
9629
9541
83.
425
0.05
30.
100
0.12
3D
aily
toba
cco
smok
er
0.
209
0.00
696
2995
418
1.90
80.
027
0.19
80.
220
Dai
ly s
mok
eles
s to
bacc
o us
e
0.23
70.
008
9629
9541
83.
595
0.03
50.
221
0.25
3D
aily
man
ufac
ture
d ci
gare
tte
smok
ers
0.
122
0.00
596
2995
418
2.05
70.
039
0.11
30.
132
Dai
ly b
idis
mok
ing
0.10
60.
006
9629
9541
83.
447
0.05
50.
094
0.11
7Fo
rmer
dai
ly to
bacc
o sm
oker
s am
ong
all a
dults
0.04
70.
003
9629
9541
82.
136
0.06
70.
041
0.05
3Fo
rmer
toba
cco
smok
ers
amon
g ev
er-d
aily
sm
oker
s
0.17
80.
011
2567
2518
52.
247
0.06
40.
155
0.20
0Fo
rmer
dai
ly s
mok
eles
s to
bacc
o us
ers
amon
g al
l adu
lts
0.01
40.
002
9629
9541
81.
774
0.11
40.
011
0.01
7Fo
rmer
sm
okel
ess
toba
cco
user
s am
ong
ever
-dai
ly u
sers
0.00
50.
006
2528
2435
81.
897
0.11
4 0.
004
0.00
7Fi
rst t
obac
co u
se w
ithin
5 m
inut
es o
f wak
ing
0.10
50.
008
3910
3802
52.
357
0.07
20.
090
0.11
9Sm
okin
g qu
it at
tem
pt in
the
past
12
mon
ths
0.
473
0.01
822
8022
671
2.80
50.
037
0.43
90.
507
Visi
ted
a he
alth
-car
e pr
ovid
er in
the
past
12
mon
ths
0.
383
0.01
722
7722
546
2.87
20.
045
0.34
90.
417
Hea
lth-c
are
prov
ider
ask
ed a
bout
sm
okin
g
0.56
00.
031
881
8690
3.38
20.
055
0.50
00.
621
Hea
lth-c
are
prov
ider
adv
ised
to q
uit s
mok
ing
0.52
90.
030
881
8690
3.11
90.
056
0.47
00.
587
Plan
ning
to q
uit o
r th
inki
ng a
bout
qui
ttin
g sm
okin
g
0.
680
0.01
821
9121
458
3.33
10.
027
0.64
50.
716
Plan
ning
to q
uit o
r thi
nkin
g ab
out q
uitt
ing
use
of s
mok
eles
s to
bacc
o
0.48
70.
019
2650
2544
93.
720
0.03
90.
450
0.52
4Ex
posu
re to
sec
ond-
hand
sm
oke
at w
ork
0.
630
0.01
921
6418
327
3.38
90.
030
0.59
30.
668
Expo
sure
to s
econ
d-ha
nd s
mok
e in
gov
ernm
ent b
uild
ings
0.05
40.
003
9618
9523
41.
954
0.06
00.
047
0.06
0Ex
posu
re to
sec
ond-
hand
sm
oke
in h
ealth
-car
e fa
cilit
ies
0.05
80.
004
9623
9538
53.
081
0.07
20.
049
0.06
6Ex
posu
re to
sec
ond-
hand
sm
oke
in re
stau
rant
s
0.27
60.
008
9625
9537
33.
129
0.02
90.
260
0.29
2Ex
posu
re to
sec
ond-
hand
sm
oke
on p
ublic
tran
spor
t0.
263
0.00
896
2095
338
3.00
00.
030
0.24
80.
279
Last
cig
aret
te p
urch
ase
in s
tore
0.98
70.
004
1454
1313
61.
464
0.00
40.
980
0.99
4La
st b
idip
urch
ase
in s
tore
0.
924
0.01
390
710
184
2.13
50.
014
0.89
80.
949
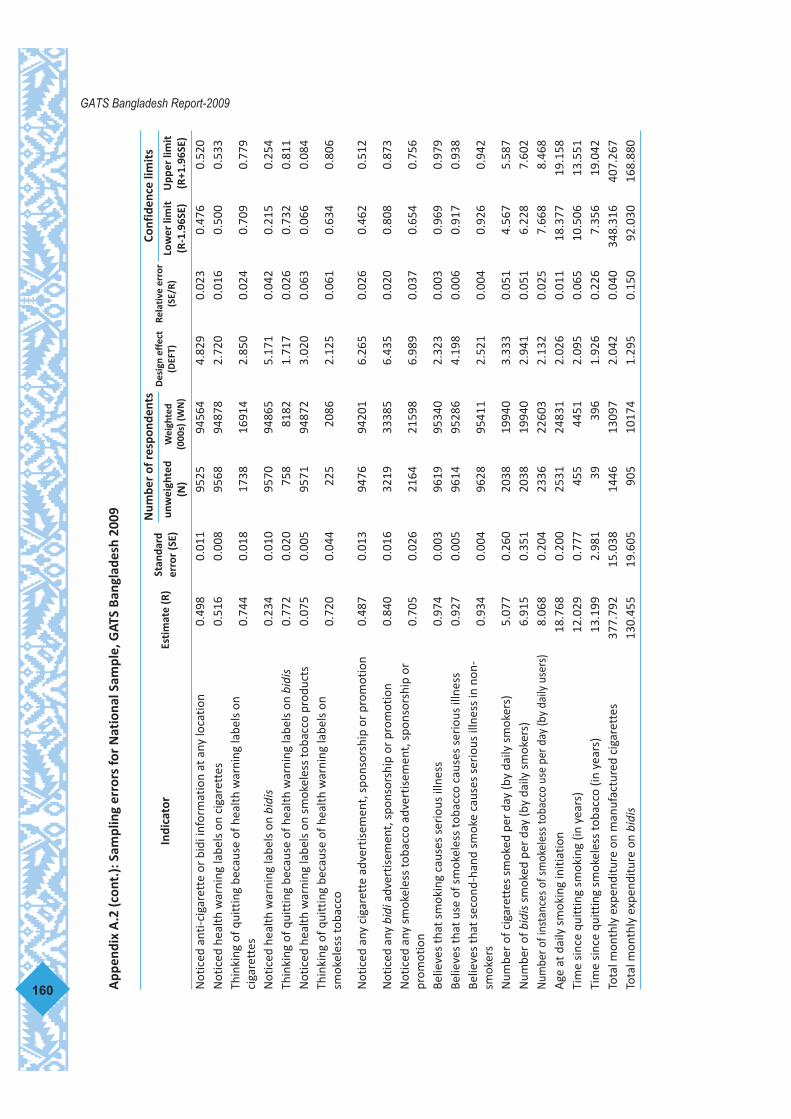
160
GATS Bangladesh Report-2009
Indi
cato
rEs
tim
ate
(R)
Stan
dard
erro
r (S
E)
Num
ber
of re
spon
dent
sD
esig
n ef
fect
(DEF
T)Re
lati
ve e
rror
(SE/
R)
Conf
iden
ce li
mit
sun
wei
ghte
d(N
)W
eigh
ted
(000
s) (W
N)
Low
er li
mit
(R-1
.96S
E)U
pper
lim
it(R
+1.9
6SE)
Not
iced
ant
i-cig
aret
te o
r bi
di in
form
atio
n at
any
loca
tion
0.
498
0.01
195
2594
564
4.82
90.
023
0.47
60.
520
Not
iced
hea
lth w
arni
ng la
bels
on
ciga
rett
es
0.51
60.
008
9568
9487
82.
720
0.01
60.
500
0.53
3Th
inki
ng o
f qui
ttin
g be
caus
e of
hea
lth w
arni
ng la
bels
on
ciga
rett
es
0.74
40.
018
1738
1691
42.
850
0.02
40.
709
0.77
9
Not
iced
hea
lth w
arni
ng la
bels
on
bidi
s0.
234
0.01
095
7094
865
5.17
10.
042
0.21
50.
254
Thin
king
of q
uitt
ing
beca
use
of h
ealth
war
ning
labe
ls o
n bi
dis
0.77
20.
020
758
8182
1.71
70.
026
0.73
20.
811
Not
iced
hea
lth w
arni
ng la
bels
on
smok
eles
s to
bacc
o pr
oduc
ts
0.07
50.
005
9571
9487
23.
020
0.06
30.
066
0.08
4Th
inki
ng o
f qui
ttin
g be
caus
e of
hea
lth w
arni
ng la
bels
on
smok
eles
s to
bacc
o
0.72
00.
044
225
2086
2.12
50.
061
0.63
40.
806
Not
iced
any
cig
aret
te a
dver
tisem
ent,
spo
nsor
ship
or
prom
otio
n
0.
487
0.01
394
7694
201
6.26
50.
026
0.46
20.
512
Not
iced
any
bid
iadv
ertis
emen
t, s
pons
orsh
ip o
r pr
omot
ion
0.84
00.
016
3219
3338
56.
435
0.02
00.
808
0.87
3N
otic
ed a
ny s
mok
eles
s to
bacc
o ad
vert
isem
ent,
spo
nsor
ship
or
prom
otio
n
0.70
50.
026
2164
2159
86.
989
0.03
70.
654
0.75
6
Belie
ves
that
sm
okin
g ca
uses
ser
ious
illn
ess
0.97
40.
003
9619
9534
02.
323
0.00
30.
969
0.97
9Be
lieve
s th
at u
se o
f sm
okel
ess
toba
cco
caus
es s
erio
us il
lnes
s
0.92
70.
005
9614
9528
64.
198
0.00
60.
917
0.93
8Be
lieve
s th
at s
econ
d-ha
nd s
mok
e ca
uses
ser
ious
illn
ess
in n
on-
smok
ers
0.93
40.
004
9628
9541
12.
521
0.00
40.
926
0.94
2
Num
ber
of c
igar
ette
s sm
oked
per
day
(by
daily
sm
oker
s)
5.
077
0.26
020
3819
940
3.33
30.
051
4.56
75.
587
Num
ber
of b
idis
smok
ed p
er d
ay (b
y da
ily s
mok
ers)
6.91
50.
351
2038
1994
02.
941
0.05
16.
228
7.60
2N
umbe
r of i
nsta
nces
of s
mok
eles
s tob
acco
use
per
day
(by
daily
use
rs)
8.06
80.
204
2336
2260
32.
132
0.02
57.
668
8.46
8A
ge a
t dai
ly s
mok
ing
initi
atio
n
18
.768
0.20
025
3124
831
2.02
60.
011
18.3
7719
.158
Tim
e si
nce
quitt
ing
smok
ing
(in y
ears
)
12.0
290.
777
455
4451
2.09
50.
065
10.5
0613
.551
Tim
e si
nce
quitt
ing
smok
eles
s to
bacc
o (in
yea
rs)
13.1
992.
981
3939
61.
926
0.22
67.
356
19.0
42To
tal m
onth
ly e
xpen
ditu
re o
n m
anuf
actu
red
ciga
rett
es
37
7.79
215
.038
1446
1309
72.
042
0.04
034
8.31
640
7.26
7To
tal m
onth
ly e
xpen
ditu
re o
n bi
dis
130.
455
19.6
0590
510
174
1.29
50.
150
92.0
3016
8.88
0
App
endi
x A
.2 (c
ont.
): S
ampl
ing
erro
rs fo
r N
atio
nal S
ampl
e, G
ATS
Bang
lade
sh 2
009

161
GATS Bangladesh Report-2009A
ppen
dix
A.3
Sam
plin
g er
rors
for
mal
es, G
ATS
Bang
lade
sh 2
009
Indi
cato
rEs
tim
ate
(R)
Stan
dard
erro
r (S
E)
Num
ber
of re
spon
dent
sD
esig
n ef
fect
(DEF
T)Re
lati
ve e
rror
(SE/
R)
Conf
iden
ce li
mit
sun
wei
ghte
d(N
)W
eigh
ted
(000
s) (W
N)
Low
er li
mit
(R-1
.96S
E)U
pper
lim
it(R
+1.9
6SE)
Curr
ent t
obac
co u
sers
0.58
00.
011
4468
4744
22.
129
0.01
90.
559
0.60
2Cu
rren
t tob
acco
sm
oker
s
0.44
70.
011
4468
4744
22.
326
0.02
50.
425
0.46
9Cu
rren
t sm
okel
ess
toba
cco
user
s
0.
264
0.01
144
6847
442
2.91
60.
043
0.24
20.
286
Curr
ent m
anuf
actu
red
ciga
rett
e sm
oker
s
0.
283
0.01
144
6847
442
2.40
70.
037
0.26
20.
303
Curr
ent b
idis
mok
ers
0.21
40.
012
4468
4744
23.
511
0.05
40.
191
0.23
6D
aily
toba
cco
smok
er
0.
407
0.01
144
6847
442
2.28
30.
027
0.38
50.
429
Dai
ly s
mok
eles
s to
bacc
o us
e
0.20
70.
011
4468
4744
23.
065
0.05
10.
187
0.22
8D
aily
man
ufac
ture
d ci
gare
tte
smok
ers
0.
245
0.01
044
6847
442
2.32
10.
040
0.22
60.
264
Dai
ly b
idis
mok
ing
0.20
30.
011
4468
4744
23.
462
0.05
50.
181
0.22
5Fo
rmer
dai
ly to
bacc
o sm
oker
s am
ong
all a
dults
0.08
40.
006
4468
4744
22.
271
0.07
40.
072
0.09
7Fo
rmer
toba
cco
smok
ers
amon
g ev
er-d
aily
sm
oker
s
0.16
70.
012
2457
2405
82.
451
0.07
10.
143
0.19
0Fo
rmer
dai
ly s
mok
eles
s to
bacc
o us
ers
amon
g al
l adu
lts
0.01
90.
003
4468
4744
21.
890
0.15
00.
013
0.02
4Fo
rmer
sm
okel
ess
toba
cco
user
s am
ong
ever
-dai
ly u
sers
0.07
90.
012
1111
1109
22.
320
0.15
30.
058
0.10
6Fi
rst t
obac
co u
se w
ithin
5 m
inut
es o
f wak
ing
0.10
70.
010
2521
2500
82.
421
0.09
00.
088
0.12
6At
tem
pts
to q
uit s
mok
ing
in th
e pa
st 1
2 m
onth
s
0.47
80.
018
2201
2193
12.
780
0.03
70.
444
0.51
3Vi
site
d a
heal
th-c
are
prov
ider
in th
e pa
st 1
2 m
onth
s
0.38
80.
017
2199
2181
62.
771
0.04
50.
354
0.42
2H
ealth
-car
e pr
ovid
er a
sked
abo
ut s
mok
ing
0.
559
0.03
185
485
033.
358
0.05
60.
497
0.62
0H
ealth
-car
e pr
ovid
er a
dvis
ed to
qui
t sm
okin
g
0.
527
0.03
085
485
033.
092
0.05
70.
468
0.58
6Pl
anni
ng to
qui
t or
thin
king
abo
ut q
uitt
ing
smok
ing
0.69
10.
018
2117
2075
73.
224
0.02
60.
655
0.72
6Pl
anni
ng to
qui
t or
thin
king
abo
ut q
uitt
ing
smok
eles
s to
bacc
o
0.61
10.
029
1221
1211
94.
308
0.04
70.
554
0.66
8Ex
posu
re to
sec
ond-
hand
sm
oke
at w
ork
0.
678
0.02
017
6115
975
3.26
50.
030
0.63
90.
717
Expo
sure
to s
econ
d-ha
nd s
mok
e in
gov
ernm
ent b
uild
ings
0.09
20.
006
4461
4731
71.
948
0.06
60.
081
0.10
4Ex
posu
re to
sec
ond-
hand
sm
oke
in h
ealth
-car
e fa
cilit
ies
0.07
10.
008
4465
4742
94.
408
0.11
40.
055
0.08
7Ex
posu
re to
sec
ond-
hand
sm
oke
in re
stau
rant
s
0.53
40.
015
4464
4739
83.
990
0.02
80.
505
0.56
3Ex
posu
re to
sec
ond-
hand
sm
oke
on p
ublic
tran
spor
t 0.
359
0.01
244
6347
389
2.90
30.
034
0.33
50.
383
Last
cig
aret
te p
urch
ase
in s
tore
0.98
70.
004
1447
1310
21.
461
0.00
40.
980
0.99
4La
st b
idip
urch
ase
in s
tore
0.
929
0.01
386
398
152.
100
0.01
40.
904
0.95
4

162
GATS Bangladesh Report-2009
Indi
cato
rEs
tim
ate
(R)
Stan
dard
erro
r (S
E)
Num
ber
of re
spon
dent
sD
esig
n ef
fect
(DEF
T)Re
lati
ve e
rror
(SE/
R)
Conf
iden
ce li
mit
sun
wei
ghte
d(N
)W
eigh
ted
(000
s) (W
N)
Low
er li
mit
(R-1
.96S
E)U
pper
lim
it(R
+1.9
6SE)
Not
iced
ant
i-cig
aret
te o
r bid
iinf
orm
atio
n at
any
loca
tion
0.
565
0.01
544
4347
229
3.93
20.
026
0.53
60.
594
Not
iced
hea
lth w
arni
ng la
bels
on
ciga
rett
es
0.75
30.
011
4441
4725
62.
926
0.01
50.
732
0.77
5Th
inki
ng o
f qui
ttin
g be
caus
e of
hea
lth w
arni
ng la
bels
on
ciga
rett
es
0.74
50.
018
1729
1681
42.
777
0.02
30.
711
0.78
0
Not
iced
hea
lth w
arni
ng la
bels
on
bidi
s0.
356
0.01
644
4047
232
4.89
50.
045
0.32
50.
387
Thin
king
of q
uitt
ing
beca
use
of h
ealth
war
ning
labe
ls o
n bi
dis
0.7
730.
020
750
8116
1.74
30.
026
0.73
30.
812
Not
iced
hea
lth w
arni
ng la
bels
on
smok
eles
s to
bacc
o pr
oduc
ts0.
087
0.00
844
4247
241
3.24
00.
087
0.07
20.
102
Thin
king
of q
uitt
ing
beca
use
of h
ealth
war
ning
labe
ls o
nsm
okel
ess
toba
cco
0.
741
0.06
013
112
572.
445
0.08
10.
623
0.85
8
Not
iced
any
cig
aret
te a
dver
tisem
ent,
spo
nsor
ship
or
prom
otio
n
0.
680
0.01
644
4647
231
4.92
30.
023
0.65
00.
710
Not
iced
any
bid
iadv
ertis
emen
t, s
pons
orsh
ip o
r pr
omot
ion
0.85
90.
019
2090
2243
76.
058
0.02
20.
823
0.89
6N
otic
ed a
ny s
mok
eles
s to
bacc
o ad
vert
isem
ent,
spo
nsor
ship
or
prom
otio
n
0.70
80.
032
1285
1341
86.
492
0.04
60.
645
0.77
2
Belie
ves
that
sm
okin
g ca
uses
ser
ious
illn
ess
0.97
60.
004
4464
4743
22.
392
0.00
40.
969
0.98
3Be
lieve
s th
at u
se o
f sm
okel
ess
toba
cco
caus
es s
erio
us il
lnes
s 0.
926
0.00
744
6047
396
2.98
10.
007
0.91
30.
940
Belie
ves
that
sec
ond-
hand
sm
oke
caus
es s
erio
us il
lnes
s in
non
-sm
oker
s0.
970
0.00
444
6747
435
2.04
70.
004
0.96
30.
977
Num
ber
of c
igar
ette
s sm
oked
per
day
(by
daily
sm
oker
s)
5.
219
0.26
419
7219
302
3.29
00.
051
4.70
15.
738
Num
ber
of b
idis
smok
ed p
er d
ay (b
y da
ily s
mok
ers)
7.00
10.
357
1972
1930
22.
902
0.05
16.
302
7.70
0N
umbe
r of
sm
okel
ess
toba
cco
uses
per
day
(by
daily
use
rs)
8
.250
0.31
298
098
412.
049
0.03
87.
639
8.86
2A
ge a
t dai
ly s
mok
ing
initi
atio
n 18
.439
0.17
424
3123
814
1.91
60.
009
18.0
9818
.780
Tim
e si
nce
quitt
ing
smok
ing
(in y
ears
)11
.795
0.80
741
540
052.
151
0.06
910
.212
13.3
77Ti
me
sinc
e qu
ittin
g sm
okel
ess
toba
cco
(in y
ears
)12
.353
2.95
837
372
2.00
10.
239
6.55
618
.151
Tota
l mon
thly
exp
endi
ture
on
man
ufac
ture
d ci
gare
ttes
378.
433
15.0
7814
3913
063
2.04
50.
040
348.
880
407.
986
Tota
l mon
thly
exp
endi
ture
s on
bid
is13
1.05
120
.302
863
9815
1.30
80.
155
91.2
5917
0.84
2
App
endi
x A
.3 (c
ont.
): S
ampl
ing
erro
rs fo
r m
ales
, GAT
S Ba
ngla
desh
200
9
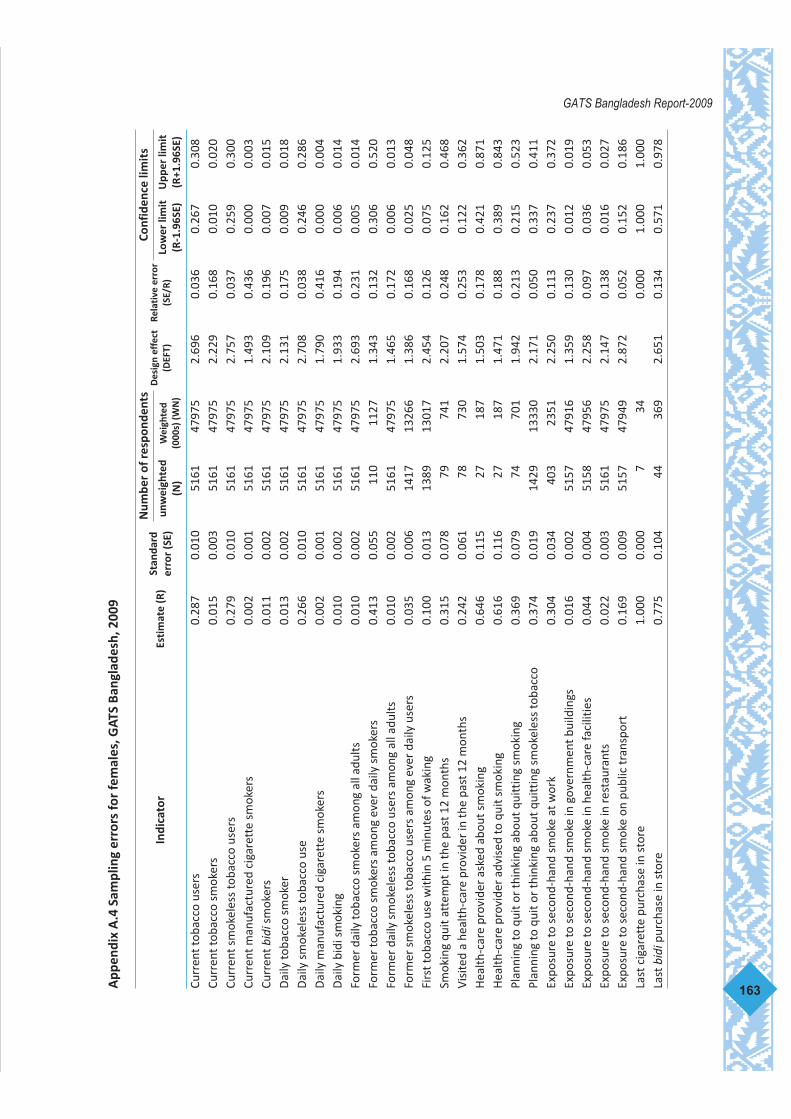
163
GATS Bangladesh Report-2009A
ppen
dix
A.4
Sam
plin
g er
rors
for
fem
ales
, GAT
S Ba
ngla
desh
, 200
9
Indi
cato
rEs
tim
ate
(R)
Stan
dard
erro
r (S
E)
Num
ber
of re
spon
dent
sD
esig
n ef
fect
(DEF
T)Re
lati
ve e
rror
(SE/
R)
Conf
iden
ce li
mit
sun
wei
ghte
d(N
)W
eigh
ted
(000
s) (W
N)
Low
er li
mit
(R-1
.96S
E)U
pper
lim
it(R
+1.9
6SE)
Curr
ent t
obac
co u
sers
0.28
70.
010
5161
4797
52.
696
0.03
60.
267
0.30
8Cu
rren
t tob
acco
sm
oker
s
0.01
50.
003
5161
4797
52.
229
0.16
80.
010
0.02
0Cu
rren
t sm
okel
ess
toba
cco
user
s
0.
279
0.01
051
6147
975
2.75
70.
037
0.25
90.
300
Curr
ent m
anuf
actu
red
ciga
rett
e sm
oker
s
0.
002
0.00
151
6147
975
1.49
30.
436
0.00
00.
003
Curr
ent b
idis
mok
ers
0.01
10.
002
5161
4797
52.
109
0.19
60.
007
0.01
5D
aily
toba
cco
smok
er
0.
013
0.00
251
6147
975
2.13
10.
175
0.00
90.
018
Dai
ly s
mok
eles
s to
bacc
o us
e
0.26
60.
010
5161
4797
52.
708
0.03
80.
246
0.28
6D
aily
man
ufac
ture
d ci
gare
tte
smok
ers
0.
002
0.00
151
6147
975
1.79
00.
416
0.00
00.
004
Dai
ly b
idi s
mok
ing
0.01
00.
002
5161
4797
51.
933
0.19
40.
006
0.01
4Fo
rmer
dai
ly to
bacc
o sm
oker
s am
ong
all a
dults
0.01
00.
002
5161
4797
52.
693
0.23
10.
005
0.01
4Fo
rmer
toba
cco
smok
ers
amon
g ev
er d
aily
sm
oker
s
0.41
30.
055
110
1127
1.34
30.
132
0.30
60.
520
Form
er d
aily
sm
okel
ess
toba
cco
user
s am
ong
all a
dults
0.
010
0.00
251
6147
975
1.46
50.
172
0.00
60.
013
Form
er s
mok
eles
s to
bacc
o us
ers
amon
g ev
er d
aily
use
rs0.
035
0.00
614
1713
266
1.38
60.
168
0.02
50.
048
Firs
t tob
acco
use
with
in 5
min
utes
of w
akin
g
0.
100
0.01
313
8913
017
2.45
40.
126
0.07
50.
125
Smok
ing
quit
atte
mpt
in th
e pa
st 1
2 m
onth
s
0.31
50.
078
7974
12.
207
0.24
80.
162
0.46
8Vi
site
d a
heal
th-c
are
prov
ider
in th
e pa
st 1
2 m
onth
s
0.24
20.
061
7873
01.
574
0.25
30.
122
0.36
2H
ealth
-car
e pr
ovid
er a
sked
abo
ut s
mok
ing
0.64
60.
115
2718
71.
503
0.17
80.
421
0.87
1H
ealth
-car
e pr
ovid
er a
dvis
ed to
qui
t sm
okin
g
0.
616
0.11
627
187
1.47
10.
188
0.38
90.
843
Plan
ning
to q
uit o
r th
inki
ng a
bout
qui
ttin
g sm
okin
g
0.
369
0.07
974
701
1.94
20.
213
0.21
50.
523
Plan
ning
to q
uit o
r th
inki
ng a
bout
qui
ttin
g sm
okel
ess
toba
cco
0.
374
0.01
914
2913
330
2.17
10.
050
0.33
70.
411
Expo
sure
to s
econ
d-ha
nd s
mok
e at
wor
k 0.
304
0.03
440
323
512.
250
0.11
30.
237
0.37
2Ex
posu
re to
sec
ond-
hand
sm
oke
in g
over
nmen
t bui
ldin
gs0.
016
0.00
251
5747
916
1.35
90.
130
0.01
20.
019
Expo
sure
to s
econ
d-ha
nd s
mok
e in
hea
lth-c
are
faci
litie
s
0.
044
0.00
451
5847
956
2.25
80.
097
0.03
60.
053
Expo
sure
to s
econ
d-ha
nd s
mok
e in
rest
aura
nts
0.
022
0.00
351
6147
975
2.14
70.
138
0.01
60.
027
Expo
sure
to s
econ
d-ha
nd s
mok
e on
pub
lic tr
ansp
ort
0.16
90.
009
5157
4794
92.
872
0.05
20.
152
0.18
6La
st c
igar
ette
pur
chas
e in
sto
re
1.00
00.
000
734
0.00
01.
000
1.00
0La
st b
idip
urch
ase
in s
tore
0.
775
0.10
444
369
2.65
10.
134
0.57
10.
978
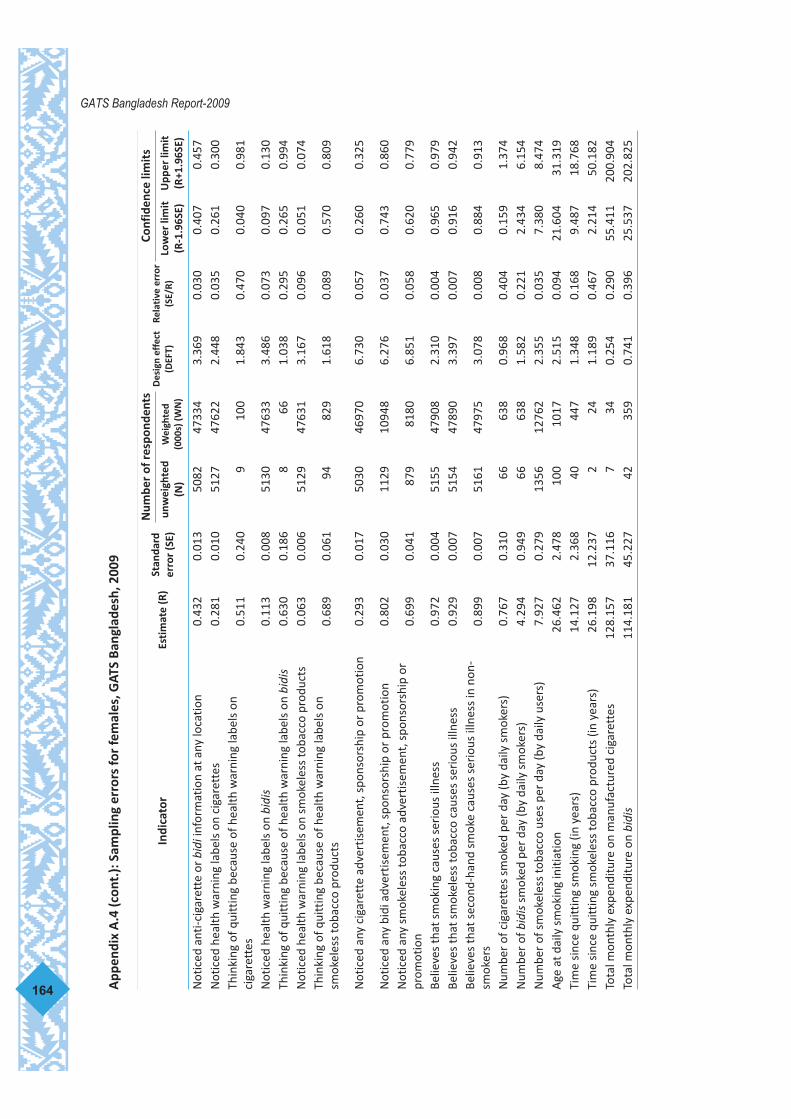
164
GATS Bangladesh Report-2009
Indi
cato
rEs
tim
ate
(R)
Stan
dard
erro
r (S
E)
Num
ber
of re
spon
dent
sD
esig
n ef
fect
(DEF
T)Re
lati
ve e
rror
(SE/
R)
Conf
iden
ce li
mit
sun
wei
ghte
d(N
)W
eigh
ted
(000
s) (W
N)
Low
er li
mit
(R-1
.96S
E)U
pper
lim
it(R
+1.9
6SE)
Not
iced
ant
i-cig
aret
te o
r bid
iinf
orm
atio
n at
any
loca
tion
0.
432
0.01
350
8247
334
3.36
90.
030
0.40
70.
457
Not
iced
hea
lth w
arni
ng la
bels
on
ciga
rett
es
0.28
10.
010
5127
4762
22.
448
0.03
50.
261
0.30
0Th
inki
ng o
f qui
ttin
g be
caus
e of
hea
lth w
arni
ng la
bels
on
ciga
rett
es
0.51
10.
240
910
01.
843
0.47
00.
040
0.98
1
Not
iced
hea
lth w
arni
ng la
bels
on
bidi
s0.
113
0.00
851
3047
633
3.48
60.
073
0.09
70.
130
Thin
king
of q
uitt
ing
beca
use
of h
ealth
war
ning
labe
ls o
n bi
dis
0.63
00.
186
866
1.03
80.
295
0.26
50.
994
Not
iced
hea
lth w
arni
ng la
bels
on
smok
eles
s to
bacc
o pr
oduc
ts
0.06
30.
006
5129
4763
13.
167
0.09
60.
051
0.07
4Th
inki
ng o
f qui
ttin
g be
caus
e of
hea
lth w
arni
ng la
bels
on
smok
eles
s to
bacc
o pr
oduc
ts0.
689
0.06
194
829
1.61
80.
089
0.57
00.
809
Not
iced
any
cig
aret
te a
dver
tisem
ent,
spo
nsor
ship
or
prom
otio
n
0.
293
0.01
750
3046
970
6.73
00.
057
0.26
00.
325
Not
iced
any
bid
i adv
ertis
emen
t, s
pons
orsh
ip o
r pr
omot
ion
0.80
20.
030
1129
1094
86.
276
0.03
70.
743
0.86
0N
otic
ed a
ny s
mok
eles
s to
bacc
o ad
vert
isem
ent,
spo
nsor
ship
or
prom
otio
n
0.69
90.
041
879
8180
6.85
10.
058
0.62
00.
779
Belie
ves
that
sm
okin
g ca
uses
ser
ious
illn
ess
0.97
20.
004
5155
4790
82.
310
0.00
40.
965
0.97
9Be
lieve
s th
at s
mok
eles
s to
bacc
o ca
uses
ser
ious
illn
ess
0.
929
0.00
751
5447
890
3.39
70.
007
0.91
60.
942
Belie
ves
that
sec
ond-
hand
sm
oke
caus
es s
erio
us il
lnes
s in
non
-sm
oker
s0.
899
0.00
751
6147
975
3.07
80.
008
0.88
40.
913
Num
ber
of c
igar
ette
s sm
oked
per
day
(by
daily
sm
oker
s)
0.
767
0.31
066
638
0.96
80.
404
0.15
91.
374
Num
ber
of b
idis
smok
ed p
er d
ay (b
y da
ily s
mok
ers)
4.29
40.
949
6663
81.
582
0.22
12.
434
6.15
4N
umbe
r of
sm
okel
ess
toba
cco
uses
per
day
(by
daily
use
rs)
7
.927
0.27
913
5612
762
2.35
50.
035
7.38
08.
474
Age
at d
aily
sm
okin
g in
itiat
ion
26.4
622.
478
100
1017
2.51
50.
094
21.6
0431
.319
Tim
e si
nce
quitt
ing
smok
ing
(in y
ears
)
14.1
272.
368
4044
71.
348
0.16
89.
487
18.7
68Ti
me
sinc
e qu
ittin
g sm
okel
ess
toba
cco
prod
ucts
(in
year
s)
26.1
9812
.237
224
1.18
90.
467
2.21
450
.182
Tota
l mon
thly
exp
endi
ture
on
man
ufac
ture
d ci
gare
ttes
12
8.15
737
.116
734
0.25
40.
290
55.4
1120
0.90
4To
tal m
onth
ly e
xpen
ditu
re o
n bi
dis
114.
181
45.2
2742
359
0.74
10.
396
25.5
3720
2.82
5
App
endi
x A
.4 (c
ont.
): S
ampl
ing
erro
rs fo
r fe
mal
es, G
ATS
Bang
lade
sh, 2
009

165
GATS Bangladesh Report-2009A
ppen
dix
A.5
Sam
plin
g er
rors
for
urba
n po
pula
tion
, GAT
S Ba
ngla
desh
200
9
Indi
cato
rEs
tim
ate
(R)
Stan
dard
erro
r (S
E)
Num
ber
of re
spon
dent
sD
esig
n ef
fect
(DEF
T)Re
lati
ve e
rror
(SE/
R)
Conf
iden
ce li
mit
sun
wei
ghte
d(N
)W
eigh
ted
(000
s) (W
N)
Low
er li
mit
(R-1
.96S
E)U
pper
lim
it(R
+1.9
6SE)
Curr
ent t
obac
co u
sers
0.38
10.
013
4857
2497
23.
454
0.03
40.
356
0.40
7Cu
rren
t tob
acco
sm
oker
s
0.21
30.
008
4857
2497
21.
800
0.03
70.
197
0.22
8Cu
rren
t sm
okel
ess
toba
cco
user
s
0.
225
0.01
248
5724
972
3.71
30.
051
0.20
20.
247
Curr
ent m
anuf
actu
red
ciga
rett
e sm
oker
s
0.
184
0.00
848
5724
972
1.87
00.
041
0.16
90.
199
Curr
ent b
idis
mok
ers
0.04
70.
005
4857
2497
22.
917
0.11
10.
036
0.05
7D
aily
toba
cco
smok
er
0.
192
0.00
848
5724
972
1.97
30.
041
0.17
60.
207
Dai
ly s
mok
eles
s to
bacc
o us
e
0.18
60.
011
4857
2497
23.
926
0.06
00.
164
0.20
7D
aily
man
ufac
ture
d ci
gare
tte
smok
ers
0.
164
0.00
848
5724
972
1.98
60.
046
0.15
00.
179
Dai
ly b
idis
mok
ing
0.04
20.
006
4857
2497
23.
847
0.13
50.
031
0.05
3Fo
rmer
dai
ly to
bacc
o sm
oker
s am
ong
all a
dults
0.04
70.
005
4857
2497
22.
874
0.11
00.
037
0.05
7Fo
rmer
toba
cco
smok
ers
amon
g ev
er-d
aily
sm
oker
s
0.19
10.
019
1226
6155
2.93
50.
101
0.15
30.
229
Form
er d
aily
sm
okel
ess
toba
cco
user
s am
ong
all a
dults
0.
015
0.00
248
5724
972
1.52
70.
142
0.01
10.
020
Form
er s
mok
eles
s to
bacc
o us
ers
amon
g ev
er-d
aily
use
rs0.
075
0.01
210
8551
221.
025
0.15
40.
055
0.10
1Fi
rst t
obac
co u
se w
ithin
5 m
inut
es o
f wak
ing
0.10
40.
014
1753
8496
3.69
60.
135
0.07
60.
131
Atte
mpt
s to
qui
t sm
okin
g in
the
past
12
mon
ths
0.
534
0.02
410
8055
572.
436
0.04
40.
487
0.58
0Vi
site
d a
heal
th-c
are
prov
ider
in th
e pa
st 1
2 m
onth
s
0.41
20.
031
1086
5579
4.37
60.
076
0.35
00.
473
Hea
lth-c
are
prov
ider
ask
ed a
bout
sm
okin
g
0.52
30.
076
439
2312
10.0
660.
145
0.37
40.
671
Hea
lth-c
are
prov
ider
adv
ised
to q
uit s
mok
ing
0.49
00.
072
439
2312
9.07
00.
147
0.34
90.
631
Plan
ning
to q
uit o
r th
inki
ng a
bout
qui
ttin
g sm
okin
g
0.
695
0.02
510
5252
583.
130
0.03
60.
645
0.74
4Pl
anni
ng to
qui
t or t
hink
ing
abou
t qui
ttin
g sm
okel
ess
toba
cco
use
0.54
40.
034
1144
5489
5.28
00.
062
0.47
70.
610
Expo
sure
to s
econ
d-ha
nd s
mok
e at
wor
k
0.58
80.
026
1487
7539
4.24
50.
045
0.53
60.
639
Expo
sure
to s
econ
d-ha
nd s
mok
e in
gov
ernm
ent b
uild
ings
0.07
80.
007
4851
2492
63.
056
0.08
70.
064
0.09
1Ex
posu
re to
sec
ond-
hand
sm
oke
in h
ealth
-car
e fa
cilit
ies
0.06
80.
010
4851
2493
96.
965
0.14
00.
049
0.08
7Ex
posu
re to
sec
ond-
hand
sm
oke
in re
stau
rant
s
0.29
90.
009
4856
2496
21.
843
0.03
00.
282
0.31
7Ex
posu
re to
sec
ond-
hand
sm
oke
on p
ublic
tran
spor
t 0.
264
0.01
048
5024
919
2.35
50.
037
0.24
50.
283
Last
cig
aret
te p
urch
ase
in s
tore
0.
983
0.00
588
244
911.
219
0.00
50.
974
0.99
3La
st b
idip
urch
ase
in s
tore
0.
874
0.04
123
210
183.
472
0.04
70.
795
0.95
4

166
GATS Bangladesh Report-2009
Indi
cato
rEs
tim
ate
(R)
Stan
dard
erro
r (S
E)
Num
ber
of re
spon
dent
sD
esig
n ef
fect
(DEF
T)Re
lati
ve e
rror
(SE/
R)
Conf
iden
ce li
mit
sun
wei
ghte
d(N
)W
eigh
ted
(000
s) (W
N)
Low
er li
mit
(R-1
.96S
E)U
pper
lim
it(R
+1.9
6SE)
Not
iced
ant
i-cig
aret
te o
r bid
iinf
orm
atio
n at
any
loca
tion
0.
570
0.01
748
0624
759
5.45
00.
029
0.53
80.
603
Not
iced
hea
lth w
arni
ng la
bels
on
ciga
rett
es
0.54
60.
012
4828
2484
62.
751
0.02
20.
522
0.56
9Th
inki
ng o
f qui
ttin
g be
caus
e of
hea
lth w
arni
ng la
bels
on
ciga
rett
es
0.74
10.
024
892
4543
2.66
50.
032
0.69
40.
788
Not
iced
hea
lth w
arni
ng la
bels
on
bidi
s0.
177
0.01
348
3224
862
5.46
50.
073
0.15
20.
202
Thin
king
of q
uitt
ing
beca
use
of h
ealth
war
ning
labe
ls o
n bi
dis
0.76
70.
040
284
1516
2.49
80.
052
0.68
90.
845
Not
iced
hea
lth w
arni
ng la
bels
on
smok
eles
s 0.
063
0.00
548
3524
880
2.16
60.
082
0.05
30.
073
Thin
king
of q
uitt
ing
beca
use
of h
ealth
war
ning
labe
ls o
nsm
okel
ess
toba
cco
0.76
30.
053
106
491
1.62
90.
069
0.66
00.
867
Not
iced
any
cig
aret
te a
dver
tisem
ent,
spo
nsor
ship
or
prom
otio
n 0.
483
0.02
047
5824
463
7.29
00.
041
0.44
50.
521
Not
iced
any
bid
iadv
ertis
emen
t, s
pons
orsh
ip o
r pr
omot
ion
0.75
50.
029
1572
8051
7.11
50.
038
0.69
80.
812
Not
iced
any
sm
okel
ess
toba
cco
adve
rtis
emen
t, s
pons
orsh
ip o
rpr
omot
ion
0.61
10.
040
1129
5977
7.57
90.
065
0.53
20.
689
Belie
ves
that
sm
okin
g ca
uses
ser
ious
illn
ess
0.97
50.
004
4851
2494
12.
729
0.00
40.
968
0.98
2Be
lieve
s th
at s
mok
eles
s to
bacc
o ca
uses
ser
ious
illn
ess
0.
949
0.00
748
4924
929
5.03
60.
008
0.93
50.
963
Belie
ves
that
sec
ond-
hand
sm
oke
caus
es s
erio
us il
lnes
s in
non
-sm
oker
s0.
967
0.00
448
5724
972
2.32
80.
004
0.95
90.
974
Num
ber
of c
igar
ette
s sm
oked
per
day
(by
daily
sm
oker
s)
8.
513
0.49
196
447
912.
272
0.05
87.
552
9.47
4N
umbe
r of
bid
issm
oked
per
day
(by
daily
sm
oker
s)
2.
654
0.37
196
447
911.
451
0.14
01.
928
3.38
1N
umbe
r of
sm
okel
ess
toba
cco
uses
per
day
(by
daily
use
rs)
8
.062
0.35
497
846
331.
443
0.04
47.
367
8.75
6A
ge a
t dai
ly s
mok
ing
initi
atio
n
18
.522
0.30
212
0860
611.
352
0.01
617
.931
19.1
14Ti
me
sinc
e qu
ittin
g sm
okin
g (in
yea
rs)
11
.352
1.70
422
911
752.
477
0.15
08.
011
14.6
92Ti
me
sinc
e qu
ittin
g sm
okel
ess
toba
cco
(in y
ears
) 10
.683
1.98
123
142
0.80
30.
186
6.79
914
.566
Tota
l mon
thly
exp
endi
ture
s on
man
ufac
ture
d ci
gare
ttes
516.
052
22.9
4987
544
591.
028
0.04
547
1.07
256
1.03
2To
tal m
onth
ly e
xpen
ditu
res
on b
idis
87.4
717.
521
230
1008
0.57
30.
086
72.7
3010
2.21
2
App
endi
x A
.5 (c
ont.
): S
ampl
ing
erro
rs fo
r ur
ban
popu
lati
on, G
ATS
Bang
lade
sh 2
009

167
GATS Bangladesh Report-2009A
ppen
dix
A.6
Sam
plin
g er
rors
for
rura
l pop
ulat
ion,
GAT
S Ba
ngla
desh
200
9
Indi
cato
rEs
tim
ate
(R)
Stan
dard
erro
r (S
E)
Num
ber
of re
spon
dent
sD
esig
n ef
fect
(DEF
T)Re
lati
ve e
rror
(SE/
R)
Conf
iden
ce li
mit
sun
wei
ghte
d(N
)W
eigh
ted
(000
s) (W
N)
Low
er li
mit
(R-1
.96S
E)U
pper
lim
it(R
+1.9
6SE)
Curr
ent t
obac
co u
sers
0.45
10.
010
4772
7044
61.
924
0.02
20.
432
0.47
1Cu
rren
t tob
acco
sm
oker
s
0.23
60.
007
4772
7044
61.
428
0.03
10.
222
0.25
0Cu
rren
t sm
okel
ess
toba
cco
user
s
0.
288
0.01
147
7270
446
2.59
60.
037
0.26
80.
309
Curr
ent m
anuf
actu
red
ciga
rett
e sm
oker
s
0.
126
0.00
647
7270
446
1.76
70.
051
0.11
40.
139
Curr
ent b
idis
mok
ers
0.13
50.
008
4772
7044
62.
332
0.05
60.
120
0.14
9D
aily
toba
cco
smok
er
0.
215
0.00
747
7270
446
1.44
60.
033
0.20
10.
229
Dai
ly s
mok
eles
s to
bacc
o us
e
0.25
50.
010
4772
7044
62.
551
0.04
00.
235
0.27
5D
aily
man
ufac
ture
d ci
gare
tte
smok
ers
0.
107
0.00
647
7270
446
1.76
50.
055
0.09
60.
119
Dai
ly b
idis
mok
ing
0.12
80.
007
4772
7044
62.
240
0.05
70.
114
0.14
3Fo
rmer
dai
ly to
bacc
o sm
oker
s am
ong
all a
dults
0.04
70.
004
4772
7044
61.
587
0.08
20.
039
0.05
4Fo
rmer
toba
cco
smok
ers
amon
g ev
er-d
aily
sm
oker
s
0.17
30.
014
1341
1902
91.
708
0.07
80.
147
0.20
0Fo
rmer
dai
ly s
mok
eles
s to
bacc
o us
ers
amon
g al
l adu
lts
0.01
40.
002
4772
7044
61.
448
0.14
90.
010
0.01
8Fo
rmer
sm
okel
ess
toba
cco
user
s am
ong
ever
-dai
ly u
sers
0.05
00.
007
1443
1923
62.
211
0.14
60.
037
0.06
6Fi
rst t
obac
co u
se w
ithin
5 m
inut
es o
f wak
ing
0.10
50.
009
2157
2953
01.
780
0.08
40.
088
0.12
2At
tem
pts
to q
uit s
mok
ing
in th
e pa
st 1
2 m
onth
s
0.45
30.
022
1200
1711
42.
285
0.04
80.
411
0.49
6Vi
site
d a
heal
th-c
are
prov
ider
in th
e pa
st 1
2 m
onth
s
0.37
40.
020
1191
1696
72.
089
0.05
40.
334
0.41
4H
ealth
-car
e pr
ovid
er a
sked
abo
ut s
mok
ing
0.
574
0.03
044
263
781.
646
0.05
30.
515
0.63
3H
ealth
-car
e pr
ovid
er a
dvis
ed to
qui
t sm
okin
g
0.
543
0.03
044
263
781.
557
0.05
50.
485
0.60
1Pl
anni
ng to
qui
t or
thin
king
abo
ut q
uitt
ing
smok
ing
0.67
60.
023
1139
1620
12.
680
0.03
40.
631
0.72
0Pl
anni
ng to
qui
t or
thin
king
abo
ut q
uitt
ing
smok
eles
s to
bacc
o
0.47
10.
022
1506
1996
12.
853
0.04
60.
429
0.51
4Ex
posu
re to
sec
ond-
hand
sm
oke
at w
ork
0.
660
0.02
867
710
788
2.27
50.
042
0.60
60.
714
Expo
sure
to s
econ
d-ha
nd s
mok
e in
gov
ernm
ent b
uild
ings
0.04
50.
004
4767
7030
71.
537
0.08
30.
038
0.05
3Ex
posu
re to
sec
ond-
hand
sm
oke
in h
ealth
-car
e fa
cilit
ies
0.05
40.
004
4772
7044
61.
775
0.08
10.
045
0.06
2Ex
posu
re to
sec
ond-
hand
sm
oke
in re
stau
rant
s
0.26
80.
010
4769
7041
12.
651
0.03
90.
247
0.28
8Ex
posu
re to
sec
ond-
hand
sm
oke
on p
ublic
tran
spor
t0.
263
0.01
047
7070
420
2.43
60.
038
0.24
40.
283
Last
cig
aret
te p
urch
ase
in s
tore
0.98
90.
005
572
8645
1.24
60.
005
0.97
90.
999
Last
bid
i pur
chas
e in
sto
re
0.92
90.
014
675
9167
1.88
00.
015
0.90
20.
956
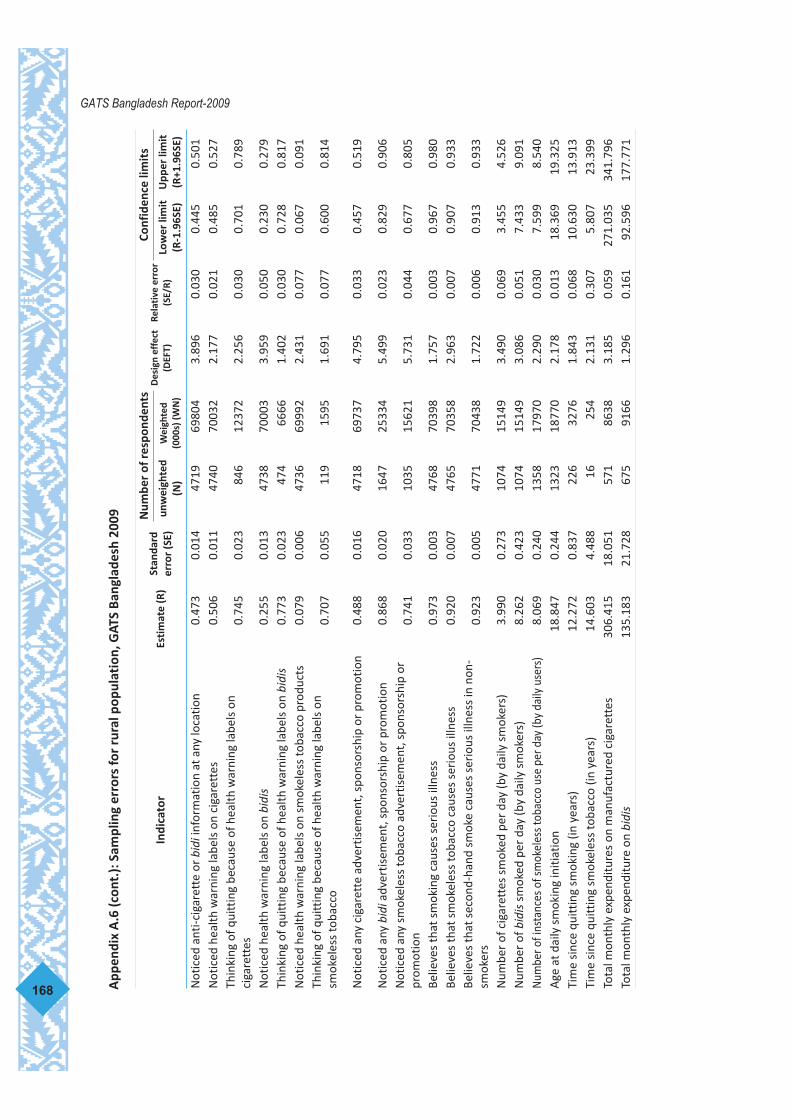
168
GATS Bangladesh Report-2009
Indi
cato
rEs
tim
ate
(R)
Stan
dard
erro
r (S
E)
Num
ber
of re
spon
dent
sD
esig
n ef
fect
(DEF
T)Re
lati
ve e
rror
(SE/
R)
Conf
iden
ce li
mit
sun
wei
ghte
d(N
)W
eigh
ted
(000
s) (W
N)
Low
er li
mit
(R-1
.96S
E)U
pper
lim
it(R
+1.9
6SE)
Not
iced
ant
i-cig
aret
te o
r bid
iinf
orm
atio
n at
any
loca
tion
0.
473
0.01
447
1969
804
3.89
60.
030
0.44
50.
501
Not
iced
hea
lth w
arni
ng la
bels
on
ciga
rett
es
0.50
60.
011
4740
7003
22.
177
0.02
10.
485
0.52
7Th
inki
ng o
f qui
ttin
g be
caus
e of
hea
lth w
arni
ng la
bels
on
ciga
rett
es
0.74
50.
023
846
1237
22.
256
0.03
00.
701
0.78
9
Not
iced
hea
lth w
arni
ng la
bels
on
bidi
s0.
255
0.01
347
3870
003
3.95
90.
050
0.23
00.
279
Thin
king
of q
uitt
ing
beca
use
of h
ealth
war
ning
labe
ls o
n bi
dis
0.77
30.
023
474
6666
1.40
20.
030
0.72
80.
817
Not
iced
hea
lth w
arni
ng la
bels
on
smok
eles
s to
bacc
o pr
oduc
ts0.
079
0.00
647
3669
992
2.43
10.
077
0.06
70.
091
Thin
king
of q
uitt
ing
beca
use
of h
ealth
war
ning
labe
ls o
nsm
okel
ess
toba
cco
0.
707
0.05
511
915
951.
691
0.07
70.
600
0.81
4
Not
iced
any
cig
aret
te a
dver
tisem
ent,
spo
nsor
ship
or
prom
otio
n
0.
488
0.01
647
1869
737
4.79
50.
033
0.45
70.
519
Not
iced
any
bid
iadv
ertis
emen
t, s
pons
orsh
ip o
r pr
omot
ion
0.86
80.
020
1647
2533
45.
499
0.02
30.
829
0.90
6N
otic
ed a
ny s
mok
eles
s to
bacc
o ad
vert
isem
ent,
spo
nsor
ship
or
prom
otio
n
0.74
10.
033
1035
1562
15.
731
0.04
40.
677
0.80
5
Belie
ves
that
sm
okin
g ca
uses
ser
ious
illn
ess
0.97
30.
003
4768
7039
81.
757
0.00
30.
967
0.98
0Be
lieve
s th
at s
mok
eles
s to
bacc
o ca
uses
ser
ious
illn
ess
0.
920
0.00
747
6570
358
2.96
30.
007
0.90
70.
933
Belie
ves
that
sec
ond-
hand
sm
oke
caus
es s
erio
us il
lnes
s in
non
-sm
oker
s0.
923
0.00
547
7170
438
1.72
20.
006
0.91
30.
933
Num
ber
of c
igar
ette
s sm
oked
per
day
(by
daily
sm
oker
s)
3.
990
0.27
310
7415
149
3.49
00.
069
3.45
54.
526
Num
ber
of b
idis
smok
ed p
er d
ay (b
y da
ily s
mok
ers)
8.26
20.
423
1074
1514
93.
086
0.05
17.
433
9.09
1N
umbe
r of i
nsta
nces
of s
mok
eles
s tob
acco
use
per
day
(by
daily
use
rs)
8.06
90.
240
1358
1797
02.
290
0.03
07.
599
8.54
0A
ge a
t dai
ly s
mok
ing
initi
atio
n
18
.847
0.24
413
2318
770
2.17
80.
013
18.3
6919
.325
Tim
e si
nce
quitt
ing
smok
ing
(in y
ears
)
12.2
720.
837
226
3276
1.84
30.
068
10.6
3013
.913
Tim
e si
nce
quitt
ing
smok
eles
s to
bacc
o (in
yea
rs)
14.6
034.
488
1625
42.
131
0.30
75.
807
23.3
99To
tal m
onth
ly e
xpen
ditu
res
on m
anuf
actu
red
ciga
rett
es
306.
415
18.0
5157
186
383.
185
0.05
927
1.03
534
1.79
6To
tal m
onth
ly e
xpen
ditu
re o
n bi
dis
135.
183
21.7
2867
591
661.
296
0.16
192
.596
177.
771
App
endi
x A
.6 (c
ont.
): S
ampl
ing
erro
rs fo
r ru
ral p
opul
atio
n, G
ATS
Bang
lade
sh 2
009

Appendix B: Sample design
B.1 INTRODUCTION
The Global Adult Tobacco Survey was the first of its kind to be conducted in Bangladesh in2009 (GATS-Bangladesh 2009) to monitor tobacco use. It is designed to be a nationallyrepresentative household survey of all non-institutionalized men and women aged 15 yearsor older. The main objectives of this survey are to provide estimates of tobacco use, exposureto second-hand smoke and frequency of quit attempts, and to monitor tobacco controlinterventions. The survey design requirements for this study have been developed so thatprecise estimates can be generated for Bangladesh as a whole as well as for two analysisgroups defined by urban/rural areas and gender.
The target population for this survey includes all people residing in all geographical areas ofthe country who consider Bangladesh to be their primary place of residence. This definitionincludes those individuals residing in Bangladesh even though they may not be citizens of thatcountry. The only adults aged 15 years or older who will be excluded from the study are thoseindividuals visiting Bangladesh (e.g. tourists), who have indicated their primary place ofresidence to be a military base or group quarters (e.g. a dormitory), and those who areinstitutionalized—including people residing in hospitals, prisons, nursing homes and othersuch institutions.
B.2 SAMPLING FRAME
The sampling frame used for GATS Bangladesh 2009 was the Population Census of the People’sRepublic of Bangladesh conducted in 2001 (PCPRB 2001), provided by the Bangladesh Bureauof Statistics (BBS). The population coverage rate of this Census 2001 is around 95.5% of thetotal population.
There are six divisions in Bangladesh, which are the largest administrative units. Each divisionis divided into several districts (zilla) and sub-districts (upazilla). Within sub-districts aremauzas and mahallas that are the smallest units with a defined area in urban and ruralBangladesh respectively. In the case of the GATS Bangladesh, it was decided that primarysampling units (PSUs) for the rural stratum will be the mauza, the smallest rural geographicalrevenue unit having a jurisdiction list number for which census information is available withclear and updated boundaries. For the urban stratum, PSUs will be based on the mahallawhich is the lowest urban geographical unit having identifiable boundaries. Households inthis survey were defined according to BBS as “a dwelling in which persons either related orunrelated (were) living together and taking food from the same kitchen”.
According to the census of 2001, the sampling frame comprised 64,407 PSUs (mauzas andmahallas) in Bangladesh, which also included cantonment areas and “depopulated” areassuch as areas with less than five households. PSUs with less than five households andcantonment areas were deleted from the sample frame and PSUs with households numberingbetween 5 and 49 were merged with adjacent PSUs. After this merger, the total number ofPSUs came to 58,755. These PSUs allowed the country as a whole to be easily classified intothe rural (49,281 PSUs) and urban (94,74 PSUs) stratum. The urban stratum includes Urbanand Statistical Metropolitan Areas (SMA) and rural stratum includes rural and Other UrbanAreas of Bangladesh.
169
GATS Bangladesh Report-2009

B.3 SAMPLE DESIGN
The sample for GATS Bangladesh 2009 was a three-stage stratified cluster sample ofhouseholds. The explicit stratification used at the first stage of selection was based on urban(mahalla) and rural (mauza) designation from BBS. Each of the rural and urban geopoliticalunits are implicitly stratified by division, noting that some divisions are mostly urban or mostlyrural, and within each division by the percentage literacy of women in each mahalla andmauza.
At the first stage, a total of 400 PSUs were selected systematically with probabilityproportionate to size (PPS), and with an equal allocation to urban and rural statum (200 PSUseach to both urban and rural strata). The size measure used to select PSUs is the total numberof households in the 2001 Census. Secondary Sampling Units (SSUs) were based upon CensusEnumeration Areas defined in the 2008 Bangladesh Agricultural Census. This Census wasconduced in the entire country with mapping of each mauza and mahalla performed and EA’sconstruction based upon 200 households units in mauzas and 300 household units in eachmahalla. In each mauza and mahalla one SSU was selected using simple random sampling(SRS). Household selection in the third stage was an equal probability systematic selectionwith 28 households per SSU using a fractional interval technique. Selected households in allthe selected segments of mauzzas/mahalla’s were randomly assigned as “male” or “female”in a ratio that produces equal numbers of male and female households. Finally, one individualwas randomly chosen from all the eligible males/females in a participating household. Noreplacements and no changes of the pre-selected households were allowed in theimplementing stages in order to prevent bias.
B.4 SAMPLE SIZE
GATS was designed to produce estimates that meet the following precision requirements:
1. Estimates computed at the national level, by urban/rural classification, by genderand by the cross of gender and urban/rural should have a 95% margin of error of3 percentage points or less for tobacco use rates of 40%.
2. Sample sizes should be sufficiently large to accommodate the statistical powerrequirements for tests to detect differences between survey rounds withindependently chosen samples
Assuming a design effect of 2.00 for estimates computed at the national level, byurban/rural classification, by gender and by the cross of gender and urban/rural, the minimumsample sizes needed to accommodate these precision requirements are 2000 respondents ineach of the four groups defined by the cross of urban/rural and gender. This results in aminimum expected respondent sample of 8000. Based on the information from DemographicHealth Surveys and previous BBS surveys, the following anticipated non-response rates at thehousehold and individual level were considered: household eligibility rate (90%), householdresponse rate (98%), household screening rate (95%), person eligibility rate (98%) and personresponse rate (85% for male and 90% for female). As a result, the number of householdsselected in each SSU was fixed to 28 households and a final adjusted sample size of 11 200households.
170
GATS Bangladesh Report-2009

Among the 400 PSUs/SSUs selected, 200 PSUs/SSUs were allocated to urban areas and 200 torural areas. Among the expected 11 200 individual interviews, 5600 were in urban areas and5600 were in rural areas. The households were equally allocated to each strata and gender inorder to obtain comparable survey precision between each subgroup.
Table B.1 below shows the total number of PSUs in Bangladesh according to division and bytype of residence; Table B.2 below shows the sample distribution of PSUs according to divisionand by type of residence; Table B.3 below shows the sample distribution of households orindividuals according to division and gender by type of residence.
171
GATS Bangladesh Report-2009
Table B.1 Total number of Mauzas/Mohallas by division and urban/rural
DivisionNumber of Mauzas/Mohallas
Total Urban RuralBarisal 3,231 394 2,837
Chittagong 8,489 1,623 6,866Dhaka 16,886 3,365 13,521Khulna 7,103 1,059 6,044
Rajshahi 17,888 2,416 15,472Sylhet 5,158 617 4,541Overall 58,755 9,474 49,281
Table B.2 Number of sampled Mauzas/Mohallas by division and urban/rural
DivisionNumber of Mauzas/Mohallas
Total Urban RuralBarisal 20 5 15Chittagong 74 39 35Dhaka 152 98 54Khulna 47 21 26Rajshahi 89 31 58Sylhet 18 6 12Overall 400 200 200
Table B.3 Number of sampled households/individuals by division, gender and urban/rural
DivisionNumber of households/individuals
TotalUrban Rural
Male Female Male FemaleBarisal 560 70 70 210 210Chittagong 2,072 546 546 490 490Dhaka 4,256 1,372 1,372 756 756Khulna 1,316 294 294 364 364Rajshahi 2,492 434 434 812 812Sylhet 504 84 84 168 168Overall 11,200 2,800 2,800 2,800 2,800
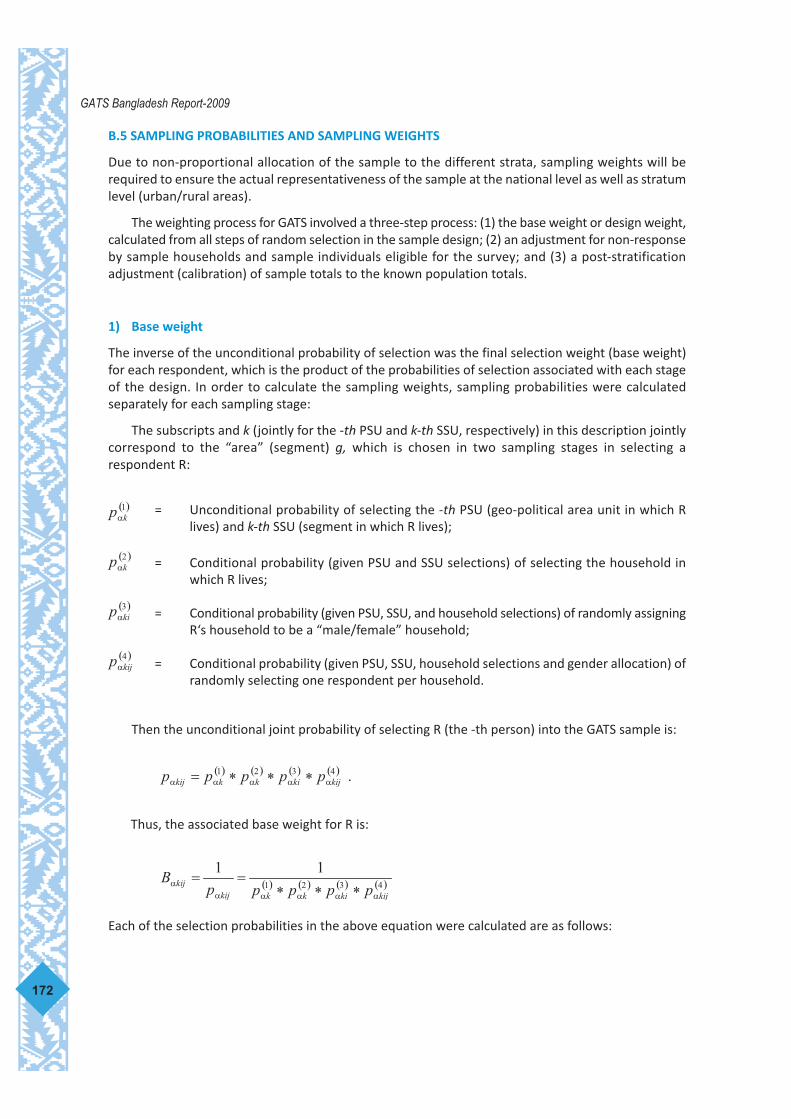
B.5 SAMPLING PROBABILITIES AND SAMPLING WEIGHTS
Due to non-proportional allocation of the sample to the different strata, sampling weights will berequired to ensure the actual representativeness of the sample at the national level as well as stratumlevel (urban/rural areas).
The weighting process for GATS involved a three-step process: (1) the base weight or design weight,calculated from all steps of random selection in the sample design; (2) an adjustment for non-responseby sample households and sample individuals eligible for the survey; and (3) a post-stratificationadjustment (calibration) of sample totals to the known population totals.
1) Base weight
The inverse of the unconditional probability of selection was the final selection weight (base weight)for each respondent, which is the product of the probabilities of selection associated with each stageof the design. In order to calculate the sampling weights, sampling probabilities were calculatedseparately for each sampling stage:
The subscripts and k (jointly for the -th PSU and k-th SSU, respectively) in this description jointlycorrespond to the “area” (segment) g, which is chosen in two sampling stages in selecting arespondent R:
= Unconditional probability of selecting the -th PSU (geo-political area unit in which Rlives) and k-th SSU (segment in which R lives);
= Conditional probability (given PSU and SSU selections) of selecting the household inwhich R lives;
= Conditional probability (given PSU, SSU, and household selections) of randomly assigningR‘s household to be a “male/female” household;
= Conditional probability (given PSU, SSU, household selections and gender allocation) ofrandomly selecting one respondent per household.
Then the unconditional joint probability of selecting R (the -th person) into the GATS sample is:
Each of the selection probabilities in the above equation were calculated are as follows:
172
GATS Bangladesh Report-2009

The unconditional joint probability of selecting R‘s PSU and R‘s SSU is,
was the size measure (in number of households
as of the last census) for R‘s PSU, I was the number of PSUs chosen in the sampling stratum from which
R‘s PSU was chosen, and was the sum of size measures for all PSUs in that stratum, kα was the
number of segments chosen (typically 1 segment per PSU) by (without-replacement) simple random
sampling and Sα was the total number of segments in R‘s PSU.
The conditional probability of selecting R‘s household was: , where Hαk was the number
of households selected (typically 28 fixed households per SSU) by without-replacement simple random
sampling and Lαk was the listed households in the αk -th segment in which R‘s household is located.
In general, Mαki and Fαki were respectively the number of selected households in the αk -th “area”
(segment) assigned to be “male” and “female” households, then the conditional probability of
randomly assigning the households was: for male respondents, and for
female respondents where Hαki = Mαki + Fαki .
A spreadsheet containing all sampling parameters and selection probabilities was prepared tofacilitate the calculation of base weight.
2) Adjustment for unit non-response
The base weights were adjusted for non-response on two factors: household level non-responseadjustments, and person-level non-response adjustments. Household-level non-response adjustmentswere made within PSU. The corresponding household-level weighting class adjustment were computedas one divided by the weighted household response rate for each sample PSUs. The person levelresponse rate was computed by roster-reported gender, age and current smoking status.
3) Post-stratification calibration adjustment
In principle, the goal of a calibration weight adjustment is to bring weighted sums of the sample datainto line with the corresponding counts in the target population. Provisional population totalsprojections of persons aged 15 years and above by urban/rural residence, and respondent-reportedgender and age group (15-24, 25-44, 45-64 and 65+) from the sample registration system (SVRS) 2008were used for a post-stratification calibration adjustment.
Ultimately, the final analysis weight (W) for the j-th respondent data record was computed as theproduct of the base weights, the non-response adjustment and post-stratification calibrationadjustment. The final weights were used in all analyses to produce estimates of populationparameters..
173
GATS Bangladesh Report-2009

174
GATS Bangladesh Report-2009
N
Primary Sampling Unit
International Boundary
District Boundary
LEGEND
INDIA
Bay of Bengal
BURMA
INDIA
#Y
0 50 100km
#Y#Y#Y#Y
#Y #Y
#Y#Y#Y
#Y
#Y#Y#Y #Y#Y#Y#Y#Y#Y#Y #Y#Y
#Y#Y#Y#Y#Y
#Y
#Y
#Y
#Y#Y
#Y
#Y
#Y
#Y
#Y
#Y
#Y
#Y #Y
#Y
#Y
#Y#Y
#Y
#Y#Y
#Y
#Y
#Y
#Y
#Y#Y
#Y #Y
#Y
#Y
#Y
#Y
#Y
#Y
#Y#Y#Y#Y#Y
#Y
#Y
#Y
#Y
#Y
#Y
#Y #Y
#Y
#Y
#Y
#Y
#Y#Y
#Y
#Y
#Y
#Y #Y
#Y
#Y
#Y
#Y
#Y
#Y
#Y
#Y
#Y
#Y#Y
#Y
#Y
#Y
#Y
#Y
#Y
#Y
#Y
#Y#Y
#Y#Y
#Y
#Y
#Y#Y
#Y
#Y
#Y#Y#Y
#Y#Y
#Y
#Y
#Y#Y
#Y
#Y#Y #Y
#Y
#Y
#Y
#Y
#Y
#Y
#Y
#Y
#Y
#Y
#Y#Y
#Y
#Y
#Y
#Y #Y
#Y#Y
#Y
#Y#Y
#Y
#Y#Y
#Y
#Y#Y
#Y
#Y
#Y
#Y#Y
#Y
#Y#Y
#Y
#Y
#Y
#Y
#Y
#Y
#Y
#Y
#Y#Y#Y
#Y
#Y
#Y
#Y
#Y
#Y#Y
#Y#Y
#Y
#Y
#Y#Y#Y
#Y
#Y#Y#Y
#Y
#Y#Y#Y#Y#Y#Y#Y#Y#Y
#Y
#Y
#Y#Y
#Y#Y#Y#Y
#Y#Y
#Y
#Y
#Y
#Y
#Y#Y
#Y#Y#Y
#Y
#Y
#Y
#Y
#Y
#Y
#Y#Y
#Y
#Y#Y#Y
#Y#Y#Y#Y
#Y#Y#Y
#Y
#Y#Y#Y#Y
#Y#Y
#Y
#Y
#Y
#Y#Y
#Y
#Y
#Y
#Y
#Y#Y #Y
#Y
#Y#Y
#Y#Y
#Y
#Y
#Y#Y
#Y
#Y
#Y#Y
#Y#Y#Y
#Y#Y
#Y#Y
#Y#Y
#Y#Y
#Y
#Y#Y
#Y#Y
#Y
#Y
#Y#Y#Y #Y#Y
#Y
#Y
#Y#Y#Y #Y
#Y
#Y#Y #Y
#Y
#Y#Y#Y
#Y#Y
#Y
#Y
#Y#Y
#Y #Y
#Y#Y #Y
#Y
#Y#Y#Y#Y#Y#Y
#Y
#Y
#Y
#Y#Y#Y#Y
#Y #Y#Y#Y#Y
#Y#Y#Y
#Y#Y#Y
#Y#Y#Y#Y
#Y
#Y#Y#Y#Y#Y
#Y #Y#Y#Y#Y #Y
#Y#Y #Y
#Y #Y#Y#Y#Y
#Y#Y #Y#Y#Y
#Y#Y
#Y
#Y#Y#Y
#Y#Y#Y
#Y#Y #Y
#Y#Y
#Y
#Y
#Y
#Y#Y#Y
#Y
SHOWING AREA OF COVERAGE OF GLOBAL ADULT TOBACCO SURVEY (GATS), BANGLADESH, 2009
Division Boundary
Prepared by : Progaammer, BBS

175
GATS Bangladesh Report-2009
Fig: Sample map of PSU
Fig: Sample map of SSU

Appendix C: Glossary of terms
176
GATS Bangladesh Report-2009
GATS Global Adult Tobacco SurveyWHO FCTC WHO Framework Convention on Tobacco ControlMPOWER WHO publication with six key strategies on tobacco control (2008)
Monitor tobacco use and prevention policiesProtect people from tobacco smokeOffer help to quit tobacco useWarn about the dangers of tobaccoEnforce bans on tobacco advertising, promotion and sponsorship Raise taxes on tobacco
NIPSOM National Institute of Preventive and Social MedicineNIPORT National Institute of Population Research and Training BBS Bangladesh Bureau of StatisticsPSUs primary sampling unitsSSUs secondary sampling unitsFSs Field SupervisorsFIs Field InterviewersAdults Population aged 15 years and over
Tobacco Products Two types of tobacco products, i.e.
1) Smoked tobacco: Includes manufactured cigarettes, bidi, hukkah(waterpipes), hand–rolled cigarettes, pipes full of tobacco, cigars,cherrots or, cigarillos, and any other. Others include dhaba(waterpipes made of bamboo).
2) Smokeless tobacco: Includes zarda, sada pata, gul, khoinee andothers. Others include kimam, different brands of zarda, musuri bakor(a type of pan masala) etc.
Smokingfrequency
Classified into three categories, i.e.:1) Daily smoking means smoking at least one tobacco product every day
over a period of a month or more.2) Occasional smoking (less than daily).3) Never smoking means person who has never tried smoking or has
just tried the same once or twice ever.
Frequency ofsmokelesstobacco use
Classified into three categories, i.e.:
1) Daily smokeless tobacco use means use of at least one smokelesstobacco product every day over a period of month or more.
2) Occasional smokeless tobacco use (less than daily).
3) Never smokeless tobacco users means a person who has never triedsmokeless tobacco products or has just tried once or twice ever.

177
GATS Bangladesh Report-2009
Frequency oftobacco use
Classified into three categories, i.e.:
1) Current tobacco use means daily smoking and smokeless tobaccouse means use of any tobacco product every day over a period ofmonth or more.
2) Occasional smoking and smokeless tobacco use (less than daily).
Current smoker Smokers who are daily or occasional smokers of any smoking tobaccoproduct.
Current smokelesstobacco products
Smokeless tobacco users who are daily or occasional users of anysmokeless tobacco product.
Prevalence (%) Statistical concept that refers to the number of occurrences of tobaccouse that are present in a particular population aged 15 years and overat a given time.
Quit attempt Current tobacco smokers and smokeless tobacco users who tried toquit during the past 12 months and former tobacco smokers andsmokeless tobacco users who have been abstinent for >12 months.
Interest in quittingsmoking
Current tobacco smokers who are planning or thinking about quittingsmoking within the next month, next 12 months or some day.
Interest in quittingsmokeless tobaccouse
Current smokeless tobacco users who are planning or thinking aboutquitting smokeless tobacco use within the next month, next 12 monthsor some day.
HCPs Health-care providers include various health professions such asmedical doctors, nurses, pharmacists, health professionals, etc.
Exposure tosecondhand smoke
Persons who saw somebody smoking or smelled tobacco smoke, orsaw tobacco butts inside (indoor areas) public places of interest duringtheir visit there in the past 30 days, including:
o Government building: covering indoor areas which are declared asnon-smoking areas by national smoke free laws.
o Health-care facilities: covering indoor areas of both public andprivate health-care facilities which are declared non-smoking areasby national smoke free laws.
o Restaurants: covering food and/or beverage selling areas inside thebuilding, not including places in front of any building and on thewayside.
o Public transport: All public transport, both air-conditioned and non-air-conditioned.
Exposure tosecondhand smokeat home
Persons who were exposed to SHS inside the respondent’s home,which does not include outside areas such as patios, balcony, garden,etc., that are not fully enclosed.

178
GATS Bangladesh Report-2009
Exposure to antitobaccoinformation
Respondents who have noticed any information about the dangers ofsmoking cigarettes or bidis and of smokeless tobacco, or that whichencourages the quitting of these tobacco products in newspapers,magazines, television, radio, billboards, posters and somewhere elsein the last 30 days.
Exposure tocigarettes, bidi andsmokeless tobaccoadvertisement,promotion andsponsorship
Respondents who have noticed any advertisement or signs at the pointof sale, or on television, radio, billboards, posters, newspapers,magazines, cinemas, the Internet, public transport vehicles or stations,public walls, and anywhere else in the last 30 days.
Beliefs about thedangers of tobaccosmoking
Respondents who believe that tobacco smoking causes serious illnessand specific diseases, i.e. stroke, heart attack, lung cancer, and long-term respiratory distress.
Beliefs about thedangers ofsmokeless tobaccouse
Respondents who believe that smokeless tobacco use causes seriousillness and specific diseases, i.e., stroke, heart attack, cancer of mouth.
Beliefs about thedangers ofsecondhand smoke
Respondents who believe that breathing smoke from other peoples’smoke causes serious illness and specific disease in non-smokers, i.e.,heart in adults, stroke in adults, lung cancer in adults, lung illness inchildren.
Health warning Six rotatory textual health warnings on cigarette packages covering30% of the front and back.

Appendix D: Technical and survey staff
179
GATS Bangladesh Report-2009
Members of Steering Committee
Secretary, Ministry of Health & Family Welfare, Bangladesh Secretariat Chairman
Director General, Directorate of Health Services Member
Joint Secretary (PH&WHO), Ministry of Health & Family Welfare, BangladeshSecretariat Member
Deputy Secretary (WHO), Ministry of Health & Family Welfare, Bangladesh Secretariat Member
Director, National Institute of Preventive and Social Medicine Member
Director General, National Institute of Population, Training and Research Member
Director General, Bangladesh Bureau of Statistics Member
Director, Medical Information System, Directorate of Health Services Member
Director, Primary Health Care, Directorate of Health Services Member
Director, Institute of Epidemiology, Disease Control and Research Member
Dr Mostafa Zaman, National Professional Officer (NCD), World Health Organization,Bangladesh Member
Prof. Syed Md Akram Hussain, Chairman, Department of Oncology, BangabandhuSheikh Mujib Medical University Member
Director, Disease Control, Directorate of Health Services Member Secretary
Members of Technical Committee
Joint Secretary (PH&WHO), Ministry of Health & Family Welfare Chairman
Director, National Institute of Preventive and Social Medicine Member
Director, Institute of Epidemiology, Disease Control and Research Member
Deputy Secretary (WHO), Ministry of Health & Family Welfare Member
Director (Research). National Institute of Population, Research and Training Member
Head, Department of Epidemiology, National Institute of Preventive and SocialMedicine Member
Head, Department of Environmental and Occupational Health, National Institute ofPreventive and Social Medicine Member
Director (Demography and Health), Bangladesh Bureau of Statistics Member
Prof. M. Kabir, Professor of Statistics. Department of Statistics, Jahangirnagar University Member
Dr Md. Mizanur Rahman, Associate Professor, National Institute of Preventive andSocial Medicine Member
Director, Disease Control, Directorate of Health Services Member
Prof. Syed Md Akram Hussain, Chairman, Department of Oncology, BangabandhuSheikh Mujib Medical University Member
Technical Officer (Surveillance of Tobacco Control), World Health Organization,Bangladesh, Dhaka. Member
Senior Assistant Secretary (WHO-2), Ministry of Health & Family Welfare, BangladeshSecretariat Member Secretary

Research and technical team members of implementing agencies
Principal Investigator (Director, NIPSOM) Professor (Dr) Sk. Akhtar Ahmad (16 Sept 2009 – 30 November 2009)Professor (Dr) Abdur Rahman, (15 Feb 2009 – 15 September 2009)Professor (Dr) Zaforullah Chowdhury ( till 15 February 2009)Co-Principal investigators Dr Md. Amirul Hassan, Associate Professor, NIPSOM ( 16 June 2009 – 30 November 2009) Dr Md. Mizanur Rahman, Associate Professor, NIPSOM ( till 15 June 2009)Co Investigators Professor (Dr.) Md. Anisur Rahman, NIPSOM Dr Md. Shafiqul Islam, Associate Professor NIPSOMDr Md. Nazrul Islam, Assistant Professor, NIPSOMDr Kazi Shafiqul Halim, Assistant Professor, NIPSOMDr Mahmudul Haque, Medical Officer, NIPSOMMd. Ahsanul Alam, Evaluation Specialist and Deputy Program Manager, NIPORTProf. Syed Mohammad Akram Hussain, BSMMU
Research OfficersDr Mahfuzur Rahman Bhuiyan, GATS, Bangladesh.Dr Sheikh Mohammad Mahbubus Sobhan, GATS, Bangladesh.Suraya Aktar, GATS, Bangladesh.Dr Jakir Hossain Bhuiyan Masud, GATS, Bangladesh.
IT professionalsABM Kamruzzaman, Programmer and Network SpecialistMd Hasanuzzaman Khan, Database & IT Specialist
Administrative staff Sere Buland Khan, Administrative cum Account Officer
Member of Quality Control Team
NIPSOM NIPORT World Health OrganizationProfessor (Dr) Abdur Rahman KC Mondal Dr M Mostafa ZamanProfessor (Dr) Md. Anisur Rahman Md Ahsanul Alam Dr Sohel Reza ChouduhryProfessor (Dr) Md. Emdadul Haque Shahin Sultana Dr Syed Mahfuzul HuqProfessor (Dr) Shaila Hossain Subrata Kumar Bhadra Dr Iqbal KabirDr. Md.Amirul Hassan Md. Mahbubur Rahman Ishrat ChowdhuryDr Md. Shafiqul Islam Shahina AlamDr Musarrat Haque Rita Farah NazDr Md. Nazrul Islam Dipak Chandra RoyDr Ashit Barun BiswasDr A. WazedDr Kazi Shafiqul HalimDr Abul Masud Md. Nurul Karim
180
GATS Bangladesh Report-2009

Bangladesh Bureau of Statistics (Mapping and Listing)
Director General, Bangladesh Bureau of StatisticsDirector, Demography and Health WingDeputy Director, Demography and Health WingOfficials of Demography and Health Wing
Data CollectorsField Supervisors
Mahfuzur Rahman Mohammad Shafiqul Alam BhuiyanMd Mizanur Rahman Muhammad Iftekharul AlamMiraj Mowla Chowdhury Abul Khayer Mohammad Rajibul AminMd Omar Faruk Sarkar Mohammad Alauddin ChowdhuryMd. Anwaruzzaman Kamal HossainMd Zahidul Haque Md Ataur Rahman (Masud)AHM Mostafa Kamal ANM Khairul BasarMd Shamim Hossain Shah Mohammad Mamun HossainMd Jafar Iqbal Monirul Alam Bhuiyan
Male InterviewersMahadi Hasan/Tushar Ahmed Kazi Mozammel HaqueObaydul Haque Nasir UddinIqbal Hossain Abdur Rab SikdarRezaul Kabir Jahidur RahmanMd Atiar Rahman Rupesh ChakmaKorshed Alam Bhuiyan Abul KherZakir Sikder Md. Najrul IslamMoidul Islam Sagar Kumar BishwashSultan Mahmud Shubash Brto ChakmaMasud Rana Atikur RahmanMahbubul Haque Md Rohidul IslamAbu Sayem Md Tanjid Mohsin HabibMd.Mahbubur Rahman Mortuza AliMd Abdul Hakim Azmol HassanAtaur Rahman Mondol Bazlul KarimMd Mahbubur Rahman Rezaul KarimZakir Hosain Choudhury Yeahia Harun or Rasid Fazlul Haque
181
GATS Bangladesh Report-2009
Female interviewersAfroza Khatun Sheuly Rubayda MostofaMahbuba Khatun Tushir Nazmun NaharMorzina Khanam Umme Kulsum ShipuJesmin Akthar Rabeya BegumTahmina Ferdus Rabey RahmanGulshan Ara Sarmin Shewli AktarRozina Aktar Doulat Ara MunniRabeya Begam Samima SultanaManjura Parveen Mukta RoyFerdous Ara Safia JerinAfroza Begum Bilkis SultanaMahmuda Begum Kafura AlamArfia Naz Asma AktharAmrita Gosh Nasima AktarJanatul Ferdus Shamim AraDilara Islam Forsheda begum AkandFatema Khanam Israt Ila SakinaFarhana Khan Afroza sultana
World Health Organization
Dr M Mostafa Zaman, National Professional Officer, WHO BangladeshDr Sohel Reza Choudhury, Technical Officer (Surveillance of Tobacco Control), WHO Bangladesh.Dr Dhirendra Narain Sinha, Technical Officer-TFI, WHO Regional Office for South-East Asia, New DelhiMr Sameer Pujari, Data Manager, WHO/HQ, Geneva
Centers for Disease Control and Prevention (CDC)
Dr Krishna Mohan Palipudi, Senior Survey Statistician, CDC, Atlanta, USA
List of contributors to the report:
Dr Dhirendra Narain Sinha, WHO SEARODr Krishna Mohan Palipudi, CDCDr Sohel Reza Choudhury, WHO, BangladeshDr M Mostafa Zaman, WHO, BangladeshDr Md Shafiqul Islam, NIPSOMDr Md. Amirul Hassan, NIPSOMProfessor (Dr) Sk. Akhtar Ahmad, NIPSOM
List of technical reviewers of the report:
Professor Shah Monir Hossain, DGHSProfessor Mahmudur Rahman, IEDCRProfessor Abul Kalam Azad, MISDr G H Rabbani, ICDDRBMr Durgapada Bhattachariya, BBSMr Ahsanul Alam, NIPORT
182
GATS Bangladesh Report-2009

Appendix E: Questionnaire
GLOBAL ADULT TOBACCO SURVEY (GATS)BANGLADESH
QUESTIONNAIRE ID NUMBER ___ ___ ___ ___ ___[USE PRE-PRINTED LABEL IF APPLICABLE]
HOUSEHOLD DESIGNATION: MALE FEMALE
DIVISION___ ___DISTRICT ___ ___UPAZILLA (SUB DISTRICT) _____ ______UNION/WARD___ ___VILLAGE/ MOUZA /MOHALLAH ______________STREET ADDRESS/LANE ADDRESS_____________________________
URBAN/RURAL _________PSU No_________HOUSEHOLD # ___ ___ ___
183
GATS Bangladesh Report-2009
VISIT RECORD
Visit Number 1 2 3 4
Date of visit __ __ __ __Day Month
__ __ __ __Day Month
__ __ __ __Day Month
__ __ __ __Day Month
Household Result* ____ ____ ____ ____
Individual Result* ____ ____ ____ ____
Interviewer ___ ___ ___ ___ ___ ___ ___ ___
Editor ___ ___ ___ ___ ___ ___ ___ ___
Supervisor ___ ___ ___ ___ ___ ___ ___ ___

184
GATS Bangladesh Report-2009
Result Codes
Household Questionnaire Pending Result Codes102: Completed Part of Household Questionnaire, Could Not Finish Roster 103: Household Questionnaire Not Complete, Could Not Identify An Appropriate Screening
Respondent 104: Household Refusal 105: Unoccupied/Vacant/Demolished House 106: Selected Address is Not a Household107: Household Respondent Incapacitated 108: Other Household Nonresponse 109: Nobody Home
Household Questionnaire Final Result Codes200: Completed Household Questionnaire, One Person Selected201: Completed Household Questionnaire, No One Selected202: Completed Part of Household Questionnaire, Could Not Finish Roster 203: Household Questionnaire Not Complete, Could Not Identify An Appropriate Screening
Respondent 204: Household Refusal 205: Unoccupied/Vacant/Demolished House206: Selected Address is Not a Household207: Household Respondent Incapacitated 208: Other Household Nonresponse 888: Household Transferred to Another Field Interviewer999: Household Replaced by Another Randomly Selected Address in the Missed Housing Unit
Procedure
Individual Questionnaire Pending Result Codes302: Completed Part of Individual Questionnaire 303: Selected Individual was Later Determine to be Survey Ineligible 304: Selected Respondent Refusal 307: Selected Respondent Incapacitated 308: Other Individual Nonresponse309: Selected Respondent Not Home
Individual Questionnaire Final Result Codes400: Completed Individual Questionnaire401: Not Eligible for Individual Questionnaire403: Selected Individual Was Later Determine to Be Survey Ineligible 404: Selected Respondent Refusal 407: Selected Respondent Incapacitated 408: Other Individual Nonresponse888: Transferred to Another Field Interviewer999: Household Replaced by Another Randomly Selected Address in the Missed Housing Unit
Procedure

Household Questionnaire
TIME HH INTERVIEW STARTED[24 HOUR CLOCK] ___ ___ : ___ ___
HRS MINS
INTERVIEWER: THE HOUSEHOLD SCREENING RESPONDENT MUST BE 18 YEARS OF AGE OR OLDER AND YOUMUST BE CONFIDENT THAT THIS PERSON CAN PROVIDE ACCURATE INFORMATION ABOUT ALLMEMBERS OF THE HOUSEHOLD.
IF NEEDED, VERIFY THE AGE OF THE HOUSEHOLD SCREENING RESPONDENT TO MAKE SUREHE/SHE IS 18 YEARS OF AGE OR OLDER.
INTRO: An important survey of adult tobacco use behavior is being conducted by the Ministry of Healthand Family Welfare throughout Bangladesh and your household has been selected toparticipate. All houses selected were chosen from a scientific sample and it is very importantto the success of this project that each participates in the survey. All information gatheredwill be kept strictly confidential. I have a few questions to find out who in your household iseligible to participate.
HH1. First, I’d like to ask you a few questions about your household. In total, how many persons live in thishousehold?
INCLUDE ANYONE WHO CONSIDERS THIS HOUSEHOLD THEIR PRIMARY PLACE OF RESIDENCE LASTNIGHT
PERSONS
HH2. How many of these household members are 15 years of age or older?
PERSONS
HH3. How many (male/female) household members are 15 years of age or older?
PERSONS
IF HH3 = 00 (NO ELIGIBLE MALES/FEMALES IN HOUSEHOLD), END INTERVIEW AND GO TO PAGE 6 TORECORD THE TIME THE INTERVIEW ENDED. ENTER RESULT CODE 2.
HH4. I now would like to collect information about the (males/females) that live in this household who are15 years of age or older. Let’s start listing the (males/females) from oldest to youngest.
ASK THE FOLLOWING QUESTIONS AND RECORD ANSWERS IN TABLE BELOW
a. What is this person’s full name?
b. What is this person’s age? IF RESPONDENT DOESN’T KNOW, PROBE FOR AN ESTIMATE
c. IF REPORTED AGE IS 15 THROUGH 17, ASK FOR BIRTH DATE: What is the month and year of this person’sdate of birth?
185
GATS Bangladesh Report-2009

CHECK TO VERIFY IF DATE OF BIRTH FALLS BEFORE THE DATE OF [FILL MONTH/YEAR] TO MAKE SUREPERSON IS 15 OR OLDER. IF NOT 15 OR OLDER, DELETE LINE.
IF RESPONDENT DOESN’T KNOW DATE OF BIRTH, CONTINUE TO d
d. RECORD GENDER
e. Does this person currently smoke tobacco, including cigarettes, bidi, hukkah, cigars, pipes?
f. Does this person currently use any smokeless tobacco product, including Zarda, Gul, Sada pata,Khoinee, Nosshi?
186
GATS Bangladesh Report-2009
MALE DESIGNATED HH…......…�1FEMALE DESIGNATED HH........�2
a. Full Name b. AgeONLY IF AGE = 15-17
c. Date of Birthd. Gender e. Current Smoker?
f. Current SmokelessTobacco user?
M F YES NO DK YES NO DK
1 ____________________ ___ ___Month: __ __
Year: __ __ __ __� � � 1 � 2 � 7 � 1 � 2 � 7
2 ____________________ ___ ___Month: __ __
Year: __ __ __ __� � � 1 � 2 � 7 � 1 � 2 � 7
3 ____________________ ___ ___Month: __ __
Year: __ __ __ __� � � 1 � 2 � 7 � 1 � 2 � 7
4 ____________________ ___ ___Month: __ __
Year: __ __ __ __� � � 1 � 2 � 7 � 1 � 2 � 7
5 ____________________ ___ ___Month: __ __
Year: __ __ __ __� � � 1 � 2 � 7 � 1 � 2 � 7
6 ____________________ ___ ___Month: __ __
Year: __ __ __ __� � � 1 � 2 � 7 � 1 � 2 � 7
7 ____________________ ___ ___Month: __ __
Year: __ __ __ __� � � 1 � 2 � 7 � 1 � 2 � 7
8 ____________________ ___ ___Month: __ __
Year: __ __ __ __� � � 1 � 2 � 7 � 1 � 2 � 7
9 ____________________ ___ ___Month: __ __
Year: __ __ __ __� � � 1 � 2 � 7 � 1 � 2 � 7
10 ____________________ ___ ___Month: __ __
Year: __ __ __ __� � � 1 � 2 � 7 � 1 � 2 � 7
*DK indicates do not know
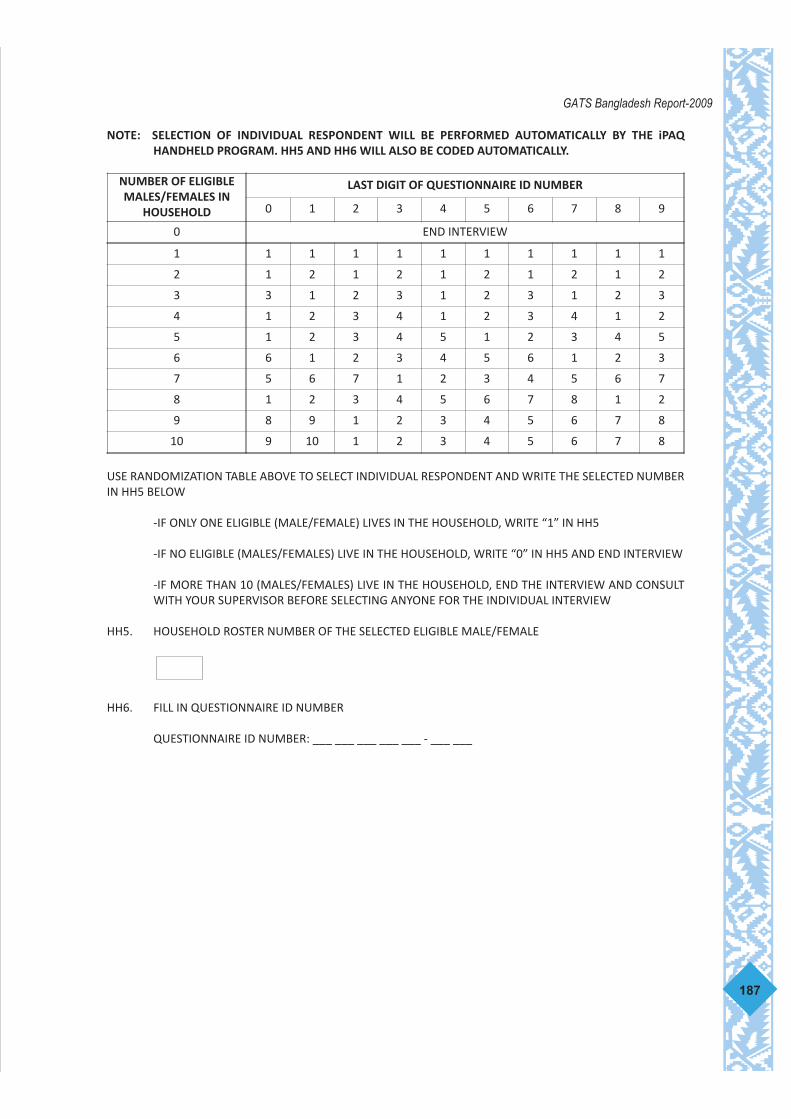
NOTE: SELECTION OF INDIVIDUAL RESPONDENT WILL BE PERFORMED AUTOMATICALLY BY THE iPAQHANDHELD PROGRAM. HH5 AND HH6 WILL ALSO BE CODED AUTOMATICALLY.
USE RANDOMIZATION TABLE ABOVE TO SELECT INDIVIDUAL RESPONDENT AND WRITE THE SELECTED NUMBERIN HH5 BELOW
-IF ONLY ONE ELIGIBLE (MALE/FEMALE) LIVES IN THE HOUSEHOLD, WRITE “1” IN HH5
-IF NO ELIGIBLE (MALES/FEMALES) LIVE IN THE HOUSEHOLD, WRITE “0” IN HH5 AND END INTERVIEW
-IF MORE THAN 10 (MALES/FEMALES) LIVE IN THE HOUSEHOLD, END THE INTERVIEW AND CONSULTWITH YOUR SUPERVISOR BEFORE SELECTING ANYONE FOR THE INDIVIDUAL INTERVIEW
HH5. HOUSEHOLD ROSTER NUMBER OF THE SELECTED ELIGIBLE MALE/FEMALE
HH6. FILL IN QUESTIONNAIRE ID NUMBER
QUESTIONNAIRE ID NUMBER: ___ ___ ___ ___ ___ - ___ ___
187
GATS Bangladesh Report-2009
NUMBER OF ELIGIBLEMALES/FEMALES IN
HOUSEHOLD
LAST DIGIT OF QUESTIONNAIRE ID NUMBER
0 1 2 3 4 5 6 7 8 9
0 END INTERVIEW
1 1 1 1 1 1 1 1 1 1 1
2 1 2 1 2 1 2 1 2 1 2
3 3 1 2 3 1 2 3 1 2 3
4 1 2 3 4 1 2 3 4 1 2
5 1 2 3 4 5 1 2 3 4 5
6 6 1 2 3 4 5 6 1 2 3
7 5 6 7 1 2 3 4 5 6 7
8 1 2 3 4 5 6 7 8 1 2
9 8 9 1 2 3 4 5 6 7 8
10 9 10 1 2 3 4 5 6 7 8

INTERVIEWER: IF YOU DO NOT SPEAK WITH THE SELECTED RESPONDENT OR IF HE/SHE IS NOT AVAILABLE FORAN INTERVIEW AT THAT TIME, WRITE DOWN HIS/HER NAME AND SCHEDULE ANOTHER VISIT(DATE AND TIME)
NAME _____________________________
DATE OF THE NEXT VISIT: ________________ TIME: _____________
DATE OF THE NEXT VISIT: ________________ TIME: _____________
DATE OF THE NEXT VISIT: ________________ TIME: _____________
DATE OF THE NEXT VISIT: ________________ TIME: _____________
TIME HH INTERVIEW STARTED[24 HOUR CLOCK] ___ ___ : ___ ___
HRS MINS
188
GATS Bangladesh Report-2009

Individual Questionnaire
QUESTIONNAIRE ID NUMBER ___ ___ ___ ___ ___ - ___ ___
CONSENT1. CHECK AGE OF SELECTED RESPONDENT FROM THE HOUSEHOLD QUESTIONNAIRE CASEDETAILS, AND SELECT THE APPROPRIATE CATEGORY BELOW:
15-17...............................................................�1 [GO TO CONSENT2]18 OR OLDER...................................................�2 [GO TO CONSENT5]EMANCIPATED MINOR (15-17)........................�3 [GO TO CONSENT5]
CONSENT2. Before starting the interview, I need to obtain consent from a parent or guardian of [NAMEOF RESPONDENT] and from [NAME OF RESPONDENT].
IF BOTH SELECTED RESPONDENT AND PARENT/GUARDIAN ARE AVAILABLE, CONTINUE WITHINTERVIEW.
IF PARENT/GUARDIAN IS NOT AVAILABLE, BREAK-OFF INTERVIEW AND SCHEDULE ANAPPOINTMENT TO RETURN.IF MINOR RESPONDENT IS NOT AVAILABLE, CONTINUE WITH OBTAINING PARENTALCONSENT.
CONSENT3. READ THE FOLLOWING TO THE PARENT/GUARDIAN AND SELECTED RESPONDENT (IF AVAILABLE):
I am working with the National Institute of Preventive and Social Medicine (NIPSOM) under Ministryof Health and Family Welfare. This institution is collecting information about tobacco use inBangladesh. This information will be used for public health purposes by the Ministry of Health andFamily Welfare.
Your household and [NAME OF RESPONDENT] have been selected at random. [NAME OFRESPONDENT] responses are very important to us and the community.
The interview will last around 30 minutes. [NAME OF RESPONDENT] participation in this survey isentirely voluntary. The information that [NAME OF RESPONDENT] will provide will be kept strictlyconfidential and [NAME OF RESPONDENT] will not be identified by his/her responses. Personalinformation will not be shared with anyone else, not even other family members including you.[NAME OF RESPONDENT] can withdraw from the study at any time, and may refuse to answer anyquestion.
We will leave the necessary contact information with you. If you have any questions about thissurvey, you can contact the telephone numbers listed.
If you agree with [NAME OF RESPONDENT]’s participation in this survey, we will conduct a privateinterview with him/her.
ASK PARENT/GUARDIAN: Do you agree with [NAME OF RESPONDENT]’s participation?
YES �1 [GO TO CONSENT4]NO �2 [END INTERVIEW]
CONSENT4. WAS THE SELECTED MINOR RESPONDENT PRESENT?
PRESENT............ �1 [GO TO CONSENT6]NOT PRESENT......... �2 [GO TO CONSENT5]
189
GATS Bangladesh Report-2009

CONSENT5. READ TO THE SELECTED RESPONDENT:
I am working with the National Institute of Preventive and Social Medicine (NIPSOM) under Ministryof Health and Family Welfare. This institution is collecting information about tobacco use inBangladesh. This information will be used for public health purposes by the Ministry of Health andFamily Welfare.
Your household and you have been selected at random. Your responses are very important to usand the community.
The interview will last around 30 minutes. Your participation in this survey is entirely voluntary. Theinformation that you will provide us will be kept strictly confidential, and you will not be identifiedby your responses. Personal information will not be shared with anyone else, not even other familymembers. You can withdraw from the study at any time, and may refuse to answer any question.
We will leave the necessary contact information with you. If you have any questions about thissurvey, you can contact the telephone numbers listed.
{FILL IF CONSENT4=2: Your parent/guardian has given his/her permission for you to participate inthis study}
If you agree to participate, we will conduct a private interview with you.
CONSENT6. ASK SELECTED RESPONDENT: Do you agree to participate?
YES �1 [PROCEED WITH INTERVIEW]NO �2 [END INTERVIEW]
FILL IN THE FOLLOWING INFORMATION:
190
GATS Bangladesh Report-2009
INTERVIEW LANGUAGE �1 ENGLISH�2 BANGLA
TIME INTERVIEW BEGAN[24 HOUR CLOCK] ___ ___ : ___ ___
HRS MINS
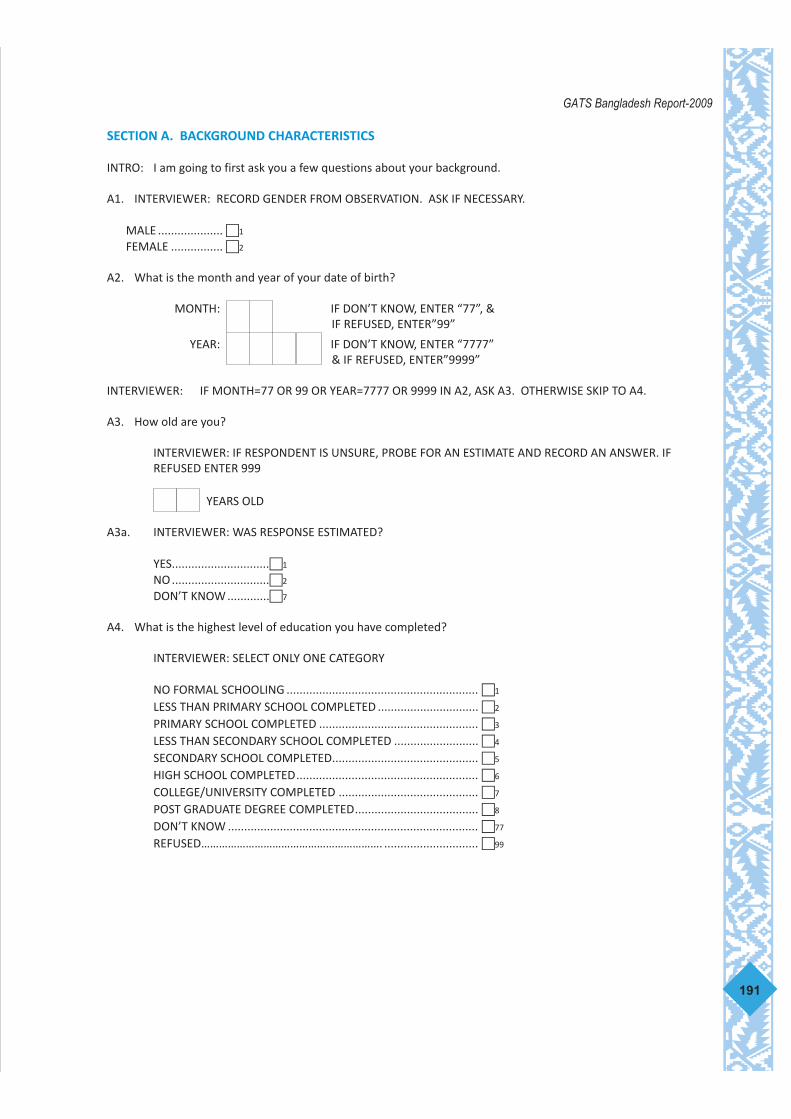
SECTION A. BACKGROUND CHARACTERISTICS
INTRO: I am going to first ask you a few questions about your background.
A1. INTERVIEWER: RECORD GENDER FROM OBSERVATION. ASK IF NECESSARY.
MALE .................... �1
FEMALE ................ �2
A2. What is the month and year of your date of birth?
MONTH: IF DON’T KNOW, ENTER “77”, &IF REFUSED, ENTER”99”
YEAR: IF DON’T KNOW, ENTER “7777”& IF REFUSED, ENTER”9999”
INTERVIEWER: IF MONTH=77 OR 99 OR YEAR=7777 OR 9999 IN A2, ASK A3. OTHERWISE SKIP TO A4.
A3. How old are you?
INTERVIEWER: IF RESPONDENT IS UNSURE, PROBE FOR AN ESTIMATE AND RECORD AN ANSWER. IFREFUSED ENTER 999
YEARS OLD
A3a. INTERVIEWER: WAS RESPONSE ESTIMATED?
YES..............................�1
NO ..............................�2
DON’T KNOW .............�7
A4. What is the highest level of education you have completed?
INTERVIEWER: SELECT ONLY ONE CATEGORY
NO FORMAL SCHOOLING ........................................................... �1
LESS THAN PRIMARY SCHOOL COMPLETED ............................... �2
PRIMARY SCHOOL COMPLETED ................................................. �3
LESS THAN SECONDARY SCHOOL COMPLETED .......................... �4
SECONDARY SCHOOL COMPLETED............................................. �5
HIGH SCHOOL COMPLETED........................................................ �6
COLLEGE/UNIVERSITY COMPLETED ........................................... �7
POST GRADUATE DEGREE COMPLETED...................................... �8
DON’T KNOW ............................................................................. �77
REFUSED……………………………………………………. ............................. �99
191
GATS Bangladesh Report-2009

A5. Which of the following best describes your main work status over the past 12 months?
Government employee, Non-government employee, Business (small), Business (large), Farming (land owner &farmer), Agricultural worker, Industrial worker, Daily laborer, Other self-employed, Student, Homemaker/housework, Retired, Unemployed-able to work or Unemployed, unable to work,
INTERVIEWER: INCLUDE SUBSISTENCE FARMING AS SELF-EMPLOYED
GOVERNMENT EMPLOYEE ....................................... �1
NON-GOVERNMENT EMPLOYEE .............................. �2
BUSINESS (SMALL) ................................................... �3
BUSINESS (LARGE).................................................... �4
FARMING (LAND OWNER & FARMER)...................... �5
AGRICULTURAL WORKER ......................................... �6
INDUSTRIAL WORKER .............................................. �7
DAILY LABORER ........................................................ �8
OTHER SELF-EMPLOYED........................................... �9
STUDENT.................................................................. �10
HOMEMAKER/ HOUSEWORK................................... �11
RETIRED ................................................................... �12
UNEMPLOYED, ABLE TO WORK................................ �13
UNEMPLOYED, UNABLE TO WORK........................... �14
OTHER ( SPECIFY) ................................................... �15
DON’T KNOW........................................................... �77
REFUSED .................................................................. �99
A6. Please tell me whether this household or any person who lives in the household has the following items:
READ EACH ITEM: YES NO DON’T KNOW REFUSED� � � �
a. Electricity? �1 �2 �7 �9
b. Flush toilet? �1 �2 �7 �9
c. Fixed telephone? �1 �2 �7 �9
d. Cell telephone? �1 �2 �7 �9
e. Television? �1 �2 �7 �9
f. Radio? �1 �2 �7 �9
g. Refrigerator? �1 �2 �7 �9
h. Car? �1 �2 �7 �9
i. Moped/scooter/motorcycle? �1 �2 �7 �9
j. Washing machine? �1 �2 �7 �9
k. Bicycle? �1 �2 �7 �9
l. Sewing machine? �1 �2 �7 �9
m. Almirah / wardrobe? �1 �2 �7 �9
n. Table? �1 �2 �7 �9
o. Bed or cot? �1 �2 �7 �9
p. Chair or Bench? �1 �2 �7 �9
q. Watch or Clock? �1 �2 �7 �9
192
GATS Bangladesh Report-2009

A8. How many rooms in your household are used for sleeping?
ROOMS
IF DON’T KNOW ENTER 77 OR IF REFUSED, ENTER “99”
A14. WHAT IS THE MAIN MATERIAL OF THE ROOF OF MAIN HOUSE? (RECORD OBSERVATION)
KATCHA (BAMBOO/THATCHED/STRAW)........�1
TIN/TILED.......................................................�2
CEMENT/CONCRETE ......................................�3
OTHER............................................................�4
DON’T KNOW/CAN’T TELL .............................�7
193
GATS Bangladesh Report-2009

SECTION B. TOBACCO SMOKING
INTRO: I would now like to ask you some questions about smoking tobacco such as cigarettes, bidi, hukkah,cigars, pipes.
Please do not answer about smokeless tobacco at this time.
B1. Do you currently smoke tobacco on a daily basis, less than daily, or not at all?
DAILY..........................................�1 � SKIP TO B4
LESS THAN DAILY........................�2
NOT AT ALL ................................�3 � SKIP TO B3
DON’T KNOW.............................�7 � SKIP TO NEXT SECTION
REFUSED…………….. ....................�9 � SKIP TO NEXT SECTION
B2. Have you smoked tobacco daily in the past?
YES.....................................�1 � SKIP TO B8NO .....................................�2 � SKIP TO B10DON’T KNOW ....................�7 � SKIP TO B10REFUSED……………...............�9 � SKIP TO B10
B3. In the past, have you smoked tobacco on a daily basis, less than daily, or not at all?
INTERVIEWER: IF RESPONDENT HAS DONE BOTH “DAILY” AND “LESS THAN DAILY” IN THE PAST, CHECK“DAILY”
DAILY..........................................�1 � SKIP TO B11LESS THAN DAILY........................�2 � SKIP TO B13NOT AT ALL ................................�3 � SKIP TO NEXT SECTIONDON’T KNOW.............................�7 � SKIP TO NEXT SECTIONREFUSED…………….......................�9 � SKIP TO NEXT SECTION
194
GATS Bangladesh Report-2009

[CURRENT DAILY SMOKERS]
B4. How old were you when you first started smoking tobacco daily?
YEARS OLD IF DON’T KNOW OR REFUSED, ENTER “99”
B5. How many years ago did you first start smoking tobacco daily?
INTERVIEWER: IF REFUSED, ENTER “99”
YEARS
B6. On average, how many of the following products do you currently smoke each day? Also, let me knowif you smoke the product, but not every day.
INTERVIEWER: IF RESPONDENT REPORTS SMOKING THE PRODUCT BUT NOT EVERY DAY, ENTER 888
IF RESPONDENT REPORTS IN PACKS OR CARTONS, PROBE TO FIND OUT HOW MANY ARE IN EACHAND CALCULATE TOTAL NUMBER
READ EACH ITEM:
B7. How soon after you wake up do you usually have your first smoke? Would you say within 5 minutes,6 to 30 minutes, 31 to 60 minutes, or more than 60 minutes?
WITHIN 5 MINUTES, ........................�1
6 TO 30 MINUTES, ...........................�2
31 TO 60 MINUTES ..........................�3
MORE THAN 60 MINUTES ...............�4
REFUSED..........................................�9
INTERVIEWER: SKIP TO NEXT SECTION
INTERVIEWER: IF B4 = 99, ASK B5. OTHERWISE SKIP TO B6.
195
GATS Bangladesh Report-2009
a. Manufactured cigarettes? .................................... PER DAY ...................
a1. [IF B6a=888] On average, how many manufacturedcigarettes do you currently smoke each week? PER WEEK ................
h. Bidis? PER DAY ...................
h1. [IF B6h=888] On average, how many bidis do youcurrently smoke each week? PER WEEK ................
f. Number of Water pipes sessions (hukkah) per day? PER DAY ...................
f1. [IF B6f=888] On average, how many water pipe sessions(hukkah) do you currently participate in each week? PER WEEK ................
b. Hand-rolled cigarettes? .................................... PER DAY ...................
b1. [IF B6b=888] On average, how many hand-rolledcigarettes do you currently smoke each week? PER WEEK ................
d. Pipes full of tobacco? .................................... PER DAY ...................
d1. [IF B6d=888] On average, how many pipes full of tobaccodo you currently smoke each week? PER WEEK ................
e. Cigars, cheroots, or cigarillos? PER DAY ...................
e1. [IF B6e=888] On average, how many cigars, cheroots, orcigarillos do you currently smoke each week? PER WEEK ................
g. Any others? (Specify type:____________________ PER DAY ...................
g1. [IF B6g=888] On average, how many [FILL PRODUCT] doyou currently smoke each week? PER WEEK ................
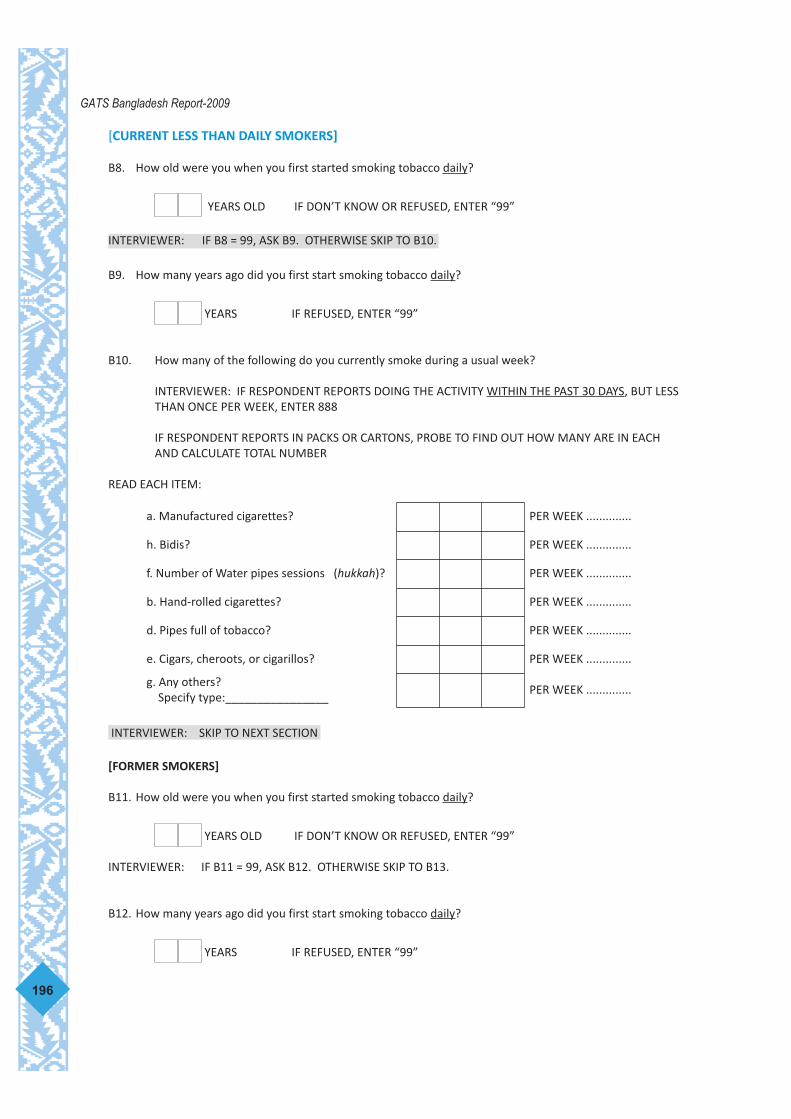
[CURRENT LESS THAN DAILY SMOKERS]
B8. How old were you when you first started smoking tobacco daily?
YEARS OLD IF DON’T KNOW OR REFUSED, ENTER “99”
B9. How many years ago did you first start smoking tobacco daily?
YEARS IF REFUSED, ENTER “99”
B10. How many of the following do you currently smoke during a usual week?
INTERVIEWER: IF RESPONDENT REPORTS DOING THE ACTIVITY WITHIN THE PAST 30 DAYS, BUT LESSTHAN ONCE PER WEEK, ENTER 888
IF RESPONDENT REPORTS IN PACKS OR CARTONS, PROBE TO FIND OUT HOW MANY ARE IN EACHAND CALCULATE TOTAL NUMBER
READ EACH ITEM:
[FORMER SMOKERS]
B11. How old were you when you first started smoking tobacco daily?
YEARS OLD IF DON’T KNOW OR REFUSED, ENTER “99”
INTERVIEWER: IF B11 = 99, ASK B12. OTHERWISE SKIP TO B13.
B12. How many years ago did you first start smoking tobacco daily?
YEARS IF REFUSED, ENTER “99”
INTERVIEWER: SKIP TO NEXT SECTION
INTERVIEWER: IF B8 = 99, ASK B9. OTHERWISE SKIP TO B10.
196
GATS Bangladesh Report-2009
a. Manufactured cigarettes? PER WEEK ..............
h. Bidis? PER WEEK ..............
f. Number of Water pipes sessions (hukkah)? PER WEEK ..............
b. Hand-rolled cigarettes? PER WEEK ..............
d. Pipes full of tobacco? PER WEEK ..............
e. Cigars, cheroots, or cigarillos? PER WEEK ..............
g. Any others?Specify type:________________
PER WEEK ..............

B13. How long has it been since you stopped smoking?
INTERVIEWER: ONLY INTERESTED IN WHEN RESPONDENT STOPPED SMOKING REGULARLY — DO NOTINCLUDE RARE INSTANCES OF SMOKING
ENTER UNIT AND NUMBER
YEARS............................�1
MONTHS.......................�2
WEEKS ..........................�3
DAYS ............................�4
LESS THAN ONE DAY (24 HOURS) ...........................�5
DON’T KNOW .........................................................�7
REFUSED.................................................................�9
B14. Have you visited a doctor or other health care provider in the past 12 months?
YES ...................... �1
NO....................... �2 � SKIP TO B18REFUSED. ............ �9 � SKIP TO B18
B15. How many times did you visit a doctor or health care provider in the past 12 months? Would you say1 or 2 times, 3 to 5 times, or 6 or more times?
1 OR 2 ................. �1
3 TO 5.................. �2
6 OR MORE ......... �3
REFUSED…........... �9
B16. During any visit to a doctor or health care provider in the past 12 months, were you asked if yousmoke tobacco?YES ......................…… �1
NO.......................…… �2 � SKIP TO B18REFUSED…................. �9 � SKIP TO B18
B17. During any visit to a doctor or health care provider in the past 12 months, were you advised to quitsmoking tobacco?
YES ......................….. �1
NO.......................….. �2
REFUSED….............… �9
B18. During the past 12 months, did you use any of the following to try to stop smoking tobacco?
READ EACH ITEM:
INTERVIEWER: IF B13 < 1 YEAR (< 12 MONTHS), THEN CONTINUE WITH B14. OTHERWISE SKIP TO NEXTSECTION
197
GATS Bangladesh Report-2009
YES NO REFUSED� � �
a. Counseling by any health care provider? �1… �2.. …..�9b. Nicotine replacement therapy, such as the patch or gum? �1… �2.. …..�9d. Traditional medicines (Ayurvedic, Unani)? �1… �2.. …..�9e. A quit line or a smoking telephone support line? �1… �2.. …..�9f. Switching to smokeless tobacco? �1… �2.. …..�9g. Anything else? Specify:_____________________ �1… �2.. …..�9

SECTION C SMOKELESS TOBACCO
INTRO: The next questions are about using smokeless tobacco, such as Zarda, Sada Pata, Gul, Khoinee,Noshii.
C1. Do you currently use smokeless tobacco on a daily basis, less than daily, or not at all?
DAILY .................................�1 � SKIP TO C4
LESS THAN DAILY ...............�2
NOT AT ALL ........................�3 � SKIP TO C3
DON’T KNOW ....................�7 � SKIP TO NEXT SECTION
REFUSED…………….. ............�9 � SKIP TO NEXT SECTION
C2. Have you used smokeless tobacco daily in the past?
YES.....................................�1 � SKIP TO C8NO .....................................�2 � SKIP TO C10DON’T KNOW ....................�7 � SKIP TO C10REFUSED……………..............�9 � SKIP TO C10
C3. In the past, have you used smokeless tobacco on a daily basis, less than daily, or not at all?
INTERVIEWER: IF RESPONDENT HAS DONE BOTH “DAILY” AND “LESS THAN DAILY” IN THE PAST,CHECK “DAILY”
DAILY .................................�1 � SKIP TO C11
LESS THAN DAILY ...............�2 � SKIP TO C13
NOT AT ALL ........................�3 � SKIP TO NEXT SECTION
DON’T KNOW ....................�7 � SKIP TO NEXT SECTION
REFUSED……………..............�9 � SKIP TO NEXT SECTION
198
GATS Bangladesh Report-2009
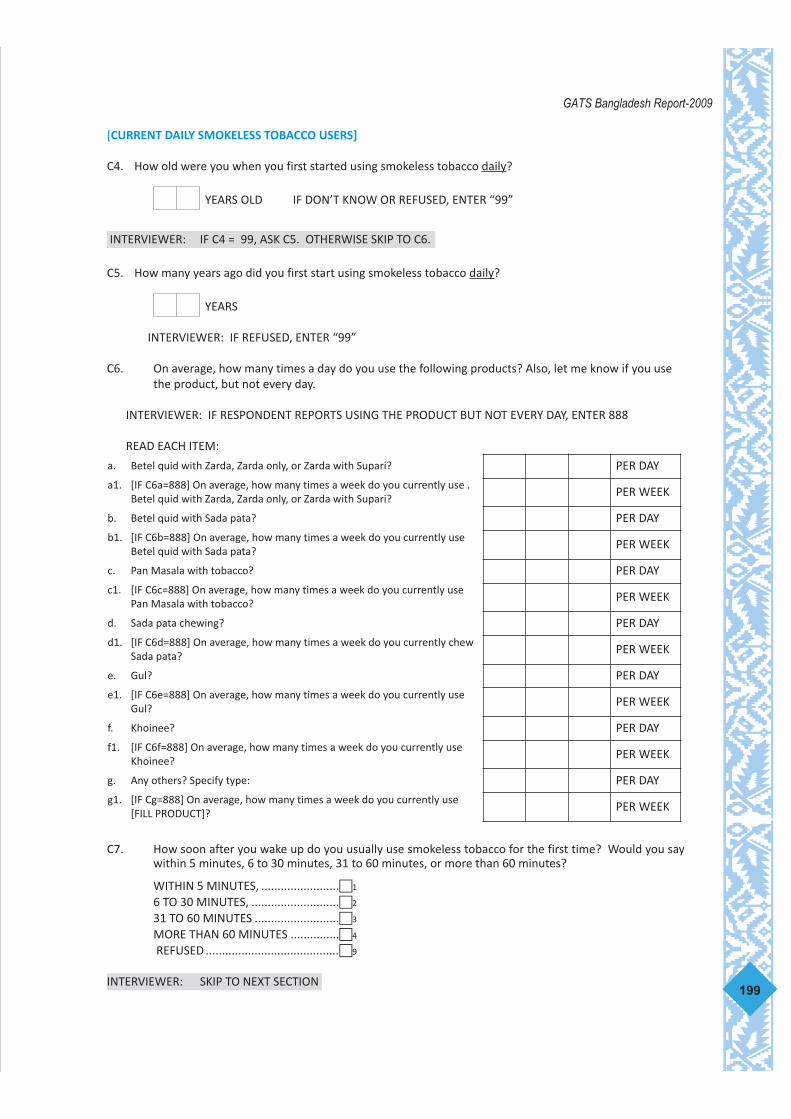
[CURRENT DAILY SMOKELESS TOBACCO USERS]
C4. How old were you when you first started using smokeless tobacco daily?
YEARS OLD IF DON’T KNOW OR REFUSED, ENTER “99”
C5. How many years ago did you first start using smokeless tobacco daily?
YEARS
INTERVIEWER: IF REFUSED, ENTER “99”
C6. On average, how many times a day do you use the following products? Also, let me know if you usethe product, but not every day.
INTERVIEWER: IF RESPONDENT REPORTS USING THE PRODUCT BUT NOT EVERY DAY, ENTER 888
READ EACH ITEM:
C7. How soon after you wake up do you usually use smokeless tobacco for the first time? Would you saywithin 5 minutes, 6 to 30 minutes, 31 to 60 minutes, or more than 60 minutes?
WITHIN 5 MINUTES, ........................�1
6 TO 30 MINUTES, ...........................�2
31 TO 60 MINUTES ..........................�3
MORE THAN 60 MINUTES ...............�4
REFUSED .........................................�9
199
GATS Bangladesh Report-2009
a. Betel quid with Zarda, Zarda only, or Zarda with Supari? PER DAY
a1. [IF C6a=888] On average, how many times a week do you currently use .Betel quid with Zarda, Zarda only, or Zarda with Supari? PER WEEK
b. Betel quid with Sada pata? PER DAY
b1. [IF C6b=888] On average, how many times a week do you currently useBetel quid with Sada pata? PER WEEK
c. Pan Masala with tobacco? PER DAY
c1. [IF C6c=888] On average, how many times a week do you currently usePan Masala with tobacco? PER WEEK
d. Sada pata chewing? PER DAY
d1. [IF C6d=888] On average, how many times a week do you currently chewSada pata? PER WEEK
e. Gul? PER DAY
e1. [IF C6e=888] On average, how many times a week do you currently useGul? PER WEEK
f. Khoinee? PER DAY
f1. [IF C6f=888] On average, how many times a week do you currently useKhoinee? PER WEEK
g. Any others? Specify type: PER DAY
g1. [IF Cg=888] On average, how many times a week do you currently use[FILL PRODUCT]? PER WEEK
INTERVIEWER: IF C4 = 99, ASK C5. OTHERWISE SKIP TO C6.
INTERVIEWER: SKIP TO NEXT SECTION

[CURRENT LESS THAN DAILY SMOKELESS TOBACCO USERS]
C8. How old were you when you first started using smokeless tobacco daily?
YEARS OLD IF DON’T KNOW OR REFUSED, ENTER “99”
INTERVIEWER: IF C8 = 99, ASK C9. OTHERWISE SKIP TO C10.
C9. How many years ago did you first start using smokeless tobacco daily?
YEARS
INTERVIEWER: IF REFUSED, ENTER “99”
C10. How many times a week do you usually use the following?
INTERVIEWER: IF RESPONDENT REPORTS DOING THE ACTIVITY WITHIN THE PAST 30 DAYS, BUT LESSTHAN ONCE PER WEEK, ENTER 888
[FORMER SMOKELESS TOBACCO USERS]
C11. How old were you when you first started using smokeless tobacco daily?
YEARS OLD IF DON’T KNOW OR REFUSED, ENTER “99”
INTERVIEWER: IF C11 = 99, ASK C12. OTHERWISE SKIP TO C13.
C12. How many years ago did you first start using smokeless tobacco daily?
YEARS
200
GATS Bangladesh Report-2009
READ EACH ITEM
a. Betel quid with Zarda, Zarda only, or Zarda with Supari? TIMES PER WEEK
b. Betel quid with Sada pata? TIMES PER WEEK
c. Pan Masala with tobacco? TIMES PER WEEK
d. Sada pata chewing? TIMES PER WEEK
e. Gul? TIMES PER WEEK
f. Khoinee? TIMES PER WEEK
g. Any others ? TIMES PER WEEK
� Specify type:_________________
INTERVIEWER: SKIP TO NEXT SECTION.
INTERVIEWER: IF REFUSED, ENTER “99”

C13. How long has it been since you stopped using smokeless tobacco?
INTERVIEWER: ONLY INTERESTED IN WHEN RESPONDENT STOPPED USING SMOKELESS TOBACCOREGULARLY — DO NOT INCLUDE RARE INSTANCES OF USING SMOKELESS TOBACCO
ENTER UNIT AND NUMBER
YEARS......................... �1
MONTHS.................... �2
WEEKS ....................... �3
DAYS ......................... �4
LESS THAN ONE DAY (24 HOURS) .............�5
DON’T KNOW............................................�7
REFUSED ...................................................�9
INTERVIEWER: IF B14 HAS NOT BEEN ASKED � CONTINUE WITH C14IF B14 = YES � SKIP TO C16IF B14 = NO � SKIP TO C18
C14. Have you visited a doctor or other health care provider in the past 12 months?
YES .................................... �1
NO..................................... �2 � SKIP TO C18REFUSED………… ................ �9 � SKIP TO C18
C15. How many times did you visit a doctor or health care provider in the past 12 months? Would you say1 or 2 times, 3 to 5 times, or 6 or more times?
1 OR 2................................ �1
3 TO 5 ................................ �2
6 OR MORE........................ �3
REFUSED…………… ............. �9
C16. During any visit to a doctor or health care provider in the past 12 months, were you asked if you usesmokeless tobacco?
YES.....................................…�1NO .....................................…�2 � SKIP TO C18REFUSED…… ........................ �9 � SKIP TO C18
C17. During any visit to a doctor or health care provider in the past 12 months, were you advised to stop usingsmokeless tobacco?
YES....................................……�1NO ....................................….. �2REFUSED……………… ............... �9
INTERVIEWER: IF C13 < 1 YEAR (< 12 MONTHS), THEN CONTINUE. OTHERWISE SKIP TO NEXT SECTION.
201
GATS Bangladesh Report-2009

C18. During the past 12 months, did you use any of the following to try to stop using smokeless tobacco?
READ EACH ITEM:
202
GATS Bangladesh Report-2009
YES NO REFUSED� � �
a. Counseling by any health care provider? �1… �2.. …..�9b. Nicotine replacement therapy, such as the patch or gum? �1… �2.. …..�9d. Traditional medicines (Ayurvedic, Unani) �1… �2.. …..�9e. A quit line or a telephone support line? �1… �2.. …..�9g. Anything else?
Specify ................................... �1… �2.. …..�9

SECTION D1. CESSATION – TOBACCO SMOKING
INTERVIEWER: CHECK THE ANSWER TO B1 AND RECORD BELOW:
B1 = ___
IF B1 = 1 or 2 (RESPONDENT CURRENTLY SMOKES TOBACCO), THEN CONTINUE WITHTHIS SECTION .........................�1
IF B1 = 3 or 7 or 9 (RESPONDENT DOES NOT CURRENTLY SMOKE TOBACCO), THENSKIP TO NEXT SECTION ...........�2
INTRO: The next questions ask about any attempts to stop smoking that you might have made during the past12 months. Please think about tobacco smoking.
D1. During the past 12 months, have you tried to stop smoking?
YES ……………. ...... �1
NO ……………. ...... �2 � SKIP TO INTERVIEWER INSTRUCTION BEFORE D4REFUSED……………...�9 � SKIP TO INTERVIEWER INSTRUCTION BEFORE D4
D2. Thinking about the last time you tried to quit, how long did you stop smoking?
CHECK UNIT AND RECORD NUMBER
IF LESS THAN ONE DAY (24 HOURS), LEAVE FIELD BLANK AND CHECK THE APPROPRIATE BOX BELOW
MONTHS.................... �1
WEEKS ....................... �2
DAYS ......................... �3
LESS THAN ONE DAY (24 HOURS) ...........................�5
DON’T KNOW .........................................................�7
REFUSED.................................................................�9
D3. During the past 12 months, did you use any of the following to try to stop smoking tobacco?
READ EACH ITEM:
203
GATS Bangladesh Report-2009
YES NO REFUSED� � �
a. Counseling by any health care provider? �1… �2.. …..�9b. Nicotine replacement therapy, such as the patch or gum? �1… �2.. …..�9d. Traditional medicines (Ayurvedic, Unani) �1… �2.. …..�9e. A quit line or a smoking telephone support line? �1… �2.. …..�9f. Switching to smokeless tobacco? �1… �2.. …..�9
g. Anything else? Specify :___________________________ �1… �2.. …..�9

INTERVIEWER: IF C14 HAS NOT BEEN ASKED � CONTINUE WITH D4IF C14 = YES �SKIP TO D6IF C14 = NO �SKIP TO D8
D4. Have you visited a doctor or other health care provider in the past 12 months?
YES ...............……………..�1
NO................……………..�2 � SKIP TO D8REFUSED…….................�9 � SKIP TO D8
D5. How many times did you visit a doctor or health care provider in the past 12 months? Would you say1 or 2 times, 3 to 5 times, or 6 or more times?
1 OR 2………………..........�1
3 TO 5……………….....…..�2
6 OR MORE ..................�3
REFUSED………..............�9
D6. During any visit to a doctor or health care provider in the past 12 months, were you asked if you smoketobacco?
YES ....................…………�1NO ....................…………�2 � SKIP TO D8REFUSED………………......�9 � SKIP TO D8
D7. During any visit to a doctor or health care provider in the past 12 months, were you advised to quitsmoking tobacco?
YES ....................…………�1
NO ....................…………�2
REFUSED………………......�9
D8. Which of the following best describes your thinking about quitting smoking? I am planning to quitwithin the next month, I am thinking about quitting within the next 12 months, I will quit someday butnot within the next 12 months, or I am not interested in quitting?
QUIT WITHIN THE NEXT MONTH......................................�1
THINKING WITHIN THE NEXT 12 MONTHS .......................�2
QUIT SOMEDAY, BUT NOT NEXT 12 MONTHS...................�3
NOT INTERESTED IN QUITTING.........................................�4
DON’T KNOW....................................................................�7
REFUSED................................................................ ...........�9
204
GATS Bangladesh Report-2009

SECTION D2. CESSATION – SMOKELESS TOBACCO
INTERVIEWER: CHECK THE ANSWER TO C1 AND RECORD BELOW:
C1 = ___
IF C1 = 1 or 2 (RESPONDENT CURRENTLY USES SMOKELESS TOBACCO), THENCONTINUE WITH THIS SECTION ........................�1
IF C1 = 3 or 7 or 9 (RESPONDENT DOES NOT CURRENTLY USE SMOKELESS TOBACCO),THEN SKIP TO NEXT SECTION............................�2
INTRO: The next questions ask about any attempts to stop using smokeless tobacco that you might have madeduring the past 12 months. Please think about your use of smokeless tobacco.
D9. During the past 12 months, have you tried to stop using smokeless tobacco?
YES ...............…………….�1
NO................…………….�2 � SKIP TO INTERVIEWER INSTRUCTION BEFORE D12REFUSED………….....……�9 � SKIP TO INTERVIEWER INSTRUCTION BEFORE D12
D10. Thinking about the last time you tried to quit, how long did you stop using smokeless tobacco?
INTERVIEWER: ENTER UNIT AND NUMBER
MONTHS.................... �1
WEEKS ....................... �2
DAYS ......................... �3
LESS THAN ONE DAY (24 HOURS) ...........................�5
DON’T KNOW .........................................................�7
REFUSED.................................................................�9
D11. During the past 12 months, have you used any of the following to try and stop using smokelesstobacco?
READ EACH ITEM:
205
GATS Bangladesh Report-2009
YES NO REFUSED� � �
a. Counseling by any health care provider? �1… �2.. …..�9b. Nicotine replacement therapy, such as the patch or gum? �1… �2.. …..�9d. Traditional medicines (Ayurvedic, Unani) �1… �2.. …..�9e. A quit line or a telephone support line? �1… �2.. …..�9
g. Anything else?Specify :__________________________ �1… �2.. …..�9

INTERVIEWER: IF BOTH B14 AND D4 HAVE NOT BEENASKED � CONTINUE WITH D12IF B14 OR D4 = YES � SKIP TO D14IF B14 OR D4 = NO � SKIP TO D16
D12. Have you visited a doctor or other health care provider in the past 12 months?
YES ...............……………..�1
NO................……………..�2 � SKIP TO D16REFUSED……………......…�9 � SKIP TO D16
D13. How many times did you visit a doctor or health care provider in the past 12 months? Would you say1 or 2 times, 3 to 5 times, or 6 or more times?
1 OR 2 ..........................�1
3 TO 5 ..........................�2
6 OR MORE ..................�3
REFUSED…….................�9
D14. During any visit to a doctor or health care provider in the past 12 months, were you asked if you usesmokeless tobacco?
YES ...............................�1NO ...............................�2 � SKIP TO D16REFUSED………………......� 9 � SKIP TO D16
D15. During any visit to a doctor or health care provider in the past 12 months, were you advised to stop usingsmokeless tobacco?
YES ...............................�1NO ...............................�2REFUSED………………......�9
D16. Which of the following best describes your thinking about quitting smokeless tobacco? I am planningto quit within the next month, I am thinking about quitting within the next 12 months, I will quitsomeday but not within the next 12 months, or I am not interested in quitting?
QUIT WITHIN THE NEXT MONTH......................................�1THINKING WITHIN THE NEXT 12 MONTHS .......................�2QUIT SOMEDAY, BUT NOT NEXT 12 MONTHS...................�3NOT INTERESTED IN QUITTING.........................................�4 DON’T KNOW....................................................................�7REFUSED ...........................................................................�9
206
GATS Bangladesh Report-2009

SECTION E. SECONDHAND SMOKE
INTRO: I would now like to ask you a few questions about smoking in various places.
E1. Which of the following best describes the rules about smoking inside of your home: Smoking is allowedinside of your home, smoking is generally not allowed inside of your home but there are exceptions,smoking is never allowed inside of your home, or there are no rules about smoking in your home?
ALLOWED....................................................... �1NOT ALLOWED, BUT EXCEPTIONS.................. �2NEVER ALLOWED ........................................... �3 � SKIP TO E4NO RULES ...................................................... �4 � SKIP TO E03DON’T KNOW................................................. �7 � SKIP TO E03REFUSED ........................................................ �9 � SKIP TO E03
E2. Inside your home, is smoking allowed in every room?
YES ..................................�1NO...................................�2 DON’T KNOW………..........�7REFUSED……....................�9
E3. How often does anyone smoke inside your home? Would you say daily, weekly, monthly, less thanmonthly, or never?
DAILY ........................................�1
WEEKLY.....................................�2
MONTHLY .................................�3
LESS THAN MONTHLY...............�4
NEVER.......................................�5
DON’T KNOW ...........................�7
REFUSED…… .............................�9
E4. Do you currently work outside of your home?
YES............................................�1NO/DON’T WORK.....................�2� SKIP TO E9REFUSED…… .............................�9� SKIP TO E9
E5. Do you usually work indoors or outdoors?
INDOORS........................�1� SKIP TO E7OUTDOORS ....................�2
BOTH ..............................�3� SKIP TO E7REFUSED…......................�9
E6. Are there any indoor areas at your work place?
YES……………........ ............�1NO ..............................….�2� SKIP TO E9DON’T KNOW .................�7� SKIP TO E9REFUSED……....... ...........�9� SKIP TO E9
207
GATS Bangladesh Report-2009

E7. Which of the following best describes the indoor smoking policy where you work: Smoking is allowedanywhere, smoking is allowed only in some indoor areas, or smoking is not allowed in any indoor areas,or there is no policy?
ALLOWED ANYWHERE .................................................�1
ALLOWED ONLY IN SOME INDOOR AREAS ...................�2
NOT ALLOWED IN ANY INDOOR AREAS .......................�3
THERE IS NO POLICY.....................................................�4
DON’T KNOW...............................................................�7
REFUSED ......................................................................�9
E8. During the past 30 days, did anyone smoke in indoor areas where you work?
YES ................................�1NO.................................�2 � SKIP TO E9DON’T KNOW ............... �7 � SKIP TO E9REFUSED……..................�9 � SKIP TO E9
E8a. How often does any one smoke in indoor areas where you work? Would you say, daily, weekly, monthlyor less than monthly?
DAILY ........................................�1
WEEKLY.....................................�2
MONTHLY .................................�3
LESS THAN MONTHLY...............�4
REFUSED…… .............................�9
E9. During the past 30 days, did you visit any government buildings or government offices?
YES .....................................�1
NO......................................�2 � SKIP TO E11DON’T KNOW.....................�7 � SKIP TO E11REFUSED…………. ................�9 � SKIP TO E11
E10. Did anyone smoke inside of any government buildings or government offices that you visited in thepast 30 days?
YES .....................................�1NO......................................�2DON’T KNOW.....................�7REFUSED…………. ................�9
E11. During the past 30 days, did you visit any health care facilities?
YES……………........ ............�1NO ..............................….�2 � SKIP TO E13DON’T KNOW .................�7 � SKIP TO E13REFUSED……....... ...........�9 � SKIP TO E13
E12. Did anyone smoke inside of any health care facilities that you visited in the past 30 days?
YES.....................................�1NO .....................................�2DON’T KNOW ....................�7REFUSED………….................�9
208
GATS Bangladesh Report-2009

E13. During the past 30 days, did you visit any restaurants?
YES ....................................�1NO.....................................�2 � SKIP TO E15DON’T KNOW....................�7 � SKIP TO E15REFUSED…………. ...............�9 � SKIP TO E15
E14. Did anyone smoke inside of any restaurants that you visited in the past 30 days?
YES ....................................�1NO.....................................�2DON’T KNOW....................�7REFUSED…………. ...............�9
E15. During the past 30 days, did you use any public transportation?
YES ....................................�1NO.....................................�2 � SKIP TO E17DON’T KNOW....................�7 � SKIP TO E17REFUSED…………. ...............�9 � SKIP TO E17
E16. Did anyone smoke inside of any public transportation that you used in the past 30 days?
YES....................................�1NO ....................................�2DON’T KNOW ...................�7REFUSED…………................�9
E17. Based on what you know or believe, does breathing other people’s smoke cause serious illness in non-smokers?
YES ....................................�1NO.....................................�2 �SKIP TO E19DON’T KNOW....................�7 �SKIP TO E19REFUSED………… ................�9 � SKIP TO E19
E18. Based on what you know or believe, does breathing smoke from other people’s smoke cause any ofthe following?
E19. During the past 30 days, did you visit any schools?
YES .....................................�1
NO......................................�2 � SKIP TO E21DON’T KNOW.....................�7 � SKIP TO E21REFUSED………… ..................�9 � SKIP TO E21
E20. Did anyone smoke inside of any schools that you visited in the past 30 days?
YES ....................................�1NO.....................................�2DON’T KNOW....................�7REFUSED…………. ...............�9
209
GATS Bangladesh Report-2009
CHECK APPROPRIATE BOX IF IDENTIFIED:YES NO DON’T
KNOWREFUSED
� � � �a. Heart disease in adults?. �1… �2.. �7.. …..�9c. Lung cancer in adults?. �1… �2.. �7.. …..�9b. Lung illnesses in children? �1… �2.. �7.. …..�9

E21. During the past 30 days, did you visit any universities?
YES.....................................�1NO .....................................�2 � SKIP TO E23DON’T KNOW ....................�7 � SKIP TO E23REFUSED………….................�9 � SKIP TO E23
E22. Did anyone smoke inside of any universities that you visited in the past 30 days?
YES .....................................�1NO......................................�2DON’T KNOW.....................�7REFUSED…………. ................�9
E23. During the past 30 days, did you visit any private workplaces {FILL IF E4=1: other than your own}?
YES.....................................�1NO .....................................�2 � SKIP TO E27DON’T KNOW ....................�7 � SKIP TO E27REFUSED…………..................�9 � SKIP TO E27
E24. Did anyone smoke inside of any {FILL IF E4=1: of these} private workplaces you visited in the past 30days?
YES.....................................�1NO .....................................�2DON’T KNOW ....................�7REFUSED……….... ...............�9
E27. During the past 30 days, did you visit any cafes, coffee shop or tea houses?
YES.....................................�1NO .....................................�2 � SKIP TO E29DON’T KNOW ....................�7 � SKIP TO E29REFUSED……….... ...............�9 � SKIP TO E29
E28. Did anyone smoke inside of any cafes, coffee shops, or tea houses that you visited in the past 30 days?
YES.....................................�1NO .....................................�2DON’T KNOW ....................�7REFUSED……….... ...............�9
E29. For each of the following public places, please tell me if you think smoking should or should not beallowed in indoor areas.
210
GATS Bangladesh Report-2009
READ EACH ITEM:SHOULD BEALLOWED
SHOULD NOT BEALLOWED
DON’T KNOW REFUSED
� � � �b. Workplaces?......... �1… �2.. �7.. …..�9c. Restaurants?............. �1… �2.. �7.. …..�9g. Universities?............... �1… �2.. �7.. …..�9

INTERVIEWER: CHECK THE ANSWERS TO B1, B6a AND B10a. RECORD BELOW:
B1 = ___B6a = ___B10a = ___
IF B1 = 1 OR 2 (RESPONDENT CURRENTLY SMOKES DAILY OR LESS THAN DAILY)
AND
[B6a OR B10a] > 0 OR = 888 (RESPONDENT SMOKES MANUFACTURED CIGARETTES)
THEN CONTINUE WITH THIS SECTION �1
OTHERWISE, SKIP TO NEXT SECTION �2
INTRO: The next few questions are about the last time you purchased cigarettes for yourself.
F1. The last time you bought cigarettes for yourself, how many cigarettes did you buy?
INTERVIEWER: ENTER UNIT AND NUMBER
CIGARETTES ...........................................�1
PACKS......................................................�2 � How many cigarettes were in each pack?___ ___ ___
CARTONS ................................................�3 � How many cigarettes were in each carton?__ ___ ___
OTHER SPECIFY:_______________.........�4 � How many cigarettes were in each [FILL]?___ ___ ___
NEVER BOUGHT CIGARETTES .................�5 � SKIP TO NEXT SECTION
REFUSED .................................................�9 � SKIP TO F3
F2. In total, how much money did you pay for this last purchase?
INTERVIEWER: IF DON’T KNOW OR REFUSED, ENTER 999
Taka
F3. What brand did you buy the last time you purchased cigarettes for yourself?
NAVY ........................................................�1
STAR .........................................................�2555 .........................................................�3BENSON AND HEDGES .............................�4K2 .........................................................�5MARISE ....................................................�6GOLD LEAF ...............................................�7MARLBORO .............................................�8PALLMAL .................................................�9OTHER ......................................................�10 ? SPECIFY: _______________________________REFUSED ..................................................�99
SECTION F. ECONOMICS – MANUFACTURED CIGARETTES
211
GATS Bangladesh Report-2009

F4. The last time you purchased cigarettes for yourself, where did you buy them?
STORE.......................................................�2
STREET VENDOR ......................................�3
MILITARY (BDR) STORE.............................�4
DUTY-FREE SHOP .....................................�5
OUTSIDE THE COUNTRY...........................�6
FROM ANOTHER PERSON ........................�9
OTHER ......................................................�10�SPECIFY: _______________________________DON’T REMEMBER ..................................�77
REFUSED………………………..........................�99
F5. Were these cigarettes filtered or non-filtered?
FILTERED ..................................................�1
NON-FILTERED .........................................�2
REFUSED ..................................................�9
212
GATS Bangladesh Report-2009

INTERVIEWER: CHECK THE ANSWERS TO B1, B6h AND B10h. RECORD BELOW:
B1 = ___B6h = ___B10h = ___
IF B1 = 1 OR 2 (RESPONDENT CURRENTLY SMOKES DAILY OR LESS THAN DAILY)
AND
[B6h OR B10h] > 0 OR = 888 (RESPONDENT SMOKES BIDIS)
THEN CONTINUE WITH THIS SECTION �1
OTHERWISE, SKIP TO NEXT SECTION �2
INTRO: The next few questions are about the last time you purchased bidis for yourself.
FA1. The last time you bought bidis for yourself, how many bidis did you buy?
INTERVIEWER: ENTER UNIT AND NUMBER
BIDIS .................................................�1
PACKS................................................�2 � How many bidis were in each pack? ___ ___ ___CARTONS ..........................................�3 � How many bidis were in each carton? ___ ___ ___OTHER SPECIFY:_______________ ...�4 � How many bidis were in each [FILL]? ___ ___ ___NEVER BOUGHT BIDIS.......................�5 � SKIP TO NEXT SECTIONREFUSED ...........................................�9 � SKIP TO FA03
FA2. In total, how much money did you pay for this last purchase?
INTERVIEWER: IF DON’T KNOW OR REFUSED, ENTER 999
Taka
FA3. What brand did you buy the last time you purchased bidis for yourself? AKIJ BIDI ...........................................�1
AZIZ BIDI ..........................................�2
ABUL BIDI .........................................�3
NASIR BIDI........................................�4
ANSAR BIDI ......................................�5
LOCAL BIDI.......................................�6
OTHER..............................................�7 � SPECIFY: _______________________________REFUSED..........................................�99
FA4. The last time you purchased bidis for yourself, where did you buy them?
STORE.......................................................�2
STREET VENDOR ......................................�3
PAN SHOP.................................................�4
FROM ANOTHER PERSON ........................�9
OTHER ......................................................�10 � SPECIFY: _______________________________DON’T REMEMBER ..................................�77
REFUSED ..................................................�99
OPTIONAL SECTION FA. ECONOMICS – BIDIS
213
GATS Bangladesh Report-2009

SECTION G. MEDIA
INTRO: The next few questions ask about your exposure to the media and advertisements in the last 30 days.For each item, I am going to ask about cigarettes, bidis and smokeless tobacco.
G1aa. In the last 30 days, have you noticed any information in newspapers about the dangers of use or thatencourages quitting of the following tobacco products?
READ EACH ITEM:
1. Cigarettes?YESE................................... �1
NOE ................................... �2
NOT APPLICABLE ................�7 � SKIP TO G1abREFUSED.............................�9
2. Bidis?YES..................................... �1NO ..................................... �2 REFUSED............................�9
3. Smokeless tobacco?YES.....................................�1NO...................... ...............�2 REFUSED............................�9
G1ab. In the last 30 days, have you noticed any information in magazines about the dangers of use or thatencourages quitting of the following tobacco products?
READ EACH ITEM:
1. Cigarettes?YES.....................................�1NO...................... ...............�2NOT APPLICABLE................�7 � SKIP TO G1bREFUSED............................�9
2. Bidis?YES.....................................�1NO...................... ...............�2 REFUSED............................�9
3. Smokeless tobacco?YES.....................................�1NO...................... ...............�2 REFUSED............................�9
G1b. In the last 30 days, have you seen any information on television about the dangers of use or thatencourages quitting of the following tobacco products?
READ EACH ITEM:
1. Cigarettes?
YES.....................................�1
NO .....................................�2
NOT APPLICABLE ...............�7 � SKIP TO G1cREFUSED............................�9
STRUCTURE #2 – ASKING ABOUT CIGARETTES, BIDIS, AND SMOKELESS TOBACCO)
214
GATS Bangladesh Report-2009

2. Bidis?
YES.....................................�1
NO .....................................�2
REFUSED............................�9
3. Smokeless tobacco?
YES.....................................�1NO .....................................�2 REFUSED............................�9
G1c. In the last 30 days, have you heard any information on the radio about the dangers or that encouragesquitting of the following tobacco products?
READ EACH ITEM:
1. Cigarettes?
YES.....................................�1
NO .....................................�2
NOT APPLICABLE ...............�7 � SKIP TO G1dREFUSED............................�9
2. Bidis?
YES.....................................�1
NO .....................................�2
REFUSED............................�9
3. Smokeless tobacco?
YES.....................................�1
NO .....................................�2
REFUSED............................�9
G1d. In the last 30 days, have you noticed any information on billboards about the dangers or that encouragesquitting of the following tobacco products?
READ EACH ITEM:
1. Cigarettes?
YES.....................................�1
NO...................... ...............�2
NOT APPLICABLE ...............�7 � SKIP TO G1ddREFUSED............................�9
2. Bidis?
YES.....................................�1
NO...................... ...............�2
REFUSED............................�9
3. Smokeless tobacco?
YES.....................................�1
NO...................... ...............�2
REFUSED............................� 9
215
GATS Bangladesh Report-2009

G1dd. In the last 30 days, have you noticed any information on posters about the dangers or that encouragesquitting of the following tobacco products?
READ EACH ITEM:
1. Cigarettes?
YES.....................................�1
NO...................... ...............�2
NOT APPLICABLE ...............�7 � SKIP TO G1eREFUSED............................�9
2. Bidis?
YES.....................................�1
NO...................... ...............�2
REFUSED............................�9
3. Smokeless tobacco?
YES.....................................�1
NO...................... ...............�2
REFUSED............................�9
G1e. In the last 30 days, have you noticed any information somewhere else about the dangers or thatencourages quitting of the following tobacco products?
READ EACH ITEM:
1. Cigarettes?
YES.....................................�1 � Please specify: __________________NO .....................................�2
REFUSED............................�9
2. Bidis?
YES.....................................�1
NO .....................................�2
REFUSED............................�9
3. Smokeless tobacco?
YES.....................................�1 � Please specify: __________________ NO .....................................�2
REFUSED............................�9
G2. In the last 30 days, did you notice any health warnings on cigarette packages?
YES .................................................................�1
NO..................................................................�2 � SKIP TO GG2DID NOT SEE ANY CIGARETTE PACKAGES .....�3 � SKIP TO GG2REFUSED ........................................................�9 � SKIP TO GG2
G3. [ADMINISTER IF B1 = 1 OR 2. ELSE GO TO GG2]
In the last 30 days, have warning labels on cigarette packages led you to think about quitting smoking?
YES.....................................�1
NO .....................................�2
REFUSED............................�9 216
GATS Bangladesh Report-2009

GG2. In the last 30 days, did you notice any health warnings on Bidi packages?
YES ...............................................................................�1
NO................................................................................�2 � SKIP TO G2aDID NOT SEE ANY BIDI PACKAGES ................................�3 � SKIP TO G2aREFUSED ......................................................................�9 � SKIP TO G2a
GG3.[ADMINISTER IF B1 = 1 OR 2. ELSE GO TO G2a]
In the last 30 days, have warning labels on bidi packages led you to think about quitting smoking?
YES..............................�1
NO ..............................�2
DON’T KNOW .............�7
REFUSED.....................�9
G2a. In the last 30 days, did you notice any health warnings on smokeless tobacco products?
YES...................... ...................................................�1
NO..........................................................................�2 � SKIP TO G4aDID NOT SEE ANY SMOKELESS PRODUCTS.............�3 � SKIP TO G4aREFUSED ................................................................�9 � SKIP TO G4a
G3a. [ADMINISTER IF C1 = 1 OR 2. ELSE GO TO G4a]
In the last 30 days, have warning labels on smokeless tobacco products led you to think about quittingsmokeless tobacco?
YES ....................................�1
NO.....................................�2
DON’T KNOW....................�7
REFUSED............... ............�9
G4a. In the last 30 days, have you noticed any advertisements or signs promoting the following tobaccoproducts in stores where the products are sold?
READ EACH ITEM:
1. Cigarettes?
YES.....................................�1
NO .....................................�2
NOT APPLICABLE ...............�7 � SKIP TO G4bREFUSED............................�9
2. Bidis?
YES.....................................�1
NO .....................................�2
REFUSED............................�9
3. Smokeless tobacco?
YES.....................................�1
NO .....................................�2
REFUSED............................�9
217
GATS Bangladesh Report-2009

G4b. In the last 30 days, have you seen any advertisements or signs promoting the following tobacco productson television?
READ EACH ITEM:
1. Cigarettes?
YES.....................................�1
NO .....................................�2
NOT APPLICABLE ...............�7 � SKIP TO G4cREFUSED............................�9
2. Bidis?
YES.....................................�1
NO .....................................�2
REFUSED............................�9
3. Smokeless tobacco?
YES.....................................�1
NO .....................................�2
REFUSED............................� 9
G4c. In the last 30 days, have you heard any advertisements promoting the following tobacco products onthe radio?
READ EACH ITEM:
1. Cigarettes?
YES.....................................�1
NO .....................................�2
NOT APPLICABLE ...............�7 � SKIP TO G4dREFUSED............................�9
2. Bidis?
YES.....................................�1
NO .....................................�2
REFUSED............................� 9
3. Smokeless tobacco?
YES.....................................�1
NO .....................................�2
REFUSED............................�9
G4d. In the last 30 days, have you noticed any advertisements promoting the following tobacco products onbillboards?
READ EACH ITEM:
1. Cigarettes?
YES.....................................�1
NO .....................................�2
NOT APPLICABLE ...............� 7 � SKIP TO G4eREFUSED............................� 9
218
GATS Bangladesh Report-2009

2. Bidis?
YES.....................................�1
NO .....................................� 2
REFUSED............................�9
3. Smokeless tobacco?
YES.....................................�1
NO .....................................�2
REFUSED............................� 9
G4e. In the last 30 days, have you noticed any advertisements or signs promoting the following tobaccoproducts on posters?
READ EACH ITEM:
1. Cigarettes?
YES.....................................�1
NO .....................................�2
NOT APPLICABLE ...............� 7 � SKIP TO G4faREFUSED............................� 9
2. Bidis?
YES.....................................�1
NO .....................................� 2
REFUSED............................�9
3. Smokeless tobacco?
YES.....................................�1
NO .....................................�2
REFUSED............................�9
G4fa. In the last 30 days, have you noticed any advertisements or signs promoting the following tobaccoproducts in newspapers?
READ EACH ITEM:
1. Cigarettes?
YES.....................................�1
NO .....................................�2
NOT APPLICABLE ...............�7 � SKIP TO G4fbREFUSED............................�9
2. Bidis?
YES.....................................�1
NO .....................................�2
REFUSED............................�9
3. Smokeless tobacco?
YES.....................................�1
NO .....................................�2
REFUSED............................�9
219
GATS Bangladesh Report-2009

G4fb. In the last 30 days, have you noticed any advertisements or signs promoting the following tobaccoproducts in magazines?
READ EACH ITEM:
1. Cigarettes?
YES.....................................�1
NO .....................................�2
NOT APPLICABLE ...............�7 � SKIP TO G4gREFUSED............................�9
2. Bidis?
YES.....................................�1
NO .....................................�2
REFUSED............................�9
3. Smokeless tobacco?
YES.....................................�1
NO .....................................�2
REFUSED............................�9
G4g. In the last 30 days, have you noticed any advertisements or signs promoting the following tobaccoproducts in cinemas?
READ EACH ITEM:
1. Cigarettes?
YES.....................................�1
NO .....................................�2
NOT APPLICABLE ...............�7 � SKIP TO G4hREFUSED............................�9
2. Bidis?
YES.....................................�1
NO .....................................�2
REFUSED............................�9
3. Smokeless tobacco?
YES.....................................�1
NO .....................................�2
REFUSED............................�9
G4h. In the last 30 days, have you noticed any advertisements or signs promoting the following tobaccoproducts on the internet?
READ EACH ITEM:
1. Cigarettes?
YES.....................................�1
NO .....................................�2
NOT APPLICABLE ...............�7 � SKIP TO G4iREFUSED............................�9
220
GATS Bangladesh Report-2009

2. Bidis?
YES.....................................�1
NO .....................................�2
REFUSED............................�9
3. Smokeless tobacco?
YES.....................................�1
NO .....................................�2
REFUSED............................�9
G4i. In the last 30 days, have you noticed any advertisements or signs promoting the following tobaccoproducts on public transportation vehicles or stations?
READ EACH ITEM:
1. Cigarettes?
YES.....................................�1
NO .....................................�2
NOT APPLICABLE ...............�7 � SKIP TO G4jREFUSED............................�9
2. Bidis?
YES.....................................�1
NO .....................................�2
REFUSED............................�9
3. Smokeless tobacco?
YES.....................................�1
NO .....................................�2
REFUSED............................�9
G4j. In the last 30 days, have you noticed any advertisements or signs promoting the following tobaccoproducts on public walls?
READ EACH ITEM:
1. Cigarettes?
YES.....................................�1
NO .....................................�2
NOT APPLICABLE ...............�7 � SKIP TO G4kREFUSED............................�9
2. Bidis?
YES.....................................�1
NO .....................................�2
REFUSED............................�9
3. Smokeless tobacco?
YES.....................................�1
NO .....................................�2
REFUSED............................�9
221
GATS Bangladesh Report-2009

G4k. In the last 30 days, have you noticed any advertisements or signs promoting the following tobaccoproducts anywhere else?
READ EACH ITEM:
1. Cigarettes?
YES.....................................�1 � Please specify: __________________NO .....................................�2
REFUSED............................�9
2. Bidis?
YES.....................................�1 � Please specify: __________________NO .....................................�2
REFUSED............................�9
3. Smokeless tobacco?
YES.....................................�1 � Please specify: __________________NO .....................................�2
REFUSED............................�9
G5. In the last 30 days, have you noticed any sport or sporting event that is associated with following:
a. Cigarette brands or cigarette companies?
YES.....................................�1
NO .....................................�2
DON’T KNOW ....................�7
REFUSED............................�9
b. Bidi brands or bidi companies?
YES....................................�1
NO ....................................�2
DON’T KNOW ...................�7
REFUSED...........................�9
c. Smokeless tobacco brands or smokeless tobacco companies?
YES.....................................�1
NO .....................................�2
DON’T KNOW ....................�7
REFUSED............................�9
GG5. In the last 30 days, have you noticed any music, theatre, art, or fashion events that are associated withfollowing:
a. Cigarette brands or cigarette companies?
YES ....................................�1
NO.....................................�2
DON’T KNOW....................�7
REFUSED ...........................�9
b. Bidi brands or bidi companies?
YES ....................................�1
NO.....................................�2
DON’T KNOW....................�7
REFUSED ...........................�9
222
GATS Bangladesh Report-2009
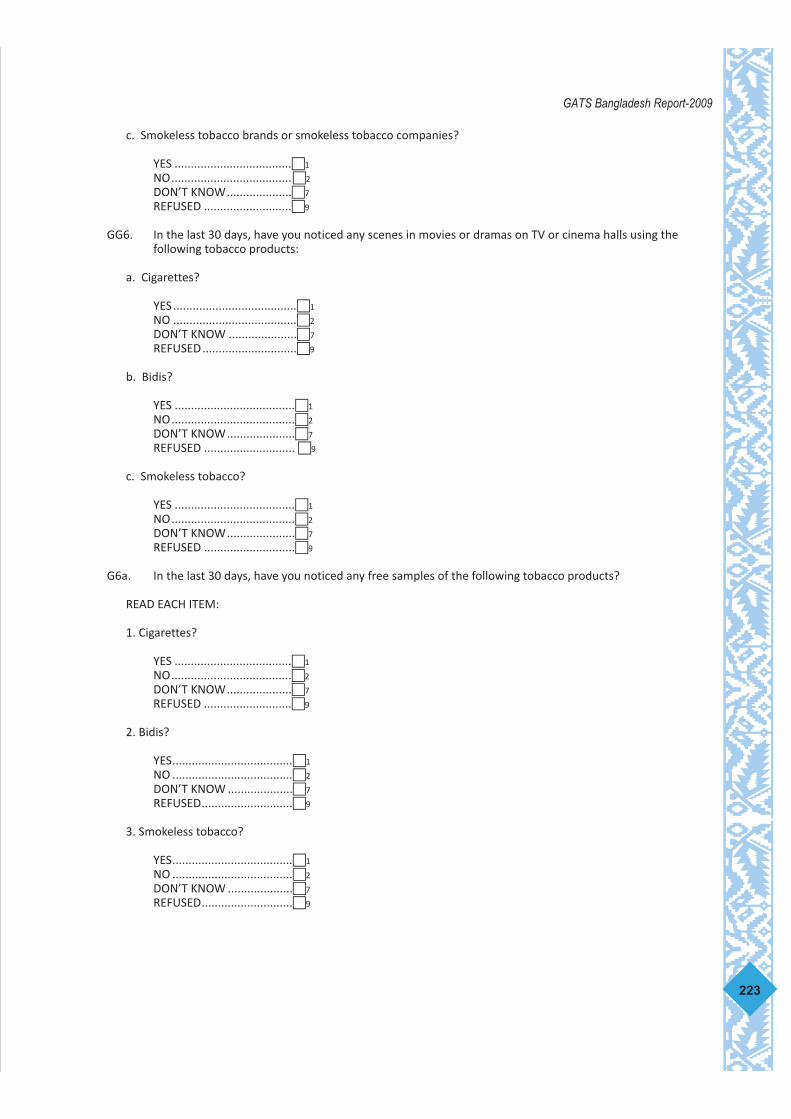
c. Smokeless tobacco brands or smokeless tobacco companies?
YES ....................................�1
NO.....................................�2
DON’T KNOW....................�7
REFUSED ...........................�9
GG6. In the last 30 days, have you noticed any scenes in movies or dramas on TV or cinema halls using thefollowing tobacco products:
a. Cigarettes?
YES......................................�1
NO ......................................�2
DON’T KNOW .....................�7
REFUSED.............................�9
b. Bidis?
YES .....................................�1
NO......................................�2
DON’T KNOW.....................�7
REFUSED ............................ �9
c. Smokeless tobacco?
YES .....................................�1
NO......................................�2
DON’T KNOW.....................�7
REFUSED ............................�9
G6a. In the last 30 days, have you noticed any free samples of the following tobacco products?
READ EACH ITEM:
1. Cigarettes?
YES ....................................�1
NO.....................................�2
DON’T KNOW....................�7
REFUSED ...........................�9
2. Bidis?
YES.....................................�1
NO .....................................�2
DON’T KNOW ....................�7
REFUSED............................�9
3. Smokeless tobacco?
YES.....................................�1
NO .....................................�2
DON’T KNOW ....................�7
REFUSED............................�9
223
GATS Bangladesh Report-2009

G6b. In the last 30 days, have you noticed any of the following tobacco products sold at sale prices?
READ EACH ITEM:
1. Cigarettes?
YES .....................................�1
NO......................................�2
DON’T KNOW.....................�7
REFUSED ............................�9
2. Bidis?
YES.....................................�1
NO .....................................�2
DON’T KNOW ....................�7
REFUSED............................�9
3. Smokeless tobacco?
YES .....................................�1
NO......................................�2
DON’T KNOW.....................�7
REFUSED ............................�9
G6c. In the last 30 days, have you noticed any coupons for the following tobacco products?
READ EACH ITEM:
1. Cigarettes?
YES ....................................�1
NO.....................................�2
DON’T KNOW....................�7
REFUSED ...........................�9
2. Bidis?
YES ....................................�1
NO.....................................�2
DON’T KNOW....................�7
REFUSED ...........................�9
3. Smokeless tobacco?
YES ....................................�1
NO.....................................�2
DON’T KNOW....................�7
REFUSED ...........................�9
G6d. In the last 30 days, have you noticed any free gifts or special discount offers on other products whenbuying any of the following tobacco products?
READ EACH ITEM:
1. Cigarettes?
YES.....................................�1
NO .....................................�2
DON’T KNOW ....................�7
REFUSED............................�9
224
GATS Bangladesh Report-2009

2. Bidis?
YES .....................................�1
NO .....................................�2
DON’T KNOW ....................�7
REFUSED............................�9
3. Smokeless tobacco?
YES.....................................�1
NO .....................................�2
DON’T KNOW ....................�7
REFUSED............................�9
G6e. In the last 30 days, have you noticed any clothing or other items with a brand name or logo of thefollowing tobacco products?
READ EACH ITEM:
1. Cigarettes?
YES ....................................�1
NO.....................................�2
DON’T KNOW....................�7
REFUSED ...........................�9
2. Bidis?
YES .....................................�1
NO......................................�2
DON’T KNOW.....................�7
REFUSED ............................�9
3. Smokeless tobacco?
YES.....................................�1
NO .....................................�2
DON’T KNOW ....................�7
REFUSED............................�9
G6f. In the last 30 days, have you noticed any promotions in the mail for the following tobacco products?
READ EACH ITEM:
1. Cigarettes?
YES .....................................�1
NO......................................�2
DON’T KNOW.....................�7
REFUSED ............................�9
2. Bidis?
YES ....................................�1
NO.....................................�2
DON’T KNOW....................�7
REFUSED ...........................�9
3. Smokeless tobacco?
YES ....................................�1
NO.....................................�2
DON’T KNOW....................�7
REFUSED ...........................�9225
GATS Bangladesh Report-2009

SECTION H. KNOWLEDGE, ATTITUDES & PERCEPTIONS
H1. The next question is asking about smoking tobacco.
Based on what you know or believe, does smoking tobacco cause serious illness?
YES ....................................�1
NO.....................................�2 � SKIP TO H3DON’T KNOW....................�7
REFUSED ...........................�9 � SKIP TO H3
H2. Based on what you know or believe, does smoking tobacco cause the following:
H3. Based on what you know or believe, does using smokeless tobacco cause serious illness?
YES.....................................�1
NO .....................................�2 � SKIP TO H2_3DON’T KNOW ....................�7
REFUSED……. .....................�9 � SKIP TO H2_3
H3. Based on what you know or believe, does using smokeless tobacco cause the following:
H2_3. Do you believe cigarettes are addictive?
YES.....................................�1
NO .....................................�2
DON’T KNOW ....................�7
REFUSED………….................�9
H2_3a. Do you believe bidis are addictive?
YES.....................................�1
NO .....................................�2
DON’T KNOW ....................�7
REFUSED……. .....................�9
H2_3b. Do you believe smokeless tobacco (Zarda, Gul, Sada pata, khinee, Nosshi) is addictive?
YES.....................................�1
NO .....................................�2
DON’T KNOW ....................�7
REFUSED............................�9
H5. Would you favor or oppose increasing taxes on tobacco products?
FAVOR ...............................�1
OPPOSE.............................�2
DON’T KNOW....................�7
REFUSED ...........................�9226
GATS Bangladesh Report-2009
READ EACH ITEM:YES NO DON’T KNOW REFUSED
� � � �a. Stroke �1… �2.. �7.. …..�9b. Heart attack �1… �2.. �7.. …..�9c. Lung cancer �1… �2.. �7.. …..�9d. Long term respiratory distress �1… �2.. �7.. …..�9
READ EACH ITEM:YES NO DON’T KNOW REFUSED
� � � �a. Stroke �1… �2.. �7.. …..�9b. Heart attack �1… �2.. �7.. …..�9
d. Cancer of mouth �1… �2.. �7.. …..�9

END INDIVIDUAL QUESTIONNAIRE
Those are all of the questions I have. Thank you very much for partcipating in this important survey.
TIME INTERVIEW ENDED[24 HOUR CLOCK] ___ ___ : ___ ___
HRS MINS
RECORD ANY NOTES ABOUT INTERVIEW:
227
GATS Bangladesh Report-2009

228
GATS Bangladesh Report-2009A
ppen
dix
F: M
POW
ER S
umm
ary
Indi
cato
rs, G
ATS
Bang
lade
sh 2
009
Indi
cato
rO
vera
llG
ende
rRe
side
nce
Mal
eFe
mal
eU
rban
Rura
l
M: M
onit
or to
bacc
o us
e an
d pr
even
tion
pol
icie
sCu
rren
t tob
acco
use
(1)
43.3
58.0
28.7
38.1
45.1
Curr
ent t
obac
co s
mok
ers(1
)23
.044
.71.
521
.323
.6
Curr
ent c
igar
ette
sm
oker
s(1) (
2)14
.128
.30.
218
.412
.6
Curr
ent b
idi S
mok
ers(1
)11
.221
.41.
14.
713
.5
Curr
ent s
mok
eles
s to
bacc
o us
e(1)
27.2
26.4
27.9
22.5
28.8
Aver
age
num
ber
of c
igar
ette
s sm
oked
per
day
5.1
5.2
0.8
8.5
4.0
Aver
age
num
ber
of b
idis
smok
ed p
er d
ay6.
97.
04.
32.
78.
3
Aver
age
num
ber
of s
mok
eles
s to
bacc
o us
es p
er d
ay8.
18.
37.
98.
18.
1
Aver
age
age
at d
aily
sm
okin
g in
itiat
ion
18.8
18.4
26.5
18.5
18.8
Form
er to
bacc
o sm
oker
s am
ong
ever
dai
ly s
mok
ers
17.8
16.7
41.3
19.1
17.3
P: P
rote
ct p
eopl
e fr
om to
bacc
o sm
oke
Perc
ent o
f adu
lts e
xpos
ed to
sec
ondh
and
smok
e at
wor
k63
.067
.830
.458
.866
.0
Perc
ent o
f adu
lts e
xpos
ed to
sec
ond
hand
sm
oke
in p
ublic
pla
ces:
Gov
ernm
ent b
uild
ings
5.
49.
21.
57.
84.
5
Hea
lth-c
are
faci
litie
s5.
87.
14.
46.
85.
4
Rest
aura
nts
27.6
53.4
2.2
29.9
26.8
Publ
ic tr
ansp
orta
tion
26.3
35.9
16.9
26.4
26.3
Any
of t
hese
pla
ces
45.0
69.4
20.8
46.6
44.4

229
GATS Bangladesh Report-2009M
POW
ER S
umm
ary
Indi
cato
rs, G
ATS
Bang
lade
sh 2
009
Indi
cato
rO
vera
llG
ende
rRe
side
nce
Mal
eFe
mal
eU
rban
Rura
l
O: O
ffer
hel
p to
qui
t tob
acco
use
Perc
ent o
f cur
rent
sm
oker
s w
ho m
ade
a qu
it at
tem
pt in
the
past
12
mon
ths
47.3
47.8
31.5
53.4
45.3
Perc
ent o
f cur
rent
sm
oker
s w
ho w
ere
advi
sed
quitt
ing
smok
ed to
bacc
o us
e by
ahe
alth
car
e pr
ovid
er52
.952
.761
.649
.054
.3
Perc
ent o
f cur
rent
sm
oker
s w
ho a
ttem
pted
to q
uit s
mok
ing
usin
g a
spec
ific
cess
atio
n m
etho
dPh
arm
acot
hera
py1.
01.
00.
50.
21.
3
Coun
selin
g/A
dvic
e or
Qui
t Lin
es14
.914
.725
.911
.816
.1
Oth
er m
etho
ds fo
r sm
okin
g ce
ssat
ion(3
)14
.514
.418
.717
.813
.3
Perc
ent o
f tob
acco
use
rs In
tere
sted
in q
uitt
ing
smok
ing:
28.9
29.4
15.0
28.9
28.9
Am
ong
toba
cco
smok
ers
28.6
28.8
3.6
26.7
29.6
Am
ong
man
ufac
ture
d ci
gare
tte
smok
ers
27.7
28.5
11.2
33.1
27.1
Am
ong
bidi
smok
ers
21.0
23.9
18.3
25.7
19.7
Am
ong
smok
eles
s to
bacc
o us
ers
W: W
arn
abou
t the
dan
gers
of t
obac
coPe
rcen
t adu
lts w
ho b
elie
ve to
bacc
o sm
okin
g ca
uses
ser
ious
illn
ess
97
.497
.697
.297
.597
.3Pe
rcen
t of a
dults
who
bel
ieve
sm
okin
g ca
uses
spe
cific
dis
ease
:St
roke
81.6
87.2
76.0
86.3
79.9
Hea
rt a
ttac
k85
.990
.281
.690
.384
.3Lu
ng c
ance
r91
.594
.288
.994
.690
.4Lo
ng te
rm re
spira
tory
dis
tres
s90
.391
.888
.892
.089
.7Pe
rcen
t adu
lts w
ho b
elie
ve s
mok
eles
s to
bacc
o ca
uses
ser
ious
illn
ess
92.7
92.6
92.9
94.9
92.0
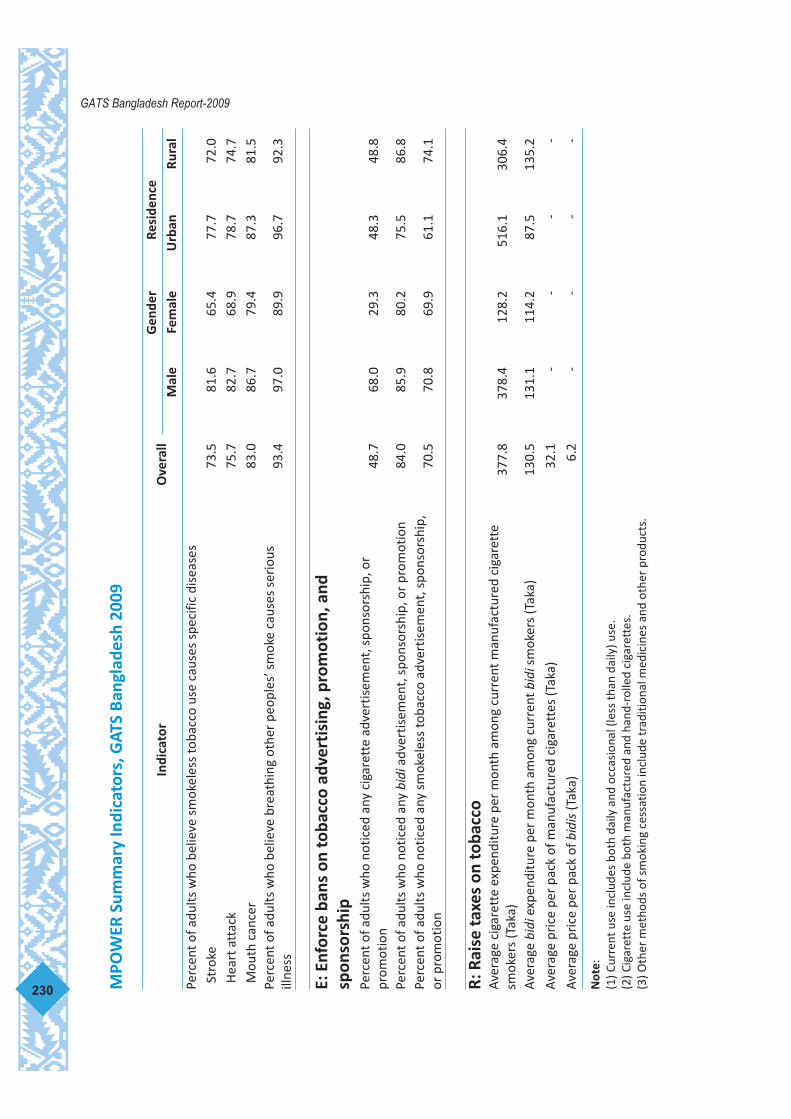
230
GATS Bangladesh Report-2009M
POW
ER S
umm
ary
Indi
cato
rs, G
ATS
Bang
lade
sh 2
009
Indi
cato
rO
vera
llG
ende
rRe
side
nce
Mal
eFe
mal
eU
rban
Rura
lPe
rcen
t of a
dults
who
bel
ieve
sm
okel
ess
toba
cco
use
caus
es s
peci
fic d
isea
ses
Stro
ke73
.581
.665
.477
.772
.0H
eart
att
ack
75.7
82.7
68.9
78.7
74.7
Mou
th c
ance
r83
.086
.779
.487
.381
.5Pe
rcen
t of a
dults
who
bel
ieve
bre
athi
ng o
ther
peo
ples
’ sm
oke
caus
es s
erio
usill
ness
93.4
97.0
89.9
96.7
92.3
E: E
nfor
ce b
ans
on to
bacc
o ad
vert
isin
g, p
rom
otio
n, a
ndsp
onso
rshi
pPe
rcen
t of a
dults
who
not
iced
any
cig
aret
te a
dver
tisem
ent,
spo
nsor
ship
, or
prom
otio
n48
.768
.029
.348
.348
.8
Perc
ent o
f adu
lts w
ho n
otic
ed a
ny b
idia
dver
tisem
ent,
spo
nsor
ship
, or
prom
otio
n84
.085
.980
.275
.586
.8Pe
rcen
t of a
dults
who
not
iced
any
sm
okel
ess
toba
cco
adve
rtis
emen
t, s
pons
orsh
ip,
or p
rom
otio
n70
.570
.869
.961
.174
.1
R: R
aise
taxe
s on
toba
cco
Aver
age
ciga
rett
e ex
pend
iture
per
mon
th a
mon
g cu
rren
t man
ufac
ture
d ci
gare
tte
smok
ers
(Tak
a)37
7.8
378.
412
8.2
516.
130
6.4
Aver
age
bidi
expe
nditu
re p
er m
onth
am
ong
curr
ent b
idis
mok
ers
(Tak
a)13
0.5
131.
111
4.2
87.5
135.
2
Aver
age
pric
e pe
r pa
ck o
f man
ufac
ture
d ci
gare
ttes
(Tak
a)32
.1-
--
-
Aver
age
pric
e pe
r pa
ck o
f bid
is(T
aka)
6.2
--
--
Not
e:
(1) C
urre
nt u
se in
clud
es b
oth
daily
and
occ
asio
nal (
less
than
dai
ly) u
se.
(2) C
igar
ette
use
incl
ude
both
man
ufac
ture
d an
d ha
nd-r
olle
d ci
gare
ttes
.(3
) Oth
er m
etho
ds o
f sm
okin
g ce
ssat
ion
incl
ude
trad
ition
al m
edic
ines
and
oth
er p
rodu
cts.


